
Ultrasound Evaluation of Renal Artery Stenosis - · PDF fileUltrasound Evaluation of Renal...
26
Ultrasound Evaluation of Renal Artery Stenosis Dr. Satish Kumar, MD Objectives Understand the normal and variant anatomy of the renal vascular system Describe the RAR and acceleration time Describe the appearance and meaning of a tardus parvus Doppler waveform Outline the protocol for a renal artery Doppler exam Introduction Hypertension affects up to 65 million adults in the United States. A small subset of these patients have renovascular hypertension due to obstruction of the renal arteries. Fortunately, this type of hypertension can be corrected with treatment of the offending renal artery stenosis. Many hypertensive patients are referred for duplex ultrasound to screen for the presence of renal artery stenosis. While ultrasound imaging with Doppler analysis is a useful tool for evaluation of the renal arteries, it is often underused because it can be technically challenging and time-consuming. This article discusses methods to improve results through optimization of scanning technique, patient positioning and enhanced understanding of the technical aspects of the examination. Two methods are used in ultrasound evaluation of renal artery stenosis; a direct and an indirect approach. A combination of these methods is recommended to optimize results. The direct approach involves Doppler interrogation along the entire length of the main renal artery and any accessory renal arteries. The indirect approach involves evaluation of the segmental or interlobar arteries within the kidney. This technique infers stenosis of the main renal artery through recognition of alterations of the normal waveform shape obtained from the intrarenal arteries. Both methods will be discussed in detail.
Transcript of Ultrasound Evaluation of Renal Artery Stenosis - · PDF fileUltrasound Evaluation of Renal...
Ultrasound Evaluation of Renal Artery Stenosis Dr. Satish Kumar, MD
Objectives
Understand the normal and variant anatomy of the renal vascular system
Describe the RAR and acceleration time
Describe the appearance and meaning of a tardus parvus Doppler waveform
Outline the protocol for a renal artery Doppler exam
Introduction
Hypertension affects up to 65 million adults in the United States. A small subset of these
patients have renovascular hypertension due to obstruction of the renal arteries. Fortunately,
this type of hypertension can be corrected with treatment of the offending renal artery
stenosis. Many hypertensive patients are referred for duplex ultrasound to screen for the
presence of renal artery stenosis. While ultrasound imaging with Doppler analysis is a useful
tool for evaluation of the renal arteries, it is often underused because it can be technically
challenging and time-consuming. This article discusses methods to improve results through
optimization of scanning technique, patient positioning and enhanced understanding of the
technical aspects of the examination.
Two methods are used in ultrasound evaluation of renal artery stenosis; a direct and an
indirect approach. A combination of these methods is recommended to optimize results. The
direct approach involves Doppler interrogation along the entire length of the main renal artery
and any accessory renal arteries. The indirect approach involves evaluation of the segmental
or interlobar arteries within the kidney. This technique infers stenosis of the main renal artery
through recognition of alterations of the normal waveform shape obtained from the intrarenal
arteries. Both methods will be discussed in detail.
Anatomy
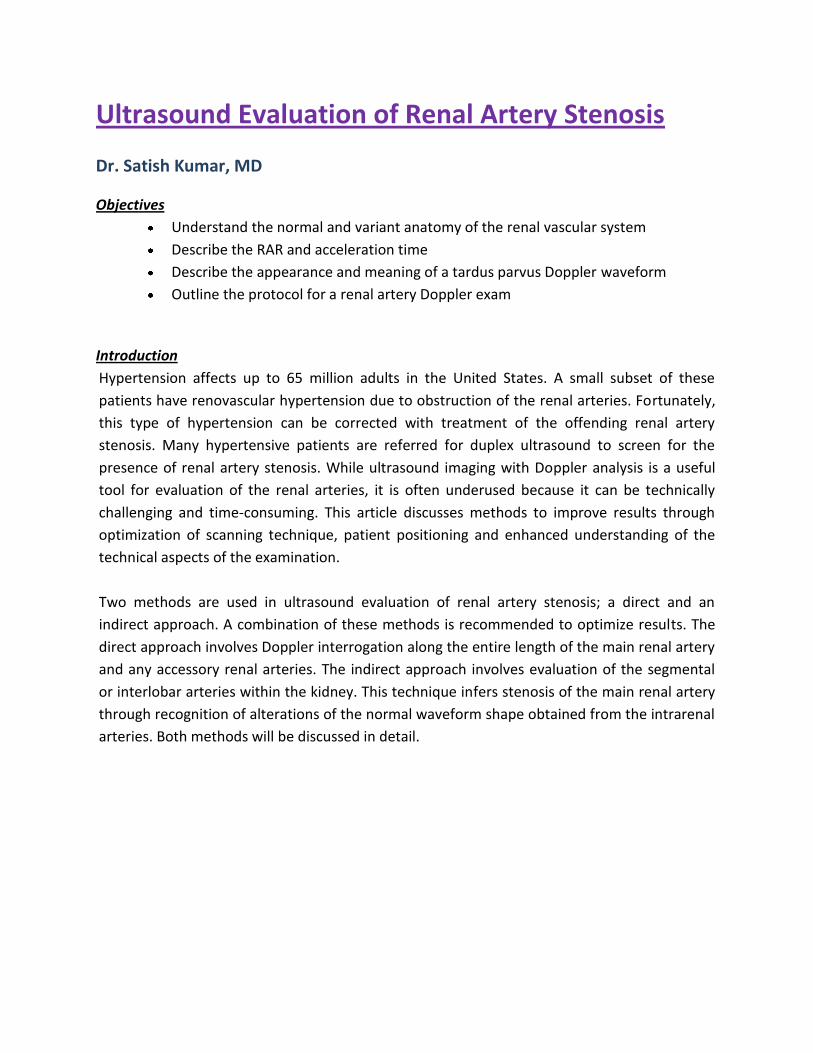
In most individuals, the renal arteries arise from the abdominal aorta immediately distal to the origin of the superior mesenteric artery (SMA). The right renal artery passes underneath the inferior vena cava (IVC) and posterior to the right renal vein (Fig 1).
A B
Figure 1 - Sagittal ultrasound image in grayscale (A) and color (B) showing the IVC in long axis and right renal artery (arrow) in short axis as it courses underneath the IVC. B. Color Doppler shows flow within the IVC, hepatic veins and renal artery.
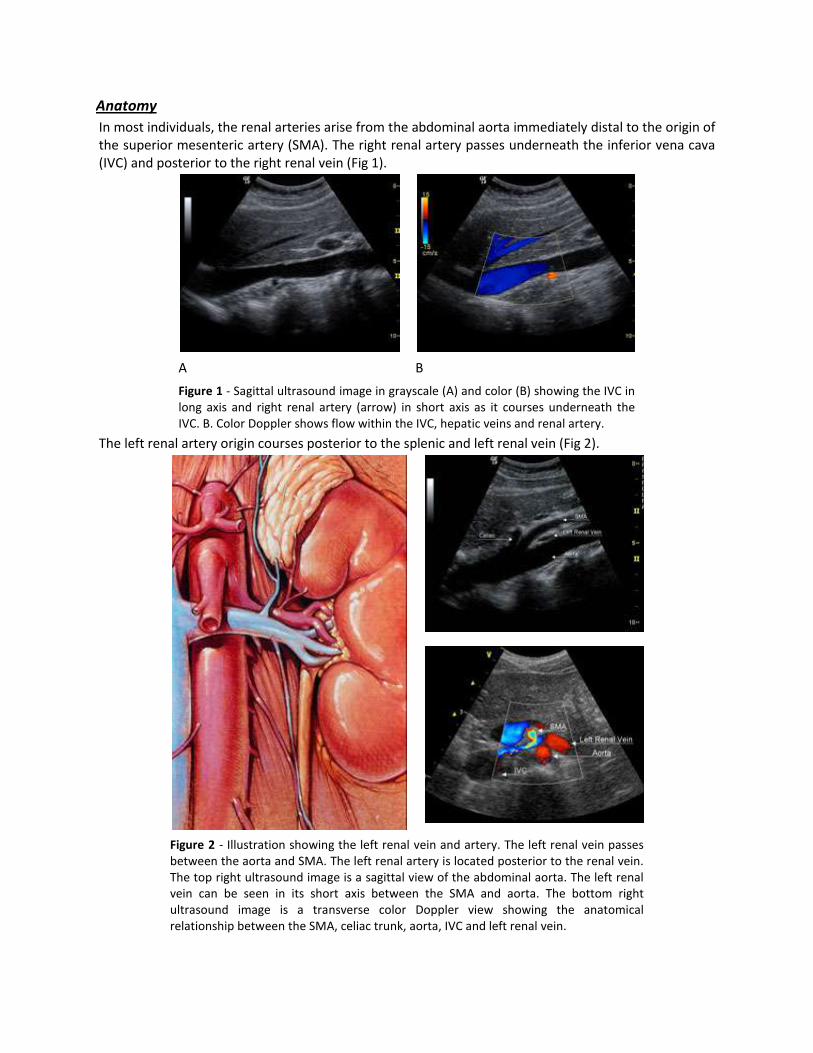
The left renal artery origin courses posterior to the splenic and left renal vein (Fig 2).
Figure 2 - Illustration showing the left renal vein and artery. The left renal vein passes between the aorta and SMA. The left renal artery is located posterior to the renal vein. The top right ultrasound image is a sagittal view of the abdominal aorta. The left renal vein can be seen in its short axis between the SMA and aorta. The bottom right ultrasound image is a transverse color Doppler view showing the anatomical relationship between the SMA, celiac trunk, aorta, IVC and left renal vein.
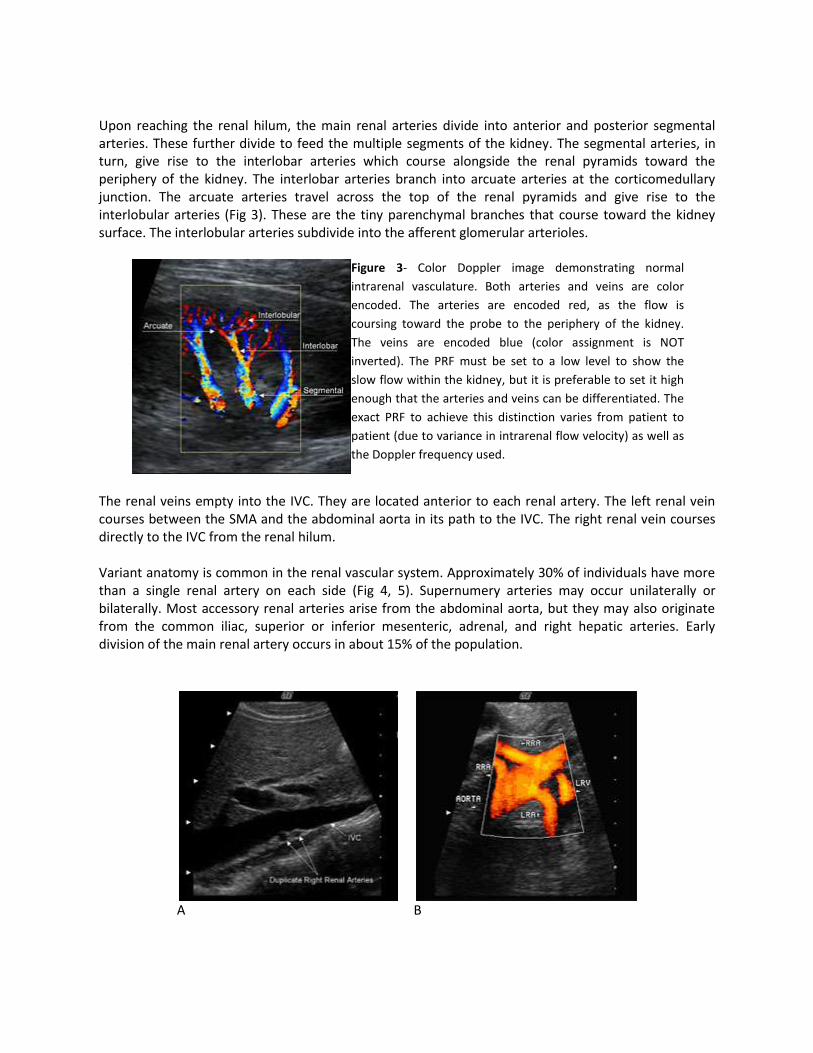
Upon reaching the renal hilum, the main renal arteries divide into anterior and posterior segmental arteries. These further divide to feed the multiple segments of the kidney. The segmental arteries, in turn, give rise to the interlobar arteries which course alongside the renal pyramids toward the periphery of the kidney. The interlobar arteries branch into arcuate arteries at the corticomedullary junction. The arcuate arteries travel across the top of the renal pyramids and give rise to the interlobular arteries (Fig 3). These are the tiny parenchymal branches that course toward the kidney surface. The interlobular arteries subdivide into the afferent glomerular arterioles.
Figure 3- Color Doppler image demonstrating normal
intrarenal vasculature. Both arteries and veins are color
encoded. The arteries are encoded red, as the flow is
coursing toward the probe to the periphery of the kidney.
The veins are encoded blue (color assignment is NOT
inverted). The PRF must be set to a low level to show the
slow flow within the kidney, but it is preferable to set it high
enough that the arteries and veins can be differentiated. The
exact PRF to achieve this distinction varies from patient to
patient (due to variance in intrarenal flow velocity) as well as
the Doppler frequency used.
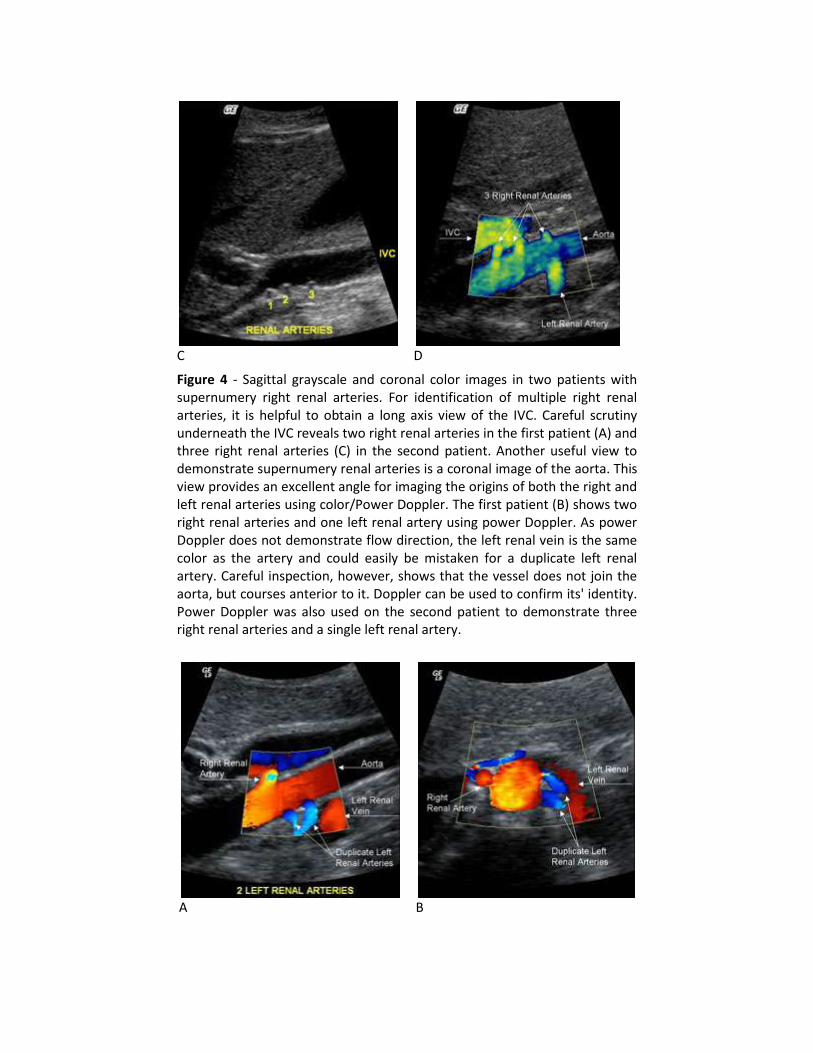
The renal veins empty into the IVC. They are located anterior to each renal artery. The left renal vein courses between the SMA and the abdominal aorta in its path to the IVC. The right renal vein courses directly to the IVC from the renal hilum. Variant anatomy is common in the renal vascular system. Approximately 30% of individuals have more than a single renal artery on each side (Fig 4, 5). Supernumery arteries may occur unilaterally or bilaterally. Most accessory renal arteries arise from the abdominal aorta, but they may also originate from the common iliac, superior or inferior mesenteric, adrenal, and right hepatic arteries. Early division of the main renal artery occurs in about 15% of the population.
A
B
C
D
Figure 4 - Sagittal grayscale and coronal color images in two patients with supernumery right renal arteries. For identification of multiple right renal arteries, it is helpful to obtain a long axis view of the IVC. Careful scrutiny underneath the IVC reveals two right renal arteries in the first patient (A) and three right renal arteries (C) in the second patient. Another useful view to demonstrate supernumery renal arteries is a coronal image of the aorta. This view provides an excellent angle for imaging the origins of both the right and left renal arteries using color/Power Doppler. The first patient (B) shows two right renal arteries and one left renal artery using power Doppler. As power Doppler does not demonstrate flow direction, the left renal vein is the same color as the artery and could easily be mistaken for a duplicate left renal artery. Careful inspection, however, shows that the vessel does not join the aorta, but courses anterior to it. Doppler can be used to confirm its' identity. Power Doppler was also used on the second patient to demonstrate three right renal arteries and a single left renal artery.
A
B
C
D
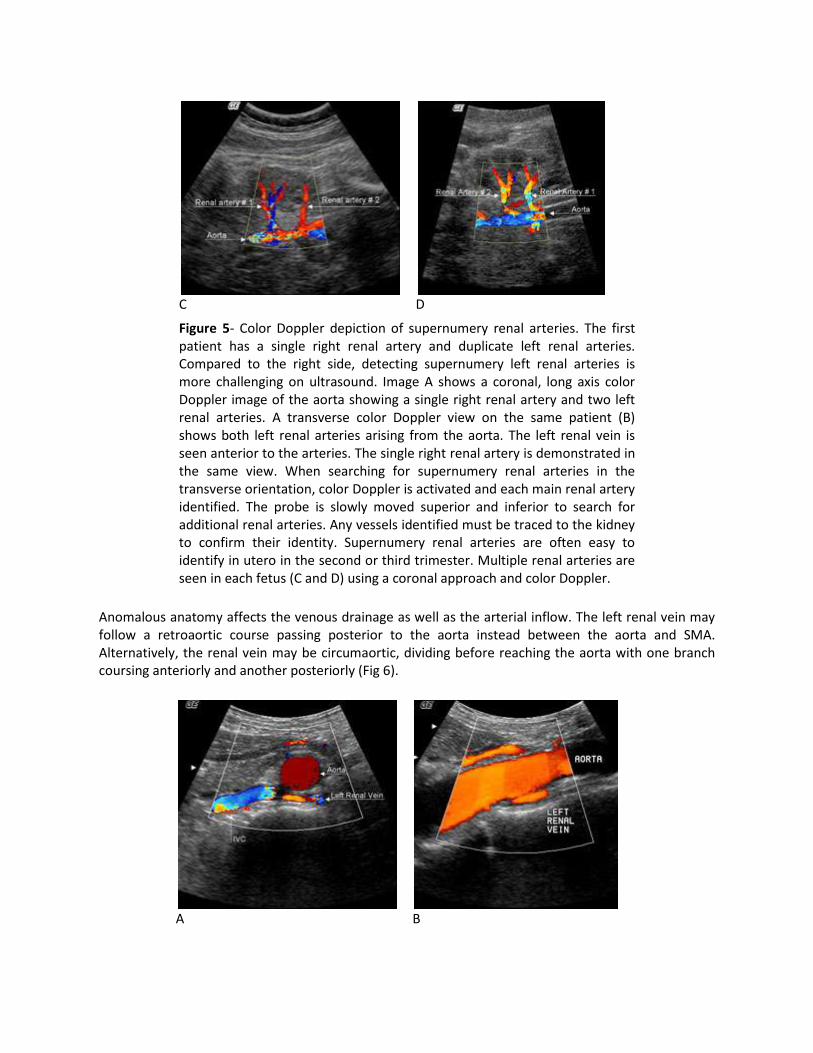
Figure 5- Color Doppler depiction of supernumery renal arteries. The first patient has a single right renal artery and duplicate left renal arteries. Compared to the right side, detecting supernumery left renal arteries is more challenging on ultrasound. Image A shows a coronal, long axis color Doppler image of the aorta showing a single right renal artery and two left renal arteries. A transverse color Doppler view on the same patient (B) shows both left renal arteries arising from the aorta. The left renal vein is seen anterior to the arteries. The single right renal artery is demonstrated in the same view. When searching for supernumery renal arteries in the transverse orientation, color Doppler is activated and each main renal artery identified. The probe is slowly moved superior and inferior to search for additional renal arteries. Any vessels identified must be traced to the kidney to confirm their identity. Supernumery renal arteries are often easy to identify in utero in the second or third trimester. Multiple renal arteries are seen in each fetus (C and D) using a coronal approach and color Doppler.
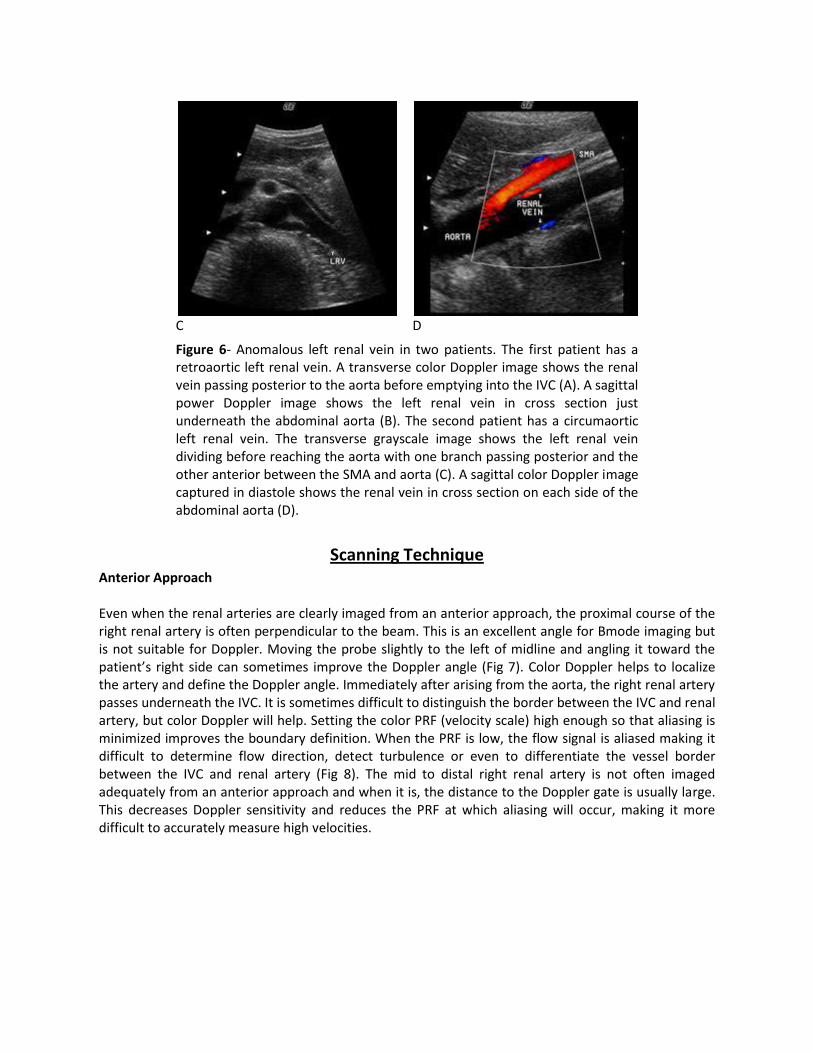
Anomalous anatomy affects the venous drainage as well as the arterial inflow. The left renal vein may follow a retroaortic course passing posterior to the aorta instead between the aorta and SMA. Alternatively, the renal vein may be circumaortic, dividing before reaching the aorta with one branch coursing anteriorly and another posteriorly (Fig 6).
A
B
C
D
Figure 6- Anomalous left renal vein in two patients. The first patient has a retroaortic left renal vein. A transverse color Doppler image shows the renal vein passing posterior to the aorta before emptying into the IVC (A). A sagittal power Doppler image shows the left renal vein in cross section just underneath the abdominal aorta (B). The second patient has a circumaortic left renal vein. The transverse grayscale image shows the left renal vein dividing before reaching the aorta with one branch passing posterior and the other anterior between the SMA and aorta (C). A sagittal color Doppler image captured in diastole shows the renal vein in cross section on each side of the abdominal aorta (D).
Scanning Technique Anterior Approach Even when the renal arteries are clearly imaged from an anterior approach, the proximal course of the right renal artery is often perpendicular to the beam. This is an excellent angle for Bmode imaging but is not suitable for Doppler. Moving the probe slightly to the left of midline and angling it toward the patient’s right side can sometimes improve the Doppler angle (Fig 7). Color Doppler helps to localize the artery and define the Doppler angle. Immediately after arising from the aorta, the right renal artery passes underneath the IVC. It is sometimes difficult to distinguish the border between the IVC and renal artery, but color Doppler will help. Setting the color PRF (velocity scale) high enough so that aliasing is minimized improves the boundary definition. When the PRF is low, the flow signal is aliased making it difficult to determine flow direction, detect turbulence or even to differentiate the vessel border between the IVC and renal artery (Fig 8). The mid to distal right renal artery is not often imaged adequately from an anterior approach and when it is, the distance to the Doppler gate is usually large. This decreases Doppler sensitivity and reduces the PRF at which aliasing will occur, making it more difficult to accurately measure high velocities.
A
B
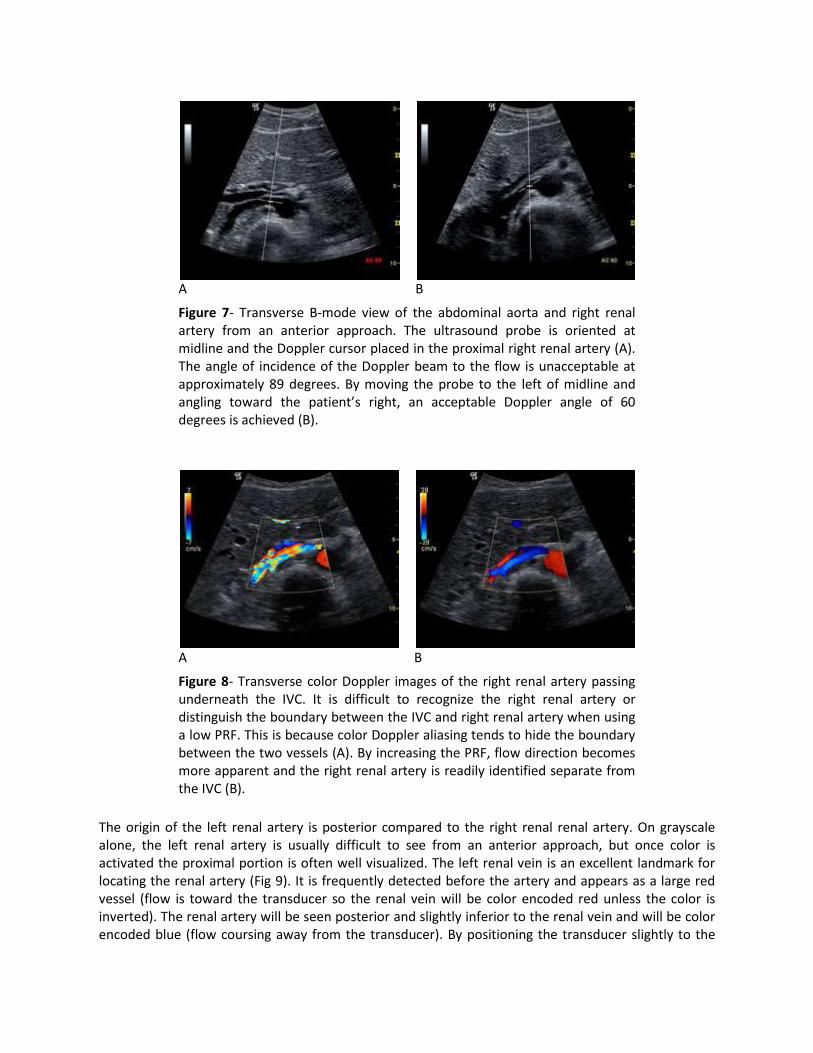
Figure 7- Transverse B-mode view of the abdominal aorta and right renal artery from an anterior approach. The ultrasound probe is oriented at midline and the Doppler cursor placed in the proximal right renal artery (A). The angle of incidence of the Doppler beam to the flow is unacceptable at approximately 89 degrees. By moving the probe to the left of midline and angling toward the patient’s right, an acceptable Doppler angle of 60 degrees is achieved (B).
A
B
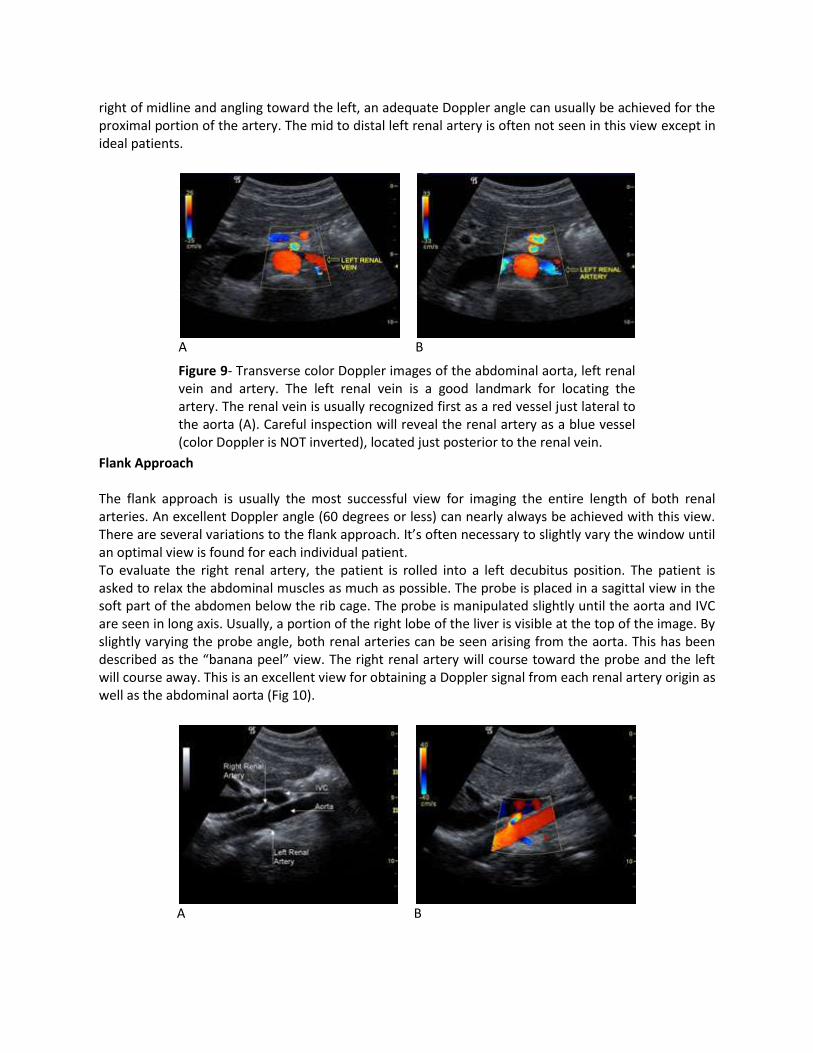
Figure 8- Transverse color Doppler images of the right renal artery passing underneath the IVC. It is difficult to recognize the right renal artery or distinguish the boundary between the IVC and right renal artery when using a low PRF. This is because color Doppler aliasing tends to hide the boundary between the two vessels (A). By increasing the PRF, flow direction becomes more apparent and the right renal artery is readily identified separate from the IVC (B).
The origin of the left renal artery is posterior compared to the right renal renal artery. On grayscale alone, the left renal artery is usually difficult to see from an anterior approach, but once color is activated the proximal portion is often well visualized. The left renal vein is an excellent landmark for locating the renal artery (Fig 9). It is frequently detected before the artery and appears as a large red vessel (flow is toward the transducer so the renal vein will be color encoded red unless the color is inverted). The renal artery will be seen posterior and slightly inferior to the renal vein and will be color encoded blue (flow coursing away from the transducer). By positioning the transducer slightly to the
right of midline and angling toward the left, an adequate Doppler angle can usually be achieved for the proximal portion of the artery. The mid to distal left renal artery is often not seen in this view except in ideal patients.
A
B
Figure 9- Transverse color Doppler images of the abdominal aorta, left renal vein and artery. The left renal vein is a good landmark for locating the artery. The renal vein is usually recognized first as a red vessel just lateral to the aorta (A). Careful inspection will reveal the renal artery as a blue vessel (color Doppler is NOT inverted), located just posterior to the renal vein.
Flank Approach The flank approach is usually the most successful view for imaging the entire length of both renal arteries. An excellent Doppler angle (60 degrees or less) can nearly always be achieved with this view. There are several variations to the flank approach. It’s often necessary to slightly vary the window until an optimal view is found for each individual patient. To evaluate the right renal artery, the patient is rolled into a left decubitus position. The patient is asked to relax the abdominal muscles as much as possible. The probe is placed in a sagittal view in the soft part of the abdomen below the rib cage. The probe is manipulated slightly until the aorta and IVC are seen in long axis. Usually, a portion of the right lobe of the liver is visible at the top of the image. By slightly varying the probe angle, both renal arteries can be seen arising from the aorta. This has been described as the “banana peel” view. The right renal artery will course toward the probe and the left will course away. This is an excellent view for obtaining a Doppler signal from each renal artery origin as well as the abdominal aorta (Fig 10).
A
B
C
D
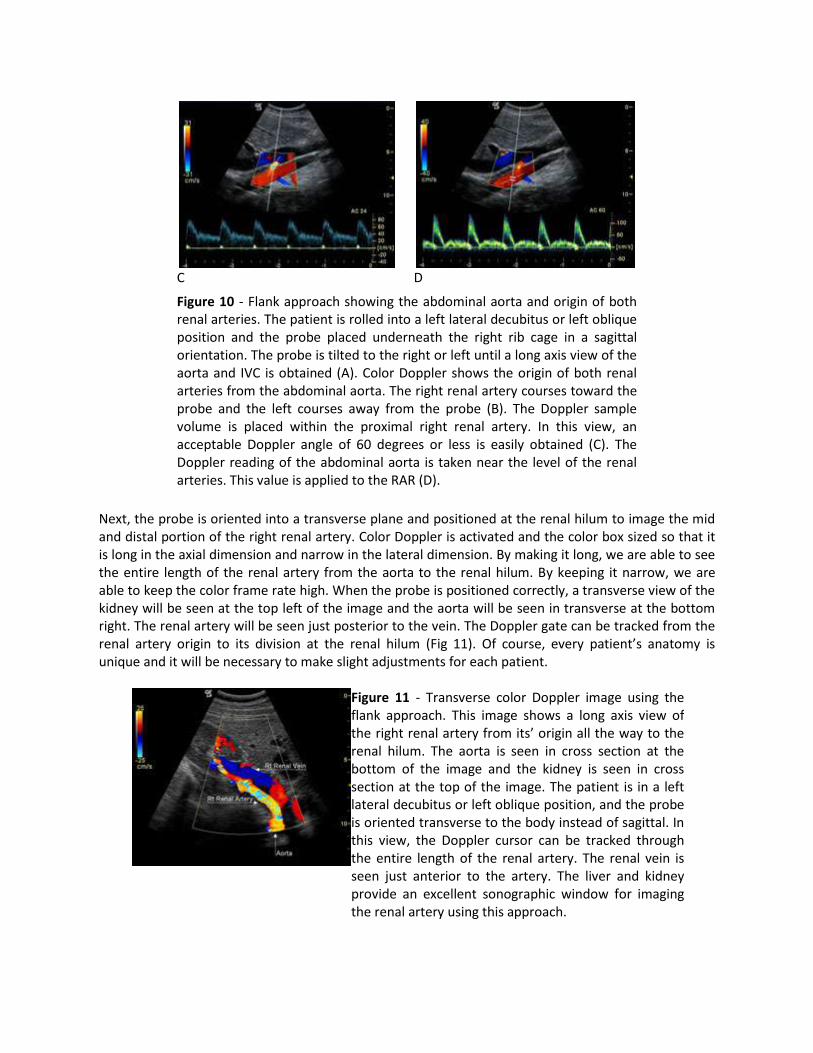
Figure 10 - Flank approach showing the abdominal aorta and origin of both renal arteries. The patient is rolled into a left lateral decubitus or left oblique position and the probe placed underneath the right rib cage in a sagittal orientation. The probe is tilted to the right or left until a long axis view of the aorta and IVC is obtained (A). Color Doppler shows the origin of both renal arteries from the abdominal aorta. The right renal artery courses toward the probe and the left courses away from the probe (B). The Doppler sample volume is placed within the proximal right renal artery. In this view, an acceptable Doppler angle of 60 degrees or less is easily obtained (C). The Doppler reading of the abdominal aorta is taken near the level of the renal arteries. This value is applied to the RAR (D).
Next, the probe is oriented into a transverse plane and positioned at the renal hilum to image the mid and distal portion of the right renal artery. Color Doppler is activated and the color box sized so that it is long in the axial dimension and narrow in the lateral dimension. By making it long, we are able to see the entire length of the renal artery from the aorta to the renal hilum. By keeping it narrow, we are able to keep the color frame rate high. When the probe is positioned correctly, a transverse view of the kidney will be seen at the top left of the image and the aorta will be seen in transverse at the bottom right. The renal artery will be seen just posterior to the vein. The Doppler gate can be tracked from the renal artery origin to its division at the renal hilum (Fig 11). Of course, every patient’s anatomy is unique and it will be necessary to make slight adjustments for each patient.
Figure 11 - Transverse color Doppler image using the flank approach. This image shows a long axis view of the right renal artery from its’ origin all the way to the renal hilum. The aorta is seen in cross section at the bottom of the image and the kidney is seen in cross section at the top of the image. The patient is in a left lateral decubitus or left oblique position, and the probe is oriented transverse to the body instead of sagittal. In this view, the Doppler cursor can be tracked through the entire length of the renal artery. The renal vein is seen just anterior to the artery. The liver and kidney provide an excellent sonographic window for imaging the renal artery using this approach.
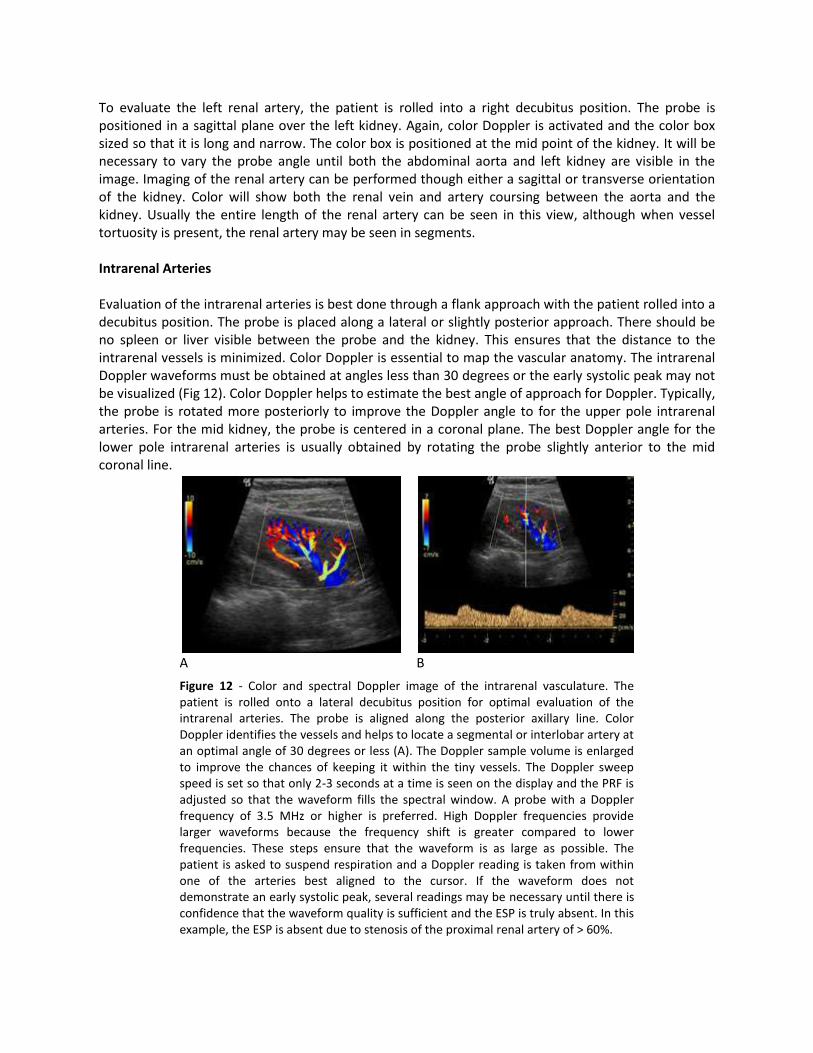
To evaluate the left renal artery, the patient is rolled into a right decubitus position. The probe is positioned in a sagittal plane over the left kidney. Again, color Doppler is activated and the color box sized so that it is long and narrow. The color box is positioned at the mid point of the kidney. It will be necessary to vary the probe angle until both the abdominal aorta and left kidney are visible in the image. Imaging of the renal artery can be performed though either a sagittal or transverse orientation of the kidney. Color will show both the renal vein and artery coursing between the aorta and the kidney. Usually the entire length of the renal artery can be seen in this view, although when vessel tortuosity is present, the renal artery may be seen in segments. Intrarenal Arteries Evaluation of the intrarenal arteries is best done through a flank approach with the patient rolled into a decubitus position. The probe is placed along a lateral or slightly posterior approach. There should be no spleen or liver visible between the probe and the kidney. This ensures that the distance to the intrarenal vessels is minimized. Color Doppler is essential to map the vascular anatomy. The intrarenal Doppler waveforms must be obtained at angles less than 30 degrees or the early systolic peak may not be visualized (Fig 12). Color Doppler helps to estimate the best angle of approach for Doppler. Typically, the probe is rotated more posteriorly to improve the Doppler angle to for the upper pole intrarenal arteries. For the mid kidney, the probe is centered in a coronal plane. The best Doppler angle for the lower pole intrarenal arteries is usually obtained by rotating the probe slightly anterior to the mid coronal line.
A
B
Figure 12 - Color and spectral Doppler image of the intrarenal vasculature. The patient is rolled onto a lateral decubitus position for optimal evaluation of the intrarenal arteries. The probe is aligned along the posterior axillary line. Color Doppler identifies the vessels and helps to locate a segmental or interlobar artery at an optimal angle of 30 degrees or less (A). The Doppler sample volume is enlarged to improve the chances of keeping it within the tiny vessels. The Doppler sweep speed is set so that only 2-3 seconds at a time is seen on the display and the PRF is adjusted so that the waveform fills the spectral window. A probe with a Doppler frequency of 3.5 MHz or higher is preferred. High Doppler frequencies provide larger waveforms because the frequency shift is greater compared to lower frequencies. These steps ensure that the waveform is as large as possible. The patient is asked to suspend respiration and a Doppler reading is taken from within one of the arteries best aligned to the cursor. If the waveform does not demonstrate an early systolic peak, several readings may be necessary until there is confidence that the waveform quality is sufficient and the ESP is truly absent. In this example, the ESP is absent due to stenosis of the proximal renal artery of > 60%.
Renal Artery Stenosis- The Problem The term renovascular hypertension (RVHT) is used to describe elevated blood pressure that is primarily caused by renal artery stenosis. This type of hypertension accounts for approximately 1-10% of patients with hypertension. Since RVHT is potentially curable with correction of the renal artery stenosis (RAS), patients having clinical findings of RVHT are often referred for a Doppler exam to evaluate their renal arteries. If stenosis is detected, intervention can be planned. Clinical findings associated with RVHT are listed in the table below. Obstruction of the renal arteries may be caused by atherosclerotic disease or arterial dysplasias. In younger patients, RVHT most often develops as a result fibromuscular dysplasia. This is more common in females than males. Older patients with RVHT are typically male who develop renal artery stenosis due to atherosclerotic disease.
Clinical Findings in Renovascular Hypertension
Hypertension that is difficult to control with medical treatment
Hypertension associated with renal failure or progressive renal
insufficiency
Severe hypertension (diastolic blood pressure >120 mm Hg)
Onset of hypertension before age 30 or after age 50
Abrupt onset of hypertension
Generalized atherosclerosis
Negative family history of hypertension
Abdominal bruit
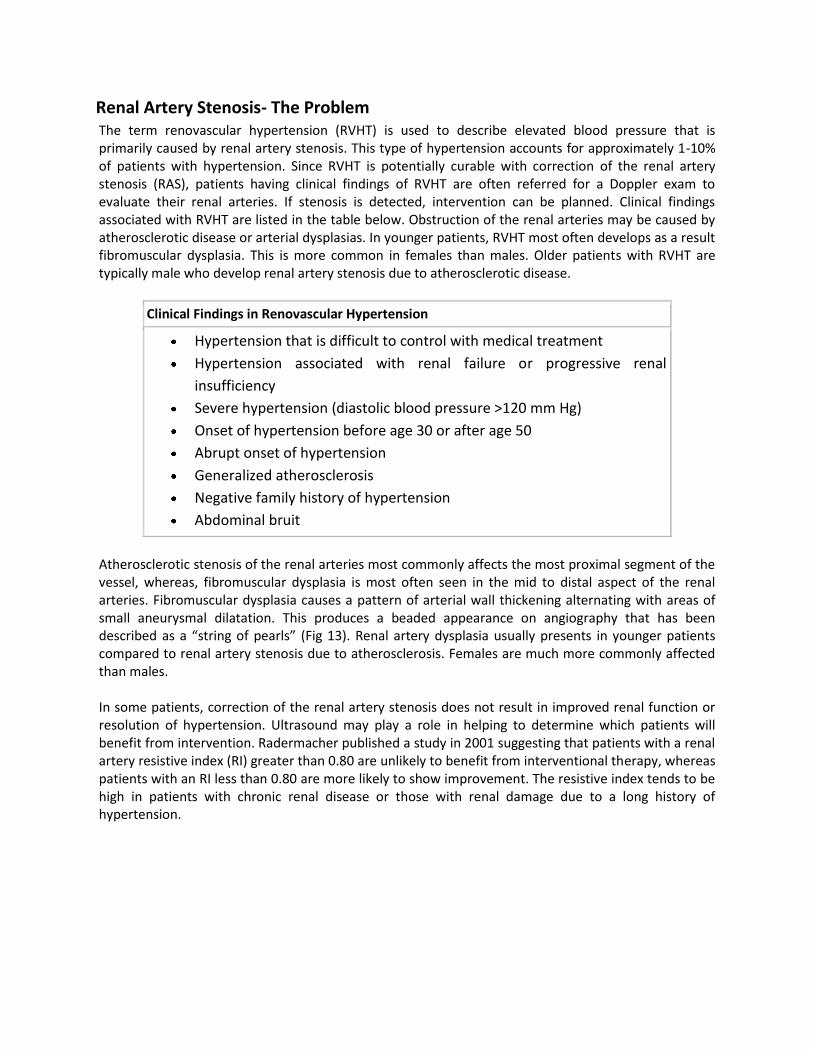
Atherosclerotic stenosis of the renal arteries most commonly affects the most proximal segment of the vessel, whereas, fibromuscular dysplasia is most often seen in the mid to distal aspect of the renal arteries. Fibromuscular dysplasia causes a pattern of arterial wall thickening alternating with areas of small aneurysmal dilatation. This produces a beaded appearance on angiography that has been described as a “string of pearls” (Fig 13). Renal artery dysplasia usually presents in younger patients compared to renal artery stenosis due to atherosclerosis. Females are much more commonly affected than males. In some patients, correction of the renal artery stenosis does not result in improved renal function or resolution of hypertension. Ultrasound may play a role in helping to determine which patients will benefit from intervention. Radermacher published a study in 2001 suggesting that patients with a renal artery resistive index (RI) greater than 0.80 are unlikely to benefit from interventional therapy, whereas patients with an RI less than 0.80 are more likely to show improvement. The resistive index tends to be high in patients with chronic renal disease or those with renal damage due to a long history of hypertension.
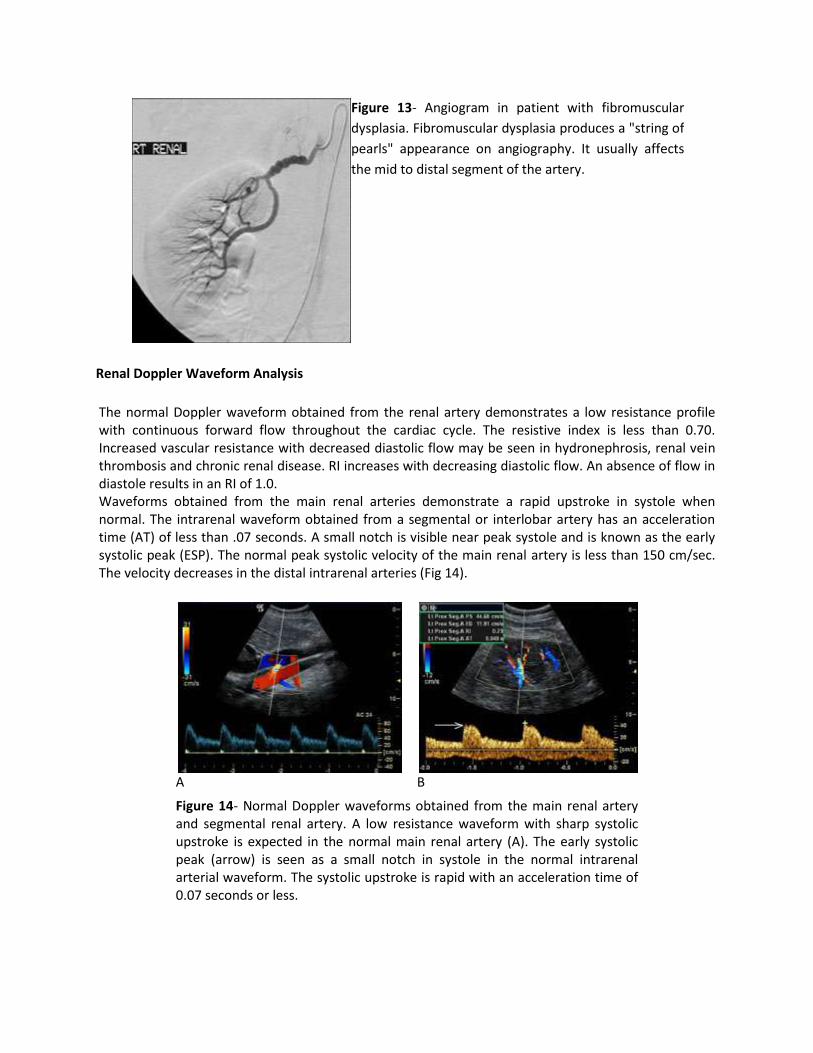
Figure 13- Angiogram in patient with fibromuscular
dysplasia. Fibromuscular dysplasia produces a "string of
pearls" appearance on angiography. It usually affects
the mid to distal segment of the artery.
Renal Doppler Waveform Analysis
The normal Doppler waveform obtained from the renal artery demonstrates a low resistance profile with continuous forward flow throughout the cardiac cycle. The resistive index is less than 0.70. Increased vascular resistance with decreased diastolic flow may be seen in hydronephrosis, renal vein thrombosis and chronic renal disease. RI increases with decreasing diastolic flow. An absence of flow in diastole results in an RI of 1.0. Waveforms obtained from the main renal arteries demonstrate a rapid upstroke in systole when normal. The intrarenal waveform obtained from a segmental or interlobar artery has an acceleration time (AT) of less than .07 seconds. A small notch is visible near peak systole and is known as the early systolic peak (ESP). The normal peak systolic velocity of the main renal artery is less than 150 cm/sec. The velocity decreases in the distal intrarenal arteries (Fig 14).
A
B
Figure 14- Normal Doppler waveforms obtained from the main renal artery and segmental renal artery. A low resistance waveform with sharp systolic upstroke is expected in the normal main renal artery (A). The early systolic peak (arrow) is seen as a small notch in systole in the normal intrarenal arterial waveform. The systolic upstroke is rapid with an acceleration time of 0.07 seconds or less.
Ultrasound Diagnosis of Renal Artery Stenosis Contrast angiography (CA) is the gold standard in the diagnosis of renal artery stenosis (RAS). Due to its invasive nature, however, CA is not suitable for screening. Multiple studies have shown that Doppler Ultrasound can be an effective tool in the diagnosis of RAS. Both a direct (evaluation of the main renal artery) and indirect (evaluation of the segmental/interlobar arteries) method of diagnosing RAS have been shown to be useful. Direct and indirect methods have both been shown to have sensitivity and specificity in the low to mid 90% range. The most reliable approach combines the two methods. Other tests used for detection of RAS include radionuclide scanning, MRA and Spiral CT.
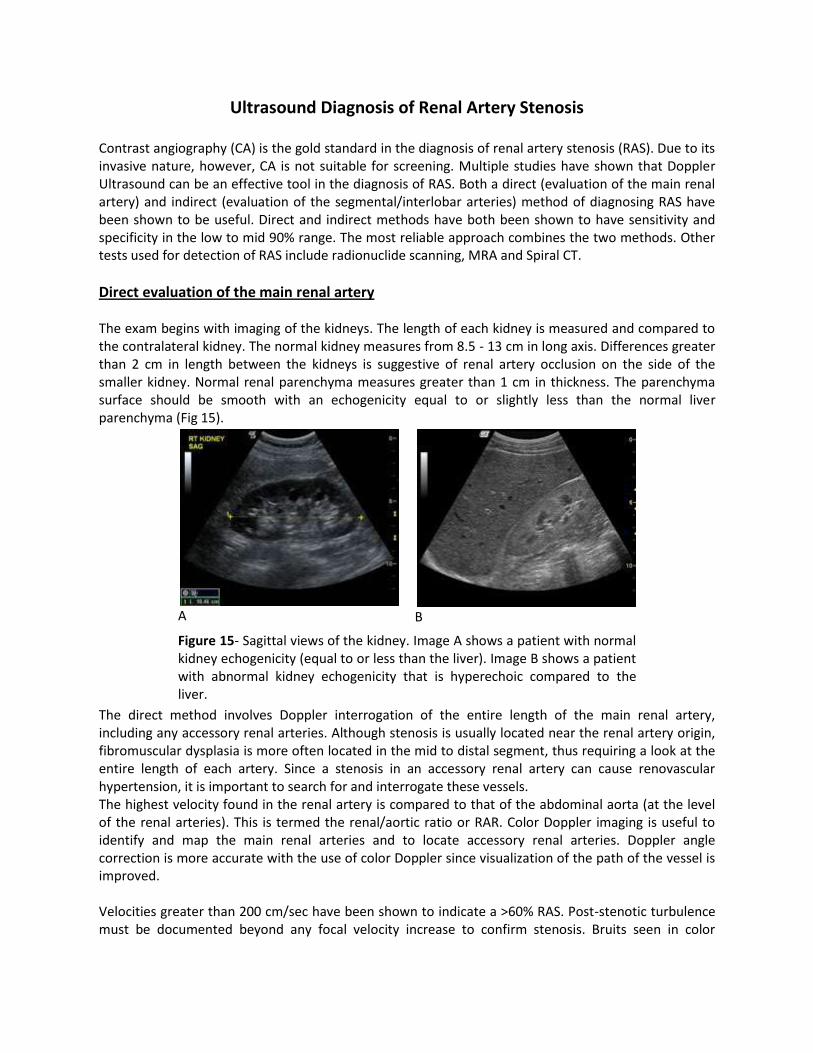
Direct evaluation of the main renal artery The exam begins with imaging of the kidneys. The length of each kidney is measured and compared to the contralateral kidney. The normal kidney measures from 8.5 - 13 cm in long axis. Differences greater than 2 cm in length between the kidneys is suggestive of renal artery occlusion on the side of the smaller kidney. Normal renal parenchyma measures greater than 1 cm in thickness. The parenchyma surface should be smooth with an echogenicity equal to or slightly less than the normal liver parenchyma (Fig 15).
A
B
Figure 15- Sagittal views of the kidney. Image A shows a patient with normal kidney echogenicity (equal to or less than the liver). Image B shows a patient with abnormal kidney echogenicity that is hyperechoic compared to the liver.
The direct method involves Doppler interrogation of the entire length of the main renal artery, including any accessory renal arteries. Although stenosis is usually located near the renal artery origin, fibromuscular dysplasia is more often located in the mid to distal segment, thus requiring a look at the entire length of each artery. Since a stenosis in an accessory renal artery can cause renovascular hypertension, it is important to search for and interrogate these vessels. The highest velocity found in the renal artery is compared to that of the abdominal aorta (at the level of the renal arteries). This is termed the renal/aortic ratio or RAR. Color Doppler imaging is useful to identify and map the main renal arteries and to locate accessory renal arteries. Doppler angle correction is more accurate with the use of color Doppler since visualization of the path of the vessel is improved. Velocities greater than 200 cm/sec have been shown to indicate a >60% RAS. Post-stenotic turbulence must be documented beyond any focal velocity increase to confirm stenosis. Bruits seen in color
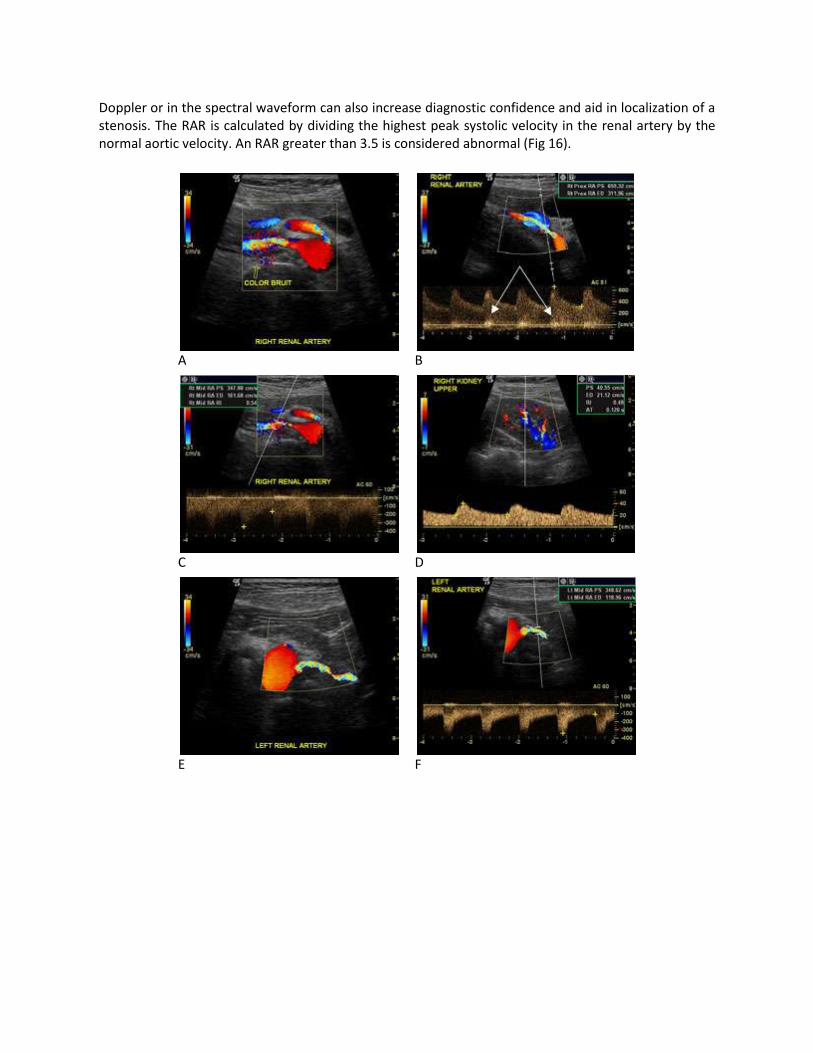
Doppler or in the spectral waveform can also increase diagnostic confidence and aid in localization of a stenosis. The RAR is calculated by dividing the highest peak systolic velocity in the renal artery by the normal aortic velocity. An RAR greater than 3.5 is considered abnormal (Fig 16).
A
B
C
D
E
F
G
H
I
J
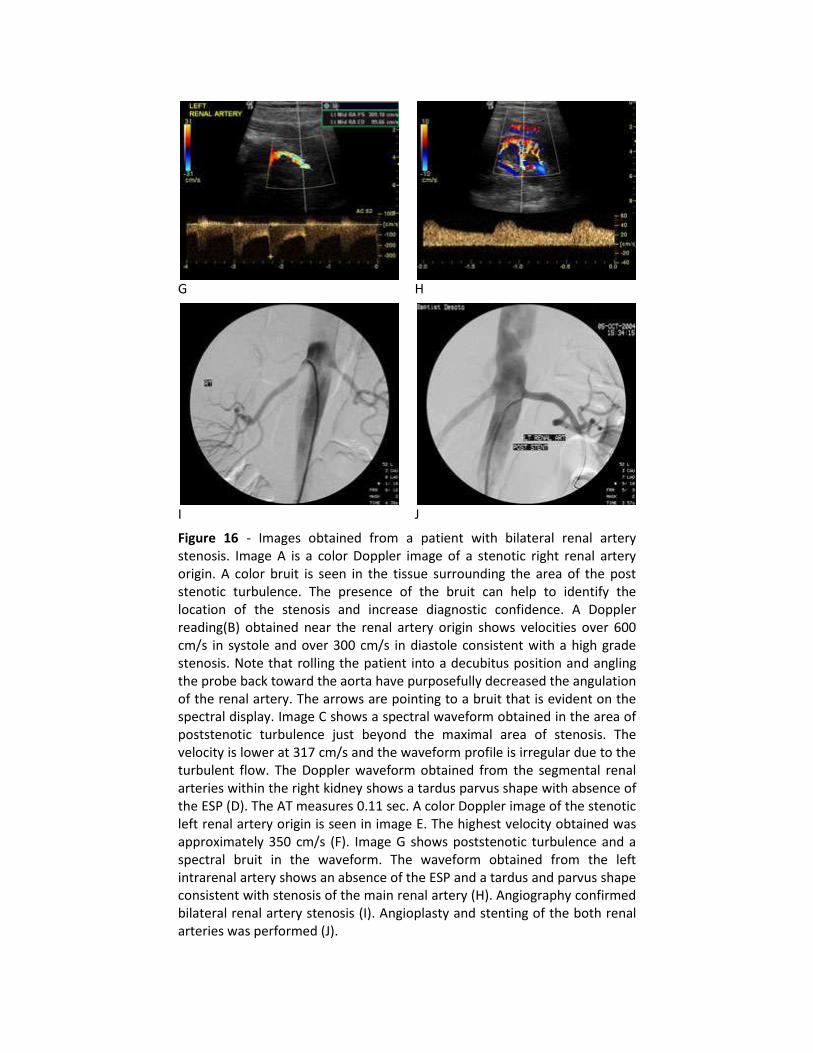
Figure 16 - Images obtained from a patient with bilateral renal artery stenosis. Image A is a color Doppler image of a stenotic right renal artery origin. A color bruit is seen in the tissue surrounding the area of the post stenotic turbulence. The presence of the bruit can help to identify the location of the stenosis and increase diagnostic confidence. A Doppler reading(B) obtained near the renal artery origin shows velocities over 600 cm/s in systole and over 300 cm/s in diastole consistent with a high grade stenosis. Note that rolling the patient into a decubitus position and angling the probe back toward the aorta have purposefully decreased the angulation of the renal artery. The arrows are pointing to a bruit that is evident on the spectral display. Image C shows a spectral waveform obtained in the area of poststenotic turbulence just beyond the maximal area of stenosis. The velocity is lower at 317 cm/s and the waveform profile is irregular due to the turbulent flow. The Doppler waveform obtained from the segmental renal arteries within the right kidney shows a tardus parvus shape with absence of the ESP (D). The AT measures 0.11 sec. A color Doppler image of the stenotic left renal artery origin is seen in image E. The highest velocity obtained was approximately 350 cm/s (F). Image G shows poststenotic turbulence and a spectral bruit in the waveform. The waveform obtained from the left intrarenal artery shows an absence of the ESP and a tardus and parvus shape consistent with stenosis of the main renal artery (H). Angiography confirmed bilateral renal artery stenosis (I). Angioplasty and stenting of the both renal arteries was performed (J).
Attention to Doppler technique is key in this exam. The Doppler angle must be 60 degrees or less and aligned parallel to the vessel wall. Angles greater than 60 degrees tend to result in overestimation of the velocity. Misalignment of the angle correction cursor so that it is not parallel with the vessel wall is a common cause of incorrect velocity measurements. The image is often frozen when obtaining Doppler readings in duplex exams. If the probe position is adjusted to improve the Doppler trace while the image is frozen, the image no longer accurately portrays the Doppler location and the angle may not be measured correctly. To avoid this pitfall, it is necessary to update the image after manipulating the probe. A low Doppler frequency is recommended (usually 2-3 MHz) to reduce aliasing of the waveform and improve penetration. The system pulse repetition frequency (PRF) is monitored and increased whenever aliasing is encountered so that the systolic peak can be demonstrated without wraparound. Doppler waveforms with aliasing will result in inaccurate peak systolic measurements unless the aliased and non aliased signal velocities are manually added together (Fig 17).
A
B
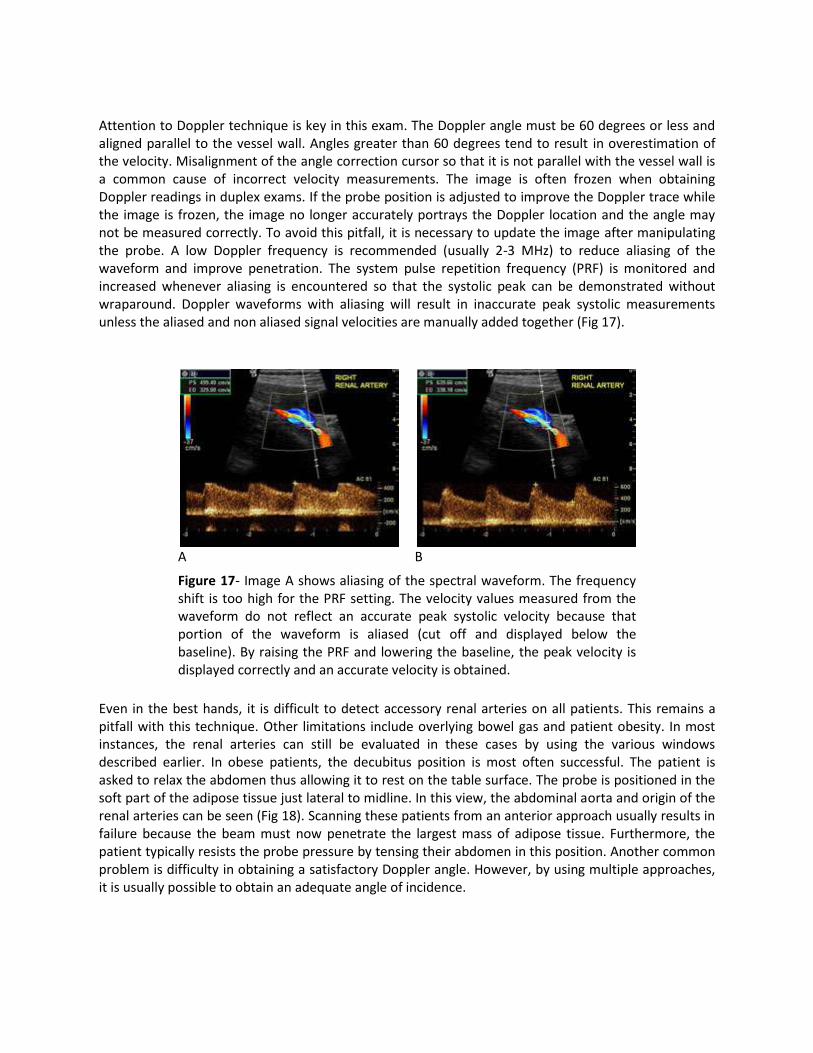
Figure 17- Image A shows aliasing of the spectral waveform. The frequency shift is too high for the PRF setting. The velocity values measured from the waveform do not reflect an accurate peak systolic velocity because that portion of the waveform is aliased (cut off and displayed below the baseline). By raising the PRF and lowering the baseline, the peak velocity is displayed correctly and an accurate velocity is obtained.
Even in the best hands, it is difficult to detect accessory renal arteries on all patients. This remains a pitfall with this technique. Other limitations include overlying bowel gas and patient obesity. In most instances, the renal arteries can still be evaluated in these cases by using the various windows described earlier. In obese patients, the decubitus position is most often successful. The patient is asked to relax the abdomen thus allowing it to rest on the table surface. The probe is positioned in the soft part of the adipose tissue just lateral to midline. In this view, the abdominal aorta and origin of the renal arteries can be seen (Fig 18). Scanning these patients from an anterior approach usually results in failure because the beam must now penetrate the largest mass of adipose tissue. Furthermore, the patient typically resists the probe pressure by tensing their abdomen in this position. Another common problem is difficulty in obtaining a satisfactory Doppler angle. However, by using multiple approaches, it is usually possible to obtain an adequate angle of incidence.
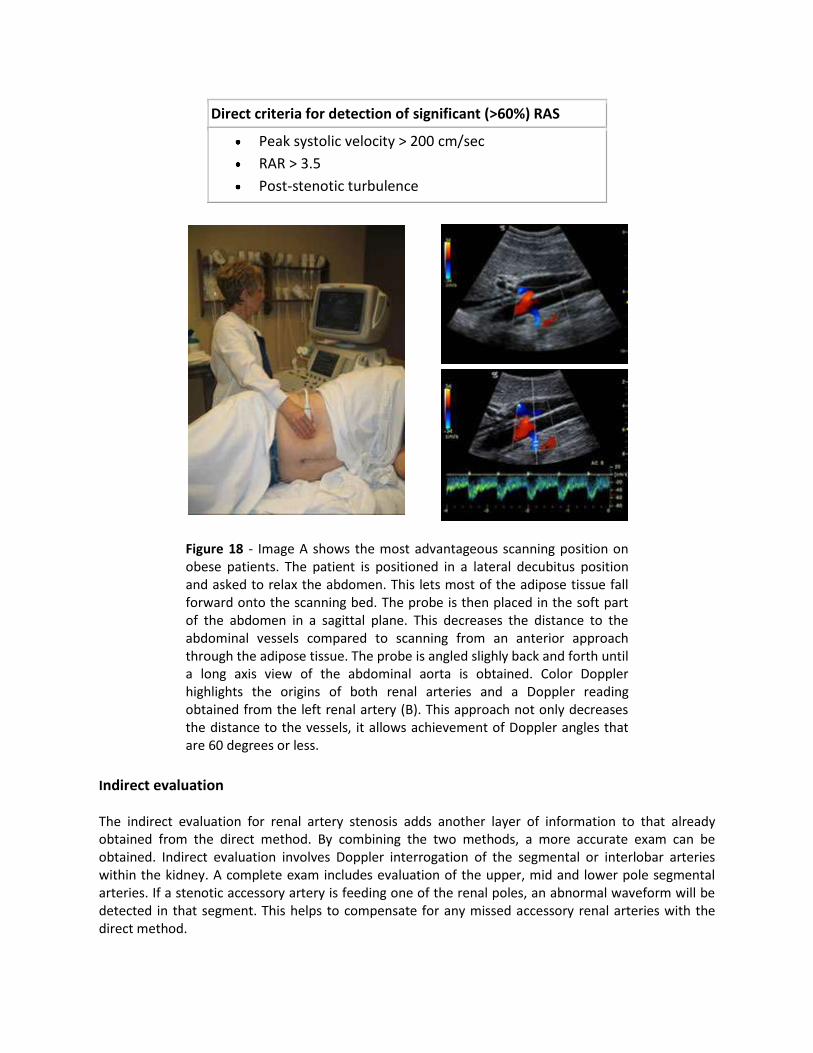
Direct criteria for detection of significant (>60%) RAS
Peak systolic velocity > 200 cm/sec
RAR > 3.5
Post-stenotic turbulence
Figure 18 - Image A shows the most advantageous scanning position on obese patients. The patient is positioned in a lateral decubitus position and asked to relax the abdomen. This lets most of the adipose tissue fall forward onto the scanning bed. The probe is then placed in the soft part of the abdomen in a sagittal plane. This decreases the distance to the abdominal vessels compared to scanning from an anterior approach through the adipose tissue. The probe is angled slighly back and forth until a long axis view of the abdominal aorta is obtained. Color Doppler highlights the origins of both renal arteries and a Doppler reading obtained from the left renal artery (B). This approach not only decreases the distance to the vessels, it allows achievement of Doppler angles that are 60 degrees or less.
Indirect evaluation The indirect evaluation for renal artery stenosis adds another layer of information to that already obtained from the direct method. By combining the two methods, a more accurate exam can be obtained. Indirect evaluation involves Doppler interrogation of the segmental or interlobar arteries within the kidney. A complete exam includes evaluation of the upper, mid and lower pole segmental arteries. If a stenotic accessory artery is feeding one of the renal poles, an abnormal waveform will be detected in that segment. This helps to compensate for any missed accessory renal arteries with the direct method.
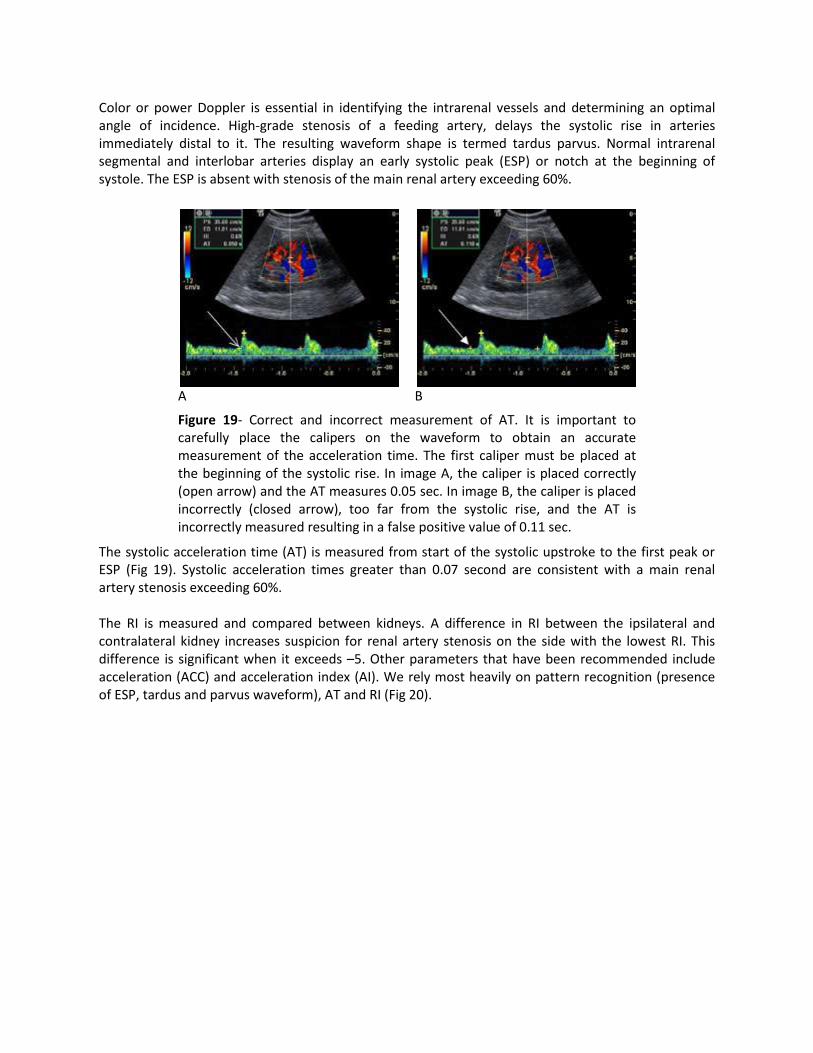
Color or power Doppler is essential in identifying the intrarenal vessels and determining an optimal angle of incidence. High-grade stenosis of a feeding artery, delays the systolic rise in arteries immediately distal to it. The resulting waveform shape is termed tardus parvus. Normal intrarenal segmental and interlobar arteries display an early systolic peak (ESP) or notch at the beginning of systole. The ESP is absent with stenosis of the main renal artery exceeding 60%.
A
B
Figure 19- Correct and incorrect measurement of AT. It is important to carefully place the calipers on the waveform to obtain an accurate measurement of the acceleration time. The first caliper must be placed at the beginning of the systolic rise. In image A, the caliper is placed correctly (open arrow) and the AT measures 0.05 sec. In image B, the caliper is placed incorrectly (closed arrow), too far from the systolic rise, and the AT is incorrectly measured resulting in a false positive value of 0.11 sec.
The systolic acceleration time (AT) is measured from start of the systolic upstroke to the first peak or ESP (Fig 19). Systolic acceleration times greater than 0.07 second are consistent with a main renal artery stenosis exceeding 60%. The RI is measured and compared between kidneys. A difference in RI between the ipsilateral and contralateral kidney increases suspicion for renal artery stenosis on the side with the lowest RI. This difference is significant when it exceeds –5. Other parameters that have been recommended include acceleration (ACC) and acceleration index (AI). We rely most heavily on pattern recognition (presence of ESP, tardus and parvus waveform), AT and RI (Fig 20).
A
B
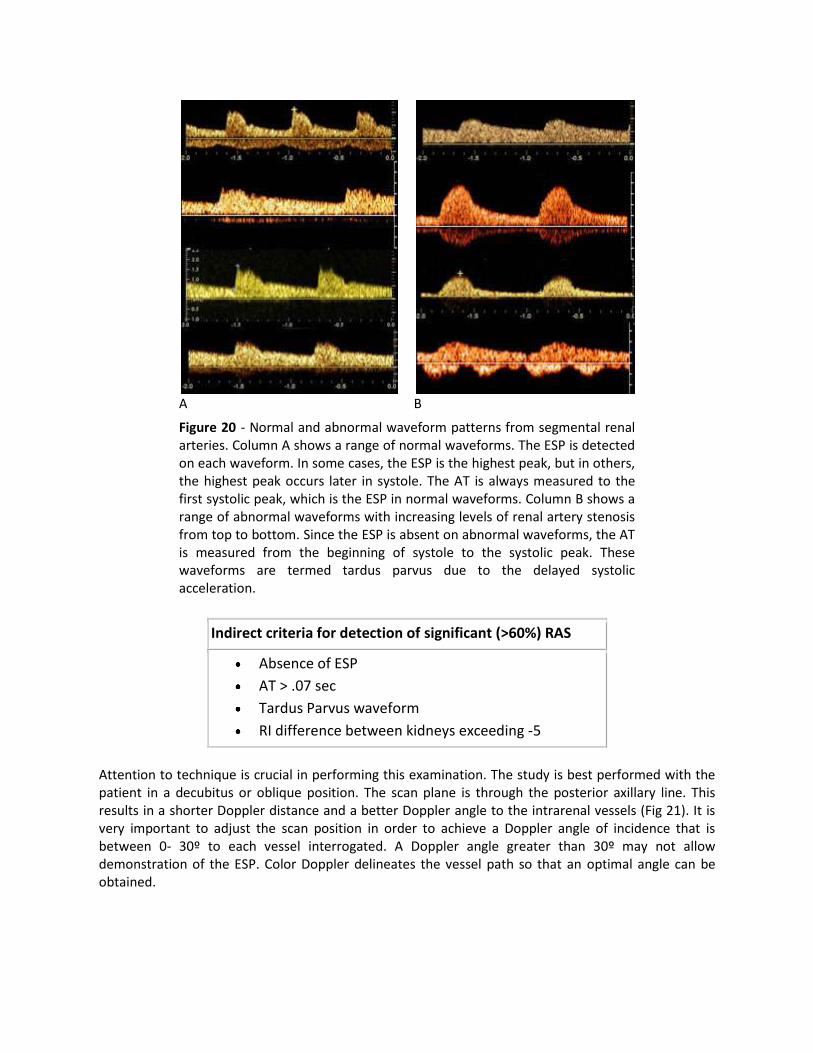
Figure 20 - Normal and abnormal waveform patterns from segmental renal arteries. Column A shows a range of normal waveforms. The ESP is detected on each waveform. In some cases, the ESP is the highest peak, but in others, the highest peak occurs later in systole. The AT is always measured to the first systolic peak, which is the ESP in normal waveforms. Column B shows a range of abnormal waveforms with increasing levels of renal artery stenosis from top to bottom. Since the ESP is absent on abnormal waveforms, the AT is measured from the beginning of systole to the systolic peak. These waveforms are termed tardus parvus due to the delayed systolic acceleration.
Indirect criteria for detection of significant (>60%) RAS
Absence of ESP
AT > .07 sec
Tardus Parvus waveform
RI difference between kidneys exceeding -5
Attention to technique is crucial in performing this examination. The study is best performed with the patient in a decubitus or oblique position. The scan plane is through the posterior axillary line. This results in a shorter Doppler distance and a better Doppler angle to the intrarenal vessels (Fig 21). It is very important to adjust the scan position in order to achieve a Doppler angle of incidence that is between 0- 30º to each vessel interrogated. A Doppler angle greater than 30º may not allow demonstration of the ESP. Color Doppler delineates the vessel path so that an optimal angle can be obtained.
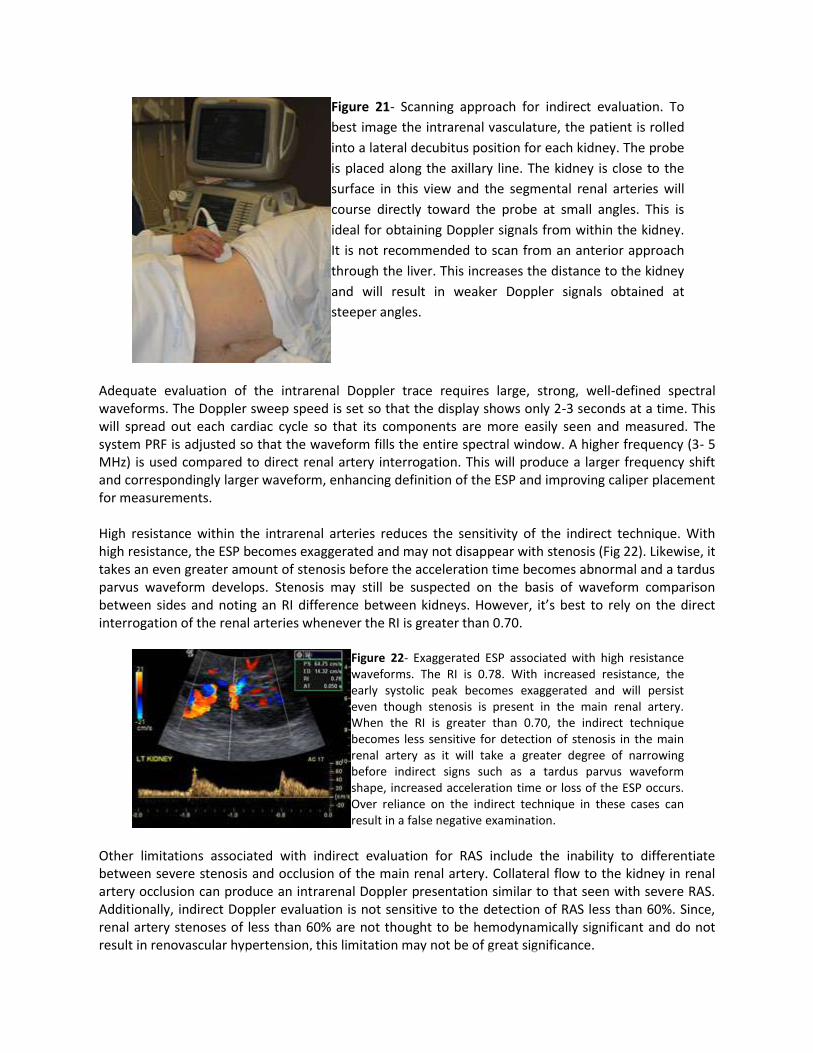
Figure 21- Scanning approach for indirect evaluation. To
best image the intrarenal vasculature, the patient is rolled
into a lateral decubitus position for each kidney. The probe
is placed along the axillary line. The kidney is close to the
surface in this view and the segmental renal arteries will
course directly toward the probe at small angles. This is
ideal for obtaining Doppler signals from within the kidney.
It is not recommended to scan from an anterior approach
through the liver. This increases the distance to the kidney
and will result in weaker Doppler signals obtained at
steeper angles.
Adequate evaluation of the intrarenal Doppler trace requires large, strong, well-defined spectral waveforms. The Doppler sweep speed is set so that the display shows only 2-3 seconds at a time. This will spread out each cardiac cycle so that its components are more easily seen and measured. The system PRF is adjusted so that the waveform fills the entire spectral window. A higher frequency (3- 5 MHz) is used compared to direct renal artery interrogation. This will produce a larger frequency shift and correspondingly larger waveform, enhancing definition of the ESP and improving caliper placement for measurements. High resistance within the intrarenal arteries reduces the sensitivity of the indirect technique. With high resistance, the ESP becomes exaggerated and may not disappear with stenosis (Fig 22). Likewise, it takes an even greater amount of stenosis before the acceleration time becomes abnormal and a tardus parvus waveform develops. Stenosis may still be suspected on the basis of waveform comparison between sides and noting an RI difference between kidneys. However, it’s best to rely on the direct interrogation of the renal arteries whenever the RI is greater than 0.70.
Figure 22- Exaggerated ESP associated with high resistance waveforms. The RI is 0.78. With increased resistance, the early systolic peak becomes exaggerated and will persist even though stenosis is present in the main renal artery. When the RI is greater than 0.70, the indirect technique becomes less sensitive for detection of stenosis in the main renal artery as it will take a greater degree of narrowing before indirect signs such as a tardus parvus waveform shape, increased acceleration time or loss of the ESP occurs. Over reliance on the indirect technique in these cases can result in a false negative examination.
Other limitations associated with indirect evaluation for RAS include the inability to differentiate between severe stenosis and occlusion of the main renal artery. Collateral flow to the kidney in renal artery occlusion can produce an intrarenal Doppler presentation similar to that seen with severe RAS. Additionally, indirect Doppler evaluation is not sensitive to the detection of RAS less than 60%. Since, renal artery stenoses of less than 60% are not thought to be hemodynamically significant and do not result in renovascular hypertension, this limitation may not be of great significance.
It's important to emphasize that use of poor Doppler angles and low Doppler frequencies can result in nonvisualization of the ESP. The ESP is best seen at Doppler angles less than 30º and Doppler frequencies of 3 MHz or greater. It is necessary to obtain Doppler samplings at the upper, mid and lower pole of the kidney; otherwise, renovascular hypertension due to stenosis of an accessory renal artery will be missed. Bilateral tardus parvus waveforms could potentially be the result of a proximal stenosis in the aorta or aortic aneurysm rather than bilateral RAS. Direct interrogation of the renal arteries will help to determine if stenosis is present. Evaluation of the abdominal aorta should be performed to rule out aneurysm.
Summary
Ultrasound evaluation for renal artery stenosis can be accurately accomplished with both
direct and indirect methods. Combining the two methods overcomes some of the limitations
specific to each. Attention to technique is crucial for success with both methods. Color and/or
Power Doppler improves visualization of the anatomy and is essential for determining an
optimal angle with the indirect technique.
References
1. Halpern EJ, Needleman L, Nack TL, East SA. Renal artery stenosis: should we study the main renal artery or segmental vessels? Radiology 1995;195:799-804.
2. Stavros AT, Harshfield D. Renal Doppler, Renal Artery Stenosis, and Renovascular Hypertension: Direct and Indirect Duplex Sonographic Abnormalities in Patients with Renal Artery Stenosis. Ultrasound Qtrly 1994;12:217-63
3. Stavros AT, Parker SH, Yakes WF, et al. Segmental renal artery tardus-parvus waveform abnormalities -pattern recognition approach to duplex sonographic diagnosis of renal artery stenosis. Radiology 1992;184:487-92.
4. Martin RL, Nanra RS, Wlodarczyk J, Desilva A, Bray AIE. Renal Hilar Doppler Analysis in the detection of renal artery stenosis. J Vasc Technology 1991;15:173-80.
5. Isaacson, JA,Zierler RE, Spittell PC, Strandness DE. Noninvasive Screening for renal artery stenosis: Comparison of renal artery and renal hilar duplex scanning. JVT 1995; 19:105-110.
6. Handa N, Fukunaga R, Etani H, Yoneda S, et al. Efficacy of echo-Doppler examination for the evaluation of renovascular disease. Ultrasound Med Biol 1988;14:1-5.
7. Schwerk WB, Restrepo IK, Stellwaag M, et al. Renal Artery Stenosis: Grading with Image-directed Doppler US Evaluation of Renal Resistive Index. Radiology 1994:190:785-790.
8. Helenon O, Rody FE, Correas J, Melki P, et al. Color Doppler US of Renovascular Disease in Native Kidneys. Radiographics 1995:15:833-854.
9. Stanley JC. Renovascular Hypertension in Women. Sem Vasc Surg 1995:8:306-316. 10. Lee H, Grant EG, Sonography in Renovascular Hypertension. J Ultrasound med 2002 21:431-
441. 11. Radermacher J, Chavan J, Bleck J, et al. Use of Doppler ultrasonography to predict the outcome
of therapy for renal artery stenosis. N Engl J Med 2001; 344:410-417.
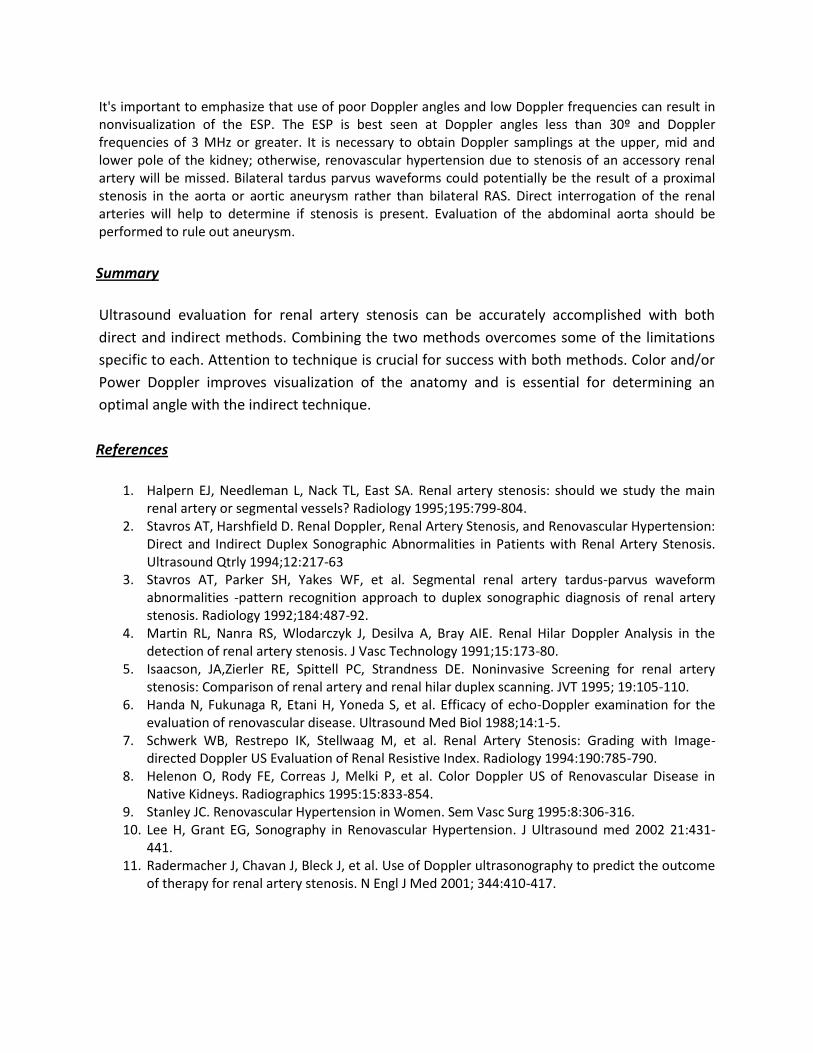
Quiz 1. Which waveform below demonstrates a tardus parvus appearance?
2. When performing Doppler analysis of the segmental renal arteries, the Doppler angle should be:
Less than 30 degrees
60 degrees
45-60 degrees
90 degrees 3. The most optimal patient positioning for imaging the intrarenal vasculature of the right kidney is:
Supine
Left lateral decubitus
Right lateral decubitus
Prone
4. Which of the following is considered to be a normal RAR?
2
3.5
4
5.5 5. Which of the following most accurately describes the normal course of the left renal vein?
Retroaortic
Between the SMA and splenic vein
Underneath the IVC
Anterior to the aorta and posterior to the SMA 6. Which intrarenal arteries normally course above the renal pyramids toward the periphery of the kidney?
Arcuate
Segmental
Interlobular
Interlobar 7. A landmark for locating the left renal artery is:
Left renal vein
Splenic vein
Gastroduodenal artery
Inferior mesenteric artery
8. A false negative indirect renal Doppler study is most likely to occur due to which of the following:
Patient was not NPO
RI is above 0.70
RI is below 0.70
Aortic aneurysm 9. The angiographic appearance termed "string of pearls" is seen with:
High grade renal artery stenosis
Renal artery dissection
Renal artery aneurysm
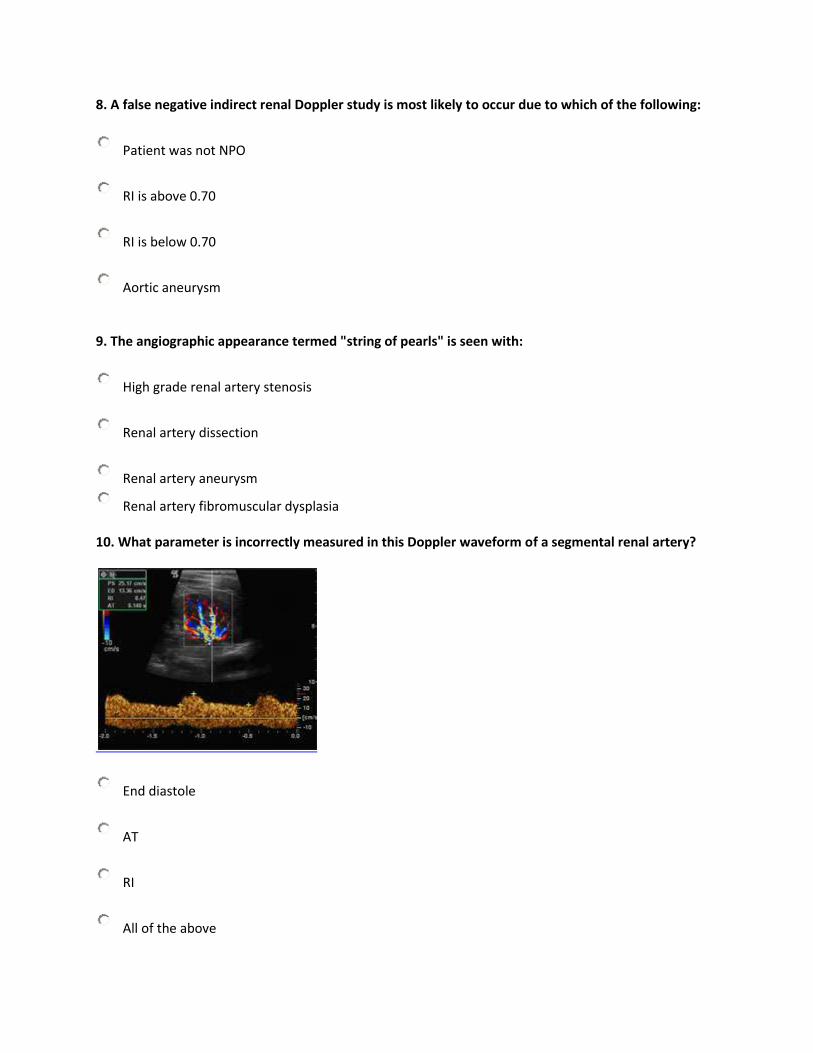
Renal artery fibromuscular dysplasia 10. What parameter is incorrectly measured in this Doppler waveform of a segmental renal artery?
End diastole
AT
RI
All of the above
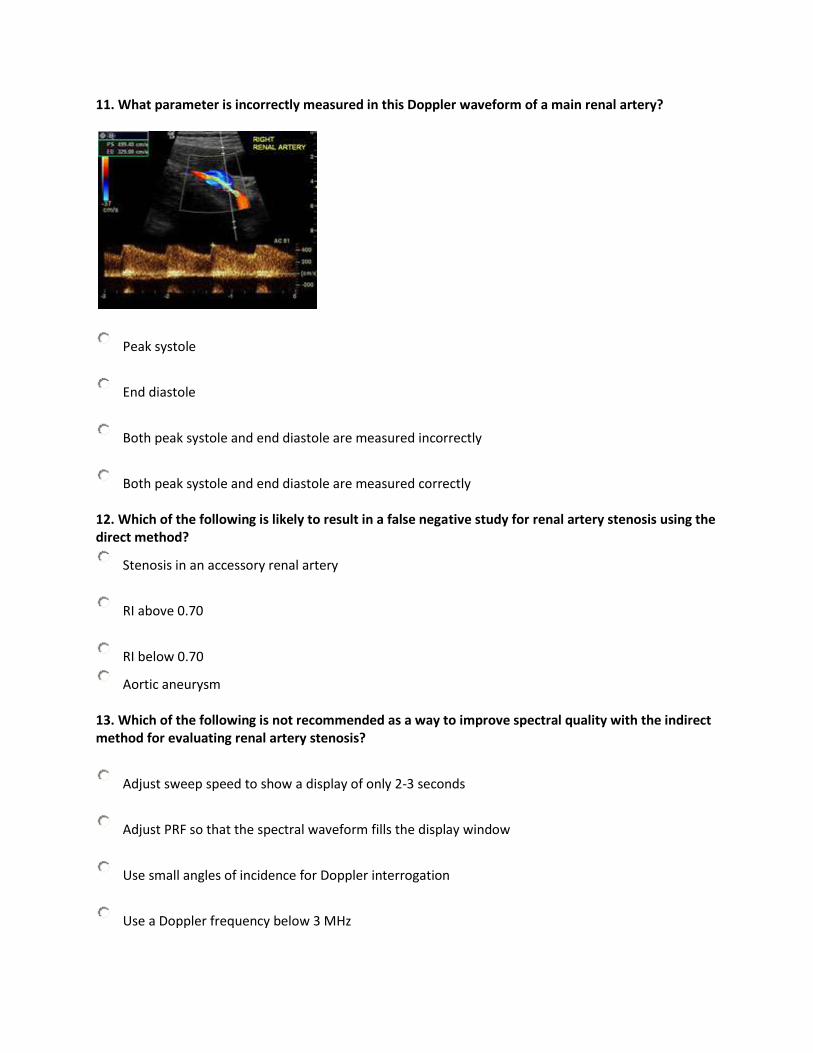
11. What parameter is incorrectly measured in this Doppler waveform of a main renal artery?
Peak systole
End diastole
Both peak systole and end diastole are measured incorrectly
Both peak systole and end diastole are measured correctly 12. Which of the following is likely to result in a false negative study for renal artery stenosis using the direct method?
Stenosis in an accessory renal artery
RI above 0.70
RI below 0.70
Aortic aneurysm 13. Which of the following is not recommended as a way to improve spectral quality with the indirect method for evaluating renal artery stenosis?
Adjust sweep speed to show a display of only 2-3 seconds
Adjust PRF so that the spectral waveform fills the display window
Use small angles of incidence for Doppler interrogation
Use a Doppler frequency below 3 MHz

14. An accurate description of the RAR is:
Maximum renal artery velocity divided by aortic velocity obtained at the level of the aortic bifurcation
Segmental renal artery velocity divided by aortic velocity obtained at the level of the aortic bifurcation
Maximum renal artery velocity divided by aortic velocity obtained at the level of the renal arteries
Minimum renal artery velocity divided by aortic velocity obtained at the level of the aortic bifurcation 15. The normal renal parenchyma echogenicity is:
hyperechoic to the liver
hypoechoic to the liver
equal to the liver
Both B and C are correct