Ultrasonic spectroscopy and fractal analysis in the study ... · Ultrasonic spectroscopy and...
11
Ultrasonic spectroscopy and fractal analysis in the study on progressive aggregation of humic substances in diluted solutions JIŘÍ KUČERÍK, MARTIN DRASTÍK, OLDŘICH ZMEŠKAL, ANNA ČTVRTNÍČKOVÁ Institute of Applied and Physical Chemistry, Faculty of Chemistry Brno University of Technology Purkyňova 118, Brno CZECH REPUBLIC [email protected] http://www.fch.vutbr.cz/home/kucerik Abstract: High resolution ultrasonic spectroscopy was used to study progressive aggregation and structural changes in diluted aquatic solutions of humic substances over the concentration range from 0.001 g/L to 3 g/L. For this purpose, both sodium salts (fulvates) and protonized forms of fulvic acids and sodium salts of humic acids (humates) were used; the origin of humic substances covered wide range of sources. Obtained results confirmed previously published statement about the progressive aggregation of humic substances in diluted solutions. The method allowing the treatment of obtained data by fractal analysis was developed and tested. Determined dependency of fractal dimension on concentration revealed clear differences in mechanisms of aggregation of individual humic and fulvic samples. In fact the value of fractal dimension 2.5 was determined for the concentration 3g/L; diluting the solution caused increasing in fractal dimension value up to 3 for concentrations around 0.01 g/L. The increase was not the same for all samples, in fact the most significant fluctuation in this concentration range was observed for fulvic acids. It was found out that despite the prevalence of hydrophobic forces in stabilization of humic substances in diluted solutions, also the nature of the counterion represents one of the crucial factors playing role in conformation and stability of humates and fulvates. In accordance with previous observations based on the measurement of lignite humates, also humates, fulvates and fulvic acids originating from various sources showed the change in their aggregates properties around the concentration 1 g/L. Key-Words: Humic and fulvic acids, aggregation, IHSS, ultrasonic spectroscopy, fractal analysis. 1 Introduction Humic substances (HS) are the most abundant group of organic compounds on the Earth but their chemistry is still not perfectly understood. Frequently, they are described as yellow to black mixture of organic compounds rich in oxygen-containing functional groups (carboxyl group -COOH; phenolic and alcoholic -OH group; ketonic and quinoic -C=O group) which are bound on both aromatic and aliphatic carbon structures. HS are traditionally divided into three groups according to their solubility under acidic or alkaline conditions: humin, the insoluble fraction; humic acids (HA), the fraction soluble under alkaline conditions and fulvic acids (FA), the fraction soluble under all pH conditions. In HS supramolecular structure there can be found remnants (e.g. lipids, saccharides, aliphatic chains, aromatic cycles, (poly)phenols, etc.) originating from miscellaneous debris. Such heterogeneity gives rise to unique and broad functions which HS play in natural systems. By general consent, HS are considered to be the crucial factor that may help to restrict deserts broadening as well as to decrease the greenhouse gases level. In soils they help to prevent drying and shrinking, improve moisture retaining properties, permit exchange of gases, stabilize structure, enhance availability of micronutrients to higher plants and increase the cation exchange capacity [1]. They exhibit hormone-like activity, especially the low-dimension aggregates and potentially polar compounds present in humic matter; those biological properties are frequently compared with hormonal activity of gibberellins or auxins [1]. Industrial utilization of HS or of their separated fraction is thought to have a great potential. For example, HA can be employed as surfactants in the soil washing of sites contaminated by metal ions, radionuclides and organic pollutants [3–5]. Application of HS in pharmacology and veterinary medicine has been also intensively studied [6]. Nevertheless, while the primary composition of humic acids is near to be completely elucidated, more information about the physical structure and aggregation mechanisms of HS is still needed to be gained. Consequently, HS as a whole system or its specific fractions can be separated and utilized in industry, agriculture, medicine and other sectors. It is clear, that the nature of supramolecular structure, the character and distribution of humic aggregates would be strongly affected by the interaction WSEAS TRANSACTIONS on ENVIRONMENT and DEVELOPMENT Jiri Kucerik, Martin Drastik, Oldrich Zmeskal, Anna Ctvrtnickova ISSN: 1790-5079 705 Issue 11, Volume 5, November 2009
Transcript of Ultrasonic spectroscopy and fractal analysis in the study ... · Ultrasonic spectroscopy and...

Ultrasonic spectroscopy and fractal analysis in the study on progressive aggregation of humic substances in diluted solutions
JIŘÍ KUČERÍK, MARTIN DRASTÍK, OLDŘICH ZMEŠKAL, ANNA ČTVRTNÍČKOVÁ
Institute of Applied and Physical Chemistry, Faculty of Chemistry Brno University of Technology
Purkyňova 118, Brno CZECH REPUBLIC
[email protected] http://www.fch.vutbr.cz/home/kucerik
Abstract: High resolution ultrasonic spectroscopy was used to study progressive aggregation and structural changes in diluted aquatic solutions of humic substances over the concentration range from 0.001 g/L to 3 g/L. For this purpose, both sodium salts (fulvates) and protonized forms of fulvic acids and sodium salts of humic acids (humates) were used; the origin of humic substances covered wide range of sources. Obtained results confirmed previously published statement about the progressive aggregation of humic substances in diluted solutions. The method allowing the treatment of obtained data by fractal analysis was developed and tested. Determined dependency of fractal dimension on concentration revealed clear differences in mechanisms of aggregation of individual humic and fulvic samples. In fact the value of fractal dimension 2.5 was determined for the concentration 3g/L; diluting the solution caused increasing in fractal dimension value up to 3 for concentrations around 0.01 g/L. The increase was not the same for all samples, in fact the most significant fluctuation in this concentration range was observed for fulvic acids. It was found out that despite the prevalence of hydrophobic forces in stabilization of humic substances in diluted solutions, also the nature of the counterion represents one of the crucial factors playing role in conformation and stability of humates and fulvates. In accordance with previous observations based on the measurement of lignite humates, also humates, fulvates and fulvic acids originating from various sources showed the change in their aggregates properties around the concentration 1 g/L. Key-Words: Humic and fulvic acids, aggregation, IHSS, ultrasonic spectroscopy, fractal analysis. 1 Introduction Humic substances (HS) are the most abundant group of organic compounds on the Earth but their chemistry is still not perfectly understood. Frequently, they are described as yellow to black mixture of organic compounds rich in oxygen-containing functional groups (carboxyl group -COOH; phenolic and alcoholic -OH group; ketonic and quinoic -C=O group) which are bound on both aromatic and aliphatic carbon structures. HS are traditionally divided into three groups according to their solubility under acidic or alkaline conditions: humin, the insoluble fraction; humic acids (HA), the fraction soluble under alkaline conditions and fulvic acids (FA), the fraction soluble under all pH conditions.
In HS supramolecular structure there can be found remnants (e.g. lipids, saccharides, aliphatic chains, aromatic cycles, (poly)phenols, etc.) originating from miscellaneous debris. Such heterogeneity gives rise to unique and broad functions which HS play in natural systems. By general consent, HS are considered to be the crucial factor that may help to restrict deserts broadening as well as to decrease the greenhouse gases level. In soils they help to prevent drying and shrinking,
improve moisture retaining properties, permit exchange of gases, stabilize structure, enhance availability of micronutrients to higher plants and increase the cation exchange capacity [1]. They exhibit hormone-like activity, especially the low-dimension aggregates and potentially polar compounds present in humic matter; those biological properties are frequently compared with hormonal activity of gibberellins or auxins [1]. Industrial utilization of HS or of their separated fraction is thought to have a great potential. For example, HA can be employed as surfactants in the soil washing of sites contaminated by metal ions, radionuclides and organic pollutants [3–5]. Application of HS in pharmacology and veterinary medicine has been also intensively studied [6]. Nevertheless, while the primary composition of humic acids is near to be completely elucidated, more information about the physical structure and aggregation mechanisms of HS is still needed to be gained. Consequently, HS as a whole system or its specific fractions can be separated and utilized in industry, agriculture, medicine and other sectors. It is clear, that the nature of supramolecular structure, the character and distribution of humic aggregates would be strongly affected by the interaction
WSEAS TRANSACTIONS on ENVIRONMENT and DEVELOPMENTJiri Kucerik, Martin Drastik, Oldrich Zmeskal, Anna Ctvrtnickova
ISSN: 1790-5079 705 Issue 11, Volume 5, November 2009

of humic molecules with water since the hydrophobic effect is thought to be a key factor in the processes of the supramolecular structure formation [7].
The amphiphilic character of HS evoked the hypothesis about their tendency to form the bilayers similar to biological membranes and micelles [8]. As early as in 1986 it was demonstrated that humic substances form so-called premicellar aggregates which were thought to be a principal reason of their solubilization capacity in diluted solutions. Despite the fact that the existence of submicellar aggregates was later confirmed again for instance by Engebretson and von Wandruszka [9] or by Rizzi et al. [10], this concept was rather overlooked by other researchers. Instead, the critical micelle concentration (CMC) i.e. concentration below which no interaction among molecules occurs and vice versa at which the micellization starts, was reported quite frequently. Typical reported CMC was in the wide range 1–10 g/L [11]. The progress in sensitivity and resolution of analytical instruments brought about the new challenges [12] and potential to solve these contradictions. High resolution ultrasonic spectroscopy (HRUS) was recently introduced to the market and become a powerful tool for both scientific and industrial purposes [13–15]. The basic principle of HRUS is determination of ultrasonic velocity in liquid sample with resolution down to ±0.2 mm/s. Analysis provides information on the interaction of the ultrasonic waves with the sample’s interior, thus enabling determination of its physical and chemical properties. Applications of HRUS [16] include structural analysis and particle sizing [17], detection and analysis of chemical reactions [15], thermal analysis and phase transitions [18], analysis of the quality of liquids, detection and analysis of conformational changes in polymers and biopolymers [19], micellization [20], ligand–polymer binding [21] and antigen–antibody interaction, hydration [22], aggregation and gelation [23] and composition analysis [14].
Recently, that technique was used also to study aggregation of lignite and soil sodium humates in diluted solutions. Obtained results revealed the progressive aggregation of humic molecules at concentration as low as 0.001 g/L [24]. Similar results were obtained also at elevated pH and at high ionic strength. Further, using temperature programmed monitoring of ultrasonic velocity, strong differences among sodium salts of humic acids (humates) solutions within the concentration range from 0.005 to 10 g/L were revealed. It was found that at higher concentrations (approximately above 1 g/L) the surface of aggregates is mostly hydrophilic and aggregates are stabilized predominantly by H-bonds but at lower concentrations the hydrophobic hydration
prevails and less stable hydrophobic interactions play a crucial role in stabilization [25].
This work follows those results obtained using HRUS. First task of this study is to reveal if the aggregation observed earlier is a general phenomenon for humic acids extracted from various sources and if there is any difference in their aggregation in comparison with FA. Further, the attempt was made to better understand to mechanism of aggregation and to disclose possible relations between aggregation of HS (physical structure) and composition (primary structure). 2 Experimental 2.1 Humic and fulvic samples HS standards were purchased from IHSS (International Humic Substances Society, web page http://ihss.gatech.edu/ihss2), titrated to pH 7.2 with 0.1M NaOH in automatic titrator to obtain sodium salt of humic (NaHA) or fulvic (NaFA) acids [25]. After reaching constant pH value 7.2, sample was kept stirred for next 60 minutes and freeze-dried. Obtained product was milled in an agate mortar and stored at room temperature in a sealed container. The non-titrated samples of FA were used as received. In addition, for demonstration of HRUS application potential, the commercial oligomeric surfactant Triton® X-100 was used as a standard compound exhibiting critical micelle concentration. It was purchased from Sigma Aldrich, the stock solution was prepared and used in the same way as humic a fulvic solutions. 2.2 High Resolution Ultrasonic Spectroscopy To monitor ultrasonic velocity, High Resolution Ultrasonic Spectroscopy HRUS 102 device (Ultrasonic-Scientific, Dublin, Ireland) was employed. HRUS consists of two independent quartz cells in which the velocity of ultrasonic wave propagation is measured. Whole system is tempered by a water bath; cell 1 serves as a sample cell and cell 2 as a reference. All measurements were carried out at 25.00 ± 0.02°C and under constant stirring (600 rpm). The full range of ultrasound frequencies (2370, 5110, 5480, 7850, 8220, 11950, 12200 and 14690 kHz) were utilised for half of the samples and when no change of ultrasonic velocity on applied frequency occurred, for the rest only 3 frequencies (5480, 8220, and 12200 kHz) were used (for explanation see below). Samples were dissolved in MilliQ water to obtain stock solutions (1, 5 and 10 g/L). Both cells of HRUS were loaded up by 1 mL of deionised and degassed water. In the cell 1, using the Hamilton syringe, the solution of respective humate was added stepwise every 10 min (i.e., when constant values
WSEAS TRANSACTIONS on ENVIRONMENT and DEVELOPMENTJiri Kucerik, Martin Drastik, Oldrich Zmeskal, Anna Ctvrtnickova
ISSN: 1790-5079 706 Issue 11, Volume 5, November 2009
of ultrasound velocity were achieved and recorded) to reach desired concentrations from 0.001 to 3.5 g/L using appropriate combination of stock solutions. The ultrasonic velocity (U) was measured in both cells. For easier observation of potential interactions, the concentration increment of ultrasonic velocity (I) was determined using the relation published earlier and as in detail described in the recent work [24], i.e. I=(U-U0)/(U0mρ0) where U and U0 are the values of ultrasonic velocity in solution (cell 1) and pure solvent – water (cell 2) (the difference denoted as U12), respectively, m stands for the weight concentration of the solute and ρ0 is the density of the solvent (water). 3 Results and Discussion 3.1 Aggregation of humic substances from different sources The chemical character of the investigated samples is summarised in Table 1. Generally, the origin of humic substances used in this work covers wide range of sources.
The Suwannee River HS (2S101H/F) originates from the Okefenokee Swamp in south Georgia, U.S.A.. The Okefenokee Swamp contains extensive peat deposits. However, decomposing vegetation is believed to provide most of the dissolved organic carbon (DOC) to its waters. At its headwaters in the Okefenokee Swamp, the Suwannee River is a blackwater river, with DOC concentrations ranging from 25 to 75 mg/L and pH values of less than pH 4.0. Suwannee River FA contains the most aliphatic carbon and also the least of nitrogen of all IHSS standards, followed by Suwannee River HA.
The Elliott soil is typical of the fertile prairie soils of the Midwest of United States. The IHSS sample was obtained from an undisturbed area on the grounds of the Joliet Army Ammunition Plant near Joliet, Illinois, U.S.A. The Elliott series consists of very deep, somewhat poorly drained soils on moraines and till plains. They formed in as much as 50 cm of loess or silty material and silty clay loam glacial till.
Pahokee peat is a typical agricultural peat soil of the Florida Everglades (U.S.A.). The IHSS sample was obtained from the University of Florida Belle Glade Research Station. The Pahokee series consists of very poorly drained soils that are 90 to 130 cm thick over limestone. Pahokee soils formed in organic deposits of freshwater marshes.
Leonardite humic acid (1S104H-5) was produced by the natural oxidation of exposed lignite and originates from North Dakota, U.S.A.. Lignite is the best source of HA since the content is more than 85 % which is the highest of any natural source. Furthermore, lignite is a plentiful and inexpensive compared to other possible
humic acid sources. Leonardite HA is the most aromatic IHSS standard since it contains more than four times more of aromatic than aliphatic carbon. The amount of carbon in carboxylic groups is very low which corresponds to high aromaticity (adopted from IHSS web page http://ihss.gatech.edu/ihss2).
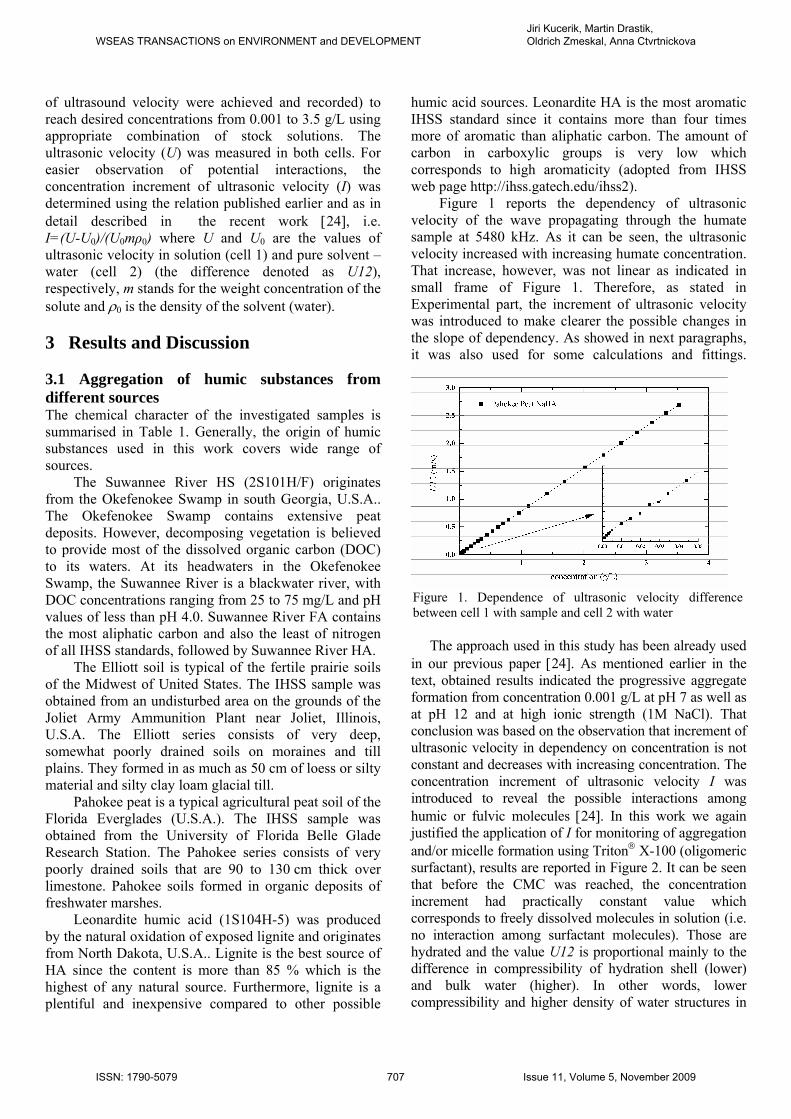
Figure 1 reports the dependency of ultrasonic velocity of the wave propagating through the humate sample at 5480 kHz. As it can be seen, the ultrasonic velocity increased with increasing humate concentration. That increase, however, was not linear as indicated in small frame of Figure 1. Therefore, as stated in Experimental part, the increment of ultrasonic velocity was introduced to make clearer the possible changes in the slope of dependency. As showed in next paragraphs, it was also used for some calculations and fittings.
Figure 1. Dependence of ultrasonic velocity difference between cell 1 with sample and cell 2 with water
The approach used in this study has been already used
in our previous paper [24]. As mentioned earlier in the text, obtained results indicated the progressive aggregate formation from concentration 0.001 g/L at pH 7 as well as at pH 12 and at high ionic strength (1M NaCl). That conclusion was based on the observation that increment of ultrasonic velocity in dependency on concentration is not constant and decreases with increasing concentration. The concentration increment of ultrasonic velocity I was introduced to reveal the possible interactions among humic or fulvic molecules [24]. In this work we again justified the application of I for monitoring of aggregation and/or micelle formation using Triton® X-100 (oligomeric surfactant), results are reported in Figure 2. It can be seen that before the CMC was reached, the concentration increment had practically constant value which corresponds to freely dissolved molecules in solution (i.e. no interaction among surfactant molecules). Those are hydrated and the value U12 is proportional mainly to the difference in compressibility of hydration shell (lower) and bulk water (higher). In other words, lower compressibility and higher density of water structures in
WSEAS TRANSACTIONS on ENVIRONMENT and DEVELOPMENTJiri Kucerik, Martin Drastik, Oldrich Zmeskal, Anna Ctvrtnickova
ISSN: 1790-5079 707 Issue 11, Volume 5, November 2009
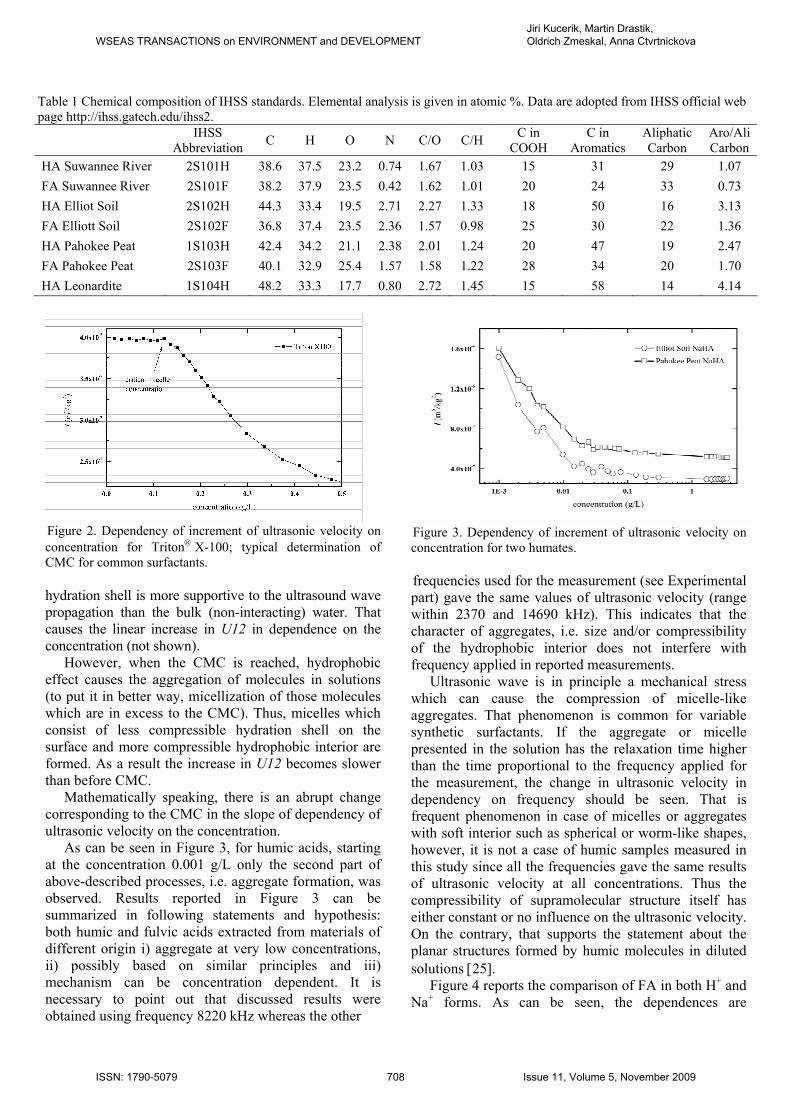
Table 1 Chemical composition of IHSS standards. Elemental analysis is given in atomic %. Data are adopted from IHSS official web page http://ihss.gatech.edu/ihss2.
IHSS Abbreviation C H O N C/O C/H C in
COOH C in
Aromatics Aliphatic Carbon
Aro/Ali Carbon
HA Suwannee River 2S101H 38.6 37.5 23.2 0.74 1.67 1.03 15 31 29 1.07 FA Suwannee River 2S101F 38.2 37.9 23.5 0.42 1.62 1.01 20 24 33 0.73 HA Elliot Soil 2S102H 44.3 33.4 19.5 2.71 2.27 1.33 18 50 16 3.13 FA Elliott Soil 2S102F 36.8 37.4 23.5 2.36 1.57 0.98 25 30 22 1.36 HA Pahokee Peat 1S103H 42.4 34.2 21.1 2.38 2.01 1.24 20 47 19 2.47 FA Pahokee Peat 2S103F 40.1 32.9 25.4 1.57 1.58 1.22 28 34 20 1.70 HA Leonardite 1S104H 48.2 33.3 17.7 0.80 2.72 1.45 15 58 14 4.14
Figure 2. Dependency of increment of ultrasonic velocity on concentration for Triton® X-100; typical determination of CMC for common surfactants. hydration shell is more supportive to the ultrasound wave propagation than the bulk (non-interacting) water. That causes the linear increase in U12 in dependence on the concentration (not shown).
However, when the CMC is reached, hydrophobic effect causes the aggregation of molecules in solutions (to put it in better way, micellization of those molecules which are in excess to the CMC). Thus, micelles which consist of less compressible hydration shell on the surface and more compressible hydrophobic interior are formed. As a result the increase in U12 becomes slower than before CMC.
Mathematically speaking, there is an abrupt change corresponding to the CMC in the slope of dependency of ultrasonic velocity on the concentration.
As can be seen in Figure 3, for humic acids, starting at the concentration 0.001 g/L only the second part of above-described processes, i.e. aggregate formation, was observed. Results reported in Figure 3 can be summarized in following statements and hypothesis: both humic and fulvic acids extracted from materials of different origin i) aggregate at very low concentrations, ii) possibly based on similar principles and iii) mechanism can be concentration dependent. It is necessary to point out that discussed results were obtained using frequency 8220 kHz whereas the other
Figure 3. Dependency of increment of ultrasonic velocity on concentration for two humates. frequencies used for the measurement (see Experimental part) gave the same values of ultrasonic velocity (range within 2370 and 14690 kHz). This indicates that the character of aggregates, i.e. size and/or compressibility of the hydrophobic interior does not interfere with frequency applied in reported measurements.
Ultrasonic wave is in principle a mechanical stress which can cause the compression of micelle-like aggregates. That phenomenon is common for variable synthetic surfactants. If the aggregate or micelle presented in the solution has the relaxation time higher than the time proportional to the frequency applied for the measurement, the change in ultrasonic velocity in dependency on frequency should be seen. That is frequent phenomenon in case of micelles or aggregates with soft interior such as spherical or worm-like shapes, however, it is not a case of humic samples measured in this study since all the frequencies gave the same results of ultrasonic velocity at all concentrations. Thus the compressibility of supramolecular structure itself has either constant or no influence on the ultrasonic velocity. On the contrary, that supports the statement about the planar structures formed by humic molecules in diluted solutions [25].
Figure 4 reports the comparison of FA in both H+ and Na+ forms. As can be seen, the dependences are
WSEAS TRANSACTIONS on ENVIRONMENT and DEVELOPMENTJiri Kucerik, Martin Drastik, Oldrich Zmeskal, Anna Ctvrtnickova
ISSN: 1790-5079 708 Issue 11, Volume 5, November 2009

relatively similar, the difference between both forms exists mainly at higher concentrations. The same results were obtained also for both H+ and Na+ fulvic acids originated from Elliott Soil and Pahokee Peat. Na+ form showed higher values of I while further dilution causes curves approximation. This is caused by the fact that solution containing Na+ form is more supportive to ultrasound propagation and thus the values of I parameter are higher than those of H+ form. Further, both forms (titrated and non-titrated) show the same shape of the curve, therefore one can assume that the observation on progressive aggregation of humic acids is relevant for fulvic acids in both forms as well. Fitting aspects of both curves, as depicted in Figure 4, are discussed in following paragraphs.
Figure 4. Dependency of increment of ultrasonic velocity on concentration for H+ and Na+ form of Suwannee river FA.
3.2 Aggregation mechanisms and their relationship to the composition of humic substances As demonstrated earlier, the parameter I extrapolated to zero concentration can be used as a measure of affinity of molecule to mutually interact and form aggregates [26]. The larger the value is, the higher affinity of molecules to form aggregates can be expected. In principle, it follows mathematical principle derived from the dependence of U12 on concentration. The highest deviation of dependency from zero at infinite dilution means higher affinity of molecules to form aggregates.
As it can be seen in Figures 3 and 4, there is a difference in the curvature of the dependency containing possible information on the aggregation nature and progress. Therefore, the attempt was made to find the best fitting equation which can be used to describe such processes. Figure 4 shows the best fitting of both dependences obtained using Equation (1).
cbxaxy
−
= (1) where y stands for concentration increment of
ultrasonic velocity (I in m6/kg2), x for sample concentration (in g/L) and a, b and c are adjustable parameters.
This function was chosen from a number of fitting functions as the best because it provided the lowest “Chi factor”. Obtained parameters a, b and c are summarized in Table 2.
It is clear that, from the mathematical point of view, Equation 1 cannot be used to extrapolate the data to zero concentration. This may suggest a possible aggregation even below the concentration 0.001 g/L or more likely the equation is valid only for a range of concentrations.
Table 2 Parameters obtained using Equation 1. Affix Na means sodium salt.
IHSS No. a* (107) b*(102) c*(10-2) 2S101HNa 2.97±0.07 – 4.26±0.55 24.8±1.8 2S101F 1.48±0.10 – 11.75±1.95 16.4±2.1 2S101FNa 2.94±0.06 – 4.11±0.63 27.6±2.4 2S102HNa 1.90±0.19 – 11.0±2.9 15.0±3.4 2S102F 1.15±0.09 – 28.5±4.10 7.0±2.2 2S102FNa 4.19±0.07 – 5.41±0.46 22.1±1.2 1S103HNa 2.87±0.03 – 5.87±0.28 23.7±0.6 2S103F 1.09±0.13 – 17.1±3.71 15.8±3.0 2S103FNa 2.52±0.09 – 5.91±1.00 20.9±2.4 1S104HNa 5.18±0.08 – 3.11±0.42 24.4±1.9
To shed light on the principles of aggregation of humic
substances in solution the relationship between parameters of Equation 1 and composition of HS was searched. Parameters a, b and c were correlated with elemental analysis and results of distribution of C in humic molecules as determined by solid state NMR using linear regression least square method; i.e. C, H, O, N, amount of carbon in carboxylic, aromatic and aliphatic groups and C/O, C/H and also aromatic to aliphatic carbon ratios (data taken from IHSS web site). For this correlations only Na+ forms of humic substances were used since H+ forms, as indicated in Figure 2, can slightly differ in aggregation principles at higher concentrations. Correlation analyses showed that NaHA Leonardite also behaved in a different manner. That was probably caused by very different origin and/or way of genesis of this sample in comparison with the rest. Obtained results are summarized in Table 3. It is necessary to point out that correlation analysis was done to see mainly the mutual relationship between correlated parameters, the reliability of trends and to observe differences between samples, therefore, the R2 correlation parameter is used as an indicator of coherence. It was found out that parameters obtained from the fitting correlate quite well with C content and C/H ratio (Table 3). Other humic composition characteristics did not show any remarkable R2 values. Greater correlations
WSEAS TRANSACTIONS on ENVIRONMENT and DEVELOPMENTJiri Kucerik, Martin Drastik, Oldrich Zmeskal, Anna Ctvrtnickova
ISSN: 1790-5079 709 Issue 11, Volume 5, November 2009
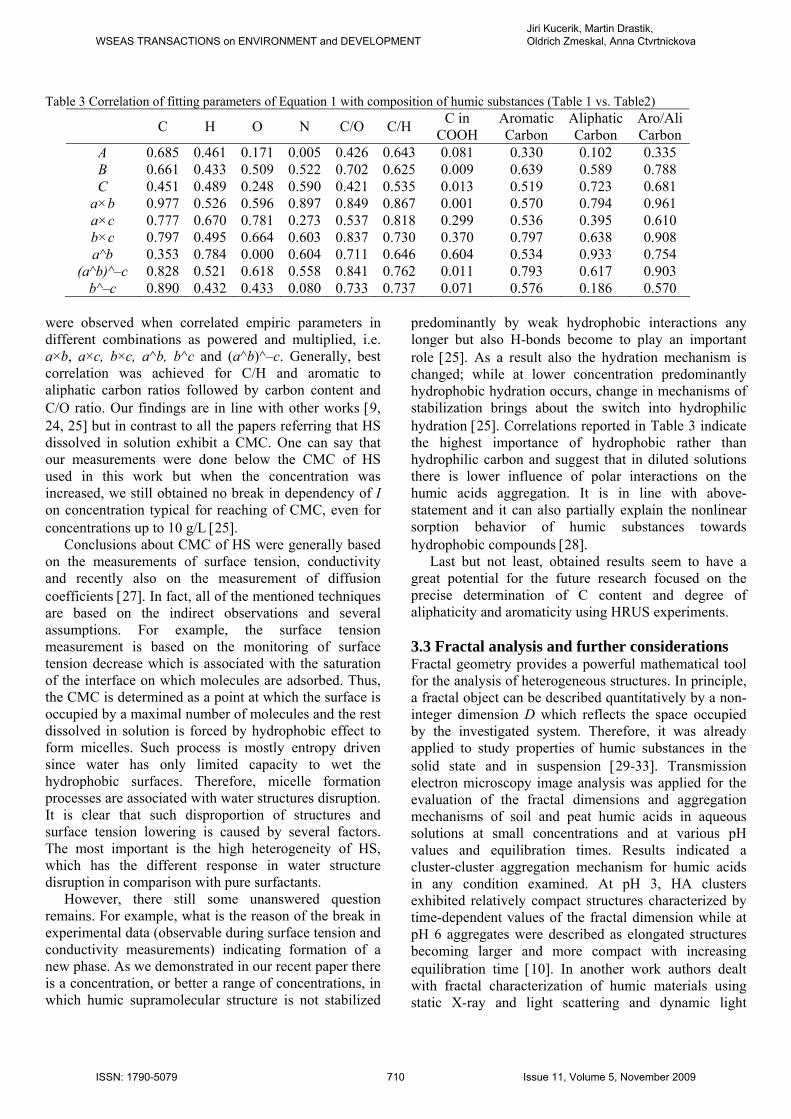
Table 3 Correlation of fitting parameters of Equation 1 with composition of humic substances (Table 1 vs. Table2)
C H O N C/O C/H C in COOH
Aromatic Carbon
Aliphatic Carbon
Aro/Ali Carbon
A 0.685 0.461 0.171 0.005 0.426 0.643 0.081 0.330 0.102 0.335 B 0.661 0.433 0.509 0.522 0.702 0.625 0.009 0.639 0.589 0.788 C 0.451 0.489 0.248 0.590 0.421 0.535 0.013 0.519 0.723 0.681
a×b 0.977 0.526 0.596 0.897 0.849 0.867 0.001 0.570 0.794 0.961 a×c 0.777 0.670 0.781 0.273 0.537 0.818 0.299 0.536 0.395 0.610 b×c 0.797 0.495 0.664 0.603 0.837 0.730 0.370 0.797 0.638 0.908 a^b 0.353 0.784 0.000 0.604 0.711 0.646 0.604 0.534 0.933 0.754
(a^b)^–c 0.828 0.521 0.618 0.558 0.841 0.762 0.011 0.793 0.617 0.903 b^–c 0.890 0.432 0.433 0.080 0.733 0.737 0.071 0.576 0.186 0.570
were observed when correlated empiric parameters in different combinations as powered and multiplied, i.e. a×b, a×c, b×c, a^b, b^c and (a^b)^–c. Generally, best correlation was achieved for C/H and aromatic to aliphatic carbon ratios followed by carbon content and C/O ratio. Our findings are in line with other works [9, 24, 25] but in contrast to all the papers referring that HS dissolved in solution exhibit a CMC. One can say that our measurements were done below the CMC of HS used in this work but when the concentration was increased, we still obtained no break in dependency of I on concentration typical for reaching of CMC, even for concentrations up to 10 g/L [25].
Conclusions about CMC of HS were generally based on the measurements of surface tension, conductivity and recently also on the measurement of diffusion coefficients [27]. In fact, all of the mentioned techniques are based on the indirect observations and several assumptions. For example, the surface tension measurement is based on the monitoring of surface tension decrease which is associated with the saturation of the interface on which molecules are adsorbed. Thus, the CMC is determined as a point at which the surface is occupied by a maximal number of molecules and the rest dissolved in solution is forced by hydrophobic effect to form micelles. Such process is mostly entropy driven since water has only limited capacity to wet the hydrophobic surfaces. Therefore, micelle formation processes are associated with water structures disruption. It is clear that such disproportion of structures and surface tension lowering is caused by several factors. The most important is the high heterogeneity of HS, which has the different response in water structure disruption in comparison with pure surfactants.
However, there still some unanswered question remains. For example, what is the reason of the break in experimental data (observable during surface tension and conductivity measurements) indicating formation of a new phase. As we demonstrated in our recent paper there is a concentration, or better a range of concentrations, in which humic supramolecular structure is not stabilized
predominantly by weak hydrophobic interactions any longer but also H-bonds become to play an important role [25]. As a result also the hydration mechanism is changed; while at lower concentration predominantly hydrophobic hydration occurs, change in mechanisms of stabilization brings about the switch into hydrophilic hydration [25]. Correlations reported in Table 3 indicate the highest importance of hydrophobic rather than hydrophilic carbon and suggest that in diluted solutions there is lower influence of polar interactions on the humic acids aggregation. It is in line with above-statement and it can also partially explain the nonlinear sorption behavior of humic substances towards hydrophobic compounds [28].
Last but not least, obtained results seem to have a great potential for the future research focused on the precise determination of C content and degree of aliphaticity and aromaticity using HRUS experiments.
3.3 Fractal analysis and further considerations Fractal geometry provides a powerful mathematical tool for the analysis of heterogeneous structures. In principle, a fractal object can be described quantitatively by a non-integer dimension D which reflects the space occupied by the investigated system. Therefore, it was already applied to study properties of humic substances in the solid state and in suspension [29-33]. Transmission electron microscopy image analysis was applied for the evaluation of the fractal dimensions and aggregation mechanisms of soil and peat humic acids in aqueous solutions at small concentrations and at various pH values and equilibration times. Results indicated a cluster-cluster aggregation mechanism for humic acids in any condition examined. At pH 3, HA clusters exhibited relatively compact structures characterized by time-dependent values of the fractal dimension while at pH 6 aggregates were described as elongated structures becoming larger and more compact with increasing equilibration time [10]. In another work authors dealt with fractal characterization of humic materials using static X-ray and light scattering and dynamic light
WSEAS TRANSACTIONS on ENVIRONMENT and DEVELOPMENTJiri Kucerik, Martin Drastik, Oldrich Zmeskal, Anna Ctvrtnickova
ISSN: 1790-5079 710 Issue 11, Volume 5, November 2009
scattering experiments. It was stated that over the length scales studied, humic materials are surface fractals in the solid state, and mass fractals in solution. The longer characterization length scales suggested that at longer characterization length scales humic acid was not fractal, at least not under the solution conditions employed in experiments. In addition application of fractal analysis to the characterization of the surface morphology of soil and peat humin samples, the calculation of the hydrodynamic radius of humic acid particles, and the study of humic acid aggregation was discussed [31].
Senesi et al., [32] combined turbidimetry and scanning electron microscopy to study the fractal dimensions of soil and peat humic acids equilibrated for various lengths of time in aqueous suspension at different pH values. It was stated that humics are either of a nonfractal or a mass fractal nature. The passage from one regime to another depends on the pH and equilibration time. With an increase of one of those factors, the mass fractal dimension of humic acids decreased from about 2.8 to values close to 1.0. This trend, suggested that nature of humic particles in suspension change from compact, almost space-filled structures with smooth surfaces, to less compact, fragmented and elongated structures having increasingly rough and irregular surfaces as the pH or time increases. Values of the mass fractal dimension close to 2.5 were suggested to reflect the diffusion-limited aggregation (DLA), whereas lower values close to 2.1 would imply a reaction-limited cluster-cluster (RLA) aggregation model [32]. In a similar study [33] the attempt was paid to relate the fractal dimension to the morphological features and types of aggregation process in aqueous suspensions under various conditions. The power-law dependence of the turbidity on the wavelength showed that i) at pH lower than or equal to 5 in the salt-free solution, only one soil HA showed mass fractal nature, peat humic acid showed surface fractal nature, ii) at pH 6 and greater in the absence of salt, and at all pH in the presence of NaCl, some humic acids exhibited mass fractal nature, iii) in systems where the ionic strength was adjusted by the addition of CaCl2, soil HA showed a mass fractal regime, whereas the rest showed a surface fractal regime, at all pH values. A non-fractal response reflected the existence of HA particles being compact, space-filled smooth surface structures; surface fractal regime implied compact structures with corrugated surfaces; and mass fractal structure with decreasing dimension implied increasingly porous, fragmented, and elongated structures with increasingly rougher surfaces. Low values of the mass fractal dimension occurred at near neutral pH and indicated that the aggregation process for humic acid particles can be attributed to the cluster-cluster reaction-limited aggregation (RLA) model. Great values of the mass fractal dimension measured at low pH
values suggested the occurrence of extended restructuring and/or reconformation of humic acid macromolecules with an underlying the DLA model [33].
In this work as a probe the ultrasonic velocity propagation was used. The sound energy density w is an adequate measure to describe the sound field at a given point as a sound energy value. The formula for sound energy density of sound waves propagating through the medium is , where v is sound velocity in the solvent and ρ is mass density of the solvent. This mass density has generally fractal distribution. In papers [
2vρw =
1, 1] the density of fractal physical quantity in E–dimensional Euclidean space E
)(rFn (E = n) was defined.
Accordingly, for the density of media )(rρ (kg.m−E) one can write [36]
ED
ρρ rKkrFkrρ −== )()( (2) where kρ is constant (elementary mass, kg), r is the
radius of elementary quantity, K the fractal measure (in m−D) and D is the fractal dimension. It is clear that in homogeneous medium ( ED = ) the mass density is constant, while for the fractal distribution of mass ( 3,2 =≤<− EEDE , in 3–dimensional space), the mass density decreases with the distance from the source by (D–3) power. For radial concentration field (in E–dimensional space) one can write the dependence of potential (proportional to quadrate of velocity) on radius using [13]
)2()()(
22
+−⋅==
+−
EDDrKkrvrV
ED
V (3)
where kV is constant in mEs–2. This equation simply
says that in the space with constant density of mass (i.e. for
)(rρED = ) the quadrate of velocity increases with
second power of r. In the case of fractal distribution of mass density (i.e. for 3,2 =≤<− EEDE , in 3–dimensional space) the square of velocity (potential) decreases with the distance by (D–1) power. From the mass density (2) and from the quadrate of velocity (3) the density of energy (in J.m−E) can be determined as follows
)2()()()(
)1(222
+−==
+−
EDDrKkkrvrρrw
ED
Vρ (4)
Finally it can be obtained the dependence of velocity of
sound in continuum on density of media with fractal structure
WSEAS TRANSACTIONS on ENVIRONMENT and DEVELOPMENTJiri Kucerik, Martin Drastik, Oldrich Zmeskal, Anna Ctvrtnickova
ISSN: 1790-5079 711 Issue 11, Volume 5, November 2009

)(22
)2(
EDED
ρ
V
Kkρ
EDDKkv
−+−
⎟⎟⎠
⎞⎜⎜⎝
⎛
+−= (5)
Let’s first consider the properties of mass transfer in
the three–dimensional space (E = 3) just for the fractal dimensions ( 3,1∈D of concentration. In this case, the velocity (5) can be re-written using equation
)3(21
)1(
−−
⎟⎟⎠
⎞⎜⎜⎝
⎛
−=
DD
ρ
V
Kkρ
DDKkv (6)
Since in experiments reported here and 0UUv −=
cρ kckρρrF =−= )()( 0 (see (2)), where U is the speed of sound in media with mass density and concentration of humate in water c(r) and where U
)(rρ0 is
speed of sound in pure water with mass density we can write analogically
)(0 rρ
)3(21
00 )1(
−−
⎟⎟⎠
⎞⎜⎜⎝
⎛ −−
=−DD
ρ
V
Kkρρ
DDKkUU (7)
In fact, it is a sound velocity related to the system
associated with sound waving in pure solvent. Sound propagation depends on the density of the hydration shell of dissolved humates, i.e. increases with concentration. Thus, D is in this case fractal dimension of humate aggegates in water. Accordingly, Equation (7) can be rewritten as follows:
)3(21
0 )1(
−−
⎟⎟⎠
⎞⎜⎜⎝
⎛−
=−DD
c
V
Kkc
DDKkUU (8)
Where (ρ-ρ0)/kρ=c/kc. Figure 5 reports the normalized dependence of sound
velocity of humates together with respective coefficients A (velocity for unit concentration) and the slope a. Both coefficients depend on the fractal dimension D.
Equation (8) can formally written as while D≈(6a-1)/(2a-1). Assuming that fractal dimension D is constant, for it is possible to determine the ratio
aAcUU =− 0
1=Kkc
cV kk , i.e. kv/kc=D(D-1)A2. All the dependences indicate that this approach is useful for concentration above 0.03g/L. The meaning of D is a “measure of changes” and reveals the possible mechanisms of
aggregation. Around 1 g/L it seems that the constant value D≈2.5 is reached. That suggests the switch in mechanisms of aggregation similarly as in ref. [25]. Here 150=cV kk which shows the relationship between elemental quantity of ultrasonic velocity kV (3) and elemental quantity of concentration kc or kρ in (2).
Figure 5. Dependence of coefficients D (fractal dimension), slope a and kv/kc on the concentration for Elliot soil FA, Na+ form. Equation (2) can be used for the determination of entropy S [37-39] obtaining Equation (9)
Kkρk
DEDrkDS
ρBB lnln
−=−= (9)
Accordingly, taking into account that (ρ-ρ0)/kρ=c/kc the thermodynamic entropy can be expressed as
ckD
DrkDS BB ln3
ln−
=−= (10)
where kB is Boltzman constant.
Figure 6 reports the comparison of fractal dimensions
among fulvic acid, sodium fulvate and sodium humate. Dependency clearly shows that the introduction of Na+ ion into the fulvic structure significantly changes the aggregation profile of the sample. While at higher concentration is the D profile relatively stable and fluctuates only slightly, the dilution brings about significant changes mainly in case of H+ form. In contrast, the fractal dimension in Na+ fulvate solution slowly increases with only weak fluctuation. It seems that the presence of the cation causes stabilization of the structure and steady formation of the structure. That explanation seems not be valid for humic acids, however, in this case the overall polarity of the system is lower as suggested by data in Table 1. We hypothesise that the H+ in fulvic acids is not capable to compensate
WSEAS TRANSACTIONS on ENVIRONMENT and DEVELOPMENTJiri Kucerik, Martin Drastik, Oldrich Zmeskal, Anna Ctvrtnickova
ISSN: 1790-5079 712 Issue 11, Volume 5, November 2009

the mutual repulsion of polar groups such as mainly deprotonized carboxylic groups. Therefore, with increasing concentration the weak interactions stabilizing system must constantly change their geometry and consequently the conformation of whole supramolecular system. In our previous work we stated that in diluted systems humic substances are stabilized mainly by hydrophobic interactions. It is well known that those interactions are strongly dependent on their mutual orientation. In contrast, the interaction of cation with other moieties can be seen as a charge interaction which has no orientation demand. As a result the stabilization of the system is more efficient by Na+ than by small H+.
Figure 6. Comparison of fractal dimensions of Na+ salts of Elliot soil humic acids and fulvic acids and H+ form of fulvic acids. 4 Conclusions and future perspectives This study confirmed the recent statement about the progressive aggregation of humic substances in diluted solutions. Results showed that despite their higher polarity, fulvic acids aggregate similarly as humic acids (humates). One of the most important parameters for aggregation and resulting nature of supramolecular structure in solution was found the properties of the counterion. The Na+ can sufficiently stabilize the structure by the compensation of carboxylic group repulsions. Our results published here question the artificial subdivision of humic substances according to their solubility and give a hint on the possible mechanism of solubilization and transport of organic compounds by means of interaction with fulvic acids. Fractal analysis confirmed a promising potential for elucidation of complex mechanisms of humic substances aggregation. To our knowledge, there was not reported yet a method allowing experimental and theoretical evaluation of data in such wide range of concentrations and possibly under such a number of variable conditions
(temperature, ionic strength etc.) as we demonstrated here. Nevertheless, several issues are still to be clarified and developed. Acknowledgement The financial support of the Ministry of Education of the Czech Republic, project MSM 0021630501 and Czech Grant Agency project number GA 104/08/0990 are acknowledged. References [1] Stevenson F. J. Humus Chemistry: Genesis, Composition, Reactions, 2nd ed., Wiley, New York, 1994. [2] Nardi S., Panuccio M. R., Abenavoli M. R., Muscolo A. Auxin-like effect of humic substances extracted from faeces of Allolobophora caliginosa and A. rosea. Soil Biology and Biochemistry, Vol. 26, 1994, pp. 1341–1346. [3] Conte P., Agretto A., Spaccini R., Piccolo A. Soil Remediation: humic acids as natural surfactants in the washings of highly contaminated soils. Environmental Pollution, Vol. 135, 2005, pp 515–522. [4] Schenato F., Schröder N. T., Martins F. B. Assessment of contaminated soils by heavy metals in municipal solid waste landfills in southern Brazil. WSEAS Transactions on Environment and Development. Vol. 4, 2008, pp 745–755. [5] Skodras G., Natas P., Grammelis P., Sakellaropoulos G. P. Effect of pyrolysis temperature and residence time on the removal of pollutants from poor quality coals and wastes. WSEAS Transactions on Environment and Development, Vol. 2, 2006, pp. 747–754. [6] Klöcking R., Helbig B., Medical aspects of application of humic substances. In: Biopolymers for medical and pharmaceutical applications. Wiley Verlag, 2005. [7] Piccolo A. The supramolecular structure of humic substances. Soil Science, Vol. 166, 2001, pp. 810–832. [8] Wershaw, R. L. A new model for humic materials and their interactions with hydrophobic chemicals in soil –water and sediment – water systems. Journal of Contaminant Hydrology, Vol. 1, 1986, pp 29–45. [9] Engebretson R. R., von Wandruszka R. Micro- organization of dissolved humic acids. Environmental Science and Technology, Vol. 28, 1994, pp. 1934–1941. [10] Rizzi F. R., Stoll S., Senesi N., Buffle J. A transmission electron microscopy study of the fractal properties and aggregation processes of humic acids. Soil Science, Vol. 169, 2004, pp 765–775. [11] Hayase K., Tsubota H., Sedimentary humic and fulvic acid as surface active substances. Geochimica et
WSEAS TRANSACTIONS on ENVIRONMENT and DEVELOPMENTJiri Kucerik, Martin Drastik, Oldrich Zmeskal, Anna Ctvrtnickova
ISSN: 1790-5079 713 Issue 11, Volume 5, November 2009

Cosmochimica Acta, Vol. 47, 1983, pp. 947–952. [12] Machalikova J., Chylkova J., Obrsalova I., Selesovska R. Advanced instrumental analytical methods and their application for sustainable transport. WSEAS Transactions on Environment and Development, Vol 2, 2006, pp. 1390–1395. [13] Buckin V., Kudryashov E., Morrissey S. High resolution ultrasonic spectroscopy for analysis in biocolloids. International Labmate, Vol. 27, 2002, pp. 23–24. [14] Buckin V., O’Driscoll B., Smyth C., Alting A. C., Visschers R. W. Ultrasonic spectroscopy for material analysis. Recent advances. Spectroscopy Europe, Vol. 15, 2003, pp. 20–25. [15] Kudryashov E., Smyth C., O’Driscoll B., Buckin V. High-resolution ultrasonic spectroscopy: for analysis of chemical reactions in real time. Spectroscopy, Vol. 18, 2003, pp. 26–32. [16] Buckin, V. Ultrasonic analyser. European Patent Application EP 455184. 2004. [17] Alba F., Crawley G. M., Fatkin J., Higgs D. M. J., Kippax P. G. Acoustic spectroscopy as a technique for the particle sizing of high concentration colloids, emulsions and suspensions. Colloids and Surfaces A, Vol. 153, 1999, pp. 495–502. [18] Smyth C., Dawson K., Buckin V. Ultrasonic analysis of heat-induced coagulation in calcium fortified milk. Progress in Colloid and Polymer Science, Vol. 112, 1999, pp. 221–226. [19] Kharakoz D. P., Sarvazyan A. P. Hydrational and intrinsic compressibilities of globular proteins. Biopolymers, Vol. 33, 1993, pp. 11–26. [20] Buckin V., Kudryashov E., Morrissey S., Kapustina T., Dawson K. Do surfactants form micelles on the surface of DNA? Progress in Colloid Polymer Science, Vol. 110, 1998, pp. 214–219. [21] Kankia B. I., Funck T., Uedaira H., Buckin V. Volume and compressibility effects in the formation of metal-EDTA complexes. Journal of Solution Chemistry, Vol. 26, 1997, pp. 877–888. [22] Buckin V., Tran H., Morozov V., Marky L. A. Hydration effects accompanying the substitution of counterions in the ionic atmosphere of Poly(rA)·Poly(rU) and Poly(rA)·2Poly(rU) helices. Journal of the American Chemical Society, Vol. 118, 1996, pp. 7033–7039. [23] Kudryashov E., Smith C., Duffy G., Buckin V. Ultrasonic high-resolution longitudinal and shear wave measurements in food colloids: monitoring of gelation processes and detection of pathogens. Progress in Colloid and Polymer Science, Vol. 115, 2000, pp. 287–294. [24] Kučerík J., Šmejkalová D., Čechlovská H., Pekař M. New insights into conformational behaviour of humic substances: Application of high resolution ultrasonic
spectroscopy. Organic Geochemistry, Vol. 38, 2007, pp. 2098–2110. [25] Kučerík J., Čechlovská H., Bursáková P., Pekař M. Lignite humic acids aggregates studied by high resolution ultrasonic spectroscopy. Thermodynamic stability and molecular feature. Journal of Thermal Analysis and Calorimetry, Vol. 96, 2009, pp 637–643. [26] Buckin V., Kudryashov E., Morrissey, S., Kapustina T., Dawson K. Do surfactants form micelles on the surface of DNA? Progress in Colloid Polymer Science, Vol. 110, 1998, pp. 214–219. [27] Quagliotto P., Montoneri E., Tambone F., Adani F., Gobetto R., Viscardi G. Chemicals from wastes: Compost-derived humic acid-like matter as surfactant. Environmental Science and Technology, Vol. 40, 2006, pp. 1686–1692. [28] Graber E. R., Borisover M. D. Evaluation of glassy/rubbery model for soil organic matter. Environmental Science and Technology. Vol. 32, 1998, pp. 3286-3292. [29] Österberg R., Mortensen K. Fractal dimension of humic acids. A small angle neutorn scattering study. European Biophysics Journal, Vol. 21, 1992, pp. 163–167. [30] Rice J., Lin J. S. Fractal nature of humic materials. Environmental Science and Technology, Vol. 27, 1993, pp. 413–414. [31] Mumby P. J., Harborne A. R., Rice J. A., Tombacz E., Malekani K. Application of light and X-ray scattering to characterize the fractal properties of soil organic matter. Geoderma. Vol. 88, 1999, pp. 251-264. [32] Senesi N., Rizzi F. R., Dellino P., Acquafredda P. Fractal dimension of humic acids in aqueous suspension as a function of pH and time. Soil Science Society of America journal. Vol. 60, 1996, pp. 1773–1780. [33] Senesi N., Rizzi F. R., Dellino P., Acquafredda P. Fractal humic acids in aqueous suspensions at various concentrations, ionic strengths, and pH values. Colloids and Surfaces A: Physicochemical and Engineering Aspects, Vol. 127, 1997, pp. 57–68. [34] Zmeškal O., Nežádal M., Buchníček M. Fractal-Cantorian Geometry, Hausdorff dimension and the fundamenal laws of physics. Chaos, Solitons & Fractals, Vol. 17, 2003, pp. 113–119. [35] Zmeškal O., Nežádal M., Buchníček M. Field and potential of fractal-Cantorian structures and El Naschie's infinite theory. Chaos, Solitons & Fractals, Vol 19, 2004, pp. 1013–1022. [36] Zmeškal O., Buchníček M., Vala M. Thermal properties of bodies in fractal and Cantorian physics. Chaos, Solitons & Fractals, Vol. 25, 2005, pp. 941–954. [37] Grassberger P., Procaccia I. Characterization of Strange Attractors. Physical Review Letters, Vol. 50, 1983, pp. 346–349.
WSEAS TRANSACTIONS on ENVIRONMENT and DEVELOPMENTJiri Kucerik, Martin Drastik, Oldrich Zmeskal, Anna Ctvrtnickova
ISSN: 1790-5079 714 Issue 11, Volume 5, November 2009

[38] Grassberger P., Procaccia I. Estimation of the Kolmogorov entropy from a chaotic signal. Physical Review Letters. A, Vol. 28, 1983, pp. 2591–2593. [39] Grassberger P. Generalized Dimensions of Strange Attractors. Physics Letters A, Vol. 97, 1983, pp. 227–230.
WSEAS TRANSACTIONS on ENVIRONMENT and DEVELOPMENTJiri Kucerik, Martin Drastik, Oldrich Zmeskal, Anna Ctvrtnickova
ISSN: 1790-5079 715 Issue 11, Volume 5, November 2009