ULTRASONIC SPECTROSCOPY - PharmaInfojbsr.pharmainfo.in/documents/vol3issue3/2011030302.pdf ·...
10
ULTRASONIC SPECTROSCOPY * Kamepalli Sujana, 1 Dr. Prameela Rani.A, Bramara Sandhya.P, Rajeesha.S and Mounika.G * Pharmaceutical Analysis division, Acharya Nagarjuna University College of Pharmaceutical sciences, A.N.U, Guntur-522510, A.P, India. 1 Department of pharmaceutics, ANU, Guntur. Abstract: Ultrasonic spectroscopy and high resolution ultrasonic spectroscopy are the novel non-destructive approaches for the analysis of materials that uses the ability of ultrasound to probe systems non-invasively and report their constitution, microstructure and intermolecular interactions. It employs high frequency acoustic waves to probe the intermolecular forces in materials. The particle size distribution and concentration of a colloidal dispersion can be determined by measuring its ultrasonic velocity and or attenuation co-efficient as a function of frequency and then using a suitable mathematical model to interpret the spectra. Ultrasonic spectrometers utilises either continous wave or pulse echo techniques. The ultrasonic technique could be used to monitor the efficiency of a processing operation in real time that could lead to a major improvement in the manufacture of many colloidal-based materials. Keywords: Ultrasonic velocity, Attenuation co-efficient, Interferometer, Piezotransducer, Colloidal systems Introduction: Ultrasonic or ultrasound is derived from the Latin word “ultra” meaning beyond and “sonic” meaning sound. Ultrasound is beyond the audible range having a frequency of more than 20,000 cycles per second. Ultrasonic spectroscopy and high resolution ultrasonic spectroscopy (HR-US) are the novel non-destructive approaches for the analysis of materials that uses the ability of ultrasound to probe systems non-invasively and report their constitution, microstructure and intermolecular interactions. Most spectroscopists are accustomed to using electromagnetic waves in analysis (UV, Visible, IR, NMR) Ultrasonic spectroscopy is simply spectroscopy employing sound waves. In particular, it uses a high frequency acoustic wave (similar to those used by dolphins for communication and bats for navigation).These waves probe intermolecular forces in materials. Oscillation compression (and decompression) in the ultrasonic wave causes oscillation of molecular arrangements in the sample, which responds by intermolecular arrangement or repulsion. The amplitudes of deformations in the ultrasonic waves employed in analytical ultrasound are extremely small, making ultrasonic analysis a non- destructive technique. PRINCIPLE Ultrasonic spectroscopy is based on the measurements of two independent parameters, ultrasonic attenuation and ultrasonic velocity. Ultrasonic attenuation is determined by the energy losses in ultrasonic waves, which includes absorption and scattering contributions. It can be expressed in terms of viscosity of the medium or its longitudinal loss modulus. It allows analysis of kinetics of fast chemical reactions, microstructure of materials including particle sizing, aggregation, gelation, crystallization and other processes and characteristics. Ultrasonic velocity is determined by the density and the elastic response of the sample to the oscillating pressure in the ultrasonic wave and can be expressed in terms of compressibility or storage modulus (longitudinal).Ultrasonic spectroscopy can be used to analyze particle sizes between 10nm to 1000mm and is suitable for application to concentrated systems (often up to 50%wt.). ADVANTAGES: Ultrasonic spectroscopy has many advantages over other existing particle- sizing technologies because it is Kamepalli Sujana et al / J Biomed Sci and Res., Vol 3 (3), 2011,414-423 414
Transcript of ULTRASONIC SPECTROSCOPY - PharmaInfojbsr.pharmainfo.in/documents/vol3issue3/2011030302.pdf ·...

ULTRASONIC SPECTROSCOPY *Kamepalli Sujana, 1Dr. Prameela Rani.A, Bramara Sandhya.P,
Rajeesha.S and Mounika.G *Pharmaceutical Analysis division, Acharya Nagarjuna University College of Pharmaceutical sciences,
A.N.U, Guntur-522510, A.P, India. 1Department of pharmaceutics, ANU, Guntur.
Abstract: Ultrasonic spectroscopy and high resolution ultrasonic spectroscopy are the novel non-destructive approaches for the analysis of materials that uses the ability of ultrasound to probe systems non-invasively and report their constitution, microstructure and intermolecular interactions. It employs high frequency acoustic waves to probe the intermolecular forces in materials. The particle size distribution and concentration of a colloidal dispersion can be determined by measuring its ultrasonic velocity and or attenuation co-efficient as a function of frequency and then using a suitable mathematical model to interpret the spectra. Ultrasonic spectrometers utilises either continous wave or pulse echo techniques. The ultrasonic technique could be used to monitor the efficiency of a processing operation in real time that could lead to a major improvement in the manufacture of many colloidal-based materials. Keywords: Ultrasonic velocity, Attenuation co-efficient, Interferometer, Piezotransducer, Colloidal systems
Introduction: Ultrasonic or ultrasound is derived from the Latin word “ultra” meaning beyond and “sonic” meaning sound. Ultrasound is beyond the audible range having a frequency of more than 20,000 cycles per second. Ultrasonic spectroscopy and high resolution ultrasonic spectroscopy (HR-US) are the novel non-destructive approaches for the analysis of materials that uses the ability of ultrasound to probe systems non-invasively and report their constitution, microstructure and intermolecular interactions. Most spectroscopists are accustomed to using electromagnetic waves in analysis (UV, Visible, IR, NMR) Ultrasonic spectroscopy is simply spectroscopy employing sound waves. In particular, it uses a high frequency acoustic wave (similar to those used by dolphins for communication and bats for navigation).These waves probe intermolecular forces in materials. Oscillation compression (and decompression) in the ultrasonic wave causes oscillation of molecular arrangements in the sample, which responds by intermolecular arrangement or repulsion. The amplitudes of deformations in the ultrasonic waves employed in analytical ultrasound are extremely small,
making ultrasonic analysis a non-destructive technique. PRINCIPLE Ultrasonic spectroscopy is based on the measurements of two independent parameters, ultrasonic attenuation and ultrasonic velocity. Ultrasonic attenuation is determined by the energy losses in ultrasonic waves, which includes absorption and scattering contributions. It can be expressed in terms of viscosity of the medium or its longitudinal loss modulus. It allows analysis of kinetics of fast chemical reactions, microstructure of materials including particle sizing, aggregation, gelation, crystallization and other processes and characteristics. Ultrasonic velocity is determined by the density and the elastic response of the sample to the oscillating pressure in the ultrasonic wave and can be expressed in terms of compressibility or storage modulus (longitudinal).Ultrasonic spectroscopy can be used to analyze particle sizes between 10nm to 1000mm and is suitable for application to concentrated systems (often up to 50%wt.). ADVANTAGES: Ultrasonic spectroscopy has many advantages over other existing particle-sizing technologies because it is
Kamepalli Sujana et al / J Biomed Sci and Res., Vol 3 (3), 2011,414-423
414

Non-destructive in nature Non-invasive in nature Capable of rapid measurements Used to characterize systems which are concentrated and optically opaque DISADVANTAGES: This technique is not suitable for analyzing dilute suspensions i.e. with particle concentrations <1%wt. PARTICLE-ULTRASONIC WAVE INTERACTIONS: The four most important types of interaction between an ultrasonic wave and a colloidal dispersion are listed below: 1. INTRINSIC ABSORPTION: Each of the individual component phases in a colloidal suspension absorbs ultrasound as a result of classical (viscous and thermal) and relaxation loss mechanisms. The magnitude of these loses can be calculated by measuring the ultrasonic absorption co-efficient of the individual components. 2. VISCO-INERTIAL DISSIPATION LOSSES: In the presence of an ultrasonic wave a particle oscillates backwards and forwards because it has a different density to that of a surrounding liquid. This oscillation is damped by the viscosity of the surrounding liquid which causes some of the ultrasonic energy to be converted to heat and therefore it leads to a reduction in the amplitude of ultrasonic wave. 3. THERMAL DISSIPATION LOSSES: In the presence of an ultrasonic wave the temperature of a particle periodically increases and decreases relative to that of the surrounding liquid. The temperature gradient which arises at the particle surface causes a net flow of heat out of the droplet, which leads to a reduction in the amplitude of the wave. 4. SCATTERING LOSSES: The pulsation and oscillation of a particle in the presence of an ultrasonic wave
causes the generation of secondary ultrasonic waves by the particle. Thus some of the ultrasonic energy associated with the incident wave is redirected into different directions, and an increase in the attenuation coefficient may be detected. The particle size distribution and concentration of a colloidal dispersion can be determined by measuring its ultrasonic velocity and or attenuation co-efficient as a function of frequency and then using a suitable mathematical model to interpret the spectra. The overall attenuation coefficient [1-3] of a colloidal suspension can be considered to be the sum of these various contributions (although in reality some of these mechanisms are coupled to each another). STEPS INVOLVED IN THE DETERMINATION OF PARTICLE SIZE USING ULTRASONIC SPECTROSCOPY Two major steps include: 1. Measurement of the ultrasonic velocity and/or attenuation spectra of the colloidal dispersion and 2. Interpretation of the resulting spectra using a suitable theory. STEP1: MEASUREMENT TECHNIQUES: a) ULTRASONIC VELOCITY: It is the distance the ultrasonic wave moves through the sample per unit time. It can be determined by two different methods:
i. Measuring the time, t taken for a pulse of ultrasound to travel a known distance, x: c =x/t, or
ii. Measuring the wavelength of an ultrasonic wave, at a known frequency,
b) ATTENUATION CO-EFFICIENT: It is determined by measuring the reduction in amplitude of an ultrasonic wave which has traveled a known distance through a material:
Kamepalli Sujana et al / J Biomed Sci and Res., Vol 3 (3), 2011,414-423
415

Where, is the initial amplitude of the
ultrasonic wave (x = 0), and is the amplitude after it has traveled a distance x. The frequency dependence of the ultrasonic properties of colloidal dispersions can be determined using a number of different measurement principles. The major difference between them is the form in which the ultrasonic signal is applied to the sample, i.e. continuous wave, tone-burst or pulse. The different types of signals used in the ultrasonic analysis of colloidal dispersions are: Ultrasonic spectrometers utilises either continous wave or pulse echo techniques. CONTINOUS WAVE TECHNIQUES: Ultrasonic spectrometers which utilise continous waves are usually reffered to as “Interferometers”.Interferometers(9) of liquids can be carried out using two types of experimental arrangement:fixed path length and variable path length devices.
A. FIXED PATH LENGTH DEVICES: In a fixed path length (or resonator) device, the sample to be analyzed is placed in a thermostatic measurement cell between two parallel piezoelectric ultrasonic transducers: a transmitter and a receiver. A signal generator produces an electrical sinusoidal wave of appropriate frequency and amplitude. This wave is applied to the transmitter where it is converted into a sinusoidal ultrasonic wave that propagates into the sample. The ultrasonic wave undergoes multiple reflections between the two transducers which results in the formation of a stationary wave. The signal detected by the receiving transducer is amplified and relayed to a signal analyzer. The amplitude of the received signal goes
through a series of maxima and minima, due to constructive and destructive interference, when the frequency of the ultrasonic wave is varied. The ultrasonic velocity and attenuation coefficient are determined by analyzing the resulting amplitude versus frequency spectra. The attenuation per cycle ( is given by equation,
= )
Where, is the central frequency of a maxima and ∆ is the width of the maxima, whilst the ultrasonic velocity is given by Equation, C=2d∆f Where d is the path length of the measurement cell and ∆f is the frequency difference between the central frequencies of two successive maxima.
Kamepalli Sujana et al / J Biomed Sci and Res., Vol 3 (3), 2011,414-423
416
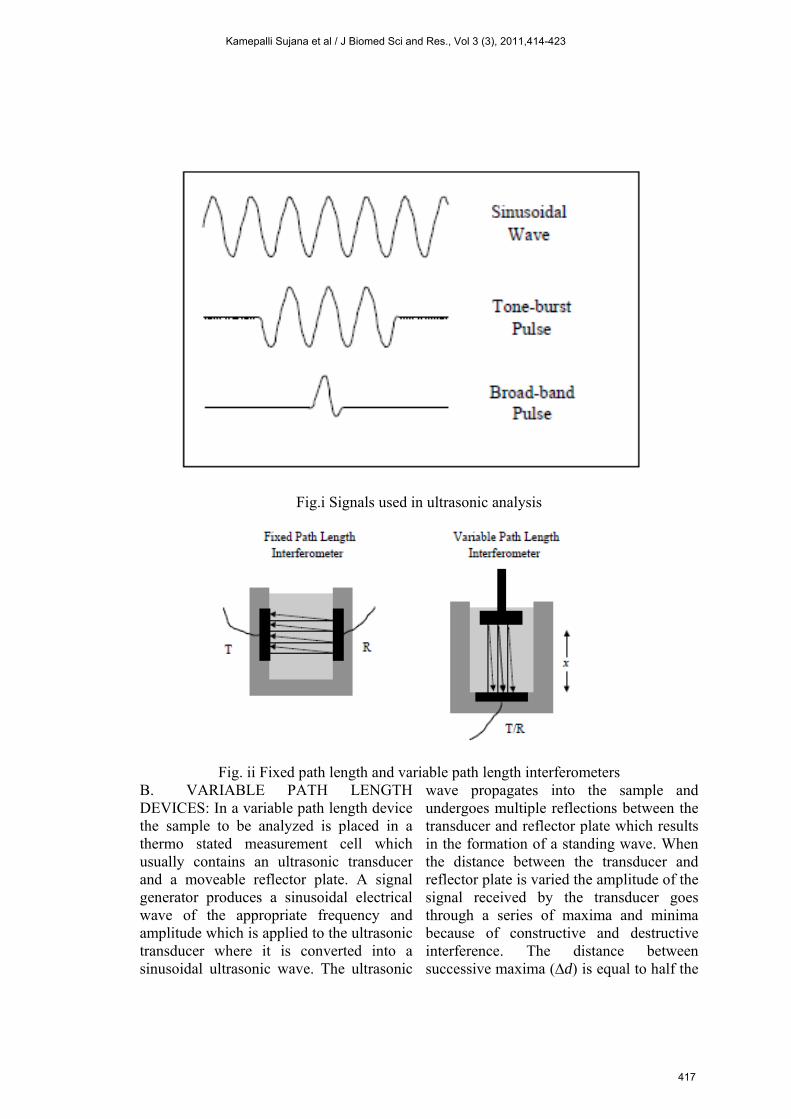
Fig.i Signals used in ultrasonic analysis
Fig. ii Fixed path length and variable path length interferometers
B. VARIABLE PATH LENGTH DEVICES: In a variable path length device the sample to be analyzed is placed in a thermo stated measurement cell which usually contains an ultrasonic transducer and a moveable reflector plate. A signal generator produces a sinusoidal electrical wave of the appropriate frequency and amplitude which is applied to the ultrasonic transducer where it is converted into a sinusoidal ultrasonic wave. The ultrasonic
wave propagates into the sample and undergoes multiple reflections between the transducer and reflector plate which results in the formation of a standing wave. When the distance between the transducer and reflector plate is varied the amplitude of the signal received by the transducer goes through a series of maxima and minima because of constructive and destructive interference. The distance between successive maxima (∆d) is equal to half the
Kamepalli Sujana et al / J Biomed Sci and Res., Vol 3 (3), 2011,414-423
417

ultrasonic wavelength of the sample, and so the ultrasonic velocity can be calculated: c =f = 2fd. The attenuation coefficient is determined from by measuring the amplitude of the maxima as a function of the separation between the reflector plate and transducer. PULSE TECHNIQUES: Ultrasonic spectrometers that utilize pulse techniques may be operated in a pulse-echo or through-transmission mode [8, 9]. In the pulse-echo mode a single transducer is used to both transmit and receive the ultrasonic signal, whereas in the through-transmission mode separate transducers are used to transmit and receive the signal. a. THROUGH-TRANSMISSION TECHNIQUES: The sample to be analyzed is placed in a thermo stated measurement cell between two ultrasonic transducers: a transmitter and a receiver. The transmitting transducer produces a pulse of ultrasound which travels across the sample and is detected by the receiving transducer. The ultrasonic velocity and attenuation coefficient of the sample are determined by measuring the time-of-flight (∆t) and amplitude (A) of the ultrasonic pulse which has traveled across the sample. The ultrasonic velocity is equal to c=d/∆t where, d is the length of the sample and ∆t is the time required to travel this distance. The attenuation coefficient is calculated by comparing the reduction in the amplitude of the pulse that has traveled through the sample with that of a pulse which has traveled through a calibration material b. PULSE-ECHO TECHNIQUES: The frequency-dependent ultrasonic properties of a sample are measured in a very similar fashion as in the through-transmission technique, except that a single transducer is used to both transmit and receive the ultrasonic pulses. The velocity and attenuation coefficient are calculated in exactly the same manner as described for
the through-transmission technique, except that the pulse has now traveled a distance 2d rather than d (8).
(a)
(b)
Fig.iii Through transmission and Pulse echo techniques STEP2: INTERPRETATION OF ULTRASONIC SPECTRA: After measuring the ultrasonic velocity and/or attenuation coefficient as a function of frequency the particle size distribution is then determined by finding the droplet size distribution that gives the best fit between the predictions of the ultrasonic scattering theory and the experimental ultrasonic spectra. There are two approaches to solving this inverse scattering problem: model-independent inversion and model-dependent inversion. In the model-dependent inversion method it is assumed that the particle size distribution follows some common forms which can simply model mathematically,
Kamepalli Sujana et al / J Biomed Sci and Res., Vol 3 (3), 2011,414-423
418

Where, P (r) is the probability of having a particle of radius r, is the geometric
mean of the radius and is the standard
deviation of the geometric mean. The droplet size distribution can then be characterized by only two parameters:
and
Commercial ultrasonic particle-sizing instruments typically make measurements over the range 1 to 200 MHz, which enables them to analyze particles between about 10nm and 1000 mm in radius [4-7] INSTRUMENTATION A typical ultrasonic spectrometer consists of a signal transmitter, a signal analyzer and a measurement cell. HIGH RESOLUTION ULTRASONIC SPECTROSCOPY: High-resolution ultrasonic spectroscopy (HR-US) is an analytical technique based upon precision measurements of parameters (velocity and attenuation) of ultrasonic compression wave propagating through the analyzed sample. The general principle of the high-resolution ultrasonic measurements includes transferring the generated ultrasonic signal by the piezotransducer into the ultrasonic wave. Another piezotransducer transfers the received ultrasonic wave into an electronic signal subsequent analysis. Most widely used approach for the measurements of ultrasonic characteristics in the past was based on the pulse technique. In this technique the ultrasonic pulse generated at a certain frequency is sent through a sample and received either at the opposite side or, after the reflection from the wall of the container, back to the source of ultrasound. Measurements of the amplitude of the wave in the pulse allow the determination of the ultrasonic attenuation and the propagation time (or
related parameters), which characterize the ultrasonic velocity. The resolution of this technique is limited by the length of the pulse or by the size of the sample. Hence the HR-US Spectrometer involves a novel principle where the path length of the ultrasonic wave in the sample exceeds the size of the sample. The use of modern advances in ultrasonic design, electronics and digital processing allow the attainment of ultrasonic measurements with much greater resolution (down to 10-5% for ultrasonic velocity) in abroad range of the sample volumes, down to a single droplet. BENEFITS OF THE ULTRASONIC ANALYSIS: Most materials are ultrasonically transparent allowing the analysis of a broad variety of sample types, chemical reactions and processes. Hence, Ultrasonic analysis can now be easily performed in chemistry, physics, biotechnology, pharmaceuticals, agriculture, environmental control, medicine Modern ultrasonic cells do not have sharp corners and can accommodate even aggressive liquids such as strong acids or organic solvents without evaporation in the course of measurements sizes range from 4ml down to 30µl. The measurements are completely computer controlled and results are presented in a graphical and digital format, which is compatible with Excel and most current data analysis software.
Kamepalli Sujana et al / J Biomed Sci and Res., Vol 3 (3), 2011,414-423
419

Fig.iv Ultrasonic spectrophotometer
Fig.v HR-US System
The novel design of the Ultrasonic Scientific HR-US makes possible ultrasonic measurements in the temperature ramp regime for analysis of heat stability, phase transitions, conformational transitions in polymers and others There is the impressive dynamic range allows the analysis of solutions of
small concentration, down to 0.3ppm (0.3µg/ml). In short HR-US 102 allows high-resolution measurements of the velocity and attenuation of acoustical waves at high, ultrasonic frequencies propagating through materials. It provides fast, non-destructive analysis of a wide spectrum of properties of materials.
Kamepalli Sujana et al / J Biomed Sci and Res., Vol 3 (3), 2011,414-423
420
It combines simple sample handling with record precision, variety of measuring regimes, small sample volume, convenience and exceptional simplicity of use. APPLICATIONS: To evaluate stability of emulsions: stability of emulsions (including the composition and microstructure) is a key element for evaluation of the lifetime and temperature conditions for the storage and use of emulsion based products. Ultrasonic measurements allow very simple procedures for the evaluation of the stability of emulsions. In this experiment, ultrasonic analysis of the thermal stability of a pharmaceutical water/oil emulsion (0.5mm) was performed during gradual heating of the sample. The changes in the attenuation and relative ultrasonic velocity were measured. The arrows in the above figure indicate the temperature corresponding to the destabilisation of the sample. (Temperature measurements were taken at various
frequencies in the range 2-15 MHz). The rise in the attenuation at 44°C provides clear evidence of restructuring in the emulsion. The increase in the attenuation can be attributed to the flocculation of dispersed aqueous droplets induced by heating. As seen above, the change in ultrasonic velocity deviates from the baseline at the same temperature that the ultrasonic attenuation begins to rise. This demonstrates the sensitivity of both ultrasonic parameters (attenuation and velocity) for accurate characterisation of the emulsion. To determine particle size distribution of colloidal systems: The attenuation spectra of a series of corn oil-in-water emulsion with different disperse phase volume fractions (1–50 vol. %) can be drawn. There will be excellent agreement between the measured and actual volume fractions of the emulsions up to the highest droplet concentration. In addition, the mean particle diameter is relatively insensitive to droplet
Kamepalli Sujana et al / J Biomed Sci and Res., Vol 3 (3), 2011,414-423
421
concentration, indicating that the ultrasonic technique is capable of analyzing this system over a wide range of concentrations without any sample preparation. In the analysis of micro emulsions: High-resolution ultrasonic spectroscopy is used for analysis of the formation of a micro emulsion in a system consisting of pharmaceutically accepted components, namely, isopropyl myristate, lecithin (Epikuron 200) and n-propanol as a co surfactant in a w/w ratio 6:1:1 and water. The measurements were performed at 20ºC using HR-US 102 spectrometer equipped with standard 1ml cell in the frequency range 2-20 MHz The representation above shows a typical dependence of ultrasonic velocity (squares) and attenuation (circles) on concentration of water in the system (at 5 MHz). Molecular dissolving of water in the mixture at low concentrations (up to 2 wt %), which is accompanied by hydration of lipid and co surfactant as shown by the steady increase in ultrasonic velocity. Following this a micro structural reorganisation takes place, indicated by an additional increase in ultrasonic velocity in the range between 2% and 6% of concentration of water HR-US Spectroscopy provides a powerful tool for quality control and process control in PAT (process analytical technology). Used in the analysis of sedimentation and aggregation of drugs prepared using different polymer coatings. Used in measurement of concentration profile and sedimentation for suspensions in flow. PERSPECTIVE AND FUTURE DEVELOPMENTS The ability of ultrasonic spectroscopy to characterize colloidal suspensions which are concentrated and optically opaque without the need for any form of sample preparation is extremely important for
many applications. One of the areas where the technique is most likely to be used is for the on-line determination of particle size distributions of colloidal suspensions during processing. The ultrasonic technique could be used to monitor the efficiency of a processing operation in real time that could lead to a major improvement in the manufacture of many colloidal-based materials, e.g. foods, pharmaceuticals, petrochemicals, agrochemicals and cosmetics. Conclusion: The arrival of new generation ultrasonic and HR-US analyzers provides real time information on chemical and micro structural characteristics across a broad range of materials. They act as a powerful tool for the development of new products and the optimization of existing products. Thus they have a profound impact on the efficiency and profitability of pharmaceutical processes. References: [1] U. Riebel, F. Loffler, ‘The Fundamentals of
Particle Size Analysis by means of Ultrasonic Spectrometry’, Part. Part. Syst. Charact., 6, 135–143 (1989).
[2] D.J. Mc Clements, ‘Principles of Ultrasonic Droplet Size Determination’, Langmuir, 12, 3454–3461 (1996).
[3] M.J.W. Povey, Ultrasonic Techniques for Fluid Characterization, Academic Press, San Diego, 1997.
[4] U. Kaatze, B. Wehrmann, R. Pottel, ‘Acoustic Absorption Spectroscopy of Liquids between 0.15 and 3000MHz. I. High Resolution Ultrasonic Resonantor Method’, J. Phys. E., 20, 1035–1040 (1987).
[5] U.Kaatze, K. Lautscham, M. Brai, ‘Acoustic Absorption Spectroscopy of Liquids between 0.15 and 3000MHz. II. Ultrasonic Pulse Transmission Methods’, J. Phys. E., 21, 98–103 (1988).
[6] U. Kaatze, B.K. Lautscham, ‘Acoustic Absorption Spectroscopy of Liquids between 0.15 and 3000MHz: II. Hypersonic Comparator Technique’, J. Phys. E., 21, 402–406 (1988).
[7] U. Kaatze,C. Trachimow,R. Pottel, M. Brai, ‘Broadband Study of the Scattering of
Kamepalli Sujana et al / J Biomed Sci and Res., Vol 3 (3), 2011,414-423
422

Ultrasound by Polystyrene- Latex-in-water Suspensions’, Ann. Physik, 5, 13–33 (1996).
[8] D.J. Mc Clements, ‘Ultrasonic Characterization of Emulsions and Suspensions’, Adv. Coll. Int. Sci., 37, 33–72 (1991).
[9] F.G. Eggers, U. Kaatze, ‘Broadband Ultrasonic Measurement Techniques for Liquids’, Meas. Sci. Tech., 7, 1–19 (1996).
[10] R.E. Challis, J.A. Harrison, A.K. Holmes, R.P. Cocker, ‘A Wide Bandwidth Spectrometer for
Rapid Ultrasonic Absorption Measurements in Liquids’, J. Acoust. Soc. Am., 90, 730–740 (1991).
[11] D.J. Mc Clements, P. Fairley, ‘Frequency Scanning Ultrasonic Pulse Echo Reflectometer’, Ultrasonics, 30, 403–406, (1992).
[12] D.J. Mc Clements, P. Fairley, ‘Ultrasonic Pulse Echo Reflectometer’, Ultrasonics, 29, 58–60 (1991).
Kamepalli Sujana et al / J Biomed Sci and Res., Vol 3 (3), 2011,414-423
423