UK Energy from Waste Statistics – 2020 - Tolvik
22
May 2021 UK Energy from Waste Statistics – 2020
Transcript of UK Energy from Waste Statistics – 2020 - Tolvik
May 2021
UK Energy from Waste Statistics – 2020
UK Energy from Waste Statistics - 2020
P a g e | 2 © Tolvik Consulting Ltd
INTRODUCTION
Tolvik’s seventh annual report on the UK Energy from Waste (“EfW”) sector brings together data from a range of sources into a single, readily accessible document. We are very grateful to the continued co-operation from all concerned, in particular the Environment Agency (“EA”), Environmental Services Association and individual EfW operators, with data analysis greatly helped by the new Annual Performance Report (“APRs”) formats.
Building upon last year’s report, the section on carbon intensity of EfW has been expanded. As in previous years we welcome any feedback on the report as a whole but we are particularly interested in comments on what is becoming an increasingly significant section.
For consistency with previous years, the focus of this report continues to remain upon conventional moving grate EfWs and Advanced Conversion Technology (“ACT”) facilities in the UK generating energy from the combustion of Residual Waste. In 2020, in addition to the use of Residual Waste in the form of Solid Recovered Fuel at cement kilns, increased (but still very modest) tonnages of Residual Waste were co-incinerated at biomass facilities including Slough Fibrepower, Boston (Biomass No 3 Limited) and RWE Markinch. This data has once again been excluded but will be reviewed each year.
Residual Waste is defined as non-hazardous, solid, combustible mixed waste which remains after recycling activities. This definition is a little broader than that for Municipal Waste but primarily includes wastes falling within European Waste Catalogue (“EWC”) 19 12 10, 19 12 12 and 20 03 01. The report continues to exclude EfW facilities in Jersey and the Isle of Man.
Please also note, where applicable, prior year data has been updated to reflect the latest available information. Note also that data tables may not add up to the total due to rounding.
Copies of this report can be downloaded via www.tolvik.com. Third parties are entitled to freely use the contents of the report, subject to appropriately acknowledging its source.
CONTENTS
1. SUMMARY OBSERVATIONS ................................................................................................................... 3
2. MARKET OVERVIEW ............................................................................................................................... 4
3. WASTE INPUTS ........................................................................................................................................ 5
4. ENERGY .................................................................................................................................................... 7
5. OPERATIONS ........................................................................................................................................... 9
6. COMPLIANCE ......................................................................................................................................... 14
7. CAPACITY DEVELOPMENT ................................................................................................................... 17
APPENDIX 1: ENERGY FROM WASTE FACILITIES INCLUDED IN THE REPORT ....................................... 18
APPENDIX 2: INTERNATIONAL BENCHMARKS ............................................................................................. 20
APPENDIX 3: DATA SOURCES ........................................................................................................................ 21
APPENDIX 4: GLOSSARY ................................................................................................................................. 21
Front Cover Image: Javelin Park Energy Recovery Facility, fully operational in 2020 Courtesy: Urbaser Environmental Ltd
UK Energy from Waste Statistics - 2020
P a g e | 3
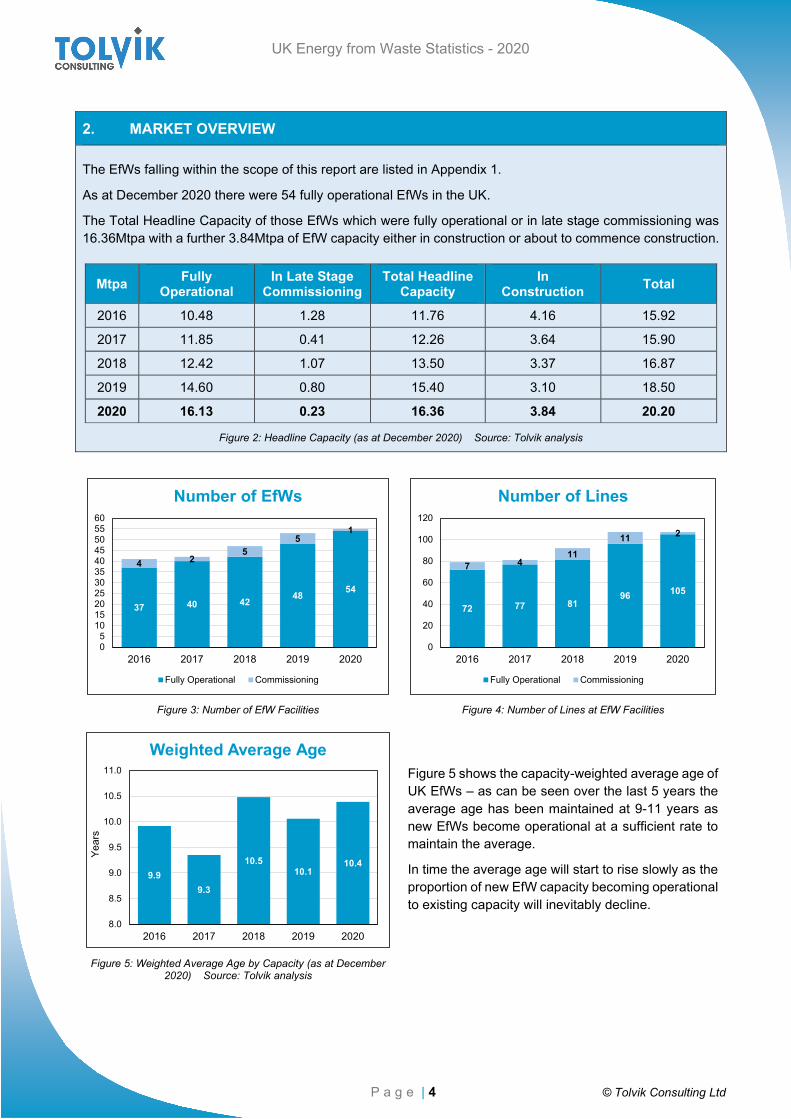
1. SUMMARY OBSERVATIONS
Above all this year’s report highlights the resilience of the UK EfW sector to the effects of COVID-19.
Residual Waste Processed
10.5%
Power Exported to Grid
15.8%
Average Availability
0.4%
Number of Heat Exporting EfWs
2
Total Heat Exported
19.3%
Net CO2 Impact / Tonne Input
1.1%
Figure 1: Comparison of 2020 vs 2019
In 2020 a total of just under 14.0Mt of Residual Waste was processed in UK EfWs, up from 12.6Mt in 2019 and higher than projected in the 2019 report.
Improved turbine availability (after the challenges reported in previous years) and two new heat exporting EfWs means that energy generation in terms of heat and power exports increased significantly, both on a like-for-like and absolute basis.
During 2020 six EfWs, including three ACTs, reported that they had achieved takeover. Meanwhile, Tolvik reported five EfWs achieving “financial close” with commencement of main construction works – Newhurst, Drakelow ACT, Newport, Protos and Slough (where ground preparation had previously commenced). This may not be entirely a co-incidence, as in a sector requiring specialist skills and experience, as EfWs complete construction so essential construction managers and engineers become available.
A number of new investors also entered the sector during the year as 2020 was arguably the busiest year in terms of M&A activity. With this has come increased leveraged finance at both corporate and asset level.
Outlook
Following the influential Committee on Climate Change (“CCC”) sixth Carbon Budget suggestion that Carbon Capture and Storage (“CCS”) should be one of the many requirements of the UK Government’s Net Zero strategy, debate as to the role of EfW in the UK’s climate change, resources and waste management sectors has intensified in recent months.
At the time of writing the Government seems set to put many of the CCC’s recommendations into law. But before any meaningful investment in CCS can be made there is a need for greater understanding of the technical and economic implications of the technology in the context of EfW, including the potential for negative emissions and the benefits (or otherwise) if an EfW is located in a carbon capture “cluster” or CO2 is transported from an EfW to such a cluster.
Understandably the focus on carbon emissions and the role of EfW means that, as when the UK faced the EU Landfill Directive targets, stakeholders (including Government) have a need to better understand the quantum, composition and available alternatives for the future treatment of Residual Waste. A range of recommendations are likely to result – some identifying ways in which the carbon performance of EfW can be improved and others suggesting novel technical options.
With significant investor appetite in the green economy, funds for the development of large scale Residual Waste treatment facilities based on novel solutions are more likely than ever to be potentially available. However, past experience suggests that such solutions can face operational challenges.
The UK continues to generate around 70,000 tonnes of Residual Waste a day, and exports and landfill options are in decline. The challenges of 2020 provided the EfW sector with the opportunity to demonstrate its operational resilience whilst highlighting that, in the understandable search for better carbon solutions for Residual Waste, stakeholders must be very careful not to lose sight of the critical need for operational reliability.
UK Energy from Waste Statistics - 2020
P a g e | 4 © Tolvik Consulting Ltd
2. MARKET OVERVIEW
The EfWs falling within the scope of this report are listed in Appendix 1.
As at December 2020 there were 54 fully operational EfWs in the UK.
The Total Headline Capacity of those EfWs which were fully operational or in late stage commissioning was 16.36Mtpa with a further 3.84Mtpa of EfW capacity either in construction or about to commence construction.
Mtpa Fully Operational
In Late Stage Commissioning
Total Headline Capacity
In Construction Total
2016 10.48 1.28 11.76 4.16 15.92
2017 11.85 0.41 12.26 3.64 15.90
2018 12.42 1.07 13.50 3.37 16.87
2019 14.60 0.80 15.40 3.10 18.50
2020 16.13 0.23 16.36 3.84 20.20
Figure 2: Headline Capacity (as at December 2020) Source: Tolvik analysis
Figure 3: Number of EfW Facilities Figure 4: Number of Lines at EfW Facilities
Figure 5 shows the capacity-weighted average age of UK EfWs – as can be seen over the last 5 years the average age has been maintained at 9-11 years as new EfWs become operational at a sufficient rate to maintain the average.
In time the average age will start to rise slowly as the proportion of new EfW capacity becoming operational to existing capacity will inevitably decline.
Figure 5: Weighted Average Age by Capacity (as at December 2020) Source: Tolvik analysis
37 40 42 48 54
4 25
51
05
1015202530354045505560
2016 2017 2018 2019 2020
Number of EfWs
Fully Operational Commissioning
72 77 8196 105
7 411
11 2
0
20
40
60
80
100
120
2016 2017 2018 2019 2020
Number of Lines
Fully Operational Commissioning
9.99.3
10.510.1
10.4
8.0
8.5
9.0
9.5
10.0
10.5
11.0
2016 2017 2018 2019 2020
Year
s
Weighted Average Age
UK Energy from Waste Statistics - 2020
P a g e | 5
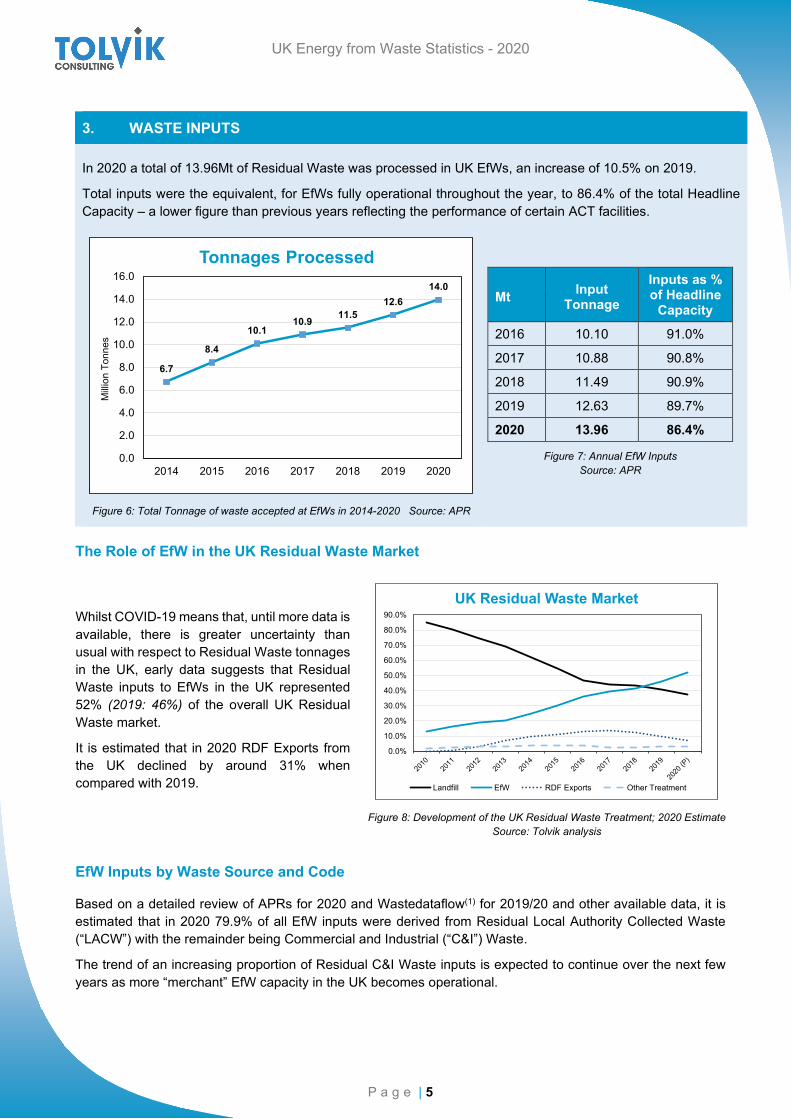
3. WASTE INPUTS
In 2020 a total of 13.96Mt of Residual Waste was processed in UK EfWs, an increase of 10.5% on 2019.
Total inputs were the equivalent, for EfWs fully operational throughout the year, to 86.4% of the total Headline Capacity – a lower figure than previous years reflecting the performance of certain ACT facilities.
Figure 6: Total Tonnage of waste accepted at EfWs in 2014-2020 Source: APR
Figure 7: Annual EfW Inputs Source: APR
Mt Input Tonnage
Inputs as % of Headline
Capacity
2016 10.10 91.0%
2017 10.88 90.8%
2018 11.49 90.9%
2019 12.63 89.7%
2020 13.96 86.4%
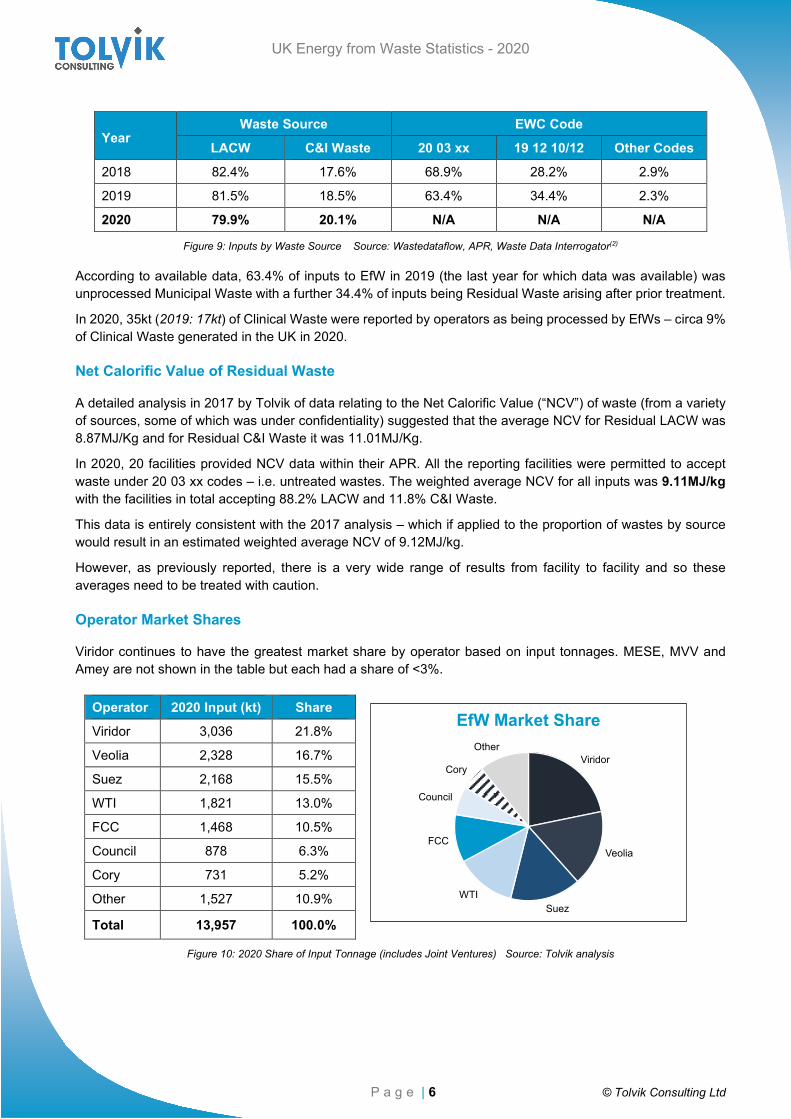
The Role of EfW in the UK Residual Waste Market
Whilst COVID-19 means that, until more data is available, there is greater uncertainty than usual with respect to Residual Waste tonnages in the UK, early data suggests that Residual Waste inputs to EfWs in the UK represented 52% (2019: 46%) of the overall UK Residual Waste market.
It is estimated that in 2020 RDF Exports from the UK declined by around 31% when compared with 2019.
Figure 8: Development of the UK Residual Waste Treatment; 2020 Estimate Source: Tolvik analysis
EfW Inputs by Waste Source and Code
Based on a detailed review of APRs for 2020 and Wastedataflow(1) for 2019/20 and other available data, it is estimated that in 2020 79.9% of all EfW inputs were derived from Residual Local Authority Collected Waste (“LACW”) with the remainder being Commercial and Industrial (“C&I”) Waste.
The trend of an increasing proportion of Residual C&I Waste inputs is expected to continue over the next few years as more “merchant” EfW capacity in the UK becomes operational.
6.7
8.4
10.110.9 11.5
12.614.0
0.0
2.0
4.0
6.0
8.0
10.0
12.0
14.0
16.0
2014 2015 2016 2017 2018 2019 2020
Milli
on T
onne
s
Tonnages Processed
0.0%
10.0%
20.0%
30.0%
40.0%
50.0%
60.0%
70.0%
80.0%
90.0%
UK Residual Waste Market
Landfill EfW RDF Exports Other Treatment
UK Energy from Waste Statistics - 2020
P a g e | 6 © Tolvik Consulting Ltd
Year Waste Source EWC Code
LACW C&I Waste 20 03 xx 19 12 10/12 Other Codes
2018 82.4% 17.6% 68.9% 28.2% 2.9%
2019 81.5% 18.5% 63.4% 34.4% 2.3%
2020 79.9% 20.1% N/A N/A N/A
Figure 9: Inputs by Waste Source Source: Wastedataflow, APR, Waste Data Interrogator(2)
According to available data, 63.4% of inputs to EfW in 2019 (the last year for which data was available) was unprocessed Municipal Waste with a further 34.4% of inputs being Residual Waste arising after prior treatment.
In 2020, 35kt (2019: 17kt) of Clinical Waste were reported by operators as being processed by EfWs – circa 9% of Clinical Waste generated in the UK in 2020.
Net Calorific Value of Residual Waste
A detailed analysis in 2017 by Tolvik of data relating to the Net Calorific Value (“NCV”) of waste (from a variety of sources, some of which was under confidentiality) suggested that the average NCV for Residual LACW was 8.87MJ/Kg and for Residual C&I Waste it was 11.01MJ/Kg.
In 2020, 20 facilities provided NCV data within their APR. All the reporting facilities were permitted to accept waste under 20 03 xx codes – i.e. untreated wastes. The weighted average NCV for all inputs was 9.11MJ/kg with the facilities in total accepting 88.2% LACW and 11.8% C&I Waste.
This data is entirely consistent with the 2017 analysis – which if applied to the proportion of wastes by source would result in an estimated weighted average NCV of 9.12MJ/kg.
However, as previously reported, there is a very wide range of results from facility to facility and so these averages need to be treated with caution.
Operator Market Shares
Viridor continues to have the greatest market share by operator based on input tonnages. MESE, MVV and Amey are not shown in the table but each had a share of <3%.
Operator 2020 Input (kt) Share
Viridor 3,036 21.8%
Veolia 2,328 16.7%
Suez 2,168 15.5%
WTI 1,821 13.0%
FCC 1,468 10.5%
Council 878 6.3%
Cory 731 5.2%
Other 1,527 10.9%
Total 13,957 100.0%
Figure 10: 2020 Share of Input Tonnage (includes Joint Ventures) Source: Tolvik analysis
Viridor
Veolia
SuezWTI
FCC
Council
Cory
Other
EfW Market Share
UK Energy from Waste Statistics - 2020
P a g e | 7
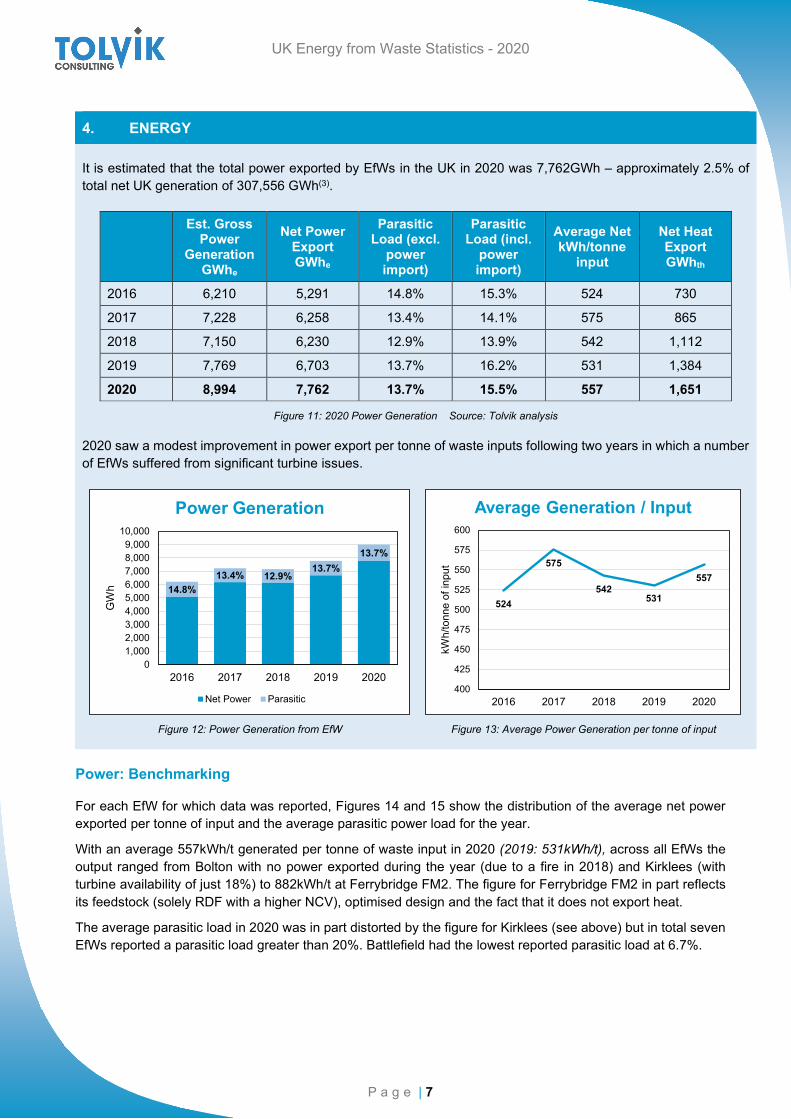
4. ENERGY
It is estimated that the total power exported by EfWs in the UK in 2020 was 7,762GWh – approximately 2.5% of total net UK generation of 307,556 GWh(3).
Est. Gross
Power Generation
GWhe
Net Power Export GWhe
Parasitic Load (excl.
power import)
Parasitic Load (incl.
power import)
Average Net kWh/tonne
input
Net Heat Export GWhth
2016 6,210 5,291 14.8% 15.3% 524 730
2017 7,228 6,258 13.4% 14.1% 575 865
2018 7,150 6,230 12.9% 13.9% 542 1,112
2019 7,769 6,703 13.7% 16.2% 531 1,384
2020 8,994 7,762 13.7% 15.5% 557 1,651
Figure 11: 2020 Power Generation Source: Tolvik analysis
2020 saw a modest improvement in power export per tonne of waste inputs following two years in which a number of EfWs suffered from significant turbine issues.
Figure 12: Power Generation from EfW Figure 13: Average Power Generation per tonne of input
Power: Benchmarking
For each EfW for which data was reported, Figures 14 and 15 show the distribution of the average net power exported per tonne of input and the average parasitic power load for the year.
With an average 557kWh/t generated per tonne of waste input in 2020 (2019: 531kWh/t), across all EfWs the output ranged from Bolton with no power exported during the year (due to a fire in 2018) and Kirklees (with turbine availability of just 18%) to 882kWh/t at Ferrybridge FM2. The figure for Ferrybridge FM2 in part reflects its feedstock (solely RDF with a higher NCV), optimised design and the fact that it does not export heat.
The average parasitic load in 2020 was in part distorted by the figure for Kirklees (see above) but in total seven EfWs reported a parasitic load greater than 20%. Battlefield had the lowest reported parasitic load at 6.7%.
14.8%13.4% 12.9%
13.7%13.7%
01,0002,0003,0004,0005,0006,0007,0008,0009,000
10,000
2016 2017 2018 2019 2020
GW
h
Power Generation
Net Power Parasitic
524
575
542531
557
400
425
450
475
500
525
550
575
600
2016 2017 2018 2019 2020
kWh/
tonn
e of
inpu
t
Average Generation / Input
UK Energy from Waste Statistics - 2020
P a g e | 8 © Tolvik Consulting Ltd
Figure 14: 2020 Net Power Exported per tonne of Input
Source: Tolvik analysis, 54 records Figure 15: 2020 Parasitic Load Distribution
Source: Tolvik analysis, 47 records
Beneficial Heat Use
In 2020, 12 EfWs in the UK exported heat for beneficial use alongside power with an estimated total export of 1,651GWhth. (2019: 1,384GWhth). Across all EfWs this was the equivalent of 118kWhth/tonne of inputs (2019: 110kWhth/tonne).
EfW Est. Export GWhth
Heat/Steam Offtake 2017 2018 2019 2020
Runcorn 405 408 405 480 Steam supply to Ineos
Eastcroft 224 332 420 405 Enviroenergy for electricity generation and hot water
Wilton 11 - 100 303 373 Adjacent Wilton International site
Kemsley - - - 123 DS Smith papermill
Sheffield 96 112 111 95 District heating operated by Veolia
Devonport 54 59 48 54 Adjacent naval dock yard
Gremista 40 40 40 50 District heating on the Shetland Islands (estimated)
SELCHP 37 38 39 40 District heating operated by Veolia
Leeds - 8 2 14 District heating operated by Vital Energi
Coventry 5 11 13 8 District heating operated by Engie
NewLincs 3 3 3 7 To local industry
Edmonton - - - 2 Very modest export reported
Total 865 1,112 1,384 1,651
Figure 16: Reported Heat Exports from EfWs Source: APR
0100200300400500600700800900
1,000
kWh/
t
2020: Net Power/t Input
0%5%
10%15%20%25%30%35%40%45%50%
Para
sitic
Loa
d
2020: Parasitic Load
UK Energy from Waste Statistics - 2020
P a g e | 9
5. OPERATIONS
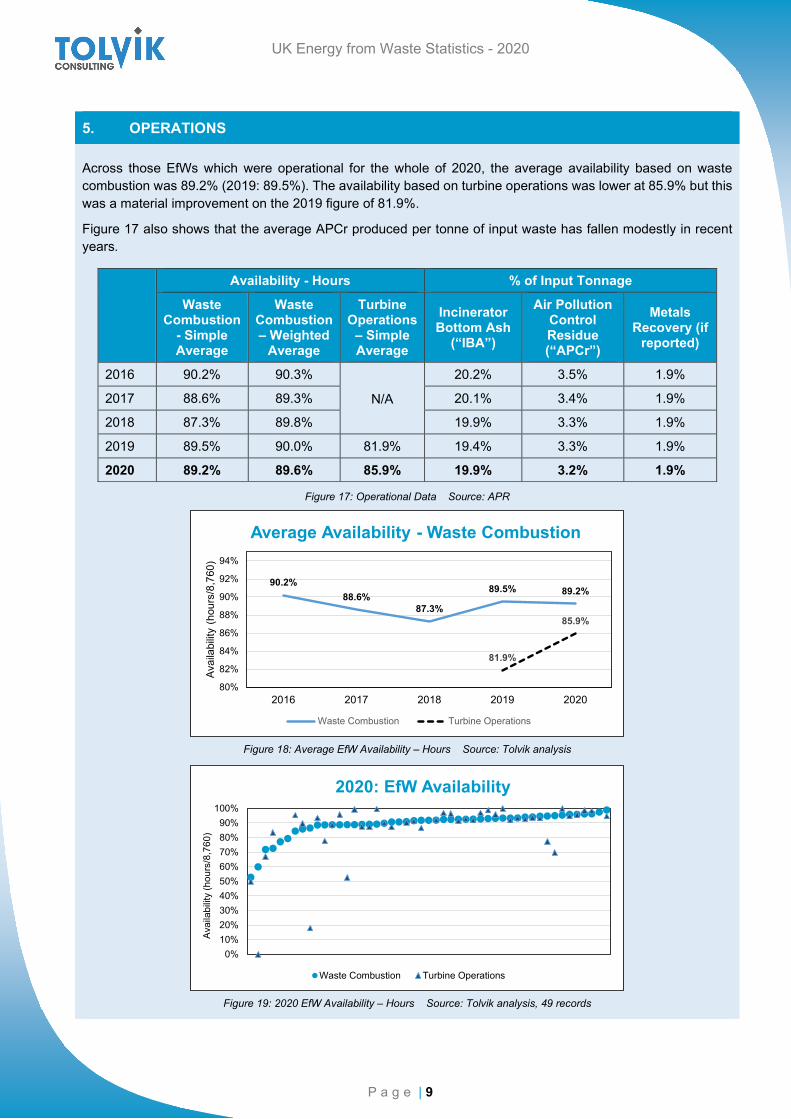
Across those EfWs which were operational for the whole of 2020, the average availability based on waste combustion was 89.2% (2019: 89.5%). The availability based on turbine operations was lower at 85.9% but this was a material improvement on the 2019 figure of 81.9%.
Figure 17 also shows that the average APCr produced per tonne of input waste has fallen modestly in recent years.
Availability - Hours % of Input Tonnage
Waste Combustion
- Simple Average
Waste Combustion – Weighted
Average
Turbine Operations
– Simple Average
Incinerator Bottom Ash
(“IBA”)
Air Pollution Control Residue (“APCr”)
Metals Recovery (if
reported)
2016 90.2% 90.3% N/A
20.2% 3.5% 1.9%
2017 88.6% 89.3% 20.1% 3.4% 1.9%
2018 87.3% 89.8% 19.9% 3.3% 1.9%
2019 89.5% 90.0% 81.9% 19.4% 3.3% 1.9%
2020 89.2% 89.6% 85.9% 19.9% 3.2% 1.9%
Figure 17: Operational Data Source: APR
Figure 18: Average EfW Availability – Hours Source: Tolvik analysis
Figure 19: 2020 EfW Availability – Hours Source: Tolvik analysis, 49 records
90.2%88.6%
87.3%
89.5% 89.2%
81.9%
85.9%
80%
82%
84%
86%
88%
90%
92%
94%
2016 2017 2018 2019 2020
Avai
labi
lity
(hou
rs/8
,760
)
Average Availability - Waste Combustion
Waste Combustion Turbine Operations
0%10%20%30%40%50%60%70%80%90%
100%
Avai
labi
lity
(hou
rs/8
,760
)
2020: EfW Availability
Waste Combustion Turbine Operations
UK Energy from Waste Statistics - 2020
P a g e | 10 © Tolvik Consulting Ltd
Operator Number of
EfWs reporting
Simple Average
Availability
Capacity Weighted Average
WTI 3 93.9% 94.1%
Veolia 10 94.4% 93.7%
Public Sector 3 91.9% 92.5%
MESE 3 91.7% 91.0%
Viridor 8 91.2% 90.8%
Suez 7 85.4% 88.9%
MVV 2 85.5% 88.4%
Other 4 83.3% 87.3%
FCC 6 88.5% 86.0%
Cory 1 84.5% 84.5%
Amey 2 74.5% 75.9%
Average 89.2% 89.6%
Figure 20: 2020 Average Availability (Waste Combustion) by Operator – EfWs operational for the full year
During 2020, eight EfWs reported an average Waste Combustion availability of greater than 95%. These ranged in scale from WTI’s Ferrybridge FM1 down to Lancing together with five Veolia facilities and Viridor’s Beddington Lane.
Of those reporting four EfWs had an availability below 75% - Bolton, Allington and two ACTs – Milton Keynes and Hoddesdon.
There was a significant increase in the number of facilities reporting average Turbine Operations availability in excess of 95% during 2020 – up from seven in 2019 to 14. However six EfWs reported a figure below 75% including Bolton and Kirklees (see previous section), two ACTs (as above) plus Hanford and Ferrybridge FM1.
Outputs
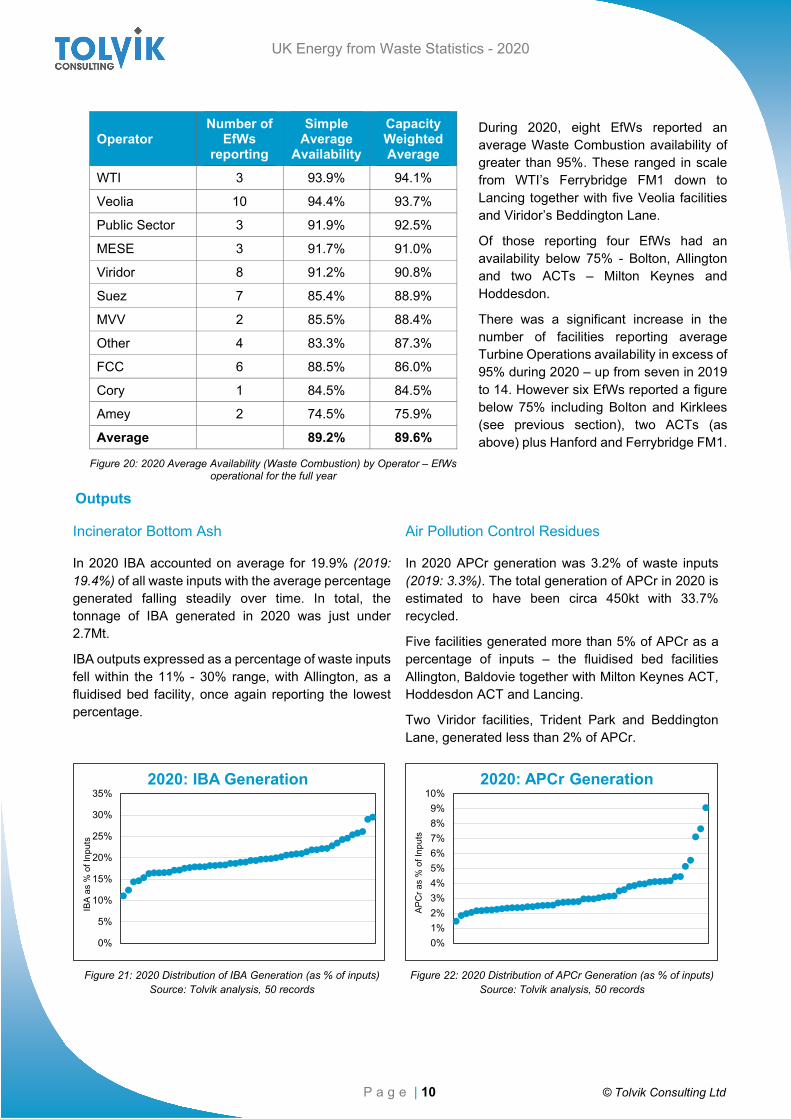
Incinerator Bottom Ash
In 2020 IBA accounted on average for 19.9% (2019: 19.4%) of all waste inputs with the average percentage generated falling steadily over time. In total, the tonnage of IBA generated in 2020 was just under 2.7Mt.
IBA outputs expressed as a percentage of waste inputs fell within the 11% - 30% range, with Allington, as a fluidised bed facility, once again reporting the lowest percentage.
Air Pollution Control Residues
In 2020 APCr generation was 3.2% of waste inputs (2019: 3.3%). The total generation of APCr in 2020 is estimated to have been circa 450kt with 33.7% recycled.
Five facilities generated more than 5% of APCr as a percentage of inputs – the fluidised bed facilities Allington, Baldovie together with Milton Keynes ACT, Hoddesdon ACT and Lancing.
Two Viridor facilities, Trident Park and Beddington Lane, generated less than 2% of APCr.
Figure 21: 2020 Distribution of IBA Generation (as % of inputs)
Source: Tolvik analysis, 50 records Figure 22: 2020 Distribution of APCr Generation (as % of inputs)
Source: Tolvik analysis, 50 records
0%
5%
10%
15%
20%
25%
30%
35%
IBA
as %
of I
nput
s
2020: IBA Generation
0%1%2%3%4%5%6%7%8%9%
10%
APC
r as
% o
f Inp
uts
2020: APCr Generation
UK Energy from Waste Statistics - 2020
P a g e | 11
Consumable Use
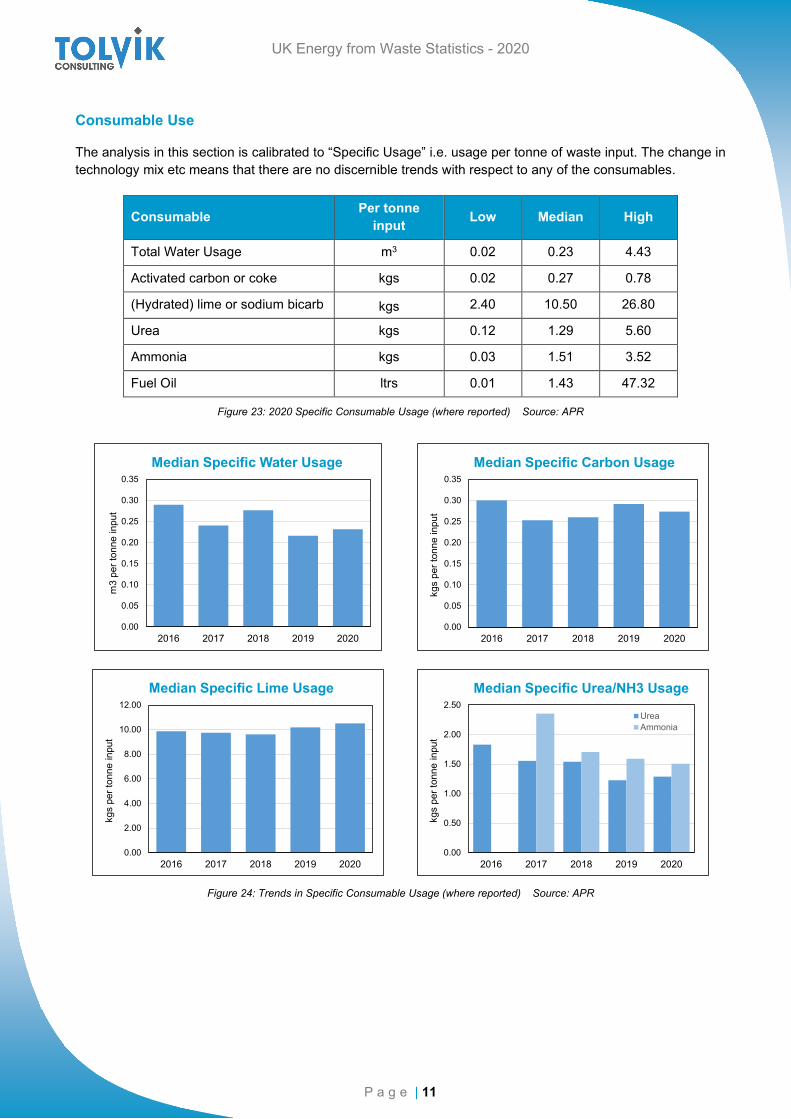
The analysis in this section is calibrated to “Specific Usage” i.e. usage per tonne of waste input. The change in technology mix etc means that there are no discernible trends with respect to any of the consumables.
Consumable Per tonne input Low Median High
Total Water Usage m3 0.02 0.23 4.43
Activated carbon or coke kgs 0.02 0.27 0.78
(Hydrated) lime or sodium bicarb kgs 2.40 10.50 26.80
Urea kgs 0.12 1.29 5.60
Ammonia kgs 0.03 1.51 3.52
Fuel Oil ltrs 0.01 1.43 47.32
Figure 23: 2020 Specific Consumable Usage (where reported) Source: APR
Figure 24: Trends in Specific Consumable Usage (where reported) Source: APR
0.00
0.05
0.10
0.15
0.20
0.25
0.30
0.35
2016 2017 2018 2019 2020
m3
per t
onne
inpu
t
Median Specific Water Usage
0.00
0.05
0.10
0.15
0.20
0.25
0.30
0.35
2016 2017 2018 2019 2020
kgs
per t
onne
inpu
t
Median Specific Carbon Usage
0.00
2.00
4.00
6.00
8.00
10.00
12.00
2016 2017 2018 2019 2020
kgs
per t
onne
inpu
t
Median Specific Lime Usage
0.00
0.50
1.00
1.50
2.00
2.50
2016 2017 2018 2019 2020
kgs
per t
onne
inpu
t
Median Specific Urea/NH3 Usage
UreaAmmonia
UK Energy from Waste Statistics - 2020
P a g e | 12 © Tolvik Consulting Ltd
Efficiency and R1
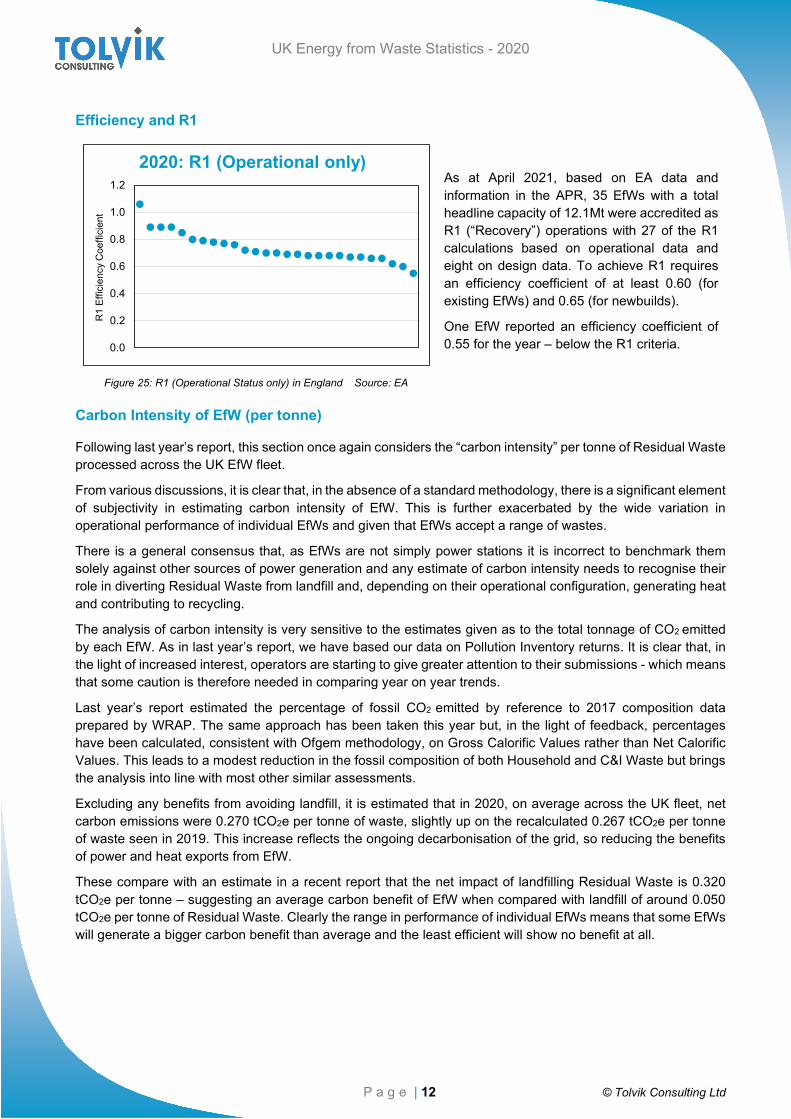
Figure 25: R1 (Operational Status only) in England Source: EA
As at April 2021, based on EA data and information in the APR, 35 EfWs with a total headline capacity of 12.1Mt were accredited as R1 (“Recovery”) operations with 27 of the R1 calculations based on operational data and eight on design data. To achieve R1 requires an efficiency coefficient of at least 0.60 (for existing EfWs) and 0.65 (for newbuilds).
One EfW reported an efficiency coefficient of 0.55 for the year – below the R1 criteria.
Carbon Intensity of EfW (per tonne)
Following last year’s report, this section once again considers the “carbon intensity” per tonne of Residual Waste processed across the UK EfW fleet.
From various discussions, it is clear that, in the absence of a standard methodology, there is a significant element of subjectivity in estimating carbon intensity of EfW. This is further exacerbated by the wide variation in operational performance of individual EfWs and given that EfWs accept a range of wastes.
There is a general consensus that, as EfWs are not simply power stations it is incorrect to benchmark them solely against other sources of power generation and any estimate of carbon intensity needs to recognise their role in diverting Residual Waste from landfill and, depending on their operational configuration, generating heat and contributing to recycling.
The analysis of carbon intensity is very sensitive to the estimates given as to the total tonnage of CO2 emitted by each EfW. As in last year’s report, we have based our data on Pollution Inventory returns. It is clear that, in the light of increased interest, operators are starting to give greater attention to their submissions - which means that some caution is therefore needed in comparing year on year trends.
Last year’s report estimated the percentage of fossil CO2 emitted by reference to 2017 composition data prepared by WRAP. The same approach has been taken this year but, in the light of feedback, percentages have been calculated, consistent with Ofgem methodology, on Gross Calorific Values rather than Net Calorific Values. This leads to a modest reduction in the fossil composition of both Household and C&I Waste but brings the analysis into line with most other similar assessments.
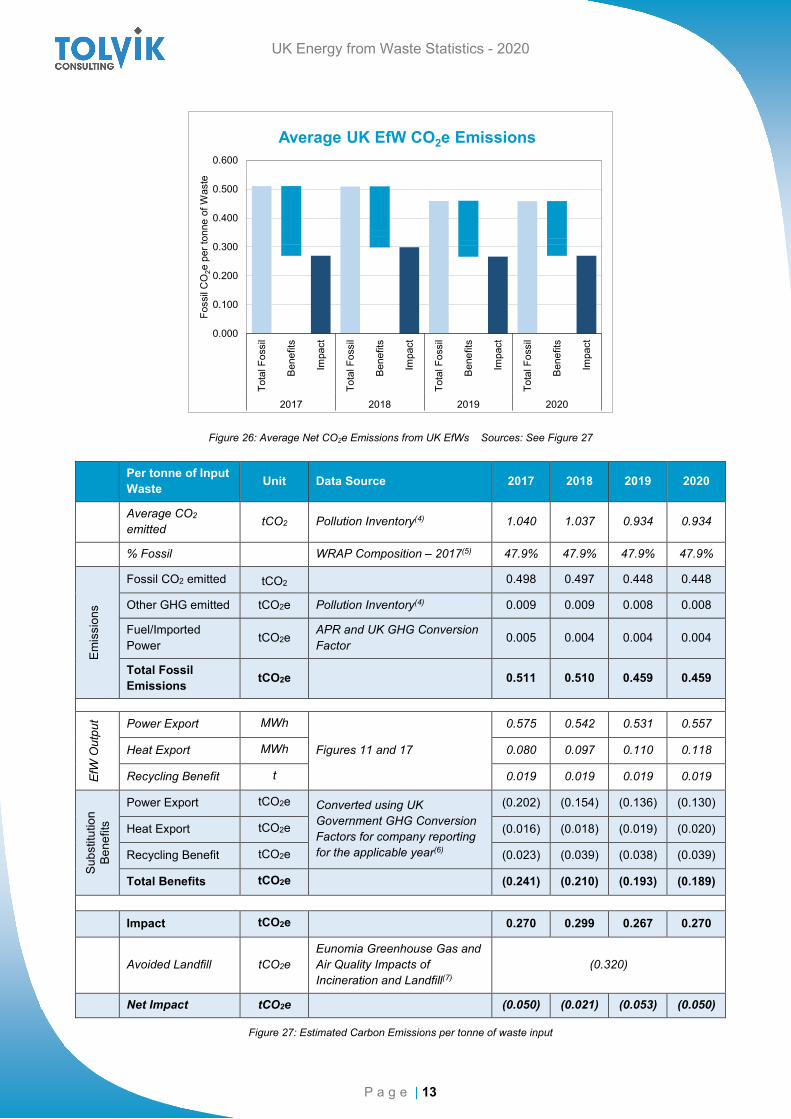
Excluding any benefits from avoiding landfill, it is estimated that in 2020, on average across the UK fleet, net carbon emissions were 0.270 tCO2e per tonne of waste, slightly up on the recalculated 0.267 tCO2e per tonne of waste seen in 2019. This increase reflects the ongoing decarbonisation of the grid, so reducing the benefits of power and heat exports from EfW.
These compare with an estimate in a recent report that the net impact of landfilling Residual Waste is 0.320 tCO2e per tonne – suggesting an average carbon benefit of EfW when compared with landfill of around 0.050 tCO2e per tonne of Residual Waste. Clearly the range in performance of individual EfWs means that some EfWs will generate a bigger carbon benefit than average and the least efficient will show no benefit at all.
0.0
0.2
0.4
0.6
0.8
1.0
1.2
R1
Effic
ienc
y C
oeffi
cien
t
2020: R1 (Operational only)
UK Energy from Waste Statistics - 2020
P a g e | 13
Figure 26: Average Net CO2e Emissions from UK EfWs Sources: See Figure 27
Per tonne of Input Waste Unit Data Source 2017 2018 2019 2020
Average CO2
emitted tCO2 Pollution Inventory(4) 1.040 1.037 0.934 0.934
% Fossil WRAP Composition – 2017(5) 47.9% 47.9% 47.9% 47.9%
Emis
sion
s
Fossil CO2 emitted tCO2 0.498 0.497 0.448 0.448
Other GHG emitted tCO2e Pollution Inventory(4) 0.009 0.009 0.008 0.008
Fuel/Imported Power tCO2e APR and UK GHG Conversion
Factor 0.005 0.004 0.004 0.004
Total Fossil Emissions tCO2e 0.511 0.510 0.459 0.459
EfW
Out
put Power Export MWh
Figures 11 and 17
0.575 0.542 0.531 0.557
Heat Export MWh 0.080 0.097 0.110 0.118
Recycling Benefit t 0.019 0.019 0.019 0.019
Subs
titut
ion
Bene
fits
Power Export tCO2e Converted using UK Government GHG Conversion Factors for company reporting for the applicable year(6)
(0.202) (0.154) (0.136) (0.130)
Heat Export tCO2e (0.016) (0.018) (0.019) (0.020)
Recycling Benefit tCO2e (0.023) (0.039) (0.038) (0.039)
Total Benefits tCO2e (0.241) (0.210) (0.193) (0.189)
Impact tCO2e 0.270 0.299 0.267 0.270
Avoided Landfill tCO2e
Eunomia Greenhouse Gas and Air Quality Impacts of Incineration and Landfill(7)
(0.320)
Net Impact tCO2e (0.050) (0.021) (0.053) (0.050)
Figure 27: Estimated Carbon Emissions per tonne of waste input
0.000
0.100
0.200
0.300
0.400
0.500
0.600
Tota
l Fos
sil
Bene
fits
Impa
ct
Tota
l Fos
sil
Bene
fits
Impa
ct
Tota
l Fos
sil
Bene
fits
Impa
ct
Tota
l Fos
sil
Bene
fits
Impa
ct
2017 2018 2019 2020
Foss
il C
O2e
per
tonn
e of
Was
te
Average UK EfW CO2e Emissions
UK Energy from Waste Statistics - 2020
P a g e | 14 © Tolvik Consulting Ltd
6. COMPLIANCE
Compliance in the EfW sector is a combination of operator self-monitoring, reporting to and monitoring by the relevant regulator.
EfWs, like most large industrial installations, are required under EU and UK law to monitor their emissions to air both continuously (on site) and periodically (by sample sent to an accredited laboratory). Emissions to water and composition of ash residues are also monitored at regular intervals.
Operators advise that measurement uncertainty, limits of detection for small samples and impact of background pollutant levels can all affect the analysis, but that the protocols used by the sector should be such that reported results are effectively a worst case.
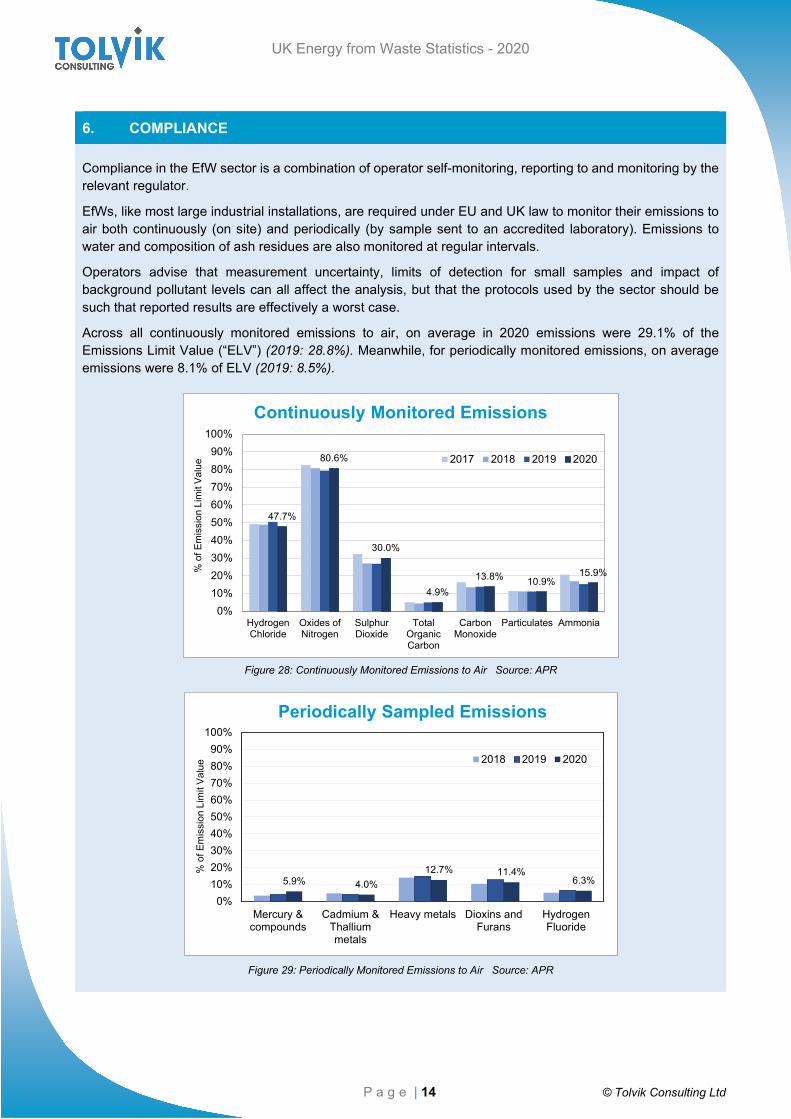
Across all continuously monitored emissions to air, on average in 2020 emissions were 29.1% of the Emissions Limit Value (“ELV”) (2019: 28.8%). Meanwhile, for periodically monitored emissions, on average emissions were 8.1% of ELV (2019: 8.5%).
Figure 28: Continuously Monitored Emissions to Air Source: APR
Figure 29: Periodically Monitored Emissions to Air Source: APR
47.7%
80.6%
30.0%
4.9%13.8% 10.9%
15.9%
0%10%20%30%40%50%60%70%80%90%
100%
HydrogenChloride
Oxides ofNitrogen
SulphurDioxide
TotalOrganicCarbon
CarbonMonoxide
Particulates Ammonia
% o
f Em
issi
on L
imit
Valu
e
Continuously Monitored Emissions
2017 2018 2019 2020
5.9% 4.0%12.7% 11.4%
6.3%
0%10%20%30%40%50%60%70%80%90%
100%
Mercury &compounds
Cadmium &Thalliummetals
Heavy metals Dioxins andFurans
HydrogenFluoride
% o
f Em
issi
on L
imit
Valu
e
Periodically Sampled Emissions
2018 2019 2020
UK Energy from Waste Statistics - 2020
P a g e | 15
It is to be noted that emission levels of Hydrogen Chloride (HCl), Sulphur Dioxide (SOx) and Oxides of Nitrogen (NOx) are controlled by the dosing rate of consumable reagents (see Section 5).
Typically in the UK, operators look to optimise resource consumption against achieving emissions levels within the specified ELV.
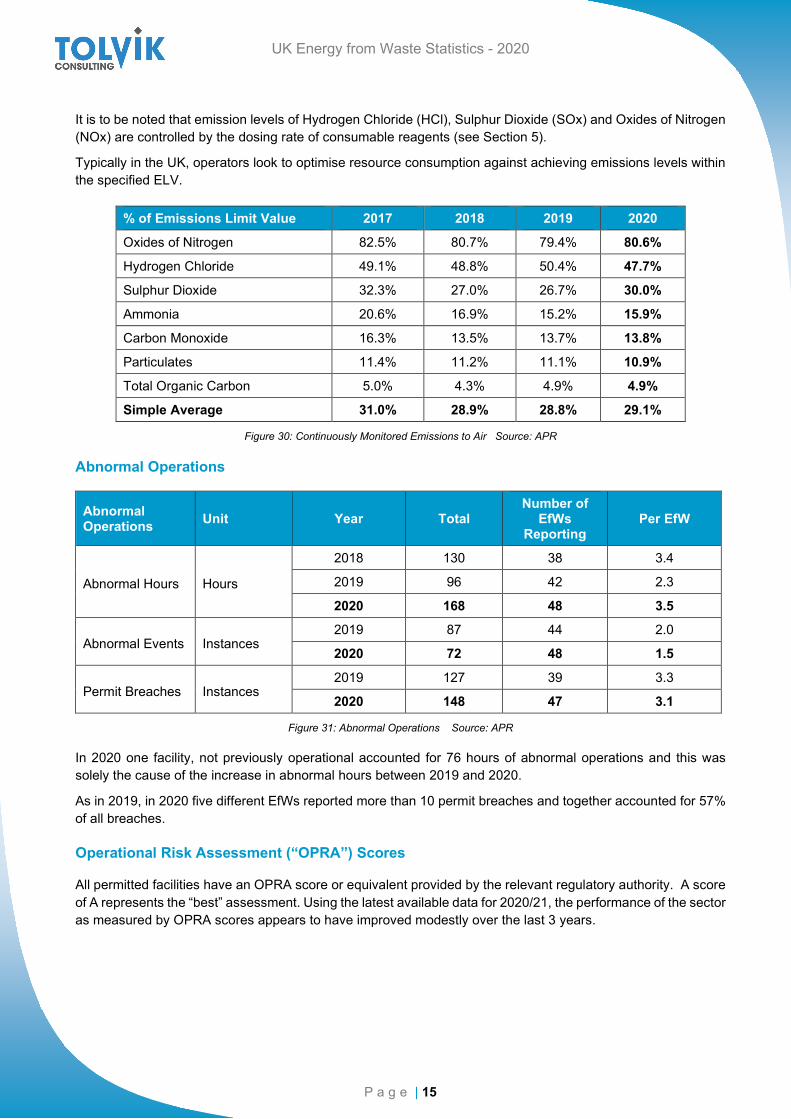
% of Emissions Limit Value 2017 2018 2019 2020
Oxides of Nitrogen 82.5% 80.7% 79.4% 80.6%
Hydrogen Chloride 49.1% 48.8% 50.4% 47.7%
Sulphur Dioxide 32.3% 27.0% 26.7% 30.0%
Ammonia 20.6% 16.9% 15.2% 15.9%
Carbon Monoxide 16.3% 13.5% 13.7% 13.8%
Particulates 11.4% 11.2% 11.1% 10.9%
Total Organic Carbon 5.0% 4.3% 4.9% 4.9%
Simple Average 31.0% 28.9% 28.8% 29.1%
Figure 30: Continuously Monitored Emissions to Air Source: APR
Abnormal Operations
Abnormal Operations Unit Year Total
Number of EfWs
Reporting Per EfW
Abnormal Hours Hours
2018 130 38 3.4
2019 96 42 2.3
2020 168 48 3.5
Abnormal Events Instances 2019 87 44 2.0
2020 72 48 1.5
Permit Breaches Instances 2019 127 39 3.3
2020 148 47 3.1
Figure 31: Abnormal Operations Source: APR
In 2020 one facility, not previously operational accounted for 76 hours of abnormal operations and this was solely the cause of the increase in abnormal hours between 2019 and 2020.
As in 2019, in 2020 five different EfWs reported more than 10 permit breaches and together accounted for 57% of all breaches.
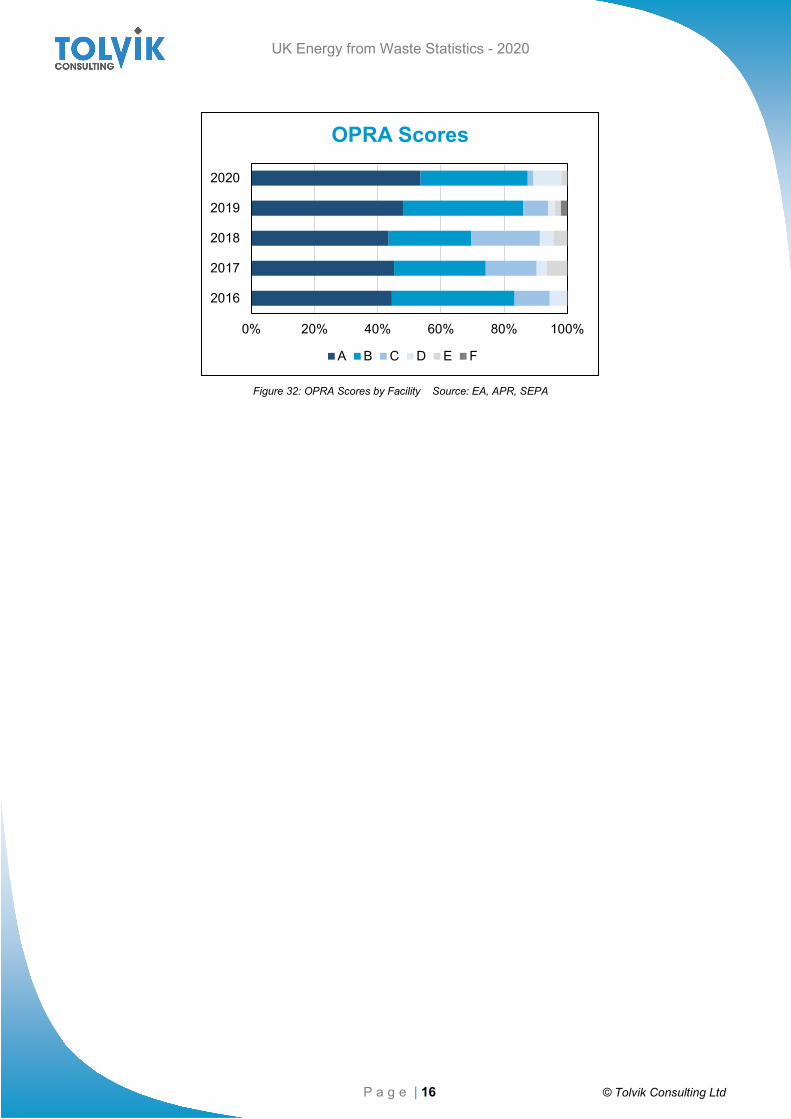
Operational Risk Assessment (“OPRA”) Scores
All permitted facilities have an OPRA score or equivalent provided by the relevant regulatory authority. A score of A represents the “best” assessment. Using the latest available data for 2020/21, the performance of the sector as measured by OPRA scores appears to have improved modestly over the last 3 years.
UK Energy from Waste Statistics - 2020
P a g e | 16 © Tolvik Consulting Ltd
Figure 32: OPRA Scores by Facility Source: EA, APR, SEPA
0% 20% 40% 60% 80% 100%
2016
2017
2018
2019
2020
OPRA Scores
A B C D E F
UK Energy from Waste Statistics - 2020
P a g e | 17
7. CAPACITY DEVELOPMENT
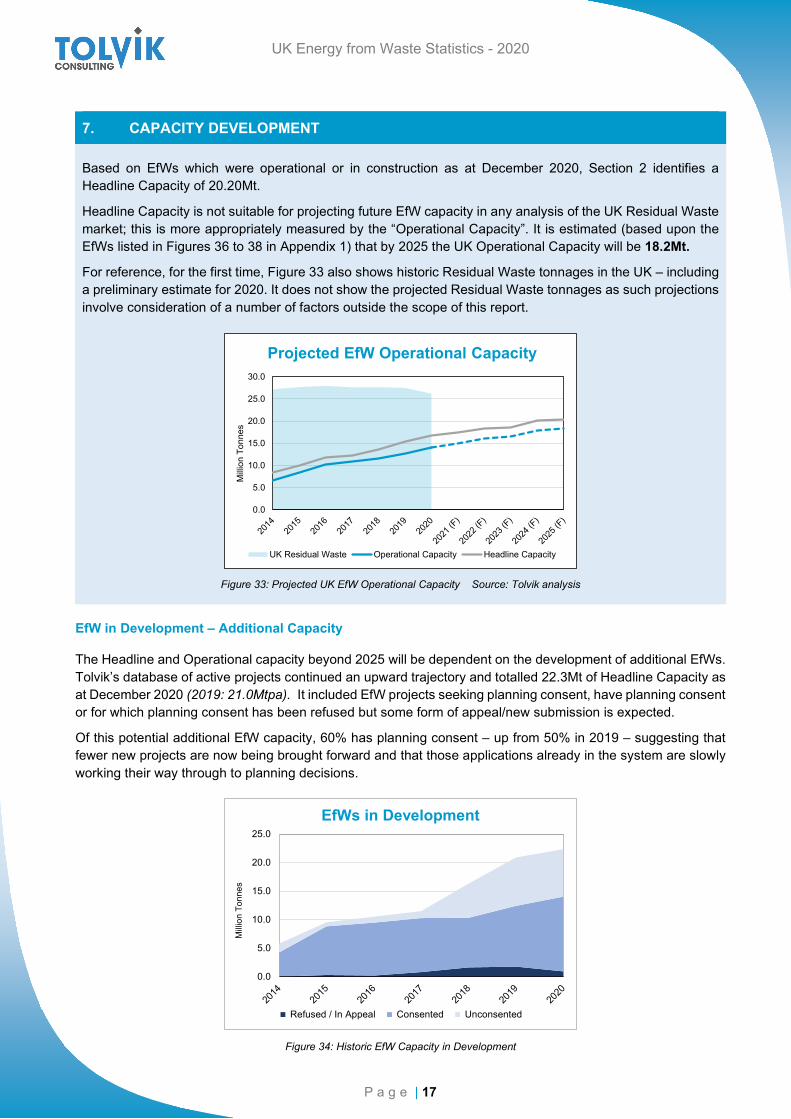
Based on EfWs which were operational or in construction as at December 2020, Section 2 identifies a Headline Capacity of 20.20Mt.
Headline Capacity is not suitable for projecting future EfW capacity in any analysis of the UK Residual Waste market; this is more appropriately measured by the “Operational Capacity”. It is estimated (based upon the EfWs listed in Figures 36 to 38 in Appendix 1) that by 2025 the UK Operational Capacity will be 18.2Mt.
For reference, for the first time, Figure 33 also shows historic Residual Waste tonnages in the UK – including a preliminary estimate for 2020. It does not show the projected Residual Waste tonnages as such projections involve consideration of a number of factors outside the scope of this report.
Figure 33: Projected UK EfW Operational Capacity Source: Tolvik analysis
EfW in Development – Additional Capacity
The Headline and Operational capacity beyond 2025 will be dependent on the development of additional EfWs. Tolvik’s database of active projects continued an upward trajectory and totalled 22.3Mt of Headline Capacity as at December 2020 (2019: 21.0Mtpa). It included EfW projects seeking planning consent, have planning consent or for which planning consent has been refused but some form of appeal/new submission is expected.
Of this potential additional EfW capacity, 60% has planning consent – up from 50% in 2019 – suggesting that fewer new projects are now being brought forward and that those applications already in the system are slowly working their way through to planning decisions.
Figure 34: Historic EfW Capacity in Development
0.0
5.0
10.0
15.0
20.0
25.0
30.0
Milli
on T
onne
s
Projected EfW Operational Capacity
UK Residual Waste Operational Capacity Headline Capacity
0.0
5.0
10.0
15.0
20.0
25.0
Milli
on T
onne
s
EfWs in Development
Refused / In Appeal Consented Unconsented
UK Energy from Waste Statistics - 2020
P a g e | 18 © Tolvik Consulting Ltd
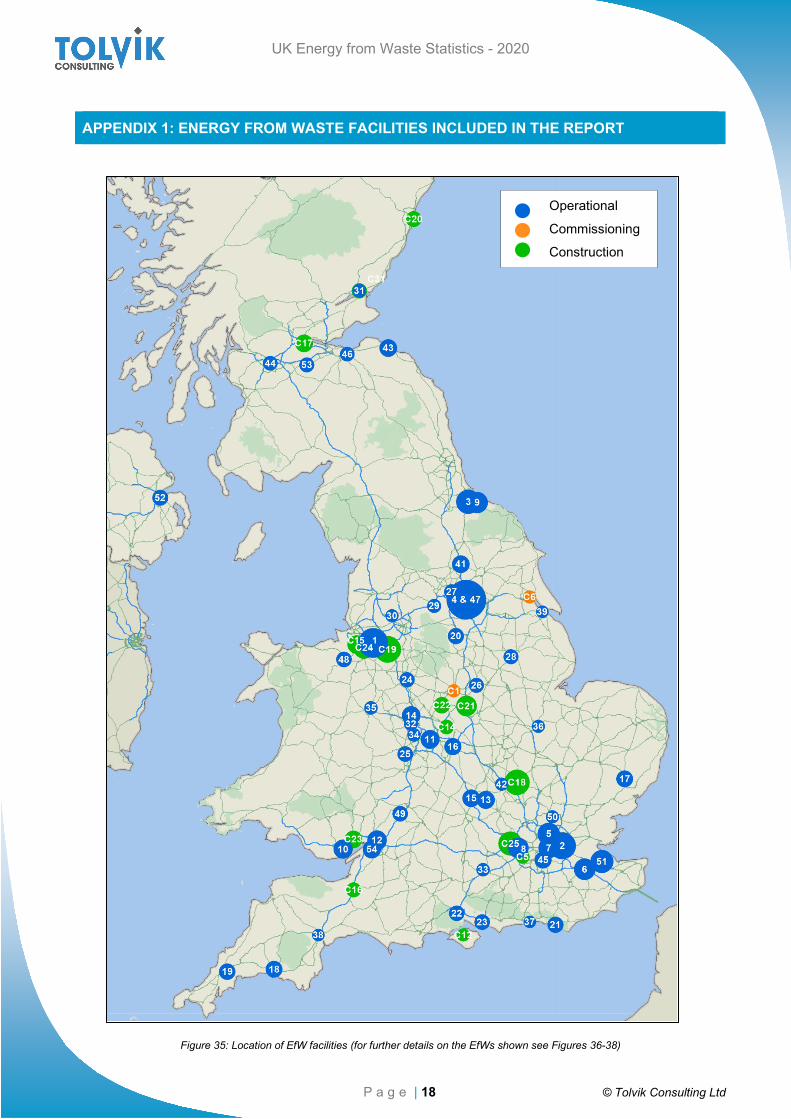
APPENDIX 1: ENERGY FROM WASTE FACILITIES INCLUDED IN THE REPORT
Figure 35: Location of EfW facilities (for further details on the EfWs shown see Figures 36-38)
12
Operational
Commissioning
Construction
C15 1
8

UK Energy from Waste Statistics - 2020
P a g e | 19
Operational EfWs
Figure 36: Operational EfWs in 2020 Source: APR
Please note, those highlighted blue were fully operational for part of the year only
CapacityPermitted Name Known As Location Operator (ktpa) 2018 2019 2020
1 Runcorn EfW Facility Runcorn Halton Viridor 1,100 884 962 9432 Riverside Resource Recovery Facility Riverside Bexley Cory 785 740 743 7313 Tees Valley - EfW Facility Tees Valley Stockton-on-Tees Suez 756 637 651 5824 Ferrybridge Multifuel 1 Ferrybridge FM1 Wakefield WTI 675 647 667 59947 Ferrybridge Multifuel 2 Ferrybridge FM2 Wakefield WTI 675 0 129 6155 EcoPark Energy Centre Edmonton Enfield Council 620 518 498 5426 Allington Waste Management Facility Allington Kent FCC 560 492 488 42351 Kemsley Park EfW Kemsley Kent WTI 550 4109 Wilton 11 EfW Wilton 11 Middlesborough Suez 500 467 448 4707 SELCHP ERF SELCHP Lewisham Veolia 464 441 439 3698 Lakeside EfW Lakeside Slough Lakeside 450 431 427 42010 Cardiff Energy Recovery Facility Trident Park Cardiff Viridor 425 376 366 37911 Tyseley ERF Tyseley Birmingham Veolia 400 343 343 36312 Severnside Energy Recovery Centre Severnside S.Gloucestershire Suez 425 377 397 41113 Greatmoor EfW Greatmoor Buckinghamshire FCC 345 308 295 30014 Staffordshire ERF Four Ashes Staffordshire Veolia 340 336 337 34015 Ardley EfW Facility Ardley Oxfordshire Viridor 326 290 280 29041 Allerton Waste Recovery Park Allerton Park North Yorkshire Amey 320 244 255 22716 CSWDC Waste to Energy Plant Coventry Coventry Council 315 289 299 31345 Beddington Energy Recovery Facility Beddington Lane Croydon Viridor 347 80 279 32254 Severn Road RRC Avonmouth Bristol Viridor 350 6843 Dunbar Energy Recovery Facility Dunbar East Lothian Viridor 325 40 251 32517 SUEZ Suffolk - EfW Facility Great Blakenham Suffolk Suez 295 264 267 29118 Devonport EfW CHP Facility Devonport Plymouth MVV 265 255 265 26120 Sheffield ERF Sheffield Sheffield Veolia 245 234 230 24021 Newhaven ERF Newhaven East Sussex Veolia 242 224 223 22919 Cornwall Energy Recovery Centre Cornwall Cornwall Suez 240 221 243 23725 EnviRecover EfW Facility Hartlebury Worcestershire Severn 230 200 201 21322 Integra South West ERF Marchwood Southampton Veolia 220 199 211 20423 Integra South East ERF Portsmouth Portsmouth Veolia 210 207 195 20524 Stoke EfW Facility Hanford Stoke-on-Trent MESE 210 186 179 18926 Eastcroft EfW Facility Eastcroft Nottingham FCC 200 177 188 19148 Parc Adfer ERF Parc Adfer Deeside WTI 200 0 58 19728 Lincolnshire EfW Facility North Hykeham Lincolnshire FCC 190 171 175 18546 Millerhill Recycling and ERC Millerhill Edinburgh FCC 190 16 142 15749 Javelin Park ERF Javelin Park Gloucestershire UBB 190 68 18327 Leeds Recycling and ERF Leeds Leeds Veolia 190 187 174 18253 Levenseat Renewable Energy Levenseat ACT West Lothian Outotec 180 20 50 (est)44 Glasgow RREC Polmadie ACT Glasgow Viridor 150 7 83 149 (est)29 Kirklees EfW Facility Kirklees Huddersfield Suez 150 124 134 12430 Bolton ERF Bolton Gtr Manchester Suez 120 29 76 5331 Baldovie Waste To Energy Plant Baldovie Dundee MVV 120 93 96 9252 Full Circle Generation EfW Belfast ACT Belfast Bouygues 120 34 7632 Wolverhampton EfW Facility Wolverhampton Wolverhampton MESE 118 110 114 11433 Integra North ERF Chineham Hampshire Veolia 110 93 94 9834 Dudley EfW Facility Dudley Dudley MESE 105 94 96 9835 Battlefield EfW Facility Battlefield Shropshire Veolia 102 96 99 9742 Milton Keynes Waste Recovery Park Milton Keynes ACT Milton Keynes Amey 94 27 58 6650 Hoddesdon EfW Plant Hoddesdon ACT Hertfordshire Bouygues 90 13 3936 Peterborough EfW Facility Peterborough Peterborough Viridor 85 81 80 8037 Enviropower Ltd, Lancing Lancing West Sussex Enviropower 75 60 55 6438 Exeter ERF Exeter Devon Viridor 60 58 58 6039 Integrated Waste Management Facility NewLincs NE Lincolnshire Tiru 56 51 51 5440 Energy Recovery Plant Gremista Shetland Islands Council 26 23 21 23
57 70 1316,131 11,488 12,626 13,957
Other EfWs in Commissioning but not achieved Takeover in 2020
Processed (ktpa)
Totals
UK Energy from Waste Statistics - 2020
P a g e | 20 © Tolvik Consulting Ltd
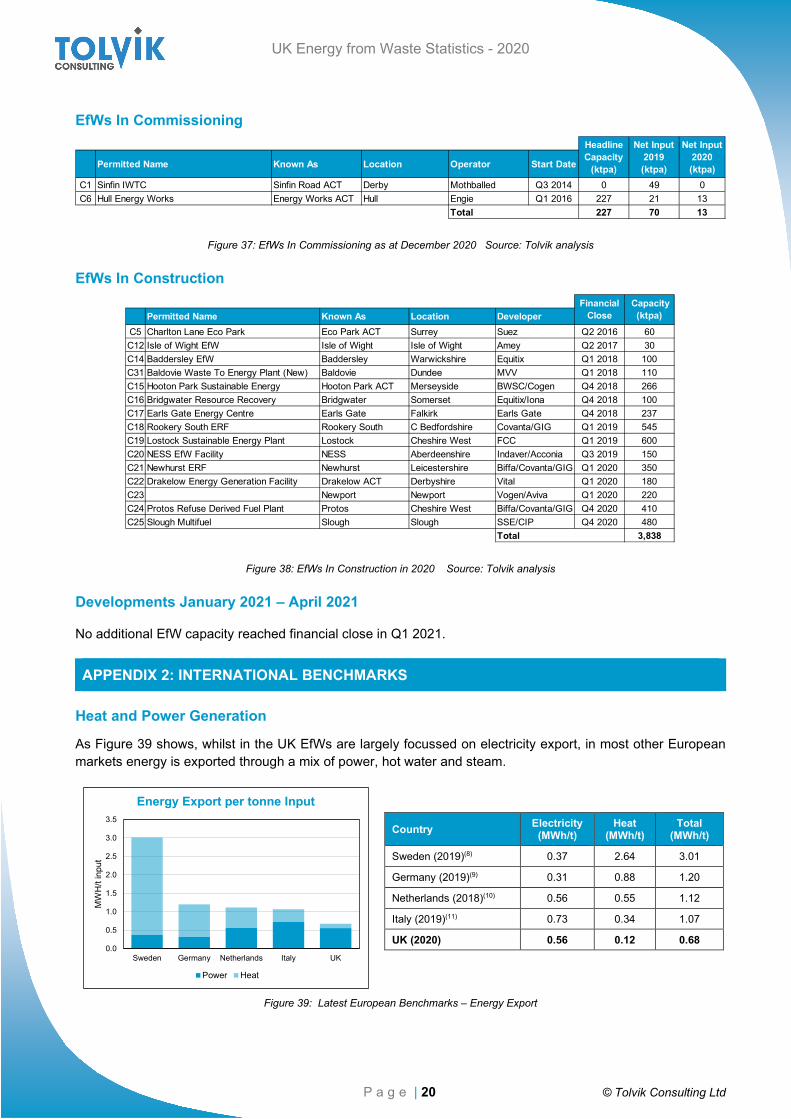
EfWs In Commissioning
Figure 37: EfWs In Commissioning as at December 2020 Source: Tolvik analysis
EfWs In Construction
Figure 38: EfWs In Construction in 2020 Source: Tolvik analysis
Developments January 2021 – April 2021
No additional EfW capacity reached financial close in Q1 2021.
APPENDIX 2: INTERNATIONAL BENCHMARKS
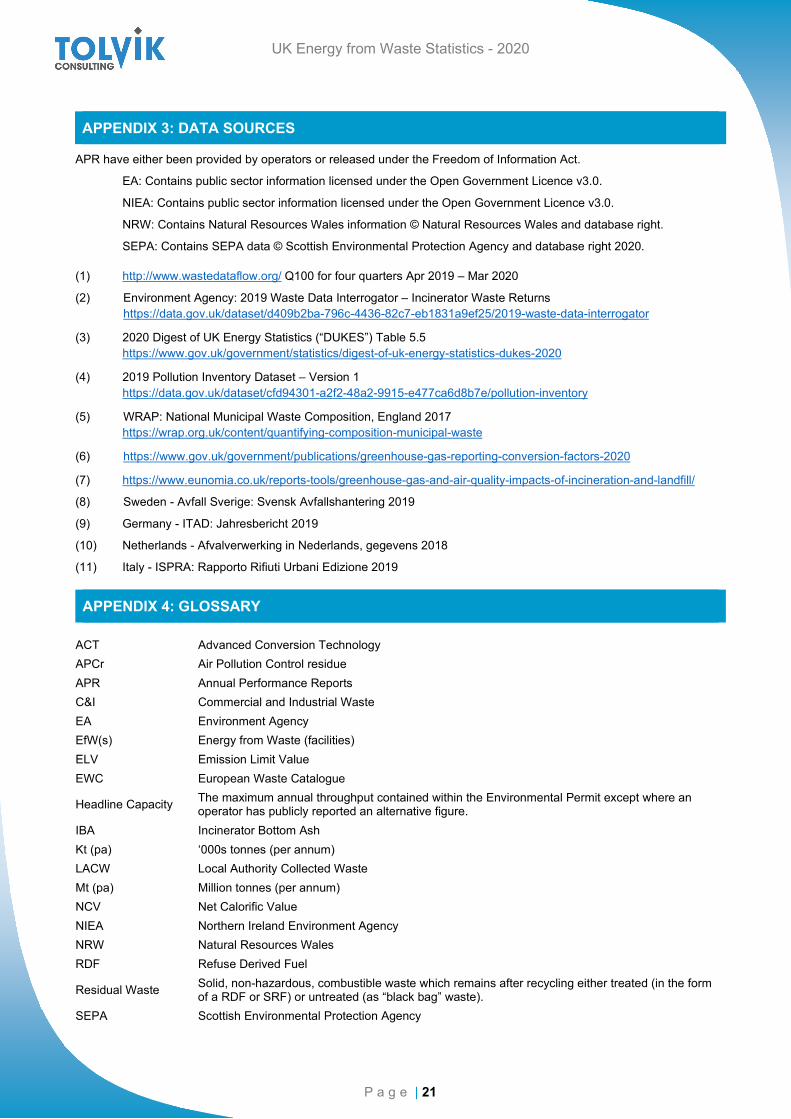
Heat and Power Generation
As Figure 39 shows, whilst in the UK EfWs are largely focussed on electricity export, in most other European markets energy is exported through a mix of power, hot water and steam.
Country Electricity (MWh/t)
Heat (MWh/t)
Total (MWh/t)
Sweden (2019)(8) 0.37 2.64 3.01
Germany (2019)(9) 0.31 0.88 1.20
Netherlands (2018)(10) 0.56 0.55 1.12
Italy (2019)(11) 0.73 0.34 1.07
UK (2020) 0.56 0.12 0.68
Figure 39: Latest European Benchmarks – Energy Export
Permitted Name Known As Location Operator Start Date
C1 Sinfin IWTC Sinfin Road ACT Derby Mothballed Q3 2014 0 49 0C6 Hull Energy Works Energy Works ACT Hull Engie Q1 2016 227 21 13
Total 227 70 13
Net Input 2020 (ktpa)
Net Input 2019 (ktpa)
Headline Capacity
(ktpa)
Permitted Name Known As Location DeveloperC5 Charlton Lane Eco Park Eco Park ACT Surrey Suez Q2 2016 60C12 Isle of Wight EfW Isle of Wight Isle of Wight Amey Q2 2017 30C14 Baddersley EfW Baddersley Warwickshire Equitix Q1 2018 100C31 Baldovie Waste To Energy Plant (New) Baldovie Dundee MVV Q1 2018 110C15 Hooton Park Sustainable Energy Hooton Park ACT Merseyside BWSC/Cogen Q4 2018 266C16 Bridgwater Resource Recovery Bridgwater Somerset Equitix/Iona Q4 2018 100C17 Earls Gate Energy Centre Earls Gate Falkirk Earls Gate Q4 2018 237C18 Rookery South ERF Rookery South C Bedfordshire Covanta/GIG Q1 2019 545C19 Lostock Sustainable Energy Plant Lostock Cheshire West FCC Q1 2019 600C20 NESS EfW Facility NESS Aberdeenshire Indaver/Acconia Q3 2019 150C21 Newhurst ERF Newhurst Leicestershire Biffa/Covanta/GIG Q1 2020 350C22 Drakelow Energy Generation Facility Drakelow ACT Derbyshire Vital Q1 2020 180C23 Newport Newport Vogen/Aviva Q1 2020 220C24 Protos Refuse Derived Fuel Plant Protos Cheshire West Biffa/Covanta/GIG Q4 2020 410C25 Slough Multifuel Slough Slough SSE/CIP Q4 2020 480
3,838
Financial Close
Total
Capacity (ktpa)
0.0
0.5
1.0
1.5
2.0
2.5
3.0
3.5
Sweden Germany Netherlands Italy UK
MW
H/t
inpu
t
Energy Export per tonne Input
Power Heat
UK Energy from Waste Statistics - 2020
P a g e | 21
APPENDIX 3: DATA SOURCES
APR have either been provided by operators or released under the Freedom of Information Act.
EA: Contains public sector information licensed under the Open Government Licence v3.0.
NIEA: Contains public sector information licensed under the Open Government Licence v3.0.
NRW: Contains Natural Resources Wales information © Natural Resources Wales and database right.
SEPA: Contains SEPA data © Scottish Environmental Protection Agency and database right 2020.
(1) http://www.wastedataflow.org/ Q100 for four quarters Apr 2019 – Mar 2020
(2) Environment Agency: 2019 Waste Data Interrogator – Incinerator Waste Returns https://data.gov.uk/dataset/d409b2ba-796c-4436-82c7-eb1831a9ef25/2019-waste-data-interrogator
(3) 2020 Digest of UK Energy Statistics (“DUKES”) Table 5.5 https://www.gov.uk/government/statistics/digest-of-uk-energy-statistics-dukes-2020
(4) 2019 Pollution Inventory Dataset – Version 1 https://data.gov.uk/dataset/cfd94301-a2f2-48a2-9915-e477ca6d8b7e/pollution-inventory
(5) WRAP: National Municipal Waste Composition, England 2017 https://wrap.org.uk/content/quantifying-composition-municipal-waste
(6) https://www.gov.uk/government/publications/greenhouse-gas-reporting-conversion-factors-2020
(7) https://www.eunomia.co.uk/reports-tools/greenhouse-gas-and-air-quality-impacts-of-incineration-and-landfill/
(8) Sweden - Avfall Sverige: Svensk Avfallshantering 2019
(9) Germany - ITAD: Jahresbericht 2019
(10) Netherlands - Afvalverwerking in Nederlands, gegevens 2018
(11) Italy - ISPRA: Rapporto Rifiuti Urbani Edizione 2019
APPENDIX 4: GLOSSARY
ACT Advanced Conversion Technology APCr Air Pollution Control residue APR Annual Performance Reports C&I Commercial and Industrial Waste EA Environment Agency EfW(s) Energy from Waste (facilities) ELV Emission Limit Value EWC European Waste Catalogue
Headline Capacity The maximum annual throughput contained within the Environmental Permit except where an operator has publicly reported an alternative figure.
IBA Incinerator Bottom Ash Kt (pa) ‘000s tonnes (per annum) LACW Local Authority Collected Waste Mt (pa) Million tonnes (per annum) NCV Net Calorific Value NIEA Northern Ireland Environment Agency NRW Natural Resources Wales RDF Refuse Derived Fuel
Residual Waste Solid, non-hazardous, combustible waste which remains after recycling either treated (in the form of a RDF or SRF) or untreated (as “black bag” waste).
SEPA Scottish Environmental Protection Agency

Tolvik Consulting Limited, The Old Vicarage, Fairmead, Cam, Dursley, Gloucestershire GL11 5JR
Tel: +44 (0)1453 519048 Email: [email protected]
www.tolvik.com
Tolvik Consulting Ltd is a privately-owned specialist provider of independent market analysis, commercial due diligence and advisory services across the waste and biomass sectors.
Our clients include the UK’s leading waste companies, project finance investors, developers and equity investors.
Adrian Judge
Chris Jonas
This report has been written by Tolvik Consulting Ltd on an independent basis using our knowledge of the current UK waste market and with reference inter alia to various published reports and studies and to our own in-house analysis.
This report has been prepared by Tolvik Consulting Ltd with all reasonable skill, care and diligence as applicable. Whilst we have taken reasonable precautions to check the accuracy of information contained herein, we do not warrant the accuracy of information provided.
Sally Freshwater