
Statistics for Action Hazardous Waste: Containing the Danger
16
© 2011 TERC • Statistics for Action Statistics for Action Hazardous Waste: Containing the Danger DRAFT Table of Contents Introduction to the Guide What’s Here .................................................................................................................. 3 Introduction to Hazardous Waste Cleanups .................................................................. 4 Terms You May Run Across ........................................................................................... 5 A Sneak Preview ............................................................................................................ 6 Testing and More Expressing Concerns: Two Stories.................................................................................. 7 Reviewing Cleanup Options.......................................................................................... 8 Setting Cleanup Objectives .......................................................................................... 9 Checking Progress ...................................................................................................... 10 Comparing and Analyzing .......................................................................................... 11 Ongoing Reporting to the Community ....................................................................... 13 Additional Testing ...................................................................................................... 14 Publicizing the Results ................................................................................................ 15 Appendix Resources .................................................................................................................... 16
Transcript of Statistics for Action Hazardous Waste: Containing the Danger
© 2011 TERC • Statistics for Action
Statistics for Action Hazardous Waste:
Containing the Danger
DRAFT
Table of Contents
Introduction to the GuideWhat’s Here .................................................................................................................. 3Introduction to Hazardous Waste Cleanups .................................................................. 4Terms You May Run Across ........................................................................................... 5A Sneak Preview ............................................................................................................ 6
Testing and MoreExpressing Concerns: Two Stories .................................................................................. 7Reviewing Cleanup Options .......................................................................................... 8Setting Cleanup Objectives .......................................................................................... 9Checking Progress ...................................................................................................... 10Comparing and Analyzing .......................................................................................... 11Ongoing Reporting to the Community ....................................................................... 13Additional Testing ...................................................................................................... 14Publicizing the Results ................................................................................................ 15
AppendixResources .................................................................................................................... 16
Acknowledgments
Contributors include Andrew Friedmann
Jim LukerMartha Merson
Ethan Contini-Field
Prepared in collaboration with Toxics Action Center, Blue Ridge Environmental Defense League, Little Village Environmental Justice Organization, Operation Green Leaves, Pesticide Watch, New England Literacy Resource Center. With thanks to Statistics for Action advisors Beth Bingman, AppalShop, Inc.; Andrew Friedmann, Mass Department of Environmental Protection; Joan Gancarski, Massachusetts Department of Public Health; Alexander Goldowsky, The EcoTarium; Marlene Kliman, TERC; Jim Luker, Green Seal Environmental; Madeleine Kangsen Scammell, Boston University School of Public Health, Dept. of Environmental Health.
© 2011 TERC. This material is based on work at TERC funded in part and supported by the National Science Foundation under Grant No. 0812954. Any opinions, findings, and conclusions or recommendations expressed in this material are those of the authors and do not necessarily reflect the views of the National Science Foundation.
© 2011 TERC • Statistics for Action DRAFT 3
SfA Hazardous Waste Guide: Containing the Danger
What’s here
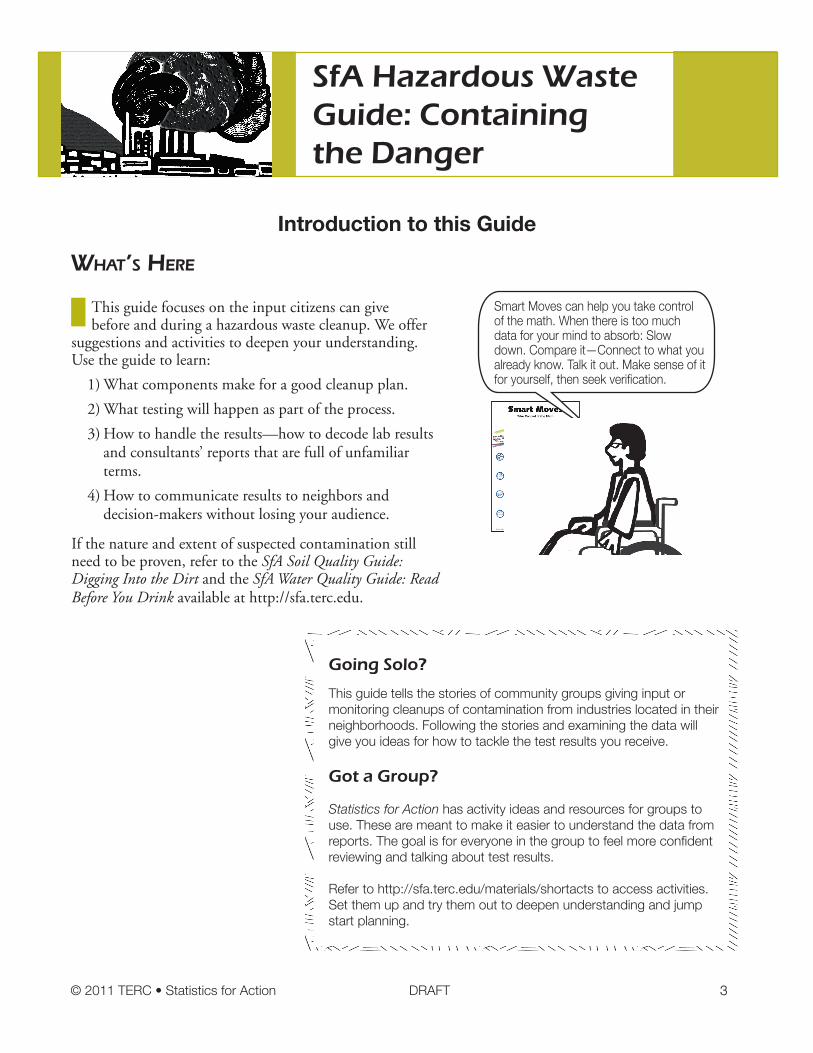
This guide focuses on the input citizens can give before and during a hazardous waste cleanup. We offer
suggestions and activities to deepen your understanding. Use the guide to learn:
1) What components make for a good cleanup plan.
2) What testing will happen as part of the process.
3) How to handle the results—how to decode lab results and consultants’ reports that are full of unfamiliar terms.
4) How to communicate results to neighbors and decision-makers without losing your audience.
If the nature and extent of suspected contamination still need to be proven, refer to the SfA Soil Quality Guide: Digging Into the Dirt and the SfA Water Quality Guide: Read Before You Drink available at http://sfa.terc.edu.
Introduction to this Guide
Going Solo?
This guide tells the stories of community groups giving input or monitoring cleanups of contamination from industries located in their neighborhoods. Following the stories and examining the data will give you ideas for how to tackle the test results you receive.
Got a Group?
Statistics for Action has activity ideas and resources for groups to use. These are meant to make it easier to understand the data from reports. The goal is for everyone in the group to feel more confident reviewing and talking about test results.
Refer to http://sfa.terc.edu/materials/shortacts to access activities. Set them up and try them out to deepen understanding and jump start planning.
Smart Moves can help you take control of the math. When there is too much data for your mind to absorb: Slow down. Compare it—Connect to what you already know. Talk it out. Make sense of it for yourself, then seek verification.
4 DRAFT © 2011 TERC • Statistics for Action
SfA Hazardous Waste Guide: Containing the Danger
IntroductIon: Why does It take so long?
Prior to any cleanup, environmental tests should establish the extent of contamination. The cleanup plan should include not only the site where the problem started but also any backyards, streams, ponds, fields, state-owned , city, schools or property that have been contaminated.
Deciding on a cleanup plan can take years. The parties involved have to agree on:
•Who is responsible;
•Who will pay;
•How extensive the cleanup will be.
The government has not set legal limits for every chemical in use. If there are no standards in place, it will take time to research and arrive at and agree on acceptable levels.
The current and past owners of the site, the community, and regulators at the county, state, or federal level will have their own ways of looking at the problem, including liability, safety, and legality.
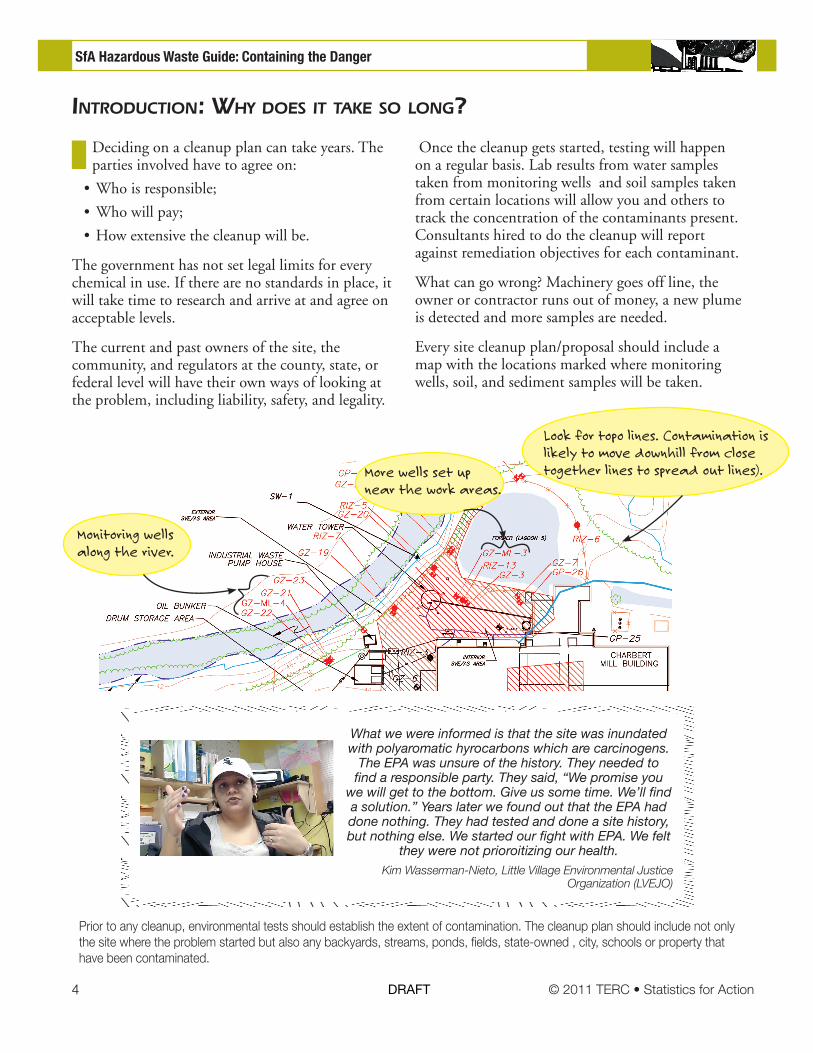
Once the cleanup gets started, testing will happen on a regular basis. Lab results from water samples taken from monitoring wells and soil samples taken from certain locations will allow you and others to track the concentration of the contaminants present. Consultants hired to do the cleanup will report against remediation objectives for each contaminant.
What can go wrong? Machinery goes off line, the owner or contractor runs out of money, a new plume is detected and more samples are needed.
Every site cleanup plan/proposal should include a map with the locations marked where monitoring wells, soil, and sediment samples will be taken.
What we were informed is that the site was inundated with polyaromatic hyrocarbons which are carcinogens.
The EPA was unsure of the history. They needed to find a responsible party. They said, “We promise you
we will get to the bottom. Give us some time. We’ll find a solution.” Years later we found out that the EPA had done nothing. They had tested and done a site history, but nothing else. We started our fight with EPA. We felt
they were not prioroitizing our health. Kim Wasserman-Nieto, Little Village Environmental Justice
Organization (LVEJO)
Monitoring wells along the river.
More wells set up near the work areas.
Look for topo lines. Contamination is likely to move downhill from close together lines to spread out lines).
© 2011 TERC • Statistics for Action DRAFT 5
SfA Hazardous Waste Guide: Containing the Danger
terms you may run across
Background LevelThe level of a contaminant that either occurs naturally, or is spread evenly across a large geographic area. If you want to know if contamination levels are unusually high, compare them to background levels, not zero.
ConcentrationThe strength of a chemical in a liquid. For example, the amount of flouride in a liter of water.
ContaminantChemical solvents, metals, and neurotoxins that can make water unsafe for humans and animals exposed to it.
Detection limitThe limits of a given scale.When a bathroom scale tops out, it can’t distinguish between the weight of two men and ten men (if they could all fit). Similarly, the amount of a contaminant is sometimes too small to be detected with the lab’s equipment.
FeasibilityHow easy it is to do something. A cleanup plan might not be feasible if it would be very expensive, or take many years, or require many people moving away.
ND Not detected. Reports state “ND” when the amount of a contaminant is too small to be measured with the lab test used.
NTNot tested.
NS/NLNo Standard / No Level has been defined for this contaminant.
PpbParts per billion; another way to express micrograms per kilogram. Micrograms are 1,000 times smaller than a milligram and kilograms are 1,000,000 times larger, so a microgram is a billion times smaller than a kilogram.
PpmParts per million; another way to express milligrams per liter or milligrams per kilogram.
Plume Pollution that is spreading from a spill or release.
Preventative Action Limit A contamination level that is safe, but is high enough so that action needs to be taken to prevent it from going higher. Usually it is half or a tenth of a legal limit.
RegulatorsGovernment employees who enforce environmental laws, and make decisions about cleanups.
Remediation Cleaning up damage done to the environment.
Remediation Objective The goal of a cleanup. This might be to get contamination down below a certain level.
Reporting LimitThe lowest weight at which an instrument is accurate.
Risk Assessment A long process in which scientists find out where the contamination is, how much of it there is, and how and when people might come into contact with the contamination. All these factors affect risk to people’s health.
SampleA small part of something that may tell you about something larger. If you take a soil sample from a field and find contamination in the sample, you may find contamination in other places in the field, too.
We educated ourselves. We had definitions for everyone.
Every technical term we came across, we shared and defined.
—Kim Wasserman-Nieto, LVEJO

6 DRAFT © 2011 TERC • Statistics for Action
SfA Hazardous Waste Guide: Containing the Danger
Contamination above the Preventive Action Limit requires attention. This level is the target for cleanup.
If the lab’s instrument can detect the concentration level, the amount appears with a number. If none is detected, you will see < or ND.
Name of well. See map for location.
sneak PrevIeW: What you mIght see on a results Page
How deep the well is. (Below Ground Surface)
Below this amount, the lab instrument cannot detect the contaminant.
Often, making your own graph will help you see a trend.
0
50
100
150
200
250
300
350
400
1/2/08 4/1/08 7/7/08 10/1/08 1/5/09
ND?
ND?
Trichloroethene Tetrachloroethene
0
50
100
150
200
250
300
350
400
Consultants will present charts from lab results for chemicals over the Preventitive Action Limit (PAL). Read the chart to learn how high contaminant levels were on testing days.
© 2011 TERC • Statistics for Action DRAFT 7
SfA Hazardous Waste Guide: Containing the Danger
Talk to others
Invite neighbors and others in the community to meetings where you share ideas for how the
site could be used in the future. Form a group. Then explain to decisionmakers how the community wants to use the site in the future. The site’s future use will determine the methods and remediation objectives. In any case, the cleanup should:
P Remove or contain contaminants
P Protect human and ecological health from future harm
P Prevent human contact with contaminated air, soil, and water
Clarify that the cleanup is NOT likely to:
2 Restore the land or water to pristine conditions
2 Reverse health effects
2 Provide money for treating people with health problems associated with the contamination.
exPressIng concerns: tWo storIes
The wastewater lagoons on Charbert Dye Company’s land in Alton, Rhode Island, were
the size of football fields. They gave off fumes that caused headaches, nausea, and breathing problems.
Neighbors of Charbert Dye Company formed a group called Alton Community Action. Testing drinking water wells was a priority. Once high levels of TCE were found, the Department of Public Health recommended that Charbert’s neighbors stop using well water for drinking, cooking, or bathing infants.
Working with the state to get Charbert Dye Company to clean up its operations was a slow process. Then Charbert shut down operations in and hired GZA Environmental to conduct a cleanup. GZA submits quarterly reports, but it will take years to bring down the contaminant levels. ACA members suspect Charbert will sell the land and wonder who will buy it and for what purpose. Meanwhile, some people are asking for a safe source of tap water.
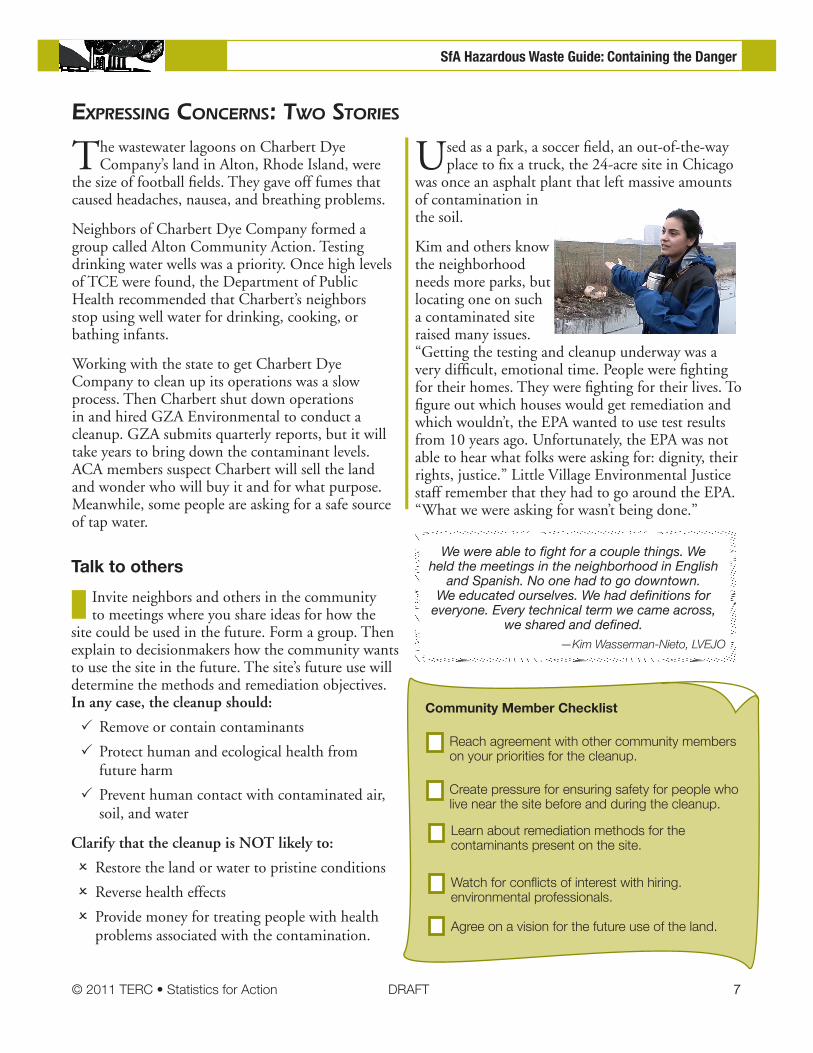
Used as a park, a soccer field, an out-of-the-way place to fix a truck, the 24-acre site in Chicago
was once an asphalt plant that left massive amounts of contamination in the soil.
Kim and others know the neighborhood needs more parks, but locating one on such a contaminated site raised many issues. “Getting the testing and cleanup underway was a very difficult, emotional time. People were fighting for their homes. They were fighting for their lives. To figure out which houses would get remediation and which wouldn’t, the EPA wanted to use test results from 10 years ago. Unfortunately, the EPA was not able to hear what folks were asking for: dignity, their rights, justice.” Little Village Environmental Justice staff remember that they had to go around the EPA. “What we were asking for wasn’t being done.”
Community Member Checklist
Reach agreement with other community members on your priorities for the cleanup.
Create pressure for ensuring safety for people who live near the site before and during the cleanup.
Learn about remediation methods for the contaminants present on the site.
Watch for conflicts of interest with hiring. environmental professionals.
Agree on a vision for the future use of the land.
We were able to fight for a couple things. We held the meetings in the neighborhood in English
and Spanish. No one had to go downtown. We educated ourselves. We had definitions for
everyone. Every technical term we came across, we shared and defined.
—Kim Wasserman-Nieto, LVEJO
8 DRAFT © 2011 TERC • Statistics for Action
SfA Hazardous Waste Guide: Containing the Danger
revIeWIng cleanuP oPtIons
Formulate questions and a recommendation
List specific questions. Do the research and make the contacts to get the answers that will help your
group make a recommendation.
Based on the information you have, formulate your recommendation for the best cleanup option.
In Chicago, the residents of the Little Village neighborhood met and decided that they wanted the contaminated site capped. The community said:
Where are they going to put that soil? Are we going to follow everytruck that leaves the site? How are we going to know that the dump or landfill or wherever they’re going isn’t going to leach out to another community? We prefer to know that it’s in the ground and that it’s not going anywhere and that it’s not going to affect anyone else.
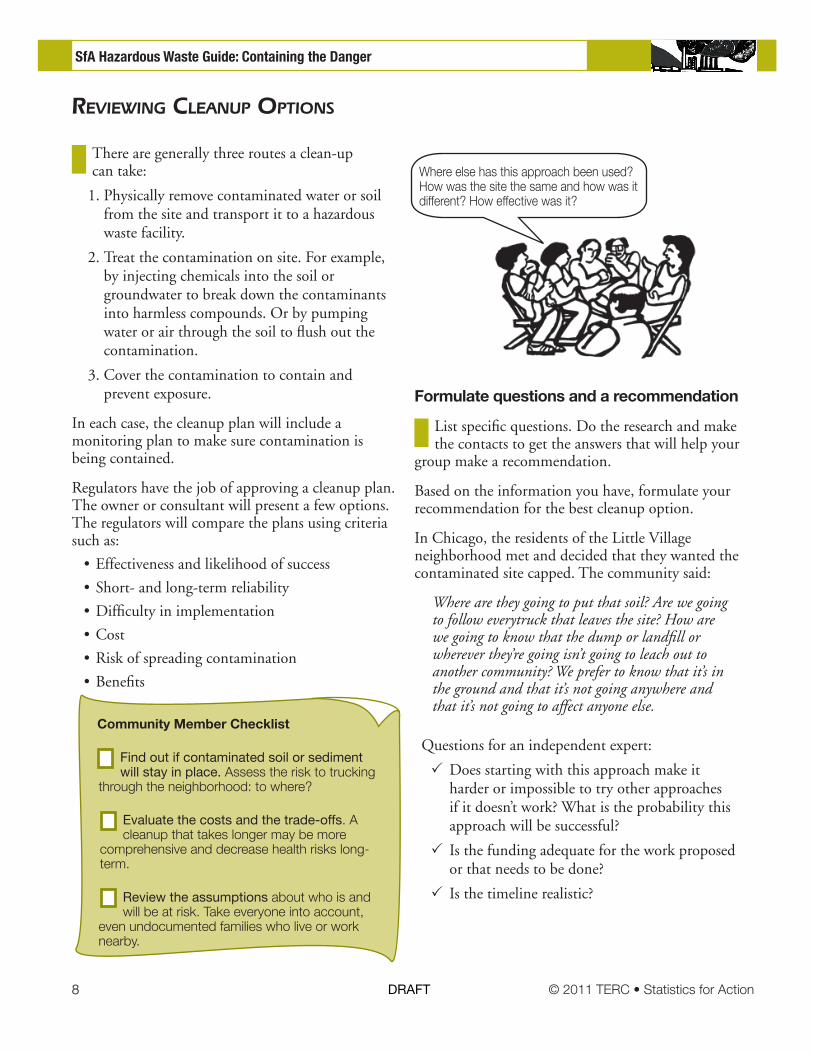
Where else has this approach been used? How was the site the same and how was it different? How effective was it?
There are generally three routes a clean-up can take:
1. Physically remove contaminated water or soil from the site and transport it to a hazardous waste facility.
2. Treat the contamination on site. For example, by injecting chemicals into the soil or groundwater to break down the contaminants into harmless compounds. Or by pumping water or air through the soil to flush out the contamination.
3. Cover the contamination to contain and prevent exposure.
In each case, the cleanup plan will include a monitoring plan to make sure contamination is being contained.
Regulators have the job of approving a cleanup plan. The owner or consultant will present a few options. The regulators will compare the plans using criteria such as:
•Effectiveness and likelihood of success
•Short- and long-term reliability
•Difficulty in implementation
•Cost
•Risk of spreading contamination
•Benefits
Questions for an independent expert:
P Does starting with this approach make it harder or impossible to try other approaches if it doesn’t work? What is the probability this approach will be successful?
P Is the funding adequate for the work proposed or that needs to be done?
P Is the timeline realistic?
Community Member Checklist
Find out if contaminated soil or sediment will stay in place. Assess the risk to trucking
through the neighborhood: to where?
Evaluate the costs and the trade-offs. A cleanup that takes longer may be more
comprehensive and decrease health risks long-term.
Review the assumptions about who is and will be at risk. Take everyone into account,
even undocumented families who live or work nearby.
© 2011 TERC • Statistics for Action DRAFT 9
SfA Hazardous Waste Guide: Containing the Danger
settIng cleanuP objectIves
Most states have published remediation objectives, the allowable levels of contamination for residential and industrial properties. Is this the best that communities can do? Not necessarily.
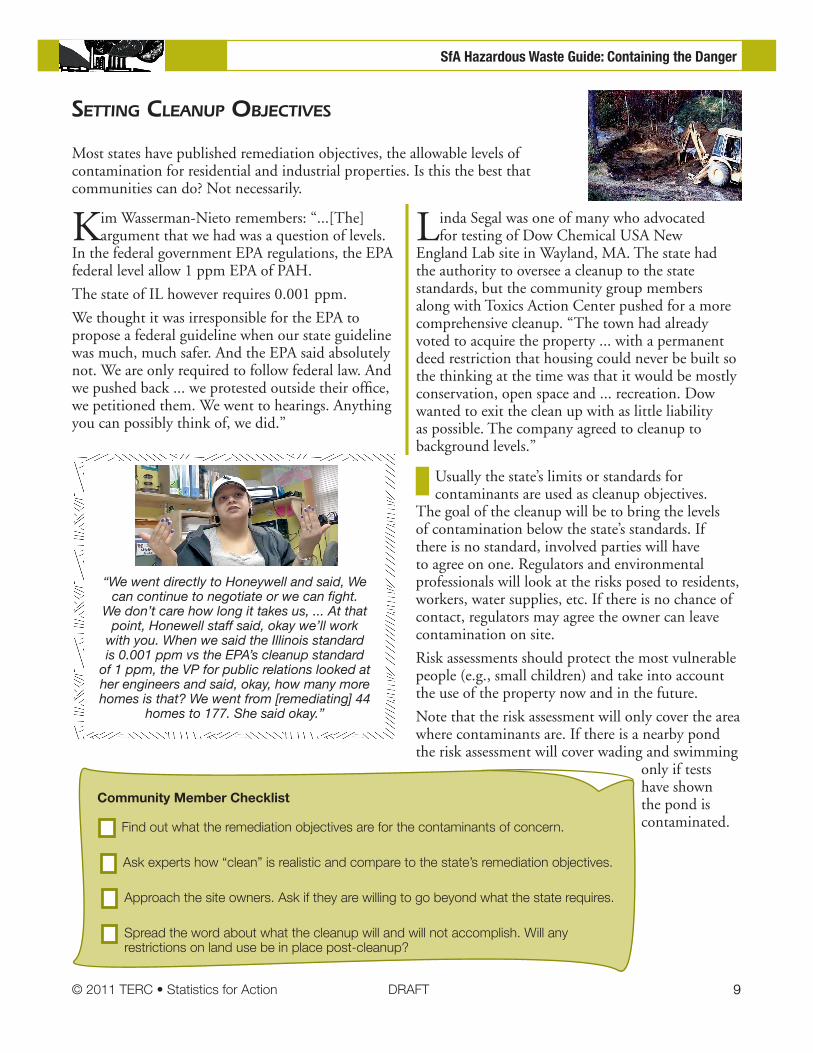
Kim Wasserman-Nieto remembers: “...[The] argument that we had was a question of levels.
In the federal government EPA regulations, the EPA federal level allow 1 ppm EPA of PAH.
The state of IL however requires 0.001 ppm.
We thought it was irresponsible for the EPA to propose a federal guideline when our state guideline was much, much safer. And the EPA said absolutely not. We are only required to follow federal law. And we pushed back ... we protested outside their office, we petitioned them. We went to hearings. Anything you can possibly think of, we did.”
Linda Segal was one of many who advocated for testing of Dow Chemical USA New
England Lab site in Wayland, MA. The state had the authority to oversee a cleanup to the state standards, but the community group members along with Toxics Action Center pushed for a more comprehensive cleanup. “The town had already voted to acquire the property ... with a permanent deed restriction that housing could never be built so the thinking at the time was that it would be mostly conservation, open space and ... recreation. Dow wanted to exit the clean up with as little liability as possible. The company agreed to cleanup to background levels.”
Usually the state’s limits or standards for contaminants are used as cleanup objectives.
The goal of the cleanup will be to bring the levels of contamination below the state’s standards. If there is no standard, involved parties will have to agree on one. Regulators and environmental professionals will look at the risks posed to residents, workers, water supplies, etc. If there is no chance of contact, regulators may agree the owner can leave contamination on site.
Risk assessments should protect the most vulnerable people (e.g., small children) and take into account the use of the property now and in the future.
Note that the risk assessment will only cover the area where contaminants are. If there is a nearby pond the risk assessment will cover wading and swimming
only if tests have shown the pond is contaminated.
Community Member Checklist
Find out what the remediation objectives are for the contaminants of concern.
Ask experts how “clean” is realistic and compare to the state’s remediation objectives.
Approach the site owners. Ask if they are willing to go beyond what the state requires.
Spread the word about what the cleanup will and will not accomplish. Will any restrictions on land use be in place post-cleanup?
“We went directly to Honeywell and said, We can continue to negotiate or we can fight.
We don’t care how long it takes us, ... At that point, Honewell staff said, okay we’ll work
with you. When we said the Illinois standard is 0.001 ppm vs the EPA’s cleanup standard
of 1 ppm, the VP for public relations looked at her engineers and said, okay, how many more homes is that? We went from [remediating] 44
homes to 177. She said okay.”
10 DRAFT © 2011 TERC • Statistics for Action
SfA Hazardous Waste Guide: Containing the Danger
During the cleanup, crews should be testing air and water to make sure their actions do not
spread the contamination. Some soil and water tests should be done near the perimeter of the contaminated area. These are the way to monitor the plume, to see if it is moving off-site.
You should never see a dust cloud over a site. The workers should have controls in place to contain the dust. They might spray water to keep dust down or use a cover.
checkIng Progress
Going Solo? Got a Group? Do a round of Sampling Plan with a local map and compare with the map of test sites. Do you feel confident that the sampling sites are well-placed and will make people feel safe with data from the spots chosen for testing?
In one site cleanup, we took video footage of the contractors taking out tanks and spilling oil.
They did a lot of bad things. Selene González, LVEJO
Community Member Checklist
Give input on monitoring test sites, making sure groundwater wells will test near
residences, drinking water wells, and areas where people play or fish.
Establish a point person officially involved in the cleanup who will pay attention to
concerns and answer questions.
Review the maps and tables in monitoring reports. Look at tables of results along with
the site map. Find the location of the high levels. Are the hot spots near residences, drinking water sources, or surface water?
Set up a spreadsheet or map where you can track wells and soil sampling locations
where levels exceed remediation objectives.
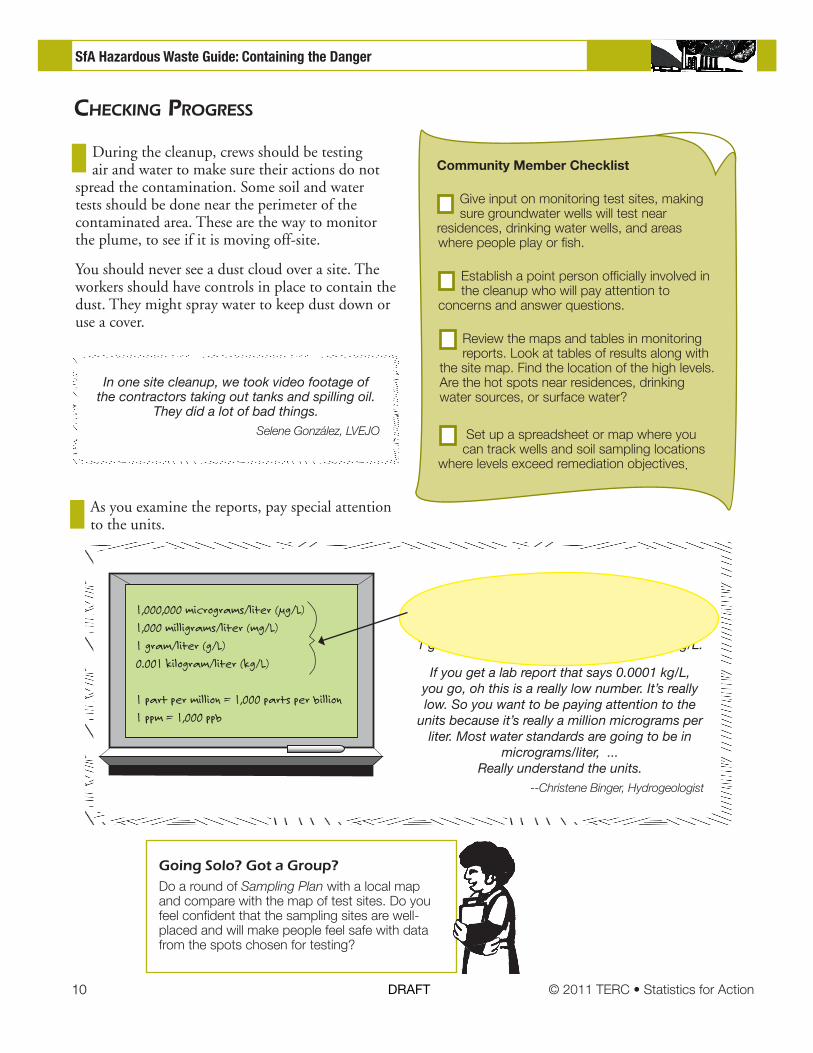
As you examine the reports, pay special attention to the units.
These are all the same number. The idea is … 1,000,000 µ/liter [is] the same as 1,000 milligrams/liter, [and that’s] the same as
1 gram/liter and it’s also the same as 0.001 kg/L.
If you get a lab report that says 0.0001 kg/L, you go, oh this is a really low number. It’s really low. So you want to be paying attention to the
units because it’s really a million micrograms per liter. Most water standards are going to be in
micrograms/liter, ... Really understand the units.
--Christene Binger, Hydrogeologist
1,000,000 micrograms/liter (µg/L)
1,000 milligrams/liter (mg/L)
1 gram/liter (g/L)
0.001 kilogram/liter (kg/L)
1 part per million = 1,000 parts per billion
1 ppm = 1,000 ppb
© 2011 TERC • Statistics for Action DRAFT 11
SfA Hazardous Waste Guide: Containing the Danger
comParIng and analyzIng
As the cleanup progresses, you expect to see the levels of contaminants decrease. Will this always be the case? No. Should you panic? Not until you find out why. Then ask how the next steps in the cleanup will
take this into account. For example:
1) Chemical compounds break down, so one level goes down, but now two other chemicals are present in higher amounts.
Ask: What will happen with these? Will they volatize (release into the air)? Break down over time? Be removed with a different remediation method? What are the risks to nearby residents, pets, or to the environment?
2) Seasonal changes. The water table goes up and the concentration goes down. The contaminant will be more diluted or more concentrated depending on how much rain, snow, or melting has occurred.
Ask: Are these contaminants water soluble? Will the levels fluctuate every season?
3) Testing reveals a new source of contamination--a part of the plume that earlier testing missed.
Ask: What sampling will be done to see how extensive this plume is? What methods will be used to address this? How will it affect the cleanup timeline?
4) Because of groundwater flow, contamination may move toward or away from a sensitive location or it may sink lower into the ground, so shallow wells show lower levels but deeper wells show higher levels.
Ask: Will additional monitoring be done? What steps can be taken to protect water supply or vulnerable people?
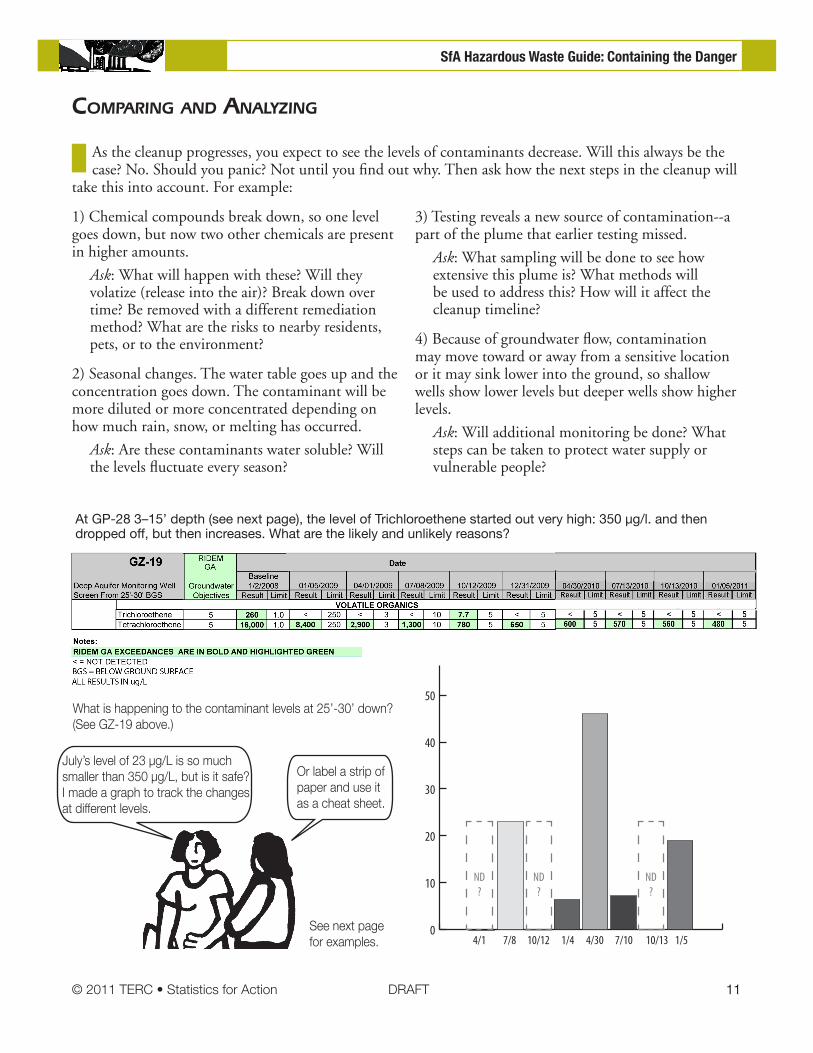
What is happening to the contaminant levels at 25’-30’ down? (See GZ-19 above.)
At GP-28 3–15’ depth (see next page), the level of Trichloroethene started out very high: 350 µg/l. and then dropped off, but then increases. What are the likely and unlikely reasons?
4/1
ND?
ND?
7/8 10/12 1/4 4/30 7/10 10/13 1/50
10
20
30
40
50
ND?
July’s level of 23 µg/L is so much smaller than 350 µg/L, but is it safe? I made a graph to track the changes at different levels.
Or label a strip of paper and use it as a cheat sheet.
See next page for examples.
12 DRAFT © 2011 TERC • Statistics for Action
SfA Hazardous Waste Guide: Containing the Danger
Trichloroethene at GP-28
RI Obj PAL05
20
40
60
80
100
350
20 times higher
8 times higher
4 times higher
2 times higher
02.5
10
20
30
40
50
250
350
23
7.2
46
6.4
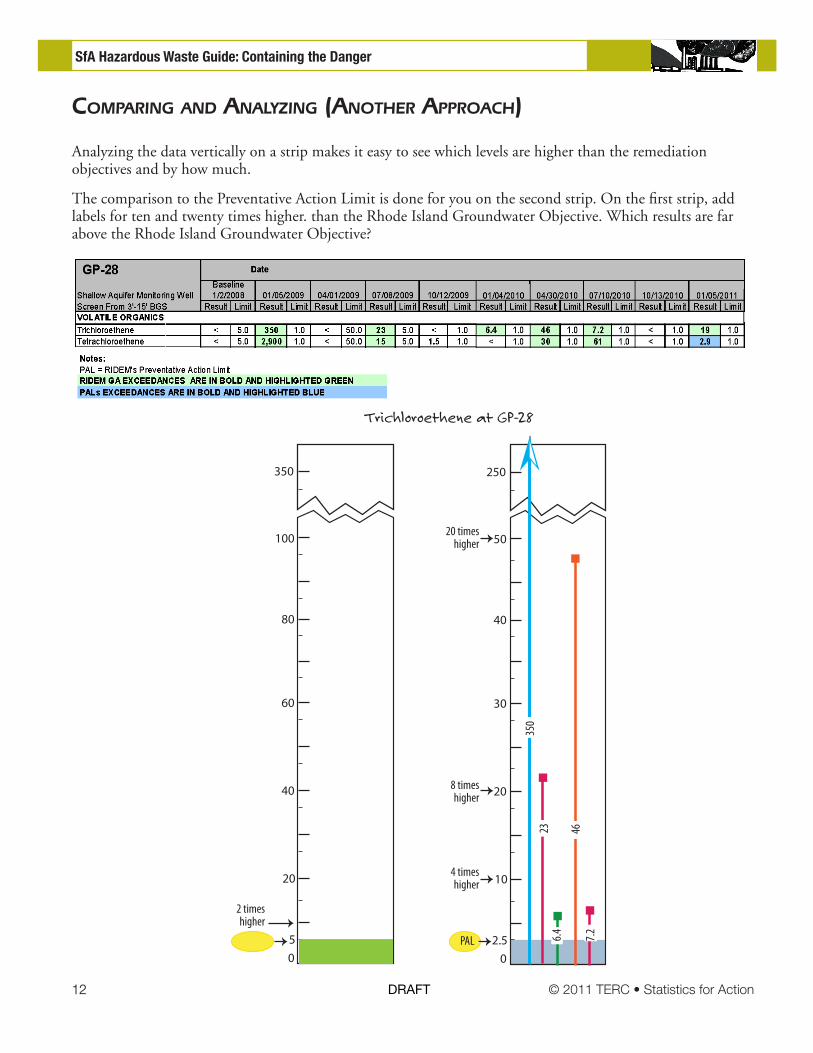
comParIng and analyzIng (another aPProach)
Analyzing the data vertically on a strip makes it easy to see which levels are higher than the remediation objectives and by how much.
The comparison to the Preventative Action Limit is done for you on the second strip. On the first strip, add labels for ten and twenty times higher. than the Rhode Island Groundwater Objective. Which results are far above the Rhode Island Groundwater Objective?
© 2011 TERC • Statistics for Action DRAFT 13
SfA Hazardous Waste Guide: Containing the Danger
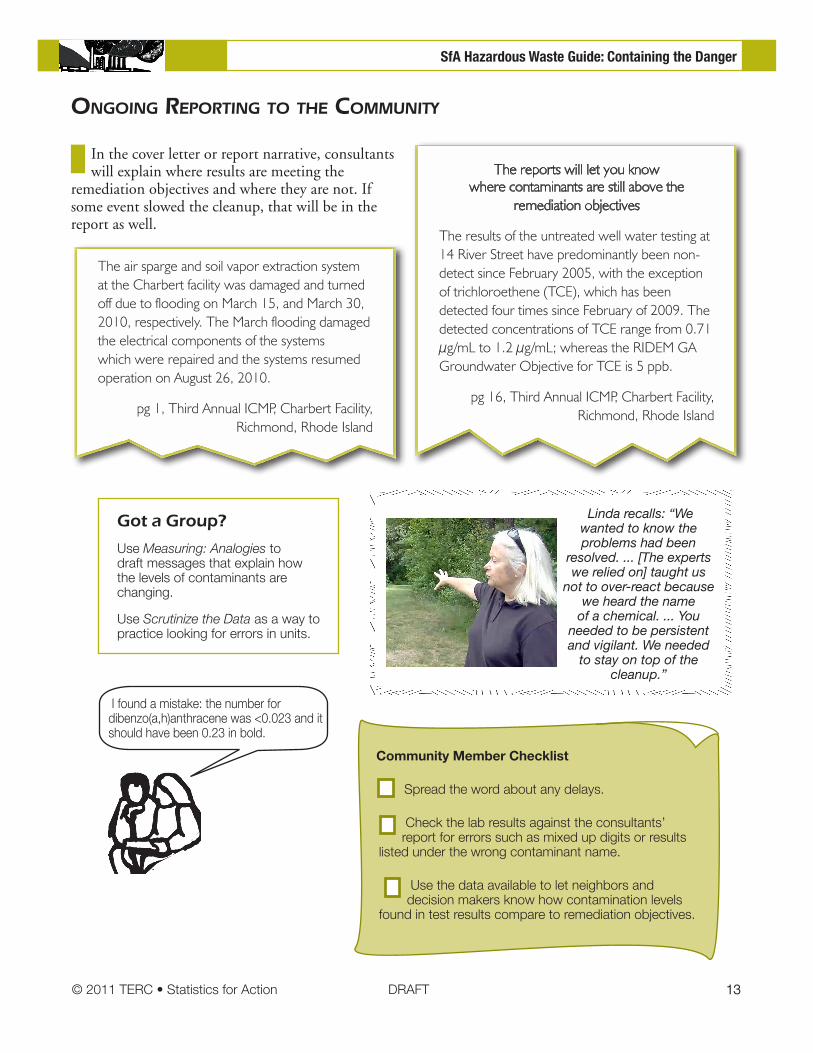
ongoIng rePortIng to the communIty
In the cover letter or report narrative, consultants will explain where results are meeting the
remediation objectives and where they are not. If some event slowed the cleanup, that will be in the report as well.
Got a Group?
Use Measuring: Analogies to draft messages that explain how the levels of contaminants are changing.
Use Scrutinize the Data as a way to practice looking for errors in units.
I found a mistake: the number for dibenzo(a,h)anthracene was <0.023 and it should have been 0.23 in bold.
Community Member Checklist
Spread the word about any delays.
Check the lab results against the consultants’ report for errors such as mixed up digits or results
listed under the wrong contaminant name.
Use the data available to let neighbors and decision makers know how contamination levels
found in test results compare to remediation objectives.
The reports will let you know where contaminants are still above the
remediation objectives
The results of the untreated well water testing at 14 River Street have predominantly been non-detect since February 2005, with the exception of trichloroethene (TCE), which has been detected four times since February of 2009. The detected concentrations of TCE range from 0.71 μg/mL to 1.2 μg/mL; whereas the RIDEM GA Groundwater Objective for TCE is 5 ppb.
pg 16, Third Annual ICMP, Charbert Facility, Richmond, Rhode Island
Linda recalls: “We wanted to know the problems had been
resolved. ... [The experts we relied on] taught us
not to over-react because we heard the name
of a chemical. ... You needed to be persistent and vigilant. We needed
to stay on top of the cleanup.”
The air sparge and soil vapor extraction system at the Charbert facility was damaged and turned off due to flooding on March 15, and March 30, 2010, respectively. The March flooding damaged the electrical components of the systems which were repaired and the systems resumed operation on August 26, 2010.
pg 1, Third Annual ICMP, Charbert Facility, Richmond, Rhode Island
14 DRAFT © 2011 TERC • Statistics for Action
SfA Hazardous Waste Guide: Containing the Danger
addItIonal testIng
At some point monitoring results will show contaminant levels meeting the cleanup
objectives. Hooray! But the cleanup process is not yet complete. Monitoring should continue for a full year after all the cleanup activities have stopped. The results should show that the average levels of contaminants are consistently below the cleanup objectives. Once a site is considered “clean,” the owners or the state should test annually for five years and then every five years after that. These test results should show that the levels of contaminants are the same as or lower than when the cleanup wrapped up.
Got a Group? Going Solo?
Use Averages: Scrutinize the Data to get a sense of how consultants might manipulate the data to argue the clean up is over.
Community Member Checklist
Check that any contaminants still present in the soil are below levels considered to
be a danger to humans.
Check the report to see if any contaminants still present are likely to
affect drinking water sources.
Create pressure for ongoing testing if needed.
Spread the word about the site’s condition.
In the rush to wrap up, sometimes consultants grow careless. Check that
testing wasn’t suspended after one low value that could have been due to heavy rains, for example. Check that outliers, or extreme values, weren’t left out without suitable explanation.
Back in Little Village, the city owned a triangle shaped lot along the railroad tracks.The small
lot was promised to the community for a garden. It had once been owned by D.A. Stuart & Co. for lubricating oil and grease and it needed to be remediated. The Little Village Evironmental Justice Organization and its lawyers made a case for a cleanup to background levels.
The cleanup took longer than expected. Finally the city and its consultants declared it done.z But no one rushed in to garden. Additional rounds of testing had to prove that the cancer-causing levels of contaminants met the state’s objectives. Community members checked the maps to make sure that samples were taken from the places where levels had been high in the past. To insure the gardeners’ safety, the site will have raised beds filled with clean soil.
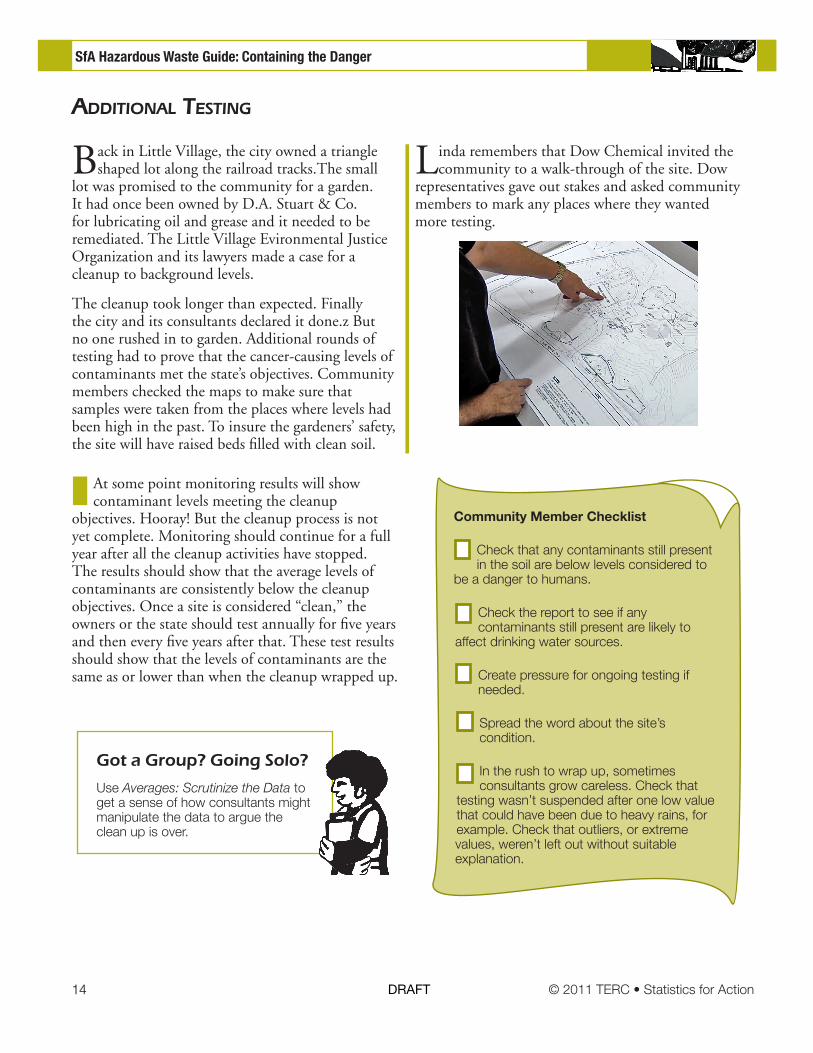
Linda remembers that Dow Chemical invited the community to a walk-through of the site. Dow
representatives gave out stakes and asked community members to mark any places where they wanted more testing.
© 2011 TERC • Statistics for Action DRAFT 15
SfA Hazardous Waste Guide: Containing the Danger
PublIcIzIng the results
Consider your audience
It is very easy to turn away from the problem once the cleanup begins. People in the community often expect that everything is going
as planned. Since this is not always the case, keeping the problem in the public eye keeps the pressure on to meet the timeline, and cleanup goals.
Few people will have the patience, interest, or time to examine the reports. So those who do, play an important role as watchdogs. They or others can take the lead on turning data into information.
Community Member Checklist
Craft a short statement or story backed up by numbers.
Explain any numbers with common comparisons or units people use in from everyday life.
Use a graph or visual to support your statement.
Test it out. If someone who has not been involved in monitoring the clean up can understand it in
half a minute, keep it. If not, simplify it!
Take advantage of anniversaries or milestones to get media attention.
Got a Group?
Use Media Talking Points to highlight conditions on the site.
About the Cleanup at Charbert
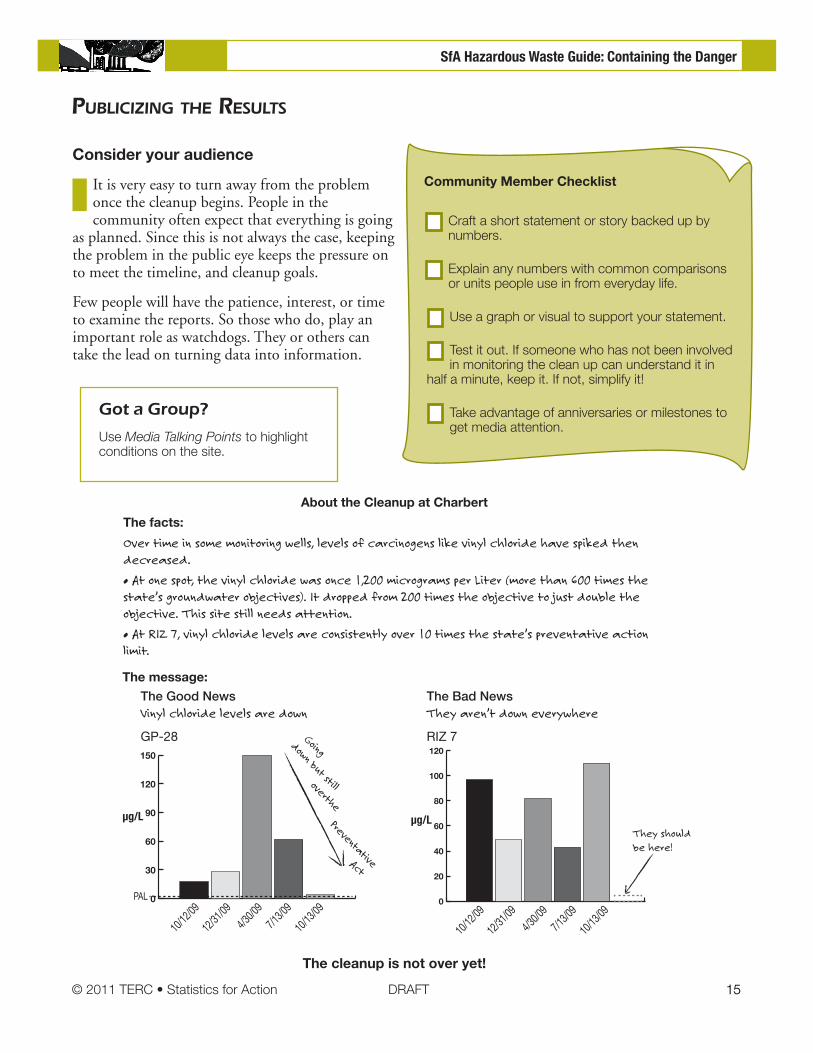
The facts:
Over time in some monitoring wells, levels of carcinogens like vinyl chloride have spiked then decreased.
• At one spot, the vinyl chloride was once 1,200 micrograms per Liter (more than 600 times the state’s groundwater objectives). It dropped from 200 times the objective to just double the objective. This site still needs attention.
• At RIZ 7, vinyl chloride levels are consistently over 10 times the state’s preventative action limit.
The Good NewsVinyl chloride levels are down
GP-28
The Bad NewsThey aren’t down everywhere
RIZ 7
0
30
60
90
120
150
0
20
40
60
80
100
120
10/12
/09
12/31
/09
4/30/0
9
7/13/0
9
10/13
/09
10/12
/09
12/31
/09
4/30/0
9
7/13/0
9
10/13
/09PAL
The cleanup is not over yet!
The message:
µg/L µg/L
Going down but still overthe
Preventative Act
They should be here!
16 DRAFT © 2011 TERC • Statistics for Action
SfA Hazardous Waste Guide: Containing the Danger
Appendix
lIst of helPful resources
Note: A specific web address for a resource may change with time. If you can’t find a resource directly, do an internet search for the title (in bold, below).
A Citizen’s Guide to Risk Assessments and Public Health Assessments at Contaminated Sites: A solid guide on how a community can clean up a site that is contaminated with dangerous chemicals. www.atsdr.cdc.gov/publications/citizensguidetoriskassessments.html
“Dirt Alert” Soil Sample Guidance: A short guide for taking soil samples. www.ecy.wa.gov/biblio/0609098.html
Environmental Experts: A website with a database of the most up-to-date environmental reports and concerns, including international news, health and safety, and news on the environment and industry. www.environmental-expert.com
EPA Integrated Risk Information Sheet (IRIS): Search for any pollutant/chemical compound and get information about how dangerous it is, and other toxicological information. www.epa.gov/iris
EPA Chemical References Index: The EPA’s list of chemicals, their properties, and their effects on human health. www.epa.gov/enviro/html/emci/chemref/
NIOSH Pocket Guide to Chemical Hazards: Put out by the National Institute for Occupational Safety and Health. A very good quick reference guides to the toxicological properties of the most common chemicals. Better organized than the EPA’s own list. www.cdc.gov/niosh/npg
Soil Pollution - A short guide put out by Green Pack that explains what the common forms of soil pollution are and their effects on human health. A good guide for beginners. greenpack.rec.org/soil/problems_and_threats_to_the_soil/03-03-03.shtml
EPA Guidelines for Brownfields Grants for Assessment, Cleanup, and Revolving Loan Funds: www.epa.gov/brownfields/applicat.htm
Housing and Urban Development - Brownfield Economic Development Initiative (BEDI): portal.hud.gov/hudportal/HUD/program_offices/comm_planning/BEDI
Agency of Toxic Substances and Disease Registry: www.atsdr.cdc.gov
Green Cleanup Standard Initiative Project: EPA is pursuing options for developing a voluntary standards and verification system that evaluates and recognizes efforts to maximize the net environmental benefit of cleaning up contaminated sites. www.clu-in.org/greenremediation/subtab_b5.cfm


![STANDARD OPERATING PROCEDURES FOR HAZARDOUS …ehs.wsu.edu/.../soptemplatedocuments/2-Mercaptoethan… · Web viewSignal Word: DANGER. ... [Rat]. 190 mg/kg [Mouse]. DERMAL (LD50):](https://static.fdocuments.in/doc/165x107/5a78f8447f8b9a9d218c57b8/standard-operating-procedures-for-hazardous-ehswsuedusoptemplatedocuments2-mercaptoethanweb.jpg)


