Waste Statistics Documents/Waste... · 2019-07-11 · Waste Statistics 2018 3 Waste in Abu Dhabi...
14
Waste Statistics
Transcript of Waste Statistics Documents/Waste... · 2019-07-11 · Waste Statistics 2018 3 Waste in Abu Dhabi...
Released Date: October 2015
Waste Statistics
Waste Statistics 2018 1
Contents
INTRODUCTION ....................................................................................................................................... 2
WASTE IN ABU DHABI EMIRATE ........................................................................................................ 3
NON-HAZARDOUS WASTE .................................................................................................................... 4
SOLID WASTE GENERATION ................................................................................................................ 4
SOLID WASTE DISPOSAL ................................................................................................................... 7
MUNICIPAL SOLID WASTE .................................................................................................................. 8
HAZARDOUS WASTE .............................................................................................................................. 9
WASTE MANAGEMENT PLANTS ......................................................................................................... 10
EXPLANATORY NOTES ........................................................................................................................ 11
GLOSSARY ................................................................................................................................... 11
DATA SOURCES ..................................................................................................................................... 12
TECHNICAL NOTES .............................................................................................................................. 12
METHODOLOGY ............................................................................................................................. 12
NOTES ON TABLES ............................................................................................................................... 12
MORE INFORMATION .......................................................................................................................... 12
Waste Statistics 2018 2
Introduction
This report presents statistics on waste generation in the Emirate of Abu Dhabi for the year 2018,
compromising statistics on waste by source activity, composition and method of disposal, in addition to
municipal and hazardous solid waste statistics. The Centre of Waste Management – Abu Dhabi and Abu
Dhabi National Oil Company (ADNOC) are the main sources of the report statistics.
The “Explanatory Notes” section at the end of this report defines the key terms and technical concepts
related to waste statistics. Reader can refer to that section while reading the statistics and information
outlined in the report.
Waste Statistics 2018 3
Waste in Abu Dhabi Emirate
Waste known as the unwanted materials caused by the daily activities of human beings, whether domestic
or municipal or industrial activities. Waste management and treatment are of particular interest to the
government of Abu Dhabi Emirate in order to minimize the waste effects on health.
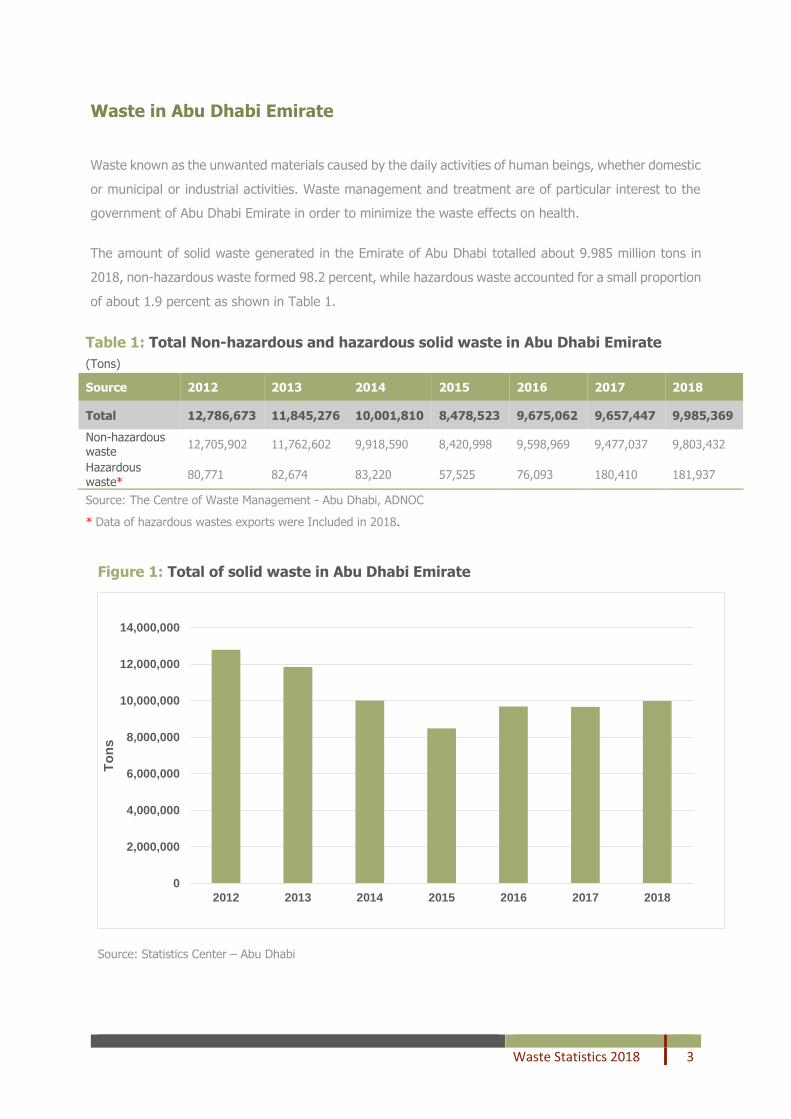
The amount of solid waste generated in the Emirate of Abu Dhabi totalled about 9.985 million tons in
2018, non-hazardous waste formed 98.2 percent, while hazardous waste accounted for a small proportion
of about 1.9 percent as shown in Table 1.
Table 1: Total Non-hazardous and hazardous solid waste in Abu Dhabi Emirate
(Tons)
Source 2012 2013 2014 2015 2016 2017 2018
Total 12,786,673 11,845,276 10,001,810 8,478,523 9,675,062 9,657,447 9,985,369
Non-hazardous waste
12,705,902 11,762,602 9,918,590 8,420,998 9,598,969 9,477,037 9,803,432
Hazardous waste*
80,771 82,674 83,220 57,525 76,093 180,410 181,937
Source: The Centre of Waste Management - Abu Dhabi, ADNOC
* Data of hazardous wastes exports were Included in 2018.
Figure 1: Total of solid waste in Abu Dhabi Emirate
Source: Statistics Center – Abu Dhabi
0
2,000,000
4,000,000
6,000,000
8,000,000
10,000,000
12,000,000
14,000,000
2012 2013 2014 2015 2016 2017 2018
To
ns
Waste Statistics 2018 4
Non-hazardous waste
Non-hazardous waste refers to materials that cause no serious environmental problems and are easy to
dispose in an environmentally safe manner. The economic growth witnessed in the Emirate in various
fields such as construction and demolition activities, in addition to industrial, commercial and agricultural
activities, which required promoting of waste reduction practices to limit the growth in waste generation
amounts
Solid waste generation
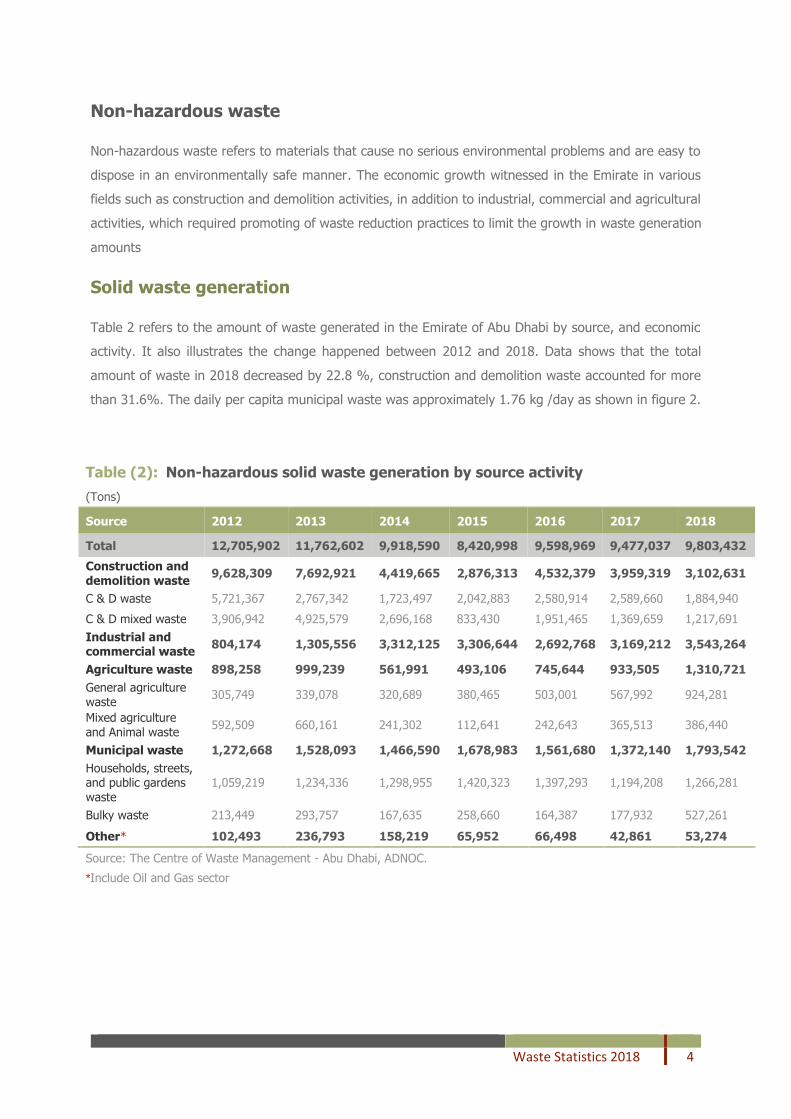
Table 2 refers to the amount of waste generated in the Emirate of Abu Dhabi by source, and economic
activity. It also illustrates the change happened between 2012 and 2018. Data shows that the total
amount of waste in 2018 decreased by 22.8 %, construction and demolition waste accounted for more
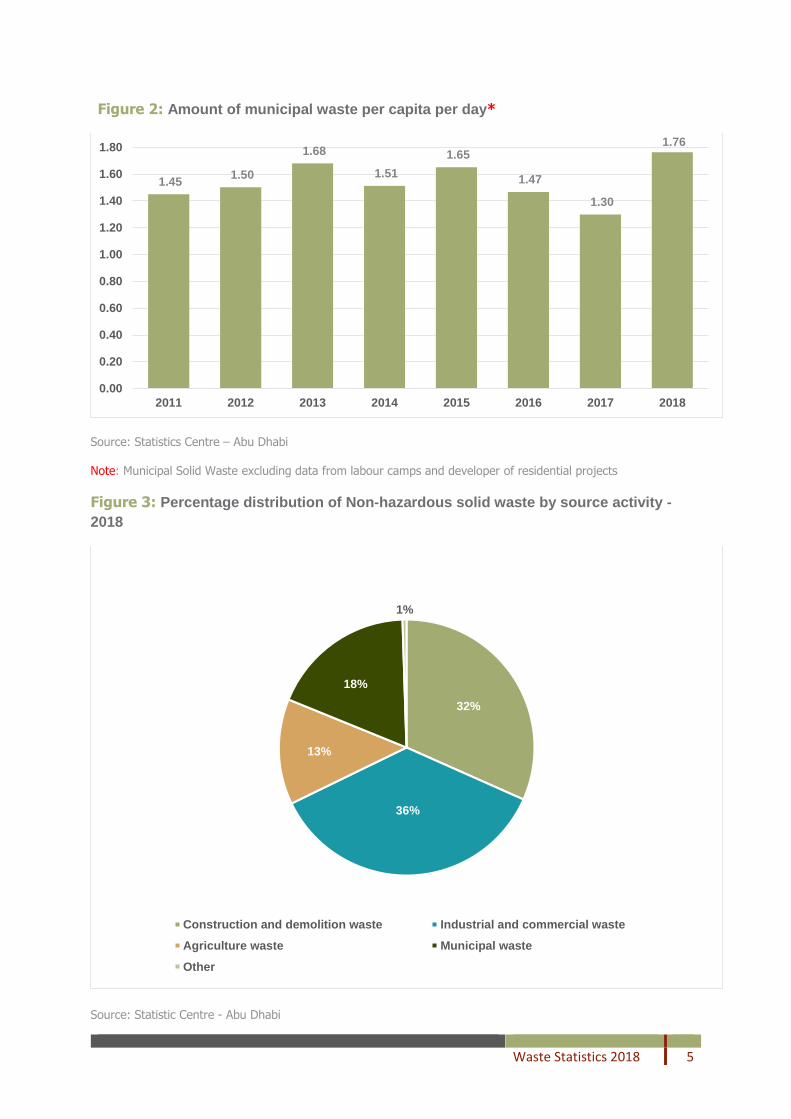
than 31.6%. The daily per capita municipal waste was approximately 1.76 kg /day as shown in figure 2.
Table (2): Non-hazardous solid waste generation by source activity
(Tons)
Source 2012 2013 2014 2015 2016 2017 2018
Total 12,705,902 11,762,602 9,918,590 8,420,998 9,598,969 9,477,037 9,803,432
Construction and demolition waste
9,628,309 7,692,921 4,419,665 2,876,313 4,532,379 3,959,319 3,102,631
C & D waste 5,721,367 2,767,342 1,723,497 2,042,883 2,580,914 2,589,660 1,884,940
C & D mixed waste 3,906,942 4,925,579 2,696,168 833,430 1,951,465 1,369,659 1,217,691
Industrial and commercial waste
804,174 1,305,556 3,312,125 3,306,644 2,692,768 3,169,212 3,543,264
Agriculture waste 898,258 999,239 561,991 493,106 745,644 933,505 1,310,721
General agriculture waste
305,749 339,078 320,689 380,465 503,001 567,992 924,281
Mixed agriculture and Animal waste
592,509 660,161 241,302 112,641 242,643 365,513 386,440
Municipal waste 1,272,668 1,528,093 1,466,590 1,678,983 1,561,680 1,372,140 1,793,542
Households, streets, and public gardens waste
1,059,219 1,234,336 1,298,955 1,420,323 1,397,293 1,194,208 1,266,281
Bulky waste 213,449 293,757 167,635 258,660 164,387 177,932 527,261
Other* 102,493 236,793 158,219 65,952 66,498 42,861 53,274
Source: The Centre of Waste Management - Abu Dhabi, ADNOC.
*Include Oil and Gas sector
Waste Statistics 2018 5
Figure 2: Amount of municipal waste per capita per day*
Source: Statistics Centre – Abu Dhabi Note: Municipal Solid Waste excluding data from labour camps and developer of residential projects
Figure 3: Percentage distribution of Non-hazardous solid waste by source activity -
2018
Source: Statistic Centre - Abu Dhabi
1.45 1.50
1.68
1.51
1.65
1.47
1.30
1.76
0.00
0.20
0.40
0.60
0.80
1.00
1.20
1.40
1.60
1.80
2011 2012 2013 2014 2015 2016 2017 2018
32%
36%
13%
18%
1%
Construction and demolition waste Industrial and commercial waste
Agriculture waste Municipal waste
Other
Waste Statistics 2018 6
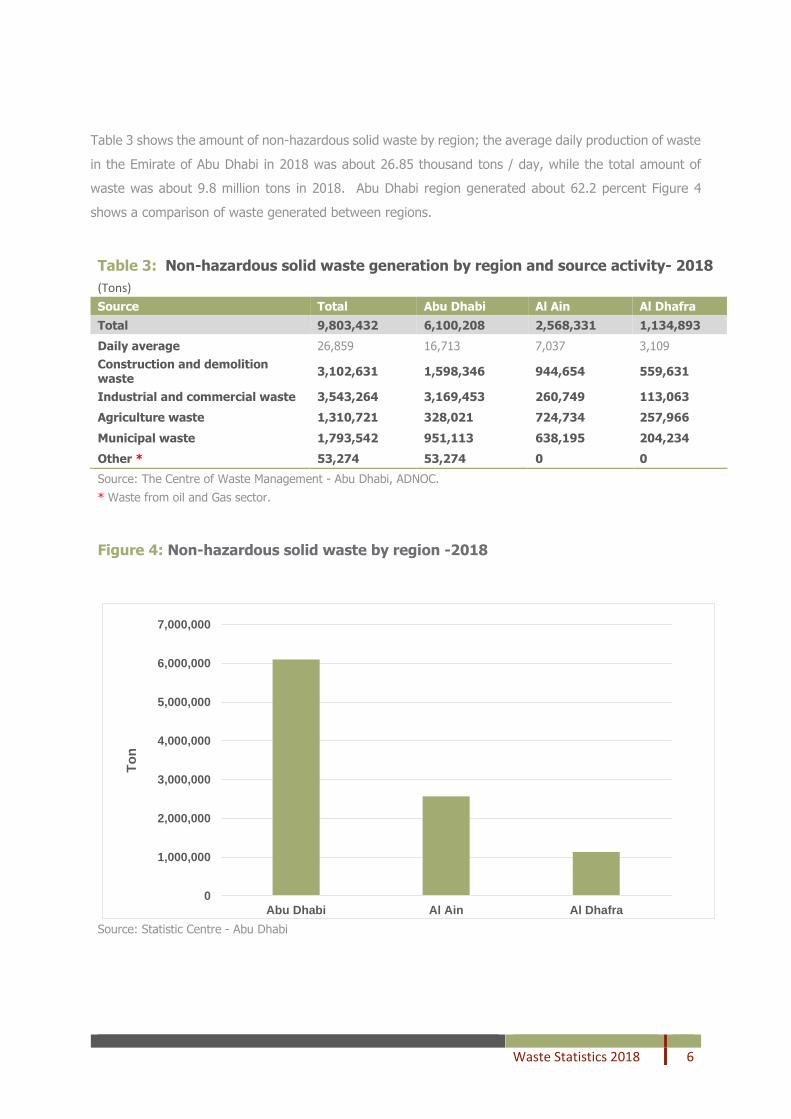
Table 3 shows the amount of non-hazardous solid waste by region; the average daily production of waste
in the Emirate of Abu Dhabi in 2018 was about 26.85 thousand tons / day, while the total amount of
waste was about .9 8 million tons in 2018. Abu Dhabi region generated about 62.2 percent Figure 4
shows a comparison of waste generated between regions.
Table 3: Non-hazardous solid waste generation by region and source activity- 2018
(Tons)
Source Total Abu Dhabi Al Ain Al Dhafra
Total 9,803,432 6,100,208 2,568,331 1,134,893
Daily average 26,859 16,713 7,037 3,109
Construction and demolition waste
3,102,631 1,598,346 944,654 559,631
Industrial and commercial waste 3,543,264 3,169,453 260,749 113,063
Agriculture waste 1,310,721 328,021 724,734 257,966
Municipal waste 1,793,542 951,113 638,195 204,234
Other * 53,274 53,274 0 0
Source: The Centre of Waste Management - Abu Dhabi, ADNOC. * Waste from oil and Gas sector.
Figure 4: Non-hazardous solid waste by region -2018
Source: Statistic Centre - Abu Dhabi
0
1,000,000
2,000,000
3,000,000
4,000,000
5,000,000
6,000,000
7,000,000
Abu Dhabi Al Ain Al Dhafra
To
n
Waste Statistics 2018 7
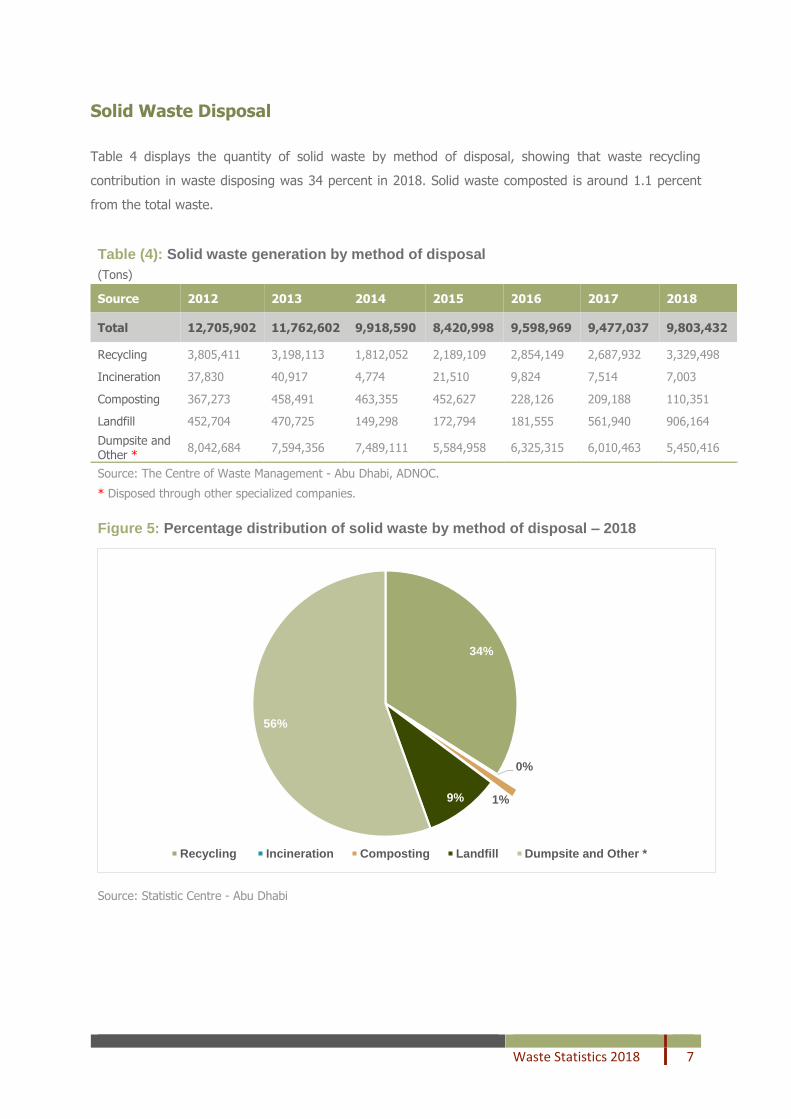
Solid Waste Disposal
Table 4 displays the quantity of solid waste by method of disposal, showing that waste recycling
contribution in waste disposing was 34 percent in 2018. Solid waste composted is around 1.1 percent
from the total waste.
Table (4): Solid waste generation by method of disposal
(Tons)
Source 2012 2013 2014 2015 2016 2017 2018
Total 12,705,902 11,762,602 9,918,590 8,420,998 9,598,969 9,477,037 9,803,432
Recycling 3,805,411 3,198,113 1,812,052 2,189,109 2,854,149 2,687,932 3,329,498
Incineration 37,830 40,917 4,774 21,510 9,824 7,514 7,003
Composting 367,273 458,491 463,355 452,627 228,126 209,188 110,351
Landfill 452,704 470,725 149,298 172,794 181,555 561,940 906,164
Dumpsite and Other *
8,042,684 7,594,356 7,489,111 5,584,958 6,325,315 6,010,463 5,450,416
Source: The Centre of Waste Management - Abu Dhabi, ADNOC.
* Disposed through other specialized companies.
Figure 5: Percentage distribution of solid waste by method of disposal – 2018
Source: Statistic Centre - Abu Dhabi
34%
0%
1%9%
56%
Recycling Incineration Composting Landfill Dumpsite and Other *
Waste Statistics 2018 8
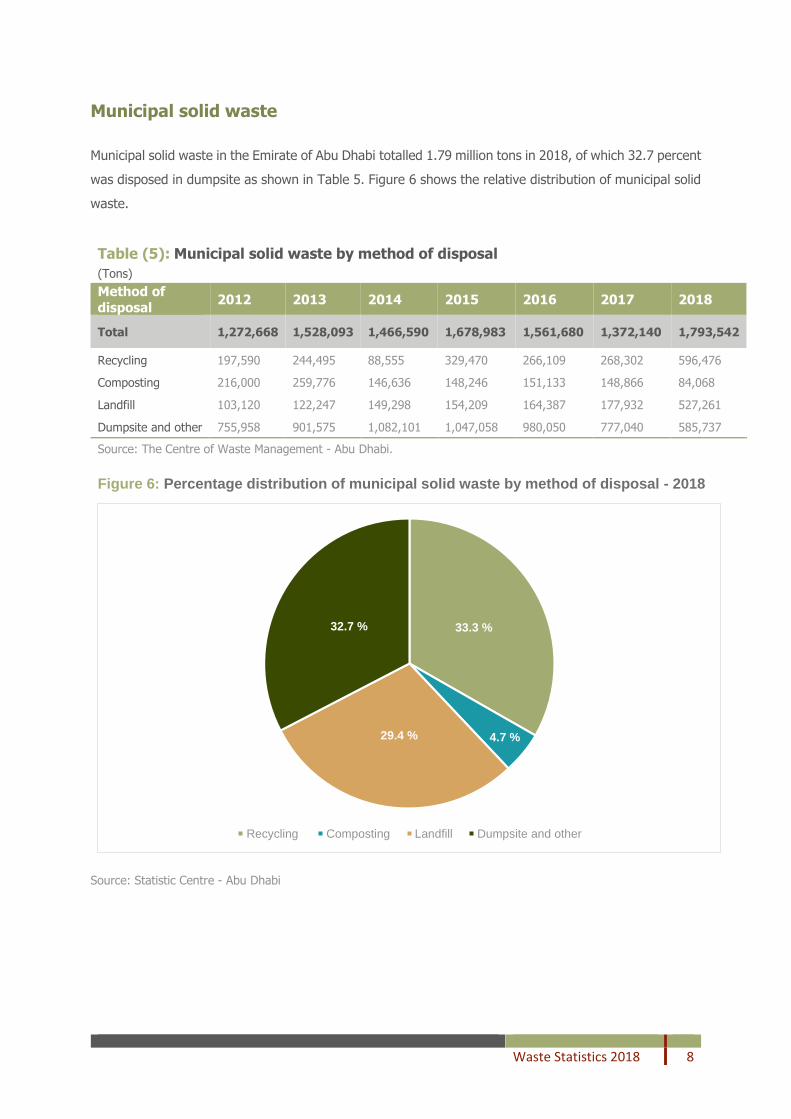
Municipal solid waste
Municipal solid waste in the Emirate of Abu Dhabi totalled .1 79 million tons in 2018, of which 32.7 percent
was disposed in dumpsite as shown in Table 5. Figure 6 shows the relative distribution of municipal solid
waste.
Table (5): Municipal solid waste by method of disposal
(Tons) Method of
disposal 2012 2013 2014 2015 2016 2017 2018
Total 1,272,668 1,528,093 1,466,590 1,678,983 1,561,680 1,372,140 1,793,542
Recycling 197,590 244,495 88,555 329,470 266,109 268,302 596,476
Composting 216,000 259,776 146,636 148,246 151,133 148,866 84,068
Landfill 103,120 122,247 149,298 154,209 164,387 177,932 527,261
Dumpsite and other 755,958 901,575 1,082,101 1,047,058 980,050 777,040 585,737
Source: The Centre of Waste Management - Abu Dhabi. Figure 6: Percentage distribution of municipal solid waste by method of disposal - 2018
Source: Statistic Centre - Abu Dhabi
33.3 %
4.7 %29.4 %
32.7 %
Recycling Composting Landfill Dumpsite and other
Waste Statistics 2018 9
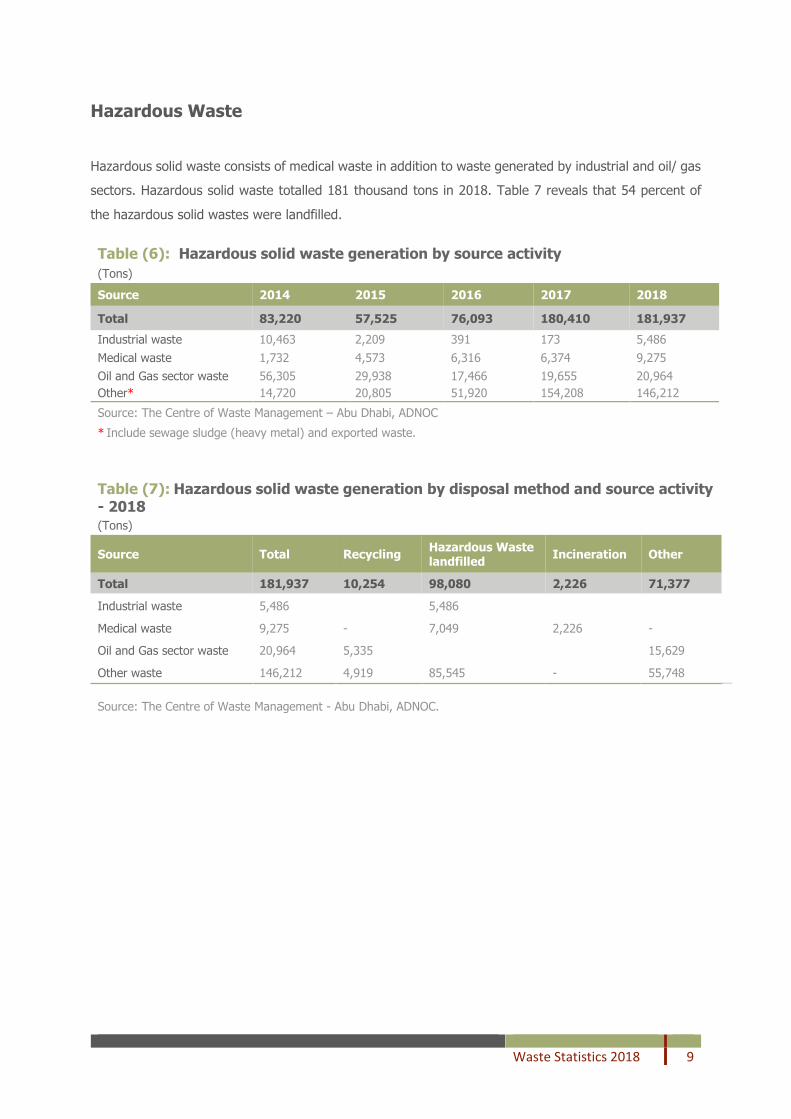
Hazardous Waste
Hazardous solid waste consists of medical waste in addition to waste generated by industrial and oil/ gas
sectors. Hazardous solid waste totalled 181 thousand tons in 2018. Table 7 reveals that 54 percent of
the hazardous solid wastes were landfilled.
Table (6): Hazardous solid waste generation by source activity
(Tons)
Source 2014 2015 2016 2017 2018
Total 83,220 57,525 76,093 180,410 181,937
Industrial waste 10,463 2,209 391 173 5,486
Medical waste 1,732 4,573 6,316 6,374 9,275
Oil and Gas sector waste 56,305 29,938 17,466 19,655 20,964 Other* 14,720 20,805 51,920 154,208 146,212
Source: The Centre of Waste Management – Abu Dhabi, ADNOC
* Include sewage sludge (heavy metal) and exported waste.
Table (7): Hazardous solid waste generation by disposal method and source activity - 2018
(Tons)
Source Total Recycling Hazardous Waste landfilled
Incineration Other
Total 181,937 10,254 98,080 2,226 71,377
Industrial waste 5,486 5,486
Medical waste 9,275 - 7,049 2,226 -
Oil and Gas sector waste 20,964 5,335 15,629
Other waste 146,212 4,919 85,545 - 55,748
Source: The Centre of Waste Management - Abu Dhabi, ADNOC.
Waste Statistics 2018 10
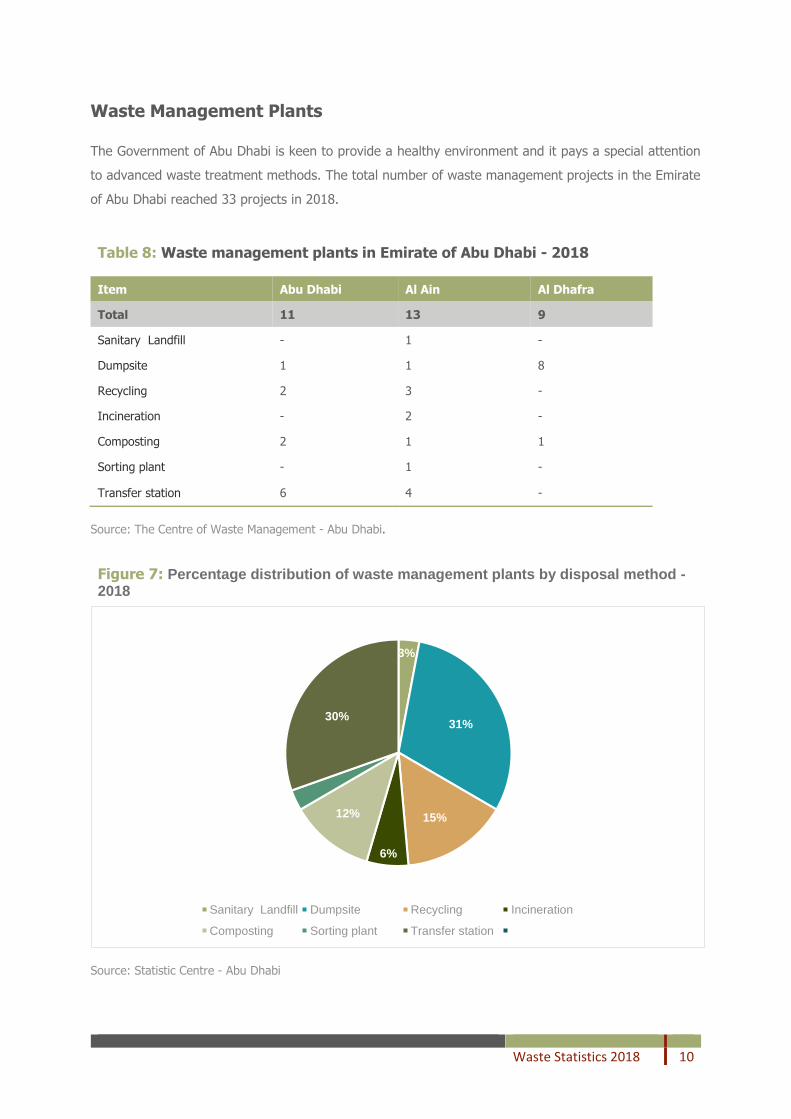
Waste Management Plants
The Government of Abu Dhabi is keen to provide a healthy environment and it pays a special attention
to advanced waste treatment methods. The total number of waste management projects in the Emirate
of Abu Dhabi reached 33 projects in 2018.
Table 8: Waste management plants in Emirate of Abu Dhabi - 2018
Item Abu Dhabi Al Ain Al Dhafra
Total 11 13 9
Sanitary Landfill - 1 -
Dumpsite 1 1 8
Recycling 2 3 -
Incineration - 2 -
Composting 2 1 1
Sorting plant - 1 -
Transfer station 6 4 -
Source: The Centre of Waste Management - Abu Dhabi.
Figure 7: Percentage distribution of waste management plants by disposal method - 2018
Source: Statistic Centre - Abu Dhabi
3%
31%
15%
6%
12%3%
30%
Sanitary Landfill Dumpsite Recycling Incineration
Composting Sorting plant Transfer station
Waste Statistics 2018 11
Explanatory Notes
Glossary
This report contains certain terms related to waste; these terms play an important role when analyzing
waste statistics for the Emirate of Abu Dhabi. The report includes the following terms:
Municipal Solid Waste (MSW)
The waste that consists of organic materials and trash generated in the kitchen and other households
uses. Households and buildings in the residential areas generate MSW.
Commercial and Industrial Waste
It includes municipal waste generated by restaurants, hotels, shopping malls, labour camps and other
public and private facilities.
Industrial Hazardous Waste
The waste generated from industrial activities, laboratories, workshops and other public and private
facilities that deal with hazardous materials.
Medical Hazardous Waste
The waste generated from hospitals, clinics and medical laboratories. It consists of human parts, tissues,
blood, and waste resulting from surgical operations.
Mixed Waste
The waste composed of household trash mixed with building materials and sand in storage locations and
/ or during the collection.
Safe Waste Landfill
The site where waste buried and processed in secure cells. Unlike medical waste landfill, safe waste
landfill has no sewage system for contaminated water.
Waste Tires
Waste tires collected from factories and repair workshops.
Construction and Demolition Waste
The waste results from construction and demolition activities.
Slaughterhouse Waste
The waste that composed of animals remains and is generated from slaughterhouses and animal shelters.
Large-scale Waste
The waste composed of unwanted household items and packaging materials resulted from commercial
activities.
Waste Statistics 2018 12
Data Sources
The main sources of the statistics are the Centre of Waste Management – Abu Dhabi, and Abu Dhabi
National Oil Company (ADNOC). Data processed in the Statistics Centre – Abu Dhabi (SCAD) for more
editing and research.
Technical Notes
Methodology
Waste generation data in Abu Dhabi, Al Ain and Al Dhafra regions was calculated based on truck scale
reports. In case reports were not available, data calculated based on reports collected from waste
contractors and waste sites.
Medical waste data in Abu Dhabi and Al Dhafra regions estimated based on Al Ain data (actual data
derived from truck scale reports of medical waste incineration sites).
Notes on Tables
Changes (levels and percent) in all tables based on unrounded numbers.
More information
For more information about waste and other official statistics for Abu Dhabi Emirate, please visit the
statistics link on the SCAD website at http://www.scad.ae
2
Was
te s
tati
stic
s 201
4
PublicationsLibrary
www.scad.gov.abudhabi