UGANDA 2013 FinScope III SURVEY KEY FINDINGSscore.or.ug/uploads/FINSCOPE_ III_ Survey_ 2013_...
28
UGANDA 2013 FinScope III SURVEY KEY FINDINGS Unlocking Barriers to Financial Inclusion November 2013
Transcript of UGANDA 2013 FinScope III SURVEY KEY FINDINGSscore.or.ug/uploads/FINSCOPE_ III_ Survey_ 2013_...

UGANDA 2013 FinScope III SURVEY
KEY FINDINGS
Unlocking Barriers to Financial Inclusion
November 2013


FinScope III SURVEY 2013 FINDINGS
1
ACKNOWLEDGEMENTS
This summary report was prepared by the Economic Policy Research Centre (EPRC) as the implementing institution for FinScope III based on the 2013 FinScope III survey data collected by REEV Consult International during June - July 2013. EPRC worked under the guidance of the FinScope III (2013) Steering Committee, which had a Secretariat at the Bank of Uganda. The Steering Committee had a membership drawn from the Ministry of Finance Planning and Economic Development, Bank of Uganda, Uganda Insurance Commission, Capital Markets Authority, Uganda Bank-ers Association, GIZ, Uganda Insurers Association, the Association of Microfinance Institutions of Uganda, Uganda Bureau of Statistics, Private Sector Foundation of Uganda and Development Partners notably UK’s Department for International Development (DFID).
EPRC wishes to extend much gratitude to DFID for entirely funding the FinScope III survey. Without their financial support this project could not have been implemented as success-fully as it has been.
We acknowledge the Capital markets Authority (CMA) for for effectively chairing and providing the the necessary stewardship for the Steering Committee and navigating the FinScope III project to its successful con-clusion. EPRC also y acknowledges with thanks the contri-butions made by all members of the steering committee. However, we shall single out for mention the role played by the Uganda Bureau of Statistics, which went beyond the membership of the Steering Committee to other additional
responsibilities. UBOS designed the methods for sample selection, sample implementation, weighting of individual records and undertook quality assurance of the work of the Research House. The efforts of UBOS helped FinScope III to collect and analyze high quality data on which this summary report is based.
Much gratitude is also extended to the Bank of Uganda and in particular the FinScope Secretariat for efficiently organizing meetings and coordinating activities.
Ms. Annette Altvater of Development Pioneer Consultants in Dar es Salaam, Tanzania provided much guidance on the development of FinScope III questionnaire between December 2012 and January 2013. Her significant contribution is very much appreciated.
FINMARK Trust of South Africa and Founder of FinScope surveys gave us guidance and insight into the FinScope III study especially with regard to generating comparable results with other African countries undertaking FinScope surveys.
Finally, special thanks go to the team of re-searchers namely, Musa Mayanja Lwanga, Ezra Munyambonera, Xavier Mugisha, Ibrahim Kasirye and Lawrence Bategeka; and Vicent Fred Sennono, Stephen Baryahirwa and Byron Twesigye of the Uganda Bureau of Statistics who meticulously analysed and compiled the information for this report. The full report is available on the EPRC website: www.eprc.or.ug.
DR SARAH SSEWANYANAEXECUTIVE DIRECTOR, ECONOMIC POLICY RESEARCH CENTRENovember 2013

FinScope III SURVEY 2013 FINDINGS
2
Introduction
Uganda’s Vision 2040 highlights the lack of ac-cess to finance as one of the barriers affecting the competitiveness of the economy. There is limited access to credit and most individuals and firms access credit from informal sources. One of the reasons for the limited access to credit is the low level of incomes and conse-quently domestic savings which affects ability by institutions to offer long term finance. As such, the government intends to increase gross national savings from the current level of 14.5% to about 35% of GDP by 2040, as a means to ac-celerate structural transformation.
Uganda has made significant progress in im-proving the welfare of its citizens. During the past 10 years, the incidence of income poverty has declined from 38% in 2002/3 to 22% (pre-liminary estimate) in 2013. On the other hand, GDP growth has averaged over 5% during the same period while the agricultural sector has performed dismally—with annual growth rates averaging less than 3% during 2002/3-2012/13. Overtime, Uganda’s financial sector has contin-ued to record positive changes such as in the level of financial development, increased com-petition and improved efficiency in the financial system. There have also been deliberate efforts by government to strengthen financial inclu-sion in Uganda since 2001.
With these advances in the financial sector, it is important that an assessment is done to ex-plore the extent to which such developments have translated into improved financial access to the adult population. As such, regular nation-ally representative FinScope surveys have been carried out in Uganda and other African coun-tries to provide a basis for monitoring progress – in terms of demand, access and use of financial products/services.
FinScope Surveys
To date, FinScope surveys have been carried out in 18 African countries including Uganda. FinScope III survey for Uganda follows two previous surveys—FinScope I and II surveys carried out in 2006 and 2009 respectively. Like the previous FinScope I and II, FinScope III gath-ered detailed demographic information for the adult population (individuals aged 16 years and above), socioeconomic characteristics and use and non-use of financial services.
Particular information collected included: finan-cial and risk management strategies; financial discipline and knowledge; attitudes and per-ceptions of, as well as preference for, financial service providers; usage and attitude to mobile money technology; rural and agriculture issues; remittances; and asset accumulation patterns. Unlike earlier FinScope surveys, FinScope III in-cluded a specific section on mobile money as well as additional questions to reflect the new changes in the financial landscape.
Sampling
FinScope III survey was based on a two-stage stratified random sampling design. In the first stage the selection was based on a region and by a stratum (urban/ rural). In each stratum, the primary sampling unit was the enumeration area (EA) and was selected systematically using the probability proportional to size mechanism within each stratum.
A total of 4,032 households were selected using the 2012 Uganda Population and Housing Cen-sus Mapping Frame. The households were se-lected using simple random sampling. Thereaf-ter, one adult person (aged 16 years and above) from a list of all adults in a selected household was chosen using KISH grid method.

FinScope III SURVEY 2013 FINDINGS
3
The actual sampled households with complete information were 3,401 from 501 EAs translat-ing into a completion rate of 84% and response rate of 85 percent. The sample for the FinScope III was designed to provide financial indicator estimates for the country as a whole and for ur-ban and rural areas separately; and for the five regions including Kampala.
Classification of financial institution
The analysis considers four major categories of financial service usage:
Formal banks regulated by the Central Bank – Tier 1-3: This category includes fi-nancial institutions that are directly super-vised and regulated by the Central Bank. They include: commercial banks, credit in-stitutions and Microfinance Deposit taking institutions (MDIs);
Non-bank formal financial institutions: e.g. Savings and Credit Cooperative Organisa-tions (SACCOs) and other microfinance institutions (MFIs), insurance companies and the non-banking financial institu-tions like foreign exchange bureau, money transfer services like Western Union, and cell phone money services;
Informal e.g. money lenders, Rotating, Savings and Credit Associations (ROSCAs), Accumulating Savings and Credit Associa-tions (ASCAs), Village Savings and Lending Associations (VSLAs), Non-governmental Organisations (NGOs), investment clubs, saving clubs, services by employers and other village groups like burial societies and welfare funds.
Financially excluded i.e. persons who do not use either the formal banks, non-bank formal or informal institutions. Products and services under financially excluded
include saving in a secret place, shops or friends/relatives; borrowing from friends or family members; or money transfers using individuals.

FinScope III SURVEY 2013 FINDINGS
4
Population
The total adult population was estimated at 16.7 million persons, with nearly 48 % of the adult population being males.
At least, 23 % of the sampled adults were below 25 years and 40 % of the adult popu-lation were within the middle age between 25 – 39 years.
Education attainment
Nearly 40% of the adult population had at-tained some primary education.
The adults in urban areas were more likely to have completed secondary education and above compared to their counterparts in rural areas.
Nearly 48 % of Kampala adults had com-pleted secondary education and above, a share well above the national average of 15 %.
Wealth status and income sources
Nationally, 19 % of the adult population were classified to be in the lowest wealth quintile. Northern region had the highest share in the lowest quintile (43 %) fol-lowed by Eastern region (23 %). In Kam-pala, 92% of the adult population was in the top wealth quintile compared to only 5 percent in Northern region.
Agriculture was the most important source of employment and income. Nearly 64 % of the adult population in rural areas and 23% in urban areas reported farming as the household’s most important source of income.
About 13% of adult Ugandans reported having wage employment with one out of every four residents in urban areas citing wage employment as the main source of household income.
Majority of the adult population (64 %) earned less than UShs 500,000 in a year.
Household’s most important source of income in 2013, %
BACKGROUND CHARACTERISTICS

FinScope III SURVEY 2013 FINDINGS
5
KEY FINDINGSFinancial Landscape
Overall usage of financial services
Overall there has been a remarkable improve-ment in financial inclusion in Uganda from 70 % in 2009 to 85% in 2013.
The share of the adult population access-ing formal institutions (banked and non-bank formal) increased by almost two fold from 28% in 2009 to 54% in 2013. The growth was driven by the increase in the non-bank formal from 20% in 2009 to 52% in 2013.
Financial access strand
The share of adults using non-bank formal financial services increased from 7% in 2009 to 34% by 2013. The strong growth in use of non-bank financial services is at-tributed majorly by use of mobile money transfer services.
Due to proximity to financial institutions, residents of urban areas were more than twice likely to use formal banking institu-tionsthan rural residents (36% compared to 17%).
In rural areas, use of informal service pro-viders predominated (35%) followed by non-bank formal institutions at 32%.
Females were more likely to report us-ing informal financial services than males (34% compared to 27%).
Financial access strand,2009 and 2013, %
Overall usage of informal financial prod-ucts and services increased by 14 percent-age points from 60% in 2009 to 74% in 2013.
The population of financially excluded adults in Uganda reduced from 4.3 million (30% of adults in 2009) to 2.6 million (15% of adults in 2013).
Overall usage of financial services, 2009 and 2013, %
FinScope III SURVEY 2013 FINDINGS
6
Who were financially excluded? The population of financially excluded
adults in Uganda reduced from 4.3 million (30% of adults in 2009) to 2.6 million (15% of adults in 2013).
Geographically, the proportion of adults excluded from financial services ranges from 3% in Kampala to 24% in Northern Uganda.
In 2013, women were equally likely as men to be excluded from financial services and as such the gender gap in financial exclu-sion that existed in 2009 had been elimi-nated by 2013.
It was mainly the youth and older persons that were more likely to be financially ex-cluded. However, the youth (aged 18-24 years) were more likely to use non-bank financial services than any other age cat-egory.
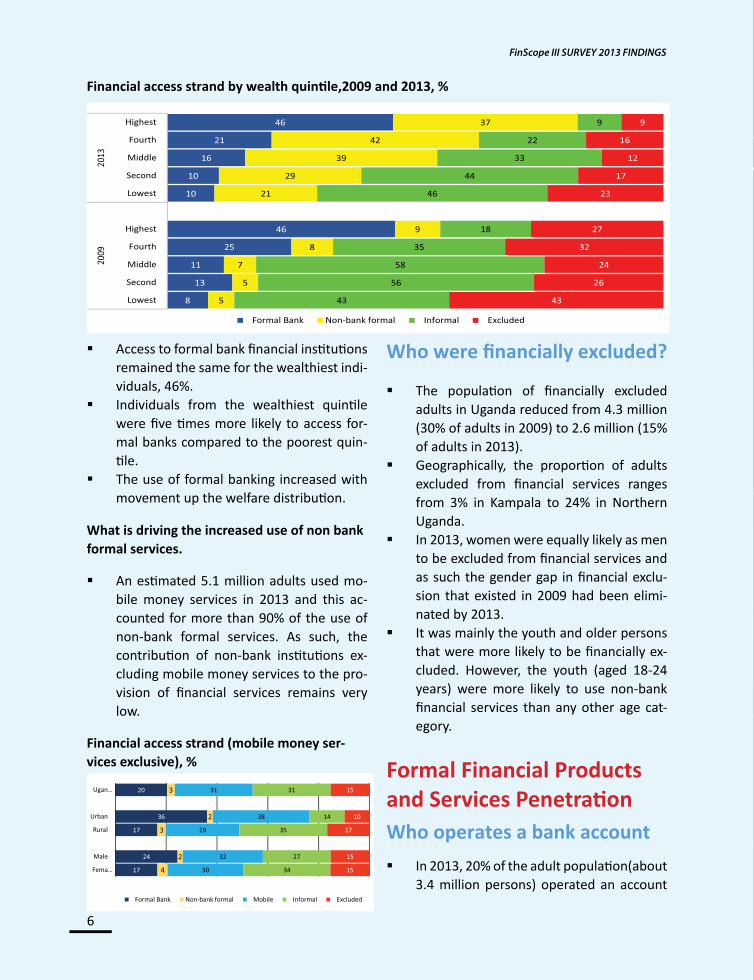
Access to formal bank financial institutions remained the same for the wealthiest indi-viduals, 46%.
Individuals from the wealthiest quintile were five times more likely to access for-mal banks compared to the poorest quin-tile.
The use of formal banking increased with movement up the welfare distribution.
Financial access strand by wealth quintile,2009 and 2013, %
What is driving the increased use of non bank formal services.
An estimated 5.1 million adults used mo-bile money services in 2013 and this ac-counted for more than 90% of the use of non-bank formal services. As such, the contribution of non-bank institutions ex-cluding mobile money services to the pro-vision of financial services remains very low.
Financial access strand (mobile money ser-vices exclusive), % Formal Financial Products
and Services PenetrationWho operates a bank account
In 2013, 20% of the adult population(about 3.4 million persons) operated an account
FinScope III SURVEY 2013 FINDINGS
7
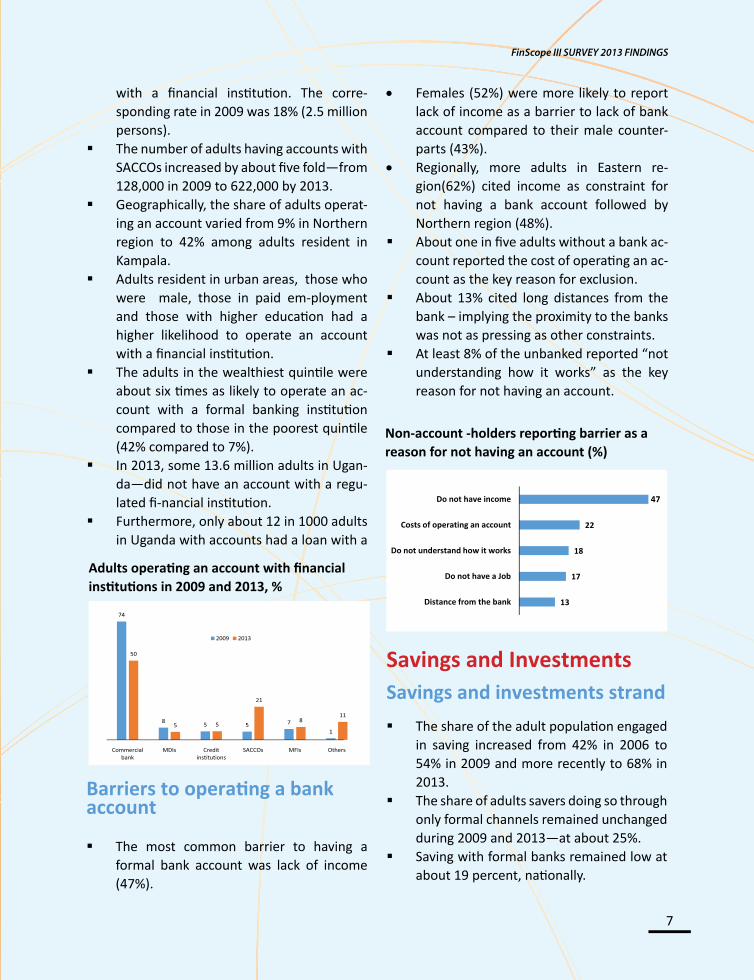
with a financial institution. The corre-sponding rate in 2009 was 18% (2.5 million persons).
The number of adults having accounts with SACCOs increased by about five fold—from 128,000 in 2009 to 622,000 by 2013.
Geographically, the share of adults operat-ing an account varied from 9% in Northern region to 42% among adults resident in Kampala.
Adults resident in urban areas, those who were male, those in paid em-ployment and those with higher education had a higher likelihood to operate an account with a financial institution.
The adults in the wealthiest quintile were about six times as likely to operate an ac-count with a formal banking institution compared to those in the poorest quintile (42% compared to 7%).
In 2013, some 13.6 million adults in Ugan-da—did not have an account with a regu-lated fi-nancial institution.
Furthermore, only about 12 in 1000 adults in Uganda with accounts had a loan with a
Adults operating an account with financial institutions in 2009 and 2013, %
Barriers to operating a bank account
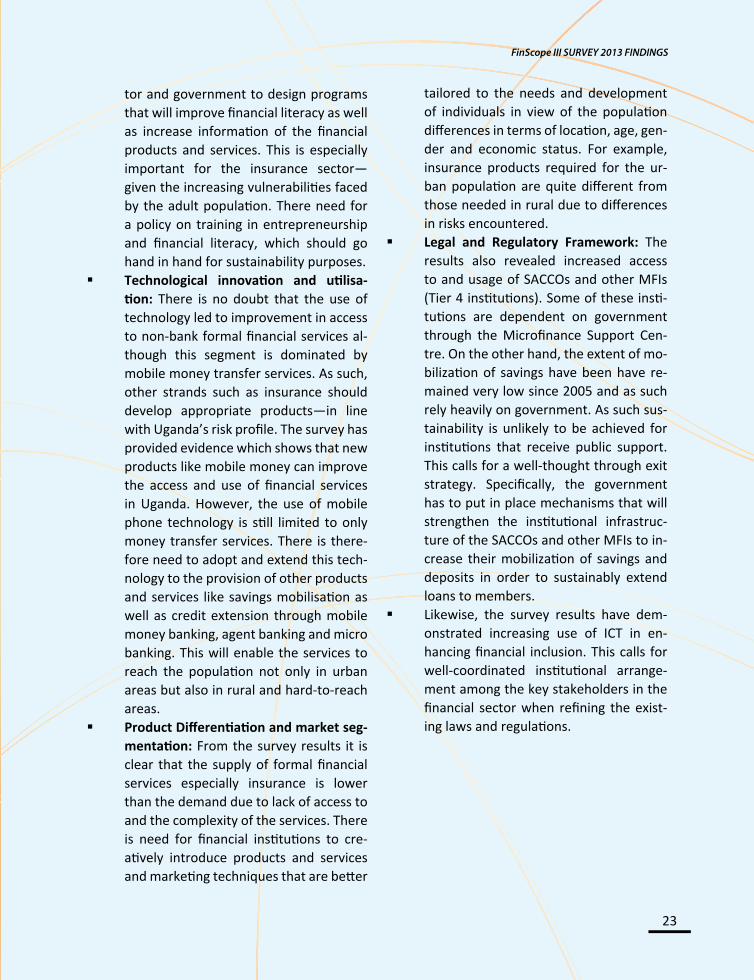
The most common barrier to having a formal bank account was lack of income (47%).
• Females (52%) were more likely to report lack of income as a barrier to lack of bank account compared to their male counter-parts (43%).
• Regionally, more adults in Eastern re-gion(62%) cited income as constraint for not having a bank account followed by Northern region (48%).
About one in five adults without a bank ac-count reported the cost of operating an ac-count as the key reason for exclusion.
About 13% cited long distances from the bank – implying the proximity to the banks was not as pressing as other constraints.
At least 8% of the unbanked reported “not understanding how it works” as the key reason for not having an account.
Non-account -holders reporting barrier as a reason for not having an account (%)
Savings and InvestmentsSavings and investments strand
The share of the adult population engaged in saving increased from 42% in 2006 to 54% in 2009 and more recently to 68% in 2013.
The share of adults savers doing so through only formal channels remained unchanged during 2009 and 2013—at about 25%.
Saving with formal banks remained low at about 19 percent, nationally.

FinScope III SURVEY 2013 FINDINGS
8
Knowledge and Practice of SavingWhat is understood by “Saving”?
Putting money in a special place/account for the money to be safe was the most cited con-sideration of what appears to be savings (41%) followed by money being put in an activity/somewhere to earn profits/returns (35%).
Adult males, and those adults residing in urban areas were more likely to save in commercial banks/MDIs relative to other socio-economic groups.
Other findings suggest that characteristics such as the formal employment, educa-tional attainment and wealth quintile sta-tus were the biggest differentiators of use of formal bank institutions.
The proportion of adults who save money at “home/secret places” increased from 18% in 2009 to 25% in 2013.
Adult males were two times more likely to save with formal institutions compared with their female counterparts.
Savings and Investments Strand, %
How the adults saved
The most cited saving behaviour was putting money in a special place or account for the money to be safe (48% – representing 8.1 mil-lion adults) followed by investing an activity or somewhere so that it can yield profits or returns (42% – representing about 7 million adults).
Females mainly saved by putting money in a special place or account compared to male counterparts who largely put money in an activity that can yield profits.
The adults with no formal education (45%) mainly saved by putting money in a special
In 2013, nearly 5 million adult Ugandans had never saved or invested before.

FinScope III SURVEY 2013 FINDINGS
9
Those in paid employment were more like-ly to save with formal institutions relative to their counterparts in self-employment. This could be partly explained by the fact that it is a requirement from the employ-ers to have a bank account through which the salaries were paid.
Mechanism used to save, (%)
place or account for the money to be safe while their educated counterparts with some secondary education (51%) mainly saved by putting money in an activity or somewhere so that it can yield profits or returns.
Perceptions on what were classified as saving in 2013, %
Reasons for saving
While 68% of the adult population indicat-ed some form of saving/investing (formal/informal), most of the savings were ear-marked for consumption
• The most cited reasons for saving included: provision for basic needs (67%) followed by emergencies (41%), education (33%) and livestock/poultry (22%).
• Broadly, the incidence of saving for emer-gencies reduced from 58% in 2009 to 41% in 2013.
Investment mechanisms, %
Mechanisms used to save The most cited mechanisms for savings is
at home (51%), followed by VSLA/ROSCA (29%) and buying of animals/other assets (18%).
Saving using formal channels increased-with wealth status and education levels.
Planning for retirement/old age Nearly 43% of the adult population (rep-
resenting 6.7 million adults) were doing nothing regarding retirement/old age planning.
Among those that reported to be doing

FinScope III SURVEY 2013 FINDINGS
10
something about retirement, the major-ity cited educating their education (23%), investment in livestock (19%) and financial investment and/or saving (15%), in that or-der of popularity.
Only a very small share reported contribut-ing to NSSF or other pension funds.
Credit and Borrowing
The share of the adults that used credit declined from 44% in 2009 to 35% in 2013 (from 6.3 million to 5.9 million adults, re-spectively).
While the use of formal institutions (for-mal bank and non-bank formal) increased from 5% in 2009 to 12% in 2013, there was a marked decline in accessing credit infor-mal institutions from 34% to 23% respec-tively.
The share of adults not accessing credit (i.e excluded) increased from 55% in 2009 to 65% in 2013.
Credit and borrowing strand
The share of adults that accessed credit only through formal bank institutions re-mained almost unchanged - marginally in-creasing from 5% in 2009 to 6% in 2013.
• By gender, a higher proportion of males (7%) accessed credit from formal banks compared to only 5% of females in 2013.
• Access to credit from formal banks in-creased faster among adults in urban ar-eas compared to their counterparts in ru-ral areas – more notable the rural/urban gap seem to have increased since 2009 by 4 percentage points.
• The higher the educational attainment, the greater the prospects for obtaining credit from banks. For example, persons with an O-level education or above were about six times more likely to receive cred-it from banks compared to their counter-parts with no formal education in 2013.
• Paid employees were more likely to obtain credit from formal bank institutions (8%) compared to their counterparts in other employment status.
Planning for retirement / old age, %
Barriers to saving/investment
The most cited reasons for not saving or investing were; the lack of adequate infor-mation on saving (47%) and lack of money to invest (44%).

FinScope III SURVEY 2013 FINDINGS
11
Overall credit usage, %
Credit and borrowing strand by gender and lo-cation, %
Regionally, the share of adults in Eastern region that accessed credit from formal in-stitutions declined from 10% in 2009 to 6% in 2013.
Western region also recorded the largest increase in shares accessing credit from formal institutions—from 5% in 2009 to 14% in 2013.
The share of adults that accessed credit through only non-bank formal institutions increased by 5 percentage points—from 2% to 7% from 2009 and 2013 respective-ly.
• Partly due to presence of SACCOs, rural adults were more likely to access credit through non-bank formal institutions com-pared to their counterparts in urban areas.
• Western region lead in terms of access to credit from non-bank formal financial institutions with 7% of the people access-ing credit from this particular source com-pared to 5% for Central region and only 2% for Northern region.
The share of adults that accessed credit from informal institutions reduced—from 27% in 2009 to 20% in 2013.
Regardless of socio-economic grouping, exclusion increased between 2009 and 2013 with a widening gender gap. The level of exclusion noted for credit and bor-rowing strand was well above that of the saving/investment strand.

FinScope III SURVEY 2013 FINDINGS
12
Forms of credit accessed by adults during past year, %
The largest share of the adult population accessed credit in form of goods and mon-ey (24%). This was followed by goods only (17%) and money only (14%).
Adults in paid employment borrowed more in form of goods and money (34%) compared to 24% for the self-employed and only 13% for the unemployed.
Western region had the highest propor-tion of its people accessing credit in form of money and goods (38%).
Why adults borrowed?
Majority of the people borrowed for con-sumption purposes. The most cited reason for borrowing was financing education for children (20%) followed by emergences such as illness (15%). In third position was the need to meet daily expenses (14%).
One in every ten borrowers borrowed for agriculture production. Females were less likely to borrow for agriculture than males (8% compared to 12%).
Residents of Northern region were more likely to borrow for agricultural production (14%) compared to Western region (12%), Central region (9%) and Eastern region (7%).
The biggest proportion of the adults that borrowed to finance agriculture produc-tion allocated resources to purchase of in-
Main reasons for accessing agricultural credit in 2013, %
How much adults borrowed?
The largest proportion of borrowers (73%)took up small loans that did not exceed Ushs 500,000.
Only 14% of borrowers indicated receiving loans in the range of shs 500,000 and shs
puts (54%), followed by hiring farm labour (29%).
Other uses of agriculture credit include purchase of livestock (15%); purchase of agricultural land (8%); and purchase of farm equipment (6%).

FinScope III SURVEY 2013 FINDINGS
13
1,000,000 while those in excess of one mil-lion were only 13 percent.
Borrowers in urban areas were more than two times likely to access loans of more than UShs 1 million and above compared to their counterparts in rural areas (24% compared to 11%).
Male borrowers were almost two times more likely to report taking a loan in ex-cess of UShs 1million (18%), compared to their female counterparts (8%).
Perceptions on whether access to financial institutions improved since 2009, retrospectively %
Understanding of the terms and conditions of loan/credit in 2013, %
Among those obtaining credit, a substan-tial proportion did not read the terms and conditions (16%).
Nearly all the adult borrowers indicated that they understood the terms and condi-tion before taking a loan

FinScope III SURVEY 2013 FINDINGS
14
The largest proportion of adults agreed that it was easier to borrow from VSLAS (53%) in 2013 than 2009 followed by SAC-COs (27%), ROSCAs (21%), in that order.
The likelihood of cited non-improvement in accessing formal financial services was more prevalent for formal banking institu-tions (Bank, credit institutions, MDI) com-pared to non-bank formal institutions.
The largest proportion of adults indicated fearing debts (31%) as the main reason for not accessing credit. The fear was report-ed more among females (34%) than males (27%).
The high cost of loans was the second most frequently cited reason for not accessing credit (14%) followed by lack of security (13%).
Risk Management and Insurance
Risk profile
The most common form of risk affecting household welfare was illness of family mem-bers, which affected 48% of the adult popula-tion.
Usage of Insurance
Only 2% of the adult population (repre-senting an estimated 349,000 adults) re-ported using formal insurance products compared to 43% (7.5 million persons) who use informal insurance products.
• The proportion of males taking up at least one formal insurance product was nearly five times that of females.
• Uptake of formal insurance increased with educational attainment, and wealth quin-tile status.
• Use of informal insurance products/servic-es was a rural phenomenon, more preva-lent among middle aged adults, with a re-gional dimension.
• Preference for informal insurance prod-ucts/services over formal ones was be-cause:Easier to join (48%), cannot afford formal insurance (15%), and never heard about formal insurance (11%).
Barriers to credit, %
Since 2006, illness in the family has been the most prevalent risk phenomenon af-fecting 58% of the adult population in 2006 and 39% in 2009.
At least one in every five adults in 2013 was affected by death of a family member.
Droughts as well as crop/livestock disease were also very prevalent affecting 26% and 15% of Ugandans, respectively.

FinScope III SURVEY 2013 FINDINGS
15
Risk management profile
Most cited strategies included: borrowing from friends/family (18%), seeking for do-nations (18%) and sale of assets (15%)
The incidence of borrowing from friends/family, seeking for donations, and reduced consumptions as risk management strate-gies reduced with wealth quintile status.
Self-employed were more likely to reduce consumption (15%) compared to their counterparts in paid employment (12%).
Barriers to formal insurance
Some 11% of the adult population had never heard about any formal insurance product while a sizeable 18% simply pre-ferred informal groups.
The most cited barriers to use of formal insurance was that persons “do not know about insurance and how it works” (55%).
Barriers to formal insurance services, %
One in two individuals without formal in-surance indicated that formal insurance was expensive and many people cannot afford it (50%)
A large proportion reported that they did-not know how to go about buying insur-ance (17%) while others never thought about it (17%).
Only a small share of adults without insur-ance reported not knowing where to buy insurance (10%).
Barriers to informal insurance
The barriers were governance, institution-al and trust in nature
• Most cited barrier was failure of members to pay their contributions (43%), followed by members pulling out (40%)
Barriers to informal insurance services in 2013, %
Remittances and money transfers
Overall access to remittances & transfers, %

FinScope III SURVEY 2013 FINDINGS
16
Use of money transfer services in 2013, %
Regarding the financial landscape, the share of the adults that received remit-tances nearly doubled from 30% in 2009 to 55% by 2013.
Receiving formal (non-bank) remittances and transfers—increased from 11% to 41% during 2009 and 2013.
Among those receiving transfers, majority reported receiving funds on a monthly ba-sis (36%) with the least share being weekly remittances (10%).
Most of the transfer funds received were from within Uganda. At least 41% of adults (7.5 million persons) received money from within Uganda while only about 4% of adults (0.6 million persons) received trans-fers from across the borders.
In terms of trends, in 2009, 29% of adults received money from within Uganda (4.1 million persons) while 5% of adults re-ceived remittances from outside Uganda (0.7 million person).
Kampala leads in receiving funds from abroad with at least 14% of adults in the capital that received funds from outside Uganda.
The most common formal method of re-ceiving funds was by mobile money (30%).
About 9% of individuals in Kampala who received funds indicated receiving via in-ternational money transfer services (West-ern Union and Money Gram).
In both rural and urban areas, the trans-fers were mainly used for home consump-tion—about 62 percent.
The second most frequently cited use of transfer funds was child education and this was followed by child care.
Only a small proportion of respondents invested the transfers received in farm-ing—18% in rural areas and 9% in urban areas.
Relatively fewer people used the received money for investing in income generating activities like farming (16%) or in business-es (13%).
Regularity of receiving remittances in 2013, %
At least 36% of the adult population sent money while a higher share (45%) report-ed receiving transfers.
Males were more likely than females to engage in money transfer services with a higher proportion of males sending money than females (41% compared to 31%).
Geographically, the highest proportions of either sending or receiving money was re-ported in Kampala (about 74%).

FinScope III SURVEY 2013 FINDINGS
17
Mobile Money Services
Uses of remittances by location in 2013, %
Since their introduction in 2009, the use of mobile money services has grown and sur-passed other forms of non-bank formal finan-cial services. The share of registered mobile money us-
ers was higher than bank account holders as well as other users of non-bank financial institutions.
The growth in use of mobile money ser-vices could be attributed to the ease, con-venience and relatively lower cost (both direct and indirect) of using the services compared to other formal services.
Nearly 77% of the adults in Uganda had-knowledge of mobile money.
Only 34% of the adult population in Ugan-da were registered users of the service.
A large proportion of the users accessed mobile money services through a third party’s account.
Knowledge & use, %
Use of mobile money services, %

FinScope III SURVEY 2013 FINDINGS
18
Main source of financial infor-mation
The main source of financial information was radio used by 53% of the adult popu-lation.
More females than males receive financial information from friends/relatives (38% compared to 26%).
Majority of respondents requested for more financial knowledge on savings (65%) followed by investment (48%) and budgeting (31%).
Only 15% of adults requested for more fi-nancial knowledge on opening an account while the corresponding rate for insurance was 12%.
A higher share of the adult population re-quested for information on savings (65%) compared to 12% on insurance.
More adults with no formal education (69%) requested for information on sav-ings compared to their counterparts with ordinary secondary education and above.
Financial Literacy and Consumer Protection
Barriers to mobile money services
The most cited reasons for not using mo-bile money was lack of a cell phone (26%).
A slightly higher share of females than males had no mobile phone as the barrier to use of mobile money.
A large proportion lacked income (18%) as the reason for the non-use of mobile mon-ey.
Only 9% of respondents who were not us-ing mobile money indicated limited infor-mation as the reason for exclusion.
Barriers to use of mobile money by gender, %
Areas where further information is re-quired, %
What transactions done, %

FinScope III SURVEY 2013 FINDINGS
19
Financial literacy
Overall financial literacy was low in Ugan-da with a large proportion of adults un-able to fully comprehend issues regarding interest rates (49%), discount rates (45%) and money lending (59%).
Only 60% of respondents stated that the main repercussion of being unable to pay back loans was losing the property which the borrower provided as collateral. This increases with education level and more prevalent in urban areas.
30% cited imprisonment and this reduces with education and more prevalent among the youths and senior citizens compared to their middle aged counterparts.
Consumer protection
Nearly 11% of the adults reported dissatis-faction with financial service providers.
When dealing with financial challenges, most adults went to local councils (46%). The relatively higher percentage on LCs could be reflecting the level of usage of informal financial services/products in the
Interest monthly vs annual, % Discount on bicycle, %
financial sector. Only about one in three Ugandans (34%)
mentioned that they get clear and easy-to-understand information from financial institutions while 42% trust the advertising of financial service providers.

FinScope III SURVEY 2013 FINDINGS
20
Transparency of Financial Institutions in 2013, %
For adults that had ever taken a financial product, nearly 6% were surprised that the product had hidden fees/charges.
Conclusions and Implicationstions
Overall there has been remarkable improvement in financial inclusion in Uganda since 2009; however, this im-provement was registered mainly in the non-bank formal sector largely driven by the introduction and growth in mobile money services. If mobile money is ex-cluded—which is largely used for money transfers and not financial intermediary, formal financial inclusion in Uganda re-mains low when compared with other countries like South Africa, Namibia, Swaziland and Kenya where similar Fin-Scope Surveys have been carried out.
Financial inclusion through formal bank-ing institutions of the adult population remained unchanged after a four-year period despite an increase in the num-ber of commercial banks and commercial bank branches during this period.
The low usage of the formal banking products and services impacts heavily on the level of savings mobilised domesti-cally through the financial system, which in turn affects access to credit and invest-ment by the private sector.
Majority of the adult population were excluded from borrowing from financial institutions which limits prospects of en-gaging in economic activities resulting into low economic growth, low incomes and unemployment.
The few Ugandans who borrow do so largely through informal institutions, which by their very nature are too small and less capitalised to support the start-up or expansion of business investments

FinScope III SURVEY 2013 FINDINGS
21
that can bring about significant economic growth and development. Furthermore, the majority of those who borrowed from informal institutions did so mainly for consumption purposes and less for in-vestment.
Access and usage of formal insurance products and services in Uganda re-mained low. Subsequently, the major-ity of the adult population resorted to informal ways (with all their limitations) to hedge against risk. Limited use of in-surance services negatively retards the growth of business enterprises that are prone to risk and thus inhibits the entre-preneurship potential of the country.
The low usage of insurance products and services was, among other things, partly attributed to lack of knowledge about the insurance industry by the majority of the population in addition to the high cost of insurance products and services. Despite the reforms in the sub-sector, the low level of penetration of the insurance ser-vices shows that the sector is still oper-ating under capacity and further reforms are necessary to increase the outreach on insurance services.
The level of financial literacy among the adult population also remained low. This was particularly demonstrated when it came to solving simple arithmetic prob-lems involving interest rates and financial numeracy. Low literacy and numeracy levels limit the individuals´ ability to di-gest financial information and to make informed financial decisions. Lack of knowledge about existing financial prod-ucts and services was rife among a large proportion of the adult population.
The information gap also suggests a re-quirement for financial institutions to increase their outreach of financial in-
formation services to the public through the available channels including the me-dia, in addition to customizing important messages to rural areas. Although the majority of Ugandans seem to be satis-fied with the services of the financial institutions this does not correlate with the numbers using the formal banks and those with bank accounts.
Financial institutions need to improve their transparency and fairness in dealing with customers’ complaints—especially by using a language that is conducive to genuine understanding and communica-tion between the client and the service provider. The lack of information is more pronounced for insurance as well as credit and borrowing.
Although a lot has been done to address the supply side constraints, much more needs to be done differently to spur de-mand for and access to formal financial services among the adult population. The barriers to financial inclusion were of multidimensional nature though criti-cal if financial inclusion for the entire adult population is to be realised. The self-reported barriers are both demand-side and supply-side related and also cut across different stakeholders in the financial sector. As such addressing only a single barrier might not translate into improved financial inclusion. If the differ-ent barriers are to be addressed, there is need for coordination and collabora-tion among various stakeholders in order to collectively learn and innovate and where possible scale upon proven inno-vations.
Some key policy actions
Maintaining macroeconomic stability: The results of FinScope 2013 suggest that

FinScope III SURVEY 2013 FINDINGS
22
macroeconomic instability has an ad-verse effect on the utilisation of financial products and services. High inflation ad-versely affects the demand for credit and the cost of borrowing. It also adversely affects savings as well as investment decisions of households as illustrated in Section 5. There is need to maintain mac-roeconomic stability at all times in order to accelerate the growth of the financial sector. There is no doubt that the mac-roeconomic conditions that prevailed between 2009 and 2013 impacted on the demand for formal financial products es-pecially in terms of savings/investments and borrowing.
Spatial targeting to promote financial inclusion: From the results it is clear that access to and use of financial products and services were skewed toward the urban population and better developed regions. Northern region registered the highest level of exclusion—partly due to the lingering effects of the civil war. Hence there is need to consolidate gov-ernment’s efforts to prioritize infrastruc-ture and energy in the region. The pri-vate sector should also be encouraged and/or supported to increase its broad-based investment in activities to comple-ment government efforts. There is no doubt that increased connectivity will unlock the barriers to financial inclusion in Uganda. There should also be efforts to sustain the progress made in financial inclusion across the region. This is illus-trated by the fact while Eastern region was ahead of the Western region in 2009 regarding access to financial services, by 2013, it had slipped in the regional rank-ings.
Promoting broad-based growth: While Uganda has been able to meet the MDG goal of halving poverty—from 56 percent in 1992 to 22 percent in 2013 (preliminary
estimates)—not everyone has benefited from this growth as demonstrated by increasing income inequalities. It is also evident from the survey findings that the development of the financial sector has not benefited all social-economic groups. There were notable gender gaps, rural/urban gaps, and gaps across educational attainment. There is need to promote broad-based growth policies that will lift the majority of the population from pov-erty and reduce income inequality. The results have shown that the rich have a higher chance of accessing and using fi-nancial products and services than the poor. Therefore, it is anticipated that improvement of incomes of the poor will improve their access to financial services.
Promoting broad-based long-term sav-ings and investment to support sustain-able growth: The study reveals that most of the financial services available were of a short-term nature, and therefore suit-able for supporting short-term consump-tion. There is a major gap in the provision of long-term savings mobilisation to sup-port long-term investment efforts. Poli-cies aimed at eradicating slack capacity in long-term savings mobilisation and in-vestment remain critical and paramount.
Financial education and information dis-semination: One of the barriers which leads to financial exclusion—especially in the strands of savings/investments, credit, and insurance is lack of knowl-edge/publicity about these services. This is exacerbated by the low levels literacy and numeracy among the Ugandan pop-ulation. The results have shown that lack of financial knowledge and information is one of the barriers to the use of finan-cial products and services. This calls for intervention from both the private sec-
FinScope III SURVEY 2013 FINDINGS
23
tor and government to design programs that will improve financial literacy as well as increase information of the financial products and services. This is especially important for the insurance sector—given the increasing vulnerabilities faced by the adult population. There need for a policy on training in entrepreneurship and financial literacy, which should go hand in hand for sustainability purposes.
Technological innovation and utilisa-tion: There is no doubt that the use of technology led to improvement in access to non-bank formal financial services al-though this segment is dominated by mobile money transfer services. As such, other strands such as insurance should develop appropriate products—in line with Uganda’s risk profile. The survey has provided evidence which shows that new products like mobile money can improve the access and use of financial services in Uganda. However, the use of mobile phone technology is still limited to only money transfer services. There is there-fore need to adopt and extend this tech-nology to the provision of other products and services like savings mobilisation as well as credit extension through mobile money banking, agent banking and micro banking. This will enable the services to reach the population not only in urban areas but also in rural and hard-to-reach areas.
Product Differentiation and market seg-mentation: From the survey results it is clear that the supply of formal financial services especially insurance is lower than the demand due to lack of access to and the complexity of the services. There is need for financial institutions to cre-atively introduce products and services and marketing techniques that are better
tailored to the needs and development of individuals in view of the population differences in terms of location, age, gen-der and economic status. For example, insurance products required for the ur-ban population are quite different from those needed in rural due to differences in risks encountered.
Legal and Regulatory Framework: The results also revealed increased access to and usage of SACCOs and other MFIs (Tier 4 institutions). Some of these insti-tutions are dependent on government through the Microfinance Support Cen-tre. On the other hand, the extent of mo-bilization of savings have been have re-mained very low since 2005 and as such rely heavily on government. As such sus-tainability is unlikely to be achieved for institutions that receive public support. This calls for a well-thought through exit strategy. Specifically, the government has to put in place mechanisms that will strengthen the institutional infrastruc-ture of the SACCOs and other MFIs to in-crease their mobilization of savings and deposits in order to sustainably extend loans to members.
Likewise, the survey results have dem-onstrated increasing use of ICT in en-hancing financial inclusion. This calls for well-coordinated institutional arrange-ment among the key stakeholders in the financial sector when refining the exist-ing laws and regulations.
FinScope III SURVEY 2013 FINDINGS
24
ECONOMIC POLICY RESEARCH CENTRE
MINISTRY OF FINANCE, PLANNING AND ECONOMIC DEVELOPMENT
REEV CONSULT INTERNATIONAL


www. eprc.or.ugTWITTER: @EPRC_officialwww.facebook.com/EPRCUgandaeprcuganda.blogspot.com
Economic Policy Research CentrePlot 51, Pool Road, Makerere University CampusP.O. Box 7841, Kampala, UgandaTel: +256-414-541023/4Fax: +256-414-541022Email: [email protected]