UGANDA 2013 FinScope III SURVEY REPORT FINDINGS · PDF fileUGANDA 2013 FinScope III SURVEY...
112
UGANDA 2013 FinScope III SURVEY REPORT FINDINGS Unlocking Barriers to Financial Inclusion November 2013 ECONOMIC POLICY RESEARCH CENTRE
Transcript of UGANDA 2013 FinScope III SURVEY REPORT FINDINGS · PDF fileUGANDA 2013 FinScope III SURVEY...

UGANDA 2013 FinScope III SURVEY REPORT FINDINGS
Unlocking Barriers to Financial Inclusion
November 2013
ECONOMIC POLICY RESEARCH CENTRE

ECONOMIC POLICY RESEARCH CENTRE
MINISTRY OF FINANCE, PLANNING AND ECONOMIC DEVELOPMENT
REEV CONSULT INTERNATIONAL

UGANDA 2013 FinScope III SURVEY REPORT FINDINGS
Unlocking Barriers to Financial Inclusion
November 2013


i
UGANDA FiNScope iii RepoRT
Unlocking Barriers to Financial inclusion in Uganda
November 2013
ACKNOWLEDGEMENTS
This report was prepared by the Econom-ic Policy Research Centre (EPRC) as the Implementing Institution for FinScope
III based on the 2013 FinScope III survey data collected by REEV Consult International dur-ing the period June - July 2013. EPRC worked under the guidance of the FinScope III (2013) Steering Committee, which had a Secretariat at the Bank of Uganda. The Steering Com-mittee had a membership drawn from the Ministry of Finance, Planning and Economic Development, Bank of Uganda, Uganda Insur-ance Commission, Capital Markets Authority, Uganda Bankers’ Association, Uganda Insur-ers Association, the Association of Microfi-nance Institutions of Uganda, Uganda Bureau of Statistics (UBOS), Private Sector Founda-tion of Uganda and Development Partners notably UKaid from the Department for Inter-national Development (DFID).
EPRC wishes to extend gratitude to DFID for entirely funding the FinScope III project. Without their financial support this project could not have been implemented as suc-cessfully as it was.
EPRC acknowledges with thanks the contri-butions made by all members of the Steering Committee. We particularly wish to single out for mention the role played by the Uganda Bureau of Statistics (UBOS), which went be-yond the membership of the Steering Com-mittee to other additional responsibilities. UBOS spearheaded the FinScope III survey design and undertook quality assurance of
the work of the Research House. The efforts of UBOS helped FinScope III to collect and an-alyze high quality data on which this report is based. We also acknowledge the role played by the Capital Markets Authority in chairing and providing the necessary stewardship.
Much gratitude is also extended to the Bank of Uganda and in particular the FinScope Sec-retariat for efficiently organizing meetings and coordinating activities.
Ms. Annette Altvater of Development Pio-neer Consultants in Dar es Salaam, Tanzania provided guidance on the development of FinScope III questionnaire between Decem-ber 2012 and January 2013. Her significant contribution is very much appreciated.
FINMARK Trust of South Africa and Founder of FinScope surveys gave us guidance and insight into the FinScope III study especially with regard to generating comparable results with other African countries undertaking Fin-Scope surveys.
Finally, special thanks go to the team of EPRC researchers namely, Musa Mayanja Lwanga, Ezra Munyambonera, Xavier Mugisha, Ibra-him Kasirye and Lawrence Bategeka; and Vi-cent Fred Sennono, Stephen Baryahirwa and Byron Twesigye of the Uganda Bureau of Sta-tistics who meticulously analysed and com-piled the information for this report.
SARAH N. SSEWANYANA, PHDEXECUTIVE DIRECTOR, ECONOMIC POLICY RESEARCH CENTRENovember 2013


iii
UGANDA FiNScope iii RepoRT
Unlocking Barriers to Financial inclusion in Uganda
November 2013
TABLE OF CONTENTS
ACKNOWLEDGEMENTS iEXECUTIVE SUMMARY viii1. INTRODUCTION AND BACKGROUND 11.1 An overview of the Uganda’s financial sector landscape 11.2 Data Sources 31.3 Methodology 41.4 Organisation of the Report 5
2. BACKGROUND CHARACTERISTICS OF THE ADULT POPULATION 62.1 Demographics 62.2 Socio-economic characteristics 62.3 Physical access to financial institutions (supply side) 8
3. FINANCIAL INCLUSION 93.1 Overall financial usage 93.2 Financial access strand 93.3 Comparison with other African countries 143.4 Concluding remarks 15
4. FORMAL Products and services PENETRATION 164.1 Having a bank account with a financial institution 164.2 Nature of transactions conducted at various banking points 184.3 Barriers to having a bank account 194.4 Concluding remarks 21
5. SAVINGS AND INVESTMENTS 225.1 Savings and investments strand 225.2 Knowledge of savings and practice 255.3 Savings mechanisms 275.4 Investment activities/products 305.5 Barriers to saving/investing 325.6 Concluding remarks 33
6. CREDIT AND BORROWING 346.1 Overall credit usage 346.2 Credit and borrowing strand 346.3 Types of credit 376.4 Uses of credit 396.5 Perceptions on credit and borrowing 416.6 Loan size and collateral requirements 426.7 Barriers to credit 436.8 Concluding remarks 44

iv
UGANDA FiNScope iii RepoRT
Unlocking Barriers to Financial inclusion in Uganda
November 2013
7. RISK MANAGEMENT AND INSURANCE 457.1 Risks profile 457.2 Access to and utilisation of insurance services 477.3 Risk management profile 497.4 Barriers to the use of insurance 517.5 Concluding remarks 54
8. REMITTANCES AND MONEY TRANSFER 558.1 Remittances Strand 558.2 Frequency of use of money transfer services 568.3 Channels used to send and receive money transfers 578.4 Frequency of receiving remittances 588.5 Origin of money transfers 598.6 Uses of funds received 608.7 Receiving funds on behalf of others 618.8 Concluding remarks 62
9. ACCESS TO AND UTILISATION OF MOBILE MONEY SERVICE 639.1 Comparison of use of mobile money relative to other financial services 639.2 Knowledge and use of mobile money services 639.3 Utilization of different products 649.4 Utilization of mobile money services by service provider 669.5 Barriers to mobile money services use 679.6 Concluding remarks 68
10. FINANCIAL LITERACY AND CONSUMER PROTECTION 6910.1 Main sources of information 6910.2 Knowledge on the basics of financial literacy 7210.3 Perceptions on loan repayment 7410.4 Consumer Protection 7510.5 Budgeting 7810.6 Concluding remarks 78
11. CONCLUSIONS AND EMERGING POLICY IMPLICATIONS 79REFERENCES 83

v
UGANDA FiNScope iii RepoRT
Unlocking Barriers to Financial inclusion in Uganda
November 2013
LIST OF TABLES
Table 1: Adult population characteristics by location in 2013, % 7Table 2: Distance to the nearest financial institution by location in 2013, % 8Table 3: Use of financial services (mutually exclusive) by adult characteristics in 2013, % 13Table 4: Product and services penetration by adult characteristics in 2013, % 17Table 5: Nature of transactions by socio-economic characteristics and location in 2013, % 18Table 6: Reasons for not having a formal bank account in 2013, % 20Table 7: Savings and investments strand by adult characteristics in 2013, % 24Table 8: Preference for savings and practice by adult characteristics in 2013, % 26Table 9: Savings mechanisms by adult characteristics in 2013, % 28Table 10: Reasons for currently saving/investing by adult characteristics in 2013, % 29Table 11: Investment mechanisms in 2013, % 31Table 12: Reasons for never saving or investing by adult characteristics in 2013, % 32Table 13: Credit and borrowing strand by socio-economic characteristics, % 36Table 14: Forms of borrowing during the last 12 months in 2013, % 38Table 15: Main reasons for utilizing credit services in 2013, % 39Table 16: Form of collateral security required by institution in 2013, % 43Table 17: Reasons for not taking loans by gender and location in 2013, % 43Table 18: Risk encountered in the last 12 months in 2013, % 46Table 19: Overall usage of formal and informal insurance, % 48Table 20: Reasons why the adults preferred informal insurance in 2013, % 49Table 21: Risk management mechanisms by adult characteristics in 2013, % 50Table 22: Barriers to formal insurance products and services in 2013, % 52Table 23: Remittances and transfers, % 56Table 24: Knowledge and use of mobile money services in 2013, % 64Table 25: Transactions done with mobile money in 2013, % 65Table 26: Utilisation of mobile money services by service provider in 2013, % 66Table 27: Reasons for not using mobile money services in 2013, % 67Table 28: The most important sources of financial information in 2013, % 70Table 29: Areas where further financial information is required in 2013, % 71Table 30: Testing knowledge of basic financial literacy in 2013, % 73Table 31: Self-reported perceptions on implications of failure to pay back a loan in 2013, % 74Table 32: Preferred options for dispute settlement in 2013, % 76
List of Appendix Tables
Table A 1: Enumeration areas and households 84Table A 2: Remittances and transfers - Sent, 2013 (%) 87Table A 3: Remittances and transfers – receipts, 2013 (%) 88Table A 4: Use of funds received and recipient in 2013, % 89

vi
UGANDA FiNScope iii RepoRT
Unlocking Barriers to Financial inclusion in Uganda
November 2013
LIST OF FIGURES
Figure 1: Households most important source of income in 2013, % 8Figure 2: Overall usage of financial services, % 9Figure 3: Mutually exclusive use of financial services by institutions, % 10Figure 4: Financial access strand with mobile money services in 2013, % 11Figure 5: Financial inclusion by selected African countries 2009-2012, % 15Figure 6: Operating an account with financial institutions, % 16Figure 7: Savings and Investments strand, % 22Figure 8: Private time and savings deposits (UShs billion) 23Figure 9: Perception on the single most definition of saving in 2013, % 25Figure 10: Means of planning for retirement/old age (mutually inclusive) in 2013, % 30Figure 11: Overall credit usage, % 34Figure 12: Credit and borrowing strand by gender and location, % 35Figure 13: Main reasons for accessing agricultural credit in 2013, % 40Figure 14: Perceptions on whether access to financial institutions improved since 2009, retrospectively % 41Figure 15: Borrowers’ perception on the affordability of their recent loan in 2013, % 42Figure 16: Understanding of the terms and conditions of loan/credit in 2013, % 42Figure 17: Loan size by gender and location in 2013, UShs (‘000), % 42Figure 18: Barriers to informal services use in 2013, % 51Figure 19: Use of money transfer services in 2013, % 57Figure 20: Methods used to send and receive money transfer services in 2013, % 58Figure 21: Regularity of receiving remittances in 2013, % 59Figure 22: Receipt of transfers from within and outside Uganda in 2013, % 60Figure 23: Uses of remittances and transfers by location in 2013, % 61Figure 24: Transparency and fairness of financial institutions in 2013, % 77
APPENDIX 1: SURVEY DESIGN 84

vii
UGANDA FiNScope iii RepoRT
Unlocking Barriers to Financial inclusion in Uganda
November 2013
ACRONYMS AND ABBREVIATIONS
ACSA Accumulating Savings and Credit AssociationsATM Automatic Teller MachineBoU Bank of UgandaCS Pro Census and Survey Processing SystemCV Coefficient of VariationDfID Department for International Development EAs Enumeration AreasEPRC Economic Policy Research CentreGDP Gross Domestic ProductGoU Government of UgandaGPS Geographical Positioning SystemIRA Insurance Regulatory AuthorityLCs Local CouncilsMDIs Micro-Deposit taking InstitutionsMFIs Microfinance Institutions MoFPED Ministry of Finance Planning and Economic Development MTN Mobile Telephone NetworkNDP National Development PlanNGOs Non-governmental OrganisationsNSSF National Social Security FundOPM Office of the Prime MinisterPPS Probability proportion to sizePSU Primary Sampling Unit ROSCAs Rotating, Savings and Credit Associations SACCOs Savings and Credit Cooperative OrganizationsUBoS Uganda Bureau of StatisticsUIA Uganda Insurance AssociationUDHS Uganda Demographic and Health SurveysUNHS Uganda National Household SurveysUSD United States DollarsUShs Uganda ShillingsVSLAs Village Savings and Lending Associations

viii
UGANDA FiNScope iii RepoRT
Unlocking Barriers to Financial inclusion in Uganda
November 2013
EXECUTIVE SUMMARY
I. Introduction
Overtime, Uganda’s financial sector has continued to record some positive changes such as the level of financial development, increased competition and improved efficiency in the financial system. There have also been deliberate efforts by government to strengthen financial inclusion in Uganda since 2001. With these developments in the financial sector, it is important that regular assessments are done to explore the extent to which such developments have translated into improved demand, access to and usage of financial products and services by the Ugandan adult population. As such, regular nationally representative FinScope surveys have been carried out in Uganda and other African countries to provide a basis for monitoring such progress – in terms of demand, access to and use of financial products and services.
To date, FinScope surveys have been carried out in 18 African countries including Uganda. The main objective of these surveys is to determine the levels of access to and use of financial products and services by the adult population. The 2013 FinScope III survey for Uganda follows two previous surveys—FinScope I and II surveys carried out in 2006 and 2009 respectively. Like the earlier surveys, FinScope III sought to establish the level of financial inclusion by looking at access to and usage of financial products and services through four major access strands namely: saving and investment; credit and borrowing; remittances and money transfer; and insurance. Additionally, the survey sought to establish the level of financial literacy amongst the adult population and their perception of consumer protection offered by financial institutions.
I.1 Data Sources
The analysis in the report is based on the 2013 FinScope III survey conducted by REEV
Consult International during June – July 2013. This survey builds on the previous nationally representative FinScope I and II conducted in 2006 and 2009 respectively. However, unlike the previous surveys, FinScope III survey presents an opportunity to track households in future surveys to monitor progress made by the same individuals over time. The survey was also expanded to include mobile money services and a refinement of some questions. It was based on a two stage stratified random sampling design and covered 3,401 households.
The report adopts the financial inclusion framework developed by FinMark Trust, which considers four financial access strands – credit and borrowing; remittances and transfer; savings and investments; and insurance. Within each strand, access to and use of the various products and services (formal and informal) by the adult population (16 years and above) is analysed across gender, life cycle (age), educational attainment, employment status, wealth quintile and spatially. Similar analysis is done based on the self-reported barriers to access and usage of the various financial products and services. At the aggregate level, all the four strands are combined to generate a single indicator – financial access strand.
I.2 Approach
In terms of access and use of financial services through institutions, the report constructs the 2013 financial access strand that is in line with the structure and framework of 2009 FinScope II survey as follows: Formal banks (Regulated by Bank of
Uganda –BoU): commercial banks, microfinance-deposit taking institutions (MDIs) and Credit institutions);
Non-bank formal (other formal) other microfinance institutions (MFIs), Savings and credit cooperative organisations (SACCOs), Insurance

ix
UGANDA FiNScope iii RepoRT
Unlocking Barriers to Financial inclusion in Uganda
November 2013
companies, cell phone mobile money, non-banking financial institutions like foreign exchange bureau, money transfer services like Western Union;
Informal —all other institutions including village savings and rotating groups – Rotating, Savings and Credit Associations (ROSCAs), Village Savings and Lending Associations (VSLAs), Accumulating Savings and Credit Associations (ACSA), Non-government organisations (NGOs), investment clubs, savings clubs, services by employers and other village groups like burial societies and welfare funds. Others informal services include shops and investing through property like houses for rent, livestock and crop produce to be sold later or farm inputs to use at a later date. FinScope III also considers borrowing such as credit from a shop, school, health centre and individuals as informal access; and
Financially excluded (unserved) are non-users of formal banks, non-bank formal or informal institutions. Products and services under financially excluded include saving in a secret place, shops or with friends/relatives; borrowing from friends or family members; or money transfers using individuals.
The analysis is done at individual level for the entire adult population aged 16 years and above, unless stated otherwise. The estimates are weighted to reflect the total adult population. To shed light on financial inclusion of the adult population, the results in 2013 are compared with those based on 2009 FinScope II, where possible.
II. Key Findings
II.1 UseofFinancialInstitutions
Overall usage of financial products and services: Broadly speaking, the Ugandan adult population financial usage was from diverse financial institutions. The share of the adult
population that cited to have accessed formal institutions (banked and non-bank formal) increased by almost two fold from 28 percent in 2009 to 54 percent in 2013. The growth was driven by the increase in the non-bank formal from 20 percent in 2009 to 52 percent in 2013. On the other hand, the increase in the share of the adult population using informal financial institutions (60 percent in 2009 to 74 percent in 2013) was not as fast as that observed for formal financial institutions.
Financial access strand (mutually exclusive): Overall, 85 percent of the adult population had access to and usage of financial services in 2013 while 15 percent were financially excluded. This compares with 70 percent in 2009, with those excluded being 30 percent. The results revealed that in 2013, 20 percent of the adult population (representing 3.4 million adults) were using a formal regulated financial intermediation service, and nearly 34 percent were using only the non-bank formal but not the formal banks, and 31 percent (representing estimated 5.1 million adults) were using only informal institutions but not the formal financial products and services. An estimated 2.6 million adult population were financially excluded in 2013 – contributing about 15 percent of the total adult population. This marks a reduction in financially excluded adult population, from 30 percent (4.3 million adults) in 2009.
In comparison to 2009, use of formal banking institutions remained the same while the share using only non-bank formal institutions but not formal banking institutions increased from 7 percent in 2009 to 34 percent in 2013. This increase was mainly driven by the surge in use of mobile money services between 2009 and 2013.
There were marked variations in access and usage of financial products and services across social groups and spatially. For example, the gender gap observed in financial exclusion in 2009 had diminished in 2013; although

x
UGANDA FiNScope iii RepoRT
Unlocking Barriers to Financial inclusion in Uganda
November 2013
there was a growing gender gap in terms of those who accessed only informal financial products and services – 7 percentage points. While there was a marked decline in the rural/urban divide, use of informal products and services remained higher among adults in rural areas compared to their counterparts in urban areas. The gap declined from 22 percentage points in 2009 to 19 percentage points in 2013. Formal employment, wealth status and educational attainment were the biggest differentiators in the use of formal banking institutions. The adults in the top most quintile were five times more likely to access banks compared to those in the bottom wealth quintile (gap growing over time); and there was a marked decline in use of formal banking institution by those in self-employment.
II.2 Formal Product and Service Penetration
Usage: One in every 5 adults (representing 3.3 million adults) had a formal account of some nature in formal banks or non-bank formal institutions in 2013. This marks a marginal increase from 18 percent (representing 2.5 million) in 2009. There was a significant reduction in the share of the population that operated an account with commercial banks from 74 percent in 2009 to 50 percent in 2013. It is evident that the SACCOs which were legally constituted, but not controlled by BoU had become an option of choice second to commercial banks – the share of the adult population that operated an account increased from 5 percent in 2009 to 21 percent in 2013.
Barriers to having a bank account: The most cited barriers were income/employment related (lack of income (47 percent) and no job (17 percent) and lack of knowledge on how a bank account works (18 percent); supply side constraints included cost of operating an account (22 percent) and distance to bank (13 percent). While the share was low, some 3 percent did not trust the financial
institutions.
II.3 Savings and Investments
Savings and investments strand: The results from the survey revealed that 68 percent of the adult population was saving (both formally and informally) in 2013 indicating an increase from 54 percent in 2009 and 42 percent recorded in 2006 – based on FinScope surveys. By implication, the share of financially excluded but not using home/secret place adult population declined over time—from 29 percent in 2009 to 6 percent by 2013. Ugandans were about twice more likely to save exclusively with informal institutions than with formal institutions. At national level, use of informal institutions increased by 15 percentage points but was marked with a growing gender and rural/urban divide gap. The likelihood to save/invest with a formal banking institution increased with educational attainment and wealth quintile. The youth were more than three times less likely to save/invest with formal banks compared to the middle aged adult population. Despite the developments in the financial sector, a significant proportion of the adult population used home/secret place for saving – the share increased from 18 percent in 2009 to 25 percent in 2013.
Savings mechanisms: Only focused on the adult population that saved in the past 12 months prior to the FinScope III survey. The most cited mechanisms in order of frequency included: home (51 percent), VSLAs/ROSCAs (29 percent) and buying of livestock/assets (18 percent). The practise of using home/secret place exclusively reduces with increasing educational attainment and wealth quintile status. Saving/investing with the bank/MDI was cited by only 19 percent of the adult population. These were mainly the adults who were males, better educated, formally employed and residing in relatively well developed regions.
What drives savings: Those who reported to

xi
UGANDA FiNScope iii RepoRT
Unlocking Barriers to Financial inclusion in Uganda
November 2013
have been saving at the time of the survey indicated multiple reasons why they did so. These included, in order of popularity: meeting basic needs (67 percent), emergencies (41 percent), education (33 percent) and livestock (22 percent). Saving for emergencies reduced but savings for business start-up/expansion increased by wealth quintile status and educational attainment. There was a gender gap with females more likely to save for emergencies while their male counterparts were more likely to save for acquisition of land.
Investment products/activities: One in every 10 adults invested through formal financial institutions (formal bank and non-bank formal) emphasizing low financial penetration. This share increases with educational attainment, wealth quintile status, level of development of the local economy and employment security. On the other hand, investment in informal financial institutions was cited by 47 percent of the adult population. It is evident that females were more likely to invest in informal institutions whereas their male counterparts were more likely to invest in formal ones.
The majority of adult population invested in agriculture and related activities. Specifically, 53 percent of the adult population that indicated to have invested at the time of the survey, most of them cited such investments in farm land (53 percent), 41 percent in livestock, and 39 percent reported investing through an informal group and 24 percent invested in starting up/expanding an existing business. Vulnerable groups i.e. females, the less educated, the unemployed and the poor were more excluded from investment activities compared to their less vulnerable counterparts.
Barriers to savings/investments: The cited barriers seem to point to lack of income and lack of knowledge as reasons for exclusions from savings/investment activities. Citing of
lack of money to save/invest increases with the life cycle. While only 7 percent of adults resident in Kampala cited lack of information on savings, a significant share (66 percent) reported the same in Eastern region. This is a wide spatial variation that needs to be addressed.
II.4 Credit and borrowing
Credit and borrowing strand: The results revealed that access to credit and borrowing was very low in Uganda with only 4 percent of the adult population accessing credit from formal bank institutions. A similar rate (4 percent) accessed credit from non-bank formal financial institutions while 20 percent accessed credit from informal sources.
What drives borrowing: The majority that borrowed did so to finance education of children (20 percent) and to cater for emergencies (15 percent). Only 10 percent of the borrowers borrowed for agricultural production yet majority of Uganda’s population derive their sustenance from agriculture. The biggest proportion of people borrowing to finance agricultural production does so for purchase of inputs (54 percent), followed by hiring farm labour (29 percent). There is a regional dimension – with adults in Northern region more likely to borrow for agricultural production and emergencies whereas those adults resident in Kampala were more likely to borrow for business purposes and acquisition of assets compared to their counterparts in other regions. As noted under savings/investments, borrowing for emergencies reduces with wealth quintile status, educational attainment and level of development of the local economy. A significant share of the youth (18-24 years) cited borrowing for business start-up/expansion compared to their other counterparts.
Terms and conditions, and size of loan: Regarding understanding loan conditions and cost of credit, nearly all the adult borrowers

xii
UGANDA FiNScope iii RepoRT
Unlocking Barriers to Financial inclusion in Uganda
November 2013
understood the terms and conditions before taking a loan. The majority of the borrowers (52 percent) indicated that the loan was affordable against 5 percent that indicated that it was very expensive. The average loan size was relatively small, with 73 percent of borrowers indicating taking small loans that did not exceed UShs 500,000. Male borrowers were almost two times likely to take a loan in excess of UShs1 million (18 percent) compared to their female counterparts (8 percent).
Barriers to credit and borrowing: Some 31 percent of the adult population that never accessed a loan during the past 12 months cited fearing debts as a reason for not doing so. The high cost of loans is the second most frequently cited reason for not accessing credit (14 percent) followed by lack of security (13 percent).
II.5 Insurance and Risk Management
Risk profile: The survey requested the respondents to indicate whether their households experienced shocks in the past 12 months prior to the survey that might have, in turn, negatively impacted on their incomes at individual level. The responses were not mutually exclusive. The most common risks included, in order of frequency: illness of family member (48 percent), drought (26 percent) and death of a family member/relatives (21 percent), price fluctuations (18 percent) and theft (15 percent). The likelihood of citing drought, crop/livestock diseases and ill-health reduced with wealth quintile status. This is expected since the better-off are less likely to be engaged in agriculture-related activities. Furthermore, the self-employed were more likely to cite drought compared to their counterparts in paid employment, whereas the reverse is true for price fluctuations.
Insurance access strand: Use of formal insurance services in Uganda remained low with only 2 percent of adult population
reporting use of these services in 2013 marking a reduction from 3 percent in 2009. Overall usage of informal insurance groups grew between 2009 and 2013. Nearly 44 percent of those using informal groups indicated that it was easier to join such groups; 15 percent said that formal insurance was beyond their means and 11 percent had never heard about formal insurance companies.
Risk management profile: The majority of adult Ugandans (45 percent in 2013) dealt with these risks largely through informal means, such as: borrowing from friends and family, asking for donations from neighbours, relatives and friends, and sale of assets such as land (15 percent). Borrowing from friend/relatives, seeking for donations, reduction in consumption reduces with wealth status. The adult population resident in rural areas was more likely to report sale of assets, borrow from friends/relative and seeking for donations compared to their counterparts in urban areas. A slightly higher share of the youth cited sale of assets compared to their counterparts in other age groups.
Barriers to insurance: While there is a growing usage of informal insurance groups by the adult population, these groups have their own weaknesses. These weaknesses are of governance, institutional development and accountability in nature. On the other hand, there remains multiple barriers to accessing formal insurance. Surprisingly, more than half of the adult population that was not currently using formal insurance products and services at the time of the survey, cited lack of knowledge on how formal insurance work. The other common barriers to formal insurance included high cost cited by 50 percent, others were aware of formal insurance services but did not have knowledge on how it works (17 percent) or even never thought of having one (17 percent).
xiii
UGANDA FiNScope iii RepoRT
Unlocking Barriers to Financial inclusion in Uganda
November 2013
II.6 RemittancesandMoneyTransferservices
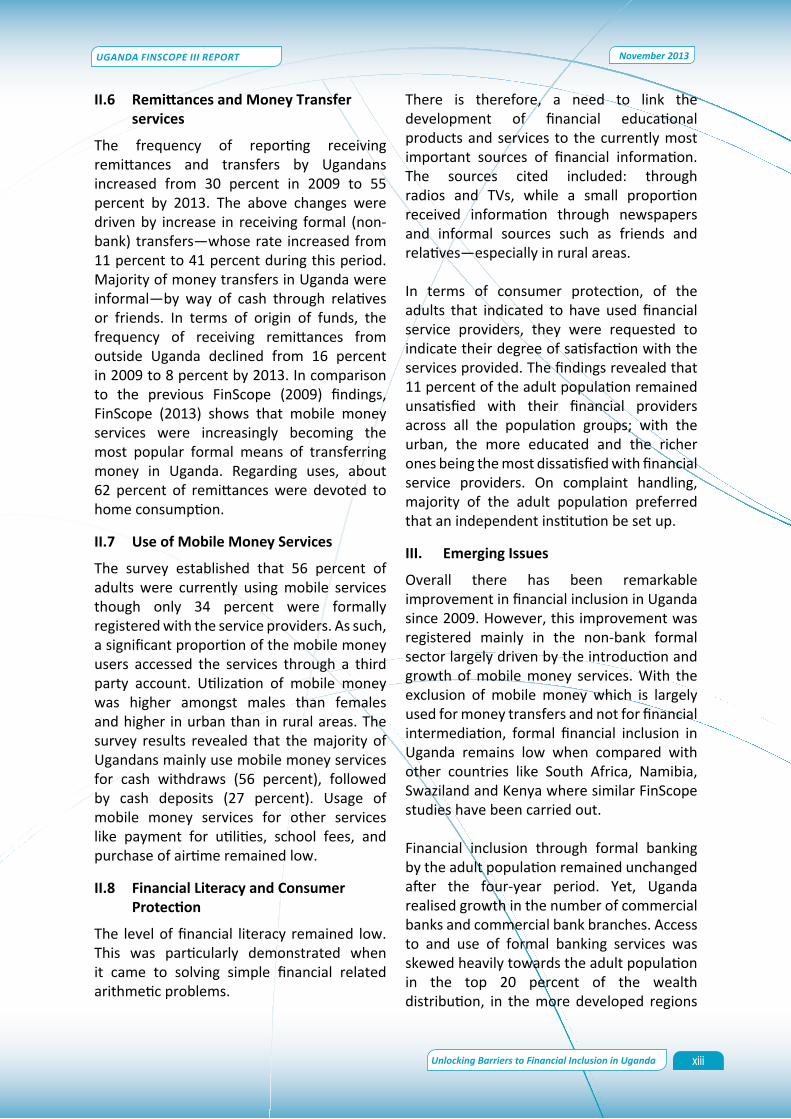
The frequency of reporting receiving remittances and transfers by Ugandans increased from 30 percent in 2009 to 55 percent by 2013. The above changes were driven by increase in receiving formal (non-bank) transfers—whose rate increased from 11 percent to 41 percent during this period. Majority of money transfers in Uganda were informal—by way of cash through relatives or friends. In terms of origin of funds, the frequency of receiving remittances from outside Uganda declined from 16 percent in 2009 to 8 percent by 2013. In comparison to the previous FinScope (2009) findings, FinScope (2013) shows that mobile money services were increasingly becoming the most popular formal means of transferring money in Uganda. Regarding uses, about 62 percent of remittances were devoted to home consumption.
II.7 Use of Mobile Money Services
The survey established that 56 percent of adults were currently using mobile services though only 34 percent were formally registered with the service providers. As such, a significant proportion of the mobile money users accessed the services through a third party account. Utilization of mobile money was higher amongst males than females and higher in urban than in rural areas. The survey results revealed that the majority of Ugandans mainly use mobile money services for cash withdraws (56 percent), followed by cash deposits (27 percent). Usage of mobile money services for other services like payment for utilities, school fees, and purchase of airtime remained low.
II.8 Financial Literacy and Consumer Protection
The level of financial literacy remained low. This was particularly demonstrated when it came to solving simple financial related arithmetic problems.
There is therefore, a need to link the development of financial educational products and services to the currently most important sources of financial information. The sources cited included: through radios and TVs, while a small proportion received information through newspapers and informal sources such as friends and relatives—especially in rural areas.
In terms of consumer protection, of the adults that indicated to have used financial service providers, they were requested to indicate their degree of satisfaction with the services provided. The findings revealed that 11 percent of the adult population remained unsatisfied with their financial providers across all the population groups; with the urban, the more educated and the richer ones being the most dissatisfied with financial service providers. On complaint handling, majority of the adult population preferred that an independent institution be set up.
III. Emerging Issues
Overall there has been remarkable improvement in financial inclusion in Uganda since 2009. However, this improvement was registered mainly in the non-bank formal sector largely driven by the introduction and growth of mobile money services. With the exclusion of mobile money which is largely used for money transfers and not for financial intermediation, formal financial inclusion in Uganda remains low when compared with other countries like South Africa, Namibia, Swaziland and Kenya where similar FinScope studies have been carried out.
Financial inclusion through formal banking by the adult population remained unchanged after the four-year period. Yet, Uganda realised growth in the number of commercial banks and commercial bank branches. Access to and use of formal banking services was skewed heavily towards the adult population in the top 20 percent of the wealth distribution, in the more developed regions

xiv
UGANDA FiNScope iii RepoRT
Unlocking Barriers to Financial inclusion in Uganda
November 2013
and in urban areas; as well as towards persons who were males, with better educational attainment and middle aged contributing further to inequalities across and within these categories.
Although a lot has been done to address the supply side constraints of formal financial services among the adult population, much more needs to be done differently to spur demand and access. Below are some of the key policy actions.
III.1 Maintaining macroeconomic stability
The results of FinScope 2013 suggest that macroeconomic instability has an effect on the utilisation of financial products and services (as illustrated in section 5.1). High inflation adversely affects the demand for credit and the cost of borrowing. It also adversely affects savings as well as investment decisions of firms and households. There is therefore a need to maintain macroeconomic stability at all times in order to accelerate the growth of the financial sector.
III.2 Spatialtargetingtopromotefinancialinclusion
From the results it is clear that access to and use of financial products and services were skewed toward the urban population and better developed regions. Northern Uganda registered the highest level of exclusion—partly due to the lingering effects of the civil war. Hence there is need to consolidate government’s efforts to prioritize development of road infrastructure and energy in the region. The private sector should also be encouraged and/or supported to increase its broad-based investment activities to compliment government efforts.
III.3 Promote broad-based growth
While Uganda has been able to meet the millennium development goals (MDGs) of halving income poverty—from 56 percent in 1992 to 22 percent in 2013 (preliminary estimates)—not every Ugandan has benefited
from this growth. The study findings have revealed that development of the financial sector has not benefited all socio-economic groups. There are notable gender gaps; rural/urban gaps; and gaps across educational attainment. There is need to promote pro-poor growth policies that will lift the majority of the population from poverty and reduce income inequality.
III.4 Promotingbroad-basedlong-termsavings and investment to support sustainable growth
The study revealed that most of the financial services available were of a short-term nature, and therefore suitable for supporting short-term consumption. There is a major gap in the provision of long-term savings mobilisation to support long-term investment efforts. Policies aimed at eradicating slack capacity in long-term savings mobilisation and investment remain critical and paramount.
III.5 Financialeducationandinformationdissemination
One of the barriers for financial exclusion—especially in the strands of savings/investments, credit, and insurance was due to lack of knowledge about these services. This is exacerbated by the low levels of literacy and numeracy among the Ugandan population. The results showed that lack of financial knowledge and information was one of the barriers to the use of financial products and services. This calls for intervention from both the private sector and government to design programs that will improve financial literacy as well as increase information of the financial products and services. This is especially important for the insurance sector—given the increasing vulnerabilities faced by the adult population. There should be a policy on training in entrepreneurship and financial literacy, which should go hand in hand for sustainability purposes.

xv
UGANDA FiNScope iii RepoRT
Unlocking Barriers to Financial inclusion in Uganda
November 2013
III.6 Technologicalinnovationandutilisation
There is no doubt that the use of technology has led to improvement in access to non-bank formal financial services although this segment is dominated by mobile money transfer services. As such, other strands such as insurance should develop appropriate products—in line with Uganda’s risk profile. The survey has provided evidence which shows that new financial products like mobile money can improve the access and use of financial services in Uganda. However, the use of this mobile phone technology is still limited to only money transfer services. There is therefore need to adopt and extend this technology to the provision of other products and services like savings mobilisation as well as credit extension through mobile money banking, agent banking and micro banking. This will enable the services to reach the population not only in urban areas but also in rural and hard-to-reach areas.
III.7 Productdifferentiationandmarketsegmentation
From the survey results it is clear that the supply of formal financial services especially insurance is lower than the demand due to lack of access to and the complexity of the services. There is need for financial institutions to creatively introduce products and services and marketing techniques that are better tailored to the needs and development of individuals in view of the population differences in terms of location, age, gender, and economic status. For example, insurance products required for the urban population are quite different from those needed in rural due to differences in risks encountered.
III.8 Legal,Institutionalandregulatoryframework
The results also revealed increased access to and usage of SACCOs and other MFIs (Tier 4 institutions). Some of these institutions are dependent on government through the Microfinance Support Centre. On the other
hand, the extent of mobilization of savings has remained very low since 2005 and as such rely heavily on government. As such sustainability is unlikely to be achieved for institutions that receive public support. This calls for a well-thought through exit strategy. Specifically, the government has to put in place mechanisms that will strengthen the institutional infrastructure of the SACCOs and other MFIs to increase their mobilization of savings and deposits in order to sustainably extend loans to members.
Likewise, the survey results have demonstrated increasing use of ICT in enhancing financial inclusion. This calls for well-coordinated institutional arrangement among the key stakeholders in the financial sector when refining the existing laws and regulations.


1
UGANDA FiNScope iii RepoRT
Unlocking Barriers to Financial inclusion in Uganda
November 2013
Uganda’s Vision 2040 highlights access to fi-nance as one of the barriers among others that are affecting the competitiveness of the economy. Most individuals and firms access credit from informal sources. One of the rea-sons for the limited access to credit is the low level of domestic savings which affects the ability by institutions to offer long term finance. As such, the Government of Uganda (GoU) intends to increase gross national sav-ings from the current level of 14.5 percent to about 35 percent of GDP by 2040, as a means to accelerate structural transformation (Na-tional Planning Authority, 2013).
Uganda has made significant progress in im-proving the welfare of its citizens. During the past 10 years, the incidence of income pover-ty has declined from 38 percent in 2002/3 to 22 percent in 2013 (preliminary estimate). On the other hand, GDP grew, on average, over 5 percent during the same period while the agricultural sector performed dismally—with annual growth rates of less than 3 percent on average, during 2002/3-2012/13.
1.1 AnoverviewoftheUganda’sfinancialsector landscape
After independence in 1962 like many devel-oping countries at the time, Uganda pursued financially repressive policies that allowed government to intervene in the financial/banking system. Government intervention was in form of setting up state owned banks, interest rate controls, partial nationalisation of foreign banks and the establishment of a variety of administered lending programmes (Brownbridge 1996). This era of financial repression led to the deterioration in the performance of Uganda´s financial/banking sector. By the early 1990s Uganda´s banking system was among the weakest in Sub-Saha-ran Africa. Its liabilities comprised less than 10 percent of GDP. Domestic credit to the pri-vate sector as a percentage of GDP had fallen from about 9 percent in 1967 to about 4 per-
cent in 1992 (World Bank 2013). The number of commercial bank branches had gradually reduced from 290 in 1970 to only 84 by 1987, of which 70 percent of branches were oper-ated by public sector banks.
1.1.1 Financial sector reforms
After decades of financial repression, the gov-ernment embarked on a programme to liber-alise the financial sector with the intention of improving efficiency in resource allocation, lowering the cost of credit, increasing the ac-cess to banking services by the general popu-lation, and mobilisation of savings, all geared towards financial and economic develop-ment (Kasekende & Atingi-Ego 2003). These reforms that started in the late 1980s, were aimed at removing controls and letting the market forces determine the various prices in the banking/financial sector. The reforms included interest rate liberalisation, reduc-tion in direct credit provided by government, prudent regulation (legal and regulatory re-forms), privatisation of financial institutions, capital account liberalisation, and foreign exchange liberalisation, among others (Bat-egeka & Okumu 2010)
1.1.2Currentfinanciallandscape
Following the reforms, there has been an im-provement in the performance of Uganda’s financial sector. For instance, financial deep-ening as proxied by domestic credit provided by banking sector to GDP increased from 4 percent in 1995 to 17 percent in 2010, lending interest rates fell from 39 percent in 1990 to 20 percent in 2010. The level of non-perform-ing loans in respect to total loans has fallen from above 10 percent in 2000 to about 4 percent by June 2013 (Bank of Uganda 2013). The number of commercial bank branches per 100,000 adults increased from about 1.1 in 2004 to about 2.5 in 2010. Depositors with commercial banks per 1,000 adults increased from 87.1 in 2004 to 191.8 in 2010. These de-velopments point to some level of financial
1. INTRODUCTION AND BACKGROUND

2
UGANDA FiNScope iii RepoRT
Unlocking Barriers to Financial inclusion in Uganda
November 2013
development, increased competition and im-proved efficiency in the financial system in Uganda (Lwanga et al. 2013).
Currently there are 24 commercial banks with a total of over 400 branches, MDIs and credit institutions with over 100 branches. There are three credit institutions and four MDIs, which are complementing commercial banks in the provision of financial products and ser-vices to the population. In addition, 20 insur-ance companies are licensed and regulated by the Insurance Regulatory Authority (IRA). The financial structure also comprises of the microfinance institutions (MFI) which include SACCOs of Tier 41 by grading, providing finan-cial services to people in peri-urban and rural areas. Since 2009, there has been a tremen-dous evolution in mobile money services that has changed Uganda’s financial landscape to include a large proportion of the population that was formerly excluded from the financial services sector.
Despite the noted improvements, financial deepening in Uganda is still very low and the financial system remains underdeveloped in a number of respects. The banking sector is still highly concentrated with 3 out of 24 commercial banks accounting for approxi-mately 50 percent of the total market share i.e. assets, deposits and number of branches (Lwanga et al. 2013). Most commercial bank branches are concentrated in the capital, Kampala, and other urban centres leaving the rural population with no access to commer-cial bank services. The cost of credit in Ugan-da is still very high with prime lending rates averaging 15 percent. Interest rate spreads—one of the measures of the efficiency of the banking sector and therefore instrumental in the mobilization of investible resources—are large about 11 percent between 1992 and
1 In Uganda, financial institutions are graded in tiers based on the minimum capital requirements. Tier 1 are commercial banks with a minimum capi-tal of UShs 25 billion (about US$ 10 million). Tier 2 are credit institutions with a minimum capital of UShs 1 billion (about US$ 400,000). Tier 3 are MDIs with a minimum capital requirement of UShs 500 million (about US$ 200,000). Tier 4 are un-regulated financial institutions not authorized to receive deposits from the public.
2010, on average. As such, the large interest rate spreads discourage potential savers due to low returns on deposits and thus limits fi-nancing for potential borrowers (Lwanga et al. 2013).
1.1.3StrengtheningfinancialinclusioninUganda
In view of the above challenges and weak-nesses, on the supply side, the GoU has undertaken a number of initiatives geared towards enhancing financial inclusion. The most recent ones include: • Establishment of the Microfinance Sup-
port Centre Ltd in 2001. The Centre is funded by GoU, African Development Bank and Islamic Development Bank to facilitate access to affordable, sus-tainable and convenient financial and business development services to ac-tive and productive Ugandans through SACCOs, Unions, other MFIs and SMEs;
• Lifting the moratorium on licensing new banks in July 2007. As a result of this, eight new banks have since been li-censed.2. The period has also witnessed an accelerated branch expansion ei-ther through mergers and acquisitions or through new branch openings. The mergers resulted in less branches or at the most the same number; and
• Establishment of a credit reference bu-reau in 2008, to minimise information asymmetry between lenders and bor-rowers.
With the noted developments in the financial sector, it is imperative that an assessment is done to explore the extent to which such developments have translated into improved financial access to the Ugandan adult popula-tion. As such, regular nationally representa-tive FinScope surveys have been carried out in 18 African countries including Uganda; to provide a basis for monitoring progress in terms of demand, access to, and use of finan-
2 The specific commercial banks licensed since 2007 are Kenya Commercial Bank, Equity Bank, Fina Bank, Global Trust Bank, United Bank for Africa, Eco bank, Housing Finance Bank, ABC Bank (Kenya).
3
UGANDA FiNScope iii RepoRT
Unlocking Barriers to Financial inclusion in Uganda
November 2013
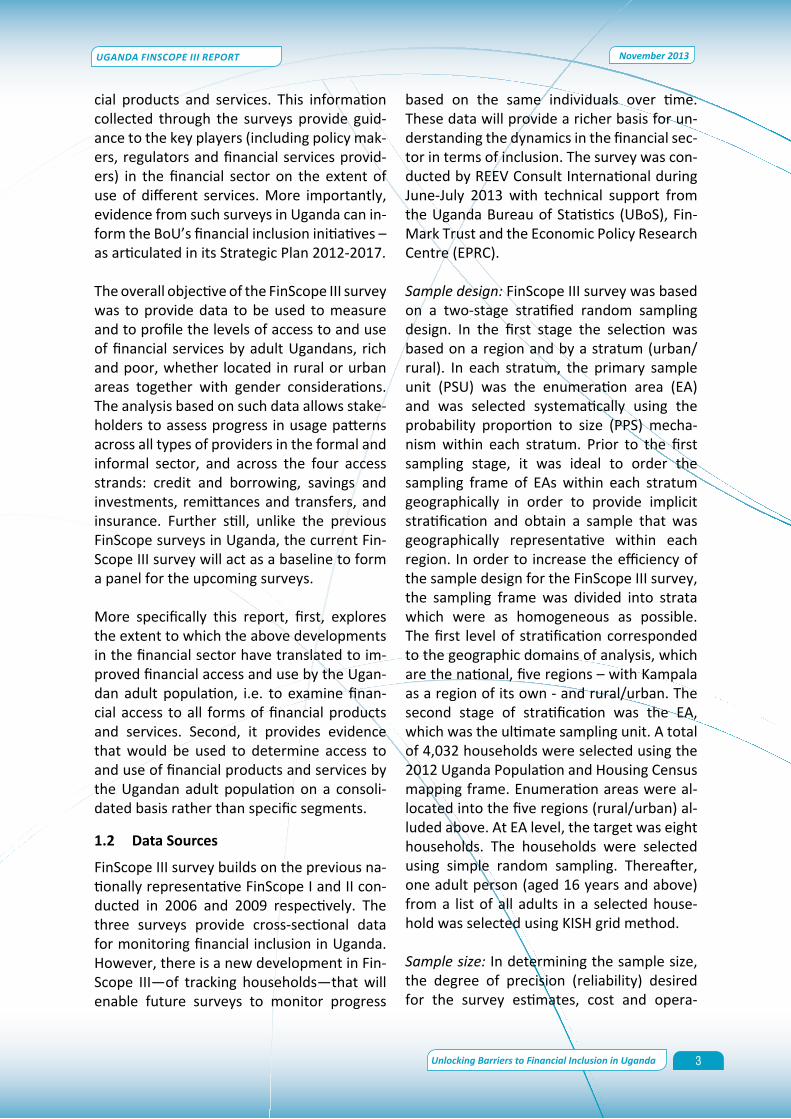
cial products and services. This information collected through the surveys provide guid-ance to the key players (including policy mak-ers, regulators and financial services provid-ers) in the financial sector on the extent of use of different services. More importantly, evidence from such surveys in Uganda can in-form the BoU’s financial inclusion initiatives – as articulated in its Strategic Plan 2012-2017.
The overall objective of the FinScope III survey was to provide data to be used to measure and to profile the levels of access to and use of financial services by adult Ugandans, rich and poor, whether located in rural or urban areas together with gender considerations. The analysis based on such data allows stake-holders to assess progress in usage patterns across all types of providers in the formal and informal sector, and across the four access strands: credit and borrowing, savings and investments, remittances and transfers, and insurance. Further still, unlike the previous FinScope surveys in Uganda, the current Fin-Scope III survey will act as a baseline to form a panel for the upcoming surveys.
More specifically this report, first, explores the extent to which the above developments in the financial sector have translated to im-proved financial access and use by the Ugan-dan adult population, i.e. to examine finan-cial access to all forms of financial products and services. Second, it provides evidence that would be used to determine access to and use of financial products and services by the Ugandan adult population on a consoli-dated basis rather than specific segments.
1.2 Data Sources
FinScope III survey builds on the previous na-tionally representative FinScope I and II con-ducted in 2006 and 2009 respectively. The three surveys provide cross-sectional data for monitoring financial inclusion in Uganda. However, there is a new development in Fin-Scope III—of tracking households—that will enable future surveys to monitor progress
based on the same individuals over time. These data will provide a richer basis for un-derstanding the dynamics in the financial sec-tor in terms of inclusion. The survey was con-ducted by REEV Consult International during June-July 2013 with technical support from the Uganda Bureau of Statistics (UBoS), Fin-Mark Trust and the Economic Policy Research Centre (EPRC).
Sample design: FinScope III survey was based on a two-stage stratified random sampling design. In the first stage the selection was based on a region and by a stratum (urban/ rural). In each stratum, the primary sample unit (PSU) was the enumeration area (EA) and was selected systematically using the probability proportion to size (PPS) mecha-nism within each stratum. Prior to the first sampling stage, it was ideal to order the sampling frame of EAs within each stratum geographically in order to provide implicit stratification and obtain a sample that was geographically representative within each region. In order to increase the efficiency of the sample design for the FinScope III survey, the sampling frame was divided into strata which were as homogeneous as possible. The first level of stratification corresponded to the geographic domains of analysis, which are the national, five regions – with Kampala as a region of its own - and rural/urban. The second stage of stratification was the EA, which was the ultimate sampling unit. A total of 4,032 households were selected using the 2012 Uganda Population and Housing Census mapping frame. Enumeration areas were al-located into the five regions (rural/urban) al-luded above. At EA level, the target was eight households. The households were selected using simple random sampling. Thereafter, one adult person (aged 16 years and above) from a list of all adults in a selected house-hold was selected using KISH grid method.
Sample size: In determining the sample size, the degree of precision (reliability) desired for the survey estimates, cost and opera-

4
UGANDA FiNScope iii RepoRT
Unlocking Barriers to Financial inclusion in Uganda
November 2013
tional limitations, and efficiency of the design were taken into consideration. The actual sampled households with complete informa-tion were 3,401, which translates to a com-pletion rate of 84 percent and response rate of 85 percent. The sample for the FinScope III was designed to provide financial indicator estimates for the country as a whole and for urban and rural areas separately; and for the five regions including Kampala.
Scope of the survey: Like the previous Fin-Scope I and II surveys, FinScope III gathered detailed demographic information of the adult population (individuals aged 16 years and above), socio-economic characteristics and use and non-use of financial services. Particular information collected included: fi-nancial and risk management strategies; fi-nancial discipline and knowledge; attitudes and perceptions of, as well as preference for, financial service providers; usage and atti-tude to mobile money technology; rural and agriculture issues; remittances; and asset ac-cumulation patterns. However, unlike earlier FinScope surveys, FinScope III included a spe-cific section on mobile money as well as ad-ditional questions to reflect the new changes in the financial landscape. The details of the sample design are provided in Appendix 1.
1.3 Methodology
1.3.1 ApproachThe report adopted the financial inclusion framework developed by FinMark Trust, which considers four financial access strands – credit and borrowing; remittances and transfer; savings and investments; and insur-ance. Within each strand, access to and use of the various products and services (formal and informal) was analysed across the adult population segments and spatially. Similar analysis was done based on the self-reported barriers to access and usage of the various products and services. At the aggregate level, all the four strands are combined to generate a single indicator.
1.3.2 Description of key variables used in the analysis
i) Financial access strand: The 2013 fi-nancial access strand is constructed in line with the structure and framework of 2009 FinScope II survey as follows:a. Formal banks regulated by the Central
Bank – Tiers 1-3: This category includes financial institutions that are directly supervised and regulated by BoU. They include: commercial banks, credit insti-tutions and MDIs;
b. Non-bank formal other: includes insti-tutions like the SACCOs and other MFIs, insurance companies and the non-banking financial institutions like for-eign exchange bureau, money transfer services like Western Union, and cell phone money services;
c. Informal includes money lenders, ROS-CAs, ASCAs, VSLAs, (NGOs), investment clubs, saving clubs, services by employ-ers and other village groups like burial societies and welfare funds. It is impor-tant to note that whoever belongs to ROSCAs or Nigiina groups is assumed to be saving informally. Others include shops and investing through property like houses for rent, livestock and crop produce to be sold later or farm inputs to use at a later date. FinScope III also considers borrowing such as credit from a shop, school, health centre and individuals as informal access. How-ever, it is important to note that such kind of borrowing is used as an alterna-tive to borrowing from formal financial institutions and informal institutions or groups; and
d. Financially excluded (unserved): these are non-users of either formal banks, non-bank formal or informal institu-tions. Products and services under fi-nancially excluded include saving in secret place, shops or friends/relatives; borrowing from friends or family mem-bers; or money transfers using individu-als.

5
UGANDA FiNScope iii RepoRT
Unlocking Barriers to Financial inclusion in Uganda
November 2013
ii) Employment categories: The main employment status is categorised as follows: selfemployed; paid employed (full time, part-time and casuals both in private and public institutions); contributing family workers (unpaid for household work) and not work-ing (including still in school, unemployed, and retired/pensioners).
iii) Highest educational attainment: In-formation was gathered on the respondents’ highest level of educational attainment. In the analysis, this variable is categorised into five (5): no formal education (never went to school); some primary (completed primary six and below); completed primary educa-tion; some secondary (completed senior three and below); and ordinary level educa-tion and above (includes all those that com-pleted ordinary secondary level and beyond).
iv) Life cycle: The life cycle of the adult population was captured through age in completed years by the time of conducting the survey. Information on age was captured as a continuous variable but as a categorical variable for the analysis. The life cycle is di-vided into five age groups. This categorisa-tion is done in such a way that the analysis could provide insights into financial inclu-sion segmentation by youth (16-17; 18-24), middle age (25-39; 40-59) and elderly (60 plus). These distinctions do reveal significant differences in both the adult population de-mographic roles and extent of financial inclu-sion.
v) Wealth index: The previous poverty studies on Uganda use consumption expendi-ture as a proxy for measuring the living stan-dards. However, unlike the Uganda National Household Surveys (UNHS), the FinScope sur-veys do not gather information on consump-tion expenditure. Instead, the study con-structed a wealth index that is similar to that commonly used in the Uganda Demographic and Health Surveys (UDHS) reports. The de-tails of how this indicator was constructed is available upon request.
vi) Regional variable: The report uses five regions instead of the usual UBoS statistical administrative regions – Central, Northern, Eastern and Western. The analysis treats Kampala as a separate region from the rest of Central region unless stated otherwise.
It is worth pointing out that the survey ques-tionnaire included the would-be useful policy categories (e.g employment, income sources, among others), some of these categories were collapsed into broader categories so as to generate statistically useful policy-orient-ed analysis. This process was guided by the level of the coefficient of variation (CV). The analysis was done at individual level for the adult population aged 16 years and above, unless stated otherwise. The estimates were weighted to reflect the total adult popula-tion composition. To shed light on financial inclusion of the adult population, the results in 2013 were compared with those based on FinScope II, where possible.
1.4 OrganisationoftheReport
The subsequent sections present the key find-ings based on the FinScope III survey data, and where possible comparisons are made with FinScope II of 2009. More specifically, Section 2 describes the Ugandan adult popu-lation by the most important socioeconomic characteristics and spatially. The section also provides insights into the supply side of the financial sector. Section 3, provides overall insights into the financial access strands and how they relate to key adult population char-acteristics. In the next sections 4-8, discus-sion focuses on the different financial strands – saving and investment; credit and borrow-ing; insurance and risk management, and re-mittances and transfers respectively. Section 9 discusses in-depth findings on access and utilisation of mobile money services prior to the discussion on financial literacy and con-sumer protection in Section 10. Section 11 concludes with implications and concrete key actions for strengthening financial inclusion for state and non-state actors.

6
UGANDA FiNScope iii RepoRT
Unlocking Barriers to Financial inclusion in Uganda
November 2013
2.1 Demographics
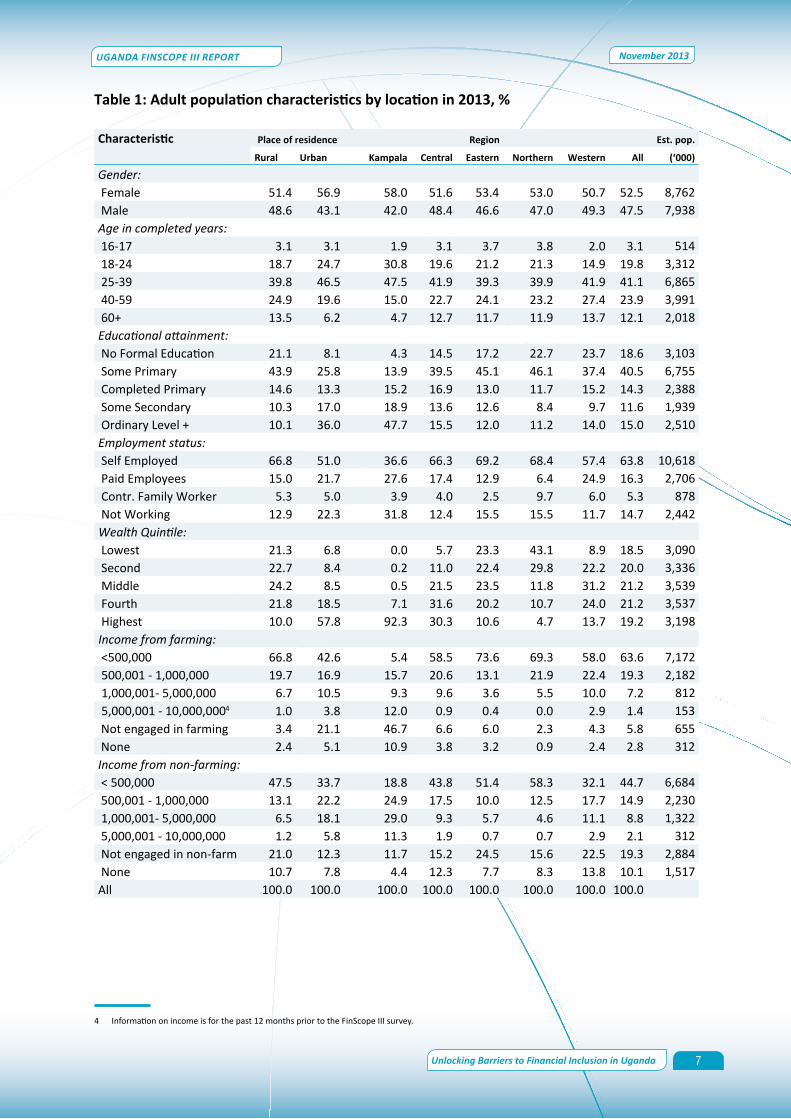
This section presents demographics and so-cio-economic profile of the target adult pop-ulation. The results are presented in Table 1. The total adult population is estimated at 16.7 million persons, with nearly 48 percent of the adult population being males. In terms of life cycle, 23 percent were below 25 years and 40 percent of the adult population were aged between 25 – 39 years.
2.2 Socio-economiccharacteristics
At the national level, nearly two fifth of the adult population had attained some pri-mary education driven largely by individu-als resident in rural areas, and Eastern and Western regions. The adults in urban areas were more likely to have completed second-ary education and above compared to their counterparts in rural areas. Nearly 48 percent of Kampala adults had completed secondary education and above, a share well above the national average of 15 percent. Throughout the report, it was not possible to make com-parison by educational attainment over time. The variable was not captured in the same way in both previous surveys.
Nationally, 19 percent of the adult popula-tion fall in the lowest wealth quintile. The corresponding estimate for Northern region was 43 percent followed by Eastern region at 23 percent. In Kampala, 92 percent of the adult population was in the top 20 percent of the wealth distribution compared to about 5 percent in Northern region. The poverty profile based on the wealth quintile by geo-graphic location mirrors similar patterns as those based on the monetary poverty profile (see Ssewanyana & Kasirye, 2012/2013).
Turning to livelihood, the results in Table 1 confirm the importance of agriculture as the main source of employment and income. Nearly 64 percent of the adult population were self-employed. As expected the share of self-employed adults in rural areas was 67 percent, was well above the national average. Residents in Kampala were more likely to be in paid employment relative to their counter-parts in other regions. Some 15 percent of the adult population did not work in the past 12 months prior to the survey. In terms of source of income, the results suggest that the majority of the adult population (64 percent) earned less than UShs 500,0003 in a year. The particular activities engaged in (in order of importance) included: sale of produce from own food crop production; running own busi-ness; working on other people’s farms; and sale of produce from own cash crop produc-tion.
3 This income level is equivalent to USD200 at the exchange rate of USD1=Shs2,580.
II RESULTS OF THE SURVEY
2. BackgroundCharacteristicsoftheAdultPopulation
7
UGANDA FiNScope iii RepoRT
Unlocking Barriers to Financial inclusion in Uganda
November 2013
Table1:Adultpopulationcharacteristicsbylocationin2013,%
Characteristic Place of residence Region Est. pop.
Rural Urban Kampala Central Eastern Northern Western All (‘000)
Gender: Female 51.4 56.9 58.0 51.6 53.4 53.0 50.7 52.5 8,762 Male 48.6 43.1 42.0 48.4 46.6 47.0 49.3 47.5 7,938Age in completed years: 16-17 3.1 3.1 1.9 3.1 3.7 3.8 2.0 3.1 514 18-24 18.7 24.7 30.8 19.6 21.2 21.3 14.9 19.8 3,312 25-39 39.8 46.5 47.5 41.9 39.3 39.9 41.9 41.1 6,865 40-59 24.9 19.6 15.0 22.7 24.1 23.2 27.4 23.9 3,991 60+ 13.5 6.2 4.7 12.7 11.7 11.9 13.7 12.1 2,018Educational attainment: No Formal Education 21.1 8.1 4.3 14.5 17.2 22.7 23.7 18.6 3,103 Some Primary 43.9 25.8 13.9 39.5 45.1 46.1 37.4 40.5 6,755 Completed Primary 14.6 13.3 15.2 16.9 13.0 11.7 15.2 14.3 2,388 Some Secondary 10.3 17.0 18.9 13.6 12.6 8.4 9.7 11.6 1,939 Ordinary Level + 10.1 36.0 47.7 15.5 12.0 11.2 14.0 15.0 2,510Employment status: Self Employed 66.8 51.0 36.6 66.3 69.2 68.4 57.4 63.8 10,618 Paid Employees 15.0 21.7 27.6 17.4 12.9 6.4 24.9 16.3 2,706 Contr. Family Worker 5.3 5.0 3.9 4.0 2.5 9.7 6.0 5.3 878 Not Working 12.9 22.3 31.8 12.4 15.5 15.5 11.7 14.7 2,442Wealth Quintile: Lowest 21.3 6.8 0.0 5.7 23.3 43.1 8.9 18.5 3,090 Second 22.7 8.4 0.2 11.0 22.4 29.8 22.2 20.0 3,336 Middle 24.2 8.5 0.5 21.5 23.5 11.8 31.2 21.2 3,539 Fourth 21.8 18.5 7.1 31.6 20.2 10.7 24.0 21.2 3,537 Highest 10.0 57.8 92.3 30.3 10.6 4.7 13.7 19.2 3,198Income from farming: <500,000 66.8 42.6 5.4 58.5 73.6 69.3 58.0 63.6 7,172 500,001 - 1,000,000 19.7 16.9 15.7 20.6 13.1 21.9 22.4 19.3 2,182 1,000,001- 5,000,000 6.7 10.5 9.3 9.6 3.6 5.5 10.0 7.2 812 5,000,001 - 10,000,0004 1.0 3.8 12.0 0.9 0.4 0.0 2.9 1.4 153 Not engaged in farming 3.4 21.1 46.7 6.6 6.0 2.3 4.3 5.8 655 None 2.4 5.1 10.9 3.8 3.2 0.9 2.4 2.8 312Income from non-farming: < 500,000 47.5 33.7 18.8 43.8 51.4 58.3 32.1 44.7 6,684 500,001 - 1,000,000 13.1 22.2 24.9 17.5 10.0 12.5 17.7 14.9 2,230 1,000,001- 5,000,000 6.5 18.1 29.0 9.3 5.7 4.6 11.1 8.8 1,322 5,000,001 - 10,000,000 1.2 5.8 11.3 1.9 0.7 0.7 2.9 2.1 312 Not engaged in non-farm 21.0 12.3 11.7 15.2 24.5 15.6 22.5 19.3 2,884 None 10.7 7.8 4.4 12.3 7.7 8.3 13.8 10.1 1,517All 100.0 100.0 100.0 100.0 100.0 100.0 100.0 100.0
4
4 Information on income is for the past 12 months prior to the FinScope III survey.

8
UGANDA FiNScope iii RepoRT
Unlocking Barriers to Financial inclusion in Uganda
November 2013
2.3 Physicalaccesstofinancialinstitutions(supply side)
In terms of physical access to financial insti-tutions, Table 2 reveals that access varied by type of institution and location. The adult population resident in urban areas and in par-ticular Kampala had better access to financial institutions relative to their counterparts in other regions. The gap (based on share of the
Figure1:Householdsmostimportantsourceofincomein2013,%
adult population) between rural and urban areas was least with informal institutions – 10 percentage points. It is also evident that adults resident in Central and Western re-gions had better access to commercial banks than Eastern and Northern regions. These findings have implications for financial inclu-sion as discussed in the subsequent sections.
Table2:Distancetothenearestfinancialinstitutionbylocationin2013,%
Location Commercial bank Semi-formal Informalinstitution
<5 km > 5 km <5 km > 5 km <5 km > 5 kmPlace of residenceRural 21.5 78.5 44.9 55.1 84.3 15.7Urban 57.7 42.3 81.4 18.6 94.2 5.8Region:Kampala 93.3 6.7 96.9 3.1 100.0 0.0Central 36.5 63.5 50.5 49.5 86.9 13.1Eastern 22.9 77.1 43.9 56.1 84.6 15.5Northern 12.7 87.3 43.7 56.4 85.1 14.9Western 32.5 67.6 60.3 39.7 85.9 14.1Uganda 28.5 71.5 51.0 49.0 85.9 14.1

9
UGANDA FiNScope iii RepoRT
Unlocking Barriers to Financial inclusion in Uganda
November 2013
3. Financial Inclusion
This Section presents the status of Uganda fi-nancial inclusion consolidated for all the four access strands as described in Section 1 – sav-ings and investment, credit and borrowing, remittance and transfers, and insurance. The Section discusses the overall usage of finan-cial institutions as a first step in understand-ing the financial access strand. The analysis is done across the socio-economic characteris-tics of the adult population and spatially.
3.1 Overallfinancialusage
Broadly speaking, the adult population ac-cessed multiple source of diverse financial service institutions. Figure 2 presents the overall usage of financial services by the adult population. The share of the adult population that accessed formal institutions (banked and non-bank formal) increased by almost two fold from 28 percent in 2009 to 54 percent in 2013. The growth was driven by the increase in the non-bank formal from 20 percent in 2009 to 52 percent in 2013. On the other hand, the increase in the adult population using informal institutions was not as fast as that observed for formal financial institu-tions. Although not presented in Figure 2, 15 percent of the adult population (representing 2.6 million adults) accessed both formal and informal financial institutions.
3.2 Financial access strand
As noted in section 3.1, there are overlaps in the financial products and services usage. In this section, these overlaps are removed. Figure 3 ranks the adult population’s financial access strands based on financial tiers by BoU - mutually exclusive use of financial services. Nearly 85 percent of the adult population had access to financial institutions in 2013 compared to 70 percent in 2009. The results reveal that in 2013, 20 percent of the adult population (translates into an estimated 3.4 million adults) were using formal regulated fi-nancial intermediation service, and nearly 34 percent were using only non-bank formal in-stitutions, and 31 percent (translates into an estimated 5.1 million adults) were using only informal institutions financial products and services. About 2.6 million adults were finan-cially excluded in 2013 – contributing about 15 percent of the total adult population. This marks a reduction from 30 percent (4.3 mil-lion adults) in 2009.
Figure 3 further presents a comparison with estimates based on the previous FinScope II survey. Clearly, there are no significant dif-ferences between the proportion of the adult population accessing formal bank institu-tions between 2009 and 2013. Yet, in abso-lute terms, there was an increase of 400,000 adults over a four-year period. This finding
Figure2:Overallusageoffinancialservices,%

10
UGANDA FiNScope iii RepoRT
Unlocking Barriers to Financial inclusion in Uganda
November 2013
suggests a rather slow improvement in the usage of products and services from formal bank institutions. This raises policy concerns of the slow demand for formal bank financial services given the reforms and developments in the financial sector as articulated in Sec-tion 1.
There was a significant reduction in informal inclusion from 42 percent in 2009 to 31 per-cent in 2013 whereas only non-bank formal inclusion increased by 27 percentage points. This could be explained by the movement of a proportion of the population from usage of the informal to non-bank formal products and services especially mobile money services. The rather high incidence of access to infor-mal services by the adult population is partly explained by the emerging rural and commu-nity based savings groups such as VSLAs and ASCAs as channels saving and borrowing.
Of special interest was the significant increase in non-bank formal inclusion to 34 percent in 2013 from 7 percent in 2009 (Figure 3). This drastic change was driven mainly by provision of mobile money services (see Figure 4). In-depth analysis reveals that 5.1 million adults used mobile money services, accounting for more than 90 percent of the non-bank formal services. The usage of mobile money services was three times that of the other non-bank services. As such the non-bank formal ser-vices excluding mobile money accounted for about 3 percent whereas the mobile money services accounted for 31 percent. These findings imply that the contribution of non-bank institutions excluding mobile money services to the provision of financial services remained very low. This finding seem to sug-gest a faster uptake of mobile money services relative to SACCOs and other forms of MFIs. The share of the urban adult population using mobile money services (38 percent) was well
Figure3:Mutuallyexclusiveuseoffinancialservicesbyinstitutions,%
Source: Author’s calculations based on FinScope II and III.

11
UGANDA FiNScope iii RepoRT
Unlocking Barriers to Financial inclusion in Uganda
November 2013
above the national average, and there were observed rural/urban and gender differences. The financial inclusion through mobile mon-ey is attributed to the product innovation of mobile money introduced by the mobile tele-phone networks in 2009. This phenomenon is discussed in detail in Section 9.
the demand for financial services depends on the level of development of the local econo-mies. It is anticipated that the current focus by GoU on infrastructure – notably roads and energy – will partly encourage the financial service providers to move to underserved re-gions.
Figure4:Financialaccessstrandwithmobilemoneyservicesin2013,%
Next the report explores how the above na-tional estimates relate to financial access strands by socio-economic characteristics. Table 3 shows that the patterns and trends observed at national level were similar to those observed by disaggregated characteris-tics. Specifically, the Western region had the least proportion of the financially excluded, whereas the adult population resident in Northern region was more likely to be in-formally included compared to counterparts in other regions. The very low formal finan-cial inclusion in Northern region is partly ex-plained by the high income poverty levels and the low bank concentration as a result of the 20-year civil war experienced in this part of the country. This finding seems to cor-roborate the low physical access to financial institutions as illustrated in Table 2 in section 2.3. As expected, residents of Kampala had the highest proportion of the adult popula-tion using formal banking institutions—49 percent. This is explained by the high concen-tration of financial institutions in Kampala. At least 28 percent of residents in Western region used formal banking institutions, fol-lowed by those in the Central region at 21 percent. Overall, these findings suggest that
Compared to FinScope II in 2009, There was a decline in the use of formal banks in east-ern region, there was a significant increase in Western region in the share of the adult pop-ulation with access to formal banking from 18 percent to 28 percent in 2013. While adults resident in Northern and Eastern regions reg-istered 10 percentage points reduction in the use of informal services over a four year peri-od, the incidence of usage of informal servic-es remained well above the national average – with four in every 10 adults using informal services.
Turning to the rural/urban divide, there are marked differences as shown in Figure 4. The results reveal that 2.2 million adults resident in rural areas had access to formal banking institutions whereas 2.2 million adults were financially excluded in 2013. The rather high incidence of formal banking in urban areas (36 percent) is partly due to the fact that for-mal banking institutions target where there is good customer catchment to transact prof-itable businesses with banks. On the other hand, the adult population in rural areas reg-istered high accessibility to financial services through only informal institutions. The ease

12
UGANDA FiNScope iii RepoRT
Unlocking Barriers to Financial inclusion in Uganda
November 2013
of access to such informal financial services in terms of cost and flexible terms of payment of the loans advanced, partly explains this find-ing. There was a marginal decrease in access to formal banking from 39 percent in 2009 to 36 percent in 2013 among the adult popula-tion in urban areas. This decrease, although, marginal needs policy attention in line with the reforms and developments in the finan-cial sector. Noteworthy, is the seemingly widening rural/urban gap in the share of the adult population accessing non-bank formal financial services and the high incidence of financial exclusion. On the other hand, there are no noticeable gaps in the level of informal and formal banking.
Considering gender, it is clear that access through the formal banking system was more pronounced in males than in females (Fig-ure 4), but the gender gap remained almost the same after a four-year period. The gen-der gap in formal banking could be indicative of the fact that formal financial institutions’ terms and conditions favour males over fe-males, although this should not be inter-preted as deliberate discrimination. While females were more likely to report use of
only informal financial services, their male counterparts were more likely to report use of only formal banking services. Whether the higher likelihood to access and usage of in-formal financial institutions among the adult females was due to easy access and flexible terms is debatable. More importantly, there is a growing gender gap in use of informal financial services. The financial exclusion by gender declined between 2009 and 2013 as well as the gender gap.
Financial inclusion depicts a life cycle dimen-sion (Table 3). In terms of formal banking services, there are noticeable differences between the youth population (18-24 years) with their middle aged (25-39 and those aged 40-59 years) counterparts. Among the youth population only 15 percent were formally in-cluded in the formal banking, well below the national average. The rather high access to non-bank formal services is partly driven by the mobile money services. Both the youth and elderly persons were more likely to be financially excluded at about 19 percent and 23 percent respectively. The levels of exclu-sion were well above the national average.

13
UGANDA FiNScope iii RepoRT
Unlocking Barriers to Financial inclusion in Uganda
November 2013
Table3:Useoffi
nancialservices(m
utua
llyexclusive)b
yad
ultp
opulati
oncha
racteristicsin
201
3,%
2009
2013
Char
acte
ristic
s F
orm
al B
ank
Non
-ban
k fo
rmal
Info
rmal
Exc
lude
d F
orm
al B
ank
Non
-ban
k fo
rmal
Info
rmal
Exc
lude
dAl
lU
gand
a21
.37.
041
.530
.220
.333
.730
.615
.310
0A
ge g
roup
, yea
rs:
16-1
715
.07.
526
.451
.110
.324
.922
.442
.410
018
-24
19.0
8.0
41.3
31.8
14.8
39.0
27.6
18.7
100
25-3
924
.07.
141
.927
.023
.136
.727
.113
.010
040
-59
21.9
6.1
46.8
25.3
25.2
30.7
34.7
9.3
100
60+
20.7
4.9
44.0
30.3
12.7
23.2
41.3
22.9
100
Educ
ation
al a
ttai
nmen
t:N
o Fo
rmal
Edu
catio
n9.
022
.244
.923
.810
0So
me
Prim
ary
13.2
31.2
38.8
16.7
100
Com
plet
ed P
rimar
y17
.344
.825
.212
.710
0So
me
Seco
ndar
y24
.748
.913
.413
.110
0O
-Lev
el +
52.9
32.6
9.0
5.5
100
Empl
oym
ent s
tatu
s:Se
lf Em
ploy
ed20
.67.
647
.324
.517
.935
.533
.513
.110
0Pa
id E
mpl
oyee
s34
.25.
932
.127
.934
.932
.122
.210
.910
0Co
ntr.
Fam
ily W
orke
r11
.28.
046
.634
.214
.334
.232
.519
.010
0N
ot W
orki
ng18
.85.
630
.445
.216
.627
.826
.828
.810
0W
ealth
qui
ntile
:Lo
wes
t8.
25.
343
.343
.39.
520
.746
.423
.410
0Se
cond
13.1
5.2
55.6
26.1
10.4
28.7
43.7
17.2
100
Mid
dle
11.4
6.5
58.1
24.0
15.7
38.7
33.2
12.4
100
Fou
rth
25.0
8.4
34.7
31.9
21.0
41.8
21.6
15.6
100
Hig
hest
45.9
9.1
18.3
26.7
45.5
37.2
8.8
8.6
100
Regi
on:
Kam
pala
48.8
39.8
3.2
3.2
100
Cent
ral
25.7
6.2
33.7
34.5
20.7
46.8
15.4
17.2
100
East
ern
22.6
6.5
51.3
19.6
11.9
33.3
40.0
14.8
100
Nor
ther
n14
.57.
221
.157
.214
.619
.142
.623
.710
0W
este
rn18
.38.
353
.519
.927
.732
.631
.48.
410
0

14
UGANDA FiNScope iii RepoRT
Unlocking Barriers to Financial inclusion in Uganda
November 2013
With regard to wealth status, Table 3 shows that access to formal bank institutions re-mained the same for the wealthiest individu-als—at 46 percent in both 2009 and 2013. However, individuals in the top 20 percent quintile were still about five times more like-ly to access banks compared to those in the lowest quintile. This sustained gap suggests no improvement in financial inclusion for the worst deprived. The level of formal banking inclusion increased with wealth quintile – ranging from about 10 percent for the adult population in the lowest quintile to nearly 46 percent in the wealthiest quintile in 2013. Worth noting is the finding that shows a shift from informality to formality with improving wealthiest quintile status.
Turning to educational attainment level, it is evident that use of formal banking services was positively related to level of education. Whereas the likelihood of exclusion reduces with education level, inclusion increases. Ta-ble 3 further reveals that nearly 24 percent of the adult population with no formal edu-cation were financially excluded, which was well above the national average of 15 per-cent.
Similarly, between 2009 and 2013, there were no changes in the rates of access to formal banks for paid employees—remained about 35 percent. However, for the self-em-ployed, the rate of access to formal banks declined from 21 percent in 2009 to 18 per-cent in 2013. This suggests that this particular group moved away from banks to other non-bank formal and informal service providers. As expected the adult population engaged in paid employment was more likely to use formal banking institutions, whereas the self-employed were more likely to use informal financial services. The latter could partly be explained by the lesser complexity of these institutions and lower costs of transactions involved. Yet these services might not pro-vide the type of products that are required for their day-to-day business that would have
required financing from the formal banking institutions. The difference based on the non-bank formal services was negligible. The not working population and contributing family workers were more likely to be financially excluded. Lack of source of income partly ex-plains this finding.
3.3 Comparison with other African coun-tries
How does the current financial inclusion in Uganda compare with that of its counter-parts in other African countries? Figure 5 shows a comparison of financial inclusion by access strands (institutions) across selected African countries since 2009. Overall, the in-cidence of financial exclusion is very low in Uganda (at 15 percent) and compares favour-ably with Kenya’s (12 percent) and South Af-rica’s (16 percent). At country-specific levels, the results show that South Africa, Swaziland and Botswana, rank highest in access to for-mal financial institutions—with access above 40 percent. These are followed by Lesotho, Kenya, Ghana and Nigeria in the second cat-egory with access rates ranging between 30-40 percent. In the third category are Zimba-bwe, Rwanda, and Uganda with rates ranging between 20-30 percent. Finally, Zambia and Tanzania are in the fourth category with ac-cess rates below 20 percent. Improvement in access to formal bank institutions seems to be partly related to economic status and the level of financial sector liberalization in a given country. For instance, countries with a higher adult population using formal banks have high level of development. Further ex-amination of the financial systems of these countries shows that, they are fully liberal-ized with heavy presence of foreign based investors. Moving down the category, coun-tries decrease in the levels of economic per-formance as well as in the efficiency of the banking system due to low economic activi-ties that are important to spur growth. The non-bank and informal institutions seem to be dominating in the third category, while a larger proportion of the adult population in
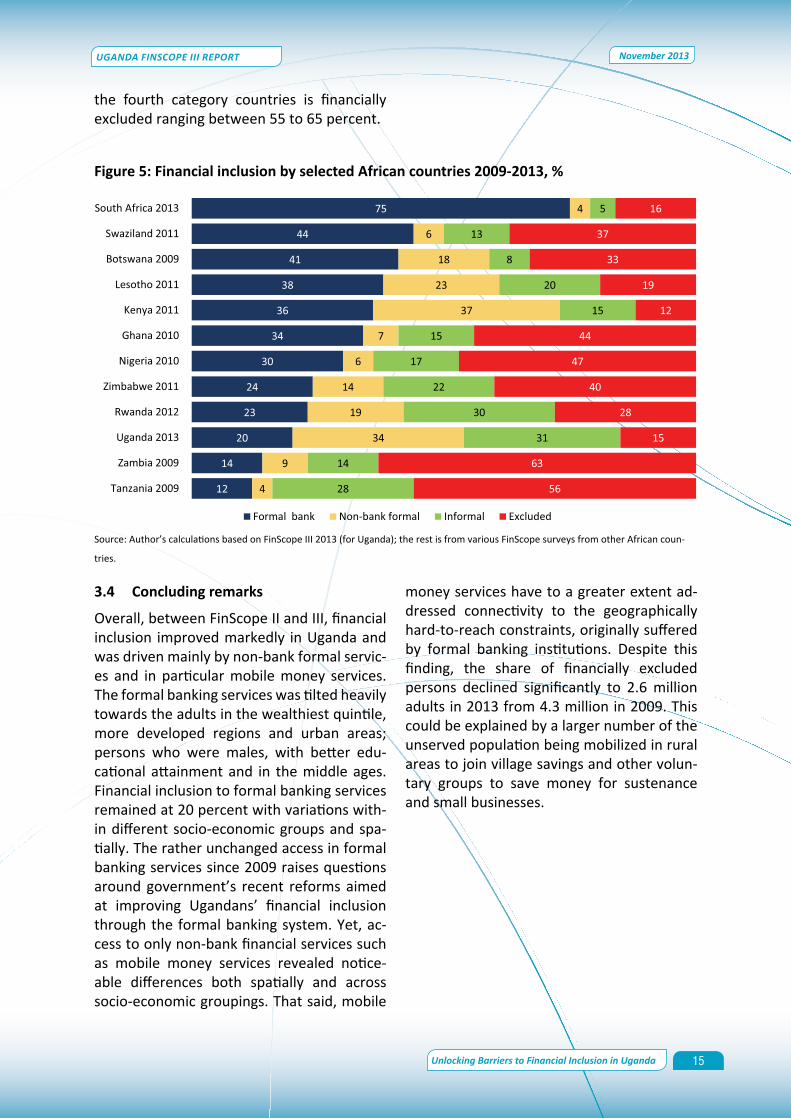
15
UGANDA FiNScope iii RepoRT
Unlocking Barriers to Financial inclusion in Uganda
November 2013
the fourth category countries is financially excluded ranging between 55 to 65 percent.
Figure5:FinancialinclusionbyselectedAfricancountries2009-2013,%
3.4 Concluding remarks
Overall, between FinScope II and III, financial inclusion improved markedly in Uganda and was driven mainly by non-bank formal servic-es and in particular mobile money services. The formal banking services was tilted heavily towards the adults in the wealthiest quintile, more developed regions and urban areas; persons who were males, with better edu-cational attainment and in the middle ages. Financial inclusion to formal banking services remained at 20 percent with variations with-in different socio-economic groups and spa-tially. The rather unchanged access in formal banking services since 2009 raises questions around government’s recent reforms aimed at improving Ugandans’ financial inclusion through the formal banking system. Yet, ac-cess to only non-bank financial services such as mobile money services revealed notice-able differences both spatially and across socio-economic groupings. That said, mobile
Source: Author’s calculations based on FinScope III 2013 (for Uganda); the rest is from various FinScope surveys from other African coun-
tries.
money services have to a greater extent ad-dressed connectivity to the geographically hard-to-reach constraints, originally suffered by formal banking institutions. Despite this finding, the share of financially excluded persons declined significantly to 2.6 million adults in 2013 from 4.3 million in 2009. This could be explained by a larger number of the unserved population being mobilized in rural areas to join village savings and other volun-tary groups to save money for sustenance and small businesses.

16
UGANDA FiNScope iii RepoRT
Unlocking Barriers to Financial inclusion in Uganda
November 2013
This Section seeks to explore the extent of penetration of financial products and ser-vices through Uganda’s financial institutions including commercial banks, MDIs, SACCOs and other forms of MFIs and how differenti-ated these products and services are across gender, life cycle, educational attainment, employment status and spatially. Such prod-ucts and services include: operating a savings account, fixed deposit account, joint account, current account, ATM card/Debit card, credit card, investment account (e.g. shares ac-count), personal loan, overdraft, mortgage or Lease, home improvement loan, commer-cial loan, money transfer services (Western union, money gram), mobile banking, cell phone banking (with a bank account) and on-line banking.
4.1 Havingabankaccountwithafinancialinstitution
One of the critical measurements of financial inclusion in an economy is the proportion of
6 ) reveals a significant reduction in the share of the adults banked with commercial banks and MDIs, and a significant increase in those using SACCOs from 5 percent in 2009 to 21 percent in 2013. Indeed, the estimated adult population using SACCOs increased by five fold in a period of four years – from 128,000 to 520,,000 adults in 2009 and 2013 respec-tively. Furthermore, about 60.6 percent of the total users of SACCOs were females and 87 in every 100 adults were in rural areas in 2013. This demonstrates that the adult population is starting to understand the im-portance of micro-finance institutions - Tier 4 (that are not regulated by BoU). Government could leverage on this positive development to address the problem of regulation through the establishment of the proposed Micro Fi-nance Regulatory Authority (MRA). This will build confidence and trust in these institution in terms of providing financial services.
4. FORMAL Products and services PENETRATION
Figure6:Operatinganaccountwithfinancialinstitutions,%
the population that operate an account of any form with a financial institution. Of the adult population, only 20 percent (represent-ing an estimated 3.1 million adults) operated an account with financial institutions in 2013. While this marks an increase from 18 percent (an estimated 2.5 million adults) in 2009, the increase was not statistically significant (Table 4). In-depth analysis based on those adults with a bank account in both years (see Figure
Within each socio-economic grouping and location, there are marked variations in the population with an account (Table 4). The adults resident in urban areas and in particu-lar Kampala and with well to do households, and who were male, in paid employment and with higher education had a higher likelihood to operate an account. In-depth analysis re-veals that the main accounts operated were savings followed by ATM card/Debit, which

17
UGANDA FiNScope iii RepoRT
Unlocking Barriers to Financial inclusion in Uganda
November 2013
were operated by more than 10 percent of the urban population. This could be due to more economic activity that takes place in urban relative to rural areas. It is worth not-ing that the more educated, the more trans-actions with the formal financial institutions. Put differently, as the population gets more learned, it is more likely to be employed and better paid thus needing the services of a bank.
Regionally, account penetration ranged from 9 percent in Northern region to 42 percent in Kampala. The adults in the wealthiest quin-tile were almost six times likely to operate an account with a formal banking institution as those in the poorest quintile. Account pen-etration for adults with ordinary secondary education and above was almost two times that of those with some education and no formal education combined.
Table4:Productandservicespenetrationbyadultcharacteristicsin2013,%
Characteristic Operates an account Loan service% (‘000) % (‘000)
Uganda 19.5 3,167.9 8.6 1,395.7Gender
Female 16.4 1,401.9 7.5 645.8Male 22.9 1,766.0 9.7 749.9
Age group:Below 18 7.0 34.6 0.9 4.518-24 12.8 408.4 4.2 134.525-39 22.5 1,505.5 11.1 739.540-59 23.9 935.9 9.8 385.060+ 14.3 283.4 6.6 132.2
Educational attainment:No Formal Education 9.3 283.1 5.4 165.0Some Primary 13.1 866.0 7.2 472.6Completed Primary 16.5 380.8 7.4 171.7Some Secondary 24.1 456.9 6.8 129.0O’Level + 48.2 1,181.1 18.7 457.4
Employment status:Self Employed 17.1 1,774.0 8.8 911.4Paid Employees 34.1 894.6 11.6 303.9Contr. Family worker 12.2 105.7 9.0 78.2Not Working 15.9 379.0 4.1 97.2
Wealth quintile:Lowest 7.2 213.0 5.7 169.2Second 10.2 333.6 6.1 198.9Third 17.0 582.3 8.0 274.4Fourth 20.7 722.1 11.1 388.9Fifth 42.1 1,316.9 11.7 364.3
Place of residence:Rural 16.2 2,132.6 7.9 1,038.1Urban 33.1 1,035.3 11.4 357.6
Region:Kampala 42.3 358.0 7.8 66.1Central 20.4 816.8 5.7 228.2Eastern 13.6 557.7 6.5 266.4Northern 9.3 319.6 4.7 162.9Western 28.8 1,115.7 17.4 672.1
In terms of overall contribution to total ac-count penetration, the contribution from males (56 percent), adults aged 25-39 years (48 percent); ordinary secondary education plus (37 percent); richest quintile (42 per-cent) and Western region (35 percent) were well above their respective shares in the total
adult population (see Table 1). On the other hands, the total contribution of the rural ar-eas stood at 67 percent well below its overall population share of about 80 percent.
Use of loan products and services remained very low as shown in Table 4. Indeed, the

18
UGANDA FiNScope iii RepoRT
Unlocking Barriers to Financial inclusion in Uganda
November 2013
adult population that was male, with ordinary secondary education, in paid employment, resident in Kampala and Western region and richest quintile was more likely to use such services compared to their counterparts.
4.2 Natureoftransactionsconductedatvarious banking points
The nature of transactions done at various banking points are presented in Table 5. There were overlaps in the transactions. It is evident that regardless of the transaction, there is a very clear gender dimension, with males more likely to transact such business compared to their female counterparts –
given the fact that males were more likely to operate a bank account. Likewise, the level of transactions seems to be higher among the urban residents compared to their rural counterparts. The incidence of making trans-actions at banking points is positively associ-ated with education level and wealth status. In terms of importance going by the propor-tion (perhaps deposits are seldomly done while withdrawals are done in bits), the adult population transacts more in withdrawals fol-lowed by deposits. This is true regardless of adult characteristics and geographical loca-tion.
Table5:Natureoftransactionsbyadultscharacteristicsin2013,%
Characteristic Withdrawals Deposits Bank transfers Other servicesUganda 17.0 16.0 4.8 9.0Gender: Female 13.4 12.2 2.2 5.1Male 20.8 20.1 7.6 13.1Age group:Below 18 1.7 4.4 0.0 1.018-24 11.9 11.5 4.1 7.225-39 20.2 18.5 5.2 10.340-59 20.7 20.5 6.7 11.160+ 9.8 8.0 1.8 4.6Educational attainment:No Formal Education 5.4 4.4 0.3 2.4Some Primary 9.1 8.7 1.3 5.0Completed Primary 13.1 11.7 4.5 7.4Some Secondary 21.4 22.6 6.7 10.4O-Level + 49.3 46.1 17.4 26.3Employment status:Self Employed 14.2 13.8 3.6 7.6Paid Employees 33.0 27.6 10.9 16.8Contr. Family Worker 7.9 7.2 1.5 6.5Not Working 13.1 15.0 4.3 6.7Wealth quintile:Lowest 5.6 5.5 0.4 3.3Second 6.5 6.3 0.8 3.5Middle 10.2 8.9 1.9 5.0Fourth 19.0 17.0 3.0 8.5Highest 40.8 39.7 17.0 23.0Place of residence:Rural 13.5 12.5 3.2 7.7Urban 30.3 29.6 11.0 13.9Region:Kampala 40.3 42.8 18.0 18.1Central 15.3 15.0 4.4 7.6Eastern 9.3 7.9 2.2 6.0Northern 11.0 9.9 2.8 5.1Western 24.2 22.3 5.9 13.6

19
UGANDA FiNScope iii RepoRT
Unlocking Barriers to Financial inclusion in Uganda
November 2013
4.3 Barriers to having a bank account
The analysis in the preceding section revealed that the majority of adults were non-banked. As such this section explores the self-report-ed barriers to bank account use with the aim of providing insights on the potential areas that need further policy refinement. These barriers are discussed in relation to the adult population characteristics and those of their households where they reside. Spatial di-mension are also considered. The results are presented in Table 6.
Across the socio-economic segmentation, the most common barriers to having a formal bank account – in order of popularity - were having no income, costs related to opening an account, having no job and lack of knowl-edge of opening an account, and distance to the bank, in that order. Distance from bank was cited by only 13 percent of the adult population. However, there are some nota-ble variations in incidence of a given barrier. For instance, the lack of knowledge on how a bank account works reduced with increases in educational attainment and wealth status. Similar patterns are observed for the distance to the bank by wealth status. This finding confirms the bank concentration seems to follow more developed regions and more af-fluent persons who were more likely to utilise such services. Income related barriers seem
to mirror the poverty profile as reported in the various studies on Uganda. There is a clear gender dimension with females (52 percent) more likely to report this as a bar-rier compared to their male counterparts (43 percent); and urban areas (33 percent) compared to their rural counterparts (51 per-cent). The only exception in citing this barrier by regional ranking were the adult popula-tion resident in Eastern region (62 percent) followed by those in Northern region at 48 percent.
These findings have implications for consum-er education in Uganda on access to financial services. As emphasised in Section 10, finan-cial institutions need to have a new and inno-vative approach of “outreach” whereby banks should reach out to communities and market their services. Financial institutions should reach out and clearly explain the financial products available, the costs of financial ser-vices such as: operating bank accounts of var-ious types; costs of services such as ATM ser-vices; cost of borrowing i.e. interest rates and why such interest rates fluctuate over time. Because of limited official consumer educa-tion, clients depend on either informal sourc-es or just on perceptions as discussed later in Section10. These shortcomings altogether greatly constrain efforts to attract new clients to the various financial institutions.

20
UGANDA FiNScope iii RepoRT
Unlocking Barriers to Financial inclusion in Uganda
November 2013
Table6:Rea
sonsfo
rno
tha
ving
afo
rmalban
kaccoun
tin20
13,%
Char
acte
ristic
Do n
ot tr
ust fi
nanc
ial
insti
tutio
nsU
se m
obile
m
oney
Cost
s of o
pera
ting
an
acco
unt
Not
Edu
cate
dDo
not
hav
e in
com
eDo
not
hav
e a
Job
Do n
ot
Qua
lify
Do n
ot u
nder
stan
d ho
w it
wor
ksDi
stan
ce fr
om
the
bank
Oth
ers
Uga
nda
2.9
3.3
21.5
9.3
47.4
16.9
4.6
17.6
13.3
4.0
Gen
der:
Fem
ale
2.4
2.8
22.6
10.4
51.9
18.0
4.8
19.6
12.5
4.7
Mal
e3.
43.
920
.48.
142
.515
.64.
415
.414
.23.
2A
ge g
roup
: B
elow
18
2.0
2.1
15.9
9.5
60.5
28.7
13.9
15.5
4.6
4.1
18-
243.
25.
722
.18.
449
.521
.64.
321
.512
.36.
1 2
5-39
3.3
2.9
21.2
8.4
44.4
13.6
2.7
15.9
14.7
3.3
40-
592.
43.
223
.78.
146
.117
.24.
215
.414
.23.
7 6
0+2.
11.
419
.016
.353
.916
.89.
922
.210
.33.
3Ed
ucati
onal
att
ain-
men
t:
No
Form
al E
duca
tion
2.1
1.7
23.1
19.2
55.7
15.5
6.4
24.9
13.9
3.0
Som
e Pr
imar
y2.
71.
724
.710
.455
.220
.56.
020
.714
.23.
8 C
ompl
eted
Prim
ary
3.3
5.6
22.8
5.7
42.2
16.0
4.2
17.7
16.0
4.2
Som
e Se
cond
ary
4.4
6.9
14.8
3.7
42.4
13.4
2.6
12.4
16.4
4.8
O-L
evel
+2.
74.
915
.31.
625
.112
.50.
64.
45.
04.
9Em
ploy
men
t sta
tus:
Sel
f Em
ploy
ed3.
13.
322
.59.
848
.115
.44.
718
.315
.03.
7 P
aid
Empl
oyee
s2.
24.
020
.56.
837
.89.
93.
311
.58.
52.
8
Con
tr. F
amily
Wor
ker
2.6
2.1
23.1
11.2
57.1
35.0
4.6
37.6
19.2
7.4
Not
Wor
king
2.6
2.9
17.9
9.5
52.0
24.8
5.4
14.6
8.9
5.2
Wea
lth Q
uinti
le:
Low
est
4.1
0.9
27.6
11.5
53.9
21.9
4.4
24.5
17.3
2.3
Sec
ond
2.1
1.8
24.5
13.6
58.3
20.1
6.1
19.9
16.3
3.3
Mid
dle
2.9
2.8
20.5
10.4
50.7
16.6
7.0
21.0
14.1
5.4
Fou
rth
2.2
6.1
22.3
7.0
45.9
15.2
2.8
13.7
12.2
3.7
Hig
hest
3.2
4.8
13.0
4.1
27.9
10.9
2.4
9.2
6.4
5.0
Plac
e of
resi
denc
e: R
ural
2.1
2.8
23.0
10.1
50.9
17.0
5.1
19.1
14.8
3.7
Urb
an6.
35.
815
.66.
132
.716
.52.
311
.46.
85.
3Re
gion
s: K
ampa
la6.
96.
214
.14.
321
.413
.02.
76.
20.
06.
9 C
entr
al2.
55.
221
.49.
145
.412
.35.
111
.813
.33.
6 E
aste
rn3.
31.
817
.310
.561
.723
.66.
923
.912
.44.
6 N
orth
ern
3.2
2.6
28.9
12.3
48.3
18.5
4.0
28.0
22.5
3.5
Wes
tern
1.6
3.2
21.4
6.7
39.3
13.9
2.5
10.3
9.1
3.5
21
UGANDA FiNScope iii RepoRT
Unlocking Barriers to Financial inclusion in Uganda
November 2013
4.4 Concluding remarks
In terms of formal bank products and servic-es, two in every ten adults have an account of some form with financial institutions domi-nated by commercial banks. Use of SACCOs seems to be growing. This could be linked to the improvement in the outreach ser-vices by the microfinance programmes. On the other hand, there are barriers that have kept the adult population away from having a bank account. The most cited barriers in-clude: low income-related; supply side con-straints in terms of physical access and costs
of operating an account; and finally, lack of knowledge – which is discussed in detail in Section 10. The lack of knowledge points to general lack of consumer education, which could be leading to misconceptions about the costs and procedures of operating a bank ac-count. These results suggest that banks are not investing adequately in consumer edu-cation thereby leaving most of the popula-tion unaware of their financial products and services. The subsequent sections provide a detailed analysis of each of the four financial access strand.
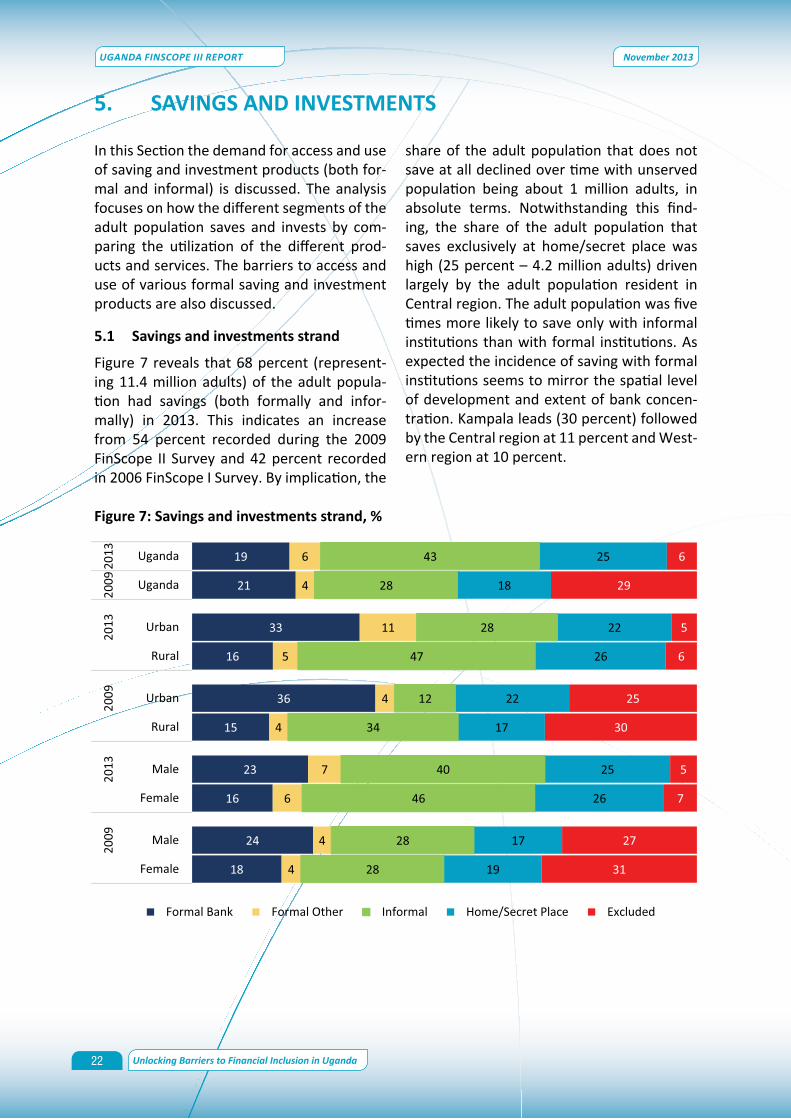
22
UGANDA FiNScope iii RepoRT
Unlocking Barriers to Financial inclusion in Uganda
November 2013
In this Section the demand for access and use of saving and investment products (both for-mal and informal) is discussed. The analysis focuses on how the different segments of the adult population saves and invests by com-paring the utilization of the different prod-ucts and services. The barriers to access and use of various formal saving and investment products are also discussed.
5.1 Savings and investments strand
Figure 7 reveals that 68 percent (represent-ing 11.4 million adults) of the adult popula-tion had savings (both formally and infor-mally) in 2013. This indicates an increase from 54 percent recorded during the 2009 FinScope II Survey and 42 percent recorded in 2006 FinScope I Survey. By implication, the
share of the adult population that does not save at all declined over time with unserved population being about 1 million adults, in absolute terms. Notwithstanding this find-ing, the share of the adult population that saves exclusively at home/secret place was high (25 percent – 4.2 million adults) driven largely by the adult population resident in Central region. The adult population was five times more likely to save only with informal institutions than with formal institutions. As expected the incidence of saving with formal institutions seems to mirror the spatial level of development and extent of bank concen-tration. Kampala leads (30 percent) followed by the Central region at 11 percent and West-ern region at 10 percent.
5. SAVINGS AND INVESTMENTS
Figure7:Savingsandinvestmentsstrand,%

23
UGANDA FiNScope iii RepoRT
Unlocking Barriers to Financial inclusion in Uganda
November 2013
Compared with FinScope 2009, there is no significant change in the proportion of the adult population saving through formal (for-mal bank & non-bank formal) channels. The decreased use of formal saving products (from 21 percent in 2009 to 19 percent in 2013 respectively) and increase in use of non-bank formal products (6 percent in 2013 from 4 percent in 2009) was marginal. This stagna-tion in use of formal products and services coincides with a reduction in growth of pri-vate saving and time deposits in the financial
sector following the macroeconomic insta-bilities that started in 2011. Private savings in the country, for example, dropped from UShs 3,330 billion in August 2011 to UShs 3,320 billion by January 2013 (Figure 8). Therefore, ensuring macroeconomic stability is neces-sary for promoting savings/investment. On the other hand, saving through only informal channels increased by 15 percentage points from 28 percent in 2009 to 43 percent in 2013.
Figure8:Privatetimeandsavingsdeposits(ushsbillion)
Source: Bank of Uganda, 2013
The picture by socio-economic group does not seem to change – with informal chan-nels dominating formal ones (Table 7). Adult males were 1.4 times more likely to save with formal institutions compared to their female counterparts (Figure 7); and informal savings are higher among females. The results fur-ther reveal that the likelihood to save with formal channels increased with wealth sta-
tus and education levels. This also applies for non-bank formal. There were no systematic patterns observed by employment status and wealth status as regards the use of informal channels. It is evident that the highly edu-cated adults, resident in households in the richest quintile and in paid employment were least likely to utilise non-bank formal servic-es. Access to knowledge and information on formal products partly explains this finding.

24
UGANDA FiNScope iii RepoRT
Unlocking Barriers to Financial inclusion in Uganda
November 2013
Table7:Savingsand
investmen
tsstran
dby
adu
ltcha
racteristicsin
201
3,%
2009
2013
Char
acte
ristic
For
mal
Ba
nk F
orm
al
Oth
er In
form
alHo
me/
Secr
et
Plac
eEx
clud
ed F
orm
al
Bank
For
mal
O
ther
Info
rmal
Hom
e/Se
cret
Pl
ace
Excl
uded
All
Uga
nda
20.5
3.7
28.4
18.4
28.9
19.3
6.2
43.4
25.1
6.0
100
Age
in y
ears
: B
elow
18
11.2
1.8
13.4
34.2
39.4
6.7
2.1
27.8
50.1
13.2
100
18-
2418
.13.
330
.418
.829
.512
.08.
841
.932
.25.
110
0 2
5-39
23.5
4.0
28.5
18.7
25.3
22.8
7.0
43.2
22.2
4.8
100
40-
5921
.84.
732
.414
.826
.323
.45.
547
.119
.54.
510
0 6
0+20
.73.
628
.47.
839
.414
.51.
143
.828
.512
.210
0Ed
ucati
onal
att
ainm
ent:
No
Form
al E
duca
tion
9.6
1.7
46.3
33.6
8.8
100
Som
e Pr
imar
y12
.74.
550
.426
.46.
010
0 C
ompl
eted
Prim
ary
16.0
8.5
48.3
23.3
3.9
100
Som
e Se
cond
ary
24.0
9.2
36.4
22.8
7.6
100
O-L
evel
and
mor
e48
.611
.622
.014
.73.
110
0Em
ploy
men
t sta
tus:
Sel
f Em
ploy
ed20
.35.
135
.916
.122
.617
.26.
048
.823
.44.
610
0 P
aid
Empl
oyee
s33
.83.
618
.517
.926
.133
.58.
632
.220
.05.
810
0 C
ontr
. Fam
ily W
orke
r9.
93.
128
.919
.039
.010
.56.
747
.431
.44.
010
0 N
ot W
orki
ng16
.70.
616
.224
.641
.915
.54.
231
.536
.012
.810
0W
ealth
qui
ntile
: L
owes
t7.
53.
328
.317
.943
.07.
13.
050
.534
.15.
410
0 S
econ
d12
.43.
041
.713
.629
.39.
64.
152
.626
.96.
810
0 M
iddl
e11
.25.
444
.116
.922
.317
.15.
349
.520
.97.
210
0 F
ourt
h24
.74.
119
.127
.424
.720
.57.
742
.225
.24.
510
0 H
ighe
st44
.02.
810
.915
.826
.542
.310
.721
.819
.45.
810
0Re
gion
: K
ampa
la41
.615
.211
.224
.77.
310
0 C
entr
al25
.02.
216
.321
.235
.221
.38.
536
.429
.44.
410
0 E
aste
rn21
.82.
433
.418
.523
.913
.14.
549
.223
.29.
910
0 N
orth
ern
14.0
6.2
16.8
11.7
51.3
9.3
5.1
49.5
32.0
4.1
100
Wes
tern
17.3
5.4
45.4
18.5
13.4
27.6
4.6
46.2
17.0
4.6
100

25
UGANDA FiNScope iii RepoRT
Unlocking Barriers to Financial inclusion in Uganda
November 2013
5.2 Knowledgeofsavingsandpractice
The survey sought the adult population’s perceptions of it understanding of the defi-nition of saving and how they save. Figure 9 illustrates the understanding of saving by the adult population in 2013. Putting money in a special place/account for the money to be safe dominated (41 percent) followed by such money being put in an activity/where to earn profits/returns (35 percent). Similar pat-terns were observed across gender and rural/urban. Most important, the understanding was not characterised be gender or rural/ur-ban gaps.
were noted for rural and urban adult popula-tions. The differences observed in the mode of saving across the different population segments, relate with levels of vulnerability i.e. the most vulnerable save mainly for safe keeping of money than for profit. This trend is also observed across the income groups and location.
Figure9:Perceptiononthesinglemostdefinitionofsavingin2013,%
The respondents were further asked to select the options that fit well with what they were doing in terms of saving. The results are pre-sented in Table 8. The most cited mechanism was putting money in a special place or ac-count for the money to be safe (48 percent – representing 8.1 million adults) followed by investing it in an activity or somewhere so that it can yield profits or returns (42 percent – representing about 7 million adults).
This implies that Ugandans’ saving decisions are mainly motivated by profit and by ensur-ing the safety of their money which empha-sizes the close relationship between saving
and investment. Analysis of saving decisions across different segments of the population reveals that females mainly saved by putting money in a special place or account for the money to be safe compared to male coun-terparts who largely put money in an activity that can yield profits. The adults with no for-mal education (45 percent) mainly saved by putting money in a special place or account for the money to be safe while their educated counterparts with some secondary education (51 percent) mainly saved by investing mon-ey in an activity or somewhere so that it can yield profits or returns. Similar observations

26
UGANDA FiNScope iii RepoRT
Unlocking Barriers to Financial inclusion in Uganda
November 2013
Table8:Preferenceforsavingsandpracticebyadultcharacteristicsin2013,%
Characteristic Putting money in a special
place or ac-count for the money to be
safe
Putting money aside to stop it
being spent im-mediately
Planning spending so that money
lasts through the week or
month
Putting money in an activity or somewhere so
that it can yield profits or returns
Est. pop (‘000)
Uganda 48.2 24.1 13.0 41.9 16,153.8Gender: Female 47.2 25.6 14.1 39.3 8,389.6 Male 49.4 22.4 11.6 44.7 7,764.2Age group: Below 18 45.2 27.2 9.3 27.1 474.0 18-24 48.0 25.0 11.4 40.3 3,203.0 25-39 48.6 22.6 14.0 45.7 6,681.8 40-59 50.8 23.9 11.6 42.6 3,904.1 60+ 42.9 27.5 15.4 34.0 1,890.9Educational attainment: No Formal Education 45.2 26.6 13.2 34.6 2,942.9 Some Primary 45.5 24.0 14.4 41.2 6,532.7 Completed Primary 46.6 25.4 10.0 45.1 2,336.7 Some Secondary 48.6 18.2 10.5 51.4 1,878.4 O-Level + 60.5 24.7 13.5 42.6 2,457.9Employment status: Self Employed 47.6 22.3 12.3 47.1 10,349.0 Paid Employees 54.9 25.1 13.7 35.7 2,623.5 Contr. Family Worker 52.4 41.3 20.8 30.4 854.0 Not Working 41.5 24.5 12.0 30.7 2,275.7Wealth quintile: Lowest 48.7 22.9 17.3 43.5 3,002.2 Second 47.4 26.8 12.7 40.0 3,187.3 Middle 44.5 21.5 13.1 43.4 3,420,5 Fourth 46.5 20.9 11.2 45.5 3,452.4 Highest 54.5 28.9 10.9 36.6 3,091.4Place of residence: Rural 47.4 22.6 12.8 42.7 13,050.1 Urban 51.5 30.3 13.4 38.6 3,103.7Region: Kampala 52.1 36.1 11.1 29.9 842.3 Central 43.4 19.6 14.7 42.7 3,984.2 Eastern 39.5 15.6 11.9 47.1 3,945.2 Northern 62.1 28.3 19.4 42.8 3,416.2 Western 49.4 31.4 7.1 37.4 3,956.9Notes: Analysis based on a sample of 3,270 adults

27
UGANDA FiNScope iii RepoRT
Unlocking Barriers to Financial inclusion in Uganda
November 2013
5.3 Savings Mechanisms
This section looks at the mechanisms used to save by the adult population. The results in Table 9 show that the majority of adults that save do so mainly using informal means. The most reported mechanisms were home (51 percent), followed by VSLAs/ROSCAs at 29 percent and buying of animals/other as-sets at 18 percent. The patterns are similar regardless of adult characteristics. Nonethe-less, it is evident that adults that were males, better educated and residing in better off households and more developed regions were more likely to save in commercial banks relative to their counterparts. Those in paid employment were more likely to save with formal institutions relative to their counter-parts in self-employment. This could be partly explained by the fact that it is a requirement from the employers to have a bank account through which the salaries are paid. Clearly, saving with formal banking institutions re-mains low at about 9 percent, nationally.
Savings through formal banks and mobile money services increases with educational attainment level and with wealth status. Those using SACCOs/other forms of MFIs were almost four times more than those us-ing ROSCAs/VSLAs; and the latter were more prevalent in rural areas than in urban areas. Notably, there is a wider gender gap in the use of ROSCAs/VSLAs (7 percentage points) compared to use of SACCOs and other MFIs (of 2 percentage points).
Saving in a secret place was a common prac-tise among the adult population. The practise reduces with increasing education levels and with wealth status. The finding on education could partly reflect the level of awareness and knowledge. The rather high incidence of saving in a secret place is greatly explained by the low financial literacy and limited access to formal financial institutions as elaborated in section 10. The alternative explanation could be low earning capacities of the majority of the adult population as presented in Table 1.
The results in Table 9 further reveal that use of mobile money services as a channel of sav-ing remains limited at 3 percent. Indeed, the practice increases with educational attain-ment, and is more prevalent in urban areas especially Kampala.
While 68 percent of the adult population indicated some form of saving/investing (formal/informal), much of the savings are earmarked for consumption as presented in Table 10. The most cited reasons for saving included basic needs (67 percent) followed by emergencies (41 percent), education (33 percent) and livestock/poultry (22 percent). These patterns do not seem to vary across adult characteristics and the ranking are simi-lar to those reported in 2009 (see FinScope II, 2009). The incidence of saving is similar be-tween female and male population. Broadly, incidence of saving for emergencies reduced from 58 percent in 2009 to 41 percent in 2013. There are no changes across gender and education between FinScope II and III.
The respondents were further requested to indicate what they were doing in terms of retirement/old age planning. The results are presented in Figure 10 (a & b) and responses are not mutually exclusive. Nearly 43 percent of the adult population (representing 6.7 million adults) indicated that they are doing nothing about their retirement age. On the other hand, those that reported to be doing something, the majority cited educating their children (23 percent), investment in livestock (19 percent) and financial investment and/or saving (15 percent), in that order of fre-quency. The very low percentages in terms of contribution to National Social Security Fund (NSSF) or non-contributory pension funds is due to that fact that the latter targets em-ployees in paid private sector employment and the latter government employees – who remain a small proportion of the adult popu-lation.

28
UGANDA FiNScope iii RepoRT
Unlocking Barriers to Financial inclusion in Uganda
November 2013
Table9:Savingsmechanismsbyadultcharacteristicsin2013,%
Bank &
MDIs
Animal & other
assets
MFI & SACCOS
ROSCA & VSLA
Mobile Home Est. pop (‘000)
Uganda 8.9 18.4 7.2 28.8 3.2 51.2 15,398.5Gender:
Female 6.1 14.9 6.4 32.0 2.7 52.6 8,003.7Male 12.0 22.3 8.1 25.2 3.7 49.7 7,394.8
Age group:
Below 18 3.0 9.7 1.4 5.6 0.7 65.3 436.618-24 6.1 18.4 3.8 24.1 5.9 57.8 3,063.625-39 11.7 19.3 8.5 30.3 4.0 48.5 6,451.240-59 8.9 19.7 11.2 35.8 1.5 46.9 3,736.060+ 5.5 15.0 2.4 23.1 0.0 54.6 1,711.1
Educational attainment:
No Formal Education 1.8 12.3 3.5 28.7 0.8 55.2 2,744.8Some Primary 3.5 19.6 5.5 30.3 1.4 54.3 6,207.2Completed Primary 5.1 24.1 10.6 32.3 2.3 50.8 2,275,3Some Secondary 12.3 19.6 6.6 27.4 6.2 49.4 1,771.5O-Level + 33.4 16.5 13.7 22.5 9.3 39.9 2,394,5
Employment status:
Self Employed 6.6 21.0 7.4 30.6 2.5 51.9 9,922.1Paid Employees 20.1 16.7 10.7 28.4 6.5 41.2 2,524.1Contr. Family Worker 4.4 15.6 6.7 32.1 0.8 65.3 834.8Not Working 7.5 10.4 2.9 20.3 3.2 54.5 2,066.0
Wealth quintile:
Lowest 2.4 18.0 3.1 28.6 1.2 66.0 2,882.7Second 1.3 19.7 5.5 34.7 1.1 54.2 3,053.4 Middle 4.5 19.2 7.9 33.6 2.4 46.5 3,231.7 Fourth 8.3 21.0 9.7 27.8 2.5 47.7 3,284,7
Highest 28.7 13.9 9.6 18.4 8.8 43.1 2,946.3Place of residence:
Rural 6.0 19.5 7.0 31.1 1.8 52.4 12,427.4Urban 21.3 13.9 8.2 18.9 8.9 46.3 2,971.1
Region:
Kampala 29.9 4.6 4.3 8.0 11.7 47.9 787.1Central 10.9 21.5 5.7 15.1 6.3 56.3 3,802.9Eastern 4.6 20.2 4.6 25.6 1.0 48.3 3,730.2Northern 5.4 20.4 5.7 38.8 1.1 65.6 3,336.8Western 10.0 14.8 13.5 41.7 2.3 37.5 3,741.4

29
UGANDA FiNScope iii RepoRT
Unlocking Barriers to Financial inclusion in Uganda
November 2013
Table10
:Rea
sonsfo
rcurren
tlysaving
/inv
esting
byad
ultc
haracteristicsin
201
3,%
Char
acte
ristic
Basic
nee
dsEm
erge
ncy
Land
Live
stoc
k/po
ultr
yAg
ric. I
nput
Busin
ess
Educ
ation
Safe
tyO
ther
sPo
p (‘0
00)
Uga
nda
67.3
41.1
11.0
21.9
7.2
9.4
32.6
13.2
23.1
15,6
32.7
Gen
der:
Fem
ale
68.4
43.3
8.6
19.4
7.5
9.4
32.9
11.3
21.1
8,14
1.3
Mal
e66
.138
.613
.624
.66.
89.
532
.415
.325
.37,
491.
5A
ge g
roup
: B
elow
18
51.5
17.9
4.4
12.4
3.3
1.8
18.4
10.5
21.4
459.
9 1
8-24
65.4
36.9
13.3
20.0
6.1
14.2
21.7
14.5
23.2
3,11
7.4
25-
3966
.044
.214
.424
.07.
011
.835
.013
.423
.26,
439.
7 4
0-59
71.4
43.2
6.8
23.5
8.5
6.2
44.0
12.0
25.7
3,81
9.9
60+
70.6
39.0
5.2
17.2
7.9
2.0
23.8
13.8
17.9
1,79
5.9
Educ
ation
al a
ttai
nmen
t: N
o Fo
rmal
Edu
catio
n74
.340
.04.
519
.46.
24.
424
.411
.817
.82,
848.
5 S
ome
Prim
ary
67.1
42.1
9.5
24.5
8.3
6.3
31.7
12.3
20.8
6,28
2.7
Com
plet
ed P
rimar
y71
.741
.513
.823
.88.
28.
936
.113
.321
.92,
289.
4 S
ome
Seco
ndar
y60
.142
.014
.122
.25.
316
.832
.512
.230
.61,
789.
2 O
-Lev
el +
60.4
38.8
17.9
16.2
5.9
18.9
41.9
18.3
31.4
2,41
7.7
Empl
oym
ent s
tatu
s: S
elf E
mpl
oyed
70.5
43.2
9.7
24.1
8.3
9.0
34.0
13.2
21.9
10,1
16.4
Pai
d Em
ploy
ees
62.3
40.6
21.2
22.3
4.6
11.1
32.6
10.4
27.2
2,50
4.3
Con
tr. F
amily
Wor
ker
69.0
42.8
5.9
26.7
13.1
13.3
34.2
16.5
26.6
836.
8 N
ot W
orki
ng58
.732
.06.
910
.42.
78.
526
.514
.922
.22,
127.
7W
ealth
qui
ntile
: L
owes
t79
.145
.64.
329
.310
.74.
927
.212
.816
.02,
953.
5 S
econ
d71
.345
.17.
321
.98.
44.
031
.213
.420
.53,
065.
7 M
iddl
e 63
.838
.113
.122
.27.
19.
733
.211
.419
.53,
256.
6 F
ourt
h68
.641
.511
.920
.84.
98.
234
.913
.625
.13,
354.
3 H
ighe
st54
.135
.317
.815
.65.
120
.636
.315
.034
.43,
002.
7Pl
ace
of re
side
nce:
Rur
al69
.141
.310
.524
.07.
87.
531
.912
.621
.412
,622
.8 U
rban
59.9
40.0
13.0
12.9
4.4
17.8
35.6
15.8
30.4
3,00
9.9
Regi
on:
Kam
pala
51.7
30.4
19.4
6.3
2.8
24.0
34.9
16.6
27.2
816.
6 C
entr
al67
.440
.512
.322
.75.
910
.731
.711
.924
.63,
870.
4 E
aste
rn64
.232
.57.
924
.34.
58.
024
.95.
521
.83,
873.
4 N
orth
ern
82.2
55.6
2.8
24.2
16.2
7.4
36.3
23.2
22.8
3,33
5.4
Wes
tern
61.0
40.5
18.3
20.0
4.5
8.3
38.1
13.3
22.3
3,73
6.9

30
UGANDA FiNScope iii RepoRT
Unlocking Barriers to Financial inclusion in Uganda
November 2013
5.4 InvestmentActivities/Products
There are multiple options through which people can make investments. Broadly speak-ing, one in every 10 adults invested through formal financial institutions (Table 11). This finding could be explained by the low finan-cial penetration as discussed in Section 3. The level of perceived risk partly determines whether one goes for formal or informal in-stitutions for investment. The Survey results show that the majority of Ugandans invest in agriculture and agricultural related activities (Table 11)—activities which are prone to risks as highlighted in section 6. Of all the respon-dents that were involved in investing, they cited investment in farm land (53 percent), 41 percent in livestock, 39 percent invested through an informal group and 24 percent in-vested in an existing business.
Investment through formal products and ser-vices increases with educational attainment and wealth status. The richest were more than 10 times likely to invest in formal prod-ucts compared to their poorest counterparts. There is also a noticeable gender and rural/urban gap. In addition, it is worth noting the very low incidence of formal investment in Eastern and Northern regions. On the other hand, while there were significant differenc-es regarding formal investment mechanisms, there were limited differences with regard to informal investment mechanisms.
Figure10:Meansofplanningforretirement/oldage(mutuallyinclusive)in2013,%
The survey reveals that investment options varied across gender, educational attainment, living standards and spatially. Overall, adult males were more likely to invest formally (es-pecially in financial institutions) compared to their female counterparts. The plausible ex-planation of the observed gender gap is that, males were more likely to access information on investment options compared to their fe-male counterparts. It is also true that females were more risk averse, exacerbated by low literacy levels. The likelihood to invest in ag-riculture was more prevalent among those adults with no education compared to their more educated counterparts. Furthermore, the likelihood to invest in livestock and for-mal financial institutions increased with edu-cation and wealth status. Looking at wealth status, the poorer adults were more concen-trated in agriculture compared to the richer counterparts. This suggests that the vulner-able group by comparison have less choice in terms of investment activity due to their low-er levels of education and limited resources.

31
UGANDA FiNScope iii RepoRT
Unlocking Barriers to Financial inclusion in Uganda
November 2013
Table11
:Inv
estm
entm
echa
nism
sin201
3,%
In
stitu
tion
Mec
hani
sms
Form
alIn
form
al
Inve
stm
ent
acco
unt i
n a
finan
cial
in
stitu
tion
Inve
sting
th
roug
h in
form
al
insti
tutio
ns
Hous
e/ro
om/
prop
erty
Farm
la
ndLi
vest
ock
Prod
uce
to
sell
late
r
Buyi
ng
farm
in
puts
Inve
sting
in
per
sona
l bu
sines
sO
ther
sEs
t. po
p.
(‘000
)
Uga
nda
10.1
46.5
9.9
38.6
4.4
52.5
41.2
22.7
7.3
24.4
5.5
Gen
der:
Fem
ale
7.8
47.9
7.2
42.2
4.3
51.9
38.1
22.9
7.1
24.7
5.0
Mal
e12
.545
.012
.834
.74.
653
.144
.722
.57.
624
.26.
1A
ge g
roup
:Be
low
18
0.7
20.1
1.2
20.4
3.3
42.5
33.9
10.3
1.7
19.3
0.8
18-2
49.
436
.47.
232
.82.
850
.538
.818
.68.
324
.37.
925
-39
12.4
50.9
11.9
39.3
5.1
49.7
41.1
23.5
6.9
28.7
6.5
40-5
99.
952
.910
.046
.34.
355
.744
.824
.97.
424
.64.
960
+6.
042
.17.
831
.14.
961
.338
.923
.78.
58.
70.
5Ed
ucati
onal
att
ainm
ent:
No
Form
al E
duca
tion
2.5
42.5
3.0
39.8
1.6
59.6
37.3
20.7
3.2
12.7
1.5
Som
e Pr
imar
y4.
448
.74.
239
.03.
256
.643
.324
.28.
123
.82.
9Co
mpl
eted
Prim
ary
9.1
48.1
7.3
42.0
5.0
53.2
46.6
25.1
9.5
25.0
5.9
Som
e Se
cond
ary
15.9
45.5
15.6
34.9
8.0
42.0
41.1
20.7
9.4
38.0
9.3
O-L
evel
+31
.045
.031
.936
.07.
740
.135
.220
.46.
529
.114
.3Em
ploy
men
t sta
tus:
Self
Empl
oyed
9.0
50.6
8.1
37.4
4.0
55.6
43.8
24.6
8.7
28.7
5.1
Paid
Em
ploy
ees
18.7
45.7
20.9
45.6
5.4
45.9
38.2
20.6
5.5
14.1
8.2
Cont
r. Fa
mily
Wor
ker
5.9
46.9
4.6
41.8
4.0
47.6
37.3
19.5
3.7
22.5
4.0
Not
Wor
king
6.3
29.2
7.8
35.0
5.7
44.1
30.7
15.5
3.3
12.2
4.8
Wea
lth q
uinti
le:
Low
est
2.1
42.8
2.4
35.9
1.7
66.6
45.6
20.9
4.8
20.5
1.5
Seco
nd3.
149
.12.
942
.33.
058
.742
.622
.46.
917
.91.
5 M
iddl
e 6.
151
.36.
442
.22.
554
.241
.323
.310
.322
.92.
4 F
ourt
h11
.348
.710
.837
.25.
253
.442
.629
.17.
923
.37.
0 H
ighe
st27
.939
.729
.034
.410
.327
.633
.316
.96.
139
.315
.2Pl
ace
of re
side
nce:
Rura
l7.
048
.47.
240
.13.
757
.244
.224
.87.
022
.23.
3U
rban
22.9
38.5
21.8
32.0
7.4
31.8
27.9
13.7
8.7
34.4
14.8
Regi
on:
Kam
pala
31.7
26.2
31.2
24.2
16.0
8.5
15.9
7.9
8.2
47.0
27.8
Cent
ral
12.4
39.0
12.2
26.2
4.0
39.9
40.7
23.6
9.7
24.6
6.4
East
ern
5.4
48.9
6.3
34.7
4.0
56.5
49.3
37.6
11.4
20.6
3.2
Nor
ther
n6.
044
.24.
742
.43.
059
.443
.910
.33.
224
.73.
7W
este
rn11
.457
.812
.352
.24.
660
.935
.820
.54.
724
.43.
7
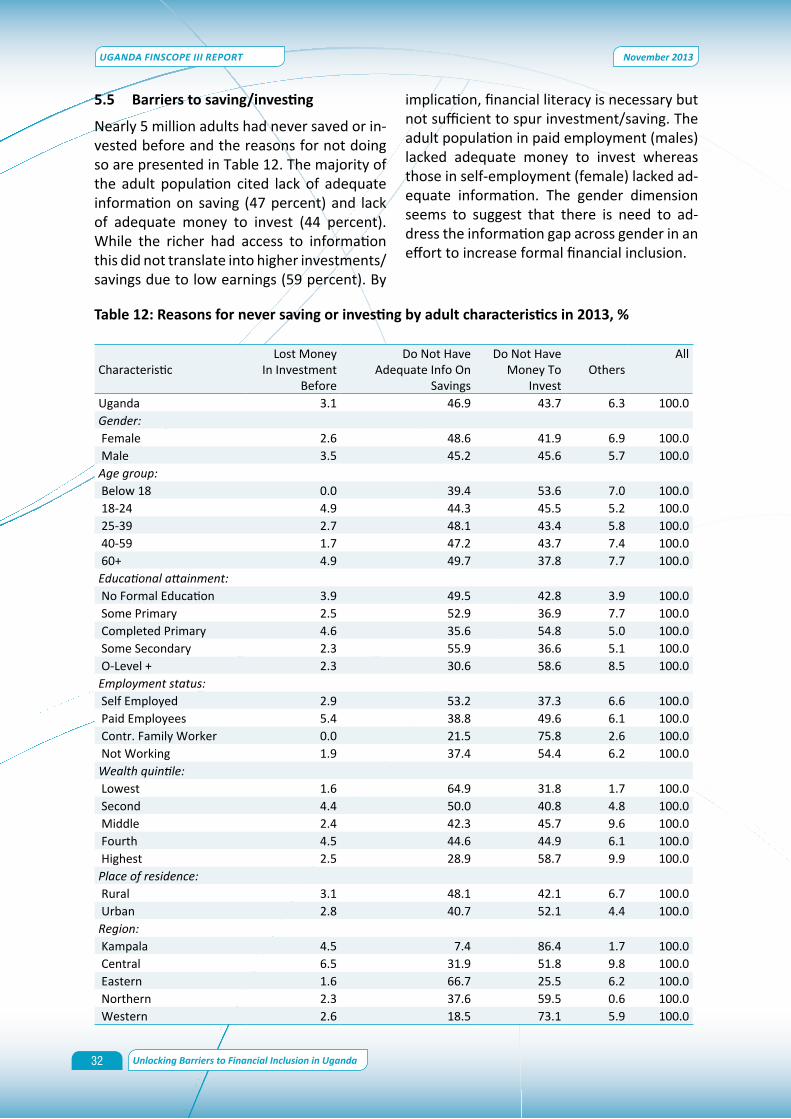
32
UGANDA FiNScope iii RepoRT
Unlocking Barriers to Financial inclusion in Uganda
November 2013
5.5 Barrierstosaving/investing
Nearly 5 million adults had never saved or in-vested before and the reasons for not doing so are presented in Table 12. The majority of the adult population cited lack of adequate information on saving (47 percent) and lack of adequate money to invest (44 percent). While the richer had access to information this did not translate into higher investments/savings due to low earnings (59 percent). By
implication, financial literacy is necessary but not sufficient to spur investment/saving. The adult population in paid employment (males) lacked adequate money to invest whereas those in self-employment (female) lacked ad-equate information. The gender dimension seems to suggest that there is need to ad-dress the information gap across gender in an effort to increase formal financial inclusion.
Table12:Reasonsforneversavingorinvestingbyadultcharacteristicsin2013,%
Characteristic Lost Money
In Investment Before
Do Not Have Adequate Info On
Savings
Do Not Have Money To
Invest Others
All
Uganda 3.1 46.9 43.7 6.3 100.0Gender: Female 2.6 48.6 41.9 6.9 100.0 Male 3.5 45.2 45.6 5.7 100.0Age group: Below 18 0.0 39.4 53.6 7.0 100.0 18-24 4.9 44.3 45.5 5.2 100.0 25-39 2.7 48.1 43.4 5.8 100.0 40-59 1.7 47.2 43.7 7.4 100.0 60+ 4.9 49.7 37.8 7.7 100.0Educational attainment: No Formal Education 3.9 49.5 42.8 3.9 100.0 Some Primary 2.5 52.9 36.9 7.7 100.0 Completed Primary 4.6 35.6 54.8 5.0 100.0 Some Secondary 2.3 55.9 36.6 5.1 100.0 O-Level + 2.3 30.6 58.6 8.5 100.0Employment status: Self Employed 2.9 53.2 37.3 6.6 100.0 Paid Employees 5.4 38.8 49.6 6.1 100.0 Contr. Family Worker 0.0 21.5 75.8 2.6 100.0 Not Working 1.9 37.4 54.4 6.2 100.0Wealth quintile: Lowest 1.6 64.9 31.8 1.7 100.0 Second 4.4 50.0 40.8 4.8 100.0 Middle 2.4 42.3 45.7 9.6 100.0 Fourth 4.5 44.6 44.9 6.1 100.0 Highest 2.5 28.9 58.7 9.9 100.0Place of residence: Rural 3.1 48.1 42.1 6.7 100.0 Urban 2.8 40.7 52.1 4.4 100.0Region: Kampala 4.5 7.4 86.4 1.7 100.0 Central 6.5 31.9 51.8 9.8 100.0 Eastern 1.6 66.7 25.5 6.2 100.0 Northern 2.3 37.6 59.5 0.6 100.0 Western 2.6 18.5 73.1 5.9 100.0

33
UGANDA FiNScope iii RepoRT
Unlocking Barriers to Financial inclusion in Uganda
November 2013
5.6 Concluding remarks
The demand for, and use of formal saving and investment products and services is low. However, the majority of the population that saved and invested used informal means. Vulnerable groups i.e. females, the less edu-cated, the unemployed and the poor were more likely to be formally excluded com-pared to their less vulnerable counterparts. The survey results also revealed that formal products were mostly used by the urban pop-ulation than their rural counterparts. There were significant gender, education and spa-tial gaps that need to be addressed, if one is to increase formal mechanisms of invest-ment. While the incidence of female non-formal (combined) savings was high, much of the savings were earmarked for consump-tion. Finally, the cited barriers seem to point to the low financial literacy levels and low in-comes.
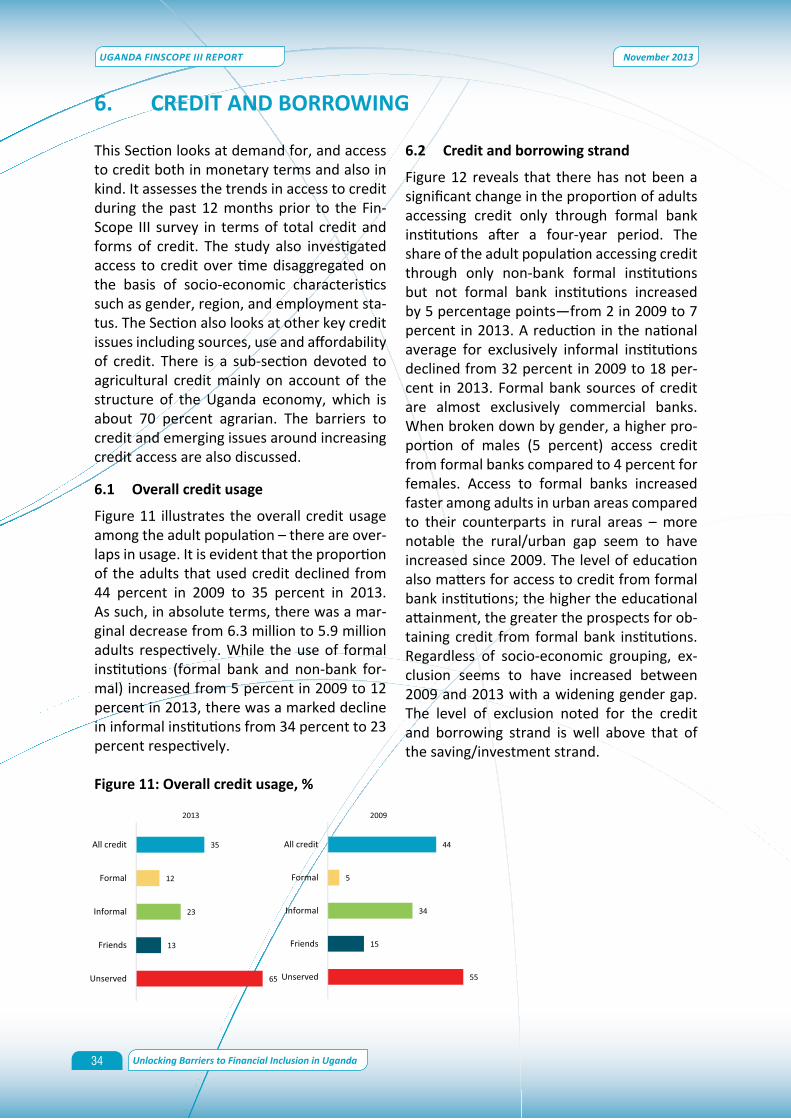
34
UGANDA FiNScope iii RepoRT
Unlocking Barriers to Financial inclusion in Uganda
November 2013
This Section looks at demand for, and access to credit both in monetary terms and also in kind. It assesses the trends in access to credit during the past 12 months prior to the Fin-Scope III survey in terms of total credit and forms of credit. The study also investigated access to credit over time disaggregated on the basis of socio-economic characteristics such as gender, region, and employment sta-tus. The Section also looks at other key credit issues including sources, use and affordability of credit. There is a sub-section devoted to agricultural credit mainly on account of the structure of the Uganda economy, which is about 70 percent agrarian. The barriers to credit and emerging issues around increasing credit access are also discussed.
6.1 Overall credit usage
Figure 11 illustrates the overall credit usage among the adult population – there are over-laps in usage. It is evident that the proportion of the adults that used credit declined from 44 percent in 2009 to 35 percent in 2013. As such, in absolute terms, there was a mar-ginal decrease from 6.3 million to 5.9 million adults respectively. While the use of formal institutions (formal bank and non-bank for-mal) increased from 5 percent in 2009 to 12 percent in 2013, there was a marked decline in informal institutions from 34 percent to 23 percent respectively.
Figure11:Overallcreditusage,%
6.2 Credit and borrowing strand
Figure 12 reveals that there has not been a significant change in the proportion of adults accessing credit only through formal bank institutions after a four-year period. The share of the adult population accessing credit through only non-bank formal institutions but not formal bank institutions increased by 5 percentage points—from 2 in 2009 to 7 percent in 2013. A reduction in the national average for exclusively informal institutions declined from 32 percent in 2009 to 18 per-cent in 2013. Formal bank sources of credit are almost exclusively commercial banks. When broken down by gender, a higher pro-portion of males (5 percent) access credit from formal banks compared to 4 percent for females. Access to formal banks increased faster among adults in urban areas compared to their counterparts in rural areas – more notable the rural/urban gap seem to have increased since 2009. The level of education also matters for access to credit from formal bank institutions; the higher the educational attainment, the greater the prospects for ob-taining credit from formal bank institutions. Regardless of socio-economic grouping, ex-clusion seems to have increased between 2009 and 2013 with a widening gender gap. The level of exclusion noted for the credit and borrowing strand is well above that of the saving/investment strand.
6. CREDIT AND BORROWING

35
UGANDA FiNScope iii RepoRT
Unlocking Barriers to Financial inclusion in Uganda
November 2013
Table 13 shows access to credit by other socio-economic characteristics in 2009 and 2013. Employment status is a determinant of access to credit from formal bank institu-tions. Paid employees were more likely to obtain credit from formal bank institutions (8 percent) compared to their counterparts in other employment status. This finding could be explained by the fact that the individuals in paid employment have a regular salary and in most cases are more likely to be guaran-teed by their employers. That said, there was a marked decline in the share of adult popu-lation accessing credit through formal institu-tions from 10 percent in 2009 to 8 percent in 2013.
The level of education also matters for ac-cess to credit from formal bank institutions; the higher the educational attainment, the greater the prospects for obtaining credit from formal bank institutions. The adult pop-ulation with O-level and above was six times more likely to receive credit compared to its counterparts with no formal education in 2013. Access to credit through formal insti-tutions improved marginally for the two top most wealth quintiles. Spatially, there was a marked decline in the share of the adult population resident in Eastern region and a significant increase for their counterparts in Western region.
Figure12:Creditandborrowingstrandbygenderandlocation,%

36
UGANDA FiNScope iii RepoRT
Unlocking Barriers to Financial inclusion in Uganda
November 2013
Table13
:Credita
ndborrowingstrand
bysocio-econ
omiccha
racteristics,%
2009
2013
Char
acte
ristic
sFo
rmal
Ba
nkFo
rmal
O
ther
Info
rmal
Fam
ily/F
riend
sEx
clud
edFo
rmal
Ba
nkFo
rmal
O
ther
Info
rmal
Fam
ily/
Frie
nds
Excl
uded
All
Uga
nda
4.6
1.6
31.8
7.2
54.9
5.7
6.6
18.4
4.5
64.8
100.
0A
ge in
yea
rs:
Belo
w 1
80.
70.
725
.410
.063
.12.
45.
310
.68.
772
.910
0.0
18-2
42.
11.
128
.19.
759
.14.
13.
114
.94.
373
.510
0.0
25-3
96.
01.
834
.36.
651
.36.
67.
820
.85.
559
.310
0.0
40-5
96.
52.
335
.26.
149
.97.
48.
321
.33.
459
.610
0.0
60+
5.3
1.1
30.1
1.4
62.2
2.6
5.2
12.3
2.7
77.2
100.
0Ed
ucati
onal
att
ainm
ent:
No
Form
al E
duca
tion
3.3
5.6
16.6
3.5
71.1
100.
0So
me
Prim
ary
3.3
6.5
21.9
4.8
63.5
100.
0Co
mpl
eted
Prim
ary
3.4
7.6
17.8
4.0
67.2
100.
0So
me
Seco
ndar
y5.
36.
819
.26.
761
.910
0.0
O’L
evel
+17
.76.
811
.63.
960
.110
0.0
Empl
oym
ent s
tatu
s:Se
lf Em
ploy
ed4.
31.
936
.17.
650
.25.
17.
520
.24.
762
.610
0.0
Paid
Em
ploy
ees
10.7
1.0
31.1
5.3
51.9
10.5
6.3
20.0
5.4
57.8
100.
0Co
ntr.
Fam
ily w
orke
r1.
22.
632
.58.
555
.24.
06.
719
.72.
667
.010
0.0
Not
Wor
king
2.5
0.4
20.3
6.7
70.1
3.5
2.8
8.9
3.2
81.6
100.
0W
ealth
qui
ntile
:Lo
wes
t2.
41.
421
.26.
368
.73.
53.
717
.06.
369
.510
0.0
Seco
nd3.
51.
341
.27.
746
.33.
95.
422
.14.
464
.210
0.0
Third
3.0
2.0
43.2
6.7
45.1
3.9
9.1
22.3
3.4
61.4
100.
0Fo
urth
5.6
1.5
30.9
8.6
53.4
6.4
8.3
18.5
3.1
63.7
100.
0Fi
fth8.
01.
722
.56.
361
.610
.76.
011
.85.
865
.810
0.0
Regi
on:
Kam
pala
4.9
2.9
11.5
3.6
77.0
100.
0Ce
ntra
l4.
00.
831
.25.
059
.04.
85.
415
.63.
870
.410
0.0
East
ern
8.0
2.5
35.2
9.6
44.6
4.6
4.7
17.5
4.7
68.6
100.
0N
orth
ern
2.2
2.2
10.7
1.5
83.4
5.3
3.1
18.4
5.2
68.0
100.
0W
este
rn3.
61.
340
.910
.743
.58.
213
.623
.84.
749
.710
0.0

37
UGANDA FiNScope iii RepoRT
Unlocking Barriers to Financial inclusion in Uganda
November 2013
Turning to non-bank formal credit some ob-servations do emerge. There are notable in-creases in the proportion of adults accessing credit through these institutions compared to the trends observed for formal financial institutions. The gender gap and gap be-tween the paid and self-employed narrowed whereas the gap between the poorest and richest increased over the four-year period. Furthermore, the rural/urban gap is widen-ing with the rural adult population more like-ly to access credit through non-bank formal institutions compared to their counterparts in urban areas. This phenomenon is partly explained by the spread of SACCOS in rural areas (see Figure 6). The Western region also leads in terms of access to credit from non-bank formal financial institutions with 14 per-cent of the adult population accessing credit compared to only 3 percent for Northern re-gion. Central region follows with 5 percent.Like other sources of credit, the proportion of adults accessing credit from informal sources though higher compared to other sources still remains small and does not exceed 30 percent for any of the categories of borrow-ers. However, there are no gender gaps in the reported use of informal sources of credit.
There is an inverse relationship between ed-ucational achievement and access to credit from informal sources in 2013. Adults with some primary education had the highest proportion of the adult population obtain-ing credit from informal sources (22 percent). The adults with O-level and above qualifica-tion had the lowest proportion of borrowing from informal sources (12 percent). A bigger proportion of adults residing in rural areas borrow from informal sources (21 percent) compared to their counterparts in urban ar-eas (18 percent). The proximity to formal and non-bank formal institutions presents great opportunities for residents in urban areas and Kampala in particular. It is therefore not surprising to note the low incidence in ac-cessing and using informal institutions.
6.3 Types of credit
Table 14 presents the type of credit accessed by borrowers. Forms of credit include the following: i) money only; ii) goods only; and iii) goods and money. The table also gives the proportion of adults not accessing credit (no goods nor money). Overall, 45 percent of the adults have no access to credit in form of money or goods. The proportion of the adult population that accessed credit in form of money only was the lowest (14 percent) compared to other categories. As much as 17 percent of the adult population accessed credit in kind (goods only) while 24 percent accessed credit in form of goods and money.
In 2013, there were no discernible gender differences with regards to accessing credit in form of goods and money; the proportion of males (25 percent) accessing credit in this form was not very different from that for fe-males (23 percent). The same is true with re-gards to different age brackets, although the 40-59 years age bracket had higher access at 29 percent followed by the 25-39 years age bracket (28 percent). Senior citizens (60 years and above) had the least access at 13 percent.Turning to educational attainment, the cat-egory of adults with O-level and above had the highest proportion who borrow in a com-bination of goods and money (31 percent) compared to (20-24 percent) for each of the remaining education categories. With regard to employment status, a bigger proportion of adults in paid employment category bor-rowed in a form of goods and money (34 per-cent) compared to only 13 percent for the unemployed, and 24 percent for the self-em-ployed. Turning to wealth status, there were hardly any observable differences in the pro-portion of borrowers for the different income quintiles ranging from 19 percent and 27 per-cent (see Table 14).
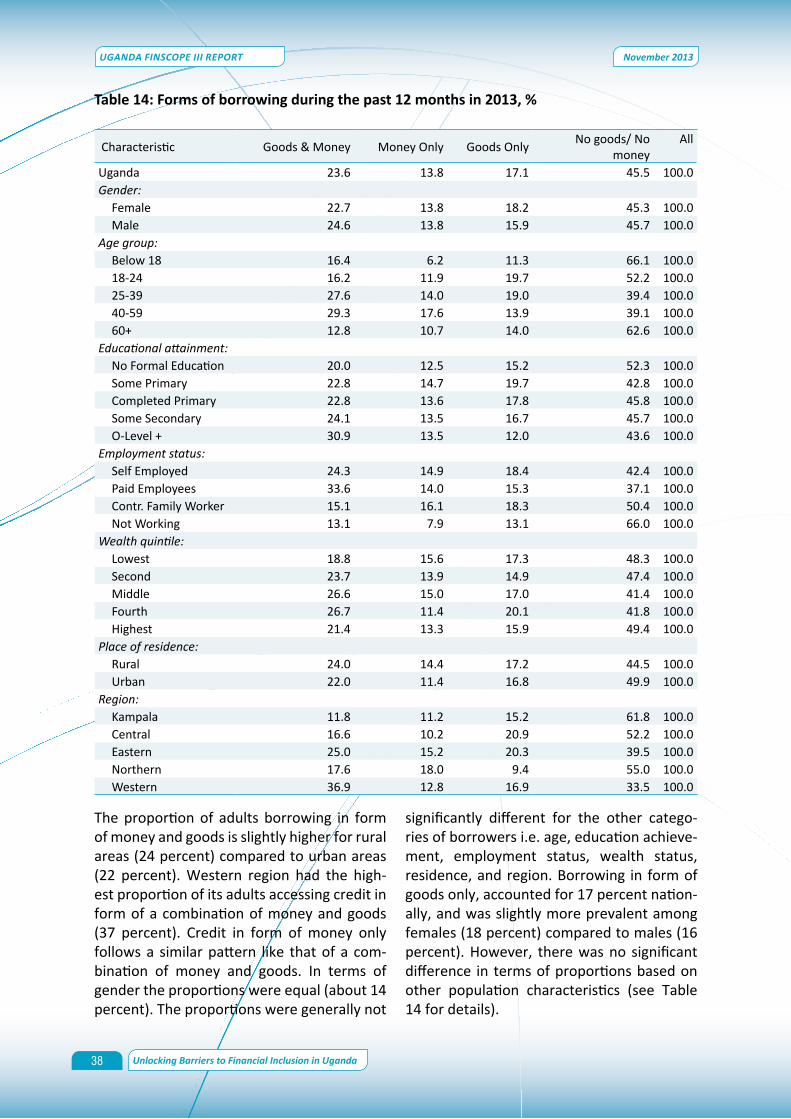
38
UGANDA FiNScope iii RepoRT
Unlocking Barriers to Financial inclusion in Uganda
November 2013
Table14:Formsofborrowingduringthepast12monthsin2013,%
Characteristic Goods & Money Money Only Goods Only No goods/ No money
All
Uganda 23.6 13.8 17.1 45.5 100.0Gender:
Female 22.7 13.8 18.2 45.3 100.0Male 24.6 13.8 15.9 45.7 100.0
Age group:Below 18 16.4 6.2 11.3 66.1 100.018-24 16.2 11.9 19.7 52.2 100.025-39 27.6 14.0 19.0 39.4 100.040-59 29.3 17.6 13.9 39.1 100.060+ 12.8 10.7 14.0 62.6 100.0
Educational attainment:No Formal Education 20.0 12.5 15.2 52.3 100.0Some Primary 22.8 14.7 19.7 42.8 100.0Completed Primary 22.8 13.6 17.8 45.8 100.0Some Secondary 24.1 13.5 16.7 45.7 100.0O-Level + 30.9 13.5 12.0 43.6 100.0
Employment status:Self Employed 24.3 14.9 18.4 42.4 100.0Paid Employees 33.6 14.0 15.3 37.1 100.0Contr. Family Worker 15.1 16.1 18.3 50.4 100.0Not Working 13.1 7.9 13.1 66.0 100.0
Wealth quintile:Lowest 18.8 15.6 17.3 48.3 100.0Second 23.7 13.9 14.9 47.4 100.0Middle 26.6 15.0 17.0 41.4 100.0Fourth 26.7 11.4 20.1 41.8 100.0Highest 21.4 13.3 15.9 49.4 100.0
Place of residence:Rural 24.0 14.4 17.2 44.5 100.0Urban 22.0 11.4 16.8 49.9 100.0
Region:Kampala 11.8 11.2 15.2 61.8 100.0Central 16.6 10.2 20.9 52.2 100.0Eastern 25.0 15.2 20.3 39.5 100.0Northern 17.6 18.0 9.4 55.0 100.0Western 36.9 12.8 16.9 33.5 100.0
The proportion of adults borrowing in form of money and goods is slightly higher for rural areas (24 percent) compared to urban areas (22 percent). Western region had the high-est proportion of its adults accessing credit in form of a combination of money and goods (37 percent). Credit in form of money only follows a similar pattern like that of a com-bination of money and goods. In terms of gender the proportions were equal (about 14 percent). The proportions were generally not
significantly different for the other catego-ries of borrowers i.e. age, education achieve-ment, employment status, wealth status, residence, and region. Borrowing in form of goods only, accounted for 17 percent nation-ally, and was slightly more prevalent among females (18 percent) compared to males (16 percent). However, there was no significant difference in terms of proportions based on other population characteristics (see Table 14 for details).
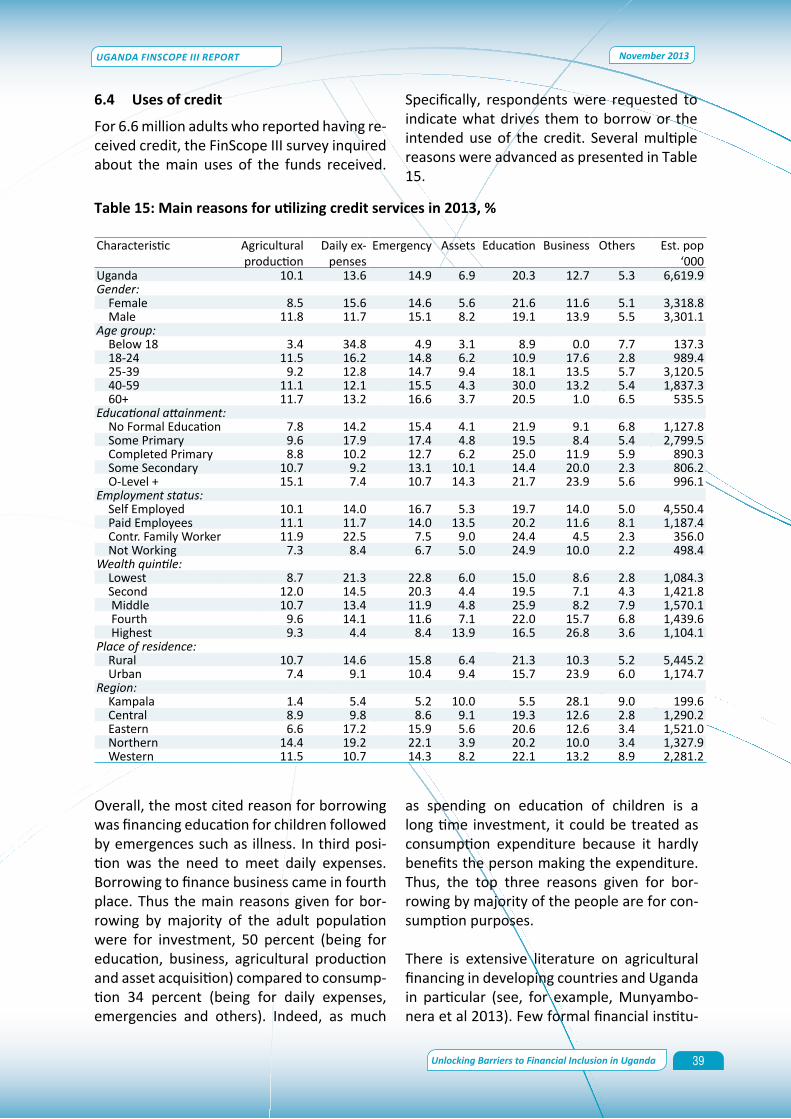
39
UGANDA FiNScope iii RepoRT
Unlocking Barriers to Financial inclusion in Uganda
November 2013
6.4 Uses of credit
For 6.6 million adults who reported having re-ceived credit, the FinScope III survey inquired about the main uses of the funds received.
Specifically, respondents were requested to indicate what drives them to borrow or the intended use of the credit. Several multiple reasons were advanced as presented in Table 15.
Table15:Mainreasonsforutilizingcreditservicesin2013,%
Characteristic Agricultural production
Daily ex-penses
Emergency Assets Education Business Others Est. pop ‘000
Uganda 10.1 13.6 14.9 6.9 20.3 12.7 5.3 6,619.9Gender:
Female 8.5 15.6 14.6 5.6 21.6 11.6 5.1 3,318.8Male 11.8 11.7 15.1 8.2 19.1 13.9 5.5 3,301.1
Age group:Below 18 3.4 34.8 4.9 3.1 8.9 0.0 7.7 137.318-24 11.5 16.2 14.8 6.2 10.9 17.6 2.8 989.425-39 9.2 12.8 14.7 9.4 18.1 13.5 5.7 3,120.540-59 11.1 12.1 15.5 4.3 30.0 13.2 5.4 1,837.360+ 11.7 13.2 16.6 3.7 20.5 1.0 6.5 535.5
Educational attainment:No Formal Education 7.8 14.2 15.4 4.1 21.9 9.1 6.8 1,127.8Some Primary 9.6 17.9 17.4 4.8 19.5 8.4 5.4 2,799.5Completed Primary 8.8 10.2 12.7 6.2 25.0 11.9 5.9 890.3Some Secondary 10.7 9.2 13.1 10.1 14.4 20.0 2.3 806.2O-Level + 15.1 7.4 10.7 14.3 21.7 23.9 5.6 996.1
Employment status:Self Employed 10.1 14.0 16.7 5.3 19.7 14.0 5.0 4,550.4Paid Employees 11.1 11.7 14.0 13.5 20.2 11.6 8.1 1,187.4Contr. Family Worker 11.9 22.5 7.5 9.0 24.4 4.5 2.3 356.0Not Working 7.3 8.4 6.7 5.0 24.9 10.0 2.2 498.4
Wealth quintile:Lowest 8.7 21.3 22.8 6.0 15.0 8.6 2.8 1,084.3Second 12.0 14.5 20.3 4.4 19.5 7.1 4.3 1,421.8 Middle 10.7 13.4 11.9 4.8 25.9 8.2 7.9 1,570.1 Fourth 9.6 14.1 11.6 7.1 22.0 15.7 6.8 1,439.6 Highest 9.3 4.4 8.4 13.9 16.5 26.8 3.6 1,104.1
Place of residence:Rural 10.7 14.6 15.8 6.4 21.3 10.3 5.2 5,445.2Urban 7.4 9.1 10.4 9.4 15.7 23.9 6.0 1,174.7
Region:Kampala 1.4 5.4 5.2 10.0 5.5 28.1 9.0 199.6Central 8.9 9.8 8.6 9.1 19.3 12.6 2.8 1,290.2Eastern 6.6 17.2 15.9 5.6 20.6 12.6 3.4 1,521.0Northern 14.4 19.2 22.1 3.9 20.2 10.0 3.4 1,327.9Western 11.5 10.7 14.3 8.2 22.1 13.2 8.9 2,281.2
Overall, the most cited reason for borrowing was financing education for children followed by emergences such as illness. In third posi-tion was the need to meet daily expenses. Borrowing to finance business came in fourth place. Thus the main reasons given for bor-rowing by majority of the adult population were for investment, 50 percent (being for education, business, agricultural production and asset acquisition) compared to consump-tion 34 percent (being for daily expenses, emergencies and others). Indeed, as much
as spending on education of children is a long time investment, it could be treated as consumption expenditure because it hardly benefits the person making the expenditure. Thus, the top three reasons given for bor-rowing by majority of the people are for con-sumption purposes.
There is extensive literature on agricultural financing in developing countries and Uganda in particular (see, for example, Munyambo-nera et al 2013). Few formal financial institu-

40
UGANDA FiNScope iii RepoRT
Unlocking Barriers to Financial inclusion in Uganda
November 2013
tions are willing to extend credit to the agri-cultural sector – regarded as a risky sector. Against this, the report explores the extent to which the adult population was borrowing for agricultural production purposes. The results in Table 15 reveal that only 10 percent of the borrowers borrowed for agriculture produc-tion. Yet, majority of Uganda’s population (an estimated 70 percent) derive their livelihoods from agriculture. Regarding credit to agricul-ture production on the basis of gender, the proportion of females borrowing for agricul-ture production (8 percent) was lower com-pared to that of males (12 percent). Table 15 further reveals a marked life cycle dimension, with the youth (18-24 years) more likely to borrow for agricultural purposes compared to their counterparts in the middle ages (25-39 years) at 9 percent. No significant differ-ences are noted across employment status.
A higher proportion (15 percent) of the adults with O-level qualifications and above bor-rowed for agriculture production compared to their counterparts with other levels of edu-cation. This scenario suggests that education is important for investment in agriculture – probably education increases one’s ability to evaluate and manage the risks involved in the agricultural sector. Regarding wealth status, the results suggests that in terms of lend-ing for agriculture production, policy makers should target middle income quintiles.
The place of residence too matters when it comes to borrowing for agriculture produc-tion. The adults residing in Northern region were more likely to borrow for agricultural production compared to their counterparts in other regions. As expected, the rural adult population is more likely to borrow for ag-ricultural purposes relative to their urban counterparts. The credit pattern, which does not give priority to agriculture production does not auger well for Uganda’s economic development prospects.
Figure 13: Main reasons for accessing agri-culturalcreditin2013,%
The biggest proportion of the adult popula-tion borrowing to finance agriculture pro-duction does so for purchase of inputs (54 percent), followed by hiring farm labour (29 percent) - Figure 13. Other uses of agricul-ture credit include purchase of livestock (15 percent); purchase of agricultural land (8 percent); and purchase of farm equipment (6 percent).
Turning to borrowing to finance start-up/ex-pansion of an existing business, 13 percent of the adult population borrow for this purpose with variations across socio-economic char-acteristics. The likelihood for this purpose increases with the level of education and wealth status. This is also true for the level of local economic development—in urban and particular Kampala, the prevalence of borrowing is relatively higher. As expected, individuals in self-employment are more like-ly to borrow for business compared to their counterparts in paid employment. A slightly higher proportion of males (14 percent) bor-row to finance their businesses compared to 12 percent for females. Compared to senior citizens, the middle aged (25-39 years) are more likely to borrow for business and less likely to borrow for agricultural production. Similar patterns are observed for the youth. Borrowing to finance daily expenses for con-sumption purposes featured high among the uses of credit with 14 percent of borrowers stating it as one of the reasons for borrow-ing. However, there were variations among different categories of borrowers. The likeli-

41
UGANDA FiNScope iii RepoRT
Unlocking Barriers to Financial inclusion in Uganda
November 2013
hood reduces with education, age and wealth status. Females were more likely to borrow (16 percent) for consumption relative to their male counterparts (12 percent). Similarly, be-ing a rural resident increased the likelihood to borrow for basic needs. These findings suggest that the more vulnerable ones were more likely to borrow to meet basic needs.
6.5 Perceptionsoncreditandborrowing
Whether from formal or informal sources, credit is given to people on different terms and conditions. Formal financial institutions’ terms of credit include: interest rates, repay-ment terms, grace period, processing fees, le-gal procedures, and other conditions. These terms and conditions, which partly constitute loan costs, are normally dictated by the lend-er; and the borrower will either accept or re-ject them. Small-value borrowers do not have market power to reduce borrowing costs compared to large corporate borrowers who have the necessary market power to do so. If Uganda is to reduce the cost of borrowing a special policy aimed at growing the popula-tion and size of the corporate sector remains
paramount. In most cases, because the bor-rowers are in urgent need of the money or goods and services, they do not take time to study and understand the terms and condi-tions. The analysis in this sub-section is based on 3.7 million adults that received a loan/credit in the most recent past.
The respondents were requested to provide their perception on whether it was easier to borrow from various financial institutions now (2013) compared to 2009. The results are presented in Figure 15 and there are variations. It is worth noting that the “don’t know” category was sizeable. However, the discussion here focuses on those who re-sponded with “Yes” or “No”, it is evident that a greater percentage of the adult population cited improvements in VSLAs (53 percent) followed by SACCOs (27 percent), ROSCAs (21 percent), in that order. The likelihood to cite non-improvement was more prevalent for formal bank institutions relative to the non-bank formal.
Figure14:Perceptionsonwhetheraccesstofinancialinstitutionsimprovedsince2009,retrospectively%

42
UGANDA FiNScope iii RepoRT
Unlocking Barriers to Financial inclusion in Uganda
November 2013
The respondents were asked to indicate on a five-tier Likert scale the affordability of the most recent loan (Figure 15). The majority of the adult population borrowers (52 per-cent) indicated that the loan was affordable against 5 percent that indicated that it was very expensive.
Figure15:Borrowers’perceptionontheaf-fordabilityoftheirrecentloanin2013,%
Furthermore, the study investigated the level of understanding of the terms and conditions of obtaining credit among the borrowers. The results are presented in Figure 16. It is sur-prising to note that 16 percent did not read the terms (Figure 16 a). Yet, nearly all the adult borrowers indicated that they under-stood the terms and conditions before taking on a given loan (Figure 16 b).
Figure 16: Understanding of the terms and conditionsofloan/creditin2013,%
residence. A larger proportion of borrow-ers (73 percent) took up small loans that did not exceed UShs 500,000. Loans that ranged between UShs 500,000 and UShs 1,000,000 were 14 percent of total loans, while those in excess of one million were only 13 percent (Figure 17).
Figure17:Loansizebygenderandlocationin2013,UShs(‘000),%
When disaggregated by rural/urban distribu-tion, borrowers in urban areas were more than two times likely to access loans of more than UShs 1 million and above compared to their counterparts in rural areas. This partly reflects the level of high income and business in these areas. On the other hand, male bor-rowers were almost three times more likely to borrow a loan of UShs 1million and above (18 percent), compared to their female coun-terparts (8 percent). Put differently, being female and resident in rural areas was associ-ated with smaller loans.
The small size of loans implies that most peo-ple are microfinance clients. This also pro-vides an explanation as to why most people prefer SACCOs and informal sources of credit compared to commercial banks. The basis for determining the size of loan from formal bank institutions includes size of business cash flows, assets that provide collateral for the credit, as well as the financial needs of the project to be financed, for which major-ity of borrowers may not have. As a conse-quence the informal and semi-formal finan-cial institutions are claiming a bigger market share of the credit services market.
6.6 Loansizeandcollateralrequirements
Figure 17 shows loan sizes starting with the broad national picture and then analysed separately for various categories of borrow-ers’ characteristics including gender and

43
UGANDA FiNScope iii RepoRT
Unlocking Barriers to Financial inclusion in Uganda
November 2013
About 47 percent of the borrowers reported that a collateral security was required in or-der to obtain a loan/credit. The borrowers, further, provided information on the form of security by financial institution when the most recent loan/credit was obtained. The results are presented in Table 16. Land title dominates the list with the exception of the ROSCAs/VSLAs and employer.
knowledge (8 percent); never needed a loan (9 percent); no financial institutions nearby (4 percent); “I do not think I am credit worthy” (9 percent); and “I do not think I need to bor-row” (6 percent).
tion of the adults feared debts (31 percent)—this suggests a certain degree of risk averse-ness among the Ugandan population. The high cost of loans was the second most fre-quently cited reason for not accessing credit (14 percent) followed by lack of security (fur-ther discussed below). In addition to these three main reasons, there were other rea-sons for not taking up loans and they includ-ed: nowhere to get a loan (5 percent); lack of
Table17:Reasonsfornottakingloansbygenderandlocationin2013,%
ReasonGender Place of residence All
Female Male Rural UrbanHave nowhere to get loan 4.4 6.3 6.0 2.6 5.3Have no knowledge 7.3 9.0 8.7 5.6 8.1Fear debts 34.2 27.3 30.8 31.7 31.0Have never needed a loan 9.5 7.8 7.8 12.8 8.7Loan are too expensive 13.6 14.3 14.4 12.0 14.0There are no financial institution nearby 2.9 4.0 3.8 2.0 3.5I do not think I am credit worthy 8.9 8.0 8.9 6.8 8.5Lack security to offer 12.6 13.5 12.5 15.4 13.0I do not think I need to borrow 5.8 5.5 4.7 9.6 5.7Others 4.0 2.7 3.0 4.9 3.4
Table16:Formofcollateralsecurityrequiredbyinstitutionin2013,%
Institutions Land title
Household assets
Livestock Car/motorcycle with logbook
Machinery, tools
Shares Insurance policy
Others Est. pop (‘000)
Commercial banks 30.2 11.2 6.9 0.7 2.5 1.3 47.1 371.4
MDI 28.0 35.3 1.9 34.8 69
Other MFIs 46.9 12.1 8.7 32.3 241.5
SACCO 29.3 9.2 9.2 0.9 10.6 40.9 452
ROSCAs/VSLAs 14.8 4.6 24.4 2.0 23.3 31.0 1,051.70
Money lender 23.6 5.3 13.0 4.4 12.4 41.2 116.3
Employer 18.7 29.4 51.9 37
6.7 Barriers to credit
For persons who have never accessed credit (from any source), the survey inquired the reasons for never having taken a loan. Table 17 profiles the reasons based on gender and spatial location. Overall the largest propor-
44
UGANDA FiNScope iii RepoRT
Unlocking Barriers to Financial inclusion in Uganda
November 2013
On the basis of gender, a higher proportion of females (34 percent) feared debts compared to males (27 percent). However, fear of loans was equally cited by both urban and rural dwellers (about 32 percent). Regarding the high cost of loans, it was considered a con-straint for both male and female borrowers (14 percent).
As can be seen from Table 17, lack of security to offer to secure a loan featured as the third most frequently stated reason for not bor-rowing. Surprisingly, a slightly larger propor-tion of males (13.5 percent) did not access credit because of lack of security compared to females (12.6 percent). This could be be-cause of the sources of credit for each of the genders; with females borrowing more from informal sources where collateral is not al-ways a requirement.
It is similarly surprising that a bigger propor-tion of urban dwellers (15.4 percent) lacked security to access credit compared to 12.5 percent for rural dwellers. This could be be-cause of collateral requirements were more pronounced in urban areas where sources of credit are largely formal. Rural people tend to borrow more from informal sources and col-lateral is not always a requirement.
6.8 Concluding remarks
The proportion of the population accessing credit from formal bank institutions increased marginally from 5 percent in 2009 to 6 per-cent in 2013. On the other hand, the propor-tion of the population accessing credit from informal sources fell from 32 percent in 2009 to 18 percent in 2013. The increasing number of SACCOs explains the increase in access to credit from non-bank formal sources from 2 percent in 2009 to 7 percent in 2013. Howev-er, the proportion of the population excluded from the credit market increased from 55 percent in 2009 to 65 percent in 2013.
The category of those excluded from the credit market comprises higher proportions
of the adults in the lower wealth quintile, fe-males, rural dwellers, and the relatively less educated. Of those that access credit from informal sources, majority of them borrow little money hardly exceeding Ushs 500,000, for which borrowing collateral is often not a requirement.
The credit accessed by majority of borrowers was mainly for consumptions purposes (such as emergencies, and meeting daily expenses) and for financing education of their children, which activities hardly translate into higher economic growth in the short run. Credit to agricultural production was accessed by only 10 percent of the population, with 54 percent of credit to agriculture going to the purchase of inputs and 29 percent going to hiring of la-bour.
Broadly, the credit system is weakly sup-portive of investment and economic growth. This is because liquidity available is of short-term nature and there is lack of sufficient long-term liquidity suitable for the long-end of the market spectrum. The system favours urban dwellers and the relatively rich, yet Uganda remains largely an agrarian economy with about 70 percent or the population em-ployed in agriculture, and having low levels of income. To enable those excluded from the credit market to benefit from credit, it will be necessary for government policy to focus on mobilising long-term savings, entrepreneur-ship mobilisation, and encourage productiv-ity as a means to increasing households in-comes, particularly targeting the vulnerable including females, the rural poor, and the relatively less educated.
45
UGANDA FiNScope iii RepoRT
Unlocking Barriers to Financial inclusion in Uganda
November 2013
This Section analyses the risks that Ugandans have encountered in the past 12 months prior to the FinScope III survey and the risk management mechanisms that were adopt-ed to ensure business continuity. It also cov-ers formal and informal insurance as means to mitigate risk.
7.1 Risksprofile
In the recent past, several research works have alluded to the growing vulnerabilities of the Ugandans (see, Ssewanyana & Kasirye 2012; MoFPED 2012). In the same manner, FinScope III survey requested the respon-dents to identify whether their households experienced any shock that might have nega-tively impacted on his/her income. Table 18 illustrates the different risks faced by adult Ugandans (nearly 16.4 million that respond-ed), disaggregated by gender, regional loca-tion and urban/rural location. In all regions including Kampala, the most common form of risk that impacted on individual income, was illness of family members (48 percent of the adult population). While there is no gen-der gap in risks due to illness, rural individu-als had a higher incidence of illness of family members. At least one in every five adults in 2013 was affected by death of a family mem-ber/relative. Illness and death are prevalent as reported risks across regions equally, al-
though residents of Kampala experienced relatively less incidences of illness of a family member/relative (30 percent) and this may explain the lower reported rates of illness in urban areas as observed above. Since Fin-Scope I in 2006 illness in the family has been a persistent risk phenomenon affecting 58 per-cent the adult population in 2006 (Stedman Group 2007) and 39 percent in 2009 (Syno-vate Uganda 2009).
Risks due to drought as well as crop/livestock diseases outbreaks were also prevalent, af-fecting 26 percent and 15 percent of the adult population respectively. Rural adults were more likely to cite drought compared to their urban counterparts. In addition, the in-cidence of reporting drought increased with wealth status. Drought was mostly cited in Northern region (39 percent) while crop/live-stock disease outbreaks were most frequent in Western region (19 percent). Previous studies conducted by EPRC (Ssewanyana & Kasirye 2013) showed increasing vulnerabil-ity to drought. Similar observations are made in various government policy documents (e.g. MoFPED (2011, 2012, 2013); OPM (2013)). Theft was also a major risk that affected 15 percent of the adult population—it raises concerns about the presence of ‘blue collar crimes’.
7. RISK MANAGEMENT AND INSURANCE
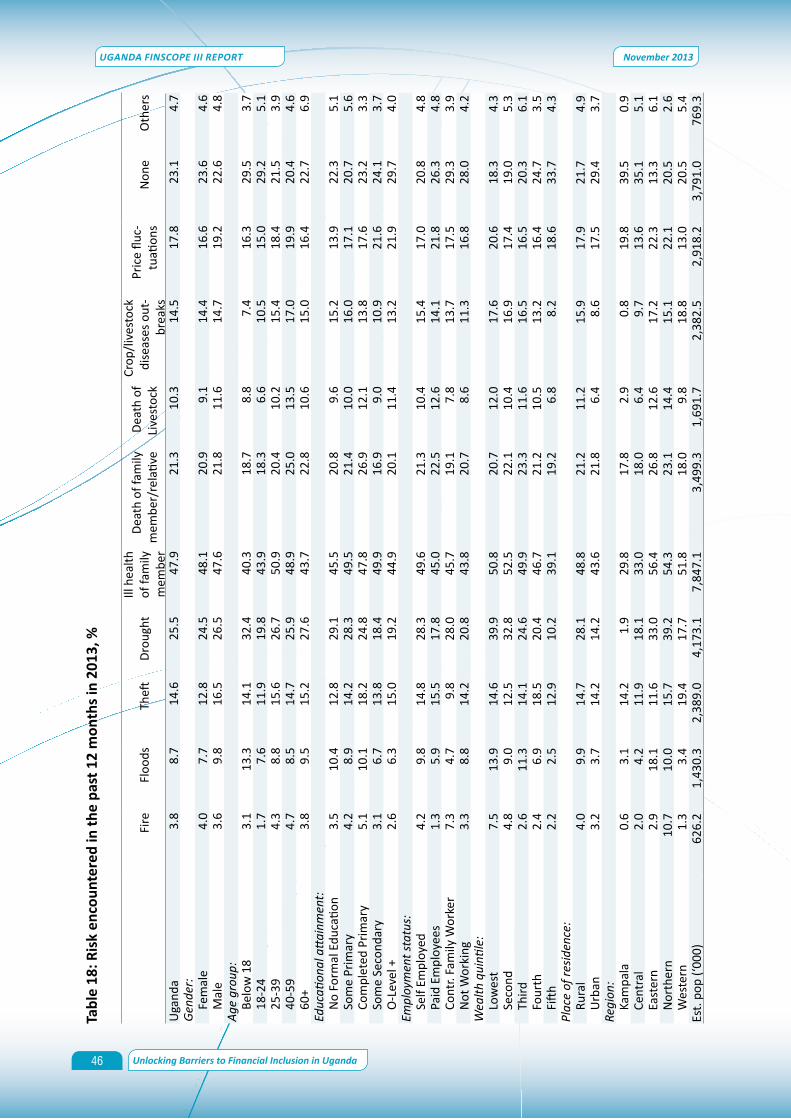
46
UGANDA FiNScope iii RepoRT
Unlocking Barriers to Financial inclusion in Uganda
November 2013
Table18
:Risken
coun
teredinthe
past12
mon
thsin201
3,%
Fire
Floo
dsTh
eftDr
ough
tIll
hea
lth
of fa
mily
m
embe
r
Deat
h of
fam
ily
mem
ber/
rela
tive
Deat
h of
Li
vest
ock
Crop
/live
stoc
k di
seas
es o
ut-
brea
ks
Pric
e flu
c-tu
ation
sN
one
Oth
ers
Uga
nda
3.8
8.7
14.6
25.5
47.9
21.3
10.3
14.5
17.8
23.1
4.7
Gen
der:
Fe
mal
e4.
07.
712
.824
.548
.120
.99.
114
.416
.623
.64.
6M
ale
3.6
9.8
16.5
26.5
47.6
21.8
11.6
14.7
19.2
22.6
4.8
Age
gro
up:
Belo
w 1
83.
113
.314
.132
.440
.318
.78.
87.
416
.329
.53.
718
-24
1.7
7.6
11.9
19.8
43.9
18.3
6.6
10.5
15.0
29.2
5.1
25-3
94.
38.
815
.626
.750
.920
.410
.215
.418
.421
.53.
940
-59
4.7
8.5
14.7
25.9
48.9
25.0
13.5
17.0
19.9
20.4
4.6
60+
3.8
9.5
15.2
27.6
43.7
22.8
10.6
15.0
16.4
22.7
6.9
Educ
ation
al a
ttai
nmen
t:N
o Fo
rmal
Edu
catio
n3.
510
.412
.829
.145
.520
.89.
615
.213
.922
.35.
1So
me
Prim
ary
4.2
8.9
14.2
28.3
49.5
21.4
10.0
16.0
17.1
20.7
5.6
Com
plet
ed P
rimar
y5.
110
.118
.224
.847
.826
.912
.113
.817
.623
.23.
3So
me
Seco
ndar
y3.
16.
713
.818
.449
.916
.99.
010
.921
.624
.13.
7O
-Lev
el +
2.6
6.3
15.0
19.2
44.9
20.1
11.4
13.2
21.9
29.7
4.0
Empl
oym
ent s
tatu
s:Se
lf Em
ploy
ed4.
29.
814
.828
.349
.621
.310
.415
.417
.020
.84.
8Pa
id E
mpl
oyee
s1.
35.
915
.517
.845
.022
.512
.614
.121
.826
.34.
8Co
ntr.
Fam
ily W
orke
r7.
34.
79.
828
.045
.719
.17.
813
.717
.529
.33.
9N
ot W
orki
ng3.
38.
814
.220
.843
.820
.78.
611
.316
.828
.04.
2W
ealth
qui
ntile
:Lo
wes
t7.
513
.914
.639
.950
.820
.712
.017
.620
.618
.34.
3Se
cond
4.8
9.0
12.5
32.8
52.5
22.1
10.4
16.9
17.4
19.0
5.3
Third
2.6
11.3
14.1
24.6
49.9
23.3
11.6
16.5
16.5
20.3
6.1
Four
th2.
46.
918
.520
.446
.721
.210
.513
.216
.424
.73.
5Fi
fth2.
22.
512
.910
.239
.119
.26.
88.
218
.633
.74.
3Pl
ace
of re
side
nce:
Rura
l4.
09.
914
.728
.148
.821
.211
.215
.917
.921
.74.
9U
rban
3.2
3.7
14.2
14.2
43.6
21.8
6.4
8.6
17.5
29.4
3.7
Regi
on:
Kam
pala
0.6
3.1
14.2
1.9
29.8
17.8
2.9
0.8
19.8
39.5
0.9
Cent
ral
2.0
4.2
11.9
18.1
33.0
18.0
6.4
9.7
13.6
35.1
5.1
East
ern
2.9
18.1
11.6
33.0
56.4
26.8
12.6
17.2
22.3
13.3
6.1
Nor
ther
n10
.710
.015
.739
.254
.323
.114
.415
.122
.120
.52.
6W
este
rn1.
33.
419
.417
.751
.818
.09.
818
.813
.020
.55.
4Es
t. po
p (‘0
00)
626.
21,
430.
32,
389.
04,
173.
17,
847.
13,
499.
31,
691.
72,
382.
52,
918.
23,
791.
076
9.3
47
UGANDA FiNScope iii RepoRT
Unlocking Barriers to Financial inclusion in Uganda
November 2013
7.2 Accesstoandutilisationofinsuranceservices
The above findings on incidence of risks pro-vide useful information to insurance compa-nies regarding product development—in or-der to deal with short- and long-term risks. Yet, only 2 percent of the adult population (representing an estimated 349,295 adults) reported using formal insurance products compared to 43 percent who use informal in-surance products (Table 19) – the results are not mutually exclusive. There was a marginal reduction from the previous FinScope sur-vey—3 percent (413,585 adults) using formal insurance but an increase in the use of infor-mal institutions (21 percent in 2009). This is consistent with figures from Uganda Insur-ers Association (UIA) showing that the insur-ance industry is still underdeveloped with an insurance density of 2 percent (Uganda In-surer’s Association, 2011).5 This implies that formal insurance products are weakly cor-related with risk management among adult Ugandans. The low level of formal insurance penetration in Uganda calls for strategic in-novations by insurance companies to address the low formal coverage. As it is now, when a disaster occurs, majority of Ugandans resort to a number of rudimentary risk mitigation strategies, most of which are informal in na-ture.
In Table 19, there are other notable patterns regarding access to insurance products that are worth commenting on. First, the propor-tion of males taking up at least one formal insurance product was nearly five times that of females. Second, higher educational at-tainment was associated with a greater likeli-hood of owning a formal insurance product. Finally, the proportion of urban dwellers with at least one formal insurance product was about four times that of rural dwellers. Kampala had more formal insurance than any other region in the country. Ownership of formal insurance is poverty insensitive—
5 Insurance density is the ratio of the persons using formal insur-ance products to the total population.
only individuals in the top 20 percent quintile have insurance cover.
On the other hand, the use of informal insur-ance is a rural phenomenon, more prevalent among middle aged adults (25-39 and 40-59 years) and among adults resident in Eastern and Western regions. Individuals using infor-mal insurance mechanisms (representing 7.2 million adults), were asked to indicate reasons for this preference. The results are presented in Table 20. Among those who stated they did not own formal insurance but belonged to one or more informal insurance groups, ma-jority (44 percent) said it was easier to join such groups. Nearly 15 percent adult popula-tion revealed affordability as a key reason for preferring informal insurance was mentioned by about 15 percent adult population. Some 11 percent of the adult population had never heard about any formal insurance products (which suggests signs of a low publicity that insurance companies need to address) while 18 percent simply preferred informal groups.

48
UGANDA FiNScope iii RepoRT
Unlocking Barriers to Financial inclusion in Uganda
November 2013
Table19:Overallusageofformalandinformalinsurance,%
2013 2009
Characteristic Any form
Formal insurance
Informal insurance
Any form
Formal insurance
Informal insurance
Uganda 44.6 2.1 43.3 22.6 2.9 21.2Gender:
Female 44.5 0.7 44.2 22.7 3.3 21.3Male 44.6 3.7 42.4 22.6 2.5 21.1
Age group:Below 18 13.3 0.2 13.1 9.4 0.3 9.418-24 30.8 1.6 29.6 17.3 0.9 16.925-39 47.9 2.5 46.2 25.2 4.5 22.840-59 57.3 2.6 56.2 28.7 3.4 27.260+ 38.7 0.8 38.4 26.6 3.3 25.3
Educational attainment:No Formal Education 43.3 0.0 43.3Some Primary 45.5 1.1 44.8Completed Primary 48.6 0.5 48.4Some Secondary 39.6 2.5 38.5O-Level + 43.4 8.5 38.1
Employment status:Self Employed 47.5 2.0 46.5 26.5 2.4 25.1Paid Employees 50.4 4.1 47.1 21.1 6.8 18.0Contr. Family Worker 37.5 0.0 37.5 25.3 1.6 25.3Not Working 27.7 1.1 27.2 11.6 1.8 10.7
Wealth quintile:Lowest 39.5 0.6 39.5 18.3 0.2 18.3Second 48.8 0.0 48.8 34.9 2.8 34.0Middle 52.3 1.1 51.9 28.9 0.5 28.9Fourth 45.5 1.7 44.7 15.1 2.2 14.8Highest 35.5 7.2 30.4 16.4 8.2 10.8
Place of residence:Rural 46.2 1.3 45.4 25.8 2.1 25.0Urban 37.9 5.3 34.5 13.2 5.6 9.7
Region:Kampala 26.5 6.7 20.1Central 28.9 1.7 27.3 8.2 2.9 6.6Eastern 55.1 1.5 54.5 38.1 3.7 36.7Northern 28.1 1.6 26.9 5.8 1.3 5.1Western 67.2 2.5 66.7 36.0 3.1 34.3
Note: Estimates under informal insurance by adult characteristics have to be interpreted with caution due to the small observations and
hence very high CV (coefficient of variation).

49
UGANDA FiNScope iii RepoRT
Unlocking Barriers to Financial inclusion in Uganda
November 2013
Table20:Reasonswhyadultspreferredinformalinsurancein2013,%
Prefer informal
group
Easier to join informal group
Can’t afford formal
insurance
Have never heard about such
companies
Other (specify)
Uganda 17.7 44.4 14.9 11.1 11.9Gender:
Female 17.5 43.3 16.8 11.5 10.9Male 18.0 45.7 12.6 10.7 13.0
Age group:Below 18 8.0 45.4 3.6 21.0 22.118-24 17.8 45.0 11.5 12.5 13.225-39 17.3 43.3 17.1 9.8 12.640-59 18.3 47.0 12.7 10.9 11.160+ 19.1 40.3 17.5 14.7 8.4
Educational attainment:No Formal Education 19.2 42.7 15.5 15.3 7.3Some Primary 18.8 40.3 16.1 13.3 11.5Completed Primary 16.9 46.1 13.5 8.5 14.9Some Secondary 13.6 52.3 15.1 4.3 14.7O-Level + 16.6 51.4 11.4 6.7 13.9
Employment status:Self Employed 15.8 45.2 15.3 12.3 11.5Paid Employees 20.7 44.9 16.4 4.9 13.1Contr. Family Worker 26.9 42.4 16.5 7.5 6.7Not Working 20.7 39.3 8.9 16.0 15.1
Wealth quintile:Lowest 13.0 44.7 14.8 21.4 6.1Second 16.6 42.5 14.2 16.4 10.3 Middle 18.6 44.3 14.1 8.1 14.9 Fourth 22.3 45.5 16.4 5.1 10.7 Highest 16.6 45.4 15.0 4.0 19.0
Place of residence:Rural 17.8 45.3 14.4 11.4 11.2Urban 17.7 39.0 17.8 9.4 16.1
Region:Kampala 20.4 55.0 8.6 3.1 12.9Central 17.9 48.4 16.2 3.4 14.1Eastern 14.3 39.6 13.3 22.0 10.7Northern 11.1 39.9 26.1 13.2 9.7Western 23.1 47.8 11.8 4.5 12.7
7.3 Riskmanagementprofile
The adults who had experienced a risk as highlighted in section 7.1 stated how they dealt with the specific risk financially. The results are presented in Table 21. The three most common strategies included: borrow-ing from friends and family (18 percent), ask-ing for donations from neighbours, relatives
and friends (18 percent) and sale of assets such as land (15 percent).
There were no discernable gender differenc-es across the cited strategies. However, there were rural/urban gaps with rural population more likely to respond by sale of assets, bor-rowing from friends/family and seeking do-

50
UGANDA FiNScope iii RepoRT
Unlocking Barriers to Financial inclusion in Uganda
November 2013
nations compared to their urban counter-parts. Coping mechanisms reduced by wealth status, with key options being: borrowing from friends/family, seeking donations and
Table21:Riskmanagementmechanismsbyadultcharacteristicsin2013,%
Characteristic Sale of assets
Borrow from a formal
institution
Borrow from an informal
institution
Borrow from friends/
family
Salary advance
Borrow from
money lenders
Seek donations
Insurance claims
Reduce consumption
Others
Uganda 15.0 1.4 8.1 18.1 0.7 0.5 17.5 0.1 13.3 7.3Gender:
Female 14.0 0.9 7.8 17.4 0.6 0.1 17.7 0.1 13.6 8.8Male 16.1 1.9 8.4 18.8 0.8 0.8 17.4 0.1 12.9 5.6
Age group:
Below 18 14.1 0.0 6.0 14.3 0.0 2.2 22.5 0.0 19.1 7.118-24 12.9 0.8 5.8 15.6 0.9 0.1 15.1 0.0 10.6 8.525-39 15.8 1.6 8.2 19.1 0.9 0.5 15.9 0.1 13.4 7.340-59 16.0 1.5 10.6 19.9 0.3 0.6 19.2 0.2 15.4 7.060+ 13.5 1.4 6.8 15.8 0.6 0.2 22.6 0.2 11.2 5.8
Educational attainment:
No Formal Education 13.1 0.4 6.8 18.8 0.3 0.0 20.6 0.3 12.5 7.0
Some Primary 16.5 1.1 10.2 19.9 0.3 0.3 17.9 0.1 15.0 6.2
Completed Primary 17.4 1.4 7.6 15.9 0.5 1.1 15.9 0.0 13.4 8.1
Some Secondary 13.6 1.5 6.1 16.5 0.3 0.5 18.6 0.2 12.6 7.6O-Level + 12.0 3.2 6.1 15.3 2.5 0.8 13.4 0.0 10.0 9.3
Employment status:
Self Employed 16.4 1.7 9.2 19.0 0.2 0.5 17.4 0.2 14.6 6.7Paid Employees 11.7 1.1 7.8 15.8 2.9 1.0 16.1 0.0 10.7 7.8
Contr. Family Worker 16.5 0.0 8.8 21.0 0.0 0.0 19.7 0.0 12.4 9.9
Not Working 12.1 0.7 3.6 14.9 0.4 0.0 18.7 0.0 10.6 8.4Wealth quintile:
Lowest 17.9 0.6 7.6 22.3 0.1 0.5 24.8 0.1 16.2 7.3Second 18.6 0.6 10.9 20.6 0.5 0.4 18.6 0.2 15.2 7.0 Middle 17.0 1.9 9.0 17.6 0.6 0.3 17.4 0.1 14.2 5.9 Fourth 13.7 1.6 8.3 17.3 0.4 0.6 14.1 0.1 11.3 8.1 Highest 7.5 2.2 4.4 12.4 1.6 0.5 13.4 0.0 9.4 8.0
Place of residence:
Rural 16.6 1.3 8.8 18.9 0.5 0.5 18.3 0.1 13.6 6.7Urban 8.1 1.8 4.9 14.5 1.5 0.2 14.2 0.0 12.0 9.6
Region:
Kampala 1.3 0.0 1.7 5.1 1.5 0.0 10.5 0.0 10.7 5.7Central 7.3 0.7 3.1 12.4 0.3 0.5 14.1 0.0 10.2 6.0Eastern 16.6 1.1 5.1 16.2 0.8 0.4 24.8 0.3 21.6 8.1Northern 25.3 1.0 11.2 28.9 0.9 0.6 26.2 0.2 16.8 5.3Western 14.8 2.9 14.8 18.9 0.5 0.4 7.2 0.0 5.0 9.7
Est. pop (‘000) 2,456.8 224.9 1,326.8 2,960.7 109.6 75.8 2,874.5 19.9 2,173.8 1,190.3
reducing consumption. The self-employed were more likely to reduce consumption (15 percent) compared to those in paid employ-ment (11 percent).
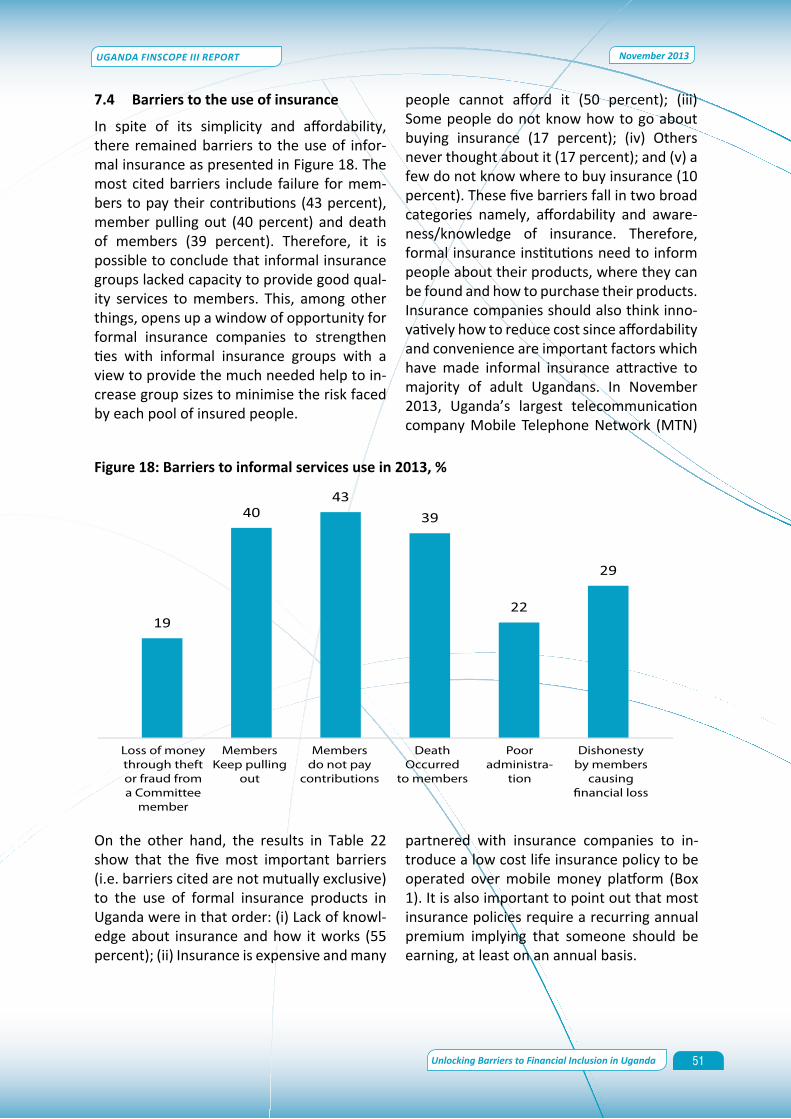
51
UGANDA FiNScope iii RepoRT
Unlocking Barriers to Financial inclusion in Uganda
November 2013
7.4 Barriers to the use of insurance
In spite of its simplicity and affordability, there remained barriers to the use of infor-mal insurance as presented in Figure 18. The most cited barriers include failure for mem-bers to pay their contributions (43 percent), member pulling out (40 percent) and death of members (39 percent). Therefore, it is possible to conclude that informal insurance groups lacked capacity to provide good qual-ity services to members. This, among other things, opens up a window of opportunity for formal insurance companies to strengthen ties with informal insurance groups with a view to provide the much needed help to in-crease group sizes to minimise the risk faced by each pool of insured people.
On the other hand, the results in Table 22 show that the five most important barriers (i.e. barriers cited are not mutually exclusive) to the use of formal insurance products in Uganda were in that order: (i) Lack of knowl-edge about insurance and how it works (55 percent); (ii) Insurance is expensive and many
Figure18:Barrierstoinformalservicesusein2013,%
people cannot afford it (50 percent); (iii) Some people do not know how to go about buying insurance (17 percent); (iv) Others never thought about it (17 percent); and (v) a few do not know where to buy insurance (10 percent). These five barriers fall in two broad categories namely, affordability and aware-ness/knowledge of insurance. Therefore, formal insurance institutions need to inform people about their products, where they can be found and how to purchase their products. Insurance companies should also think inno-vatively how to reduce cost since affordability and convenience are important factors which have made informal insurance attractive to majority of adult Ugandans. In November 2013, Uganda’s largest telecommunication company Mobile Telephone Network (MTN)
partnered with insurance companies to in-troduce a low cost life insurance policy to be operated over mobile money platform (Box 1). It is also important to point out that most insurance policies require a recurring annual premium implying that someone should be earning, at least on an annual basis.

52
UGANDA FiNScope iii RepoRT
Unlocking Barriers to Financial inclusion in Uganda
November 2013
Table22:Barrierstoformalinsuranceproductsandservicesin2013,%
Do not want it
Cannot afford
Does not know
how it works
Lacks knowledge
on how
Does not know
where to buy it
Never thought about it
Insurance do not pay
enough compensation
Claim process
too long
Others
Uganda 5.7 49.7 55.4 17.3 9.8 17.2 0.5 1.3 3.2Gender:
Female 4.8 50.1 57.2 16.8 7.8 16.3 0.5 1.1 2.8Male 6.6 49.3 53.3 17.9 12.1 18.2 0.5 1.4 3.5
Age group:
Below 18 10.6 46.1 62.8 16.6 7.7 12.0 0.0 0.0 2.718-24 6.3 47.5 54.7 16.3 8.6 19.9 0.3 0.8 3.425-39 5.3 50.6 53.1 18.3 10.6 16.1 0.4 1.5 2.740-59 5.0 48.8 56.6 19.6 11.6 18.3 0.4 1.3 3.360+ 5.7 53.4 60.2 11.4 5.8 15.7 1.4 1.5 3.9
Educational attainment:
No Formal Education 6.1 48.5 64.4 15.3 6.7 17.0 0.2 0.7 3.4Some Primary 4.7 49.9 60.1 18.6 10.2 16.2 0.5 0.9 1.7Completed Primary 7.2 49.1 54.4 16.4 12.3 18.8 0.1 0.7 2.6Some Secondary 3.7 50.0 53.5 17.5 10.0 18.9 0.9 2.0 4.9O-Level + 8.3 51.5 30.7 16.9 9.6 17.4 1.0 3.3 6.0
Employment status:
Self Employed 4.7 49.4 56.0 17.5 10.7 17.4 0.6 1.1 3.0Paid Employees 8.4 55.3 43.7 16.4 11.2 16.7 0.5 2.7 3.3Contr. Family Worker 7.3 43.1 73.2 23.5 10.5 17.3 0.0 0.0 4.0Not Working 5.6 47.2 59.7 15.0 3.7 17.2 0.2 1.0 3.4
Wealth quintile:
Lowest 4.5 45.5 61.2 18.3 10.8 16.8 0.1 0.4 2.9Second 4.5 50.3 59.6 21.9 11.2 17.5 0.1 0.6 1.8 Middle 6.1 52.5 56.9 15.4 10.4 15.0 0.5 0.8 1.9 Fourth 3.9 55.1 54.7 16.9 9.5 15.5 0.7 2.8 4.6 Highest 10.0 43.8 43.2 13.5 6.4 22.1 1.0 1.8 4.5
Place of residence:
Rural 5.1 50.7 57.4 17.8 11.0 16.5 0.4 1.3 2.7Urban 8.3 45.4 46.6 15.1 4.1 20.4 0.8 1.4 5.1
Region:
Kampala 12.8 45.9 39.8 11.6 2.7 22.2 1.8 1.0 6.5Central 5.1 53.2 46.8 15.9 12.5 20.0 0.8 1.7 3.9Eastern 3.3 46.3 65.4 16.8 9.9 15.4 0.2 0.8 2.1Northern 5.6 44.8 61.1 19.5 9.4 21.3 0.3 1.8 4.0Western 7.3 55.4 51.0 18.4 8.6 11.8 0.4 1.0 2.1

53
UGANDA FiNScope iii RepoRT
Unlocking Barriers to Financial inclusion in Uganda
November 2013
Box 1: MTN Introduces low cost life insurance policy
By Zurah Nakabugo
In what could turn out to be a great innovation, MTN Uganda has partnered with insur-ance firms AON and Jubilee to launch MTN LifeCare, a low-cost life insurance policy. It is probably the lowest- priced life insurance policy on the market and for as low as Shs 7,500 per year, MTN customers and non-customers shall get at least Shs 1 million as pay-out in the event of death. Subscription to the policy shall be through the MTN mobile money service.
“MTN Uganda continues to lead in innovation by becoming the first company to offer affordable life insurance services paid through mobile money in partnership with AON Uganda and Jubilee Insurance,” Ernst Fonternel, MTN’s chief marketing officer, said. To register for the policy, Fonternel said, a customer can simply dial *221# to get insured and then follow the prompts as directed on the phone. Under the policy, there will be three insurance cover options, each with a different pay-out upon death of the insured cus-tomer—Silver (1,000,000), Gold (3,000,000) and Platinum (5,000,000). Fonternel said a customer can only subscribe to one insurance cover per year. For one to qualify to benefit from this policy, he/she must be a registered MTN customer. However, there will also be arrangements for non-MTN customers to register for the policy. “Life is unpredictable but with MTN LifeCare, MTN customers can count on their mobile money accounts to secure the future of their families in a simple, yet cost effective and reliable way. It’s a great ad-dition to the innovative mobile money services already offered by MTN,” Fonternel said.
Jeremy Kirkland, the AON director in charge of large clients, welcomed the partnership with MTN. He said the premium would be paid as a one-off lump sum and the cover ex-pires after 12 months upon which the customer can choose to renew it.
Kaddunabbi Lubega, the Chief Executive Officer of the Insurance Regulatory Authority (IRA), the body that regulates the sector, encouraged people to take out this policy. “I request Ugandans to take on this insurance coverage since ... death doesn’t discriminate between the poor and the rich,” he said Patrick Kimathi, the manager, Life Assurance, at Jubilee, said: “The claims process is very simple. Pay-out cash upon the death of the in-sured is processed via mobile money within 48 hours upon receipt of the complete claim documents by Jubilee Insurance.” Claim forms shall be got from any MTN service centre or dealer outlet or they can be downloaded from the Jubilee website www.jubileeinsur-ance.com. Uganda has one of the lowest insurance penetration rates in the region stand-ing at 0.7 per cent of GDP compared with Tanzania at 0.9 per cent and Kenya at three per cent.
Source: The Observer 17th November 2013
54
UGANDA FiNScope iii RepoRT
Unlocking Barriers to Financial inclusion in Uganda
November 2013
7.5 Concluding remarks
Taking all the different financial access strands, insurance products and services were the least used. Nearly 6 in every 10 adults were excluded from the insurance products and services despite the many risks that affect them financially. There are no sig-nificant changes in the access to formal in-surance since 2009 even after the reforms in the insurance sector. Affordability and lack of knowledge of how formal insurance works remained major impediments. The insurance industry needs to provide more information and educate the public about the products on
offer, where they can be bought and how to go about buying them.
On the other hand, use of informal insurance more than doubled since 2009. There were several reasons for this preference, which the formal insurance institutions could study in order to provide products and services that the majority of the adult population can af-ford. Notwithstanding its popularity among the adult population, informal insurance groups seem to suffer from governance is-sues including weak institutional develop-ment and accountability.

55
UGANDA FiNScope iii RepoRT
Unlocking Barriers to Financial inclusion in Uganda
November 2013
Contextually, money transfers involve the sending or receiving of money from one per-son/entity to another. The transfers can be from within the country; or extend beyond the national borders (remittances). The sur-vey collected information on whether people sent or received money; the institutions, if any, used for money transfer services; the regularity of sending or receiving transfers; the usage of funds received; and whether transfers were received for own use or on behalf of someone else. The objectives of this Section is to establish: access and use of mon-ey transfer services; the channels through which money transfer transactions are made; and whether funds received originated from within or outside Uganda. Such information is useful in enhancing the understanding of the factors that constrain access to; and use of transfer services in Uganda.
8.1 RemittancesStrand
Table 22 shows the landscape for receiving remittances and transfers during FinScope II and FinScope III. It is indicated that the pro-portion of the adult population receiving re-mittances nearly doubled from 30 percent in 2009 to 55 percent in 2013. The above changes were driven by increase in receiv-ing formal (non-bank) remittances and trans-fers—whose rate increased from 11 percent to 41 percent during this period. The table shows some widening gender gaps with 52 percent of females receiving remittances and transfers compared to 59 percent of their male counterparts in 2013. Furthermore, the youth (18-24 years age category) also report-ed relatively higher rates of receiving formal transfers in 2013 (42 percent) compared to 12 percent in 2009. This may be partly attrib-uted to the fact that younger persons adapt more easily to technological changes than their older counterparts.
When one classifies banks and mobile money as formal institutions, the table further shows
that 36 percent of females and 46 percent of males received remittances using formal in-stitutions (the categories are not mutually ex-clusive). At least 16 percent of both females and males received remittances through in-formal sources. Use of formal institution to receive remittances was highest among in-dividuals in the middle age category as well as those with relatively higher educational attainment—62 percent for some secondary education and 76 percent for persons with O-level or higher education. On a regional basis, Kampala and Central region had the highest rates of use of formal financial institutions to receive remittances—81 percent and 56 per-cent respectively. On the other hand, West-ern region had the highest use of informal sources—22 percent compared to 16 percent for across Uganda.
8. REMITTANCES AND MONEY TRANSFERS
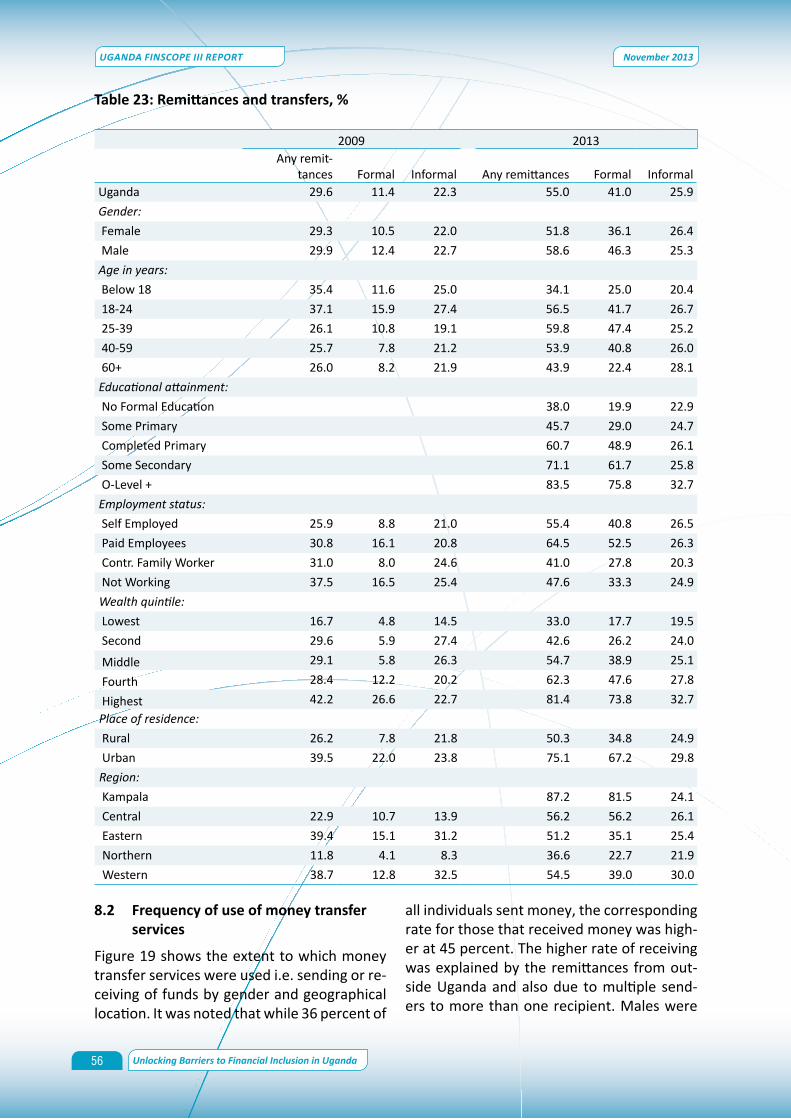
56
UGANDA FiNScope iii RepoRT
Unlocking Barriers to Financial inclusion in Uganda
November 2013
Table23:Remittancesandtransfers,%
2009 2013Any remit-
tances Formal Informal Any remittances Formal InformalUganda 29.6 11.4 22.3 55.0 41.0 25.9Gender:
Female 29.3 10.5 22.0 51.8 36.1 26.4 Male 29.9 12.4 22.7 58.6 46.3 25.3Age in years:
Below 18 35.4 11.6 25.0 34.1 25.0 20.4 18-24 37.1 15.9 27.4 56.5 41.7 26.7 25-39 26.1 10.8 19.1 59.8 47.4 25.2 40-59 25.7 7.8 21.2 53.9 40.8 26.0 60+ 26.0 8.2 21.9 43.9 22.4 28.1Educational attainment:
No Formal Education 38.0 19.9 22.9 Some Primary 45.7 29.0 24.7 Completed Primary 60.7 48.9 26.1 Some Secondary 71.1 61.7 25.8 O-Level + 83.5 75.8 32.7Employment status:
Self Employed 25.9 8.8 21.0 55.4 40.8 26.5 Paid Employees 30.8 16.1 20.8 64.5 52.5 26.3 Contr. Family Worker 31.0 8.0 24.6 41.0 27.8 20.3 Not Working 37.5 16.5 25.4 47.6 33.3 24.9Wealth quintile:
Lowest 16.7 4.8 14.5 33.0 17.7 19.5 Second 29.6 5.9 27.4 42.6 26.2 24.0
Middle 29.1 5.8 26.3 54.7 38.9 25.1
Fourth 28.4 12.2 20.2 62.3 47.6 27.8
Highest 42.2 26.6 22.7 81.4 73.8 32.7Place of residence:
Rural 26.2 7.8 21.8 50.3 34.8 24.9 Urban 39.5 22.0 23.8 75.1 67.2 29.8Region:
Kampala 87.2 81.5 24.1 Central 22.9 10.7 13.9 56.2 56.2 26.1 Eastern 39.4 15.1 31.2 51.2 35.1 25.4 Northern 11.8 4.1 8.3 36.6 22.7 21.9 Western 38.7 12.8 32.5 54.5 39.0 30.0
8.2 Frequencyofuseofmoneytransferservices
Figure 19 shows the extent to which money transfer services were used i.e. sending or re-ceiving of funds by gender and geographical location. It was noted that while 36 percent of
all individuals sent money, the corresponding rate for those that received money was high-er at 45 percent. The higher rate of receiving was explained by the remittances from out-side Uganda and also due to multiple send-ers to more than one recipient. Males were

57
UGANDA FiNScope iii RepoRT
Unlocking Barriers to Financial inclusion in Uganda
November 2013
more likely than female to send money (41 percent against 31 percent). However, when one considers receiving of funds, the gender gaps were relatively small—43 percent for females against 48 percent for males receive money.
Overall, males were more likely than females to engage in money transfer services. This particular finding is in line with results of Fin-Scope II, which established similar patterns i.e. a higher proportion of male adults than females reported being engaged in money transfer services of any form (Synovate Ugan-da 2009). The plausible explanation for this pattern is the set-up of the traditional African family where males shoulder family respon-sibilities and therefore those (males) who stayed away from home regularly remit mon-ey for family upkeep and other necessities.
In terms of location, it was only for the adults residing in Kampala where the rates of send-
ing and receiving funds were relatively simi-lar—73 percent compared to 76 percent. For the rest of the other regions, there were more likely to receive than send. This suggests that Kampala was a major source of funds trans-ferred to the other regions. Unfortunately, the survey did not gather information on the volume of transactions.
Demographically, as indicated in Table A 2 in the appendix, middle aged adults (25-39 years) were more likely to send money (42 percent) than any other age group. Further-more, increased educational attainment was associated with an increased likelihood of sending funds—51.4 percent for persons with some secondary education and 67 percent for persons with O-level or higher education. A similar demographic pattern was observed for receiving money—72 percent of persons with O-level or higher education (Table A 3 in the appendix).
Figure19:Useofmoneytransferservicesin2013,%
8.3 Channels used to send and receive Money transfers
The survey inquired about the channels used to send and receive funds. In Figure 20, the channels were aggregated into four broad categories: cash with relative or friend; by
bank; by mobile money; and other channel including electronic transfers, money gram and Western Union—by gender of the re-spondent. Given that multiple responses were possible for these specific questions, the rates reported in Figure 20 are not mutu-
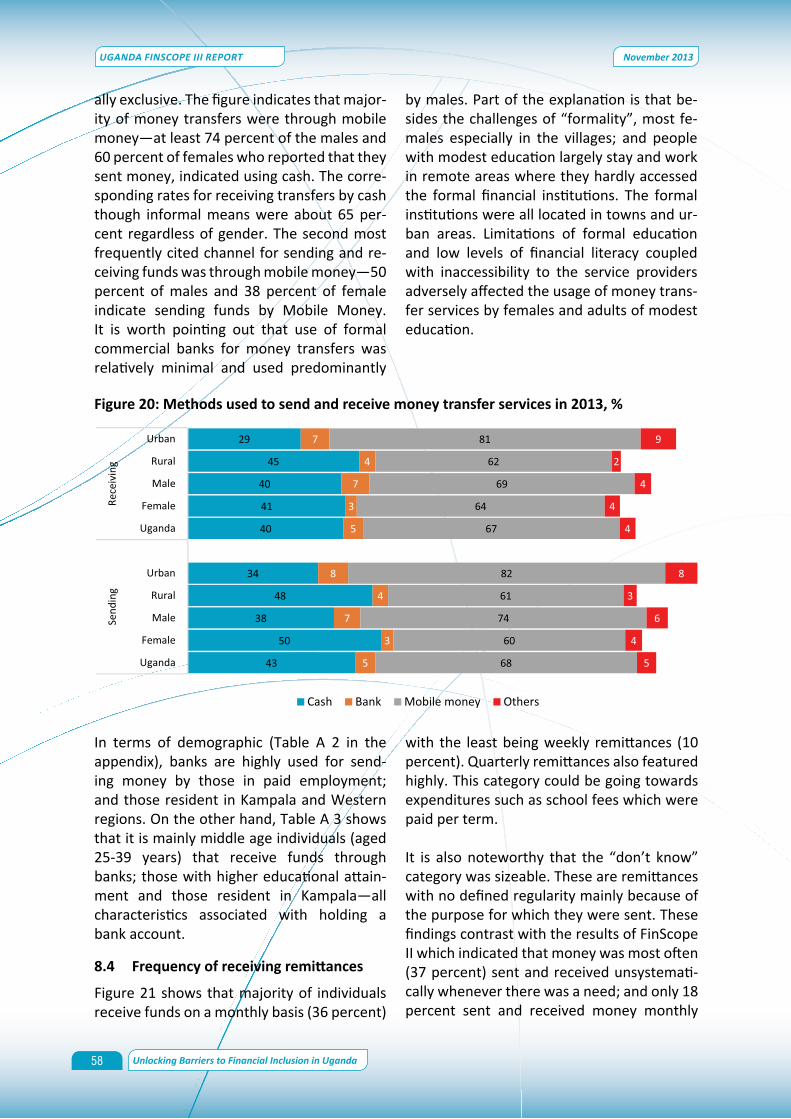
58
UGANDA FiNScope iii RepoRT
Unlocking Barriers to Financial inclusion in Uganda
November 2013
ally exclusive. The figure indicates that major-ity of money transfers were through mobile money—at least 74 percent of the males and 60 percent of females who reported that they sent money, indicated using cash. The corre-sponding rates for receiving transfers by cash though informal means were about 65 per-cent regardless of gender. The second most frequently cited channel for sending and re-ceiving funds was through mobile money—50 percent of males and 38 percent of female indicate sending funds by Mobile Money. It is worth pointing out that use of formal commercial banks for money transfers was relatively minimal and used predominantly
by males. Part of the explanation is that be-sides the challenges of “formality”, most fe-males especially in the villages; and people with modest education largely stay and work in remote areas where they hardly accessed the formal financial institutions. The formal institutions were all located in towns and ur-ban areas. Limitations of formal education and low levels of financial literacy coupled with inaccessibility to the service providers adversely affected the usage of money trans-fer services by females and adults of modest education.
Figure20:Methodsusedtosendandreceivemoneytransferservicesin2013,%
In terms of demographic (Table A 2 in the appendix), banks are highly used for send-ing money by those in paid employment; and those resident in Kampala and Western regions. On the other hand, Table A 3 shows that it is mainly middle age individuals (aged 25-39 years) that receive funds through banks; those with higher educational attain-ment and those resident in Kampala—all characteristics associated with holding a bank account.
8.4 Frequencyofreceivingremittances
Figure 21 shows that majority of individuals receive funds on a monthly basis (36 percent)
with the least being weekly remittances (10 percent). Quarterly remittances also featured highly. This category could be going towards expenditures such as school fees which were paid per term.
It is also noteworthy that the “don’t know” category was sizeable. These are remittances with no defined regularity mainly because of the purpose for which they were sent. These findings contrast with the results of FinScope II which indicated that money was most often (37 percent) sent and received unsystemati-cally whenever there was a need; and only 18 percent sent and received money monthly

59
UGANDA FiNScope iii RepoRT
Unlocking Barriers to Financial inclusion in Uganda
November 2013
(Synovate Uganda 2009). This shows chang-ing trends from sending when needs arise to sending regularly per month. In contrast, Fin-Scope South Africa showed that 87 percent of transfers in South Africa were on a weekly basis. The plausible explanation for the re-sults of this survey (FinScope III) lies with the system of payment for labour in Uganda where most workers are paid monthly. This has set the month as the standard for settle-ment of payments and therefore, the right time for those with distant dependents to re-mit funds.
8.5 Origin of Money transfers
It was indicated that the majority of adult pop-ulation received funds/transfers from within the country (41 percent) while only about 16 percent of the adults received remittances from abroad. This represents an increase in utilization of the money transfer services of 29 percent (within Uganda) and reduction to 5 percent (external) reported by FinScope II (2009). Compared to other countries, this re-sult shows Uganda ahead of many peer coun-tries in usage of money transfer services. For example, FinScope South Africa (2012) shows that only 18 percent of adults in South Afri-ca either sent or received money to or from
Figure21:Regularityofreceivingremittancesin2013,%
family members, parents, and children within South Africa; while Rwanda (FinScope 2013) reported 14 percent as the proportion of people involved in money transfers. Focusing on only those that received money transfers, in absolute numbers, about 4.1 million adults received money transfers in 2009 compared to 7.5 million adults in 2013. The number receiving transfers from outside Uganda re-mained at 0.6 million adults. Figure 22 shows the proportion of adults that received money from sources within Uganda and from outside
Uganda during the 12 months preceding this FinScope survey. It is evident that nearly 9 in every 10 Ugandan adults received transfers coming from within the country whereas, the shares of those that received transfers from abroad declined.
Figure 22 also shows regional distribution of the adult population that received or sent money. The providers of money transfer ser-vices were based in urban areas with very limited, if any presence, in the rural areas. The infrastructure, most importantly electric-ity that is critical for money transfer services is more inadequate in the rural areas than in
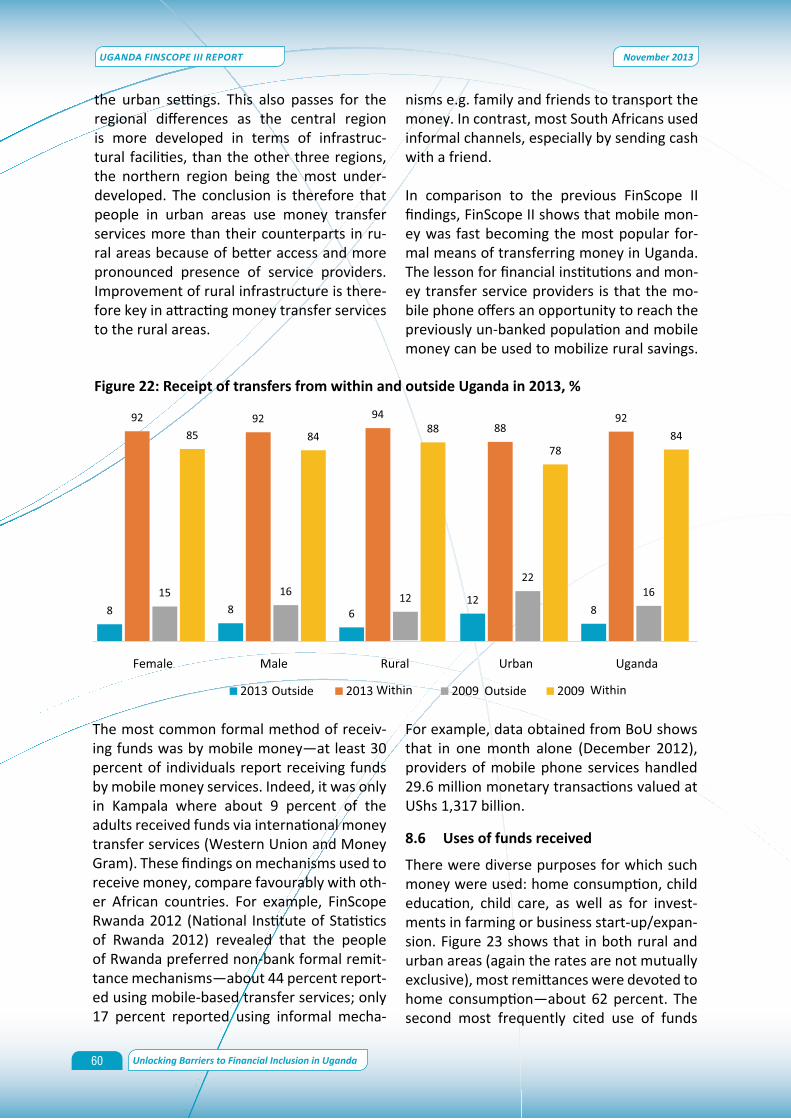
60
UGANDA FiNScope iii RepoRT
Unlocking Barriers to Financial inclusion in Uganda
November 2013
the urban settings. This also passes for the regional differences as the central region is more developed in terms of infrastruc-tural facilities, than the other three regions, the northern region being the most under-developed. The conclusion is therefore that people in urban areas use money transfer services more than their counterparts in ru-ral areas because of better access and more pronounced presence of service providers. Improvement of rural infrastructure is there-fore key in attracting money transfer services to the rural areas.
For example, data obtained from BoU shows that in one month alone (December 2012), providers of mobile phone services handled 29.6 million monetary transactions valued at UShs 1,317 billion.
8.6 Uses of funds received
There were diverse purposes for which such money were used: home consumption, child education, child care, as well as for invest-ments in farming or business start-up/expan-sion. Figure 23 shows that in both rural and urban areas (again the rates are not mutually exclusive), most remittances were devoted to home consumption—about 62 percent. The second most frequently cited use of funds
Figure22:ReceiptoftransfersfromwithinandoutsideUgandain2013,%
The most common formal method of receiv-ing funds was by mobile money—at least 30 percent of individuals report receiving funds by mobile money services. Indeed, it was only in Kampala where about 9 percent of the adults received funds via international money transfer services (Western Union and Money Gram). These findings on mechanisms used to receive money, compare favourably with oth-er African countries. For example, FinScope Rwanda 2012 (National Institute of Statistics of Rwanda 2012) revealed that the people of Rwanda preferred non-bank formal remit-tance mechanisms—about 44 percent report-ed using mobile-based transfer services; only 17 percent reported using informal mecha-
nisms e.g. family and friends to transport the money. In contrast, most South Africans used informal channels, especially by sending cash with a friend.
In comparison to the previous FinScope II findings, FinScope II shows that mobile mon-ey was fast becoming the most popular for-mal means of transferring money in Uganda. The lesson for financial institutions and mon-ey transfer service providers is that the mo-bile phone offers an opportunity to reach the previously un-banked population and mobile money can be used to mobilize rural savings.

61
UGANDA FiNScope iii RepoRT
Unlocking Barriers to Financial inclusion in Uganda
November 2013
received was child education and this was followed by child care. Only a small propor-tion of respondents indicated investing the received transfers in farming—18 percent in rural areas and 9 percent in urban areas. These findings are consistent with findings of FinScope II which reported that the majority (63 percent) used money received for home consumption (food, clothing, rent). The de-tails show that the money received was used to cater for basic household necessities like health (34 percent), educating others (14 percent) and other household members (24 percent) or taking care of children (19 per-cent). Relatively fewer people used the mon-ey received for investing in income generat-ing activities like farming (16 percent) or in businesses (13 percent).
males were more likely to invest in business start-up/expansion than females—16 per-cent compared to 11 percent. Geographical-ly, the northern and Eastern regions reported the highest levels of utilization of remittances on home consumption (about 70 percent). At the same time, persons in Northern region were more likely to use the received funds for farming (31 percent) compared to the whole of Uganda (16 percent). The North-ern region also allocates a disproportionately higher share of the remittances to child care, emergencies and home improvement. The most plausible explanation is the long period of insurgency which has deprived the region of productive investments, rendering most
Figure23:Usesofremittancesandtransfersbylocationin2013,%
With regard to demographics, Table A9.2 in the appendix shows that females were more likely than males to use the received funds for home consumption—68 percent females compared to 56 percent for males. On the other hand, males were more likely to invest in farming (18 percent) compared to their female counterparts (13 percent). Similarly,
households to depend on remittances. The uses put to remittances were not different from those reported under Sections 5 and 6—the uses are largely for consumption.
8.7 Receiving funds on behalf of others
For adults who reported receiving transfers, the survey inquired whether the funds re-

62
UGANDA FiNScope iii RepoRT
Unlocking Barriers to Financial inclusion in Uganda
November 2013
ceived were: for own use; on behalf of some-one else; or both.6 The reported rates are presented in the last three columns of Table A.4 and indicate that over 80 percent of the respondents received the funds for own use. The national rates for receiving funds on behalf of someone else or both were 8 per-cent and 9 percent respectively. Individuals aged less than 18 years were far more likely to receive funds for own use than any other age category (92 percent). Persons resident in Kampala and Eastern Uganda were more likely to receive remittances on behalf of someone else (16 percent and 11 percent re-spectively).
8.8 Concluding remarks
The survey results revealed that the frequen-cy of Ugandans sending and receiving mon-ey increased from 30 percent in 2009 to 55 percent by 2013. These changes were mainly driven by transfers through mobile mon-ey that grew from less than 1 million users in 2009 to about 5.1 million in 2013. Those who received money were more than those who sent, with most of them transacting on a monthly basis. There was also a larger varia-tion by gender, education and the wealth status in remitting funds within the country. Majority of money transfers were through mobile money services. In terms of origin of funds, the main transactions were within the country, with a slight decline in remittances from outside from 16 percent in 2009 to 8 percent by 2013. The interesting finding from this survey is that the majority of the adults that received money transfers used it large-ly for consumption purposes- which is not a good indicator for household savings and fu-ture investment for the future.
6 The actual question asked as “Thinking about the last time you received money, did you receive it for yourself or on behalf of another person?”

63
UGANDA FiNScope iii RepoRT
Unlocking Barriers to Financial inclusion in Uganda
November 2013
This Section looks at the demand for, access to and use of mobile money services in Ugan-da. Mobile money can be defined as an elec-tronic wallet service that enables one to send and receive money anywhere using a mobile/cellular phone. In Uganda, the services start-ed in 2009 and have since changed Uganda’s financial landscape to include a large section of the population that was formerly financial-ly excluded as noted in Section 3. Since intro-duction, mobile money services have evolved beyond money transfer services (sending and receiving), to include other services like pay-ment of utility bills, air time purchase and savings and the recent development by MTN on low cost life insurance policy as discussed in Section 7. This Section, therefore, analyses how the different segments of the adult pop-ulation use mobile money services. The Sec-tion also looks at barriers to access and use of the various mobile money products and services.
9.1 Comparison of use of mobile money relativetootherfinancialservices
Since introduction in 2009, the use of mobile money services has grown and surpassed other forms of non-bank formal financial ser-vices. Results from the survey show that the share of registered mobile money users was higher than bank account holders as well as other users of non-bank financial institutions. This relatively high growth in use of mobile money services largely contributed to the declining share of the population excluded from the use of financial services—from 30 percent in 2009 to about 15 percent in 2013 (see Figure 4). This growth has been aided by the increased use of mobile communication services in Uganda. Regardless of age, mobile phone subscription increased from 2 million in 2006 to over 16 million in 2012, largely due to the increase in number of mobile tele-communication companies that lowered the cost of mobile communication services and the availability of relatively cheaper mobile
phone sets on the market. In addition, the growth in use of mobile money services can be attributed to the ease, convenience and relatively lower transaction costs of using the services compared to other formal services.
9.2 Knowledge and use of mobile money services
The survey set out to analyse the level of us-age, awareness and knowledge of the various mobile money services in Uganda. Nearly 77 percent of the adult population had knowl-edge of mobile money. However, there were notable variations across the different popu-lation segments. In terms of gender, males had more knowledge of the services than fe-males while the educated had more knowl-edge about the services than the less educat-ed. Results further showed that knowledge about the services was higher amongst the urban population than the rural population and higher amongst the rich than the poor. Spatially, the result point to geographical bias towards the better developed regions i.e. Kampala and Central. The observed dif-ferences in knowledge point to the informa-tion gap between the different segments of the population with the vulnerable groups i.e. females, the poor and the less educated having less access to information than their less vulnerable counter parts.
Despite the relatively high level of knowl-edge about mobile money, only 34 percent of the adult population were registered users of the service. The likelihood to register in-creased with education level and wealth sta-tus. Furthermore, adults in paid employment (48 percent) were more likely to use these services compared to their counterparts in self-employment (31 percent). On the other hand, 56 percent of all adults were currently using mobile money services. A large propor-tion of the users therefore accessed the ser-vices through a third party’s account. Results also show that utilization was higher amongst
9. ACCESS TO AND UTILISATION OF MOBILE MONEY SERVICE

64
UGANDA FiNScope iii RepoRT
Unlocking Barriers to Financial inclusion in Uganda
November 2013
males than females, higher in urban than in rural areas, higher amongst the educated than the less educated and higher amongst the rich than the poor. Nearly 8 in every 10 of the adult population resident in Kampala were using mobile money services by the time of the survey compared to about 3 in every 10 in Northern region.
9.3 UtilizationofdifferentProducts
The survey results revealed that the majority of adults mainly used mobile money services for cash withdraws (56 percent), followed by receiving (54 percent) and sending money (46 percent). Usage of the other products and services like payment for utilities, school
Table24:Knowledgeanduseofmobilemoneyservicesin2013,%
Characteristic Knowledge about mobile money Registered user Currently using
Uganda 76.8 33.7 56.0Gender:
Female 73.3 27.6 52.5Male 80.7 39.9 59.7
Age group:Below 18 75.0 8.8 33.718-24 84.5 31.2 53.925-39 80.9 39.0 61.340-59 74.4 34.3 56.160+ 55.3 20.8 42.4
Educational attainment:No Formal Education 54.6 18.1 39.2Some Primary 72.8 21.9 45.2Completed Primary 86.8 35.4 58.8Some Secondary 88.7 44.3 70.7O-Level + 96.6 59.8 77.4
Employment status:Self Employed 76.6 31.3 55.1Paid Employees 80.9 48.4 68.7Contr. Family Worker 70.7 34.0 51.0Not Working 75.0 26.5 46.5
Wealth quintile:Lowest 62.0 14.7 31.6Second 68.6 19.6 41.5 Middle 76.6 27.8 54.1 Fourth 83.6 39.5 63.4 Highest 92.2 56.6 78.4
Place of residence:Rural 73.5 28.8 50.7Urban 90.7 50.7 74.5
Region:Kampala 96.8 60.6 83.0Central 88.7 36.8 66.7Eastern 70.9 28.3 51.3Northern 65.5 22.9 34.8Western 76.5 36.1 57.4

65
UGANDA FiNScope iii RepoRT
Unlocking Barriers to Financial inclusion in Uganda
November 2013
fees, and purchase of airtime was relatively low. Generally, there were gender and rural/urban dimensions by transactions. Adults in paid employment were more likely to use mobile money services for cash deposits,
cash transfer and to send money compared to their counterparts in self-employment. This could be explained by the regularity in earning for those in paid employment.
Table25:Transactionsdonewithmobilemoneyin2013,%
Cash withdrawal
Cash deposits
Cash transfer
Purchase of air time
To send money
Receive money
Currently not using Others
Uganda 56.2 32.6 6.4 6.0 46.3 54.1 4.3 5.0Gender:
Female 51.8 26.8 4.2 3.0 38.9 55.1 4.9 3.7Male 60.1 37.9 8.4 8.7 52.9 53.1 3.8 6.3
Age group:Below 18 56.6 16.1 3.1 2.2 14.7 34.3 0.0 2.918-24 60.0 34.9 6.7 5.0 49.1 48.7 3.2 3.425-39 59.1 35.9 8.0 7.3 46.9 55.5 5.8 5.140-59 50.3 31.6 4.2 5.6 48.0 58.1 2.8 6.860+ 42.8 10.4 2.4 2.5 35.3 52.6 3.3 4.2
Educational attainment:No Formal Education 46.5 18.2 2.4 0.7 31.7 58.6 0.6 2.8Some Primary 44.6 21.2 2.5 3.2 34.2 48.6 8.3 2.9Completed Primary 51.6 30.2 5.9 2.7 41.8 54.1 3.4 4.5Some Secondary 60.1 35.8 7.5 10.4 58.9 53.7 3.6 7.6O-Level + 73.9 51.0 12.1 10.6 60.7 59.0 2.0 7.1
Employment status:Self Employed 50.6 28.4 5.2 4.9 44.8 52.6 4.9 4.9Paid Employees 69.0 48.1 11.1 9.4 57.8 53.5 1.5 7.0Contr. Family Worker 64.9 30.9 4.0 4.8 39.3 64.8 8.9 5.0Not Working 60.7 27.9 5.6 6.5 36.8 58.5 4.6 2.4
Wealth quintile:Lowest 53.7 23.8 4.5 7.2 37.4 43.2 5.4 2.9Second 50.9 17.5 0.6 3.2 36.9 47.1 5.9 1.1Middle 44.7 24.1 4.9 4.4 38.5 52.1 4.6 5.7Fourth 55.0 30.3 5.2 6.0 48.2 57.9 4.6 5.5Highest 67.5 48.8 11.4 7.9 56.1 58.1 2.9 6.5
Place of residence:Rural 52.8 26.7 4.3 5.7 42.8 52.4 5.0 4.9Urban 64.1 46.7 11.4 6.6 54.4 58.1 2.7 5.5
Region:Kampala 61.8 53.6 13.7 7.6 55.3 52.1 3.9 5.8Central 54.0 33.6 3.4 5.5 48.4 51.8 3.5 4.5Eastern 61.2 22.1 3.9 5.5 40.8 46.2 5.7 4.9Northern 64.6 36.8 7.7 6.2 55.0 60.0 5.6 7.1Western 48.5 30.7 9.2 6.3 40.9 62.1 3.8 4.6
Notes: Caution in the interpretation of the estimates for currently not using, airtime, cash transfer and other by region, education levels, employment and age group due to very high CV.

66
UGANDA FiNScope iii RepoRT
Unlocking Barriers to Financial inclusion in Uganda
November 2013
9.4 Utilizationofmobilemoneyservicesby service provider
Respondents were asked which mobile mon-ey service provider they used in order to as-sess competition among different service providers. Majority of the respondents used MTN, followed by Airtel.7 This finding could be explained by the fact that MTN was the first to initiate mobile money services and as such has more registered agents compared to
other networks. Reasons given for the choice of a particular service provider included con-venience and cost of the service in that order of importance. There appears to be a life-cycle dimension for the below 18 years using Airtel more than MTN. Furthermore, the ur-ban population was more likely to use MTN mobile money services compared to their ru-ral counterparts.
Table26:Utilisationofmobilemoneyservicesbyserviceproviderin2013,%
MTN Airtel Others AllUganda 72.5 27.2 4.1 100Gender:
Female 71.0 25.3 3.3 100Male 73.9 29.0 4.8 100
Age group:Below 18 20.9 56.8 2.1 10018-24 69.2 26.3 4.9 10025-39 75.3 27.2 4.8 10040-59 74.9 27.1 3.0 10060+ 69.7 23.4 0.6 100
Educational attainment:No Formal Education 67.9 23.4 5.2 100Some Primary 67.8 25.1 4.2 100Completed Primary 73.7 22.6 2.3 100Some Secondary 72.2 27.2 4.5 100O-Level + 79.3 34.1 4.4 100
Employment status:Self Employed 72.1 25.8 3.9 100Paid Employees 74.8 31.0 4.6 100Contr. Family Worker 82.2 17.1 8.4 100Not Working 68.4 31.3 2.2 100
Wealth quintile:Lowest 66.4 23.4 5.8 100Second 71.0 23.6 3.7 100 Middle 72.8 22.2 1.5 100 Fourth 72.3 26.2 3.0 100 Highest 74.9 33.9 6.3 100
Place of residence:Rural 70.4 25.3 3.1 100Urban 77.5 31.9 6.3 100
Region:Kampala 78.0 37.9 7.7 100Central 63.1 31.4 1.4 100Eastern 79.7 21.5 4.0 100Northern 77.9 19.3 9.0 100Western 74.1 26.4 4.0 100
7
7 Warid merged with Airtel in May 2013.
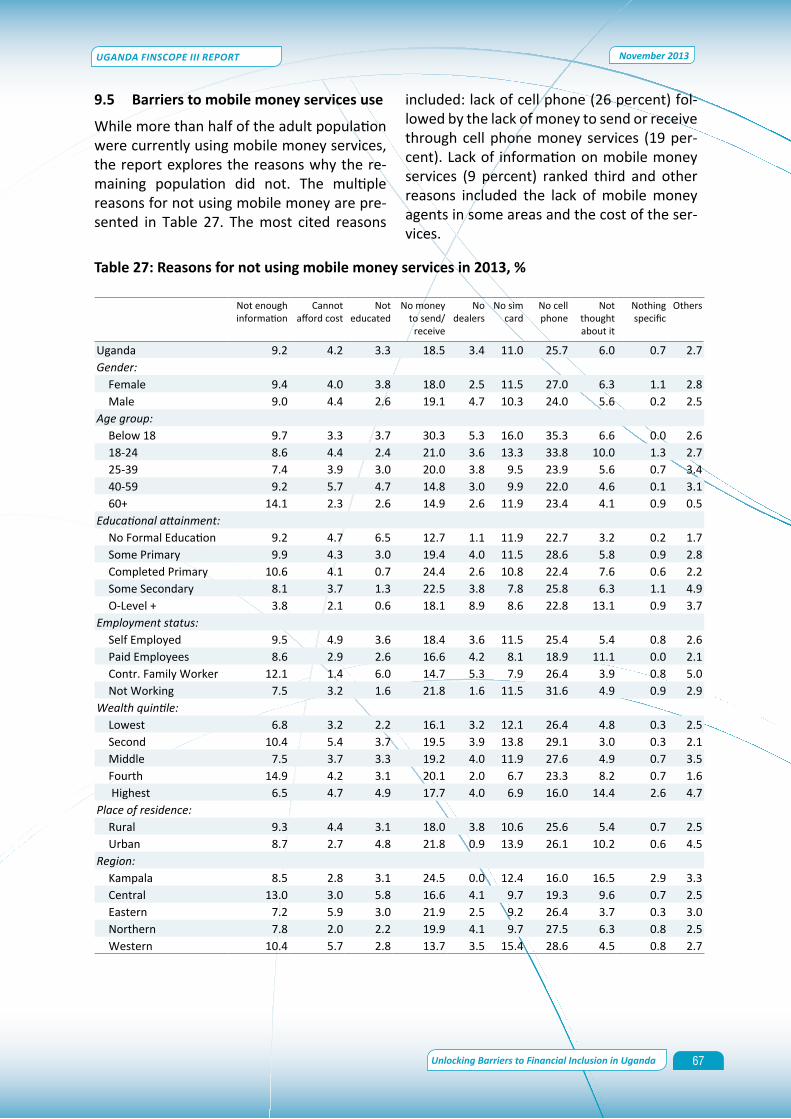
67
UGANDA FiNScope iii RepoRT
Unlocking Barriers to Financial inclusion in Uganda
November 2013
9.5 Barriers to mobile money services use
While more than half of the adult population were currently using mobile money services, the report explores the reasons why the re-maining population did not. The multiple reasons for not using mobile money are pre-sented in Table 27. The most cited reasons
included: lack of cell phone (26 percent) fol-lowed by the lack of money to send or receive through cell phone money services (19 per-cent). Lack of information on mobile money services (9 percent) ranked third and other reasons included the lack of mobile money agents in some areas and the cost of the ser-vices.
Table27:Reasonsfornotusingmobilemoneyservicesin2013,%
Not enough information
Cannot afford cost
Not educated
No money to send/
receive
No dealers
No sim card
No cell phone
Not thought about it
Nothing specific
Others
Uganda 9.2 4.2 3.3 18.5 3.4 11.0 25.7 6.0 0.7 2.7Gender:
Female 9.4 4.0 3.8 18.0 2.5 11.5 27.0 6.3 1.1 2.8Male 9.0 4.4 2.6 19.1 4.7 10.3 24.0 5.6 0.2 2.5
Age group:Below 18 9.7 3.3 3.7 30.3 5.3 16.0 35.3 6.6 0.0 2.618-24 8.6 4.4 2.4 21.0 3.6 13.3 33.8 10.0 1.3 2.725-39 7.4 3.9 3.0 20.0 3.8 9.5 23.9 5.6 0.7 3.440-59 9.2 5.7 4.7 14.8 3.0 9.9 22.0 4.6 0.1 3.160+ 14.1 2.3 2.6 14.9 2.6 11.9 23.4 4.1 0.9 0.5
Educational attainment:No Formal Education 9.2 4.7 6.5 12.7 1.1 11.9 22.7 3.2 0.2 1.7Some Primary 9.9 4.3 3.0 19.4 4.0 11.5 28.6 5.8 0.9 2.8Completed Primary 10.6 4.1 0.7 24.4 2.6 10.8 22.4 7.6 0.6 2.2Some Secondary 8.1 3.7 1.3 22.5 3.8 7.8 25.8 6.3 1.1 4.9O-Level + 3.8 2.1 0.6 18.1 8.9 8.6 22.8 13.1 0.9 3.7
Employment status:Self Employed 9.5 4.9 3.6 18.4 3.6 11.5 25.4 5.4 0.8 2.6Paid Employees 8.6 2.9 2.6 16.6 4.2 8.1 18.9 11.1 0.0 2.1Contr. Family Worker 12.1 1.4 6.0 14.7 5.3 7.9 26.4 3.9 0.8 5.0Not Working 7.5 3.2 1.6 21.8 1.6 11.5 31.6 4.9 0.9 2.9
Wealth quintile:Lowest 6.8 3.2 2.2 16.1 3.2 12.1 26.4 4.8 0.3 2.5Second 10.4 5.4 3.7 19.5 3.9 13.8 29.1 3.0 0.3 2.1Middle 7.5 3.7 3.3 19.2 4.0 11.9 27.6 4.9 0.7 3.5Fourth 14.9 4.2 3.1 20.1 2.0 6.7 23.3 8.2 0.7 1.6 Highest 6.5 4.7 4.9 17.7 4.0 6.9 16.0 14.4 2.6 4.7
Place of residence:Rural 9.3 4.4 3.1 18.0 3.8 10.6 25.6 5.4 0.7 2.5Urban 8.7 2.7 4.8 21.8 0.9 13.9 26.1 10.2 0.6 4.5
Region:Kampala 8.5 2.8 3.1 24.5 0.0 12.4 16.0 16.5 2.9 3.3Central 13.0 3.0 5.8 16.6 4.1 9.7 19.3 9.6 0.7 2.5Eastern 7.2 5.9 3.0 21.9 2.5 9.2 26.4 3.7 0.3 3.0Northern 7.8 2.0 2.2 19.9 4.1 9.7 27.5 6.3 0.8 2.5Western 10.4 5.7 2.8 13.7 3.5 15.4 28.6 4.5 0.8 2.7

68
UGANDA FiNScope iii RepoRT
Unlocking Barriers to Financial inclusion in Uganda
November 2013
9.6 Concluding remarks
Overall, it is evident that the demand for, and use of mobile money services is relatively high compared to other formal financial products (both bank and non-bank). Further analysis however, revealed that vulnerable groups i.e. females the youth, the less educated, the unemployed and the poor use less of the ser-vices than their less vulnerable counterparts. Lack of cell phone, no money to send/receive came up as the major barriers to access and use of mobile money services. Compared to other products, there was high degree of awareness of these products among the adult population going by the low percentage of 9 percent without such knowledge.

69
UGANDA FiNScope iii RepoRT
Unlocking Barriers to Financial inclusion in Uganda
November 2013
Governments in developed economies have recognised financial inclusion and consum-er protection as an integral part of achiev-ing financial stability and integrity (Cohen & Candace 2011). Financial literacy can have different meaning to different people. In de-veloped economies being financially literate might require knowledge of tax codes, insur-ance requirements, credit cards, while for the unbanked population in developing coun-tries, financial literacy is more likely defined by basic concepts of safe and secure savings, budgeting and wise borrowing. Financial lit-eracy may also mean evolving state of com-petency that enables each individual to re-spond effectively to ever changing personal and economic circumstances. It is in this framework that financial literacy was anal-ysed. Financial literacy as used in the context of this report means the knowledge and the understanding of operations of financial insti-tutions including financial products, their use and how they can benefit clients and the gen-eral economy. Earlier on, the study findings showed that many adults do not understand the meanings of savings and investment; and how and where to buy insurance. This Section gives insights into source of financial infor-mation, financial numeracy and perceptions of Ugandans on paying back loans. Focusing on those adults who had ever received credit, the Section has insight customers’ dissatisfac-
tion with financial institutions customers and how complaints could be handled. Perceived transparency and fairness in dealing with fi-nancial institution clients are also discussed.
10.1 Mainsourcesofinformation
The source of information on financial issues is important as it determines not only the cred-ibility of such information but also the clar-ity and subsequent response from potential clients. Table 28 shows that the main source of financial information was radio used by 53 percent of the adult population. This is true regardless of socio-economic grouping. By implication, financial services providers need to creatively package their information as well as identify radio stations with a greater reach to the target adult population.
Worth noting is the share of adult females (38 percent) that received information from friends/relatives compared to males (26 per-cent). The same source was cited more in rural areas, than in urban areas. This find-ing is not surprising given the fact that most females were residents in rural area where the majority of the adult population relied more on the informal financial institutions. Yet, such information from relatives/friends against the low financial literacy levels raises concerns on authenticity and quality of infor-mation received.
10. FINANCIAL LITERACY AND CONSUMER PROTECTION

70
UGANDA FiNScope iii RepoRT
Unlocking Barriers to Financial inclusion in Uganda
November 2013
Table28:Themostimportantsourcesoffinancialinformationin2013,%
Radio Television Newspapers Friends/ Relatives
Colleagues At Work
Church/Mosque
My Bank Sacco Internet Employer
Uganda 52.5 4.5 1.6 32.0 2.2 2.0 1.7 2.7 0.5 0.2
Gender:
Female 46.9 5.1 1.0 37.5 1.9 2.2 1.3 3.6 0.3 0.2Male 58.6 3.8 2.3 26.2 2.6 1.9 2.2 1.8 0.6 0.2
Age group:
Below 18 53.8 10.0 0.0 34.1 1.8 0.0 0.0 0.0 0.0 0.318-24 52.8 6.9 2.3 30.6 2.1 1.2 1.6 1.3 0.7 0.425-39 53.1 4.2 1.9 30.7 2.7 2.2 2.1 2.5 0.5 0.240-59 51.9 3.0 0.7 33.3 2.4 2.1 1.3 5.3 0.1 0.060+ 50.7 3.1 1.8 37.1 0.2 3.4 1.6 1.4 0.7 0.0
Educational attainment:
No Formal Education 41.3 1.1 0.1 45.7 2.0 5.0 0.5 4.0 0.1 0.2
Some Primary 53.1 1.8 0.3 38.0 2.0 1.2 0.8 2.7 0.1 0.2
Completed Primary 55.4 5.4 1.0 29.1 1.7 3.6 0.3 3.1 0.1 0.4
Some Secondary 61.1 6.4 2.1 18.6 3.3 1.3 3.6 3.5 0.0 0.1O-Level + 53.1 12.1 6.4 17.3 2.5 0.4 5.0 0.9 2.2 0.1
Wealth quintile:
Lowest 41.9 0.4 0.4 48.5 1.2 3.8 1.1 2.8 0.0 0.0Second 53.7 0.0 0.0 38.0 1.1 1.8 0.3 4.6 0.3 0.0
Middle 57.3 0.4 0.7 34.7 2.1 1.3 0.9 2.4 0.0 0.3
Fourth 63.7 1.0 2.7 25.7 1.2 1.8 1.1 2.3 0.2 0.3
Highest 43.5 20.0 4.1 16.6 5.3 1.8 5.0 1.7 1.7 0.3Place of residence:
Rural 54.8 1.1 0.8 35.0 1.9 2.1 1.1 2.8 0.1 0.1Urban 43.5 17.5 4.6 20.5 3.5 1.8 4.0 2.4 1.8 0.4
Region:
Kampala 20.6 31.2 8.2 14.9 8.3 1.9 9.2 0.9 3.7 1.0Central 62.9 8.3 1.7 20.1 2.6 0.2 1.2 3.0 0.0 0.0Eastern 51.2 1.0 0.7 39.7 2.1 0.8 1.0 2.6 0.6 0.4Northern 40.5 0.6 0.8 45.9 2.3 4.3 2.3 3.2 0.0 0.0Western 60.3 1.5 1.6 28.8 0.7 3.1 0.8 2.7 0.4 0.1
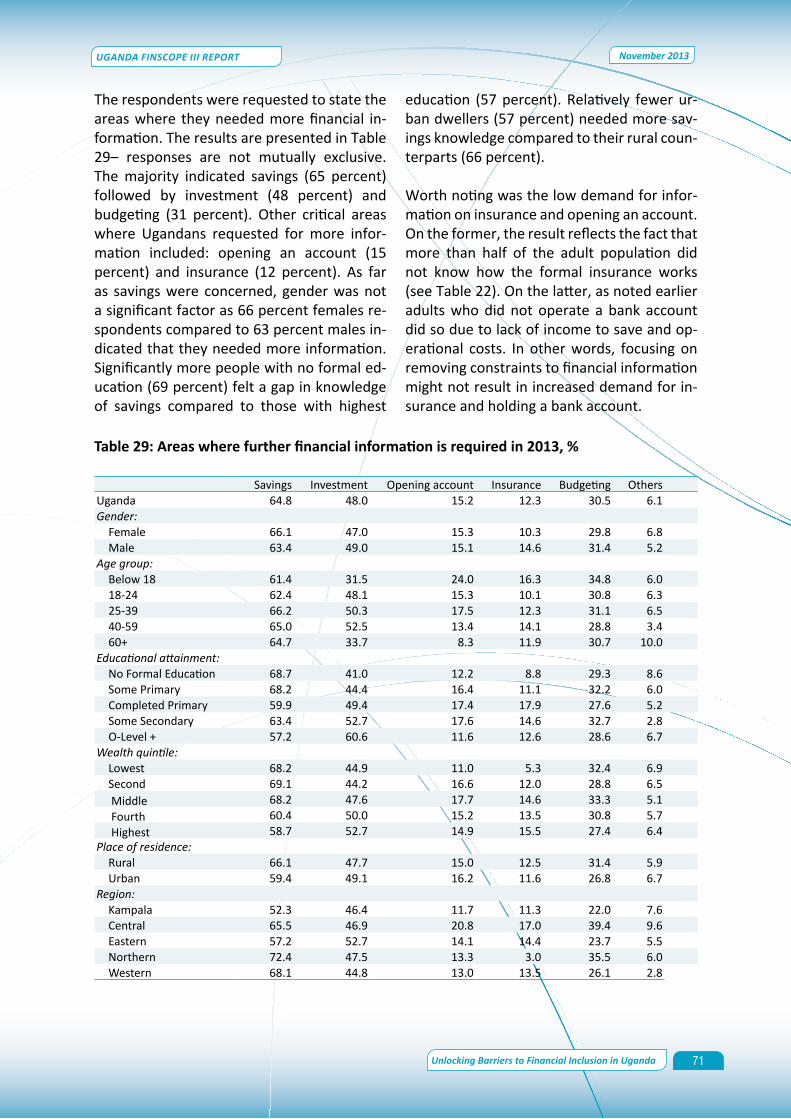
71
UGANDA FiNScope iii RepoRT
Unlocking Barriers to Financial inclusion in Uganda
November 2013
The respondents were requested to state the areas where they needed more financial in-formation. The results are presented in Table 29– responses are not mutually exclusive. The majority indicated savings (65 percent) followed by investment (48 percent) and budgeting (31 percent). Other critical areas where Ugandans requested for more infor-mation included: opening an account (15 percent) and insurance (12 percent). As far as savings were concerned, gender was not a significant factor as 66 percent females re-spondents compared to 63 percent males in-dicated that they needed more information. Significantly more people with no formal ed-ucation (69 percent) felt a gap in knowledge of savings compared to those with highest
education (57 percent). Relatively fewer ur-ban dwellers (57 percent) needed more sav-ings knowledge compared to their rural coun-terparts (66 percent).
Worth noting was the low demand for infor-mation on insurance and opening an account. On the former, the result reflects the fact that more than half of the adult population did not know how the formal insurance works (see Table 22). On the latter, as noted earlier adults who did not operate a bank account did so due to lack of income to save and op-erational costs. In other words, focusing on removing constraints to financial information might not result in increased demand for in-surance and holding a bank account.
Table29:Areaswherefurtherfinancialinformationisrequiredin2013,%
Savings Investment Opening account Insurance Budgeting OthersUganda 64.8 48.0 15.2 12.3 30.5 6.1Gender:
Female 66.1 47.0 15.3 10.3 29.8 6.8Male 63.4 49.0 15.1 14.6 31.4 5.2
Age group:Below 18 61.4 31.5 24.0 16.3 34.8 6.018-24 62.4 48.1 15.3 10.1 30.8 6.325-39 66.2 50.3 17.5 12.3 31.1 6.540-59 65.0 52.5 13.4 14.1 28.8 3.460+ 64.7 33.7 8.3 11.9 30.7 10.0
Educational attainment:No Formal Education 68.7 41.0 12.2 8.8 29.3 8.6Some Primary 68.2 44.4 16.4 11.1 32.2 6.0Completed Primary 59.9 49.4 17.4 17.9 27.6 5.2Some Secondary 63.4 52.7 17.6 14.6 32.7 2.8O-Level + 57.2 60.6 11.6 12.6 28.6 6.7
Wealth quintile:Lowest 68.2 44.9 11.0 5.3 32.4 6.9Second 69.1 44.2 16.6 12.0 28.8 6.5 Middle 68.2 47.6 17.7 14.6 33.3 5.1 Fourth 60.4 50.0 15.2 13.5 30.8 5.7 Highest 58.7 52.7 14.9 15.5 27.4 6.4
Place of residence:Rural 66.1 47.7 15.0 12.5 31.4 5.9Urban 59.4 49.1 16.2 11.6 26.8 6.7
Region:Kampala 52.3 46.4 11.7 11.3 22.0 7.6Central 65.5 46.9 20.8 17.0 39.4 9.6Eastern 57.2 52.7 14.1 14.4 23.7 5.5Northern 72.4 47.5 13.3 3.0 35.5 6.0Western 68.1 44.8 13.0 13.5 26.1 2.8

72
UGANDA FiNScope iii RepoRT
Unlocking Barriers to Financial inclusion in Uganda
November 2013
10.2 Knowledgeonthebasicsoffinancialliteracy
The survey captured information on the re-spondents’ ability to understand and inter-nalise financial literacy. Specifically, the sur-vey posed three questions on interest rates, discount rates and money lending, with mul-tiple choice answer. As shown in Table 30, question on discount on the bicycle was gen-erally answered better than any of the other two, having been solved correctly by 55 per-cent of the adult population. On all the three questions, a higher percentage of males than females got the answer correctly, and perfor-mance was directly related to educational at-tainment, i.e., the higher the education level,
the greater the percentage was, of people who got the answer correctly. Urban resi-dents performed only marginally better on the second question than their rural counter-parts.
In the category of respondents with highest education, not more than 68 percent got the answer correctly on any of the three prob-lems, which was a reflection of a low level of financial literacy in Uganda. A sizeable per-centage of adults with no education were able to answer the three questions. The im-plication of this finding is that formal educa-tion is necessary but not sufficient to ensure competencies in financial literacy.

73
UGANDA FiNScope iii RepoRT
Unlocking Barriers to Financial inclusion in Uganda
November 2013Table30
:Testing
kno
wledg
eofbasicfina
ncialliteracyin201
3,%
Char
acte
ristic
In
tere
st m
onth
ly v
s ann
ual (
a)
A di
scou
nt o
n bi
cycl
e on
sale
(b)
Bo
rrow
from
a m
oney
lend
er (c
)Al
l 5
%
mon
thly
20%
An
nual
Not
Sur
eU
Sh30
,000
Disc
ount
10
% N
ot S
ure
M1
M2
Do n
ot
know
Uga
nda
23.4
51.0
25.6
54
.920
.125
.0
28.4
41.5
30.1
100.
0G
ende
r:Fe
mal
e22
.048
.629
.452
.318
.529
.328
.138
.433
.510
0.0
Mal
e24
.953
.721
.457
.822
.020
.328
.845
.026
.210
0.0
Age
gro
up:
Belo
w 1
817
.145
.937
.042
.022
.435
.617
.452
.330
.310
0.0
18-2
424
.354
.121
.556
.922
.420
.731
.741
.526
.810
0.0
25-3
924
.753
.921
.557
.820
.521
.729
.745
.025
.310
0.0
40-5
923
.252
.224
.656
.619
.523
.928
.342
.928
.710
0.0
60+
19.6
35.0
45.4
41.6
15.8
42.6
21.6
23.8
54.6
100.
0Ed
ucati
onal
att
ainm
ent:
No
Form
al E
duca
tion
19.8
35.8
44.4
42.5
14.2
43.3
17.2
32.1
50.7
100.
0So
me
Prim
ary
23.9
46.2
29.9
54.2
17.4
28.4
28.1
39.1
32.8
100.
0Co
mpl
eted
Prim
ary
23.9
59.5
16.7
55.9
26.5
17.6
33.4
46.4
20.2
100.
0So
me
Seco
ndar
y26
.859
.214
.062
.024
.813
.233
.648
.018
.410
0.0
O-L
evel
and
mor
e23
.468
.18.
565
.625
.09.
434
.549
.815
.710
0.0
Empl
oym
ent s
tatu
s:Se
lf Em
ploy
ed22
.951
.425
.856
.018
.625
.427
.941
.630
.410
0.0
Paid
Em
ploy
ees
29.0
52.3
18.6
56.0
25.1
19.0
33.0
43.9
23.1
100.
0Co
ntr.
Fam
ily W
orke
r16
.059
.724
.351
.121
.327
.715
.448
.336
.310
0.0
Not
Wor
king
22.0
44.7
33.3
50.1
20.9
29.0
30.2
35.8
34.0
100.
0W
ealth
qui
ntile
:Lo
wes
t17
.346
.536
.245
.216
.438
.419
.139
.041
.910
0.0
Seco
nd24
.546
.828
.754
.518
.726
.924
.242
.932
.910
0.0
Mid
dle
24.4
51.0
24.6
57.0
20.3
22.6
29.7
38.5
31.7
100.
0Fo
urth
28.0
49.1
23.0
57.8
20.4
21.8
34.7
41.4
24.0
100.
0Hi
ghes
t22
.161
.716
.259
.124
.716
.233
.545
.720
.810
0.0
Plac
e of
resi
denc
e:Ru
ral
23.6
49.6
26.8
54.6
19.6
25.7
28.3
40.6
31.2
100.
0U
rban
22.5
57.0
20.5
55.9
22.2
21.9
29.2
45.4
25.4
100.
0Re
gion
:Ka
mpa
la17
.752
.729
.544
.924
.230
.924
.936
.938
.310
0.0
Cent
ral
23.7
55.5
20.9
59.8
20.2
20.1
37.1
34.8
28.1
100.
0Ea
ster
n23
.843
.133
.147
.521
.131
.432
.334
.633
.110
0.0
Nor
ther
n20
.349
.730
.051
.616
.831
.615
.148
.936
.010
0.0
Wes
tern
26.7
55.6
17.7
62.8
21.1
16.1
27.7
50.2
22.1
100.
0 No
tes:
a) N
1.5:
If y
ou w
ere
offer
ed a
loan
with
5%
mon
thly
inte
rest
rate
and
a lo
an w
ith 2
0% a
nnua
l int
eres
t rat
e, w
hich
loan
wou
ld o
ffer b
etter
val
ue?
b) N
1.6:
If th
e sa
me
bicy
cle
is on
sale
in tw
o di
ffere
nt sh
ops a
t USh
s200
,000
and
one
shop
offe
red
a di
scou
nt o
f USh
s30,
000
whi
le th
e ot
her s
hop
offer
ed a
10%
disc
ount
, whi
ch o
ne is
the
bett
er b
arga
in?
c) N
1.8:
You
wan
t to
borr
ow U
Shs5
00,0
00 fr
om a
mon
ey le
nder
(M1)
. He
says
that
you
can
get
it b
ut y
ou m
ust p
ay h
im U
shs6
00,0
00 in
a m
onth
. Ano
ther
mon
ey le
nder
(M2)
says
you
hav
e to
pay
USh
s500
,000
bac
k pl
us in
tere
st o
f 15%
in a
mon
th.
Whi
ch o
ne d
o yo
u ta
ke?
d) T
he c
orre
ct re
spon
se a
re m
arke
d in
gre
y.
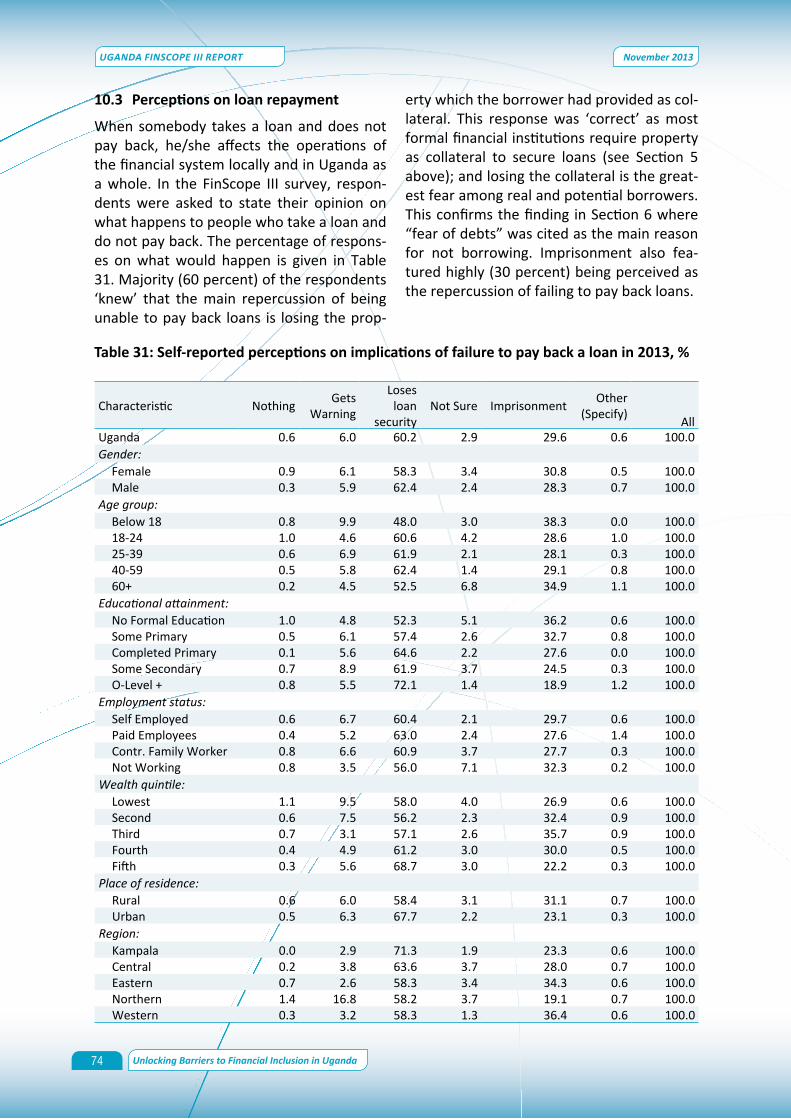
74
UGANDA FiNScope iii RepoRT
Unlocking Barriers to Financial inclusion in Uganda
November 2013
10.3 Perceptionsonloanrepayment
When somebody takes a loan and does not pay back, he/she affects the operations of the financial system locally and in Uganda as a whole. In the FinScope III survey, respon-dents were asked to state their opinion on what happens to people who take a loan and do not pay back. The percentage of respons-es on what would happen is given in Table 31. Majority (60 percent) of the respondents ‘knew’ that the main repercussion of being unable to pay back loans is losing the prop-
erty which the borrower had provided as col-lateral. This response was ‘correct’ as most formal financial institutions require property as collateral to secure loans (see Section 5 above); and losing the collateral is the great-est fear among real and potential borrowers. This confirms the finding in Section 6 where “fear of debts” was cited as the main reason for not borrowing. Imprisonment also fea-tured highly (30 percent) being perceived as the repercussion of failing to pay back loans.
Table31:Self-reportedperceptionsonimplicationsoffailuretopaybackaloanin2013,%
Characteristic Nothing Gets Warning
Loses loan
security Not Sure Imprisonment Other
(Specify) AllUganda 0.6 6.0 60.2 2.9 29.6 0.6 100.0Gender:
Female 0.9 6.1 58.3 3.4 30.8 0.5 100.0Male 0.3 5.9 62.4 2.4 28.3 0.7 100.0
Age group:Below 18 0.8 9.9 48.0 3.0 38.3 0.0 100.018-24 1.0 4.6 60.6 4.2 28.6 1.0 100.025-39 0.6 6.9 61.9 2.1 28.1 0.3 100.040-59 0.5 5.8 62.4 1.4 29.1 0.8 100.060+ 0.2 4.5 52.5 6.8 34.9 1.1 100.0
Educational attainment:No Formal Education 1.0 4.8 52.3 5.1 36.2 0.6 100.0Some Primary 0.5 6.1 57.4 2.6 32.7 0.8 100.0Completed Primary 0.1 5.6 64.6 2.2 27.6 0.0 100.0Some Secondary 0.7 8.9 61.9 3.7 24.5 0.3 100.0O-Level + 0.8 5.5 72.1 1.4 18.9 1.2 100.0
Employment status:Self Employed 0.6 6.7 60.4 2.1 29.7 0.6 100.0Paid Employees 0.4 5.2 63.0 2.4 27.6 1.4 100.0Contr. Family Worker 0.8 6.6 60.9 3.7 27.7 0.3 100.0Not Working 0.8 3.5 56.0 7.1 32.3 0.2 100.0
Wealth quintile:Lowest 1.1 9.5 58.0 4.0 26.9 0.6 100.0Second 0.6 7.5 56.2 2.3 32.4 0.9 100.0Third 0.7 3.1 57.1 2.6 35.7 0.9 100.0Fourth 0.4 4.9 61.2 3.0 30.0 0.5 100.0Fifth 0.3 5.6 68.7 3.0 22.2 0.3 100.0
Place of residence:Rural 0.6 6.0 58.4 3.1 31.1 0.7 100.0Urban 0.5 6.3 67.7 2.2 23.1 0.3 100.0
Region:Kampala 0.0 2.9 71.3 1.9 23.3 0.6 100.0Central 0.2 3.8 63.6 3.7 28.0 0.7 100.0Eastern 0.7 2.6 58.3 3.4 34.3 0.6 100.0Northern 1.4 16.8 58.2 3.7 19.1 0.7 100.0Western 0.3 3.2 58.3 1.3 36.4 0.6 100.0

75
UGANDA FiNScope iii RepoRT
Unlocking Barriers to Financial inclusion in Uganda
November 2013
Respondents in urban areas (67 percent) were more inclined to say that the loan security would be taken away compared to respon-dents in rural areas (58 percent), whereas many more in rural areas (31 percent) stated that the defaulter would be imprisoned as compared to respondents in urban areas (24 percent). In general, males and females gave similar perceptions. The likelihood to cite im-prisonment was higher among the youth and senior citizens compared to their middle aged counterparts. The reverse is observed for losing collateral security. In terms of wealth status, there were no discernible patterns. This finding was expected given the patterns observed based on employment status. In terms of education, citing loss of loan secu-rity increases with educational attainment, whereas citing imprisonment reduces. The adult population with no formal education was more likely to be poor and hence lacking a collateral security.
10.4 ConsumerProtection
This section focuses on only those individu-als who used financial products and services during the past 12 months prior to the Fin-Scope III survey – estimated at 13.6 million adults.
Satisfaction with financial services providers: The adults that reported to have used finan-cial institutions they were requested to indi-cate their degree of satisfaction with finan-cial services providers. Nearly 11 percent of the adults reported dissatisfaction. The most highly educated, the urban dwellers and the respondents from Western region showed the highest level of dissatisfaction. Gender did not seem to determine the level of dissat-isfaction. The level of dissatisfaction of cus-tomers of financial institutions was very high among the urban residents and among those with the highest education. Financial institu-tions therefore need to probe to find out the actual reasons why there is this widespread dissatisfaction with their services. Indeed, some of these adults (36 percent) indicated
that they did not expect to see their com-plaints being resolved soon, and 23 percent believed that the service provider was too powerful for them to get their complaint re-solved. These two results suggest a high level of apathy. Financial institutions, therefore, ought to come out strongly and address the problem of customer dissatisfaction.
Handling of complaints: The FinScope III sur-vey asked respondents to indicate the places where they normally go to get their com-plaints handled (multiple responses); and whether they would feel better if there was an independent complaints handling body. The results are presented in Table 32. Most adults went to the local councils (LCs) (46 percent), institutions providing the service (37 percent) and to the police (25 percent). These patterns appear to reflect the type of financial providers used. The relatively higher percentage on LCs could be reflecting the lev-el of usage of informal financial products and services. If the complaint concerns matters to do with informal financial institutions, then going to the LC structures for dispute settle-ment would appear to be more appropriate. Nearly 12 percent of the adults mentioned that they would not go to any financial insti-tution if they had a complaint. This is one of the groups which need to be targeted for an intensive financial literacy campaign because their response is nothing but apathy.
Majority of Ugandans (66 percent) would feel confident (in their dealings with financial in-stitutions) if there was an independent body to handle complaints. With such a resound-ing majority preferring an independent body, serious consideration should be given to this matter by the relevant authorities.

76
UGANDA FiNScope iii RepoRT
Unlocking Barriers to Financial inclusion in Uganda
November 2013
Table32:Preferredoptionsfordisputesettlementin2013,%
Place where a complaint is registered
Service provider Police Local Councils None Others Independent body
Uganda 37.1 24.7 46.3 12.3 2.1 65.7Gender:
Female 36.3 24.2 47.7 12.1 2.2 63.3Male 38.0 25.3 44.9 12.5 1.9 68.3
Age group:Below 18 18.7 36.3 56.6 16.8 1.4 50.918-24 34.6 27.9 44.9 15.4 2.3 60.925-39 41.4 24.3 43.0 11.4 1.7 69.440-59 38.9 21.7 47.6 11.4 2.6 69.160+ 26.5 24.1 55.4 10.8 1.7 54.3
Educational attainment:No Formal Education 25.9 24.2 56.9 11.8 1.4 58.4Some Primary 30.4 26.7 52.7 13.6 1.2 64.8Completed Primary 37.2 24.1 43.2 12.2 3.4 69.7Some Secondary 45.6 24.9 39.2 11.3 2.5 67.2O’Level + 60.6 20.6 26.0 10.3 3.4 70.4
Employment status:Self Employed 37.0 25.3 48.3 10.5 1.7 65.5Paid Employees 41.3 22.6 42.0 13.2 2.6 67.1Contr. Family Worker 31.6 29.3 55.5 14.8 3.5 74.9Not Working 34.8 23.2 39.3 18.2 2.4 60.6
Wealth quintile:Lowest 31.5 32.8 53.3 11.7 2.1 61.1Second 30.2 25.2 55.6 12.7 2.0 69.4Third 32.7 24.3 51.8 11.9 2.1 65.9Fourth 35.8 22.4 46.1 14.1 0.5 62.6Fifth 54.9 20.0 25.4 10.7 3.8 68.5
Place of residence:Rural 33.5 25.6 50.6 12.0 2.1 64.8Urban 51.4 20.9 29.0 13.2 2.0 69.1
Region:Kampala 68.6 14.8 6.1 18.4 2.5 64.3Central 43.6 14.3 42.4 9.6 0.8 60.1Eastern 30.5 34.9 48.6 12.4 2.6 70.3Northern 39.3 36.5 51.1 9.6 2.7 68.1Western 29.3 16.0 52.5 15.3 2.0 64.8
About a third of Ugandans believed that fi-nancial institutions provide enough informa-tion to safeguard payment instruments such as cheque books. This shows that more work needs to be done by financial institutions in this area. Less than ten percent of respon-dents were able to access a hotline to report
stolen instruments, which suggests that this matter deserves attention.
Perceived transparency and fairness of finan-cial institutions: This section focuses on the proportion of the adult population (20 per-cent) that reported to have accessed formal

77
UGANDA FiNScope iii RepoRT
Unlocking Barriers to Financial inclusion in Uganda
November 2013
bank institutions. The survey asked respon-dents to state how they perceived transpar-ency and fairness with which financial insti-tutions render financial services. About 3 in 10 adults (34 percent) mentioned that they got clear and easy-to-understand informa-
tion from financial institutions while 42 per-cent trusted the advertising of financial ser-vice providers (Figure 24). Nearly 6 percent had taken a financial product only to be later surprised that the product had hidden fees/charges.
Figure24:Transparencyandfairnessoffinancialinstitutionsin2013,%
Of the Ugandans who did not get clear and easy-to-understand information from finan-cial service providers the main reasons were: transactions documents were written in small font (2 percent); some clients could not read and yet the information had not been ex-plained orally (22 percent), others found that the language used was difficult (27 percent); or the clients got the information in a lan-guage they did not understand (15 percent); while others found that crucial elements were hidden (20 percent). These results in-dicate that many clients in Uganda made fi-nancial transactions with service providers in a language they did not understand; or they felt that crucial information was withheld from them by financial institutions, which are both signs of lack of transparency. However, one should not overlook the fact that some adult Ugandans cannot read much as the banks could be able to provide the relevant
information. That said, in order to increase transparency, financial institutions need to use simplified language and treat customers who cannot read and write in a correct and special way.
Turning to fair treatment: The results of the survey showed that 42 percent of adult population were treated fairly by financial institutions. Only 3 percent had ever been threatened or treated in a violent or humiliat-ing manner; 4 percent had ever been taken advantage of; 3 percent had been sold a fi-nancial product and later on noticed that the product was not in their best interest; while 2 percent had been sold a loan without the fi-nancial service provider assessing their ability to repay the loan. In general, the results re-flect fair treatment of Ugandans by financial service providers.

78
UGANDA FiNScope iii RepoRT
Unlocking Barriers to Financial inclusion in Uganda
November 2013
10.5 Budgeting
On budgeting, results of this survey showed that 44 percent of adult population always budgeted before they engage in any financial transaction; 19 percent knew exactly how much money they personally spent in the 7 days preceding the survey; 21 percent al-ways kept track record of money they got and spent; while 10 percent always prioritised their spending to ensure that there is enough money left. This shows that financial institu-tions need to carry put in place an appropria-tetraining program to improve the knowledge of budgeting among Ugandans.
10.6 Concluding remarks
In summary, the survey findings revealed the importance of consumer education to en-hance financial literacy and financial capabil-ity among Uganda’s adult population. This is revealed by the majority of the adult popula-tion who reported the need to have more in-formation on savings (65 percent), investment
(48 percent) and budgeting (31 percent). Although the results showed a high level of financial numeracy spatially, it was more in-clined to males and the more educated, than with the females and the less educated,and not knowledgeable about financial matters.
Most of the adult population related the cost of defaulting on loan repayment to loss of property pledged by the client. While there has been tremendous growth in financial in-stitutions over the years, about 11 percent of the adult population were not satisfied with their services. This would call for the financial institutions to invest more in outreach ser-vices to popularise about their products and services. On complaint handling, majority of the adult population would prefer an inde-pendent institution. This is a very important consideration for the financial inclusion strat-egy in Uganda to improve financial literacy and capability.

79
UGANDA FiNScope iii RepoRT
Unlocking Barriers to Financial inclusion in Uganda
November 2013
Overall there has been remarkable improve-ment in financial inclusion in Uganda since 2009 – from 70 percent in 2009 to 85 percent in 2013. However, this improvement was reg-istered mainly in the non-bank formal sector largely driven by the introduction and growth in mobile money services. With the exclusion of mobile money which is largely used for money transfers and not financial intermedi-ary, formal financial inclusion in Uganda re-mains low when compared with other coun-tries like South Africa, Namibia, Swaziland and Kenya where similar FinScopeSurveys have been carried out.
Financial inclusion through formal banking institutions of the adult population remained unchanged after a four-year period despite an increase in the number of commercial banks and commercial bank branches during this period. The low usage of the formal bank-ing products and services impacts heavily on the level of savings mobilised domestically through the financial system, which in turn affects access to credit and investment by the private sector. The survey results showed that the majority of the adult population was excluded from borrowing from financial in-stitutions which limits a large section of the population from engaging in economic activi-ties resulting into low economic growth, low incomes and unemployment. Low savings mobilisation and limited access to credit keep a large section of the Ugandan population in a vicious cycle of poverty and widens income inequalities. The survey results showed that even the few who borrowed did so largely through informal institutions, which by their very nature are too small and less capitalised to support the start-up or expansion of busi-ness investments that can bring about sig-nificant economic growth and development. Furthermore, the majority of those borrow-ing did so mainly for consumption purposes and less for investment.
Access to and use of formal banking services were skewed heavily towards the adult popu-lation within the wealthiest quintile, in the more developed regions and in urban areas; as well as towards adults who were males, with better educational attainment and in the middle age contributing further to inequali-ties in incomes across and within these cat-egories.
When it comes to insurance, the survey find-ings revealed that access to and usage of for-mal insurance products and services in Ugan-da remained low. Subsequently, the majority of the adult population resorted to informal ways (with all their limitations) to hedge against risk. Limited use of insurance servic-es negatively retards the growth of business ventures that are prone to risk and thus in-hibits the entrepreneurship potential of the country. The low usage of insurance products and services was, among other things, largely due to lack of knowledge about insurance by the majority of the population in addition to the high cost of insurance products and ser-vices. Despite the reforms in the sector, the low level of penetration of the insurance ser-vices shows that the sector is still operating under capacity and further reforms are nec-essary to increase the outreach on insurance services.
The survey findings revealed that the level of financial literacy among the adult population-remained low. This was particularly demon-strated when it came to solving simple arith-metic problems involving interest rates and financial numeracy. Low literacy and numera-cy levels limit the individuals´ ability to digest financial information and to make informed financial decisions. Lack of knowledge about existing financial products and services was rife among a large proportion of the adult population.
11. CONCLUSIONS AND EMERGING POLICY IMPLICATIONS
80
UGANDA FiNScope iii RepoRT
Unlocking Barriers to Financial inclusion in Uganda
November 2013
The information gap shows that there is the need for financial institutions to increase their outreach of financial information services to the public through the available channels in-cluding the media, in addition to customizing important messages to rural areas. Although the majority of the adult population seemed to be satisfied with the services of the finan-cial institutions this did not correlate with the numbers using the formal banks and those with bank accounts.
Regarding the handling of complaints made to financial institutions, the majority Ugan-dans preferred an independent body to re-solve financial-related complaints and a good number preferred neutrality in complaint handling with the service providers. What comes out from this analysis is that financial institutions need to improve their transpar-ency and fairness in dealing with their cus-tomers especially by using a language that is conducive to genuine understanding and communication between the client and the service provider. The information packaging should take into account the educational at-tainment of the adult population. Overall, regardless of strand, lack of information or awareness on financial products and services featured prominently. The lack of information is more pronounced for insurance as well as credit and borrowing.
Although a lot has been done to address the supply side constraints, much more needs to be done differently to spur demand for and access to formal financial services among the adult population. The barriers to finan-cial inclusion are of multidimensional nature though critical if financial inclusion for the entire adult population is to be realised. The self-reported barriers are both demand-side and supply-side related and also cut across different stakeholders in the financial sec-tor. As such addressing only a single barrier might not translate into improved financial inclusion. If the different barriers are to be addressed, there is need for coordination and
collaboration among various stakeholders in order to collectively learn and innovate and where possible scale upon proven innova-tions.
Somekeypolicyactions:
Maintaining macroeconomic stability: The results of FinScope 2013 suggest that mac-roeconomic instability has an adverse effect on the utilisation of financial products and services. High inflation adversely affects the demand for credit and the cost of borrowing.It also adversely affects savings as well as in-vestment decisions of households as illustrat-ed in Section 5. There is therefore a need to maintain macroeconomic stability at all times in order to accelerate the growth of the finan-cial sector. There is no doubt that the macro-economic conditions that prevailed between 2009 and 2013 impacted on the demand for formal financial products especially in terms of savings/investments and borrowing.
Spatialtargetingtopromotefinancialinclu-sion: From the results it is clear that access to and use of financial products and services were skewed toward the urban population and better developed regions. Northern re-gion registered the highest level of exclu-sion—partly due to the lingering effects of the civil war. Hence there is need to consoli-date government’s efforts to prioritize infra-structure and energy in the region. The pri-vate sector should also be encouraged and/or supported to increase its broad-based invest-ment in activities to complement government efforts. There is no doubt that increased con-nectivity will to some extent unlock the barri-ers to financial inclusion in Uganda.
On the other hand, there should be efforts to sustain the progress made in financial inclu-sion across the region. This is illustrated by the fact that while Eastern region was ahead of the Western region in 2009 regarding ac-cess to formal bank institutions, by 2013, it had slipped in the regional rankings.
81
UGANDA FiNScope iii RepoRT
Unlocking Barriers to Financial inclusion in Uganda
November 2013
Promoting broad-based growth: While Uganda has been able to meet the MDG goal of halving poverty—from 56 percent in 1992 to 22 percent in 2013 (preliminary es-timates)—not everyone has benefited from this growth as demonstrated by increasing in-come inequalities. It is also evident from the survey findings that the development of the financial sector has not benefited all socio-economic groups. There are notable gender gaps, rural/urban gaps, and gaps across edu-cational attainment. There is need to promote broad-based growth policies that will lift the majority of the population from poverty and reduce income inequality. The results showed that the rich had a higher chance of access-ing and using financial products and services than the poor. Therefore, it is anticipated that improvement of incomes of the poor will im-prove their access to financial services.
Promoting broad-based long-term sav-ings and investment to support sustainable growth: The study revealed that most of the financial services available were of a short-term nature, and therefore suitable for sup-porting short-term consumption. There is a major gap in the provision of long-term sav-ings mobilisation to support long-term invest-ment efforts. Policies aimed at eradicating slack capacity in long-term savings mobilisa-tion and investment remain critical and para-mount.
Financialeducationandinformationdissem-ination:One of the barriers which leads to financial exclusion—especially in the strands of savings/investments, credit, and insurance is lack of knowledge/publicity about these services. This is exacerbated by the low levels literacy and numeracy among the Ugandan population. The results showed that lack of financial knowledge and information was one of the barriers to the use of financial prod-ucts and services. This calls for intervention from both the private sector and government to design programs that will improve financial literacy as well as increase information of the
financial products and services. This is espe-cially important for the insurance sector—given the increasing vulnerabilities faced by the adult population. There is need for a pol-icy on training in entrepreneurship and finan-cial literacy, which should go hand in hand for sustainability purposes.
Technological innovation and utilisation:There is no doubt that the use of technology led to improvement in access to non-bank formal financial services although this seg-ment is dominated by mobile money trans-fer services. As such, other strands such as insurance should develop appropriate prod-ucts—in line with Uganda’s risk profile. The survey has provided evidence which shows that new products like mobile money can im-prove the access to and use of financial ser-vices in Uganda. However, the use of mobile phone technology is still limited to only mon-ey transfer services. There is therefore need to adopt and extend this technology to the provision of other products and services like savings mobilisation as well as credit exten-sion through mobile money banking, agent banking and micro banking. This will enable the services to reach the population not only in urban areas but also in rural and hard-to-reach areas.
ProductDifferentiationandmarketsegmen-tation:From the survey results it is clear that the supply of formal financial services espe-cially insurance is lower than the demand due to lack of access to and the complexity of the services. There is need for financial institutions to creatively introduce products and services and marketing techniques that are better tailored to the needs and develop-ment of individuals in view of the population differences in terms of location, age, gender and economic status. For example, insurance products required for the urban population are quite different from those needed in rural due to differences in risks encountered.

82
UGANDA FiNScope iii RepoRT
Unlocking Barriers to Financial inclusion in Uganda
November 2013
Legal, Institutional and Regulatory Frame-work: The results also revealed increased ac-cess to and usage of SACCOs and other MFIs (Tier 4 institutions). Some of these institu-tions are dependent on government through the Microfinance Support Centre. On the other hand, the extent of mobilization of sav-ings has remained very low since 2005 and as such rely heavily on government. As such sus-tainability is unlikely to be achieved for insti-tutions that receive public support. This calls for a well-thought through exit strategy. Spe-cifically, the government has to put in place
mechanisms that will strengthen the institu-tional infrastructure of the SACCOs and other MFIs to increase their mobilization of savings and deposits in order to sustainably extend loans to members.
Likewise, the survey results have demonstrat-ed increasing use of ICT in enhancing financial inclusion. This calls for well-coordinated insti-tutional arrangement among the key stake-holders in the financial sector when refining the existing laws and regulations.

83
UGANDA FiNScope iii RepoRT
Unlocking Barriers to Financial inclusion in Uganda
November 2013
REFERENCES
Bank of Uganda (2013), “Financial Stability Report Issue No. 5”
Bategeka L., and L.J. Okumu (2010), “Banking Sector Liberalisation in Uganda Process, Results and Policy Options, Research re-port”, Centre for Research on Multina-tional Corporations.
Brownbridge M. (1996), “Financial Repres-sion and Financial Reform in Uganda”, UNCTAD (Division for Least Developed Countries), Geneva, Switzerland.
Cohen M. and N. Candace (2011), Financial Literacy: A step for Clients towards Fi-nancial Inclusion, 2011 Global Micro-credit Summit.
FinMark (2012), “FinScope Survey on Access to Financial Services in South Africa.”
Kasekende L.A. and M. Ating-Ego (2003), “Fi-nancial Liberalisation and its implica-tion for the domestic system: The case of Uganda”, AERC Research Paper, No. 128. African Economic Consortium, Nai-robi.
Lwanga M.M., A. Kuteesa, and E. Munyam-bonera (2013), “Determinants of Do-mestic Private Credit Growth and Dis-tribution in Uganda”. EPRC Research Series (forthcoming), Economic Policy Research Centre 2013.
Ministry of Finance, Planning and Economic Development (Several Issues). Back-ground to the Budget, Kampala-Ugan-da.
Munyambonera E., A. D. Nampewo (2013), Adong, and M. Mayanja (2013) “Access and use of Credit: Unlocking the Dilem-ma of Financing Small Holder Farmers”. EPRC Series 109.
National Institute of Statistics of Rwanda (2012),FinScope 2012: Financial Inclu-sion in Rwanda 2008-2012.
National Planning Authority (2013), Uganda Vision 2040.
Office of the Prime Minister (2012), The 2010-11 Integrated Rainfall Variability Im-pacts, Needs Assessment and Drought Risk Management Strategy, Depart-ment of Disaster Management, Office of the Prime Minister.
Ssewanyana S. and I. Kasirye (2013), “The dynamics of income poverty in Ugan-da: Insights from the Uganda National Panel Surveys of 2009/10 and 2010/11” forthcoming.
Ssewanyana S. and I. Kasirye (2012), “Poverty and Inequality Dynamics in Uganda: In-sights from the Uganda National Panel Surveys 2005/6 and 2009/10” EPRC re-search Series No. 94.
Stedman Group (2007),FinScope 2006: Re-sults of National Survey on Access to Financial Services in Uganda.
Synovate Uganda (2009),FinScope 2009: Re-sults of National Survey on Demand, Usage and Access to Financial Services in Uganda.
Uganda Bureau of Statistics (2011), “ A Census of Uganda Microfinance Institutions”
Uganda Insurers’ Association (2011),Uganda Insurers Association Annual Report: As-sessing the Performance of Uganda’s Insurance Industry.

84
UGANDA FiNScope iii RepoRT
Unlocking Barriers to Financial inclusion in Uganda
November 2013
APPENDIX 1: SURVEY DESIGN
SurveyPopulation
This was a cross-sectional population-based study conducted to measure financial access among respondents aged 16 years and above (adult population) sampled countrywide. Sample DesignThe sample for the FinScope III was designed to provide financial indicator estimates for the country as a whole and for urban and rural areas separately. Estimates were also reported for the five regions of Uganda with Kampala as one of the region separated from Central region.
A two stage sampling design was used to draw the sample. At the first stage, Enumera-tion Areas (EAs) were drawn with Probability Proportional to Size (PPS), and at the second stage, households which were the ultimate sampling units were drawn using Simple Ran-dom Sampling (SRS). A total of 4,032 house-holds were selected using 2012 Uganda Pop-ulation and Housing Census Mapping Frame. At the EA level, the target was eight house-
TableA1:Enumerationareasandhouseholds
Number of enumeration areas in frame Number of households in frame
Rural Urban total Rural Urban total
Kampala 0 3,199 3,199 0 336,995 336,995
central 13,785 3,022 16,807 1,203,952 295,352 1,499,304
Eastern 19,652 2,302 21,954 1,400,659 194,032 1,594,691
Northern 15,790 1,651 17,441 1,162,984 141,889 1,304,873
Western 16,636 2,913 19,549 1,260,573 239,141 1,499,714
Uganda 65,863 13,087 78,950 5,028,168 870,414 6,235,577
SampleSize
holds. The survey selected one adult respon-dents from the list of adults in the selected household using KISH grid method.
Sample frameThe sampling frame used for the 2013 Fin-Scope is the 2012 Population Census Map-ping listing provided by the Uganda Bureau of Statistics (UBOS). The UBOS has an elec-tronic file consisting of 78,950 Enumeration. Areas (EAs) created for the 2012 Population and Housing Census. An EA is a geographic area consisting of a convenient number of dwelling units that serve as counting units for the census. Tables A.1 provide information on the distribution of EAs and households in the sampling frame by region and residence. Table A.1 shows that among the 78,950 EAs, 13087 (22 percent) are in urban areas and 65863 (78 percent) are in rural areas. The av-erage size of an EA, measured in number of households, is 95 in an urban EA and 77 in a rural EA, with an overall average of 79

85
UGANDA FiNScope iii RepoRT
Unlocking Barriers to Financial inclusion in Uganda
November 2013
The size required for the sample was deter-mined by taking into consideration several factors, the three most important being: the degree of precision (reliability) desired for the survey estimates, the cost and operational limitations, and the efficiency of the design. The FinScope III actual sample with complet-ed information were 3,401 – translates into a completion of 84 percent and response rate of 85 percent.
Listing, Pre-test, Main Training, Fieldwork,and Data Processing
Listing:The listing was performed by orga-nizing the listing staff into 10 teams, with 3 listers per team. Supervision teams were dis-patched to the listing teams to crosscheck the listing exercise. This comprised of staff from UBOS and two staff from EPRC.
Pretesting:Before the start of fieldwork, the questionnaires were piloted in English to make sure that the questions were clear and could be understood by the respondents. This was done during the finalization of the draft questionnaire
Main Training for enumerators and super-visors: REEV Consult International recruited and trained 60 enumerators and 6 supervisors who also acted as field editors, the fieldwork consisted of both male and female person-nel and the reserve interviewers were also trained to remain on standby in case there was need for re-enforcement in the field. Ini-tially, training was conducted for 8 days, but due to further changes in the questionnaire, two additional days were added before the team left for the field work. The training con-sisted of instruction regarding interviewing techniques and field procedures, a detailed review of questionnaires, tests, and instruc-tion and practice. The training also included mock interviews and role plays among partic-ipants in the classroom and in the neighbour-ing villages. Team supervisors and editors were further trained in data quality control
procedures and fieldwork coordination, and use of the GPS machine. The training mainly used the English questionnaires, while the translated versions were simultaneously checked against the English questionnaires to ensure accurate translation.
Main fieldwork: A centralized approach to data collection was used and comprised of 9 field teams. Each team consisted of one Su-pervisor, male and female Enumerators and one Driver. Fieldwork was undertaken with the use of mobile field teams whereby work was programmed from the headquarters to all the sampled areas. There are nine statisti-cal sub regions, and the teams were recruited based on the languages mostly used in each sub region. In total, there were 9 Supervisors, 60 Enumerators, 4 Regional Supervisors, 4 Se-nior Supervisors and 15 drivers. The fieldwork was conducted between June-July, 2013.
Data entry, cleaning and processing: Com-pleted questionnaires were sent to the of-fice as soon as they were ready/filled. Data was first entered in Epi Data while the second data entry was done in CS Pro version.
Data quality / assurance: As part of quality assurance, UBoS and EPRC staff carried out supervision visits during the main fieldwork and would review collected questionnaires and check for completeness and consistency in addition to attending interviews to assess the flow and how questions were asked. The interview teams were then advised on where they needed to improve if necessary.
Also the data from both the first and second entry was reviewed and validated by UBoS, checking for any inconsistencies that needed reconciling, The data was then shared with the research house for final check before it could be used for computation of weights, analysis and tabulation of results.
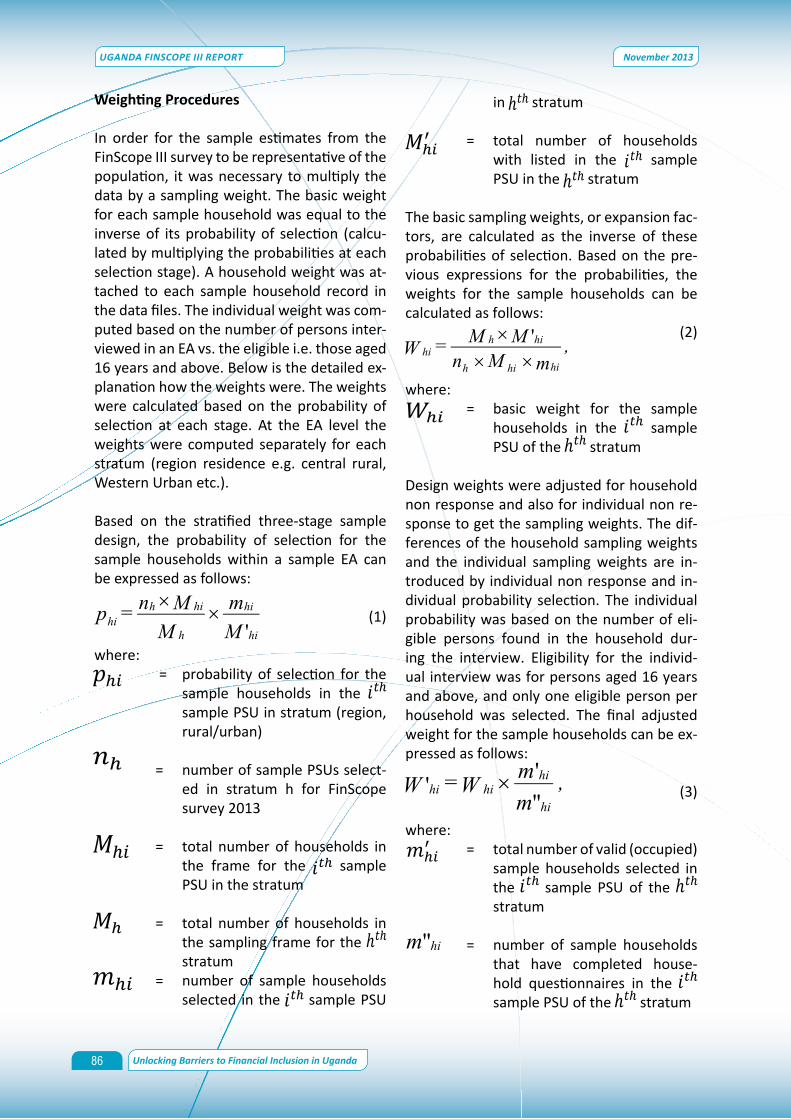
86
UGANDA FiNScope iii RepoRT
Unlocking Barriers to Financial inclusion in Uganda
November 2013
in stratum
= total number of households with listed in the sample PSU in the stratum
The basic sampling weights, or expansion fac-tors, are calculated as the inverse of these probabilities of selection. Based on the pre-vious expressions for the probabilities, the weights for the sample households can be calculated as follows: (2)
where:= basic weight for the sample
households in the sample PSU of the stratum
Design weights were adjusted for household non response and also for individual non re-sponse to get the sampling weights. The dif-ferences of the household sampling weights and the individual sampling weights are in-troduced by individual non response and in-dividual probability selection. The individual probability was based on the number of eli-gible persons found in the household dur-ing the interview. Eligibility for the individ-ual interview was for persons aged 16 years and above, and only one eligible person per household was selected. The final adjusted weight for the sample households can be ex-pressed as follows:
(3)
where:= total number of valid (occupied)
sample households selected in the sample PSU of the stratum
= number of sample households that have completed house-hold questionnaires in the sample PSU of the stratum
WeightingProcedures
In order for the sample estimates from the FinScope III survey to be representative of the population, it was necessary to multiply the data by a sampling weight. The basic weight for each sample household was equal to the inverse of its probability of selection (calcu-lated by multiplying the probabilities at each selection stage). A household weight was at-tached to each sample household record in the data files. The individual weight was com-puted based on the number of persons inter-viewed in an EA vs. the eligible i.e. those aged 16 years and above. Below is the detailed ex-planation how the weights were. The weights were calculated based on the probability of selection at each stage. At the EA level the weights were computed separately for each stratum (region residence e.g. central rural, Western Urban etc.).
Based on the stratified three-stage sample design, the probability of selection for the sample households within a sample EA can be expressed as follows:
(1)
where: = probability of selection for the
sample households in the sample PSU in stratum (region, rural/urban)
= number of sample PSUs select-ed in stratum h for FinScope survey 2013
= total number of households in the frame for the sample PSU in the stratum
= total number of households in
the sampling frame for the stratum
= number of sample households selected in the sample PSU

87
UGANDA FiNScope iii RepoRT
Unlocking Barriers to Financial inclusion in Uganda
November 2013
TableA2:R
emittan
cesan
dtran
sfers-S
ent,201
3(%
)
Ch
anne
ls us
ed to
send
mon
ey
How
ofte
n do
you
send
mon
ey?
Char
acte
ristic
Send
mon
eyCa
shBa
nkM
obile
mon
eyO
ther
s A
t Lea
st O
nce
A W
eek
Onc
e A
Mon
th Q
uart
erly
Bi-A
nnua
lly A
nnua
lly D
o n’
t Kno
w
Gen
der:
Fe
mal
e30
.550
.23.
260
.34.
47.
833
.528
.17.
713
.49.
6M
ale
41.2
38.0
6.9
74.4
5.5
11.0
34.8
28.4
9.8
7.5
8.4
Age
gro
up:
Belo
w 1
813
.978
.69.
837
.80.
02.
970
.70.
06.
00.
020
.518
-24
37.0
38.4
4.7
68.7
4.0
11.9
38.6
27.6
7.2
7.8
6.9
25-3
941
.540
.15.
772
.86.
59.
736
.227
.88.
89.
18.
340
-59
35.8
47.9
3.2
66.0
4.3
9.5
28.5
30.2
9.0
11.4
11.4
60+
18.5
62.6
10.3
42.9
0.4
2.3
19.7
31.5
15.2
22.7
8.5
Educ
ation
al a
ttai
nmen
t:N
o Fo
rmal
Edu
catio
n16
.755
.50.
547
.56.
15.
326
.531
.38.
516
.012
.4So
me
Prim
ary
26.7
53.7
2.4
51.4
2.7
6.9
28.2
26.9
11.0
14.9
12.2
Com
plet
ed P
rimar
y39
.943
.61.
869
.11.
27.
235
.225
.915
.78.
87.
1So
me
Seco
ndar
y51
.432
.03.
183
.74.
715
.936
.826
.05.
58.
17.
7O
-Lev
el +
66.7
35.5
13.0
82.4
9.5
11.2
41.1
31.6
4.8
5.2
6.1
Empl
oym
ent s
tatu
s:Se
lf Em
ploy
ed35
.746
.62.
665
.94.
49.
530
.230
.710
.310
.19.
2Pa
id E
mpl
oyee
s47
.936
.612
.176
.76.
88.
952
.120
.14.
86.
87.
3Co
ntr.
Fam
ily W
orke
r24
.842
.31.
161
.66.
111
.027
.725
.417
.89.
98.
1N
ot W
orki
ng25
.839
.48.
565
.04.
910
.123
.532
.65.
817
.610
.4W
ealth
qui
ntile
:Lo
wes
t19
.457
.91.
547
.73.
95.
222
.333
.313
.716
.09.
5Se
cond
21.5
56.2
1.4
49.8
1.3
6.0
22.4
35.6
9.2
18.7
8.1
Third
29.3
50.3
1.1
56.9
5.6
6.8
32.5
30.1
10.2
13.1
7.4
Four
th42
.041
.66.
471
.04.
112
.731
.529
.58.
210
.67.
5Fi
fth65
.833
.08.
883
.56.
911
.144
.722
.47.
23.
710
.9Pl
ace
of re
side
nce:
Rura
l29
.948
.04.
061
.23.
48.
731
.329
.99.
911
.98.
3U
rban
59.9
33.9
7.8
82.4
8.4
11.4
40.6
24.7
6.8
6.3
10.3
Regi
on:
Kam
pala
72.6
18.3
11.4
84.8
12.3
13.8
41.9
18.3
9.0
1.8
15.2
Cent
ral
47.7
33.1
3.2
77.6
2.1
8.7
31.5
30.1
13.4
8.6
7.6
East
ern
30.7
49.9
3.3
59.7
2.7
8.3
34.4
29.3
7.6
15.7
4.7
Nor
ther
n19
.554
.05.
261
.43.
79.
029
.936
.21.
616
.86.
4W
este
rn34
.657
.87.
158
.48.
610
.437
.024
.67.
47.
013
.7U
gand
a35
.6
43.5
5.2
68.0
5.0
9.
534
.228
.38.
910
.18.
9

88
UGANDA FiNScope iii RepoRT
Unlocking Barriers to Financial inclusion in Uganda
November 2013
TableA3:R
emittan
cesan
dtran
sfers–receipts,2
013(%
)
Ch
anne
ls us
ed to
rece
ive
mon
ey
How
Ofte
n Do
You
Rec
eive
Mon
ey F
rom
Out
side
Your
Hou
seho
ld?
Char
acte
ristic
Rece
ived
Cash
Bank
Mob
ile m
oney
Oth
ers
At L
east
Onc
e A
Wee
k O
nce
A M
onth
Qua
rter
ly B
i-Ann
ually
Ann
ually
Do
n’t K
now
Uga
nda
45.0
40
.55.
166
.74.
1
9.5
36.9
23.9
9.9
11.8
7.9
Gen
der:
Fe
mal
e42
.941
.02.
964
.43.
99.
839
.321
.68.
811
.68.
9M
ale
47.5
39.9
7.2
69.0
4.3
9.2
34.6
26.2
10.9
12.0
6.9
Age
gro
up:
Belo
w 1
830
.462
.42.
068
.02.
214
.854
.716
.68.
70.
05.
318
-24
47.1
39.2
5.2
64.7
5.7
7.1
40.1
23.9
10.0
10.8
8.1
25-3
949
.433
.46.
272
.84.
511
.234
.324
.110
.712
.27.
540
-59
41.7
41.4
3.2
70.2
2.7
8.0
38.1
23.2
9.4
13.1
8.2
60+
37.4
68.2
4.2
35.4
3.1
9.0
36.2
26.5
7.0
12.0
9.4
Educ
ation
al a
ttai
nmen
t:N
o Fo
rmal
Edu
catio
n31
.356
.31.
745
.13.
65.
734
.926
.611
.114
.17.
6So
me
Prim
ary
35.9
52.1
2.7
56.4
1.0
9.8
32.3
23.3
11.1
14.9
8.6
Com
plet
ed P
rimar
y49
.632
.51.
175
.41.
97.
240
.226
.011
.511
.23.
9So
me
Seco
ndar
y58
.232
.17.
872
.26.
114
.040
.520
.27.
59.
48.
4O
-Lev
el +
72.1
26.9
10.9
82.9
8.8
9.9
39.7
24.3
7.9
8.6
9.6
Empl
oym
ent s
tatu
s:Se
lf Em
ploy
ed44
.542
.14.
265
.63.
09.
132
.826
.011
.314
.06.
8Pa
id E
mpl
oyee
s53
.130
.49.
775
.58.
09.
241
.121
.96.
410
.610
.7Co
ntr.
Fam
ily W
orke
r35
.939
.21.
566
.31.
89.
553
.017
.38.
97.
43.
9N
ot W
orki
ng41
.147
.93.
758
.94.
911
.644
.819
.98.
94.
410
.4W
ealth
qui
ntile
:Lo
wes
t27
.552
.81.
247
.32.
29.
526
.524
.311
.519
.98.
3Se
cond
35.0
54.2
0.4
55.6
1.8
6.5
27.4
25.8
15.9
15.7
8.7
Third
41.8
41.5
3.8
63.3
1.7
4.6
36.5
28.2
10.5
13.9
6.4
Four
th50
.839
.12.
870
.71.
411
.238
.524
.68.
410
.66.
6Fi
fth69
.528
.911
.779
.09.
913
.045
.119
.46.
86.
29.
5Pl
ace
of re
side
nce:
Rura
l40
.844
.54.
261
.62.
38.
134
.425
.110
.913
.97.
6U
rban
62.9
29.3
7.4
80.9
9.2
13.4
44.0
20.7
7.0
6.0
9.0
Regi
on:
Kam
pala
75.7
20.7
11.0
74.9
15.8
15.9
37.9
17.6
9.1
4.0
15.4
Cent
ral
54.5
33.4
4.0
74.8
3.4
7.7
43.0
24.6
10.2
7.0
7.5
East
ern
43.0
41.6
3.8
66.4
2.1
10.7
32.9
26.5
10.9
14.7
4.4
Nor
ther
n30
.754
.64.
352
.54.
09.
832
.027
.66.
816
.27.
6W
este
rn43
.546
.95.
962
.62.
98.
136
.220
.310
.515
.19.
8

89
UGANDA FiNScope iii RepoRT
Unlocking Barriers to Financial inclusion in Uganda
November 2013
TableA4:U
seoffun
dsre
ceived
and
recipien
tin201
3,%
M
oney
rece
ived
use
d fo
r:
Who
rece
ived
mon
ey?
Char
acte
ristic
Hom
e co
n-su
mpti
onCh
ild
care
Child
edu
ca-
tion
Tran
spor
t fe
esFa
rmin
gBu
sines
s sta
rtup
/ex
pans
ion
Hom
e im
-pr
ovem
ent
Emer
genc
ies
Oth
ers
O
wn
Use
Ano
ther
Pe
rson
Bot
h
Uga
nda
62.2
24.4
30.0
5.8
15.5
13.0
5.1
18.2
3.4
82
.38.
39.
4G
ende
r:Fe
mal
e68
.129
.732
.05.
913
.110
.95.
018
.93.
381
.97.
710
.3M
ale
56.3
19.1
28.0
5.7
17.8
15.2
5.2
17.6
3.4
82.6
8.9
8.4
Age
gro
up:
Belo
w 1
860
.69.
919
.011
.114
.68.
70.
018
.99.
192
.43.
83.
718
-24
67.4
18.9
18.7
10.0
16.4
9.6
4.3
19.8
3.9
79.3
10.9
9.8
25-3
958
.929
.531
.35.
615
.016
.56.
516
.23.
281
.98.
210
.040
-59
60.1
22.8
41.9
2.6
15.1
14.4
4.3
18.6
2.8
84.0
8.2
7.8
60+
71.8
19.0
23.8
4.1
16.6
2.3
3.0
23.4
3.0
84.3
5.0
10.7
Educ
ation
al a
ttai
nmen
t:N
o Fo
rmal
Edu
catio
n70
.522
.131
.31.
716
.26.
01.
924
.52.
885
.95.
68.
5So
me
Prim
ary
62.6
28.9
30.8
3.5
16.8
9.5
3.9
18.7
4.8
82.6
8.0
9.4
Com
plet
ed P
rimar
y56
.421
.531
.65.
017
.811
.34.
118
.73.
485
.86.
87.
3So
me
Seco
ndar
y60
.522
.029
.86.
49.
617
.59.
216
.32.
580
.710
.78.
6O
-Lev
el +
62.2
22.9
27.5
11.3
15.3
19.8
6.5
15.2
2.3
78.5
9.8
11.6
Empl
oym
ent s
tatu
s:Se
lf Em
ploy
ed60
.324
.730
.82.
717
.216
.04.
817
.43.
685
.87.
66.
5Pa
id E
mpl
oyee
s63
.425
.830
.58.
414
.210
.27.
218
.23.
573
.912
.213
.9Co
ntr.
Fam
ily W
orke
r63
.024
.532
.93.
813
.34.
66.
211
.22.
772
.65.
222
.1N
ot W
orki
ng69
.021
.124
.817
.69.
35.
93.
424
.92.
779
.97.
512
.6W
ealth
qui
ntile
:Lo
wes
t61
.436
.327
.93.
524
.810
.05.
723
.84.
182
.69.
08.
4Se
cond
65.6
27.7
32.6
2.7
18.0
2.7
4.5
22.8
4.4
82.3
7.8
9.9
Third
62.5
22.2
36.3
3.5
17.8
10.8
3.0
13.4
3.5
76.7
11.0
12.2
Four
th60
.422
.029
.15.
015
.614
.26.
618
.72.
985
.27.
17.
7Fi
fth62
.121
.526
.010
.58.
920
.15.
316
.62.
883
.57.
68.
9Pl
ace
of re
side
nce:
Rura
l62
.425
.030
.24.
217
.910
.24.
418
.13.
683
.17.
69.
3U
rban
61.6
22.7
29.5
10.4
8.6
20.9
7.1
18.6
2.6
80.0
10.5
9.5
Regi
on:
Kam
pala
63.7
22.6
26.5
14.0
1.6
18.1
4.3
17.3
0.3
74.9
16.6
8.4
Cent
ral
60.5
20.0
26.0
4.7
13.8
12.3
3.3
18.5
1.9
88.8
6.6
4.6
East
ern
70.7
25.1
27.8
5.9
12.9
9.7
3.2
10.9
6.1
80.8
10.8
8.4
Nor
ther
n74
.036
.237
.94.
930
.910
.613
.128
.03.
581
.08.
810
.2W
este
rn47
.922
.633
.84.
616
.017
.04.
620
.03.
5
78.8
4.8
16.4

90
UGANDA FiNScope iii RepoRT
Unlocking Barriers to Financial inclusion in Uganda
November 2013


www. eprc.or.ugTWITTER: @EPRC_officialwww.facebook.com/EPRCUgandaeprcuganda.blogspot.com
Economic Policy Research CentrePlot 51, Pool Road, Makerere University CampusP.O. Box 7841, Kampala, UgandaTel: +256-414-541023/4Fax: +256-414-541022Email: [email protected]