Ueda2016 symposium -t2 dm management - lobna el toony
71
-
Upload
ueda2015 -
Category
Health & Medicine
-
view
191 -
download
0
Transcript of Ueda2016 symposium -t2 dm management - lobna el toony


2
T2DM Management …..
In search for an ideal anti-diabetic agent
LOBNA F ELTOONY Head Of Internal Medicine Department
Assiut University
Faculty Of Medicine

3
Diabetes is a huge and growing problem, and the costs
to society are high and escalating
382 million people have diabetes
By 2035, this number will rise to 592 million
Ref. IDF atlas 06, 2013

4

5
6

7
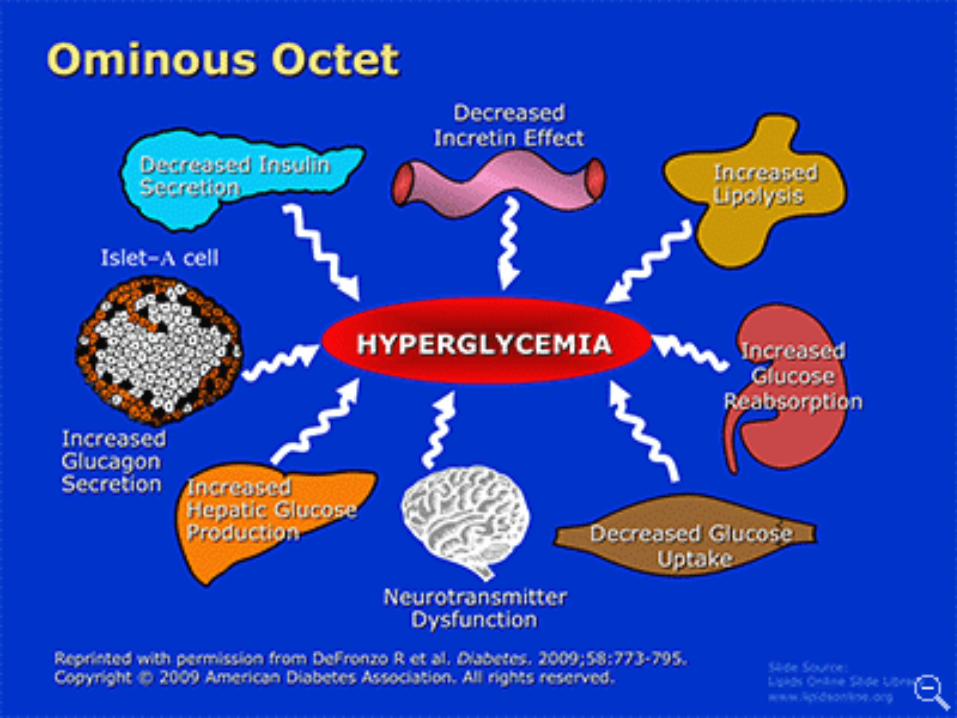
Complex Physiology Complex Management
Insulin resistance
Years of diabetes
Beta-cell failure
Insulin output
0
100
200
300
–10 –5 0 5 10 15 20 25 30
Rel
ativ
e
-cel
l
func
tion
(%)
At risk for
diabetes
Fasting glucose
50100
200
300
Glu
cose
(m
g/dL
)
Post-meal glucose
Lifestyle InsulinSFU, glitinides, exenatide
Metformin, TZDs, AGIs, DPP4 AGI: alpha glucosidase inhibitorSFU: sulfonylurea
8

9
Microvascular
complications
Myocardial
infarction
HbA1c
14%
Lowering HbA1c reduces the risk of Diabetes complications
37%
1%
Diabetes related
death
Peripheral Vascular
Disease
21%
43%
UKPDS
UKPDS = UK Prospective Diabetes Study; randomized patients received either conventional glucose control (primarily based on diet) or intensive glucose control (sulfonylurea or insulin). aP<0.0001. Stratton IM et al. BMJ. 2000;321:405–412.

10
Diabetes management guidelines:
a sense of urgency
HbA1c “... the results of the UKPDS
mandate that treatment of type 2 diabetes include
aggressive efforts to lower blood glucose levels as close to
normal as possible”
“Diabetes must be… diagnosed earlier.
And once diagnosed, all types of
diabetes must then be managed
much more aggressively”
American Diabetes Association1
Canadian Diabetes Association2
1American Diabetes Association. Diabetes Care 2003; 26:S28–S32.
2Canadian Diabetes Association. Can J Diabetes 2003; 27 (Suppl. 2):S1–S152.
11

12
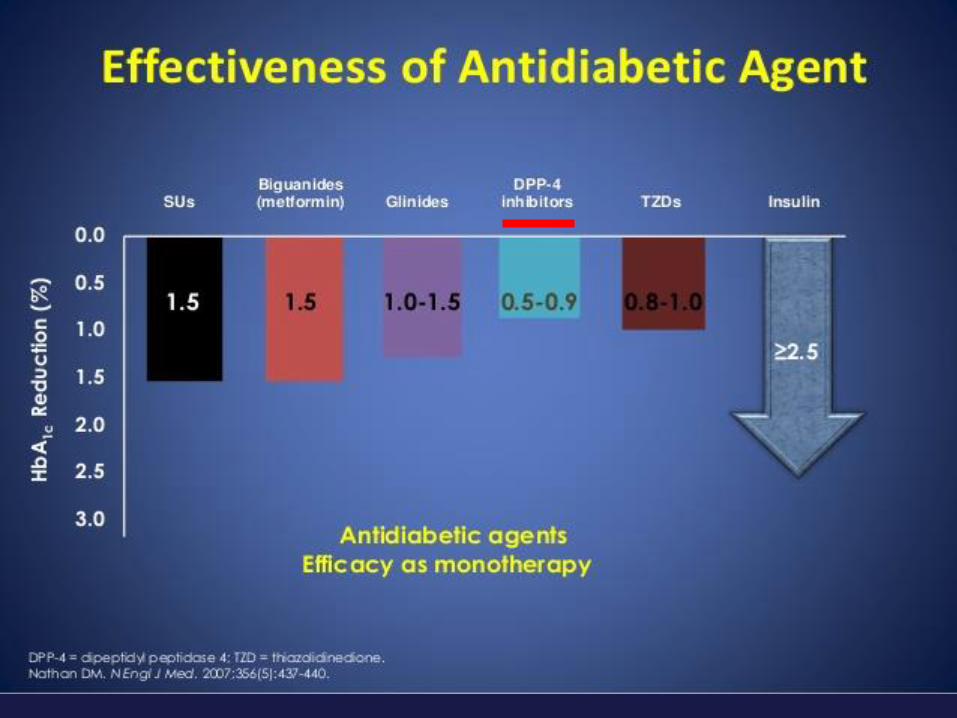
All Anti Diabetic agents are effective
but the Important Question is How this efficacy comes?
12
13
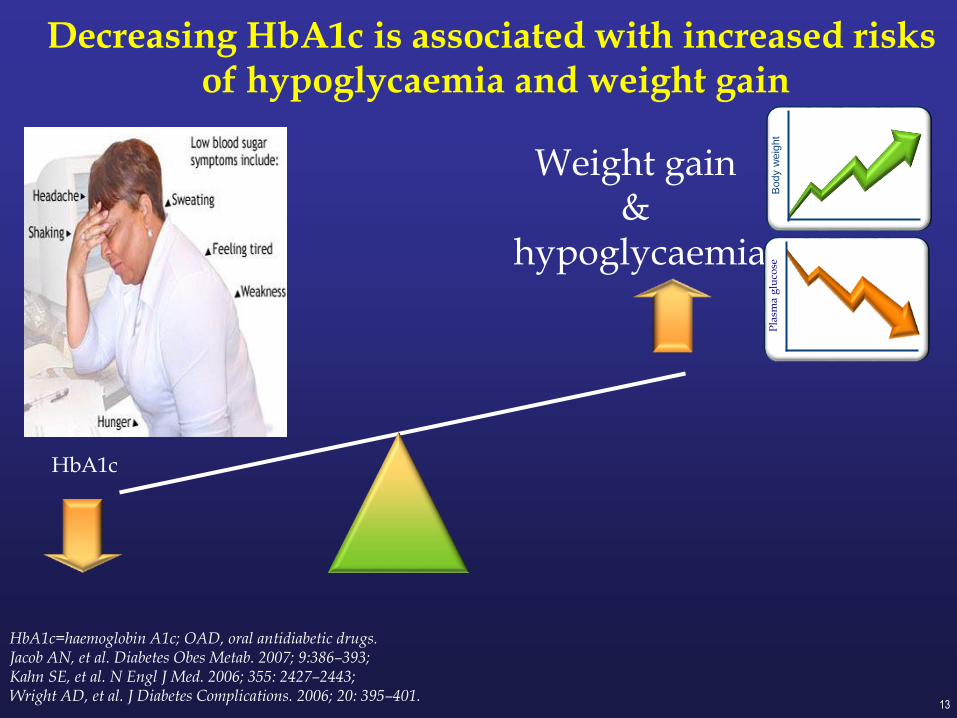
HbA1c=haemoglobin A1c; OAD, oral antidiabetic drugs.Jacob AN, et al. Diabetes Obes Metab. 2007; 9:386–393;Kahn SE, et al. N Engl J Med. 2006; 355: 2427–2443;Wright AD, et al. J Diabetes Complications. 2006; 20: 395–401.
Decreasing HbA1c is associated with increased risks of hypoglycaemia and weight gain
Weight gain &
hypoglycaemia
Body w
eig
ht
HbA1c
Pla
sma
glu
cose

14
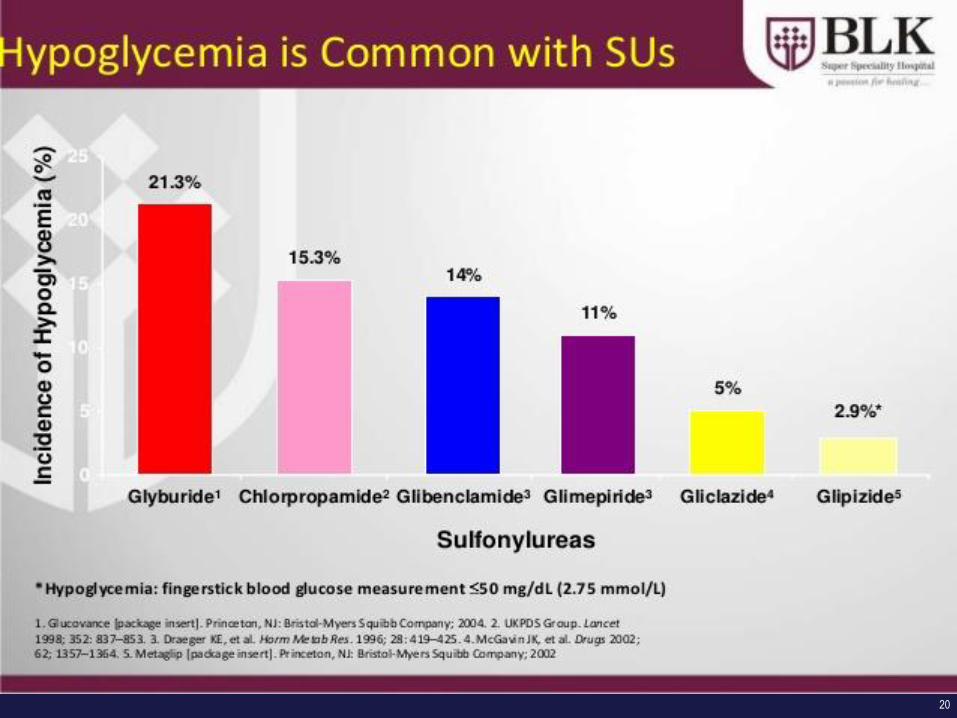
Hypoglycaemia
1Briscoe VJ, et al. Clin Diabetes 2006;24:115–21;2Cryer PE. Diabetologia 2002;45:937–48
A major limiting factor to achieve intensive
glycaemic control in people with T2DM1
Hypoglycaemia makes clinicians less likely
to implement glycaemic targets2
15
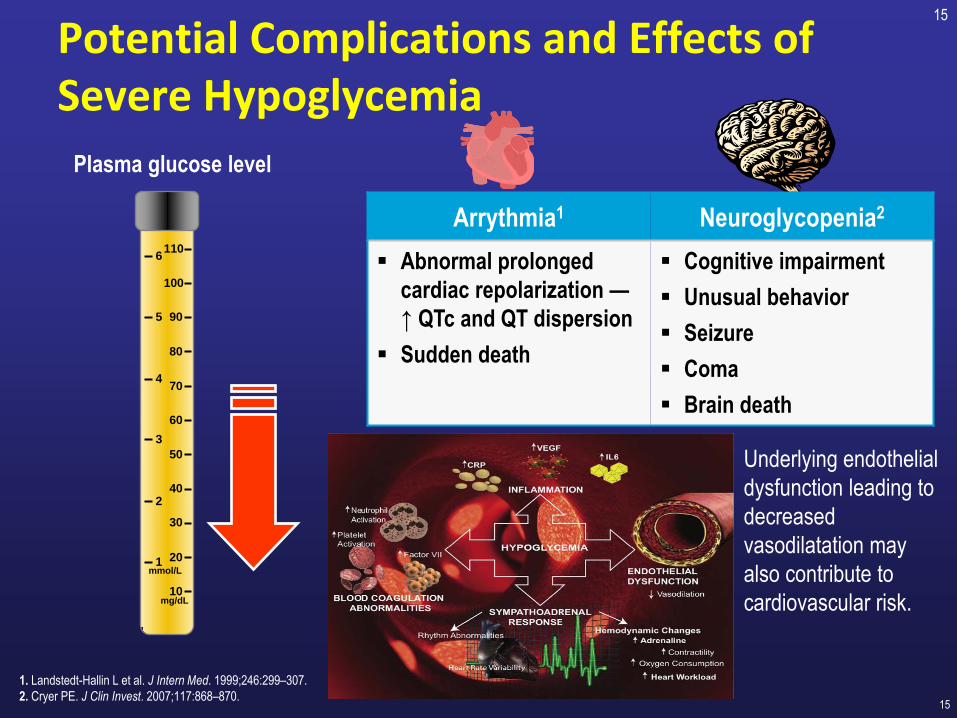
Potential Complications and Effects of Severe Hypoglycemia
15
Plasma glucose level
10
20
30
40
50
60
70
80
90
100
110
1
2
3
4
5
6
mg/dL
mmol/L
1. Landstedt-Hallin L et al. J Intern Med. 1999;246:299–307.
2. Cryer PE. J Clin Invest. 2007;117:868–870.
Arrythmia1 Neuroglycopenia2
Abnormal prolonged
cardiac repolarization —
↑ QTc and QT dispersion
Sudden death
Cognitive impairment
Unusual behavior
Seizure
Coma
Brain death
Underlying endothelial
dysfunction leading to
decreased
vasodilatation may
also contribute to
cardiovascular risk.

16
17
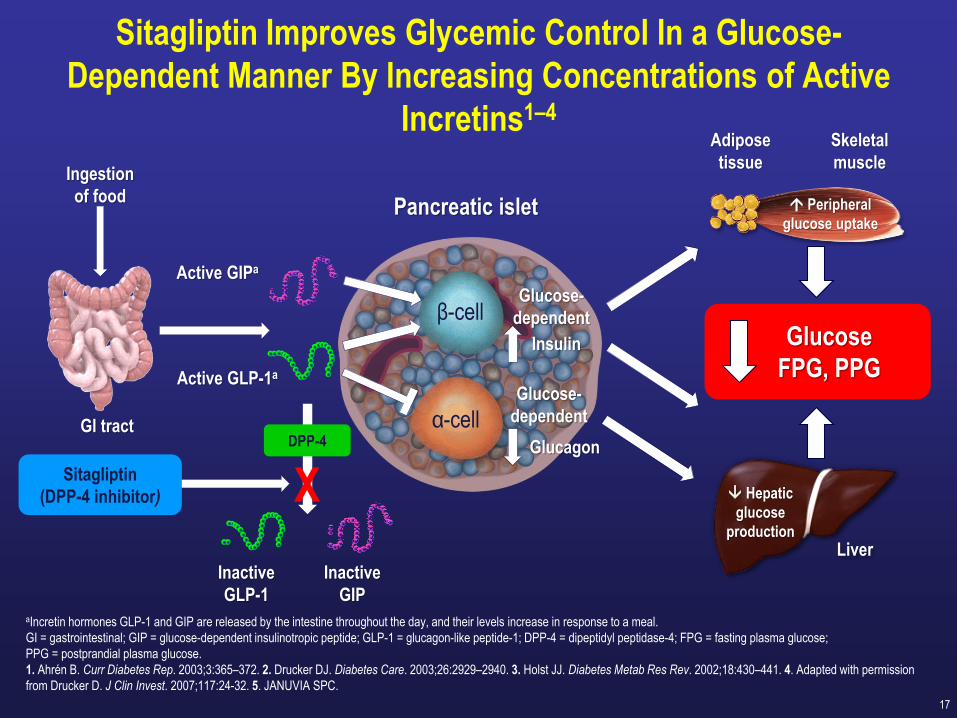
Sitagliptin Improves Glycemic Control In a Glucose-
Dependent Manner By Increasing Concentrations of Active
Incretins1–4
aIncretin hormones GLP-1 and GIP are released by the intestine throughout the day, and their levels increase in response to a meal.
GI = gastrointestinal; GIP = glucose-dependent insulinotropic peptide; GLP-1 = glucagon-like peptide-1; DPP-4 = dipeptidyl peptidase-4; FPG = fasting plasma glucose;
PPG = postprandial plasma glucose.
1. Ahrén B. Curr Diabetes Rep. 2003;3:365–372. 2. Drucker DJ. Diabetes Care. 2003;26:2929–2940. 3. Holst JJ. Diabetes Metab Res Rev. 2002;18:430–441. 4. Adapted with permission
from Drucker D. J Clin Invest. 2007;117:24-32. 5. JANUVIA SPC.
Sitagliptin
(DPP-4 inhibitor)
Ingestion
of food
GlucagonGI tract
Inactive
GLP-1
Insulin
Glucose-
dependent
Pancreatic islet
Inactive
GIP
α-cell
β-cell
Glucose-
dependent
Hepatic
glucose
production
Liver
Glucose
FPG, PPG
DPP-4
Active GLP-1a
Active GIPa
X
Skeletal
muscle
Peripheral
glucose uptake
Adipose
tissue
18

19
20
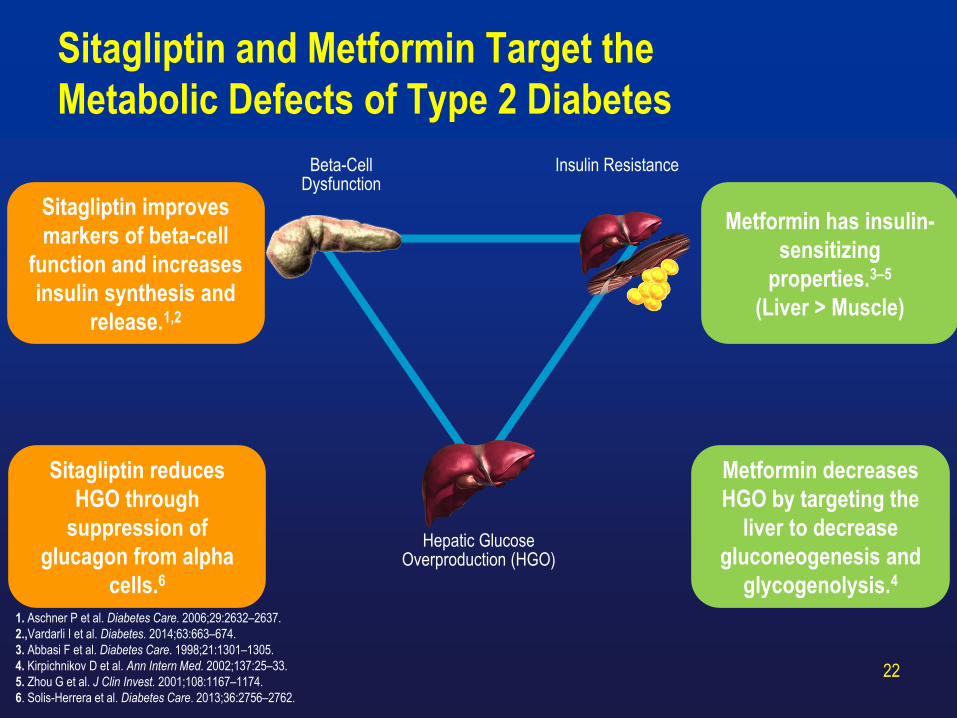
Sitagliptin and Metformin Target the
Metabolic Defects of Type 2 Diabetes
22
1. Aschner P et al. Diabetes Care. 2006;29:2632–2637.
2.,Vardarli I et al. Diabetes. 2014;63:663–674.
3. Abbasi F et al. Diabetes Care. 1998;21:1301–1305.
4. Kirpichnikov D et al. Ann Intern Med. 2002;137:25–33.
5. Zhou G et al. J Clin Invest. 2001;108:1167–1174.
6. Solis-Herrera et al. Diabetes Care. 2013;36:2756–2762.
Beta-Cell Dysfunction
Hepatic Glucose Overproduction (HGO)
Insulin Resistance
Sitagliptin improves
markers of beta-cell
function and increases
insulin synthesis and
release.1,2
Sitagliptin reduces
HGO through
suppression of
glucagon from alpha
cells.6
Metformin decreases
HGO by targeting the
liver to decrease
gluconeogenesis and
glycogenolysis.4
Metformin has insulin-
sensitizing
properties.3–5
(Liver > Muscle)

Initial Fixed-Dose Combination Therapy With JANUMET™ vs Metformin
Monotherapy: Change from Baseline in HbA1c by Baseline HbA1c at Week
18
FAS=full analysis set; FDC=fixed-dose combination.
1. Reasner C et al. Poster presented at: American Diabetes Association 69th Scientific Sessions. New Orleans, LA. June 5–9, 2009.
2. Data on file, MSD.
Hb
A1c
LS
Mea
n C
han
ge
fro
m B
ase
lin
e, %
Baseline HbA1c,% <8 ≥8 and <9 ≥9 and <10 ≥10 and <11 ≥11
FAS (Week 18)
P=0.009
P<0.001
P<0.001
Mean HbA1c,% 7.6 8.4 9.5 9.4 10.4 12.2
n=
–1.1
–1.6
–2.0
–2.9–2.7
–2.1
–1.7
–1.1
–0.8
–4.0
–3.5
–3.0
–2.5
–2.0
–1.5
–1.0
–0.5
0
Sitagliptin/metformin FDC
Metformin
99 95 99 11187 101 124 109 150 148
P=0.158
P=0.111
–3.6
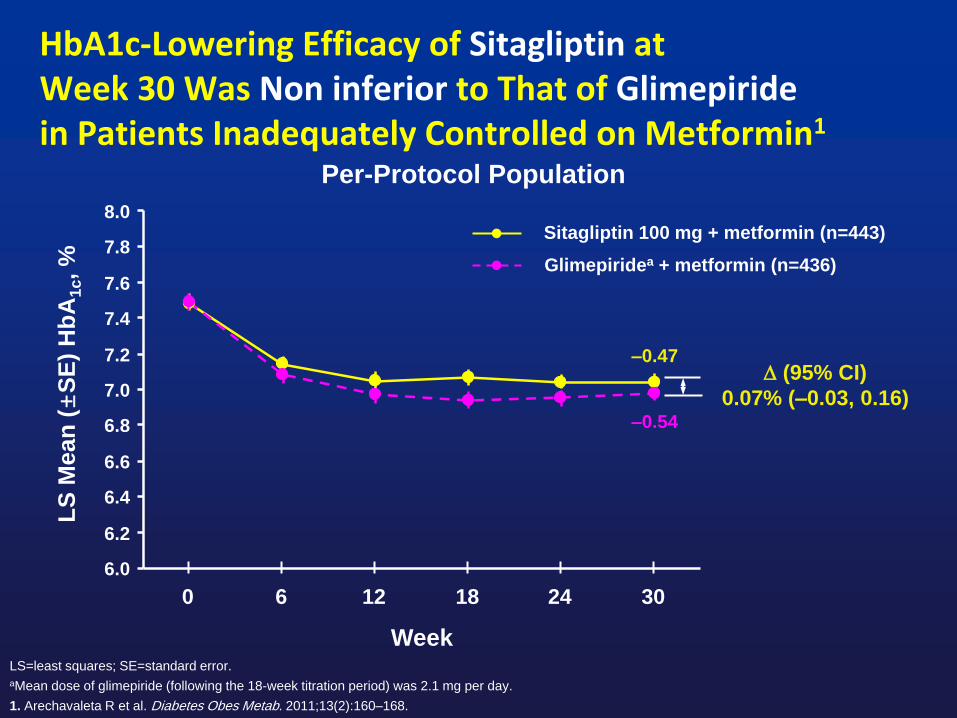
HbA1c-Lowering Efficacy of Sitagliptin atWeek 30 Was Non inferior to That of Glimepiridein Patients Inadequately Controlled on Metformin1
LS=least squares; SE=standard error.
aMean dose of glimepiride (following the 18-week titration period) was 2.1 mg per day.
1. Arechavaleta R et al. Diabetes Obes Metab. 2011;13(2):160–168.
Week
LS
Mean
(±
SE
) H
bA
1c, %
Per-Protocol Population
6.0
6.2
6.4
6.6
6.8
7.0
7.2
7.4
7.6
7.8
8.0
0 6 12 18 24 30
(95% CI)
0.07% (–0.03, 0.16)
Sitagliptin 100 mg + metformin (n=443)
Glimepiridea + metformin (n=436)
–0.47
–0.54

Sitagliptin Was Associated With a Lower Incidence of
Hypoglycemia and Reduced Body Weight vs Glimepiride1
26
Hypoglycemia Over 30 Weeks Body Weight Change at Week 30
APaT=all patients as treated; CI=confidence interval; LS=least-squares.aMean dose of glimepiride (following the 18-week titration period) was 2.1 mg per day.
1. Arechavaleta R et al. Diabetes Obes Metab. 2011;13:160–168.
2. Data on file, MSD.
Pat
ien
ts W
ith
≥1
Hyp
og
lyce
mic
Ep
iso
de,
%
LS
Mea
n (
95%
CI)
Ch
ang
e in
Bo
dy
Wei
gh
t F
rom
Bas
elin
e, k
g
n=516 n=518
All patients inadequately controlled on metformin monotherapy (≥1500 mg/day)
(APaT Population)
(95% CI)
–15.0% (–19.3, –10.9) (P<0.001)
Sitagliptin 100 mg + metformin
Glimepiridea + metformin
= –2.0 kg
(P<0.001)
n=461
n=465

ODYSSÉE: HbA1c Over Time Until
Modification of Combination Therapy1
Sitagliptin + metformin SU + metforminLS=least square; SD=standard deviation; SU=sulfonylurea.
1. Valensi P et al. American Diabetes Association 2014. Abstract 136-LB.
6.4
6.6
6.8
7.0
7.2
7.4
7.6
7.8
Inclusion 6 12 18 24 30 36
LS M
ean
HbA
1c±
SD
, %
n=1735
n=678
n=1,263
n=490
n=1,089
n=370
n=921
n=286
n=793
n=245
n=688
n=206
n=592
n=190
LS Mean Change in HbA1c:
~ –0.6 in both groups
7.7
7.5
7.3
7.1
6.9
6.7
6.5
Time, months
27
Gliclazide was the most
commonly prescribed SU (54%)
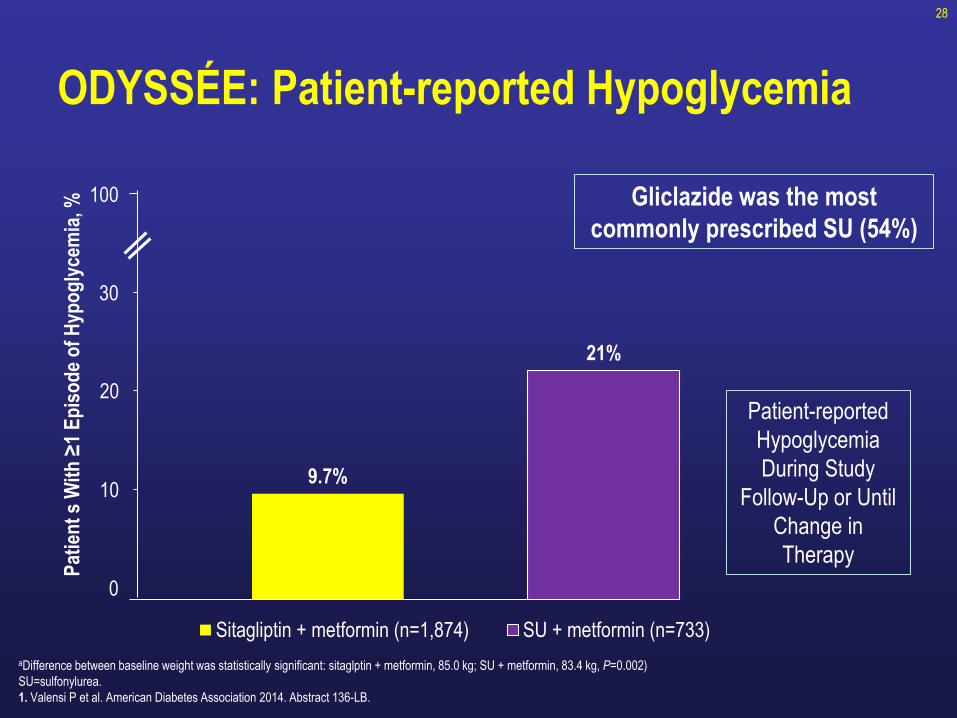
ODYSSÉE: Patient-reported Hypoglycemia
28
aDifference between baseline weight was statistically significant: sitaglptin + metformin, 85.0 kg; SU + metformin, 83.4 kg, P=0.002)
SU=sulfonylurea.
1. Valensi P et al. American Diabetes Association 2014. Abstract 136-LB.
100
30
20
10
0
9.7%
21%
Pat
ien
t s
Wit
h ≥
1 E
pis
od
e o
f H
ypo
gly
cem
ia, %
Sitagliptin + metformin (n=1,874) SU + metformin (n=733)
Patient-reported
Hypoglycemia
During Study
Follow-Up or Until
Change in
Therapy
Gliclazide was the most
commonly prescribed SU (54%)

Durability 29

30

Sitagliptin and -cell mass
Mu J. et al. Eur J Pharm 2009; 623: 148-154
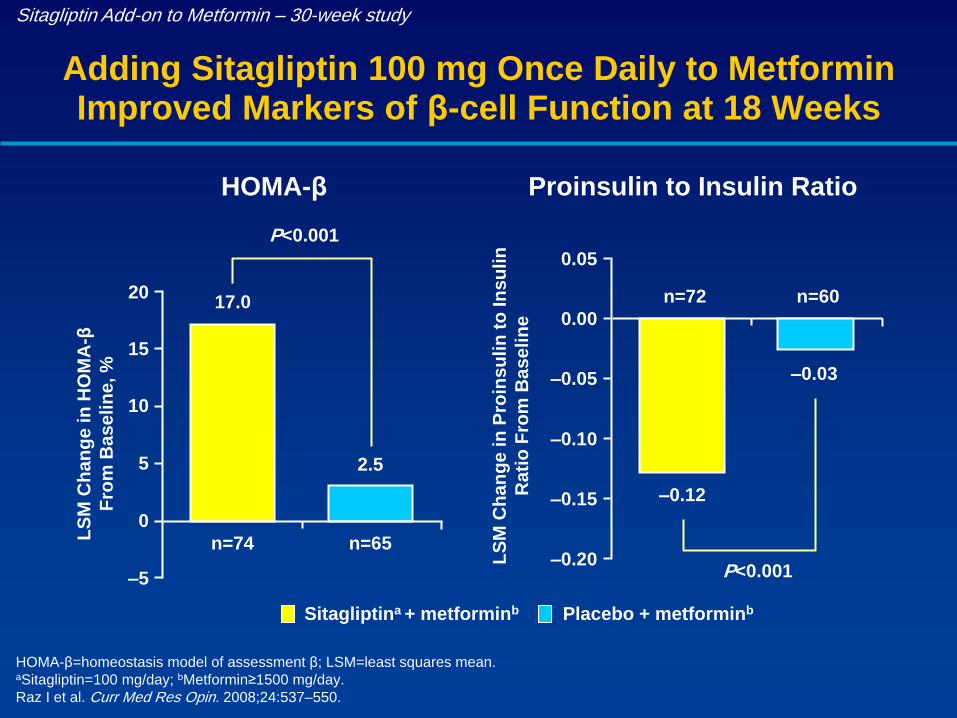
Sitagliptin Add-on to Metformin – 30-week study
Adding Sitagliptin 100 mg Once Daily to Metformin Improved Markers of β-cell Function at 18 Weeks
HOMA-β=homeostasis model of assessment β; LSM=least squares mean.aSitagliptin=100 mg/day; bMetformin≥1500 mg/day.
Raz I et al. Curr Med Res Opin. 2008;24:537–550.
LS
M C
han
ge in
Pro
insu
lin
to
In
su
lin
Rati
o F
rom
Base
lin
e
Proinsulin to Insulin Ratio
P<0.001
17.0
2.5
–5
0
5
10
15
20
LS
M C
han
ge in
HO
MA
-β
Fro
m B
ase
lin
e, %
Sitagliptina + metforminb Placebo + metforminb
HOMA-β
P<0.001
–0.12
–0.03
–0.20
–0.15
–0.10
–0.05
0.00
0.05
n=74 n=65
n=72 n=60

33
P.Valensi et al. Treatment Maintenance Duration of Dual Therapy with Metformin and Sitagliptin in Type 2 Diabetes: The Odyssee
Observational Study. Diabetes 63(S1): LB-35 Abst 136-LB 2014 Jun 13-17 2014 - ADA 2014 74th American Diabetes Association
Scientific Sessions, San Francisco, California Abst: 136-LB
ODYSSÉE Study: Results…
Treatment maintenance duration until treatment modification
MetSita group : 43.2 months [95%CI: 41.4 – NE*]
MetSU group : 20.2 months [95%CI: 17.0 - 25.1]
Pro
po
rtio
n o
f P
ati
en
ts m
ain
tain
ed
*non-evaluable

34
The natural course of HbA1c
Ferrannini et al. J Clin Endocrinol Metab 2005

35
TECOS CV Safety Trial:
Time-to-Initiation of Insulin Therapy1
Intention-to-Treat Populationa
Sitagliptin
N=5,608
Placebo
N=5,655 HR (95% CI) P-value
Initiation of insulin ,
n (%); rate per 100 patient-years
542 (9.7)
3.44
744 (13.2);
4.850.70 (0.63, 0.79) <0.001
Intention-to-Treat Populationa Sitagliptin Placebo
Cumulative incidence of events, % (95% CI) N=5,608 N=5,655
1 year 3.2 (2.77, 3.72) 4.8 (4.29, 5.43)
2 years 6.4 (5.75, 7.07) 9.7 (8.93, 10.53)
3 years 9.8 (8.96, 10.71) 14.1 (13.09, 15.12)
4 years 13.2 (12.09, 14.50) 17.5 (16.27, 18.89)
aIn patients not receiving insulin at baseline
TECOS = Trial Evaluating Cardiovascular Outcomes With Sitagliptin; CV = cardiovascular; HR = hazard ratio; CI = confidence interval.
1. Green JB et al. [published online ahead of print June 8, 2015] N Engl J Med. doi: 10.1056/NEJMoa1501352.
30%

36
June 2015
Inzucchi et al published online: 22 JUN 2015Diabetes, Obesity and Metabolism 2015
Study Overview…
This study provides insight about different oral treatment regimens
and their possible effect on initiation of insulin under real-world
conditions.
Real-world research is an important complement to clinical trials as
we seek to improve patient health outcomes.
The objectives of the study were to assess:
• The differences in time to initiation of insulin use.
• The proportion of the population initiating insulin among patients
taking the combination of JANUVIA and metformin, and patients
taking the combination of a sulfonylurea and metformin.Inzucchi et al published online: 22 JUN 2015Diabetes, Obesity and Metabolism 2015
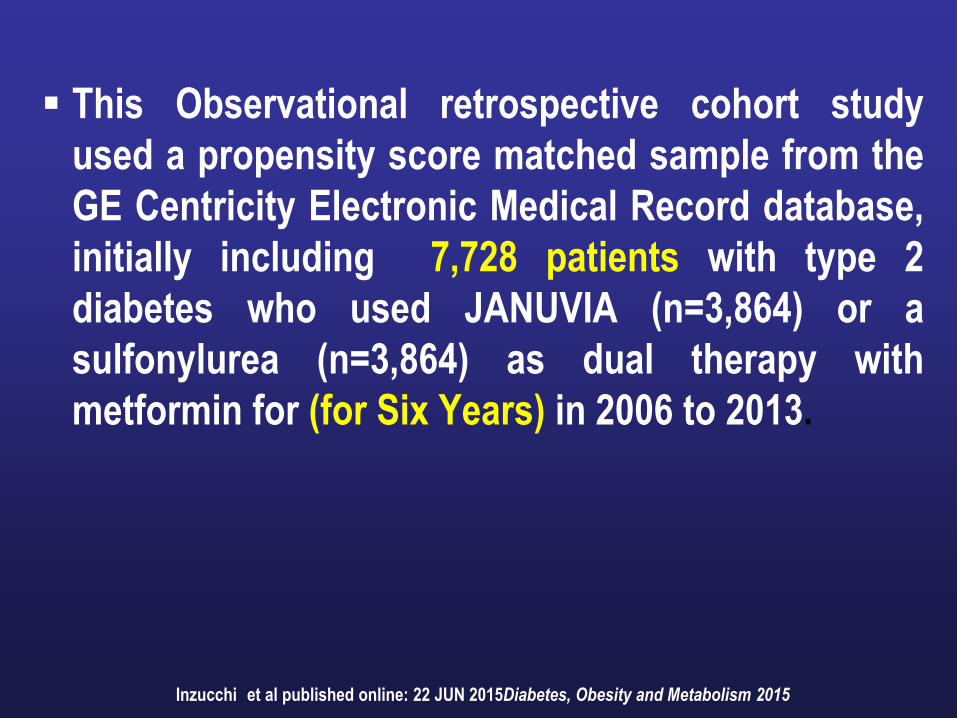
This Observational retrospective cohort study
used a propensity score matched sample from the
GE Centricity Electronic Medical Record database,
initially including 7,728 patients with type 2
diabetes who used JANUVIA (n=3,864) or a
sulfonylurea (n=3,864) as dual therapy with
metformin for (for Six Years) in 2006 to 2013.
Inzucchi et al published online: 22 JUN 2015Diabetes, Obesity and Metabolism 2015

Results…
Results from a late-breaking observational study showed that patients with type 2 diabetes treated
with JANUVIA progressed more slowly to insulin than patients taking a sulfonylurea
(p=0.0034).
This Analysis indicated that at year six, patients in the JANUVIA group were 24 percent
less likely to initiate insulin during the period of observation compared to patients taking a
sulfonylurea (p=0.0011).Inzucchi et al published online: 22 JUN 2015Diabetes, Obesity and Metabolism 2015
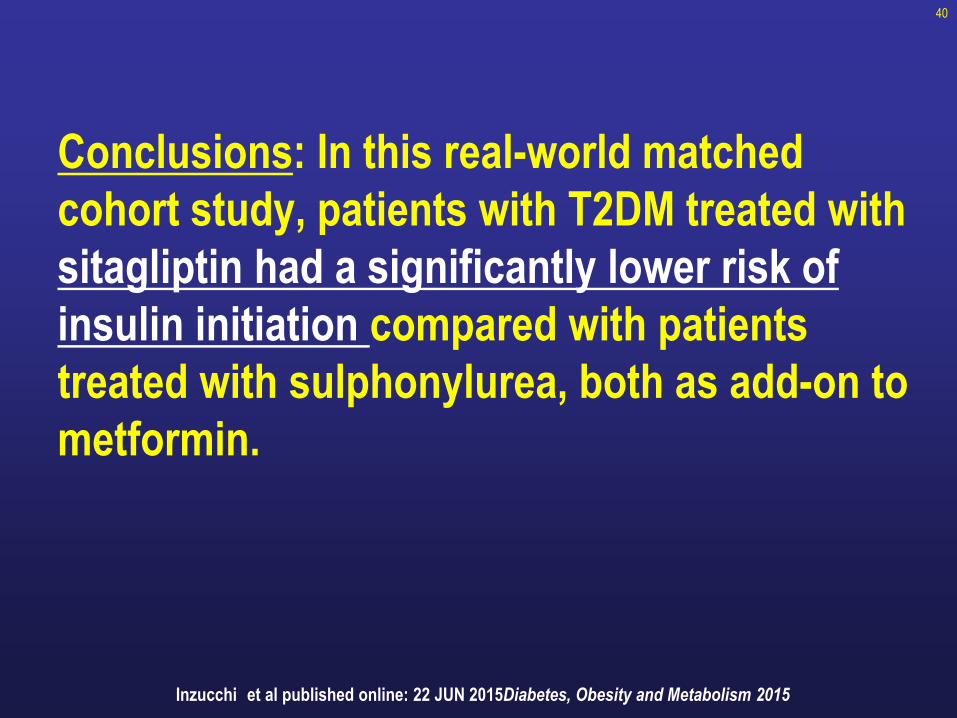
Conclusions: In this real-world matched
cohort study, patients with T2DM treated with
sitagliptin had a significantly lower risk of
insulin initiation compared with patients
treated with sulphonylurea, both as add-on to
metformin.
40
Inzucchi et al published online: 22 JUN 2015Diabetes, Obesity and Metabolism 2015

Why Sitagliptin? Uniqueness
41

Sitagliptin
Molecular structure
Half Life (T1/2) 12.4 hrs
DPP-4 Inhibition* post 24 hrs 100mg QD 80-97% @ 24hrs
DPP-4 Peak Inhibition ~97%
Selectivity for DPP-IV vs. DPP-8/DPP-9*2600 fold for DPP4 vs. DPP-8
10,000 fold for DPP4 vs. DPP-9
Selectivity High
Metabolism ~16% metabolized
Bioavailability ~87%
Liver Monitoring NO
Elimination
Kidney (87%)
79% mostly unchanged
Liver (13%)
FDA YES
* All use different proprietary assays with different dilutions and therefore % DPP-4 inhibition cannot be compared across assays
Data on file, MSD
F
F
F ON
NH2
N NN
CF3

Why Sitagliptin? Safety Profile
43

In search for an Ideal anti diabetic
medication
There is a strong clinical need to find glucose lowering agent that are , at a
minimum , safe ………

Meglitinide
Sulfonylureas
Hypoglycemia
Biguanides
α-Glucosidaseinhibitors
GI disturbance
Sulfonylureas
Meglitinides
Thiazolidinediones
Weight gain
Major Concerns
with Hypoglycemic Agents
Glycemic Variability
Cardiovascular safety of OADs?


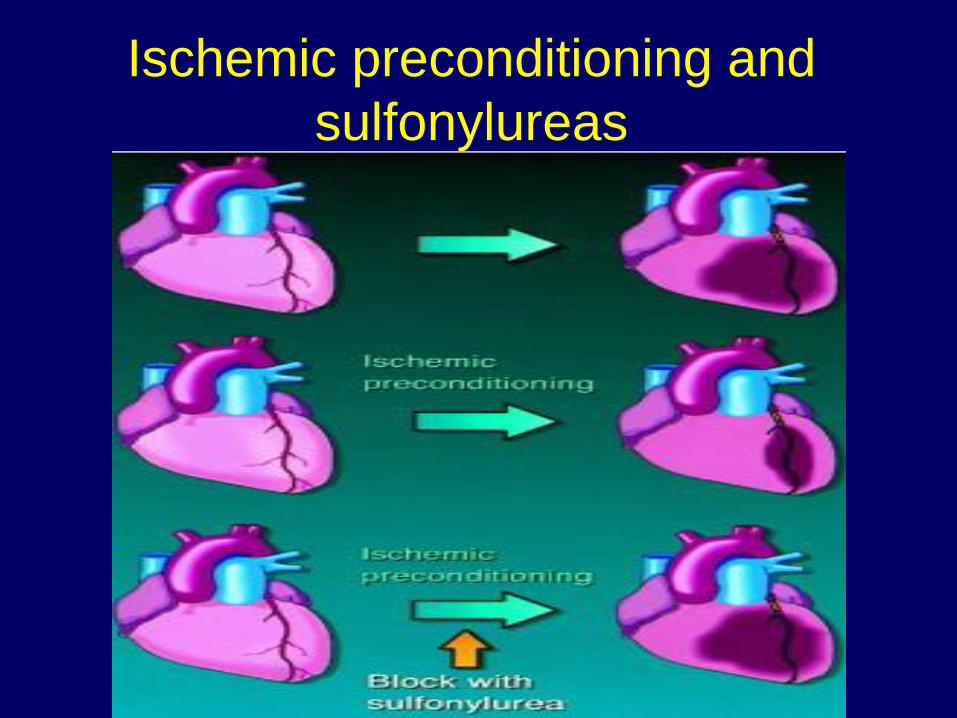
Ischemic preconditioning and
sulfonylureas

TZD
52

GLP-1 Actions on the Heart:
Direct or Indirect?
Ussher J, Drucker DJ, Endocrine Rev. 2012 Apr;33(2):187-215.

1. Golden SH. Am J Cardiol 2011;108 (Suppl):59B-67B2. Fonseca V. Am J Cardiol 2011;108 (supp):52B–58Bl
3. Clinicaltrials.gov
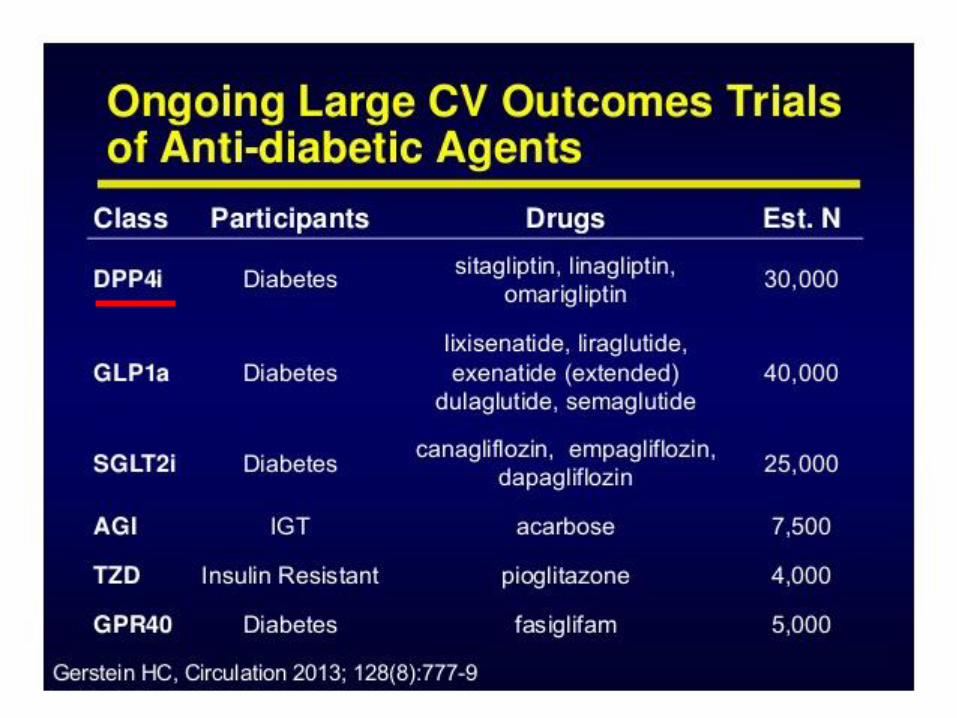
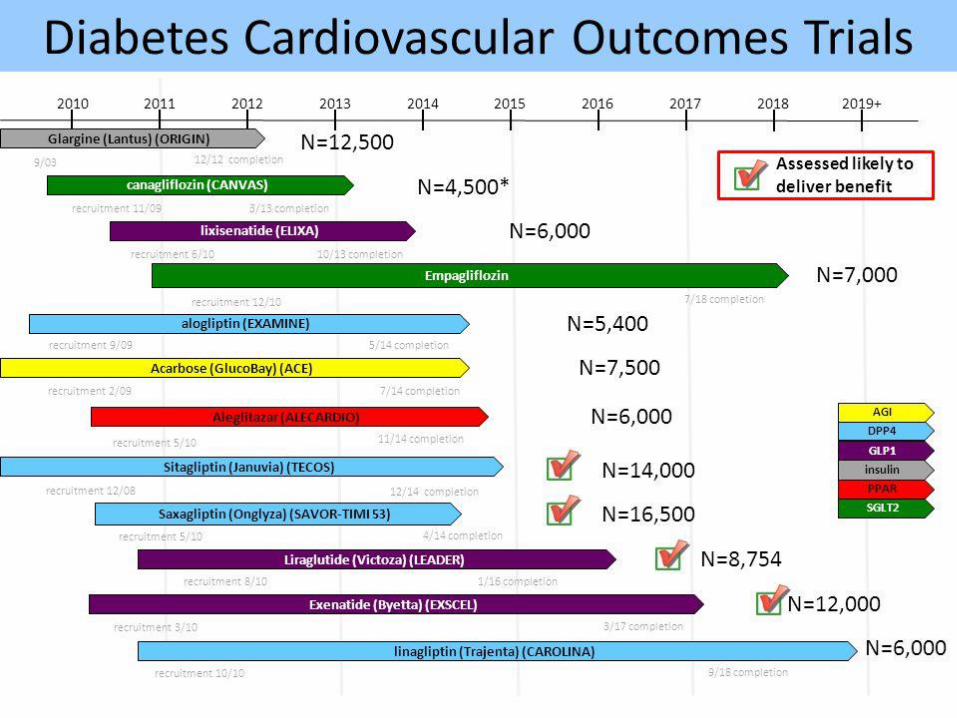
Therapies N Population Endpoints Results
TECOS Sitagliptin/ Placebo
14,000 Established CVD CV death, NF MI or CVA, unstableangina hospital.
Dec 2014
SAVOR-TIMI 53 Saxagliptin/ Placebo
16,5003 CVD or ≥ 2 RF CV death, NF MI or ischemicstroke
June 2014
CAROLINA Linagliptin/ Glimepiride
6000 CVD or ≥ 2 RF CV death, NF MI or CVA, unstableangina hospital.
Sept 2018
LEADER Liraglutide/ Placebo
8754 CVD, PAD, CKD, CHF or RF if >60yrs
CV death, NF MI or stroke, revasc
Jan 2016
EXSCEL Exenatide LAR/Placebo
9500 Not specified CV death, NF MI or stroke
Mar 2017
Ongoing Cardiovascular Outcome Trials:DPP-4 Inhibitors and GLP-1 Agonists

57
TECOS CV Safety Trial:Trial Evaluating Cardiovascular Outcomes With Sitagliptin
To assess the long-term CV safety of adding sitagliptin to
usual care, as compared with usual care alone, in patients
with type 2 diabetes and established CV disease
TECOS = Trial Evaluating Cardiovascular Outcomes With Sitagliptin; CV = cardiovascular.
1. Green JB et al. [published online ahead of print June 8, 2015] N Engl J Med. doi: 10.1056/NEJMoa1501352.
Usual care defined as care provided by patient’s physicians based on local and
institutional practice and regional guidelines, and included continuation of existing
therapy at baseline and adjustment of open-label therapy as required during study
Primary Objective1
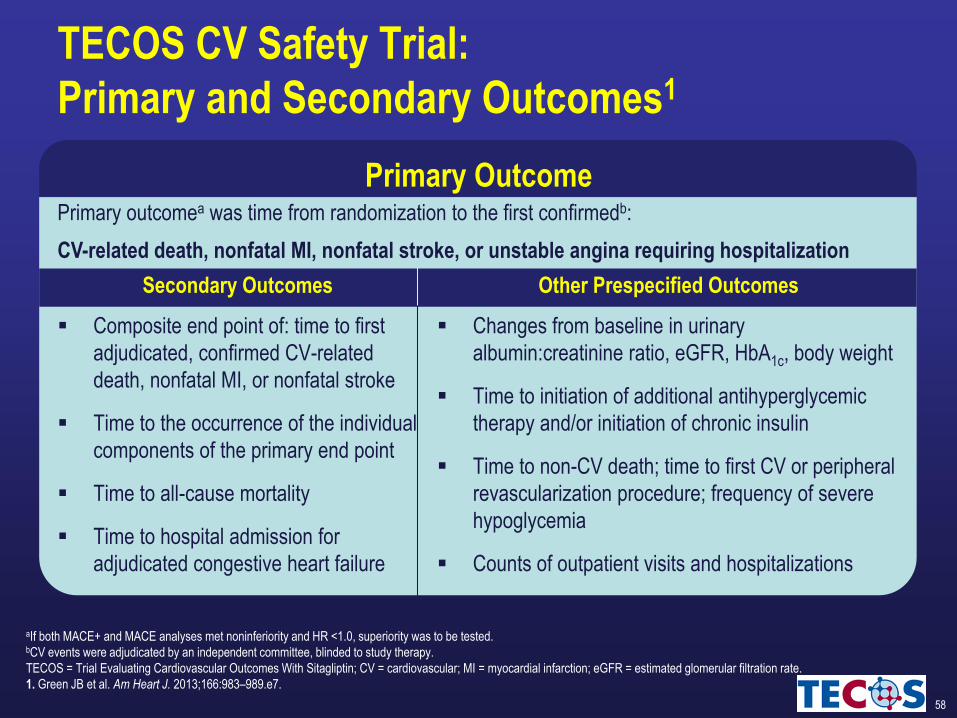
58
Primary OutcomePrimary outcomea was time from randomization to the first confirmedb:
CV-related death, nonfatal MI, nonfatal stroke, or unstable angina requiring hospitalization
Secondary Outcomes Other Prespecified Outcomes
Composite end point of: time to first
adjudicated, confirmed CV-related
death, nonfatal MI, or nonfatal stroke
Time to the occurrence of the individual
components of the primary end point
Time to all-cause mortality
Time to hospital admission for
adjudicated congestive heart failure
Changes from baseline in urinary
albumin:creatinine ratio, eGFR, HbA1c, body weight
Time to initiation of additional antihyperglycemic
therapy and/or initiation of chronic insulin
Time to non-CV death; time to first CV or peripheral
revascularization procedure; frequency of severe
hypoglycemia
Counts of outpatient visits and hospitalizations
aIf both MACE+ and MACE analyses met noninferiority and HR <1.0, superiority was to be tested.bCV events were adjudicated by an independent committee, blinded to study therapy.
TECOS = Trial Evaluating Cardiovascular Outcomes With Sitagliptin; CV = cardiovascular; MI = myocardial infarction; eGFR = estimated glomerular filtration rate.
1. Green JB et al. Am Heart J. 2013;166:983–989.e7.
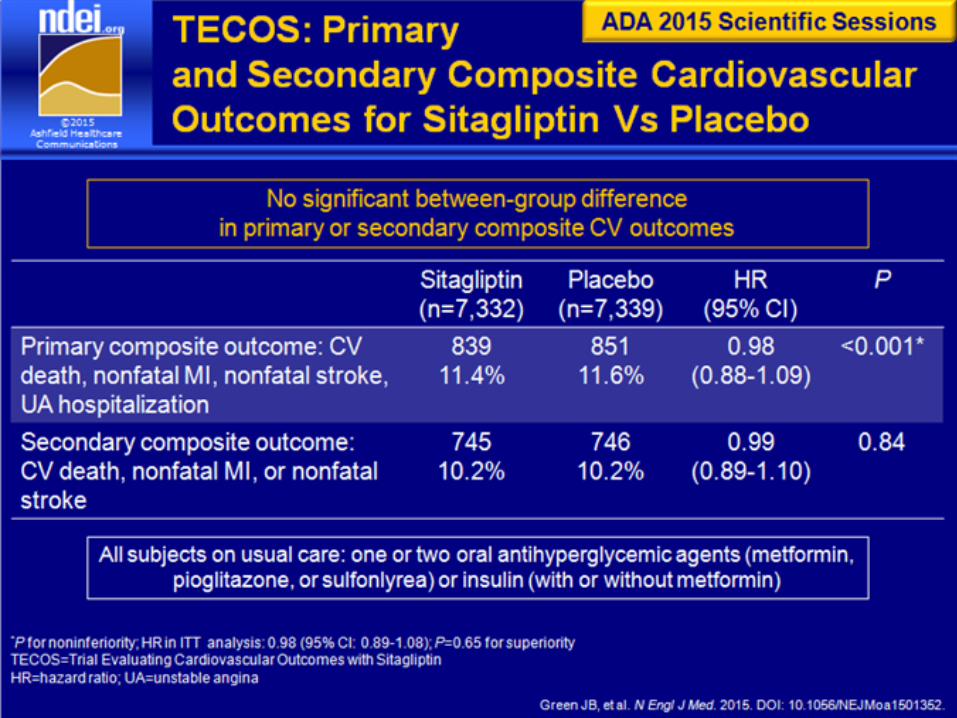
TECOS CV Safety Trial:
Primary and Secondary Outcomes1

60

61

62
TECOS CV Safety Trial: Primary Composite CV
Outcome (Analysis for non Inferiority)1
aNoninferiority P-value for a margin of 1.30 in hazard ratio.
TECOS = Trial Evaluating Cardiovascular Outcomes With Sitagliptin; CV = cardiovascular; ITT = intention-to-treat; PP = per protocol; HR = hazard ratio; CI = confidence interval.
1. Green JB et al. [published online ahead of print June 8, 2015] N Engl J Med. doi: 10.1056/NEJMoa1501352.
100
80
60
40
20
0
0 4 8 12 18 24 30 36 42 48
484 8 12 18 24 30 36 420
0
15
Month
Pat
ien
ts w
ith
Eve
nt,
%
No. at Risk
Sitagliptin 7257 6857 6519 6275 5931 5616 3919 2896 1748 1028
Placebo 7266 6846 6449 6165 5803 5421 3780 2743 1690 1005
10
5
Placebo
Sitagliptin
Primary Composite CV Outcome: Per-Protocol Population
HR (95% CI) 0.98 (0.88, 1.09)
P value for non inferiority: P >0.001
63
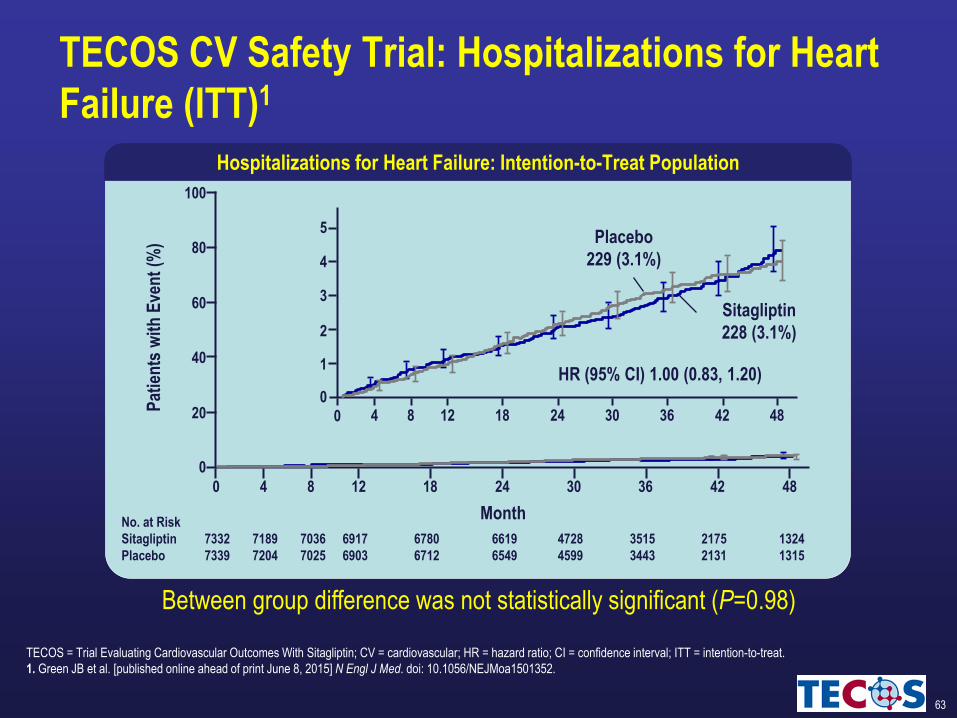
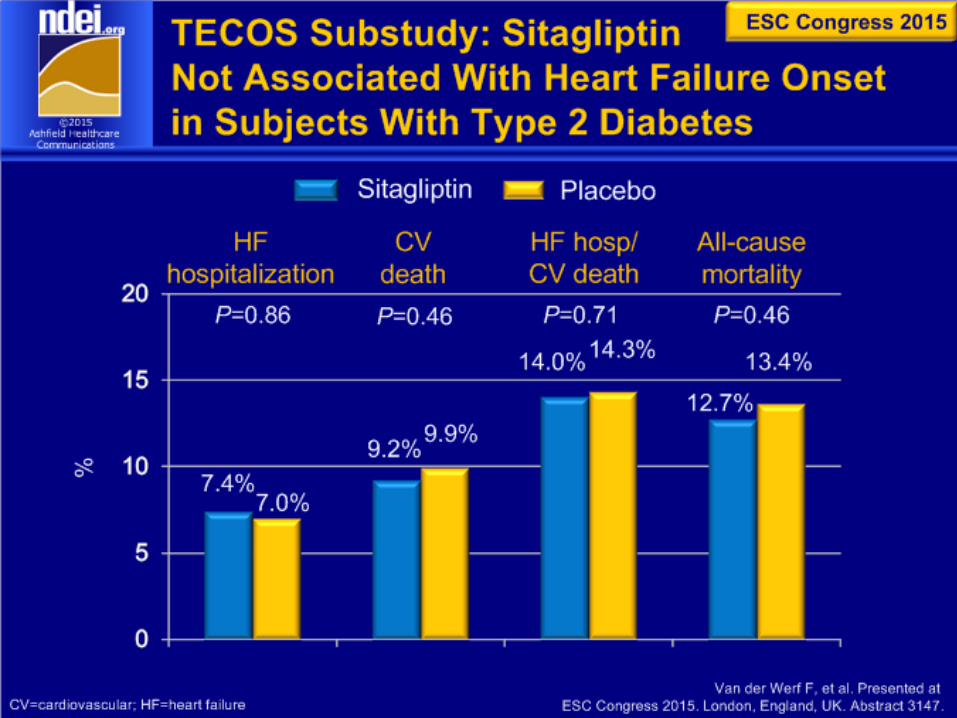
TECOS CV Safety Trial: Hospitalizations for Heart
Failure (ITT)1
TECOS = Trial Evaluating Cardiovascular Outcomes With Sitagliptin; CV = cardiovascular; HR = hazard ratio; CI = confidence interval; ITT = intention-to-treat.
1. Green JB et al. [published online ahead of print June 8, 2015] N Engl J Med. doi: 10.1056/NEJMoa1501352.
Placebo
229 (3.1%)
Sitagliptin
228 (3.1%)
Hospitalizations for Heart Failure: Intention-to-Treat Population
100
80
60
40
20
0
0 4 8 12 18 24 30 36 42 48
484 8 12 18 24 30 36 420
0
1
2
3
4
5
Month
Pat
ien
ts w
ith
Eve
nt
(%)
No. at Risk
Sitagliptin 7332 7189 7036 6917 6780 6619 4728 3515 2175 1324
Placebo 7339 7204 7025 6903 6712 6549 4599 3443 2131 1315
HR (95% CI) 1.00 (0.83, 1.20)
Between group difference was not statistically significant (P=0.98)
64

65
Non-CV outcomesa Sitagliptin Placebo
n (%); rate per 100 patient-years N=7,332 N=7,339 HR (95% CI) P-value
Acute pancreatitis 23 (0.3);
0.11
12 (0.2);
0.06
1.93 (0.96, 3.88) 0.07
Charter-defined cancer 268 (3.7);
1.25
290 (4.0);
1.37
0.91 (0.77, 1.08) 0.27
Pancreatic cancer 9 (0.1);
0.04
14 (0.2);
0.07
0.66 (0.28, 1.51) 0.32
Severe hypoglycemia 160 (2.2);
0.78
143 (1.9);
0.70
1.12 (0.89, 1.40) 0.33
TECOS CV Safety Trial:
Key Non-CV Outcomes (ITT)1
aITT population.
TECOS = Trial Evaluating Cardiovascular Outcomes With Sitagliptin; CV = cardiovascular; ITT = intention-to-treat; HR = hazard ratio; CI = confidence interval.
1. Green JB et al. [published online ahead of print June 8, 2015] N Engl J Med. doi: 10.1056/NEJMoa1501352.
66

67
TECOS CV Safety Trial: Summary of Results1
Sitagliptin met primary end point (no increased CV risk) when added to
usual care in patients with type 2 diabetes and established CV disease
Sitagliptin therapy did not increase all-cause mortality, CV death, or
non-CV death
No between-group difference in hospitalization for heart failure
Sitagliptin treatment not associated with a significant increase in severe
hypoglycemia
TECOS = Trial Evaluating Cardiovascular Outcomes With Sitagliptin; CV = cardiovascular.
1. Green JB et al. [published online ahead of print June 8, 2015] N Engl J Med. doi: 10.1056/NEJMoa1501352.

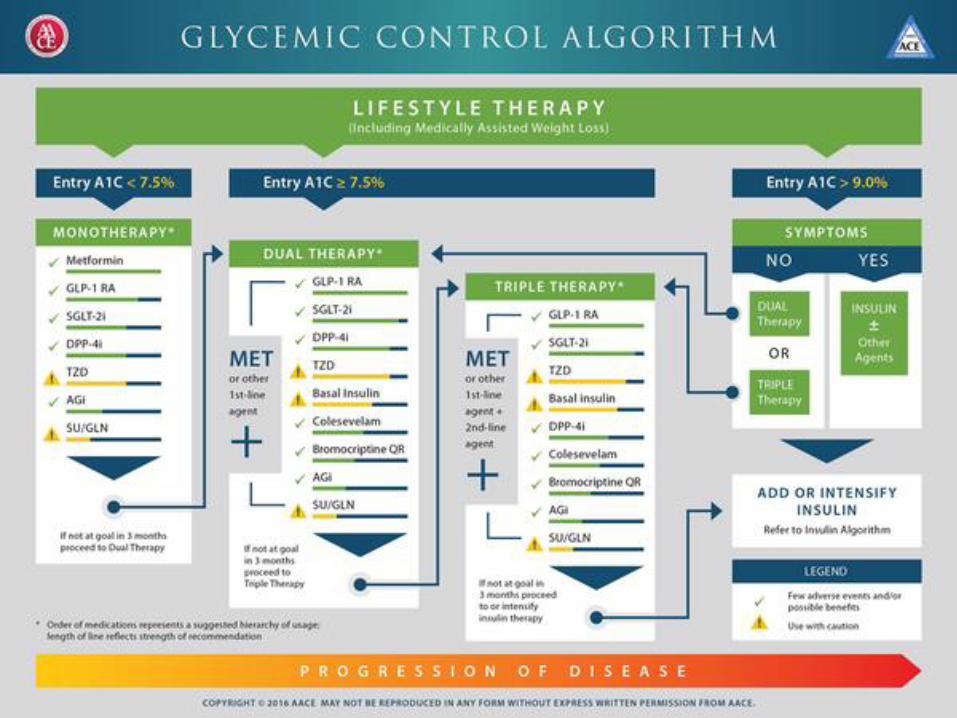
Healthy eating, weight control, increased physical activity & diabetes education
Metformin high low risk
neutral/loss
GI / lactic acidosis
low
If HbA1c target not achieved after ~3 months of monotherapy, proceed to 2-drug combination (order not meant to denote any specific preference - choice dependent on a variety of patient- & disease-specific factors):
Metformin +
Metformin +
Metformin +
Metformin +
Metformin +
high low risk
gain
edema, HF, fxs
low
Thiazolidine- dione
intermediate low risk
neutral
rare
high
DPP-4 inhibitor
highest high risk
gain
hypoglycemia
variable
Insulin (basal)
Metformin +
Metformin +
Metformin +
Metformin +
Metformin +
Basal Insulin +
Sulfonylurea
+
TZD
DPP-4-i
GLP-1-RA
Insulin§
or
or
or
or
Thiazolidine-dione
+ SU
DPP-4-i
GLP-1-RA
Insulin§
TZD
DPP-4-i
or
or
or
GLP-1-RA
high low risk
loss
GI
high
GLP-1 receptor agonist
Sulfonylurea
high moderate risk
gain
hypoglycemia
low
SGLT2 inhibitor
intermediate low risk
loss
GU, dehydration
high
SU
TZD
Insulin§
GLP-1 receptor agonist
+
SGLT-2 Inhibitor +
SU
TZD
Insulin§
Metformin +
Metformin +
or
or
or
or
SGLT2-i
or
or
or
SGLT2-i
Mono- therapy
Efficacy* Hypo risk
Weight
Side effects
Costs
Dual therapy†
Efficacy* Hypo risk
Weight
Side effects
Costs
Triple therapy
or
or
DPP-4 Inhibitor
+ SU
TZD
Insulin§
SGLT2-i
or
or
or
SGLT2-i
or
DPP-4-i
If HbA1c target not achieved after ~3 months of dual therapy, proceed to 3-drug combination (order not meant to denote any specific preference - choice dependent on a variety of patient- & disease-specific factors):
If HbA1c target not achieved after ~3 months of triple therapy and patient (1) on oral combination, move to injectables, (2) on GLP-1 RA, add basal insulin, or (3) on optimally titrated basal insulin, add GLP-1-RA or mealtime insulin. In refractory patients consider adding TZD or SGL T2-i:
Metformin +
Combination injectable therapy‡
GLP-1-RA Mealtime Insulin
Insulin (basal)
+
Diabetes Care 2015;38:140-149; Diabetologia 2015;10.1077/s00125-014-3460-0


70
Take home message :
DPP4I Sitagliptin Improves Glycemic Control In a Glucose-
Dependent Manner helping T2DM patients to reach targets without
compromise
Sitagliptin and Metformin combination targets the 3 Metabolic
Defects of Type 2 Diabetes with a reduction in A1c up to -3.6%
Because people with type 2 diabetes are at increased risk for CV
complications, understanding the CV safety of these medicines is
important, That is what the TECOS CV Safety Trial addressed – the
CV safety of Sitagliptin
When considering managing T2DM with CV disease ; Sitagliptin
should be on top of the list.

71
Thank You ….