TSMC 2021Q3 Consolidated Financial Statements E
88
Taiwan Semiconductor Manufacturing Company Limited and Subsidiaries Consolidated Financial Statements for the Nine Months Ended September 30, 2021 and 2020 and Independent Auditors’ Review Report
Transcript of TSMC 2021Q3 Consolidated Financial Statements E

Taiwan Semiconductor Manufacturing Company Limited and Subsidiaries Consolidated Financial Statements for the Nine Months Ended September 30, 2021 and 2020 and Independent Auditors’ Review Report


- 3 -
Taiwan Semiconductor Manufacturing Company Limited and Subsidiaries CONSOLIDATED BALANCE SHEETS (In Thousands of New Taiwan Dollars)
September 30, 2021
(Reviewed) December 31, 2020
(Audited) September 30, 2020
(Reviewed) Amount % Amount % Amount % ASSETS CURRENT ASSETS
Cash and cash equivalents (Note 6) $ 853,811,966 26 $ 660,170,647 24 $ 604,195,113 23 Financial assets at fair value through profit or loss (Note 7) 33,956 - 2,259,412 - 2,526,481 - Financial assets at fair value through other comprehensive income (Note 8) 121,935,878 4 122,448,453 5 128,608,752 5 Financial assets at amortized cost (Note 9) - - 6,597,992 - 7,090,162 - Hedging financial assets (Note 10) 37,769 - 47 - - - Notes and accounts receivable, net (Note 11) 186,309,080 6 145,480,272 5 161,700,332 6 Receivables from related parties (Note 30) 859,144 - 558,131 - 877,765 - Other receivables from related parties (Note 30) 73,090 - 50,645 - 40,773 - Inventories (Note 12) 182,233,752 5 137,353,407 5 109,509,486 4 Other financial assets (Note 31) 14,007,812 - 10,676,111 1 9,647,119 1 Other current assets 11,336,722 - 6,590,191 - 5,477,935 -
Total current assets 1,370,639,169 41 1,092,185,308 40 1,029,673,918 39
NONCURRENT ASSETS
Financial assets at fair value through other comprehensive income (Note 8) 5,729,779 - 4,514,940 - 4,305,357 - Financial assets at amortized cost (Note 9) 1,545,597 - 4,372,207 - 4,508,201 - Investments accounted for using equity method (Note 13) 20,455,175 1 18,841,061 1 17,701,081 1 Property, plant and equipment (Note 14) 1,828,894,565 55 1,555,589,120 56 1,504,438,119 57 Right-of-use assets (Note 15) 32,961,097 1 27,728,382 1 20,824,081 1 Intangible assets (Note 16) 25,643,914 1 25,768,179 1 26,339,513 1 Deferred income tax assets (Note 4) 41,925,391 1 25,958,184 1 22,505,789 1 Refundable deposits 2,422,262 - 1,343,001 - 1,274,044 - Other noncurrent assets 2,094,935 - 4,411,023 - 4,002,111 -
Total noncurrent assets 1,961,672,715 59 1,668,526,097 60 1,605,898,296 61
TOTAL $ 3,332,311,884 100 $ 2,760,711,405 100 $ 2,635,572,214 100 LIABILITIES AND EQUITY CURRENT LIABILITIES
Short-term loans (Notes 17 and 28) $ 118,844,065 4 $ 88,559,026 3 $ 155,377,630 6 Financial liabilities at fair value through profit or loss (Note 7) 1,405,470 - 94,128 - 1,445,911 - Hedging financial liabilities (Note 10) - - 1,169 - 11,839 - Accounts payable 41,733,233 1 38,987,284 1 38,909,171 1 Payables to related parties (Note 30) 2,155,628 - 2,107,718 - 1,983,175 - Salary and bonus payable 20,422,409 1 20,071,241 1 17,511,612 1 Accrued profit sharing bonus to employees and compensation to directors and supervisors (Note
27) 27,219,784 1 35,681,046 1 26,584,817 1 Payables to contractors and equipment suppliers 128,367,724 4 157,804,961 6 100,637,031 4 Cash dividends payable (Note 20) 142,617,092 4 129,651,902 5 129,651,902 5 Income tax payable (Note 4) 33,614,402 1 53,909,313 2 33,705,272 1 Long-term liabilities - current portion (Notes 19 and 28) - - 2,600,000 - 2,600,000 - Accrued expenses and other current liabilities (Notes 15, 21, 28 and 30) 139,241,643 4 87,683,260 3 79,823,363 3
Total current liabilities 655,621,450 20 617,151,048 22 588,241,723 22
NONCURRENT LIABILITIES
Bonds payable (Notes 18 and 28) 459,733,448 14 254,105,084 9 227,045,434 9 Long-term bank loans (Notes 19 and 28) 3,472,190 - 1,967,611 - 982,449 - Deferred income tax liabilities (Note 4) 2,306,909 - 1,729,941 - 1,022,263 - Lease liabilities (Notes 15 and 28) 21,052,983 1 20,560,649 1 19,180,809 1 Net defined benefit liability (Note 4) 11,276,177 - 11,914,074 1 8,384,974 - Guarantee deposits 641,546 - 265,599 - 167,727 - Others (Note 21) 99,886,871 3 2,395,400 - 2,280,460 -
Total noncurrent liabilities 598,370,124 18 292,938,358 11 259,064,116 10
Total liabilities 1,253,991,574 38 910,089,406 33 847,305,839 32
EQUITY ATTRIBUTABLE TO SHAREHOLDERS OF THE PARENT
Capital stock (Note 20) 259,303,805 8 259,303,805 9 259,303,805 10 Capital surplus (Note 20) 64,746,864 2 56,347,243 2 56,339,982 2 Retained earnings (Note 20)
Appropriated as legal capital reserve 311,146,899 9 311,146,899 11 311,146,899 12 Appropriated as special capital reserve 58,594,043 2 42,259,146 2 36,757,795 1 Unappropriated earnings 1,441,532,663 43 1,235,280,036 45 1,166,071,694 44
1,811,273,605 54 1,588,686,081 58 1,513,976,388 57 Others (Note 20) (59,304,212) (2) (54,679,873) (2) (42,259,146) (1)
Equity attributable to shareholders of the parent 2,076,020,062 62 1,849,657,256 67 1,787,361,029 68
NON - CONTROLLING INTERESTS 2,300,248 - 964,743 - 905,346 -
Total equity 2,078,320,310 62 1,850,621,999 67 1,788,266,375 68 TOTAL $ 3,332,311,884 100 $ 2,760,711,405 100 $ 2,635,572,214 100 The accompanying notes are an integral part of the consolidated financial statements.

- 4 -
Taiwan Semiconductor Manufacturing Company Limited and Subsidiaries CONSOLIDATED STATEMENTS OF COMPREHENSIVE INCOME (In Thousands of New Taiwan Dollars, Except Earnings Per Share) (Reviewed, Not Audited)
For the Three Months Ended September 30 For the Nine Months Ended September 30 2021 2020 2021 2020 Amount % Amount % Amount % Amount % NET REVENUE (Notes 21, 30 and 35) $ 414,670,379 100 $ 356,426,204 100 $1,149,225,731 100 $ 977,721,754 100 COST OF REVENUE (Notes 12, 27 and 30) 201,821,695 49 165,945,534 47 560,367,693 49 461,764,078 47 GROSS PROFIT BEFORE REALIZED
(UNREALIZED) GROSS PROFIT ON SALES TO ASSOCIATES 212,848,684 51 190,480,670 53 588,858,038 51 515,957,676 53
REALIZED (UNREALIZED) GROSS PROFIT ON
SALES TO ASSOCIATES (102,489 ) - 12,826 - (75,595 ) - (63,881 ) - GROSS PROFIT 212,746,195 51 190,493,496 53 588,782,443 51 515,893,795 53 OPERATING EXPENSES (Notes 27 and 30)
Research and development 30,866,634 7 29,683,751 8 92,496,368 8 79,545,677 8 General and administrative 8,929,793 2 9,272,555 2 23,280,651 2 22,070,021 2 Marketing 1,853,489 1 1,935,049 1 5,568,153 - 5,119,412 1
Total operating expenses 41,649,916 10 40,891,355 11 121,345,172 10 106,735,110 11
OTHER OPERATING INCOME AND EXPENSES,
NET (Notes 14, 15 and 27) (92,731 ) - 445,208 - (228,328 ) - 504,839 - INCOME FROM OPERATIONS (Note 35) 171,003,548 41 150,047,349 42 467,208,943 41 409,663,524 42 NON-OPERATING INCOME AND EXPENSES
Share of profits of associates 1,513,156 - 833,165 - 3,952,156 - 2,237,890 - Interest income (Note 22) 1,356,544 - 1,897,963 1 4,246,129 - 7,365,394 1 Other income 155,818 - 117,634 - 813,088 - 461,558 - Foreign exchange gain (loss), net (Note 33) 3,724,723 1 (3,549,939 ) (1 ) 9,848,594 1 (394,836 ) - Finance costs (Note 23) (1,334,063 ) - (373,164 ) - (3,240,557 ) - (1,312,873 ) - Other gains and losses, net (Note 24) (2,568,087 ) - 6,150,995 2 (4,521,250 ) - 5,649,162 -
Total non-operating income and expenses 2,848,091 1 5,076,654 2 11,098,160 1 14,006,295 1
INCOME BEFORE INCOME TAX 173,851,639 42 155,124,003 44 478,307,103 42 423,669,819 43 INCOME TAX EXPENSE (Notes 4 and 25) 17,372,485 4 17,745,852 5 47,607,484 5 48,336,261 5 NET INCOME 156,479,154 38 137,378,151 39 430,699,619 37 375,333,558 38 OTHER COMPREHENSIVE INCOME (LOSS)
(Notes 20 and 25) Items that will not be reclassified subsequently to
profit or loss: Unrealized gain on investments in equity
instruments at fair value through other comprehensive income 264,000 - 100,021 - 1,081,336 - 78,311 -
Gain (loss) on hedging instruments - - 65,691 - (41,416 ) - 22,942 - Share of other comprehensive income of
associates 17,230 - 6,680 - 21,732 - 3,211 - Income tax benefit (expense) related to items that
will not be reclassified subsequently (231 ) - 161 - (56,076 ) - 627 - 280,999 - 172,553 - 1,005,576 - 105,091 -
Items that may be reclassified subsequently to profit or loss: Exchange differences arising on translation of
foreign operations (541,643 ) - (5,473,167 ) (2 ) (3,636,922 ) - (17,163,363 ) (2 ) Unrealized gain/(loss) on investments in debt
instruments at fair value through other comprehensive income (419,794 ) - (97,724 ) - (2,209,963 ) - 2,600,675 1
Share of other comprehensive loss of associates (26,886 ) - (37,064 ) - (100,543 ) - (213,373 ) - (988,323 ) - (5,607,955 ) (2 ) (5,947,428 ) - (14,776,061 ) (1 )
Other comprehensive loss for the period, net of income tax (707,324 ) - (5,435,402 ) (2 ) (4,941,852 ) - (14,670,970 ) (1 )
TOTAL COMPREHENSIVE INCOME FOR THE
PERIOD $ 155,771,830 38 $ 131,942,749 37 $ 425,757,767 37 $ 360,662,588 37 NET INCOME ATTRIBUTABLE TO:
Shareholders of the parent $ 156,258,287 38 $ 137,310,040 39 $ 430,307,722 37 $ 375,118,953 38 Non-controlling interests 220,867 - 68,111 - 391,897 - 214,605 -
$ 156,479,154 38 $ 137,378,151 39 $ 430,699,619 37 $ 375,333,558 38
(Continued)

- 5 -
Taiwan Semiconductor Manufacturing Company Limited and Subsidiaries CONSOLIDATED STATEMENTS OF COMPREHENSIVE INCOME (In Thousands of New Taiwan Dollars, Except Earnings Per Share) (Reviewed, Not Audited)
For the Three Months Ended September 30 For the Nine Months Ended September 30 2021 2020 2021 2020 Amount % Amount % Amount % Amount % TOTAL COMPREHENSIVE INCOME
ATTRIBUTABLE TO: Shareholders of the parent $ 155,549,779 38 $ 131,874,689 37 $ 425,364,812 37 $ 360,447,417 37 Non-controlling interests 222,051 - 68,060 - 392,955 - 215,171 -
$ 155,771,830 38 $ 131,942,749 37 $ 425,757,767 37 $ 360,662,588 37 EARNINGS PER SHARE (NT$, Note 26)
Basic earnings per share $ 6.03 $ 5.30 $ 16.59 $ 14.47 Diluted earnings per share $ 6.03 $ 5.30 $ 16.59 $ 14.47
The accompanying notes are an integral part of the consolidated financial statements. (Concluded)

- 6 -
Taiwan Semiconductor Manufacturing Company Limited and Subsidiaries CONSOLIDATED STATEMENTS OF CHANGES IN EQUITY (In Thousands of New Taiwan Dollars) (Reviewed, Not Audited)
Equity Attributable to Shareholders of the Parent Others Unrealized Gain (Loss) on Financial Assets at Fair Foreign Value Through Unearned Capital Stock - Common Stock Retained Earnings Currency Other Gain (Loss) on Stock-Based Shares Legal Capital Special Capital Unappropriated Translation Comprehensive Hedging Employee Non-controlling Total (In Thousands) Amount Capital Surplus Reserve Reserve Earnings Total Reserve Income Instruments Compensation Total Total Interests Equity BALANCE, JANUARY 1, 2021 25,930,380 $ 259,303,805 $ 56,347,243 $ 311,146,899 $ 42,259,146 $ 1,235,280,036 $ 1,588,686,081 $ (57,001,627 ) $ 2,321,754 $ - $ - $ (54,679,873 ) $ 1,849,657,256 $ 964,743 $ 1,850,621,999 Appropriations of earnings
Special capital reserve - - - - 16,334,897 (16,334,897 ) - - - - - - - - - Cash dividends to shareholders - - - - - (207,443,043 ) (207,443,043 ) - - - - - (207,443,043 ) - (207,443,043 )
Total - - - - 16,334,897 (223,777,940 ) (207,443,043 ) - - - - - (207,443,043 ) - (207,443,043 ) Net income for the nine months ended September 30, 2021 - - - - - 430,307,722 430,307,722 - - - - - 430,307,722 391,897 430,699,619 Other comprehensive loss for the nine months ended September 30,
2021, net of income tax
- - - - - - - (3,737,424 ) (1,160,964 ) (44,522 ) - (4,942,910 ) (4,942,910 ) 1,058 (4,941,852 ) Total comprehensive income (loss) for the nine months ended
September 30, 2021
- - - - - 430,307,722 430,307,722 (3,737,424 ) (1,160,964 ) (44,522 ) - (4,942,910 ) 425,364,812 392,955 425,757,767 Disposal of investments in equity instruments at fair value through
other comprehensive income
- - - - - (277,155 ) (277,155 ) - 277,155 - - 277,155 - - - Basis adjustment for gain on hedging instruments - - - - - - - - - 41,416 - 41,416 41,416 - 41,416 Adjustments to share of changes in equities of associates - - 317 - - - - - - - - - 317 - 317 From difference between the consideration received and the carrying
amount of the subsidiaries' net assets during actual disposal
- - 8,406,282 - - - - - - - - - 8,406,282 1,045,516 9,451,798 From share of changes in equities of subsidiaries - - (6,978 ) - - - - - - - - - (6,978 ) 6,978 - Decrease in non-controlling interests - - - - - - - - - - - - - (110,099 ) (110,099 ) Effect of acquisition of subsidiary - - - - - - - - - - - - - 155 155 BALANCE, SEPTEMBER 30, 2021 25,930,380 $ 259,303,805 $ 64,746,864 $ 311,146,899 $ 58,594,043 $ 1,441,532,663 $ 1,811,273,605 $ (60,739,051 ) $ 1,437,945 $ (3,106 ) $ - $ (59,304,212 ) $ 2,076,020,062 $ 2,300,248 $ 2,078,320,310 BALANCE, JANUARY 1, 2020 25,930,380 $ 259,303,805 $ 56,339,709 $ 311,146,899 $ 10,675,106 $ 1,011,512,974 $ 1,333,334,979 $ (26,871,400 ) $ (692,959 ) $ (3,820 ) $ (190 ) $ (27,568,369 ) $ 1,621,410,124 $ 685,302 $ 1,622,095,426 Appropriations of earnings
Special capital reserve - - - - 26,082,689 (26,082,689 ) - - - - - - - - - Cash dividends to shareholders - - - - - (194,477,853 ) (194,477,853 ) - - - - - (194,477,853 ) - (194,477,853 )
Total - - - - 26,082,689 (220,560,542 ) (194,477,853 ) - - - - - (194,477,853 ) - (194,477,853 ) Net income for the nine months ended September 30, 2020 - - - - - 375,118,953 375,118,953 - - - - - 375,118,953 214,605 375,333,558 Other comprehensive income (loss) for the nine months ended
September 30, 2020, net of income tax
- - - - - - - (17,376,530 ) 2,682,052 22,942 - (14,671,536 ) (14,671,536 ) 566 (14,670,970 ) Total comprehensive income (loss) for the nine months ended
September 30, 2020
- - - - - 375,118,953 375,118,953 (17,376,530 ) 2,682,052 22,942 - (14,671,536 ) 360,447,417 215,171 360,662,588 Disposal of investments in equity instruments at fair value through
other comprehensive income
- - - - - 309 309 - (309 ) - - (309 ) - - - Basis adjustment for loss on hedging instruments - - - - - - - - - (19,122 ) - (19,122 ) (19,122 ) - (19,122 ) Adjustments to share of changes in equities of associates - - 273 - - - - - - - 190 190 463 - 463 Increase in non-controlling interests - - - - - - - - - - - - - 4,873 4,873 BALANCE, SEPTEMBER 30, 2020 25,930,380 $ 259,303,805 $ 56,339,982 $ 311,146,899 $ 36,757,795 $ 1,166,071,694 $ 1,513,976,388 $ (44,247,930 ) $ 1,988,784 $ - $ - $ (42,259,146 ) $ 1,787,361,029 $ 905,346 $ 1,788,266,375 The accompanying notes are an integral part of the consolidated financial statements.

- 7 -
Taiwan Semiconductor Manufacturing Company Limited and Subsidiaries CONSOLIDATED STATEMENTS OF CASH FLOWS (In Thousands of New Taiwan Dollars) (Reviewed, Not Audited) Nine Months Ended September 30 2021 2020 CASH FLOWS FROM OPERATING ACTIVITIES
Income before income tax $ 478,307,103 $ 423,669,819 Adjustments for:
Depreciation expense 305,598,797 228,890,246 Amortization expense 6,133,442 5,272,559 Expected credit losses recognized (reversal) on investments in debt
instruments (5,246) 4,219 Finance costs 3,240,557 1,312,873 Share of profits of associates (3,952,156) (2,237,890) Interest income (4,246,129) (7,365,394) Share-based compensation 6,007 4,873 Loss (gain) on disposal or retirement of property, plant and
equipment, net 123,673 (152,305) Loss on disposal or retirement of intangible assets, net 1,228 599 Impairment loss on property, plant and equipment 274,388 10,159 Gain on financial instruments at fair value through profit or loss, net - (2,360) Gain on disposal of investments in debt instruments at fair value
through other comprehensive income, net (183,349) (1,327,251) Unrealized gross profit on sales to associates 75,595 63,881 Gain on foreign exchange, net (11,104,453) (741,378) Dividend income (357,214) (452,570) Others (414,281) (461)
Changes in operating assets and liabilities: Financial instruments at fair value through profit or loss 3,497,620 (1,852,218) Notes and accounts receivable, net (40,828,800) (24,302,814) Receivables from related parties (301,013) (15,695) Other receivables from related parties (22,445) 16,779 Inventories (44,880,345) (26,528,290) Other financial assets (4,503,858) 2,432,568 Other current assets (4,760,353) (287,297) Accounts payable 2,745,949 329,534 Payables to related parties 47,910 548,275 Salary and bonus payable 351,168 1,239,259 Accrued profit sharing bonus to employees and compensation to
directors and supervisors (8,461,262) 2,935,914 Accrued expenses and other current liabilities 51,695,061 13,765,279 Other noncurrent liabilities 89,862,181 - Net defined benefit liability (637,897) (797,522)
Cash generated from operations 817,301,878 614,433,391 Income taxes paid (83,340,473) (50,897,763)
Net cash generated by operating activities 733,961,405 563,535,628 (Continued)
- 8 -
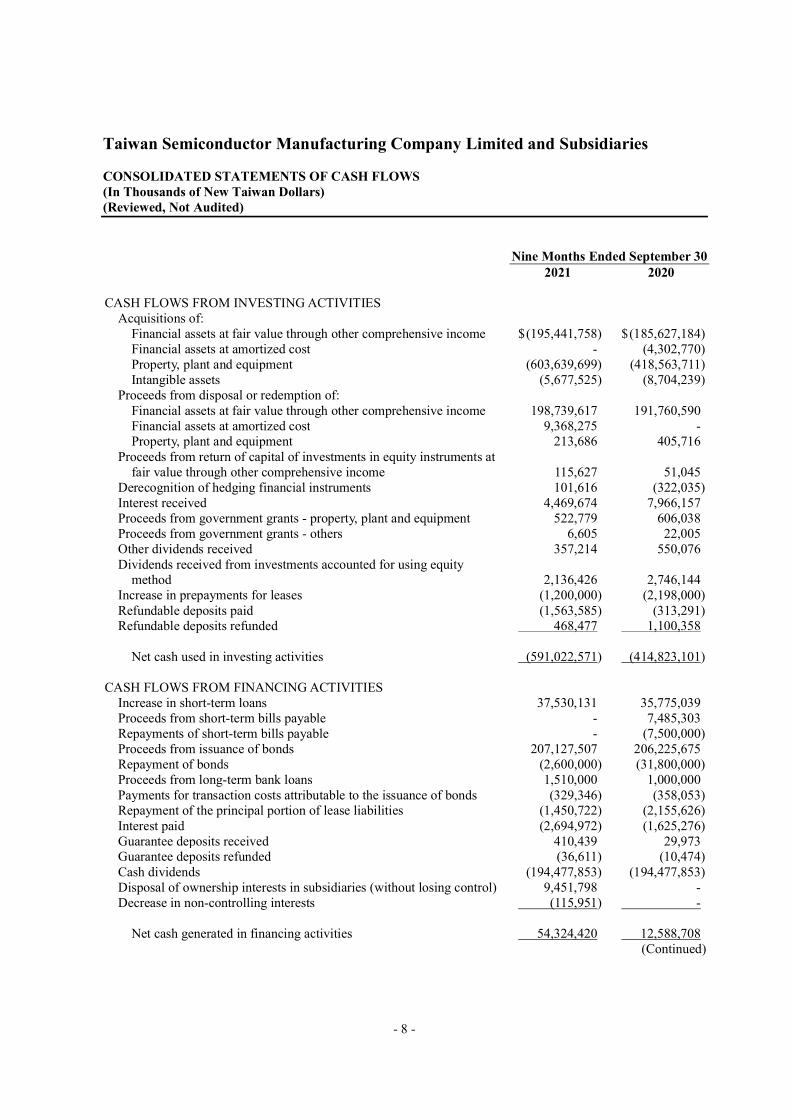
Taiwan Semiconductor Manufacturing Company Limited and Subsidiaries CONSOLIDATED STATEMENTS OF CASH FLOWS (In Thousands of New Taiwan Dollars) (Reviewed, Not Audited) Nine Months Ended September 30 2021 2020 CASH FLOWS FROM INVESTING ACTIVITIES
Acquisitions of: Financial assets at fair value through other comprehensive income $ (195,441,758) $ (185,627,184) Financial assets at amortized cost - (4,302,770) Property, plant and equipment (603,639,699) (418,563,711) Intangible assets (5,677,525) (8,704,239)
Proceeds from disposal or redemption of: Financial assets at fair value through other comprehensive income 198,739,617 191,760,590 Financial assets at amortized cost 9,368,275 - Property, plant and equipment 213,686 405,716
Proceeds from return of capital of investments in equity instruments at fair value through other comprehensive income 115,627 51,045
Derecognition of hedging financial instruments 101,616 (322,035) Interest received 4,469,674 7,966,157 Proceeds from government grants - property, plant and equipment 522,779 606,038 Proceeds from government grants - others 6,605 22,005 Other dividends received 357,214 550,076 Dividends received from investments accounted for using equity
method 2,136,426 2,746,144 Increase in prepayments for leases (1,200,000) (2,198,000) Refundable deposits paid (1,563,585) (313,291) Refundable deposits refunded 468,477 1,100,358
Net cash used in investing activities (591,022,571) (414,823,101)
CASH FLOWS FROM FINANCING ACTIVITIES
Increase in short-term loans 37,530,131 35,775,039 Proceeds from short-term bills payable - 7,485,303 Repayments of short-term bills payable - (7,500,000) Proceeds from issuance of bonds 207,127,507 206,225,675 Repayment of bonds (2,600,000) (31,800,000) Proceeds from long-term bank loans 1,510,000 1,000,000 Payments for transaction costs attributable to the issuance of bonds (329,346) (358,053) Repayment of the principal portion of lease liabilities (1,450,722) (2,155,626) Interest paid (2,694,972) (1,625,276) Guarantee deposits received 410,439 29,973 Guarantee deposits refunded (36,611) (10,474) Cash dividends (194,477,853) (194,477,853) Disposal of ownership interests in subsidiaries (without losing control) 9,451,798 - Decrease in non-controlling interests (115,951) -
Net cash generated in financing activities 54,324,420 12,588,708
(Continued)

- 9 -
Taiwan Semiconductor Manufacturing Company Limited and Subsidiaries CONSOLIDATED STATEMENTS OF CASH FLOWS (In Thousands of New Taiwan Dollars) (Reviewed, Not Audited) Nine Months Ended September 30 2021 2020 EFFECT OF EXCHANGE RATE CHANGES ON CASH AND CASH
EQUIVALENTS $ (3,621,935) $ (12,505,458) NET INCREASE IN CASH AND CASH EQUIVALENTS 193,641,319 148,795,777 CASH AND CASH EQUIVALENTS, BEGINNING OF PERIOD 660,170,647 455,399,336 CASH AND CASH EQUIVALENTS, END OF PERIOD $ 853,811,966 $ 604,195,113 The accompanying notes are an integral part of the consolidated financial statements. (Concluded)

- 10 -
Taiwan Semiconductor Manufacturing Company Limited and Subsidiaries NOTES TO CONSOLIDATED FINANCIAL STATEMENTS FOR THE NINE MONTHS ENDED SEPTEMBER 30, 2021 AND 2020 (Amounts in Thousands of New Taiwan Dollars, Unless Specified Otherwise) (Reviewed, Not Audited) 1. GENERAL
Taiwan Semiconductor Manufacturing Company Limited (TSMC), a Republic of China (R.O.C.) corporation, was incorporated on February 21, 1987. TSMC is a dedicated foundry in the semiconductor industry which engages mainly in the manufacturing, sales, packaging, testing and computer-aided design of integrated circuits and other semiconductor devices and the manufacturing of masks. On September 5, 1994, TSMC’s shares were listed on the Taiwan Stock Exchange (TWSE). On October 8, 1997, TSMC listed some of its shares of stock on the New York Stock Exchange (NYSE) in the form of American Depositary Shares (ADSs). The address of its registered office and principal place of business is No. 8, Li-Hsin Rd. 6, Hsinchu Science Park, Taiwan. The principal operating activities of TSMC’s subsidiaries are described in Note 4.
2. THE AUTHORIZATION OF FINANCIAL STATEMENTS The accompanying consolidated financial statements were reported to the Board of Directors and issued on November 9, 2021.
3. APPLICATION OF NEW AND REVISED INTERNATIONAL FINANCIAL REPORTING STANDARDS
a. Initial application of the amendments to the International Financial Reporting Standards (IFRS),
International Accounting Standards (IAS), IFRIC Interpretations (IFRIC), and SIC Interpretations (SIC) (collectively, “IFRSs”) endorsed and issued into effect by the Financial Supervisory Commission (FSC)
The initial application of the amendments to the IFRSs endorsed and issued into effect by the FSC did not have a significant effect on the accounting policies of TSMC and its subsidiaries (collectively as the “Company”).
b. The IFRSs issued by International Accounting Standards Board (IASB) and endorsed by FSC with
effective date starting 2022
New, Revised or Amended Standards and Interpretations Effective Date Issued
by IASB Annual Improvements to IFRS Standards 2018 - 2020 Cycle January 1, 2022 Amendments to IFRS 3 “Reference to the Conceptual Framework” January 1, 2022 Amendments to IAS 16 “Property, Plant and Equipment - Proceeds
before Intended Use” January 1, 2022
Amendments to IAS 37 “Onerous Contracts–Cost of Fulfilling a Contract”
January 1, 2022

- 11 -
c. The IFRSs issued by IASB, but not yet endorsed and issued into effect by the FSC
New, Revised or Amended Standards and Interpretations Effective Date Issued
by IASB Amendments to IFRS 10 and IAS 28 “Sale or Contribution of Assets
between an Investor and its Associate or Joint Venture” To be determined by IASB
Amendments to IAS 1 “Classification of Liabilities as Current or Non-current”
January 1, 2023
Amendments to IAS 1 “Disclosure of Accounting Policies” January 1, 2023 Amendments to IAS 8 “Definition of Accounting Estimates” January 1, 2023 Amendments to IAS 12 “Deferred Tax related to Assets and
Liabilities arising from a Single Transaction” January 1, 2023
As of the date the accompanying consolidated financial statements were issued, the Company continues in evaluating the impact on its financial position and financial performance from the initial adoption of the aforementioned standards or interpretations and related applicable period. The related impact will be disclosed when the Company completes its evaluation.
4. SUMMARY OF SIGNIFICANT ACCOUNTING POLICIES
Except for the following, the accounting policies applied in these consolidated financial statements are consistent with those applied in the consolidated financial statements for the year ended December 31, 2020. For the convenience of readers, the accompanying consolidated financial statements have been translated into English from the original Chinese version prepared and used in the R.O.C. If there is any conflict between the English version and the original Chinese version or any difference in the interpretation of the two versions, the Chinese-language consolidated financial statements shall prevail. Statement of Compliance The accompanying consolidated financial statements have been prepared in conformity with the Regulations Governing the Preparation of Financial Reports by Securities Issuers and IAS 34, “Interim Financial Reporting,” endorsed and issued into effect by the FSC. The consolidated financial statements do not present all the disclosures required for a complete set of annual consolidated financial statements prepared under the IFRSs endorsed and issued into effect by the FSC (collectively, “Taiwan-IFRSs”). Basis of Consolidation The basis of preparation and the basis for the consolidated financial statements The basis of preparation and the basis for the consolidated financial statements applied in these consolidated financial statements are consistent with those applied in the consolidated financial statements for the year ended December 31, 2020. The subsidiaries in the consolidated financial statements The detail information of the subsidiaries at the end of reporting period is as follows:
Establishment Percentage of Ownership
Name of Investor Name of Investee Main Businesses and Products and Operating
Location September 30,
2021 December 31,
2020 September 30,
2020 Note TSMC TSMC North America Sales and marketing of integrated
circuits and other semiconductor devices
San Jose, California, U.S.A.
100% 100% 100% -
TSMC Europe B.V. (TSMC Europe)
Customer service and supporting activities
Amsterdam, the Netherlands
100% 100% 100% a)
TSMC Japan Limited (TSMC Japan)
Customer service and supporting activities
Yokohama, Japan 100% 100% 100% a)
(Continued)

- 12 -
Establishment Percentage of Ownership
Name of Investor Name of Investee Main Businesses and Products and Operating
Location September 30,
2021 December 31,
2020 September 30,
2020 Note TSMC TSMC Design Technology
Japan, Inc. (TSMC JDC) Engineering support activities Yokohama, Japan 100% 100% 100% a)
TSMC Japan 3DIC R&D Center, Inc. (TSMC 3DIC)
Engineering support activities Yokohama, Japan 100% - - a), b)
TSMC Korea Limited (TSMC Korea)
Customer service and supporting activities
Seoul, Korea 100% 100% 100% a)
TSMC Partners, Ltd. (TSMC Partners)
Investing in companies involved in the semiconductor design and manufacturing, and other investment activities
Tortola, British Virgin Islands
100% 100% 100% a)
TSMC Global, Ltd. (TSMC Global)
Investment activities Tortola, British Virgin Islands
100% 100% 100% -
TSMC China Company Limited (TSMC China)
Manufacturing, sales, testing and computer-aided design of integrated circuits and other semiconductor devices
Shanghai, China 100% 100% 100% -
TSMC Nanjing Company Limited (TSMC Nanjing)
Manufacturing, sales, testing and computer-aided design of integrated circuits and other semiconductor devices
Nanjing, China 100% 100% 100% -
VisEra Technologies Company Ltd. (VisEra Tech)
Research, design, development, manufacturing, sales, packaging and test of color filter
Hsin-Chu, Taiwan 73% 87% 87% c)
TSMC Arizona Corporation (TSMC Arizona)
Manufacturing, sales and testing of integrated circuits and other semiconductor devices
Phoenix, Arizona, U.S.A.
100% 100% - a), d)
VentureTech Alliance Fund II, L.P. (VTAF II)
Investing in technology start-up companies
Cayman Islands 98% 98% 98% a)
VentureTech Alliance Fund III, L.P. (VTAF III)
Investing in technology start-up companies
Cayman Islands 98% 98% 98% a)
Emerging Fund L.P. (Emerging Fund)
Investing in technology start-up companies
Cayman Islands 99.9% - - a), e)
TSMC Partners TSMC Development, Inc. (TSMC Development)
Investing in companies involved in semiconductor manufacturing
Delaware, U.S.A. 100% 100% 100% -
TSMC Technology, Inc. (TSMC Technology)
Engineering support activities Delaware, U.S.A. 100% 100% 100% a)
TSMC Design Technology Canada Inc. (TSMC Canada)
Engineering support activities Ontario, Canada 100% 100% 100% a)
InveStar Semiconductor Development Fund, Inc. (ISDF)
Investing in technology start-up companies
Cayman Islands - - 97% a), f)
InveStar Semiconductor Development Fund, Inc. (II) LDC. (ISDF II)
Investing in technology start-up companies
Cayman Islands - - 97% a), f)
TSMC Development WaferTech, LLC (WaferTech)
Manufacturing, sales and testing of integrated circuits and other semiconductor devices
Washington, U.S.A. 100% 100% 100% -
VTAF III Growth Fund Limited (Growth Fund)
Investing in technology start-up companies
Cayman Islands 100% 100% 100% a)
(Concluded) Note a: This is an immaterial subsidiary for which the consolidated financial statements are neither reviewed nor audited by the Company’s independent auditors. Note b: TSMC 3DIC is established in March 2021. Note c: To facilitate VisEra’s IPO in Taiwan, 39,501 thousand common shares of VisEra at a price of NT$240 were sold by TSMC and an increase of NT$8,406,282 thousand in capital surplus was
recognized. TSMC’s shareholding in VisEra decreased from 87% to 73%. This disposal was accounted for as an equity transaction since the transaction did not change TSMC’s control over VisEra.
Note d: TSMC Arizona is established in November 2020. Under the terms of the development agreement entered into between TSMC Arizona and the City of Phoenix, the City of Phoenix commits
approximately US$205 million toward various public infrastructure projects in the area of the proposed manufacturing facility, conditioned on TSMC Arizona’s achieving a minimum project scale with defined spending and job-creation thresholds.
Note e: Emerging fund is established in January 2021. Note f: ISDF and ISDF II have completed the liquidation procedures in November 2020.
Retirement Benefits Pension cost for an interim period is calculated on a year-to-date basis by using the actuarially determined pension cost rate at the end of the prior financial year. Taxation Income tax expense represents the sum of the tax currently payable and deferred tax. The interim period income tax expense is accrued using the tax rate that would be applicable to expected total annual earnings, that is, the estimated average annual effective income tax rate applied to the pre-tax income of the interim period.
- 13 -
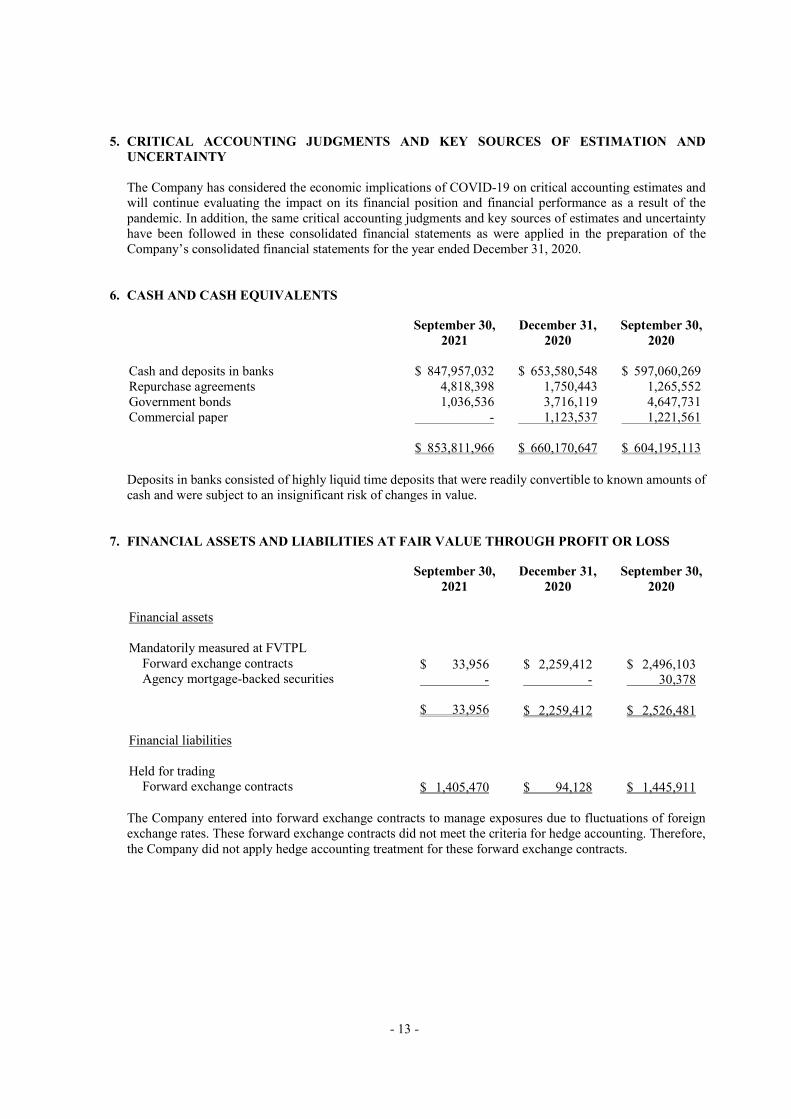
5. CRITICAL ACCOUNTING JUDGMENTS AND KEY SOURCES OF ESTIMATION AND UNCERTAINTY
The Company has considered the economic implications of COVID-19 on critical accounting estimates and will continue evaluating the impact on its financial position and financial performance as a result of the pandemic. In addition, the same critical accounting judgments and key sources of estimates and uncertainty have been followed in these consolidated financial statements as were applied in the preparation of the Company’s consolidated financial statements for the year ended December 31, 2020.
6. CASH AND CASH EQUIVALENTS
September 30,
2021 December 31,
2020 September 30,
2020 Cash and deposits in banks $ 847,957,032 $ 653,580,548 $ 597,060,269 Repurchase agreements 4,818,398 1,750,443 1,265,552 Government bonds 1,036,536 3,716,119 4,647,731 Commercial paper - 1,123,537 1,221,561 $ 853,811,966 $ 660,170,647 $ 604,195,113 Deposits in banks consisted of highly liquid time deposits that were readily convertible to known amounts of cash and were subject to an insignificant risk of changes in value.
7. FINANCIAL ASSETS AND LIABILITIES AT FAIR VALUE THROUGH PROFIT OR LOSS
September 30,
2021 December 31,
2020 September 30,
2020 Financial assets Mandatorily measured at FVTPL
Forward exchange contracts $ 33,956 $ 2,259,412 $ 2,496,103 Agency mortgage-backed securities - - 30,378
$ 33,956 $ 2,259,412 $ 2,526,481 Financial liabilities Held for trading
Forward exchange contracts $ 1,405,470 $ 94,128 $ 1,445,911 The Company entered into forward exchange contracts to manage exposures due to fluctuations of foreign exchange rates. These forward exchange contracts did not meet the criteria for hedge accounting. Therefore, the Company did not apply hedge accounting treatment for these forward exchange contracts.

- 14 -
Outstanding forward exchange contracts consisted of the following: Contract Amount Maturity Date (In Thousands) September 30, 2021 Sell NT$ October 2021 to December 2021 NT$ 126,403,873 Sell US$ October 2021 to November 2021 US$ 1,787,551 December 31, 2020 Sell NT$ January 2021 to March 2021 NT$ 144,697,981 Sell US$ January 2021 to March 2021 US$ 1,176,858 September 30, 2020 Sell NT$ October 2020 to March 2021 NT$ 165,325,463 Sell JPY October 2020 to November 2020 JPY 100,765,250 Sell US$ October 2020 to December 2020 US$ 838,405
8. FINANCIAL ASSETS AT FAIR VALUE THROUGH OTHER COMPREHENSIVE INCOME
September 30,
2021 December 31,
2020 September 30,
2020 Investments in debt instruments at FVTOCI
Corporate bonds $ 58,340,908 $ 56,593,623 $ 58,950,049 Agency bonds/Agency mortgage-backed
securities 33,836,903 43,977,113 48,699,955 Government bonds 22,479,749 13,459,503 11,806,156 Asset-backed securities 7,219,193 8,368,264 9,152,592 121,876,753 122,398,503 128,608,752
Investments in equity instruments at FVTOCI
Non-publicly traded equity investments 5,729,779 4,514,940 4,305,357 Publicly traded stocks 59,125 49,950 - 5,788,904 4,564,890 4,305,357
$ 127,665,657 $ 126,963,393 $ 132,914,109
Current $ 121,935,878 $ 122,448,453 $ 128,608,752 Noncurrent 5,729,779 4,514,940 4,305,357 $ 127,665,657 $ 126,963,393 $ 132,914,109 These investments in equity instruments are held for medium to long-term purposes and therefore are accounted for as FVTOCI. For dividends recognized from these investments, please refer to consolidated statements of cash flows. All of the dividends are from investments held at the end of the reporting period. As of September 30, 2021 and 2020, the cumulative loss allowance for expected credit loss of NT$32,764 thousand and NT$$33,932 thousand was recognized under investments in debt instruments at FVTOCI, respectively. Refer to Note 29 for information relating to the credit risk management and expected credit loss.

- 15 -
9. FINANCIAL ASSETS AT AMORTIZED COST
September 30,
2021 December 31,
2020 September 30,
2020 Corporate bonds $ 1,546,856 $ 10,977,298 $ 11,605,781 Less: Allowance for impairment loss (1,259) (7,099) (7,418)
$ 1,545,597 $ 10,970,199 $ 11,598,363
Current $ - $ 6,597,992 $ 7,090,162 Noncurrent 1,545,597 4,372,207 4,508,201 $ 1,545,597 $ 10,970,199 $ 11,598,363 Refer to Note 29 for information relating to credit risk management and expected credit loss for financial assets at amortized cost.
10. HEDGING FINANCIAL INSTRUMENTS
September 30,
2021 December 31,
2020 September 30,
2020 Financial assets - current Fair value hedges
Interest rate futures contracts $ 37,769 $ 47 $ - Financial liabilities - current Fair value hedges
Interest rate futures contracts $ - $ 1,169 $ 11,839 Fair value hedge The Company entered into interest rate futures contracts, which are used to partially hedge against the fair value changes caused by interest rate fluctuation in the Company’s fixed income investments. The hedge ratio is adjusted in response to the changes in the financial market and capped at 100%. On the basis of economic relationships, the value of the interest rate futures contracts and the value of the hedged financial assets will change in opposite directions in response to movements in interest rates. The main source of hedge ineffectiveness in these hedging relationships is the credit risk of the hedged financial assets, which is not reflected in the fair value of the interest rate futures contracts. No other sources of ineffectiveness emerged from these hedging relationships during the hedging period. Amount of hedge ineffectiveness recognized in profit or loss is classified under other gains and losses, net.

- 16 -
The following tables summarize the information relating to the hedges of interest rate risk. September 30, 2021
Hedging Instruments Contract Amount
(US$ in Thousands) Maturity
Interest rate futures contracts - US Treasury futures
US$ 85,200 December 2021
Hedged Items Asset Carrying Amount
Accumulated Amount of Fair Value Hedge
Adjustments
Financial assets at FVTOCI $ 6,295,906 $ (37,769) December 31, 2020
Hedging Instruments Contract Amount
(US$ in Thousands) Maturity
Interest rate futures contracts - US Treasury futures
US$ 88,700 March 2021
Hedged Items Asset Carrying Amount
Accumulated Amount of Fair Value Hedge
Adjustments
Financial assets at FVTOCI $ 6,198,683 $ 1,122 September 30, 2020
Hedging Instruments Contract Amount
(US$ in Thousands) Maturity
Interest rate futures contracts - US Treasury futures
US$ 113,900 December 2020
Hedged Items Asset Carrying Amount
Accumulated Amount of Fair Value Hedge
Adjustments
Financial assets at FVTOCI $ 7,748,163 $ 11,839

- 17 -
The effect for the nine months ended September 30, 2021 and 2020 is detailed below:
Hedging Instruments/Hedged Items
Increase (Decrease) in Value Used for
Calculating Hedge Ineffectiveness Nine Months Ended September 30 2021 2020
Hedging Instruments
Interest rate futures contracts - US Treasury futures $ 140,575 $ (377,392) Hedged Items
Financial assets at FVTOCI (140,575) 377,392 $ - $ -
Cash flow hedge The Company entered into forward exchange contracts to partially hedge foreign exchange rate risks associated with certain highly probable forecast transactions (capital expenditures). The hedge ratio is adjusted in response to the changes in the financial market and capped at 100%. The forward exchange contracts have maturities of 12 months or less. On the basis of economic relationships, the Company expects that the value of forward exchange contracts and the value of hedged transactions will change in opposite directions in response to movements in foreign exchange rates. The main source of hedge ineffectiveness in these hedging relationships is driven by the effect of the counterparty’s own credit risk on the fair value of forward exchange contracts. No other sources of ineffectiveness emerged from these hedging relationships. For the nine months ended September 30, 2021 and 2020, refer to Note 20(d) for gain or loss arising from changes in the fair value of hedging instruments and the amount transferred to initial carrying amount of hedged items. The effect for the nine months ended September 30, 2021 and 2020 is detailed below:
Hedging Instruments/Hedged Items
Increase (Decrease) in Value Used for
Calculating Hedge Ineffectiveness
Nine Months Ended September 30 2021 2020
Hedging Instruments
Forward exchange contracts $ (41,416) $ 22,942 Hedged Items
Forecast transaction (capital expenditures) $ 41,416 $ (22,942)

- 18 -
11. NOTES AND ACCOUNTS RECEIVABLE, NET
September 30,
2021 December 31,
2020 September 30,
2020 At amortized cost
Notes and accounts receivable $ 183,139,013 $ 142,771,597 $ 157,937,980 Less: Loss allowance (322,950) (246,626) (371,352)
182,816,063 142,524,971 157,566,628 At FVTOCI 3,493,017 2,955,301 4,133,704 $ 186,309,080 $ 145,480,272 $ 161,700,332 The Company signed a contract with the bank to sell certain accounts receivable without recourse and transaction cost required. These accounts receivable are classified as at FVTOCI because they are held within a business model whose objective is achieved by both collecting contractual cash flows and selling financial assets. In principle, the payment term granted to customers is due 30 days from the invoice date or 30 days from the end of the month when the invoice is issued. Aside from recognizing impairment loss for credit-impaired accounts receivable, the Company recognizes loss allowance based on the expected credit loss ratio of customers by different risk levels with consideration of factors of historical loss ratios and customers’ financial conditions, competitiveness and business outlook. For accounts receivable past due over 90 days without collaterals or guarantees, the Company recognizes loss allowance at full amount. Aging analysis of notes and accounts receivable
September 30,
2021 December 31,
2020 September 30,
2020 Not past due $ 183,113,259 $ 140,933,622 $ 152,869,171 Past due
Past due within 30 days 3,472,387 4,784,425 9,198,369 Past due 31-60 days 46,228 8,708 1,736 Past due 61-120 days 156 48 2,310 Past due over 121 days - 95 98
Less: Loss allowance (322,950) (246,626) (371,352)
$ 186,309,080 $ 145,480,272 $ 161,700,332 All of the Company’s accounts receivable classified as at FVTOCI were not past due. Movements of the loss allowance for accounts receivable Nine Months Ended September 30 2021 2020 Balance, beginning of period $ 246,626 $ 325,325 Provision 76,332 46,206 Effect of exchange rate changes (8) (179) Balance, end of period $ 322,950 $ 371,352
For the nine months ended September 30, 2021 and 2020, the changes in loss allowance were mainly due to the variations in the balance of accounts receivable of different risk levels.

- 19 -
12. INVENTORIES
September 30,
2021 December 31,
2020 September 30,
2020 Finished goods $ 19,823,464 $ 21,705,625 $ 13,620,691 Work in process 139,395,844 91,672,870 72,578,922 Raw materials 12,206,876 14,715,963 14,790,043 Supplies and spare parts 10,807,568 9,258,949 8,519,830 $ 182,233,752 $ 137,353,407 $ 109,509,486
Write-down of inventories to net realizable value and reversal of write-down of inventories resulting from the increase in net realizable value were included in the cost of revenue. The amounts are illustrated below:
Three Months Ended
September 30 Nine Months Ended
September 30 2021 2020 2021 2020 Inventory losses (reversal of write-
down of inventories)
$ (578,018)
$ 2,182,303 $ (1,524,065) $ 2,455,986 13. INVESTMENTS ACCOUNTED FOR USING EQUITY METHOD
Associates consisted of the following:
Place of
Carrying Amount % of Ownership and Voting Rights
Held by the Company
Name of Associate Principal Activities Incorporation and Operation
September 30, 2021
December 31, 2020
September 30, 2020
September 30, 2021
December 31, 2020
September 30, 2020
Vanguard International
Semiconductor Corporation (VIS)
Manufacturing, sales, packaging, testing and computer-aided design of integrated circuits and other semiconductor devices and the manufacturing and design service of masks
Hsinchu, Taiwan
$ 9,623,603 $ 9,029,890 $ 8,599,651 28% 28% 28%
Systems on Silicon Manufacturing Company Pte Ltd. (SSMC)
Manufacturing and sales of integrated circuits and other semiconductor devices
Singapore 6,604,176 5,900,245 5,788,458 39% 39% 39%
Xintec Inc. (Xintec) Wafer level chip size packaging and wafer level post passivation interconnection service
Taoyuan, Taiwan
2,860,422 2,554,123 2,214,499 41% 41% 41%
Global Unichip Corporation (GUC)
Researching, developing, manufacturing, testing and marketing of integrated circuits
Hsinchu, Taiwan
1,343,198 1,328,620 1,069,317 35% 35% 35%
Mutual-Pak Technology Co., Ltd. (Mutual-Pak)
Manufacturing of electronic parts, wholesaling and retailing of electronic materials, and researching, developing and testing of RFID
New Taipei, Taiwan
23,776 28,183 29,156 28% 28% 28%
$ 20,455,175 $ 18,841,061 $ 17,701,081
The market prices of the associates’ ownership held by the Company in publicly traded stocks calculated by the closing price at the end of the reporting period are summarized as follows. The closing price represents the quoted price in active markets, the level 1 fair value measurement.
Name of Associate September 30,
2021 December 31,
2020 September 30,
2020 VIS $ 70,329,859 $ 53,849,925 $ 44,611,878 GUC $ 23,390,617 $ 15,827,184 $ 12,138,843 Xintec $ 14,188,445 $ 20,420,233 $ 13,019,985

- 20 -
14. PROPERTY, PLANT AND EQUIPMENT
September 30, 2021
December 31, 2020
September 30, 2020
Assets used by the Company $ 1,828,889,640 $ 1,554,585,938 $ 1,504,410,142 Assets subject to operating leases 4,925 1,003,182 27,977 $ 1,828,894,565 $ 1,555,589,120 $ 1,504,438,119 a. Assets used by the Company
Land and Land Improvements Buildings
Machinery and Equipment
Office Equipment
Equipment under Installation and Construction in
Progress Total Cost Balance at January 1, 2021 $ 3,942,625 $ 522,447,474 $ 3,607,005,732 $ 68,862,648 $ 223,965,360 $ 4,426,223,839 Additions 2,587,183 46,613,697 318,204,846 5,597,208 204,674,844 577,677,778 Disposals or retirements - (31,702 ) (11,832,893 ) (145,438 ) - (12,010,033 ) Transfers from assets subject
to operating leases - 35,478 1,443,590 - - 1,479,068
Transfers to assets subject to operating leases -
- (244,579 ) - - (244,579 )
Effect of exchange rate changes
(19,085 ) 44,863 614,474 (17,070 ) (192,162 ) 431,020
Balance at September 30,
2021 $ 6,510,723 $ 569,109,810 $ 3,915,191,170 $ 74,297,348 $ 428,448,042 $ 4,993,557,093 Accumulated depreciation and impairment Balance at January 1, 2021 $ 506,129 $ 271,799,471 $ 2,555,529,969 $ 43,802,332 $ - $ 2,871,637,901 Additions 998 25,530,181 271,954,105 6,091,281 - 303,576,565 Disposals or retirements - (27,770 ) (11,458,210 ) (144,616 ) - (11,630,596 ) Transfers from assets subject
to operating leases -
15,066
436,816
-
-
451,882 Transfers to assets subject to
operating leases - - (68,279 ) - - (68,279 ) Impairment - - 274,388 - - 274,388 Effect of exchange rate
changes
(4,201 ) (2,726 ) 447,113 (14,594 ) - 425,592 Balance at September 30,
2021 $ 502,926 $ 297,314,222 $ 2,817,115,902 $ 49,734,403 $ - $ 3,164,667,453 Carrying amounts at
January 1, 2021 $ 3,436,496 $ 250,648,003 $ 1,051,475,763 $ 25,060,316 $ 223,965,360 $ 1,554,585,938 Carrying amounts at
September 30, 2021 $ 6,007,797 $ 271,795,588 $ 1,098,075,268 $ 24,562,945 $ 428,448,042 $ 1,828,889,640
Cost Balance at January 1, 2020 $ 3,991,798 $ 438,075,063 $ 2,886,622,968 $ 54,611,364 $ 528,295,086 $ 3,911,596,279 Additions (deductions) - 77,864,221 660,847,245 11,947,069 (371,053,563 ) 379,604,972 Disposals or retirements - (40,840 ) (4,575,584 ) (377,899 ) - (4,994,323 ) Transfers from assets subject
to operating leases - 23,142 - - - 23,142
Effect of exchange rate changes
(26,732 ) (598,690 ) (1,999,085 ) (100,526 ) (87,627 ) (2,812,660 )
Balance at September 30,
2020 $ 3,965,066 $ 515,322,896 $ 3,540,895,544 $ 66,080,008 $ 157,153,896 $ 4,283,417,410
(Continued)

- 21 -
Land and Land Improvements Buildings
Machinery and Equipment
Office Equipment
Equipment under Installation and Construction in
Progress Total Accumulated depreciation and impairment Balance at January 1, 2020 $ 538,690 $ 243,059,390 $ 2,278,265,943 $ 37,418,395 $ - $ 2,559,282,418 Additions 1,140 21,082,267 200,520,703 5,135,311 - 226,739,421 Disposals or retirements - (27,084 ) (4,355,884 ) (376,173 ) - (4,759,141 ) Transfers from assets subject
to operating leases -
8,215
-
-
-
8,215 Impairment - - 10,159 - - 10,159 Effect of exchange rate
changes
(18,499 ) (405,913 ) (1,777,880 ) (71,512 ) - (2,273,804 )
Balance at September 30, 2020 $ 521,331 $ 263,716,875 $ 2,472,663,041 $ 42,106,021 $ - $ 2,779,007,268
Carrying amounts at
January 1, 2020 $ 3,453,108 $ 195,015,673 $ 608,357,025 $ 17,192,969 $ 528,295,086 $ 1,352,313,861 Carrying amounts at
September 30, 2020 $ 3,443,735 $ 251,606,021 $ 1,068,232,503 $ 23,973,987 $ 157,153,896 $ 1,504,410,142
(Concluded) The significant part of the Company’s buildings includes main plants, mechanical and electrical power equipment and clean rooms, and the related depreciation is calculated using the estimated useful lives of 20 years, 10 years and 10 years, respectively. In the first quarter of 2021, the Company recognized an impairment loss of NT$274,388 thousand for certain machinery and equipment that was assessed to have no future use, and the recoverable amount of certain machinery and equipment was nil. Such impairment loss was recognized in other operating income and expenses.
b. Assets subject to operating leases
Buildings Machinery and
Equipment Total Cost Balance at January 1, 2021 $ 227,529 $ 1,199,011 $ 1,426,540 Transfers to assets used by the Company (35,478) (1,443,590) (1,479,068) Transfers from assets used by the Company - 244,579 244,579 Balance at September 30, 2021 $ 192,051 $ - $ 192,051 Accumulated depreciation Balance at January 1, 2021 $ 201,366 $ 221,992 $ 423,358 Additions 826 146,545 147,371 Transfers to assets used by the Company (15,066) (436,816) (451,882) Transfers from assets used by the Company - 68,279 68,279 Balance at September 30, 2021 $ 187,126 $ - $ 187,126 Carrying amounts at January 1, 2021 $ 26,163 $ 977,019 $ 1,003,182 Carrying amounts at September 30, 2021 $ 4,925 $ - $ 4,925
(Continued)

- 22 -
Buildings Machinery and
Equipment Total Cost Balance at January 1, 2020 $ 562,610 $ - $ 562,610 Disposals or retirements (311,939) - (311,939) Transfers to assets used by the Company (23,142) - (23,142) Balance at September 30, 2020 $ 227,529 $ - $ 227,529 Accumulated depreciation Balance at January 1, 2020 $ 499,066 $ - $ 499,066 Additions 14,467 - 14,467 Disposals or retirements (305,766) - (305,766) Transfers to assets used by the Company (8,215) - (8,215) Balance at September 30, 2020 $ 199,552 $ - $ 199,552 Carrying amounts at January 1, 2020 $ 63,544 $ - $ 63,544 Carrying amounts at September 30, 2020 $ 27,977 $ - $ 27,977
(Concluded)
Operating leases relate to leases of buildings and leases of machinery and equipment with lease terms ranging between approximately 1 to 5 years. The lessees do not have purchase options to acquire the assets at the expiration of the lease periods. The maturity analysis of operating lease payments receivable from the buildings and machinery and equipment is as follows:
September 30,
2021 December 31,
2020 September 30,
2020 Year 1 $ 18,437 $ 149,120 $ 17,307 Year 2 4,248 16,992 16,992 Year 3 - - 4,248 $ 22,685 $ 166,112 $ 38,547
15. LEASE ARRANGEMENTS
a. Right-of-use assets
September 30,
2021 December 31,
2020 September 30,
2020 Carrying amounts Land $ 30,082,601 $ 25,141,908 $ 18,193,595 Buildings 2,843,518 2,544,742 2,588,685 Machinery and equipment 3,701 - - Office equipment 31,277 41,732 41,801
$ 32,961,097 $ 27,728,382 $ 20,824,081
- 23 -
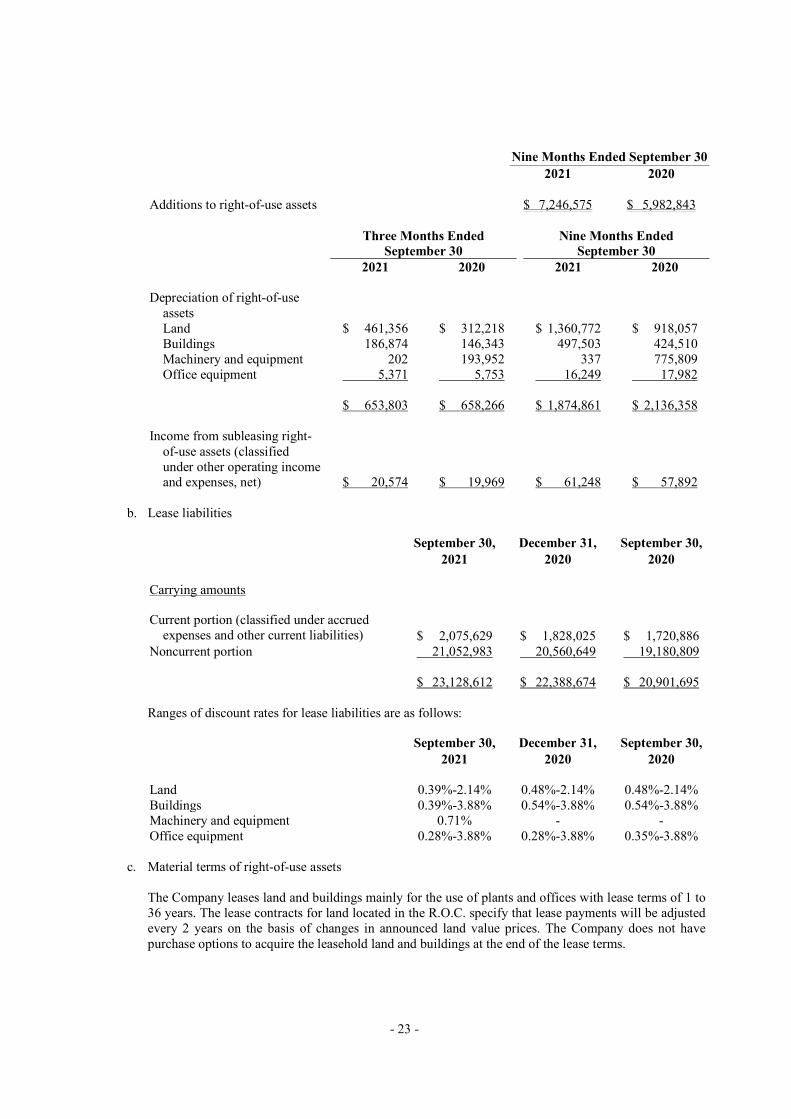
Nine Months Ended September 30 2021 2020 Additions to right-of-use assets $ 7,246,575 $ 5,982,843
Three Months Ended
September 30 Nine Months Ended
September 30 2021 2020 2021 2020 Depreciation of right-of-use
assets
Land $ 461,356 $ 312,218 $ 1,360,772 $ 918,057 Buildings 186,874 146,343 497,503 424,510 Machinery and equipment 202 193,952 337 775,809 Office equipment 5,371 5,753 16,249 17,982
$ 653,803 $ 658,266 $ 1,874,861 $ 2,136,358 Income from subleasing right-
of-use assets (classified under other operating income and expenses, net) $ 20,574 $ 19,969 $ 61,248 $ 57,892
b. Lease liabilities
September 30,
2021 December 31,
2020 September 30,
2020 Carrying amounts Current portion (classified under accrued
expenses and other current liabilities)
$ 2,075,629
$ 1,828,025
$ 1,720,886 Noncurrent portion 21,052,983 20,560,649 19,180,809
$ 23,128,612 $ 22,388,674 $ 20,901,695
Ranges of discount rates for lease liabilities are as follows:
September 30,
2021 December 31,
2020 September 30,
2020 Land 0.39%-2.14% 0.48%-2.14% 0.48%-2.14% Buildings 0.39%-3.88% 0.54%-3.88% 0.54%-3.88% Machinery and equipment 0.71% - - Office equipment 0.28%-3.88% 0.28%-3.88% 0.35%-3.88%
c. Material terms of right-of-use assets
The Company leases land and buildings mainly for the use of plants and offices with lease terms of 1 to 36 years. The lease contracts for land located in the R.O.C. specify that lease payments will be adjusted every 2 years on the basis of changes in announced land value prices. The Company does not have purchase options to acquire the leasehold land and buildings at the end of the lease terms.

- 24 -
d. Subleases
The Company subleases the right to use its buildings and machinery and equipment under operating leases with lease terms of 1 to 6 years. The maturity analysis of lease payments receivable under operating subleases is as follows:
September 30,
2021 December 31,
2020 September 30,
2020 Year 1 $ 57,855 $ 144,099 $ 56,473
e. Other lease information
Three Months Ended
September 30 Nine Months Ended
September 30 2021 2020 2021 2020 Expenses relating to short-term
leases
$ 1,295,891
$ 636,919
$ 3,884,773
$ 2,391,757 Expenses relating to variable
lease payments not included in the measurement of lease liabilities
$ 32,262
$ 36,751
$ 133,279
$ 133,905
Nine Months Ended
September 30 2021 2020 Total cash outflow for leases $ 5,495,274 $ 5,069,674
16. INTANGIBLE ASSETS
Goodwill Technology License Fees
Software and System Design
Costs Patent and
Others
Total Cost Balance at January 1, 2021 $ 5,436,602 $ 22,161,712 $ 36,238,967 $ 11,277,701 $ 75,114,982 Additions - 1,350,950 4,599,668 90,702 6,041,320 Disposals or retirements - - (21,134 ) - (21,134 ) Effect of exchange rate changes (31,638 ) (326 ) 1,420 140 (30,404 ) Balance at September 30, 2021 $ 5,404,964 $ 23,512,336 $ 40,818,921 $ 11,368,543 $ 81,104,764 Accumulated amortization and impairment Balance at January 1, 2021 $ - $ 12,226,066 $ 30,111,759 $ 7,008,978 $ 49,346,803 Additions - 2,004,389 3,226,688 902,365 6,133,442 Disposals or retirements - - (19,906 ) - (19,906 ) Effect of exchange rate changes - (326 ) 733 104 511 Balance at September 30, 2021 $ - $ 14,230,129 $ 33,319,274 $ 7,911,447 $ 55,460,850 Carrying amounts at January 1, 2021 $ 5,436,602 $ 9,935,646 $ 6,127,208 $ 4,268,723 $ 25,768,179 Carrying amounts at September 30, 2021 $ 5,404,964 $ 9,282,207 $ 7,499,647 $ 3,457,096 $ 25,643,914
(Continued)

- 25 -
Goodwill Technology License Fees
Software and System Design
Costs Patent and
Others
Total Cost Balance at January 1, 2020 $ 5,693,376 $ 15,854,951 $ 33,024,010 $ 8,302,996 $ 62,875,333 Additions - 6,263,480 1,863,640 2,974,885 11,102,005 Disposals or retirements - - (60,467 ) - (60,467 ) Effect of exchange rate changes (139,589 ) (3,120 ) (5,930 ) (485 ) (149,124 ) Balance at September 30, 2020 $ 5,553,787 $ 22,115,311 $ 34,821,253 $ 11,277,396 $ 73,767,747 Accumulated amortization and impairment Balance at January 1, 2020 $ - $ 9,823,770 $ 26,502,067 $ 5,896,468 $ 42,222,305 Additions - 1,710,904 2,760,196 801,459 5,272,559 Disposals or retirements - - (59,868 ) - (59,868 ) Effect of exchange rate changes - (3,120 ) (3,308 ) (334 ) (6,762 ) Balance at September 30, 2020 $ - $ 11,531,554 $ 29,199,087 $ 6,697,593 $ 47,428,234 Carrying amounts at January 1, 2020 $ 5,693,376 $ 6,031,181 $ 6,521,943 $ 2,406,528 $ 20,653,028 Carrying amounts at September 30, 2020 $ 5,553,787 $ 10,583,757 $ 5,622,166 $ 4,579,803 $ 26,339,513
(Concluded)
The Company’s goodwill has been tested for impairment at the end of the annual reporting period and the recoverable amount is determined based on the value in use. The value in use was calculated based on the cash flow forecast from the financial budgets covering the future five-year period, and the Company used annual discount rate of 8.0% in its test of impairment as of December 31, 2020 to reflect the relevant specific risk in the cash-generating unit.
17. SHORT-TERM LOANS
September 30, 2021
December 31, 2020
September 30, 2020
Unsecured loans
Amount $ 118,844,065 $ 88,559,026 $ 155,377,630
Loan content US$ (in thousands) $ - $ 200,000 $ 1,225,000 EUR (in thousands) 3,496,802 2,398,000 3,526,000 JPY (in thousands) 21,500,000 - - Annual interest rate (0.25)%-0.15% (0.54)%-0.33% (0.11)%-0.46% Maturity date Due by March
2022 Due by February
2021 Due by February
2021 18. BONDS PAYABLE
September 30, 2021
December 31, 2020
September 30, 2020
Domestic unsecured bonds $ 279,828,000 $ 173,197,000 $ 143,560,000 Overseas unsecured bonds 181,116,000 84,291,000 86,880,000 Less: Discounts on bonds payable (1,210,552) (782,916) (794,566) Less: Current portion - (2,600,000) (2,600,000)
$ 459,733,448 $ 254,105,084 $ 227,045,434

- 26 -
The Company issued domestic unsecured bonds for the nine months ended September 30, 2021, the major terms are as follows:
Issuance Tranche Issuance Period Total Amount Coupon
Rate Repayment and
Interest Payment
NT$ unsecured bonds
110-1 A March 2021 to
March 2026 $ 4,800,000 0.50% Bullet repayment;
interest payable annually
B March 2021 to March 2028
11,400,000 0.55% The same as above
C March 2021 to March 2031
4,900,000 0.60% The same as above
110-2 A May 2021 to May 2026
5,200,000 0.50% The same as above
B May 2021 to May 2028
8,400,000 0.58% The same as above
C May 2021 to May 2031
5,600,000 0.65% The same as above
110-3 A June 2021 to June 2026
6,900,000 0.52% The same as above
B June 2021 to June 2028
7,900,000 0.58% The same as above
C June 2021 to June 2031
4,900,000 0.65% The same as above
110-4 A August 2021 to August 2025
4,000,000 0.485% The same as above
B August 2021 to August 2026
8,000,000 0.50% The same as above
C August 2021 to August 2028
5,400,000 0.55% The same as above
D August 2021 to August 2031
4,200,000 0.62% The same as above
Issuance Tranche Issuance Period
Total Amount (US$
in Thousands) Coupon
Rate Repayment and
Interest Payment US$ unsecured bonds
110-5 - September 2021
to September 2051
US$ 1,000,000 3.10% Bullet repayment (callable on the 5th anniversary of the issue date and every anniversary thereafter); interest payable annually

- 27 -
The major terms of overseas unsecured bonds are as follows:
Issuance Period Total Amount (US$
in Thousands) Coupon Rate Repayment and Interest Payment September 2020
to September 2025
US$ 1,000,000
0.75%
Bullet repayment (callable at any time, in whole or in part, at the relevant redemption price according to relevant agreements); interest payable semi-annually
September 2020 to September 2027
750,000
1.00% The same as above
September 2020 to September 2030
1,250,000
1.375% The same as above
April 2021 to April 2026
1,100,000
1.25% The same as above
April 2021 to April 2028
900,000
1.75% The same as above
April 2021 to April 2031
1,500,000
2.25% The same as above
19. LONG-TERM BANK LOANS
September 30, 2021
December 31, 2020
September 30, 2020
Unsecured loans $ 3,510,000 $ 2,000,000 $ 1,000,000 Less: Discounts on government grants (37,810) (32,389) (17,551) $ 3,472,190 $ 1,967,611 $ 982,449 Loan content
Annual interest rate 0.4%-0.9% 0.4% 0.4% Maturity date Due by September
2026 Due by September
2025 Due by September
2025
The long-term bank loans of the Company are with preferential interest rates subsidized by the government, and the loans are used to fund capital expenditure qualifying for the subsidy.
20. EQUITY
a. Capital stock
September 30,
2021 December 31,
2020 September 30,
2020 Authorized shares (in thousands) 28,050,000 28,050,000 28,050,000 Authorized capital $ 280,500,000 $ 280,500,000 $ 280,500,000 Issued and paid shares (in thousands) 25,930,380 25,930,380 25,930,380 Issued capital $ 259,303,805 $ 259,303,805 $ 259,303,805
A holder of issued common shares with par value of NT$10 per share is entitled to vote and to receive dividends.

- 28 -
The authorized shares include 500,000 thousand shares allocated for the exercise of employee stock options. As of September 30, 2021, 1,064,288 thousand ADSs of TSMC were traded on the NYSE. The number of common shares represented by the ADSs was 5,321,441 thousand shares (one ADS represents five common shares).
b. Capital surplus
September 30,
2021 December 31,
2020 September 30,
2020 Additional paid-in capital $ 24,184,939 $ 24,184,939 $ 24,184,939 From merger 22,804,510 22,804,510 22,804,510 From convertible bonds 8,892,847 8,892,847 8,892,847 From difference between the consideration
received and the carrying amount of the subsidiaries’ net assets during actual disposal
8,406,282
-
- From share of changes in equities of
subsidiaries
114,865
121,843
121,843 From share of changes in equities of
associates
302,843
302,526
302,507 Donations 40,578 40,578 33,336 $ 64,746,864 $ 56,347,243 $ 56,339,982 Under the relevant laws, the capital surplus generated from the excess of the issuance price over the par value of capital stock (including the stock issued for new capital, mergers and convertible bonds), the difference between the consideration received and the carrying amount of the subsidiaries’ net assets during actual disposal and donations may be used to offset a deficit; in addition, when the Company has no deficit, such capital surplus may be distributed as cash dividends or stock dividends up to a certain percentage of TSMC’s paid-in capital. The capital surplus from share of changes in equities of subsidiaries and associates and dividend of a claim extinguished by a prescription may be used to offset a deficit.
c. Retained earnings and dividend policy
TSMC’s Articles of Incorporation provide that, earnings distribution may be made on a quarterly basis after the close of each quarter. Distribution of earnings by way of cash dividends should be approved by TSMC’s Board of Directors and reported to TSMC’s shareholders in its meeting. When allocating earnings, TSMC shall first estimate and reserve the taxes to be paid, offset its losses, set aside a legal capital reserve at 10% of the remaining earnings (until the accumulated legal capital reserve equals TSMC’s paid-in capital), then set aside a special capital reserve in accordance with relevant laws or regulations or as requested by the authorities in charge. Any balance left over shall be allocated according to relevant laws and the TSMC’s Articles of Incorporation. TSMC’s Articles of Incorporation also provide that profits of TSMC may be distributed by way of cash dividend and/or stock dividend. However, distribution of earnings shall be made preferably by way of cash dividend. Distribution of earnings may also be made by way of stock dividend, provided that the ratio for stock dividend shall not exceed 50% of the total distribution.
The legal capital reserve may be used to offset a deficit, or be distributed as dividends in cash or stocks for the portion in excess of 25% of the paid-in capital if the Company incurs no loss.

- 29 -
Pursuant to existing regulations, the Company is required to set aside additional special capital reserve equivalent to the net debit balance of the other components of stockholders’ equity, such as the accumulated balance of foreign currency translation reserve, unrealized valuation gain or loss from fair value through other comprehensive income financial assets, gain or loss from changes in fair value of hedging instruments in cash flow hedges, etc. For the subsequent decrease in the deduction amount to stockholders’ equity, any special reserve appropriated may be reversed to the extent that the net debit balance reverses. The appropriations of 2021, 2020 and 2019 quarterly earnings have been approved by TSMC’s Board of Directors in its meeting, respectively. The appropriations and cash dividends per share were as follows: Third Quarter Second Quarter First Quarter Resolution Date of TSMC’s of 2021 of 2021 of 2021 Board of Directors in its November 9, August 10, June 9, meeting 2021 2021 2021 Special capital reserve $ 710,169 $ 10,201,220 $ (6,287,050) Cash dividends to shareholders $ 71,308,546 $ 71,308,546 $ 71,308,546 Cash dividends per share (NT$) $ 2.75 $ 2.75 $ 2.75 Fourth Quarter Third Quarter Second Quarter First Quarter Resolution Date of TSMC’s of 2020 of 2020 of 2020 of 2020 Board of Directors in its February 9, November 10, August 11, May 12, meeting 2021 2020 2020 2020 Special capital reserve $ 12,420,727 $ 5,501,351 $ 11,884,457 $ (2,694,841) Cash dividends to shareholders $ 64,825,951 $ 64,825,951 $ 64,825,951 $ 64,825,951 Cash dividends per share (NT$) $ 2.5 $ 2.5 $ 2.5 $ 2.5 Fourth Quarter Third Quarter Second Quarter First Quarter Resolution Date of TSMC’s of 2019 of 2019 of 2019 of 2019 Board of Directors in its meeting
February 11, 2020
November 12, 2019
August 13, 2019
June 5, 2019
Special capital reserve $ 16,893,073 $ 3,289,166 $ (3,338,190) $ (4,723,939) Cash dividends to shareholders $ 64,825,951 $ 64,825,951 $ 64,825,951 $ 51,860,761 Cash dividends per share (NT$) $ 2.5 $ 2.5 $ 2.5 $ 2.0
d. Others
Changes in others were as follows: Nine Months Ended September 30, 2021
Foreign
Currency Translation
Reserve
Unrealized Gain (Loss) on
Financial Assets at FVTOCI
Gain (Loss) on Hedging
Instruments
Unearned Stock-Based
Employee Compensation
Total Balance, beginning of period $ (57,001,627 ) $ 2,321,754 $ - $ - $ (54,679,873 ) Exchange differences arising on translation of
foreign operations
(3,636,881 )
-
-
-
(3,636,881 ) Unrealized gain (loss) on financial assets at
FVTOCI
Equity instruments - 1,080,237 - - 1,080,237 Debt instruments - (2,027,175 ) - - (2,027,175 )
Cumulative unrealized gain (loss) of equity instruments transferred to retained earnings due to disposal
- 277,155 - - 277,155 Cumulative unrealized gain (loss) of debt
instruments transferred to profit or loss due to disposal
- (183,349 ) - - (183,349 )
(Continued)

- 30 -
Nine Months Ended September 30, 2021
Foreign
Currency Translation
Reserve
Unrealized Gain (Loss) on
Financial Assets at FVTOCI
Gain (Loss) on Hedging
Instruments
Unearned Stock-Based
Employee Compensation
Total Loss allowance adjustments from debt
instruments
$ -
$ 561
$ -
$ -
$ 561 Gain (loss) arising on changes in the fair
value of hedging instruments
-
-
(41,416 )
-
(41,416 ) Transferred to initial carrying amount of
hedged items
-
-
41,416
-
41,416 Share of other comprehensive income (loss)
of associates
(100,543 )
24,838
(3,106 )
-
(78,811 ) Income tax effect - (56,076 ) - - (56,076 ) Balance, end of period $ (60,739,051 ) $ 1,437,945 $ (3,106 ) $ - $ (59,304,212 )
(Concluded)
Nine Months Ended September 30, 2020
Foreign
Currency Translation
Reserve
Unrealized Gain (Loss) on
Financial Assets at FVTOCI
Gain (Loss) on Hedging
Instruments
Unearned Stock-Based
Employee Compensation
Total Balance, beginning of period $ (26,871,400 ) $ (692,959 ) $ (3,820 ) $ (190 ) $ (27,568,369 ) Exchange differences arising on translation of
foreign operations
(17,163,157 )
-
-
-
(17,163,157 ) Unrealized gain (loss) on financial assets at
FVTOCI
Equity instruments - 77,539 - - 77,539 Debt instruments - 3,928,369 - - 3,928,369
Cumulative unrealized gain (loss) of equity instruments transferred to retained earnings due to disposal
-
(309 )
-
-
(309 ) Cumulative unrealized gain (loss) of debt
instruments transferred to profit or loss due to disposal
- (1,327,251 ) - - (1,327,251 ) Loss allowance adjustments from debt
instruments
- (443 ) - - (443 ) Gain (loss) arising on changes in the fair
value of hedging instruments
-
-
22,942
-
22,942 Transferred to initial carrying amount of
hedged items
-
-
(19,122 )
-
(19,122 ) Share of other comprehensive income (loss)
of associates
(213,373 )
3,211
-
-
(210,162 ) Share of unearned stock-based employee
compensation of associates
-
-
-
190
190 Income tax effect - 627 - - 627 Balance, end of period $ (44,247,930 ) $ 1,988,784 $ - $ - $ (42,259,146 )
The aforementioned other equity includes the changes in other equities of TSMC and TSMC’s share of its subsidiaries and associates.
- 31 -
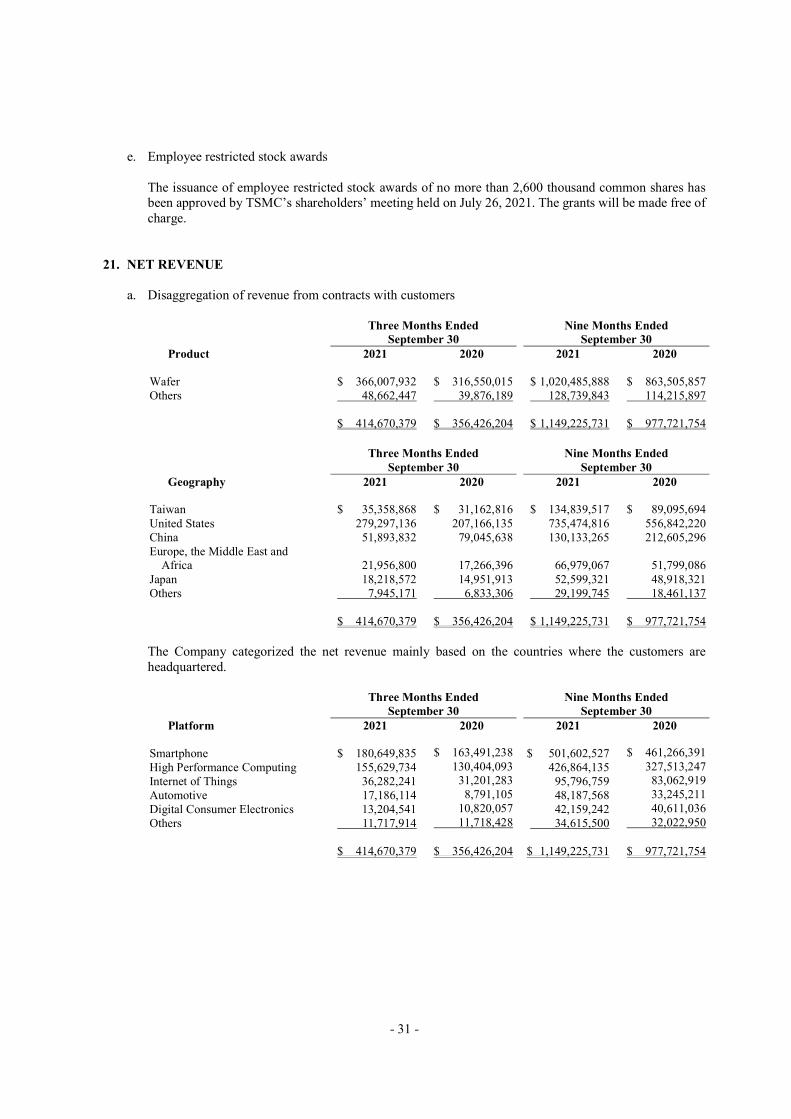
e. Employee restricted stock awards
The issuance of employee restricted stock awards of no more than 2,600 thousand common shares has been approved by TSMC’s shareholders’ meeting held on July 26, 2021. The grants will be made free of charge.
21. NET REVENUE
a. Disaggregation of revenue from contracts with customers
Three Months Ended
September 30 Nine Months Ended
September 30 Product 2021 2020 2021 2020 Wafer $ 366,007,932 $ 316,550,015 $ 1,020,485,888 $ 863,505,857 Others 48,662,447 39,876,189 128,739,843 114,215,897 $ 414,670,379 $ 356,426,204 $ 1,149,225,731 $ 977,721,754
Three Months Ended
September 30 Nine Months Ended
September 30 Geography 2021 2020 2021 2020 Taiwan $ 35,358,868 $ 31,162,816 $ 134,839,517 $ 89,095,694 United States 279,297,136 207,166,135 735,474,816 556,842,220 China 51,893,832 79,045,638 130,133,265 212,605,296 Europe, the Middle East and
Africa
21,956,800 17,266,396 66,979,067 51,799,086 Japan 18,218,572 14,951,913 52,599,321 48,918,321 Others 7,945,171 6,833,306 29,199,745 18,461,137 $ 414,670,379 $ 356,426,204 $ 1,149,225,731 $ 977,721,754
The Company categorized the net revenue mainly based on the countries where the customers are headquartered.
Three Months Ended
September 30 Nine Months Ended
September 30 Platform 2021 2020 2021 2020
Smartphone $ 180,649,835 $ 163,491,238 $ 501,602,527 $ 461,266,391 High Performance Computing 155,629,734 130,404,093 426,864,135 327,513,247 Internet of Things 36,282,241 31,201,283 95,796,759 83,062,919 Automotive 17,186,114 8,791,105 48,187,568 33,245,211 Digital Consumer Electronics 13,204,541 10,820,057 42,159,242 40,611,036 Others 11,717,914 11,718,428 34,615,500 32,022,950 $ 414,670,379 $ 356,426,204 $ 1,149,225,731 $ 977,721,754

- 32 -
Three Months Ended September 30
Nine Months Ended September 30
Resolution 2021 2020 2021 2020
5-nanometer $ 66,930,524 $ 25,829,998 $ 173,733,470 $ 25,829,998 7-nanometer 122,606,053 109,428,962 334,954,675 305,365,603 10-nanometer 14,701 766,811 643,187 2,770,348 16-nanometer 48,812,969 55,726,975 139,462,708 155,855,314 20-nanometer 1,203,472 2,415,743 3,734,272 6,512,124 28-nanometer 37,739,348 37,682,521 111,922,338 114,161,676 40/45-nanometer 27,233,876 26,360,109 74,029,676 78,505,193 65-nanometer 16,189,697 15,184,482 48,148,098 46,745,439 90-nanometer 6,998,277 7,670,558 24,753,997 22,970,808 0.11/0.13 micron 10,382,373 8,349,281 28,387,457 22,947,184 0.15/0.18 micron 22,268,008 21,894,064 63,875,473 65,173,244 0.25 micron and above 5,628,634 5,240,511 16,840,537 16,668,926 Wafer revenue $ 366,007,932 $ 316,550,015 $ 1,020,485,888 $ 863,505,857
b. Contract balances
September 30,
2021 December 31,
2020 September 30,
2020 January 1,
2020
Contract liabilities (classified under accrued expenses and other current liabilities)
$ 33,659,796
$ 13,775,088
$ 10,807,208 $ 6,784,323 The changes in the contract liability balances primarily result from the timing difference between the satisfaction of performance obligation and the customer’s payment. The Company recognized revenue from the beginning balance of contract liability, which amounted to NT$492,255 thousand and NT$412,178 thousand for the three months ended September 30, 2021 and 2020, respectively; and NT$11,296,660 thousand and NT$4,421,939 thousand for the nine months ended September 30, 2021 and 2020, respectively.
c. Temporary receipts from customers
September 30,
2021 Current portion (classified under accrued
expenses and other current liabilities)
$ 16,200,130 Noncurrent portion (classified under other
noncurrent liabilities)
90,128,894 $ 106,329,024 The Company’s temporary receipts from customer are payments made by customers to the Company to retain the Company’s capacity. When the terms and conditions set forth in the agreements are subsequently satisfied, the treatment of temporary receipts will be determined by mutual consent.

- 33 -
22. INTEREST INCOME
Three Months Ended September 30
Nine Months Ended September 30
2021 2020 2021 2020
Interest income Bank deposits $ 686,841 $ 969,406 $ 2,026,308 $ 4,341,478 Financial assets at FVTPL - 883 - 2,651 Financial assets at FVTOCI 509,785 738,287 1,685,252 2,443,186 Financial assets at amortized cost 159,918 189,387 534,569 578,079 $ 1,356,544 $ 1,897,963 $ 4,246,129 $ 7,365,394
23. FINANCE COSTS
Three Months Ended September 30
Nine Months Ended September 30
2021 2020 2021 2020
Interest expense Corporate bonds $ 1,282,154 $ 256,406 $ 3,080,458 $ 645,061 Lease liabilities 47,895 49,517 144,822 177,892 Bank loans 3,924 60,328 15,017 474,525 Others 90 6,913 260 15,395
$ 1,334,063 $ 373,164 $ 3,240,557 $ 1,312,873
24. OTHER GAINS AND LOSSES, NET
Three Months Ended September 30
Nine Months Ended September 30
2021 2020 2021 2020
Gain on disposal of financial assets, net
Investments in debt instruments at FVTOCI
$ 14,015
$ 400,332
$ 183,349
$ 1,327,251
Gain (loss) on financial instruments at FVTPL, net
Mandatorily measured at FVTPL (2,572,629) 5,612,561 (4,971,538) 4,104,770 The reversal (accrual) of expected
credit loss of financial assets
Investments in debt instruments
at FVTOCI
1,056
188
(561)
443 Financial assets at amortized cost 906 (4,219) 5,807 (4,662)
Other gains (losses), net (11,435) 142,133 261,693 221,360 $ (2,568,087) $ 6,150,995 $ (4,521,250) $ 5,649,162

- 34 -
25. INCOME TAX
a. Income tax expense recognized in profit or loss
Income tax expense consisted of the following:
Three Months Ended
September 30 Nine Months Ended
September 30 2021 2020 2021 2020 Current income tax expense
Current tax expense recognized in the current period
$ 22,861,314
$ 19,115,987 $ 62,738,892 $ 52,290,738 Income tax adjustments on
prior years
53,479
14,349 211,922 89,979 Other income tax
adjustments
40,188
(34,218)
110,074 (113,680) 22,954,981 19,096,118 63,060,888 52,267,037
Deferred income tax benefit The origination and reversal
of temporary differences
(4,150,348)
(1,350,266) (11,388,659) (3,930,776) Investment tax credits (1,432,148) - (4,064,745) - (5,582,496) (1,350,266) (15,453,404) (3,930,776)
Income tax expense recognized
in profit or loss
$ 17,372,485
$ 17,745,852 $ 47,607,484 $ 48,336,261
b. Income tax expense recognized in other comprehensive income
Three Months Ended
September 30 Nine Months Ended
September 30 2021 2020 2021 2020 Deferred income tax benefit
(expense)
Related to unrealized
gain/loss on investments in equity instruments at FVTOCI
$ (231)
$ 161 $ (56,076) $ 627 c. Income tax examination
The tax authorities have examined income tax returns of TSMC through 2019. All investment tax credit adjustments assessed by the tax authorities have been recognized accordingly.
26. EARNINGS PER SHARE
Three Months Ended
September 30 Nine Months Ended
September 30 2021 2020 2021 2020 Basic EPS $ 6.03 $ 5.30 $ 16.59 $ 14.47 Diluted EPS $ 6.03 $ 5.30 $ 16.59 $ 14.47

- 35 -
EPS is computed as follows:
Amounts (Numerator)
Number of Shares
(Denominator) (In Thousands)
EPS (NT$) Three months ended September 30, 2021 Basic/Diluted EPS
Net income available to common shareholders of the parent
$ 156,258,287 25,930,380 $ 6.03
Three months ended September 30, 2020 Basic/Diluted EPS
Net income available to common shareholders of the parent
$ 137,310,040 25,930,380 $ 5.30
Nine months ended September 30, 2021 Basic/Diluted EPS
Net income available to common shareholders of the parent
$ 430,307,722 25,930,380 $ 16.59
Nine months ended September 30, 2020 Basic/Diluted EPS
Net income available to common shareholders of the parent
$ 375,118,953 25,930,380 $ 14.47
27. ADDITIONAL INFORMATION OF EXPENSES BY NATURE
Three Months Ended
September 30 Nine Months Ended
September 30 2021 2020 2021 2020 a. Depreciation of property, plant
and equipment and right-of-use assets
Recognized in cost of revenue $ 97,830,855 $ 86,576,054 $ 284,777,952 $ 210,020,400 Recognized in operating
expenses
7,057,572
6,245,834 20,673,474 18,855,379 Recognized in other operating
income and expenses
13,317
3,049 147,371 14,467 $ 104,901,744 $ 92,824,937 $ 305,598,797 $ 228,890,246

- 36 -
Three Months Ended
September 30 Nine Months Ended
September 30 2021 2020 2021 2020 b. Amortization of intangible
assets
Recognized in cost of revenue $ 1,468,312 $ 1,337,967 $ 4,150,177 $ 3,512,941 Recognized in operating
expenses
656,707
570,172 1,983,265 1,759,618 $ 2,125,019 $ 1,908,139 $ 6,133,442 $ 5,272,559
c. Employee benefits expenses
Post-employment benefits
Defined contribution plans $ 999,238 $ 729,803 $ 2,713,067 $ 2,069,138 Defined benefit plans 48,112 51,216 144,344 153,658
1,047,350 781,019 2,857,411 2,222,796 Other employee benefits 41,636,272 35,883,467 117,318,335 100,883,978
$ 42,683,622 $ 36,664,486 $ 120,175,746 $ 103,106,774
Employee benefits expense summarized by function
Recognized in cost of revenue
$ 25,364,310
$ 21,551,904 $ 71,684,550 $ 61,033,439
Recognized in operating expenses
17,319,312
15,112,582 48,491,196 42,073,335
$ 42,683,622 $ 36,664,486 $ 120,175,746 $ 103,106,774
According to TSMC’s Articles of Incorporation, TSMC shall allocate compensation to directors and profit sharing bonus to employees of TSMC not more than 0.3% and not less than 1% of annual profits during the period, respectively.
TSMC accrued profit sharing bonus to employees based on a percentage of net income before income tax, profit sharing bonus to employees and compensation to directors during the period; compensation to directors was expensed based on estimated amount payable. If there is a change in the proposed amounts after the annual consolidated financial statements are authorized for issue, the differences are recorded as a change in accounting estimate. Accrued profit sharing bonus to employees is illustrated below:
Three Months Ended
September 30 Nine Months Ended
September 30 2021 2020 2021 2020 Profit sharing bonus to employees $ 9,326,508 $ 9,219,036 $ 25,685,342 $ 25,182,341

- 37 -
TSMC’s profit sharing bonus to employees and compensation to directors for 2020 and 2019 had been approved by the Board of Directors of TSMC, as illustrated below: Years Ended December 31 2020 2019 February 9, February 11, Resolution Date of TSMC’s Board of Directors in its meeting 2021 2020 Profit sharing bonus to employees $ 34,753,184 $ 23,165,745 Compensation to directors $ 509,753 $ 360,404 There is no significant difference between the aforementioned approved amounts and the amounts charged against earnings of 2020 and 2019, respectively. The information about the appropriations of TSMC’s profit sharing bonus to employees and compensation to directors is available at the Market Observation Post System website.
28. CASH FLOW INFORMATION
a. Non-cash transactions
Nine Months Ended September 30 2021 2020
Additions of financial assets at FVTOCI $ 200,469,936 $ 195,269,785 Conversion of convertible bonds into equity securities - (120,548) Changes in accrued expenses and other current liabilities (5,028,178) (9,522,053) Payments for acquisition of financial assets at FVTOCI $ 195,441,758 $ 185,627,184 Disposal of financial assets at FVTOCI $ 197,256,267 $ 193,363,747 Changes in other financial assets 1,483,350 (1,603,157) Proceeds from disposal of financial assets at FVTOCI $ 198,739,617 $ 191,760,590 Additions of property, plant and equipment $ 577,677,778 $ 379,604,972 Changes in other financial assets 761,893 561,993 Exchange of assets - (1,148) Changes in payables to contractors and equipment suppliers 25,241,444 38,378,772 Transferred to initial carrying amount of hedged items (41,416) 19,122 Payments for acquisition of property, plant and equipment $ 603,639,699 $ 418,563,711 Additions of intangible assets $ 6,041,320 $ 11,102,005 Changes in other financial assets 2,700 8,064 Changes in account payable - 191,429 Changes in accrued expenses and other current liabilities (366,495) (2,597,259) Payments for acquisition of intangible assets $ 5,677,525 $ 8,704,239

- 38 -
b. Reconciliation of liabilities arising from financing activities
Non-cash changes
Balance as of
January 1, 2021 Financing Cash
Flow
Foreign Exchange Movement
Leases Modifications
Other Changes (Note)
Balance as of September 30,
2021
Short-term loans $ 88,559,026 $ 37,530,131 $ (6,830,906 ) $ - $ (414,186 ) $ 118,844,065 Bonds payable 256,705,084 204,198,161 (1,272,285 ) - 102,488 459,733,448 Long-term bank loans 1,967,611 1,510,000 - - (5,421 ) 3,472,190 Lease liabilities 22,388,674 (1,595,286 ) (47,830 ) 2,238,232 144,822 23,128,612 Total $ 369,620,395 $ 241,643,006 $ (8,151,021 ) $ 2,238,232 $ (172,297 ) $ 605,178,315
Non-cash changes
Balance as of
January 1, 2020 Financing Cash
Flow
Foreign Exchange Movement
Leases Modifications
Other Changes (Note)
Balance as of September 30,
2020
Short-term loans $ 118,522,290 $ 35,775,039 $ 1,080,301 $ - $ - $ 155,377,630 Bonds payable 56,900,000 174,067,622 (1,327,304 ) - 5,116 229,645,434 Long-term bank loans - 1,000,000 - - (17,551 ) 982,449 Lease liabilities 17,316,917 (2,322,231 ) (35,975 ) 5,765,092 177,892 20,901,695 Total $ 192,739,207 $ 208,520,430 $ (282,978 ) $ 5,765,092 $ 165,457 $ 406,907,208
Note: Other changes include discounts on short-term loans, amortization of bonds payable, amortization of long-term bank
loan interest subsidy and financial cost of lease liabilities. 29. FINANCIAL INSTRUMENTS
a. Categories of financial instruments
September 30,
2021 December 31,
2020 September 30,
2020 Financial assets
FVTPL (Note 1) $ 33,956 $ 2,259,412 $ 2,526,481 FVTOCI (Note 2) 131,158,674 129,918,694 137,047,813 Hedging financial assets 37,769 47 - Amortized cost (Note 3) 1,055,535,934 826,293,705 785,199,805
$1,186,766,333 $ 958,471,858 $ 924,774,099 Financial liabilities
FVTPL (Note 4) $ 1,405,470 $ 94,128 $ 1,445,911 Hedging financial liabilities - 1,169 11,839 Amortized cost (Note 5) 1,098,592,492 748,129,332 724,649,788
$1,099,997,962 $ 748,224,629 $ 726,107,538 Note 1: Financial assets mandatorily measured at FVTPL. Note 2: Including notes and accounts receivable (net), equity and debt investments. Note 3: Including cash and cash equivalents, financial assets at amortized cost, notes and accounts
receivable (including related parties), other receivables and refundable deposits. Note 4: Held for trading. Note 5: Including short-term loans, accounts payable (including related parties), payables to contractors
and equipment suppliers, cash dividends payable, accrued expenses and other current liabilities, bonds payable, long-term bank loans, guarantee deposits and other noncurrent liabilities.

- 39 -
b. Financial risk management objectives
The Company manages its exposure to foreign currency risk, interest rate risk, equity price risk, credit risk and liquidity risk with the objective to reduce the potentially adverse effects the market uncertainties may have on its financial performance. The plans for material treasury activities are reviewed by the Audit Committees and/or Board of Directors in accordance with procedures required by relevant regulations or internal controls. During the implementation of such plans, the Company must comply with certain treasury procedures that provide guiding principles for overall financial risk management and segregation of duties.
c. Market risk The Company is exposed to the financial market risks, primarily changes in foreign currency exchange rates, interest rates and equity investment prices. A portion of these risks is hedged. Foreign currency risk Substantially all the Company’s sales are denominated in U.S. dollars and over half of its capital expenditures are denominated in currencies other than NT dollars, primarily in U.S. dollars, Japanese yen and Euros. As a result, any significant fluctuations to its disadvantage in the exchanges rate of NT dollar against such currencies, in particular a weakening of U.S. dollar against NT dollar, would have an adverse impact on the revenue and operating profit as expressed in NT dollars. The Company uses foreign currency derivative contracts, such as currency forwards or currency swaps, to protect against currency exchange rate risks associated with non-NT dollar-denominated assets and liabilities and certain forecasted transactions. These hedges reduce, but do not entirely eliminate, the effect of foreign currency exchange rate movements on the assets and liabilities. Based on a sensitivity analysis performed on the Company’s total monetary assets and liabilities for the nine months ended September 30, 2021 and 2020, a hypothetical adverse foreign currency exchange rate change of 10% would have decreased its net income by NT$542,268 thousand and NT$374,923 thousand for the nine months ended September 30, 2021 and 2020, respectively, after taking into account hedges and offsetting positions. Interest rate risk The Company is exposed to interest rate risks primarily related to its investment portfolio and outstanding debt. Changes in interest rates affect the interest earned on the Company’s cash and cash equivalents and fixed income securities, the fair value of those securities, as well as the interest paid on its debt. The Company’s cash and cash equivalents as well as fixed income investments in both fixed- and floating-rate securities carry a degree of interest rate risk. The majority of the Company’s fixed income investments are fixed-rate securities, which are classified as financial assets at FVTOCI, and may have their fair value adversely affected due to a rise in interest rates. At the same time, if interest rates fall, cash and cash equivalents as well as floating-rate securities may generate less interest income than expected. The Company has entered and may in the future enter into interest rate futures to partially hedge the interest rate risk on its fixed income investments. However, these hedges can offset only a small portion of the financial impact from movements in interest rates. Based on a sensitivity analysis performed on the Company’s fixed income investments at the end of the reporting period, interest rates increase of 100 basis points (1.00%) across all maturities would have decreased the Company’s other comprehensive income by NT$3,871,576 thousand and NT$3,419,947 thousand for the nine months ended September 30, 2021 and 2020, respectively.

- 40 -
All of the Company’s short-term debt is floating-rate, hence a rise in interest rates may result in higher interest expense than expected. The majority of the Company’s long-term debt is fixed-rate and measured at amortized cost and as such, changes in interest rates would not affect the future cash flows and the carrying amount. Other price risk The Company is exposed to equity price risk arising from financial assets at FVTOCI. Assuming a hypothetical decrease of 10% in prices of the equity investments at the end of the reporting period for the nine months ended September 30, 2021 and 2020, the other comprehensive income would have decreased by NT$567,419 thousand and NT$419,845 thousand, respectively.
d. Credit risk management Credit risk refers to the risk that a counterparty will default on its contractual obligations resulting in financial losses to the Company. The Company is exposed to credit risks from operating activities, primarily accounts receivable, and from investing activities, primarily deposits, fixed-income investments and other financial instruments with banks. Credit risk is managed separately for business related and financial related exposures. As of the end of the reporting period, the Company’s maximum credit risk exposure is equal to the carrying amount of financial assets. Business related credit risk The Company’s accounts receivable are from its customers worldwide. The majority of the Company’s outstanding accounts receivable are not covered by collaterals or guarantees. While the Company has procedures to monitor and manage credit risk exposure on accounts receivable, there is no assurance such procedures will effectively eliminate losses resulting from its credit risk. This risk is heightened during periods when economic conditions worsen. As of September 30, 2021, December 31, 2020 and September 30, 2020, the Company’s ten largest customers accounted for 80%, 79% and 82% of accounts receivable, respectively. The Company considers the concentration of credit risk for the remaining accounts receivable not material. Financial credit risk The Company mitigates its financial credit risk by selecting counterparties with investment grade credit ratings and by limiting the exposure to any individual counterparty. The Company regularly monitors and reviews the limit applied to counterparties and adjusts the limit according to market conditions and the credit standing of the counterparties.
The objective of the Company’s investment policy is to achieve a return that will allow the Company to preserve principal and support liquidity requirements. The policy generally requires securities to be investment grade and limits the amount of credit exposure to any one issuer. The Company assesses whether there has been a significant increase in credit risk in the invested securities since initial recognition by reviewing changes in external credit ratings, financial market conditions and material information of the issuers.

- 41 -
The Company assesses the 12-month expected credit loss and lifetime expected credit loss based on the probability of default and loss given default provided by external credit rating agencies. The current credit risk assessment policies are as follows:
Category
Description Basis for Recognizing Expected Credit Loss
Expected Credit Loss
Ratio
Performing Credit rating is investment grade on valuation date
12 months expected credit loss
0-0.1%
Doubtful Credit rating is non-investment grade on valuation date
Lifetime expected credit loss-not credit impaired
-
In default Credit rating is CC or below on valuation date
Lifetime expected credit loss-credit impaired
-
Write-off There is evidence indicating that the debtor is in severe financial difficulty and the Company has no realistic prospect of recovery
Amount is written off -
For the nine months ended September 30, 2021 and 2020, the expected credit loss decreased NT$5,556 thousand and increased NT$2,825 thousand, respectively. The changes were mainly due to investment portfolio adjustment.
e. Liquidity risk management
The objective of liquidity risk management is to ensure the Company has sufficient liquidity to fund its business operations over the next 12 months. The Company manages its liquidity risk by maintaining adequate cash and cash equivalents, financial assets at FVTOCI-current, financial assets at amortized cost-current and sufficient cost-efficient funding. The table below summarizes the maturity profile of the Company’s financial liabilities based on contractual undiscounted payments, including principal and interest.
Less Than
1 Year 1-3 Years 3-5 Years More Than
5 Years Total September 30, 2021 Non-derivative financial liabilities Short-term loans $ 118,660,406 $ - $ - $ - $ 118,660,406 Accounts payable (including related
parties) 43,888,861 - - - 43,888,861 Payables to contractors and
equipment suppliers 128,367,724 - - - 128,367,724 Accrued expenses and other current
liabilities 103,426,537 - - - 103,426,537 Bonds payable 5,785,181 38,720,687 126,849,991 372,476,536 543,832,395 Long-term bank loans 17,021 2,086,920 1,454,963 - 3,558,904 Lease liabilities (including those
classified under accrued expenses and other current liabilities) 2,272,985 3,796,655 3,390,634 15,056,590 24,516,864
Others - 97,521,348 - - 97,521,348 402,418,715 142,125,610 131,695,588 387,533,126 1,063,773,039 Derivative financial instruments Forward exchange contracts
Outflows 176,212,206 - - - 176,212,206 Inflows (175,119,313 ) - - - (175,119,313 )
1,092,893 - - - 1,092,893 $ 403,511,608 $ 142,125,610 $ 131,695,588 $ 387,533,126 $ 1,064,865,932
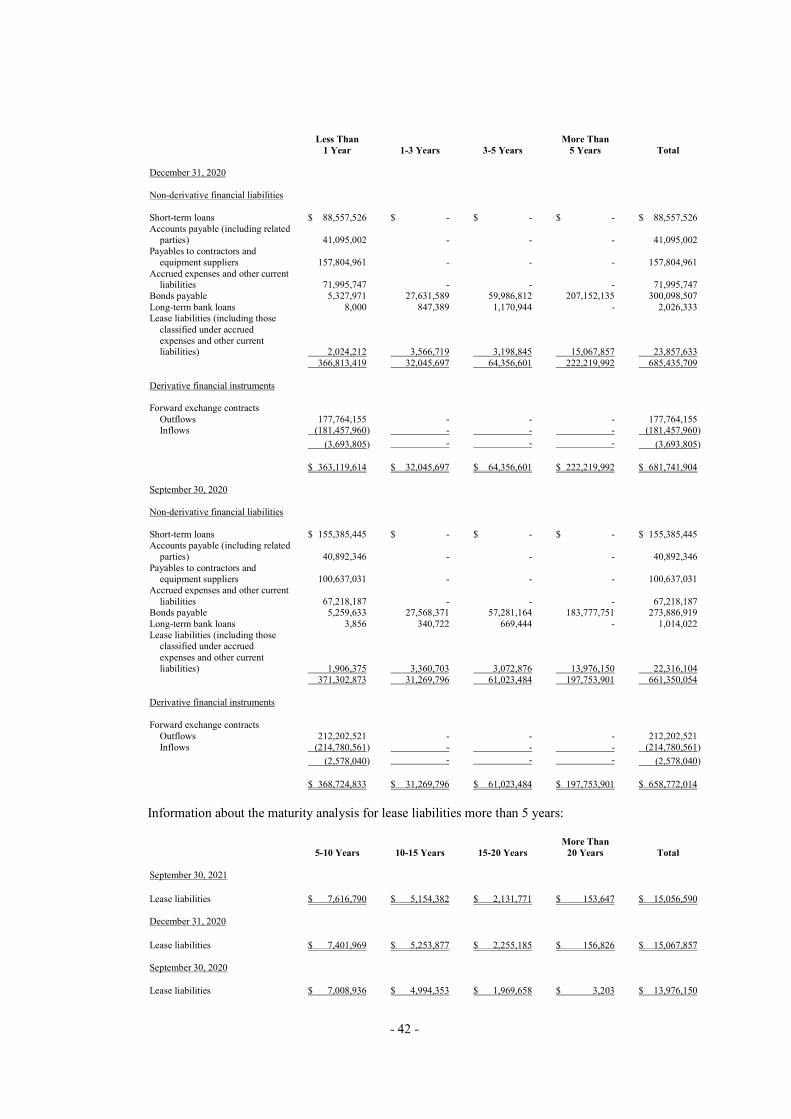
- 42 -
Less Than
1 Year 1-3 Years 3-5 Years More Than
5 Years Total December 31, 2020 Non-derivative financial liabilities Short-term loans $ 88,557,526 $ - $ - $ - $ 88,557,526 Accounts payable (including related
parties) 41,095,002 - - - 41,095,002 Payables to contractors and
equipment suppliers 157,804,961 - - - 157,804,961 Accrued expenses and other current
liabilities 71,995,747 - - - 71,995,747 Bonds payable 5,327,971 27,631,589 59,986,812 207,152,135 300,098,507 Long-term bank loans 8,000 847,389 1,170,944 - 2,026,333 Lease liabilities (including those
classified under accrued expenses and other current liabilities) 2,024,212 3,566,719 3,198,845 15,067,857 23,857,633
366,813,419 32,045,697 64,356,601 222,219,992 685,435,709 Derivative financial instruments Forward exchange contracts
Outflows 177,764,155 - - - 177,764,155 Inflows (181,457,960 ) - - - (181,457,960 )
(3,693,805 ) - - - (3,693,805 ) $ 363,119,614 $ 32,045,697 $ 64,356,601 $ 222,219,992 $ 681,741,904
September 30, 2020 Non-derivative financial liabilities Short-term loans $ 155,385,445 $ - $ - $ - $ 155,385,445 Accounts payable (including related
parties) 40,892,346 - - - 40,892,346 Payables to contractors and
equipment suppliers 100,637,031 - - - 100,637,031 Accrued expenses and other current
liabilities 67,218,187 - - - 67,218,187 Bonds payable 5,259,633 27,568,371 57,281,164 183,777,751 273,886,919 Long-term bank loans 3,856 340,722 669,444 - 1,014,022 Lease liabilities (including those
classified under accrued expenses and other current liabilities) 1,906,375 3,360,703 3,072,876 13,976,150 22,316,104
371,302,873 31,269,796 61,023,484 197,753,901 661,350,054 Derivative financial instruments Forward exchange contracts
Outflows 212,202,521 - - - 212,202,521 Inflows (214,780,561 ) - - - (214,780,561 )
(2,578,040 ) - - - (2,578,040 ) $ 368,724,833 $ 31,269,796 $ 61,023,484 $ 197,753,901 $ 658,772,014
Information about the maturity analysis for lease liabilities more than 5 years:
5-10 Years 10-15 Years 15-20 Years More Than
20 Years Total
September 30, 2021
Lease liabilities $ 7,616,790 $ 5,154,382 $ 2,131,771 $ 153,647 $ 15,056,590
December 31, 2020
Lease liabilities $ 7,401,969 $ 5,253,877 $ 2,255,185 $ 156,826 $ 15,067,857
September 30, 2020 Lease liabilities $ 7,008,936 $ 4,994,353 $ 1,969,658 $ 3,203 $ 13,976,150

- 43 -
f. Fair value of financial instruments
1) Fair value measurements recognized in the consolidated balance sheets Fair value measurements are grouped into Levels 1 to 3 based on the degree to which the fair value is observable: Level 1 fair value measurements are those derived from quoted prices (unadjusted) in active
markets for identical assets or liabilities; Level 2 fair value measurements are those derived from inputs other than quoted prices included
within Level 1 that are observable for the asset or liability, either directly (i.e. as prices) or indirectly (i.e. derived from prices); and
Level 3 fair value measurements are those derived from valuation techniques that include inputs
for the asset or liability that are not based on observable market data (unobservable inputs). The timing of transfers between levels within the fair value hierarchy is at the end of reporting period.
2) Fair value of financial instruments that are measured at fair value on a recurring basis
Fair value hierarchy The following table presents the Company’s financial assets and liabilities measured at fair value on a recurring basis: September 30, 2021 Level 1 Level 2 Level 3 Total Financial assets at FVTPL Mandatorily measured at FVTPL
Forward exchange contracts $ - $ 33,956 $ - $ 33,956
Financial assets at FVTOCI Investments in debt instruments
Corporate bonds $ - $ 58,340,908 $ - $ 58,340,908 Agency bonds/Agency
mortgage-backed securities
- 33,836,903 -
33,836,903 Government bonds 22,399,723 80,026 - 22,479,749 Asset-backed securities - 7,219,193 - 7,219,193
Investments in equity instruments Non-publicly traded equity
investments
- - 5,729,779 5,729,779 Publicly traded stocks 59,125 - - 59,125
Notes and accounts receivable, net - 3,493,017 - 3,493,017
$ 22,458,848 $ 102,970,047 $ 5,729,779 $ 131,158,674 Hedging financial assets Fair value hedges
Interest rate futures contracts $ 37,769 - $ - $ 37,769 (Continued)

- 44 -
September 30, 2021 Level 1 Level 2 Level 3 Total Financial liabilities at FVTPL
Held for trading
Forward exchange contracts $ - $ 1,405,470 $ - $ 1,405,470 (Concluded)
December 31, 2020 Level 1 Level 2 Level 3 Total Financial assets at FVTPL Mandatorily measured at FVTPL
Forward exchange contracts $ - $ 2,259,412 $ - $ 2,259,412
Financial assets at FVTOCI
Investments in debt instruments Corporate bonds $ - $ 56,593,623 $ - $ 56,593,623 Agency bonds/Agency
mortgage-backed securities
- 43,977,113 -
43,977,113 Government bonds 13,279,154 180,349 - 13,459,503 Asset-backed securities - 8,368,264 - 8,368,264
Investments in equity instruments Non-publicly traded equity
investments
- - 4,514,940 4,514,940 Publicly traded stocks 49,950 - - 49,950
Notes and accounts receivable, net - 2,955,301 - 2,955,301
$ 13,329,104 $ 112,074,650 $ 4,514,940 $ 129,918,694 Hedging financial assets Fair value hedges
Interest rate futures contracts $ 47 $ - $ - $ 47 Financial liabilities at FVTPL Held for trading
Forward exchange contracts $ - $ 94,128 $ - $ 94,128
Hedging financial liabilities
Fair value hedges
Interest rate futures contracts $ 1,169 $ - $ - $ 1,169
Because certain equity investment’s quoted price (unadjusted) in active markets became available in the fourth quarter of 2020, its fair value hierarchy was transferred from Level 2 to Level 1.

- 45 -
September 30, 2020 Level 1 Level 2 Level 3 Total Financial assets at FVTPL Mandatorily measured at FVTPL
Forward exchange contracts $ - $ 2,496,103 $ - $ 2,496,103 Agency mortgage-backed
securities
-
30,378
-
30,378
$ - $ 2,526,481 $ - $ 2,526,481 Financial assets at FVTOCI Investments in debt instruments
Corporate bonds $ - $ 58,950,049 $ - $ 58,950,049 Agency bonds/Agency
mortgage-backed securities
- 48,699,955 -
48,699,955 Government bonds 11,620,134 186,022 - 11,806,156 Asset-backed securities - 9,152,592 - 9,152,592
Investments in equity instruments Non-publicly traded equity
investments
- 66,394 4,238,963 4,305,357 Notes and accounts receivable, net - 4,133,704 - 4,133,704
$ 11,620,134 $ 121,188,716 $ 4,238,963 $ 137,047,813 Financial liabilities at FVTPL Held for trading
Forward exchange contracts $ - $ 1,445,911 $ - $ 1,445,911 Hedging financial liabilities Fair value hedges
Interest rate futures contracts $ 11,839 $ - $ - $ 11,839 Reconciliation of Level 3 fair value measurements of financial assets The financial assets measured at Level 3 fair value were equity investments classified as financial assets at FVTOCI and financial assets at FVTPL. Reconciliations for the nine months ended September 30, 2021 and 2020 are as follows:
Nine Months Ended September 30 2021 2020 Balance, beginning of period $ 4,514,940 $ 4,208,900 Additions 293,034 152,986 Recognized in profit or loss - (3,821) Recognized in other comprehensive income or loss 1,071,721 48,946 Disposals and proceeds from return of capital of investments (115,627) (51,045) Effect of exchange rate changes (34,289) (117,003) Balance, end of period $ 5,729,779 $ 4,238,963

- 46 -
Valuation techniques and assumptions used in Level 2 fair value measurement The fair values of financial assets and financial liabilities are determined as follows:
The fair values of corporate bonds, agency bonds, agency mortgage-backed securities, asset-
backed securities, government bonds and non-publicly traded equity investments - equity investments trading on the Emerging Stock Board are determined by quoted market prices provided by third party pricing services.
The fair values of forward exchange contracts are measured using forward exchange rates and
discount rates derived from quoted market prices. The fair value of accounts receivable classified as at FVTOCI is determined by the present value
of future cash flows based on the discount rate that reflects the credit risk of counterparties. Valuation techniques and assumptions used in Level 3 fair value measurement The fair values of non-publicly traded equity investments (excluding those trading on the Emerging Stock Board) are mainly determined by using the asset approach and market approach. The asset approach takes into account the net asset value measured at the fair value by independent parties. On September 30, 2021, December 31, 2020 and September 30, 2020, the Company uses unobservable inputs derived from discount for lack of marketability of 10%. When other inputs remain equal, the fair value will decrease by NT$47,821 thousand, NT$39,006 thousand and NT$35,255 thousand, respectively, if discounts for lack of marketability increase by 1%. For the remaining few investments, the market approach is used to arrive at their fair values, for which the recent financing activities of investees, the market transaction prices of the similar companies and market conditions are considered.
3) Fair value of financial instruments that are not measured at fair value Except as detailed in the following table, the Company considers that the carrying amounts of financial instruments in the consolidated financial statements that are not measured at fair value approximate their fair values. Fair value hierarchy The table below sets out the fair value hierarchy for the Company’s financial assets and liabilities which are not required to be measured at fair value:
September 30, 2021 Carrying Level 2 Amount Fair Value Financial assets Financial assets at amortized costs
Corporate bonds $ 1,545,597 $ 1,577,696 Financial liabilities Financial liabilities at amortized costs
Bonds payable $ 459,733,448 $ 454,886,671

- 47 -
December 31, 2020 Carrying Level 2 Amount Fair Value Financial assets Financial assets at amortized costs
Corporate bonds $ 10,970,199 $ 11,053,550 Financial liabilities Financial liabilities at amortized costs
Bonds payable $ 256,705,084 $ 257,551,196 September 30, 2020 Carrying Level 2 Amount Fair Value Financial assets Financial assets at amortized costs
Corporate bonds $ 11,598,363 $ 11,690,973 Financial liabilities Financial liabilities at amortized costs
Bonds payable $ 229,645,434 $ 229,726,057 Valuation techniques and assumptions used in Level 2 fair value measurement The fair values of corporate bonds and the Company’s bonds payable are determined by quoted market prices provided by third party pricing services.
30. RELATED PARTY TRANSACTIONS Intercompany balances and transactions between TSMC and its subsidiaries, which are related parties of TSMC, have been eliminated upon consolidation; therefore those items are not disclosed in this note. The following is a summary of significant transactions between the Company and other related parties: a. Related party name and categories
Related Party Name Related Party Categories
GUC Associates VIS Associates SSMC Associates Xintec Associates TSMC Education and Culture Foundation Other related parties TSMC Charity Foundation Other related parties

- 48 -
b. Net revenue
Three Months Ended September 30
Nine Months Ended September 30
2021 2020 2021 2020 Item Related Party Categories Net revenue from
sale of goods Associates $ 2,438,567 $ 2,281,642 $ 5,885,674 $ 5,963,569
Net revenue from
royalties Associates $ 57,866 $ 32,361 $ 162,820 $ 135,730
c. Purchases
Three Months Ended
September 30 Nine Months Ended
September 30 2021 2020 2021 2020
Related Party Categories Associates $ 1,817,821 $ 1,948,527 $ 5,720,954 $ 5,681,777
d. Receivables from related parties
September 30,
2021 December 31,
2020 September 30,
2020 Item Related Party Name/Categories Receivables from GUC $ 678,067 $ 370,643 $ 699,198
related parties Xintec 181,077 187,488 178,567 $ 859,144 $ 558,131 $ 877,765 Other receivables SSMC $ 49,304 $ 45,291 $ 35,443
from related TSMC Charity Foundation 15,028 - - parties VIS 8,758 4,311 4,466 Other associates - 1,043 864
$ 73,090 $ 50,645 $ 40,773 e. Payables to related parties
September 30,
2021 December 31,
2020 September 30,
2020 Item Related Party Name/Categories Payables to related Xintec $ 1,403,671 $ 1,358,624 $ 1,283,751
parties SSMC 419,846 400,819 378,524 VIS 305,298 311,406 281,953 Others 26,813 36,869 38,947
$ 2,155,628 $ 2,107,718 $ 1,983,175
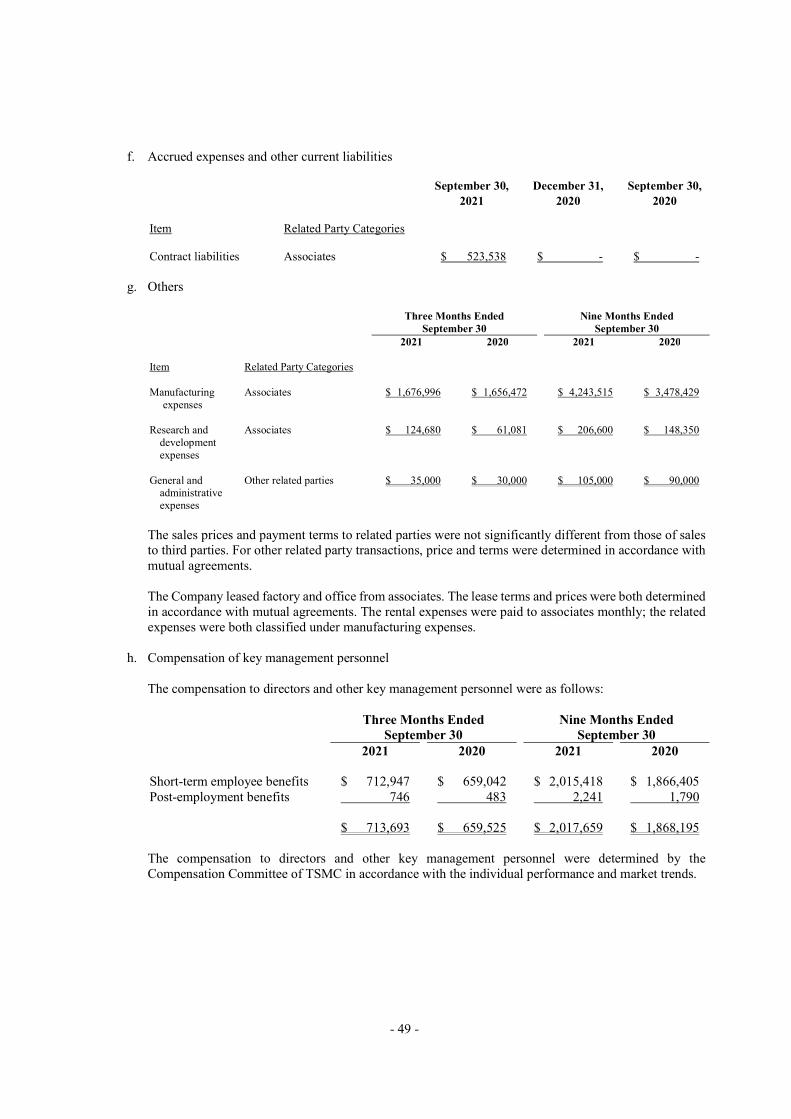
- 49 -
f. Accrued expenses and other current liabilities
September 30,
2021 December 31,
2020 September 30,
2020 Item Related Party Categories Contract liabilities Associates $ 523,538 $ - $ -
g. Others
Three Months Ended September 30
Nine Months Ended September 30
2021 2020 2021 2020 Item Related Party Categories Manufacturing
expenses Associates $ 1,676,996 $ 1,656,472
$ 4,243,515
$ 3,478,429
Research and
development expenses
Associates $ 124,680 $ 61,081 $ 206,600 $ 148,350
General and
administrative expenses
Other related parties $ 35,000 $ 30,000 $ 105,000 $ 90,000
The sales prices and payment terms to related parties were not significantly different from those of sales to third parties. For other related party transactions, price and terms were determined in accordance with mutual agreements. The Company leased factory and office from associates. The lease terms and prices were both determined in accordance with mutual agreements. The rental expenses were paid to associates monthly; the related expenses were both classified under manufacturing expenses.
h. Compensation of key management personnel
The compensation to directors and other key management personnel were as follows:
Three Months Ended
September 30 Nine Months Ended
September 30 2021 2020 2021 2020 Short-term employee benefits $ 712,947 $ 659,042 $ 2,015,418 $ 1,866,405 Post-employment benefits 746 483 2,241 1,790 $ 713,693 $ 659,525 $ 2,017,659 $ 1,868,195 The compensation to directors and other key management personnel were determined by the Compensation Committee of TSMC in accordance with the individual performance and market trends.
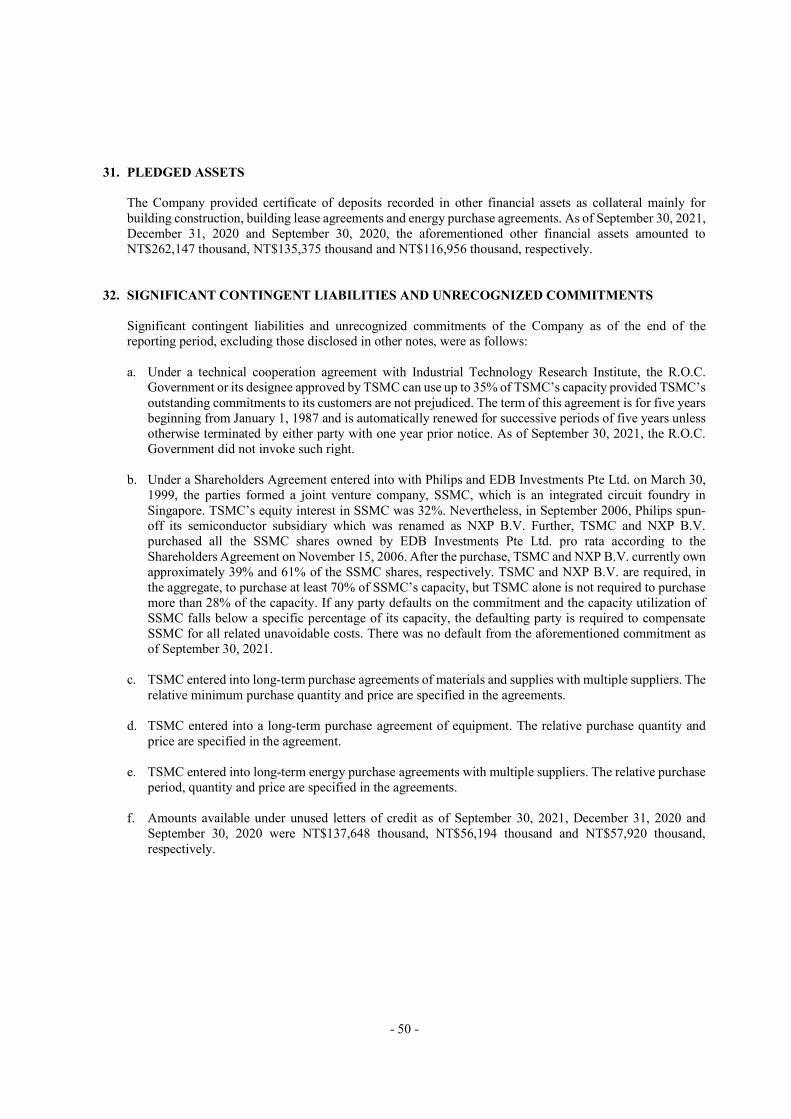
- 50 -
31. PLEDGED ASSETS
The Company provided certificate of deposits recorded in other financial assets as collateral mainly for building construction, building lease agreements and energy purchase agreements. As of September 30, 2021, December 31, 2020 and September 30, 2020, the aforementioned other financial assets amounted to NT$262,147 thousand, NT$135,375 thousand and NT$116,956 thousand, respectively.
32. SIGNIFICANT CONTINGENT LIABILITIES AND UNRECOGNIZED COMMITMENTS
Significant contingent liabilities and unrecognized commitments of the Company as of the end of the reporting period, excluding those disclosed in other notes, were as follows: a. Under a technical cooperation agreement with Industrial Technology Research Institute, the R.O.C.
Government or its designee approved by TSMC can use up to 35% of TSMC’s capacity provided TSMC’s outstanding commitments to its customers are not prejudiced. The term of this agreement is for five years beginning from January 1, 1987 and is automatically renewed for successive periods of five years unless otherwise terminated by either party with one year prior notice. As of September 30, 2021, the R.O.C. Government did not invoke such right.
b. Under a Shareholders Agreement entered into with Philips and EDB Investments Pte Ltd. on March 30,
1999, the parties formed a joint venture company, SSMC, which is an integrated circuit foundry in Singapore. TSMC’s equity interest in SSMC was 32%. Nevertheless, in September 2006, Philips spun-off its semiconductor subsidiary which was renamed as NXP B.V. Further, TSMC and NXP B.V. purchased all the SSMC shares owned by EDB Investments Pte Ltd. pro rata according to the Shareholders Agreement on November 15, 2006. After the purchase, TSMC and NXP B.V. currently own approximately 39% and 61% of the SSMC shares, respectively. TSMC and NXP B.V. are required, in the aggregate, to purchase at least 70% of SSMC’s capacity, but TSMC alone is not required to purchase more than 28% of the capacity. If any party defaults on the commitment and the capacity utilization of SSMC falls below a specific percentage of its capacity, the defaulting party is required to compensate SSMC for all related unavoidable costs. There was no default from the aforementioned commitment as of September 30, 2021.
c. TSMC entered into long-term purchase agreements of materials and supplies with multiple suppliers. The
relative minimum purchase quantity and price are specified in the agreements. d. TSMC entered into a long-term purchase agreement of equipment. The relative purchase quantity and
price are specified in the agreement. e. TSMC entered into long-term energy purchase agreements with multiple suppliers. The relative purchase
period, quantity and price are specified in the agreements. f. Amounts available under unused letters of credit as of September 30, 2021, December 31, 2020 and
September 30, 2020 were NT$137,648 thousand, NT$56,194 thousand and NT$57,920 thousand, respectively.

- 51 -
33. EXCHANGE RATE INFORMATION OF FOREIGN-CURRENCY FINANCIAL ASSETS AND LIABILITIES
The following information was summarized according to the foreign currencies other than the functional currency of the Company. The exchange rates disclosed were used to translate the foreign currencies into the functional currency. The significant financial assets and liabilities denominated in foreign currencies were as follows:
Foreign Currencies
(In Thousands) Exchange Rate
(Note 1)
Carrying Amount
(In Thousands) September 30, 2021 Financial assets Monetary items
USD $ 9,582,823 27.864 $ 267,015,782 USD 1,772,067 6.463(Note 2) 49,376,882 EUR 7,248 32.450 235,213 JPY 1,089,600 0.2499 272,291
Financial liabilities Monetary items
USD 9,777,821 27.864 272,449,192 EUR 2,906,442 32.450 94,314,055 JPY 129,710,147 0.2499 32,414,566
December 31, 2020 Financial assets Monetary items
USD 6,984,545 28.097 196,244,748 USD 785,171 6.540(Note 2) 22,060,962 EUR 13,820 34.587 478,002 JPY 83,593,234 0.2729 22,812,594
Financial liabilities Monetary items
USD 6,966,889 28.097 195,748,671 EUR 4,150,215 34.587 143,543,499 JPY 105,112,663 0.2729 28,685,246
(Continued)

- 52 -
Foreign Currencies
(In Thousands) Exchange Rate
(Note 1)
Carrying Amount
(In Thousands) September 30, 2020 Financial assets Monetary items
USD $ 6,240,456 28.960 $ 180,723,613 USD 644,523 6.811 (Note 2) 18,665,381 EUR 39,293 34.005 1,336,143 JPY 161,096,791 0.2742 44,172,740
Financial liabilities Monetary items
USD 7,348,763 28.960 212,820,173 EUR 4,604,918 34.005 156,590,231 JPY 64,241,355 0.2742 17,614,979
(Concluded) Note 1: Except as otherwise noted, exchange rate represents the number of NT dollar for which one foreign
currency could be exchanged. Note 2: The exchange rate represents the number of RMB for which one U.S. dollar could be exchanged. Please refer to the consolidated statements of comprehensive income for the total of realized and unrealized foreign exchange gain and loss for the three months and the nine months ended September 30, 2021 and 2020, respectively. Since there were varieties of foreign currency transactions and functional currencies within the subsidiaries of the Company, the Company was unable to disclose foreign exchange gain (loss) towards each foreign currency with significant impact.
34. ADDITIONAL DISCLOSURES
Following are the additional disclosures required by the Securities and Futures Bureau for TSMC: a. Financings provided: See Table 1 attached; b. Endorsement/guarantee provided: See Table 2 attached; c. Marketable securities held (excluding investments in subsidiaries and associates): See Table 3 attached; d. Marketable securities acquired and disposed of at costs or prices of at least NT$300 million or 20% of
the paid-in capital: See Table 4 attached; e. Acquisition of individual real estate properties at costs of at least NT$300 million or 20% of the paid-in
capital: See Table 5 attached; f. Disposal of individual real estate properties at prices of at least NT$300 million or 20% of the paid-in
capital: None; g. Total purchases from or sales to related parties of at least NT$100 million or 20% of the paid-in capital:
See Table 6 attached;

- 53 -
h. Receivables from related parties amounting to at least NT$100 million or 20% of the paid-in capital: See Table 7 attached;
i. Information about the derivative financial instruments transaction: See Notes 7 and 10; j. Others: The business relationship between the parent and the subsidiaries and significant transactions
between them: See Table 8 attached; k. Names, locations, and related information of investees over which TSMC exercises significant influence
(excluding information on investment in mainland China): See Table 9 attached; l. Information on investment in mainland China
1) The name of the investee in mainland China, the main businesses and products, its issued capital, method of investment, information on inflow or outflow of capital, percentage of ownership, income (losses) of the investee, share of profits/losses of investee, ending balance, amount received as dividends from the investee, and the limitation on investee: See Table 10 attached.
2) Significant direct or indirect transactions with the investee, its prices and terms of payment, unrealized
gain or loss, and other related information which is helpful to understand the impact of investment in mainland China on financial reports: See Table 8 attached.
m. Information of major shareholders
List of all shareholders with ownership of 5 percent or greater showing the names and the number of shares and percentage of ownership held by each shareholder: See Table 11 attached.
35. OPERATING SEGMENTS INFORMATION
TSMC’s chief operating decision makers periodically review operating results, focusing on operating income generated by foundry segment. Operating results are used for resource allocation and/or performance assessment. As a result, the Company has only one operating segment, the foundry segment. The foundry segment engages mainly in the manufacturing, sales, packaging, testing and computer-aided design of integrated circuits and other semiconductor devices and the manufacturing of masks. The basis for the measurement of income from operations is the same as that for the preparation of financial statements. Please refer to the consolidated statements of comprehensive income for the related segment revenue and operating results.

- 54 -
TABLE 1
Taiwan Semiconductor Manufacturing Company Limited and Subsidiaries FINANCINGS PROVIDED FOR THE NINE MONTHS ENDED SEPTEMBER 30, 2021 (Amounts in Thousands of New Taiwan Dollars, Unless Specified Otherwise)
No. Financing Company
Counterparty Financial Statement
Account Related Party
Maximum Balance for the Period (Foreign Currencies in
Thousands) (Note 3)
Ending Balance (Foreign Currencies
in Thousands) (Note 3)
Amount Actually Drawn
(Foreign Currencies in Thousands)
Interest Rate Nature for Financing Transaction
Amounts Reason for Financing
Allowance for Bad Debt
Collateral Financing Limits for Each
Borrowing Company
(Notes 1 and 2)
Financing Company’s Total
Financing Amount Limits
(Notes 1 and 2)
Item Value
1 TSMC China TSMC Nanjing
Other receivables from
related parties Yes $ 55,455,360
( RMB 10,600,000) & ( US$ 350,000 )
$ 34,759,680 ( RMB 5,800,000) & ( US$ 350,000 )
$ 24,144,960 ( RMB 5,600,000 )
1.30%-1.50% The need for long-term financing
$ - Operating capital $ - - $ - $ 70,856,227 $ 70,856,227
2 TSMC Global TSMC Other receivables from related parties
Yes 103,096,800 ( US$ 3,700,000 )
24,241,680 ( US$ 870,000 )
24,241,680 ( US$ 870,000 )
0.00% The need for short-term financing
- Operating capital - - - 757,445,781 757,445,781
Note 1: The aggregate amount available for lending to TSMC Nanjing from TSMC China shall not exceed the net worth of TSMC China. Note 2: The aggregate amount available for lending to TSMC from TSMC Global shall not exceed two times (200%) of the net worth of TSMC Global. Note 3: The maximum balance for the period and ending balance represent the amounts approved by the Board of Directors.

- 55 -
TABLE 2
Taiwan Semiconductor Manufacturing Company Limited and Subsidiaries ENDORSEMENTS/GUARANTEES PROVIDED FOR THE NINE MONTHS ENDED SEPTEMBER 30, 2021 (Amounts in Thousands of New Taiwan Dollars, Unless Specified Otherwise)
No. Endorsement/
Guarantee Provider
Guaranteed Party Limits on Endorsement/
Guarantee Amount
Provided to Each Guaranteed
Party (Notes 1 and 2)
Maximum Balance
for the Period (Foreign
Currencies in Thousands)
(Note 3)
Ending Balance (Foreign
Currencies in Thousands)
(Note 3)
Amount Actually Drawn (US$ in
Thousands)
Amount of Endorsement/
Guarantee Collateralized by
Properties
Ratio of Accumulated Endorsement/
Guarantee to Net Equity per
Latest Financial Statements
Maximum Endorsement/
Guarantee Amount
Allowable (Notes 1 and 2)
Guarantee Provided by
Parent Company
Guarantee Provided by A Subsidiary
Guarantee Provided to Subsidiaries in Mainland
China
Name Nature of
Relationship
0 TSMC TSMC North
America Subsidiary $ 519,005,016 $ 2,318,655
( US$ 83,213 ) $ 2,318,655 ( US$ 83,213 )
$ 2,318,655 ( US$ 83,213 )
$ - 0.11% $ 519,005,016 Yes No No
TSMC Global Subsidiary 519,005,016 208,980,000 ( US$ 7,500,000 )
208,980,000 ( US$ 7,500,000 )
181,116,000 ( US$ 6,500,000 )
- 10.07% 519,005,016 Yes No No
TSMC Arizona Subsidiary 519,005,016 223,815,351 ( US$ 8,032,420 )
223,815,351 ( US$ 8,032,420 )
903,351 ( US$ 32,420 )
- 10.78% 519,005,016 Yes No No
1 TSMC Japan TSMC JDC The same parent company
343,534 329,868 ( JPY 1,320,000 )
329,868 ( JPY 1,320,000 )
329,868 ( JPY 1,320,000 )
- 0.02% 343,534 No No No
Note 1: The total amount of the endorsement/guarantee provided by TSMC to TSMC North America, TSMC Global and TSMC Arizona shall not exceed twenty-five percent (25%) of TSMC’s net worth. Note 2: The total amount of the endorsement/guarantee provided by TSMC Japan to TSMC JDC shall not exceed two hundred and fifty percent (250%) of TSMC Japan’s net worth. Note 3: The maximum balance for the period and ending balance represent the amounts approved by the Board of Directors.

- 56 -
TABLE 3
Taiwan Semiconductor Manufacturing Company Limited and Subsidiaries MARKETABLE SECURITIES HELD SEPTEMBER 30, 2021 (Amounts in Thousands of New Taiwan Dollars, Unless Specified Otherwise)
Held Company Name Marketable Securities Type and Name Relationship with the Company Financial Statement Account
September 30, 2021
Note Shares/Units (In Thousands)
Carrying Value (Foreign Currencies
in Thousands)
Percentage of Ownership (%)
Fair Value (Foreign Currencies
in Thousands) TSMC Non-publicly traded equity investments United Industrial Gases Co., Ltd. - Financial assets at fair value through other
comprehensive income 21,230 $ 493,395 10 $ 493,395
Shin-Etsu Handotai Taiwan Co., Ltd. - 〃 10,500 348,096 7 348,096 Global Investment Holding Inc. - 〃 10,442 111,638 6 111,638 Crimson Asia Capital - 〃 - 1,523 1 1,523 W.K. Technology Fund IV - 〃 202 270 2 270 TSMC Partners Non-publicly traded equity investments Shanghai Walden Venture Capital Enterprise - Financial assets at fair value through other
comprehensive income - US$ 28,533 6 US$ 28,533
China Walden Venture Investments II, L.P. - 〃 - US$ 12,826 9 US$ 12,826 China Walden Venture Investments III, L.P. - 〃 - US$ 7,775 4 US$ 7,775 Inpria Corporation - 〃 1,778 US$ 3,600 4 US$ 3,600 Movella Inc. - 〃 6,333 - 10 - Tela Innovations - 〃 6,942 - 22 - TSMC Global Corporate bond Bank of America Corporation - Financial assets at fair value through other
comprehensive income - US$ 64,768 N/A US$ 64,768
Morgan Stanley - 〃 - US$ 52,795 N/A US$ 52,795 JPMorgan Chase & Co. - 〃 - US$ 46,948 N/A US$ 46,948 Citigroup Inc. - 〃 - US$ 42,909 N/A US$ 42,909 The Goldman Sachs Group, Inc. - 〃 - US$ 42,051 N/A US$ 42,051 Mitsubishi UFJ Financial Group, Inc. - 〃 - US$ 34,973 N/A US$ 34,973 AbbVie Inc. - 〃 - US$ 32,281 N/A US$ 32,281 Wells Fargo & Company - 〃 - US$ 28,838 N/A US$ 28,838 Sumitomo Mitsui Financial Group, Inc. - 〃 - US$ 28,696 N/A US$ 28,696 Athene Global Funding - 〃 - US$ 27,653 N/A US$ 27,653 HSBC Holdings plc - 〃 - US$ 24,097 N/A US$ 24,097 Lloyds Banking Group plc - 〃 - US$ 23,215 N/A US$ 23,215 Apple Inc. - 〃 - US$ 21,319 N/A US$ 21,319 Nordea Bank Abp - 〃 - US$ 20,913 N/A US$ 20,913 NatWest Markets Plc - 〃 - US$ 20,593 N/A US$ 20,593 Oracle Corporation - 〃 - US$ 19,931 N/A US$ 19,931 Hyundai Capital America, Inc. - 〃 - US$ 19,890 N/A US$ 19,890 Mizuho Financial Group, Inc. - 〃 - US$ 19,608 N/A US$ 19,608 BNP Paribas SA - 〃 - US$ 18,677 N/A US$ 18,677 Metropolitan Life Global Funding I - 〃 - US$ 18,458 N/A US$ 18,458 Banco Santander, S.A. - 〃 - US$ 18,233 N/A US$ 18,233 Volkswagen Group of America Finance, LLC - 〃 - US$ 17,533 N/A US$ 17,533 AT&T Inc. - 〃 - US$ 17,499 N/A US$ 17,499 Credit Suisse AG, New York Branch - 〃 - US$ 15,606 N/A US$ 15,606 Banque Fédérative du Crédit Mutuel Société anonyme - 〃 - US$ 15,008 N/A US$ 15,008
(Continued)

- 57 -
Held Company Name Marketable Securities Type and Name Relationship with the Company Financial Statement Account
September 30, 2021
Note Shares/Units (In Thousands)
Carrying Value (Foreign Currencies
in Thousands)
Percentage of Ownership (%)
Fair Value (Foreign Currencies
in Thousands) TSMC Global The Toronto-Dominion Bank - Financial assets at fair value through other
comprehensive income - US$ 14,985 N/A US$ 14,985
Nationwide Building Society - 〃 - US$ 14,852 N/A US$ 14,852 Toyota Motor Credit Corporation - 〃 - US$ 14,699 N/A US$ 14,699 Sumitomo Mitsui Trust Bank, Limited - 〃 - US$ 14,646 N/A US$ 14,646 Principal Life Global Funding II - 〃 - US$ 14,627 N/A US$ 14,627 Protective Life Global Funding - 〃 - US$ 14,506 N/A US$ 14,506 Intel Corporation - 〃 - US$ 13,849 N/A US$ 13,849 Amazon.com, Inc. - 〃 - US$ 13,102 N/A US$ 13,102 Barclays PLC - 〃 - US$ 13,009 N/A US$ 13,009 NTT Finance Corporation - 〃 - US$ 12,714 N/A US$ 12,714 Chevron Corporation - 〃 - US$ 12,534 N/A US$ 12,534 Comcast Corporation - 〃 - US$ 12,219 N/A US$ 12,219 National Securities Clearing Corporation - 〃 - US$ 11,899 N/A US$ 11,899 Equitable Financial Life Global Funding - 〃 - US$ 11,635 N/A US$ 11,635 Verizon Communications Inc. - 〃 - US$ 11,633 N/A US$ 11,633 Société Générale Société anonyme - 〃 - US$ 11,628 N/A US$ 11,628 Bristol-Myers Squibb Company - 〃 - US$ 11,439 N/A US$ 11,439 Equifax Inc. - 〃 - US$ 11,370 N/A US$ 11,370 Royal Bank of Canada - 〃 - US$ 11,113 N/A US$ 11,113 BPCE SA - 〃 - US$ 10,996 N/A US$ 10,996 AstraZeneca Finance LLC - 〃 - US$ 10,899 N/A US$ 10,899 NextEra Energy Capital Holdings, Inc. - 〃 - US$ 10,017 N/A US$ 10,017 Roper Technologies, Inc. - 〃 - US$ 9,975 N/A US$ 9,975 AIG Global Funding - 〃 - US$ 9,947 N/A US$ 9,947 U.S. Bancorp - 〃 - US$ 9,926 N/A US$ 9,926 Standard Chartered PLC - 〃 - US$ 9,784 N/A US$ 9,784 Equinor ASA - 〃 - US$ 9,374 N/A US$ 9,374 Canadian Imperial Bank of Commerce - 〃 - US$ 9,184 N/A US$ 9,184 Shire Acquisitions Investments Ireland Designated Activity
Company - 〃 - US$ 9,032 N/A US$ 9,032
Credit Agricole SA London Branch - 〃 - US$ 9,029 N/A US$ 9,029 NIKE, Inc. - 〃 - US$ 8,993 N/A US$ 8,993 New York Life Global Funding - 〃 - US$ 8,924 N/A US$ 8,924 The Bank of Nova Scotia - 〃 - US$ 8,661 N/A US$ 8,661 Santander UK plc - 〃 - US$ 8,650 N/A US$ 8,650 Fédération des caisses Desjardins du Québec - 〃 - US$ 8,630 N/A US$ 8,630 Macquarie Group Limited - 〃 - US$ 8,519 N/A US$ 8,519 KfW - 〃 - US$ 8,364 N/A US$ 8,364 UnitedHealth Group Incorporated - 〃 - US$ 8,320 N/A US$ 8,320 Guardian Life Global Funding - 〃 - US$ 8,288 N/A US$ 8,288 General Electric Company - 〃 - US$ 8,275 N/A US$ 8,275 International Bank for Reconstruction and Development - 〃 - US$ 8,209 N/A US$ 8,209 BP Capital Markets America, Inc. - 〃 - US$ 8,204 N/A US$ 8,204 Santander UK Group Holdings plc - 〃 - US$ 8,111 N/A US$ 8,111 Great-West Lifeco U.S. Finance 2020, Lp - 〃 - US$ 8,050 N/A US$ 8,050 Inter-American Development Bank - 〃 - US$ 8,049 N/A US$ 8,049 ING Groep N.V. - 〃 - US$ 7,973 N/A US$ 7,973 Suncorp-Metway Limited - 〃 - US$ 7,973 N/A US$ 7,973 Nomura Holdings, Inc. - 〃 - US$ 7,922 N/A US$ 7,922
(Continued)

- 58 -
Held Company Name Marketable Securities Type and Name Relationship with the Company Financial Statement Account
September 30, 2021
Note Shares/Units (In Thousands)
Carrying Value (Foreign Currencies
in Thousands)
Percentage of Ownership (%)
Fair Value (Foreign Currencies
in Thousands) TSMC Global Pacific Life Global Funding II - Financial assets at fair value through other
comprehensive income - US$ 7,623 N/A US$ 7,623
Credit Suisse Group AG - 〃 - US$ 7,573 N/A US$ 7,573 Intuit Inc. - 〃 - US$ 7,353 N/A US$ 7,353 AstraZeneca PLC - 〃 - US$ 7,215 N/A US$ 7,215 DNB Bank ASA - 〃 - US$ 7,143 N/A US$ 7,143 Huntington Bancshares Incorporated - 〃 - US$ 7,119 N/A US$ 7,119 Prudential Funding Corp. - 〃 - US$ 7,112 N/A US$ 7,112 Cargill, Incorporated - 〃 - US$ 6,634 N/A US$ 6,634 Macquarie Bank Limited - 〃 - US$ 6,565 N/A US$ 6,565 Deutsche Bank AG - New York Branch - 〃 - US$ 6,507 N/A US$ 6,507 Daimler Finance North America LLC - 〃 - US$ 6,481 N/A US$ 6,481 Montpelier Re Holdings Ltd. - 〃 - US$ 6,471 N/A US$ 6,471 Banco Bilbao Vizcaya Argentaria, S.A. - 〃 - US$ 6,439 N/A US$ 6,439 UBS Group Funding (Switzerland) AG - 〃 - US$ 6,427 N/A US$ 6,427 Bank of Montreal - 〃 - US$ 6,403 N/A US$ 6,403 Exxon Mobil Corporation - 〃 - US$ 6,347 N/A US$ 6,347 ANZ New Zealand (Int'l) Limited - 〃 - US$ 6,295 N/A US$ 6,295 Scentre Group Trust 1 - 〃 - US$ 6,274 N/A US$ 6,274 Enel Finance International N.V. - 〃 - US$ 6,239 N/A US$ 6,239 Fox Corporation - 〃 - US$ 6,147 N/A US$ 6,147 The Bank of New York Mellon Corporation - 〃 - US$ 6,130 N/A US$ 6,130 WPP Finance 2010 - 〃 - US$ 6,102 N/A US$ 6,102 Cigna Corporation - 〃 - US$ 6,070 N/A US$ 6,070 UBS AG, London Branch - 〃 - US$ 5,955 N/A US$ 5,955 Siemens Financieringsmaatschappij N.V. - 〃 - US$ 5,954 N/A US$ 5,954 W. P. Carey Inc. - 〃 - US$ 5,891 N/A US$ 5,891 Analog Devices, Inc. - 〃 - US$ 5,874 N/A US$ 5,874 Capital One, National Association - 〃 - US$ 5,849 N/A US$ 5,849 Alabama Power Company - 〃 - US$ 5,794 N/A US$ 5,794 UBS Group AG - 〃 - US$ 5,582 N/A US$ 5,582 Fiserv, Inc. - 〃 - US$ 5,568 N/A US$ 5,568 Capital One Financial Corporation - 〃 - US$ 5,520 N/A US$ 5,520 Sprint Spectrum Co Llc - 〃 - US$ 5,477 N/A US$ 5,477 Danske Bank A/S - 〃 - US$ 5,462 N/A US$ 5,462 CenterPoint Energy, Inc. - 〃 - US$ 5,460 N/A US$ 5,460 NatWest Group plc - 〃 - US$ 5,450 N/A US$ 5,450 Five Corners Funding Trust - 〃 - US$ 5,402 N/A US$ 5,402 Thermo Fisher Scientific Inc. - 〃 - US$ 5,333 N/A US$ 5,333 Fifth Third Bancorp - 〃 - US$ 5,289 N/A US$ 5,289 CGI Inc. - 〃 - US$ 5,279 N/A US$ 5,279 Merck & Co., Inc. - 〃 - US$ 5,182 N/A US$ 5,182 Svenska Handelsbanken AB (publ) - 〃 - US$ 5,182 N/A US$ 5,182 SMBC Aviation Capital Finance DAC - 〃 - US$ 5,153 N/A US$ 5,153 Sempra - 〃 - US$ 5,149 N/A US$ 5,149 BMW US Capital, LLC - 〃 - US$ 5,091 N/A US$ 5,091 HP Inc. - 〃 - US$ 4,963 N/A US$ 4,963 Skandinaviska Enskilda Banken AB (publ) - 〃 - US$ 4,856 N/A US$ 4,856 Northwestern Mutual Global Funding - 〃 - US$ 4,840 N/A US$ 4,840 Jackson National Life Global Funding - 〃 - US$ 4,788 N/A US$ 4,788
(Continued)

- 59 -
Held Company Name Marketable Securities Type and Name Relationship with the Company Financial Statement Account
September 30, 2021
Note Shares/Units (In Thousands)
Carrying Value (Foreign Currencies
in Thousands)
Percentage of Ownership (%)
Fair Value (Foreign Currencies
in Thousands) TSMC Global Intercontinental Exchange, Inc. - Financial assets at fair value through other
comprehensive income - US$ 4,741 N/A US$ 4,741
American International Group, Inc. - 〃 - US$ 4,703 N/A US$ 4,703 Truist Financial Corporation - 〃 - US$ 4,702 N/A US$ 4,702 UBS Group Funding (Jersey) Ltd. - 〃 - US$ 4,644 N/A US$ 4,644 Bank of New Zealand - 〃 - US$ 4,634 N/A US$ 4,634 Roche Holdings, Inc. - 〃 - US$ 4,591 N/A US$ 4,591 Eversource Energy - 〃 - US$ 4,559 N/A US$ 4,559 CVS Health Corporation - 〃 - US$ 4,483 N/A US$ 4,483 OGE Energy Corp. - 〃 - US$ 4,452 N/A US$ 4,452 Florida Power & Light Company - 〃 - US$ 4,449 N/A US$ 4,449 Truist Bank - 〃 - US$ 4,414 N/A US$ 4,414 Swedbank AB (publ) - 〃 - US$ 4,376 N/A US$ 4,376 NiSource Inc. - 〃 - US$ 4,357 N/A US$ 4,357 7-Eleven, Inc. - 〃 - US$ 4,355 N/A US$ 4,355 MPLX LP - 〃 - US$ 4,294 N/A US$ 4,294 Fidelity National Information Services, Inc. - 〃 - US$ 4,277 N/A US$ 4,277 Pioneer Natural Resources Company - 〃 - US$ 4,269 N/A US$ 4,269 Coöperatieve Rabobank U.A. - 〃 - US$ 4,256 N/A US$ 4,256 Element Fleet Management Corp. - 〃 - US$ 4,255 N/A US$ 4,255 Dominion Energy, Inc. - 〃 - US$ 4,161 N/A US$ 4,161 National Bank of Canada - 〃 - US$ 4,137 N/A US$ 4,137 Exelon Corporation - 〃 - US$ 4,135 N/A US$ 4,135 The European Bank for Reconstruction and Development - 〃 - US$ 4,121 N/A US$ 4,121 Ameren Corporation - 〃 - US$ 4,091 N/A US$ 4,091 B.A.T. International Finance p.l.c. - 〃 - US$ 4,080 N/A US$ 4,080 Pricoa Global Funding I - 〃 - US$ 4,067 N/A US$ 4,067 Ameriprise Financial, Inc. - 〃 - US$ 4,050 N/A US$ 4,050 American Express Credit Corporation - 〃 - US$ 4,034 N/A US$ 4,034 Barclays Bank PLC - 〃 - US$ 4,031 N/A US$ 4,031 Coca-Cola Europacific Partners PLC - 〃 - US$ 4,023 N/A US$ 4,023 Appalachian Power Company - 〃 - US$ 4,009 N/A US$ 4,009 Public Storage - 〃 - US$ 4,002 N/A US$ 4,002 BorgWarner Inc. - 〃 - US$ 3,938 N/A US$ 3,938 Credit Suisse Group Funding (Guernsey) Limited - 〃 - US$ 3,882 N/A US$ 3,882 V.F. Corporation - 〃 - US$ 3,880 N/A US$ 3,880 Bayer US Finance II LLC - 〃 - US$ 3,866 N/A US$ 3,866 Eastern Energy Gas Holdings, LLC - 〃 - US$ 3,827 N/A US$ 3,827 Hewlett Packard Enterprise Company - 〃 - US$ 3,803 N/A US$ 3,803 Public Service Electric and Gas Company - 〃 - US$ 3,793 N/A US$ 3,793 BG Energy Capital plc - 〃 - US$ 3,755 N/A US$ 3,755 Monongahela Power Company - 〃 - US$ 3,717 N/A US$ 3,717 The Charles Schwab Corporation - 〃 - US$ 3,712 N/A US$ 3,712 Welltower Inc. - 〃 - US$ 3,687 N/A US$ 3,687 Ross Stores, Inc. - 〃 - US$ 3,668 N/A US$ 3,668 Diageo Capital plc - 〃 - US$ 3,608 N/A US$ 3,608 Phillips 66 - 〃 - US$ 3,598 N/A US$ 3,598 Verisk Analytics, Inc. - 〃 - US$ 3,571 N/A US$ 3,571 Highmark Inc. - 〃 - US$ 3,564 N/A US$ 3,564 F&G Global Funding - 〃 - US$ 3,562 N/A US$ 3,562
(Continued)

- 60 -
Held Company Name Marketable Securities Type and Name Relationship with the Company Financial Statement Account
September 30, 2021
Note Shares/Units (In Thousands)
Carrying Value (Foreign Currencies
in Thousands)
Percentage of Ownership (%)
Fair Value (Foreign Currencies
in Thousands) TSMC Global ERAC USA Finance LLC - Financial assets at fair value through other
comprehensive income - US$ 3,557 N/A US$ 3,557
American Honda Finance Corporation - 〃 - US$ 3,501 N/A US$ 3,501 Reckitt Benckiser Treasury Services plc - 〃 - US$ 3,498 N/A US$ 3,498 Gilead Sciences, Inc. - 〃 - US$ 3,478 N/A US$ 3,478 Pfizer Inc. - 〃 - US$ 3,454 N/A US$ 3,454 HSBC Bank Canada - 〃 - US$ 3,429 N/A US$ 3,429 Penske Truck Leasing Co., L.P. - 〃 - US$ 3,413 N/A US$ 3,413 Reliance Standard Life Global Funding II - 〃 - US$ 3,411 N/A US$ 3,411 USAA Capital Corp. - 〃 - US$ 3,406 N/A US$ 3,406 The Western Union Company - 〃 - US$ 3,341 N/A US$ 3,341 Nestlé Holdings, Inc. - 〃 - US$ 3,341 N/A US$ 3,341 Johnson & Johnson - 〃 - US$ 3,323 N/A US$ 3,323 Essex Portfolio Limited Partnership - 〃 - US$ 3,273 N/A US$ 3,273 PNC Bank, National Association - 〃 - US$ 3,237 N/A US$ 3,237 ONE Gas, Inc. - 〃 - US$ 3,234 N/A US$ 3,234 Texas Instruments Incorporated - 〃 - US$ 3,229 N/A US$ 3,229 CNA Financial Corporation - 〃 - US$ 3,224 N/A US$ 3,224 Cox Communications, Inc. - 〃 - US$ 3,186 N/A US$ 3,186 Ralph Lauren Corporation - 〃 - US$ 3,182 N/A US$ 3,182 Avangrid, Inc. - 〃 - US$ 3,180 N/A US$ 3,180 Oncor Electric Delivery Company LLC - 〃 - US$ 3,160 N/A US$ 3,160 Baidu, Inc. - 〃 - US$ 3,124 N/A US$ 3,124 Novartis Capital Corporation - 〃 - US$ 3,099 N/A US$ 3,099 BOC Aviation Limited - 〃 - US$ 3,079 N/A US$ 3,079 Helmerich & Payne, Inc. - 〃 - US$ 3,036 N/A US$ 3,036 B.A.T Capital Corporation - 〃 - US$ 3,004 N/A US$ 3,004 Chevron Phillips Chemical Company LLC - 〃 - US$ 2,988 N/A US$ 2,988 Southern California Edison Company - 〃 - US$ 2,963 N/A US$ 2,963 American Electric Power Company, Inc. - 〃 - US$ 2,881 N/A US$ 2,881 Ventas Realty, Limited Partnership - 〃 - US$ 2,867 N/A US$ 2,867 Xcel Energy Inc. - 〃 - US$ 2,866 N/A US$ 2,866 American Express Company - 〃 - US$ 2,848 N/A US$ 2,848 Air Products and Chemicals, Inc. - 〃 - US$ 2,829 N/A US$ 2,829 PPL Electric Utilities Corporation - 〃 - US$ 2,767 N/A US$ 2,767 Ryder System, Inc. - 〃 - US$ 2,746 N/A US$ 2,746 Nuveen Finance, LLC - 〃 - US$ 2,746 N/A US$ 2,746 NBN Co Limited - 〃 - US$ 2,736 N/A US$ 2,736 DTE Energy Company - 〃 - US$ 2,729 N/A US$ 2,729 VEREIT Operating Partnership, L.P. - 〃 - US$ 2,704 N/A US$ 2,704 CRH America, Inc. - 〃 - US$ 2,669 N/A US$ 2,669 BBVA USA - 〃 - US$ 2,662 N/A US$ 2,662 Kimco Realty Corporation - 〃 - US$ 2,655 N/A US$ 2,655 CMS Energy Corporation - 〃 - US$ 2,646 N/A US$ 2,646 Nutrien Ltd. - 〃 - US$ 2,632 N/A US$ 2,632 Pinnacle West Capital Corporation - 〃 - US$ 2,630 N/A US$ 2,630 The PNC Financial Services Group, Inc. - 〃 - US$ 2,623 N/A US$ 2,623 Yara International ASA - 〃 - US$ 2,620 N/A US$ 2,620 AutoZone, Inc. - 〃 - US$ 2,606 N/A US$ 2,606 Magellan Midstream Partners, L.P. - 〃 - US$ 2,600 N/A US$ 2,600
(Continued)

- 61 -
Held Company Name Marketable Securities Type and Name Relationship with the Company Financial Statement Account
September 30, 2021
Note Shares/Units (In Thousands)
Carrying Value (Foreign Currencies
in Thousands)
Percentage of Ownership (%)
Fair Value (Foreign Currencies
in Thousands) TSMC Global Air Lease Corporation - Financial assets at fair value through other
comprehensive income - US$ 2,573 N/A US$ 2,573
John Deere Capital Corporation - 〃 - US$ 2,567 N/A US$ 2,567 Empower Finance 2020, LP - 〃 - US$ 2,493 N/A US$ 2,493 Chevron U.S.A. Inc. - 〃 - US$ 2,473 N/A US$ 2,473 Georgia Power Company - 〃 - US$ 2,462 N/A US$ 2,462 AvalonBay Communities, Inc. - 〃 - US$ 2,457 N/A US$ 2,457 Reynolds American Inc. - 〃 - US$ 2,453 N/A US$ 2,453 Berkshire Hathaway Inc. - 〃 - US$ 2,441 N/A US$ 2,441 DuPont de Nemours, Inc. - 〃 - US$ 2,364 N/A US$ 2,364 O'Reilly Automotive, Inc. - 〃 - US$ 2,343 N/A US$ 2,343 Union Pacific Corporation - 〃 - US$ 2,337 N/A US$ 2,337 Health Care Service Corporation - 〃 - US$ 2,275 N/A US$ 2,275 Georgia-Pacific LLC - 〃 - US$ 2,243 N/A US$ 2,243 ITC Holdings Corp. - 〃 - US$ 2,225 N/A US$ 2,225 The East Ohio Gas Company - 〃 - US$ 2,224 N/A US$ 2,224 Mead Johnson Nutrition Company - 〃 - US$ 2,224 N/A US$ 2,224 Magna International Inc. - 〃 - US$ 2,217 N/A US$ 2,217 GA Global Funding Trust - 〃 - US$ 2,214 N/A US$ 2,214 Healthpeak Properties, Inc. - 〃 - US$ 2,172 N/A US$ 2,172 Citizens Bank, National Association - 〃 - US$ 2,167 N/A US$ 2,167 Amphenol Corporation - 〃 - US$ 2,145 N/A US$ 2,145 Hormel Foods Corporation - 〃 - US$ 2,144 N/A US$ 2,144 ASB Bank Limited - 〃 - US$ 2,135 N/A US$ 2,135 Tucson Electric Power Company - 〃 - US$ 2,121 N/A US$ 2,121 Otis Worldwide Corporation - 〃 - US$ 2,101 N/A US$ 2,101 Keurig Dr Pepper Inc. - 〃 - US$ 2,047 N/A US$ 2,047 CK Hutchison International 16 Ltd - 〃 - US$ 2,000 N/A US$ 2,000 Shinhan Financial Group Co., Ltd. - 〃 - US$ 1,990 N/A US$ 1,990 NBK SPC Limited - 〃 - US$ 1,975 N/A US$ 1,975 Mitsubishi Corporation - 〃 - US$ 1,975 N/A US$ 1,975 Automatic Data Processing, Inc. - 〃 - US$ 1,940 N/A US$ 1,940 Sydney Airport Finance Company Pty Ltd - 〃 - US$ 1,935 N/A US$ 1,935 Kentucky Utilities Company - 〃 - US$ 1,933 N/A US$ 1,933 Mondelez International Holdings Netherlands Bv - 〃 - US$ 1,928 N/A US$ 1,928 AmerisourceBergen Corporation - 〃 - US$ 1,903 N/A US$ 1,903 Wipro IT Services LLC - 〃 - US$ 1,895 N/A US$ 1,895 Evergy Kansas Central, Inc. - 〃 - US$ 1,884 N/A US$ 1,884 Public Service Enterprise Group Incorporated - 〃 - US$ 1,879 N/A US$ 1,879 Gulfstream Natural Gas System, L.L.C. - 〃 - US$ 1,864 N/A US$ 1,864 Burlington Northern Santa Fe, LLC - 〃 - US$ 1,854 N/A US$ 1,854 Enbridge Inc. - 〃 - US$ 1,846 N/A US$ 1,846 Caterpillar Financial Services Corporation - 〃 - US$ 1,844 N/A US$ 1,844 Walmart Inc. - 〃 - US$ 1,834 N/A US$ 1,834 Rio Tinto Finance (USA) Limited - 〃 - US$ 1,828 N/A US$ 1,828 Tencent Holdings Limited - 〃 - US$ 1,827 N/A US$ 1,827 Philip Morris International Inc. - 〃 - US$ 1,811 N/A US$ 1,811 McCormick & Company, Incorporated - 〃 - US$ 1,802 N/A US$ 1,802 Boston Properties Limited Partnership - 〃 - US$ 1,797 N/A US$ 1,797
(Continued)

- 62 -
Held Company Name Marketable Securities Type and Name Relationship with the Company Financial Statement Account
September 30, 2021
Note Shares/Units (In Thousands)
Carrying Value (Foreign Currencies
in Thousands)
Percentage of Ownership (%)
Fair Value (Foreign Currencies
in Thousands) TSMC Global Infor, Inc. - Financial assets at fair value through other
comprehensive income - US$ 1,786 N/A US$ 1,786
Tyson Foods, Inc. - 〃 - US$ 1,784 N/A US$ 1,784 Quest Diagnostics Incorporated - 〃 - US$ 1,766 N/A US$ 1,766 Berkshire Hathaway Energy Company - 〃 - US$ 1,740 N/A US$ 1,740 AIA Group Limited - 〃 - US$ 1,736 N/A US$ 1,736 University of California - 〃 - US$ 1,735 N/A US$ 1,735 eBay Inc. - 〃 - US$ 1,729 N/A US$ 1,729 International Business Machines Corporation - 〃 - US$ 1,721 N/A US$ 1,721 Emerson Electric Co. - 〃 - US$ 1,708 N/A US$ 1,708 Raytheon Technologies Corporation - 〃 - US$ 1,706 N/A US$ 1,706 Svenska Handelsbanken, NY - 〃 - US$ 1,700 N/A US$ 1,700 Westpac Banking Corporation - 〃 - US$ 1,697 N/A US$ 1,697 Midwest Connector Capital Company LLC - 〃 - US$ 1,673 N/A US$ 1,673 Anthem, Inc. - 〃 - US$ 1,672 N/A US$ 1,672 APT Pipelines Limited - 〃 - US$ 1,671 N/A US$ 1,671 Alimentation Couche-Tard Inc. - 〃 - US$ 1,649 N/A US$ 1,649 Toyota Industries Corporation - 〃 - US$ 1,642 N/A US$ 1,642 MetLife, Inc. - 〃 - US$ 1,638 N/A US$ 1,638 The Southern Company - 〃 - US$ 1,638 N/A US$ 1,638 China Resources Gas Group Limited - 〃 - US$ 1,629 N/A US$ 1,629 Duke Energy Florida, LLC - 〃 - US$ 1,620 N/A US$ 1,620 Suntory Holdings Limited - 〃 - US$ 1,619 N/A US$ 1,619 NSTAR Electric Company - 〃 - US$ 1,609 N/A US$ 1,609 Brookfield Finance LLC - 〃 - US$ 1,605 N/A US$ 1,605 Panasonic Corporation - 〃 - US$ 1,598 N/A US$ 1,598 CPI Property Group S.A. - 〃 - US$ 1,586 N/A US$ 1,586 CK Hutchison International (19) Limited - 〃 - US$ 1,586 N/A US$ 1,586 Marsh & McLennan Companies, Inc. - 〃 - US$ 1,555 N/A US$ 1,555 Marathon Petroleum Corporation - 〃 - US$ 1,554 N/A US$ 1,554 KEB Hana Bank - 〃 - US$ 1,505 N/A US$ 1,505 Alliant Energy Finance, LLC - 〃 - US$ 1,497 N/A US$ 1,497 Virginia Electric and Power Company - 〃 - US$ 1,448 N/A US$ 1,448 Eastern Gas Transmission and Storage, Inc. - 〃 - US$ 1,443 N/A US$ 1,443 Entergy Louisiana, LLC - 〃 - US$ 1,430 N/A US$ 1,430 NetApp, Inc. - 〃 - US$ 1,407 N/A US$ 1,407 Daiwa Securities Group Inc. - 〃 - US$ 1,406 N/A US$ 1,406 Met Tower Global Funding - 〃 - US$ 1,391 N/A US$ 1,391 Andrew W. Mellon Foundation, The - 〃 - US$ 1,388 N/A US$ 1,388 Kilroy Realty, L.P. - 〃 - US$ 1,384 N/A US$ 1,384 PACCAR Financial Corp. - 〃 - US$ 1,342 N/A US$ 1,342 Entergy Arkansas, LLC - 〃 - US$ 1,325 N/A US$ 1,325 Ontario Teachers' Cadillac Fairview Properties Trust - 〃 - US$ 1,314 N/A US$ 1,314 Martin Marietta Materials, Inc. - 〃 - US$ 1,312 N/A US$ 1,312 State Of Tennessee - 〃 - US$ 1,266 N/A US$ 1,266 Lincoln National Corporation - 〃 - US$ 1,198 N/A US$ 1,198 PSEG Power LLC - 〃 - US$ 1,183 N/A US$ 1,183 State Street Corporation - 〃 - US$ 1,182 N/A US$ 1,182 Scottish Power Limited - 〃 - US$ 1,154 N/A US$ 1,154 The Curators of the University of Missouri - 〃 - US$ 1,134 N/A US$ 1,134
(Continued)

- 63 -
Held Company Name Marketable Securities Type and Name Relationship with the Company Financial Statement Account
September 30, 2021
Note Shares/Units (In Thousands)
Carrying Value (Foreign Currencies
in Thousands)
Percentage of Ownership (%)
Fair Value (Foreign Currencies
in Thousands) TSMC Global Enterprise Products Operating LLC - Financial assets at fair value through other
comprehensive income - US$ 1,130 N/A US$ 1,130
Foxconn (Far East) Limited - 〃 - US$ 1,127 N/A US$ 1,127 The Cleveland Electric Illuminating Company - 〃 - US$ 1,127 N/A US$ 1,127 National Australia Bank Limited, New York Branch - 〃 - US$ 1,103 N/A US$ 1,103 Sinopec Group Overseas Development (2014) Ltd. - 〃 - US$ 1,085 N/A US$ 1,085 Brighthouse Financial Global Funding - 〃 - US$ 1,079 N/A US$ 1,079 BBVA Bancomer, S.A. - 〃 - US$ 1,078 N/A US$ 1,078 Kansas City Southern - 〃 - US$ 1,073 N/A US$ 1,073 DH Europe Finance II S.a.r.l. - 〃 - US$ 1,045 N/A US$ 1,045 Baltimore Gas and Electric Company - 〃 - US$ 1,042 N/A US$ 1,042 Entergy Mississippi, LLC - 〃 - US$ 1,036 N/A US$ 1,036 Loews Corporation - 〃 - US$ 1,031 N/A US$ 1,031 Denver City & County Housing Authority - 〃 - US$ 1,029 N/A US$ 1,029 MassMutual Global Funding II - 〃 - US$ 1,028 N/A US$ 1,028 Texas Eastern Transmission, LP - 〃 - US$ 1,017 N/A US$ 1,017 Kaiser Foundation Hospitals - 〃 - US$ 1,016 N/A US$ 1,016 Kinder Morgan, Inc. - 〃 - US$ 1,007 N/A US$ 1,007 National Rural Utilities Cooperative Finance Corporation - 〃 - US$ 988 N/A US$ 988 Board Of Regents State Of Iowa - 〃 - US$ 980 N/A US$ 980 Aflac Incorporated - 〃 - US$ 962 N/A US$ 962 Unilever Capital Corporation - 〃 - US$ 943 N/A US$ 943 QNB Finance Ltd. - 〃 - US$ 942 N/A US$ 942 Southern California Gas Company - 〃 - US$ 937 N/A US$ 937 BHP Billiton Finance (USA) Limited - 〃 - US$ 922 N/A US$ 922 Mitsubishi HC Capital Inc. - 〃 - US$ 916 N/A US$ 916 Prudential Financial, Inc. - 〃 - US$ 905 N/A US$ 905 KeyBank National Association - 〃 - US$ 875 N/A US$ 875 Palm Beach County, Florida - 〃 - US$ 853 N/A US$ 853 The Walt Disney Company - 〃 - US$ 830 N/A US$ 830 Sinopec Capital (2013) Ltd. - 〃 - US$ 828 N/A US$ 828 Niagara Mohawk Power Corporation - 〃 - US$ 828 N/A US$ 828 Aetna Inc. - 〃 - US$ 823 N/A US$ 823 Visa Inc. - 〃 - US$ 820 N/A US$ 820 Oregon Health & Science University - 〃 - US$ 816 N/A US$ 816 Crédit Agricole S.A. - 〃 - US$ 802 N/A US$ 802 Southern Power Company - 〃 - US$ 798 N/A US$ 798 MASCO CORP - 〃 - US$ 777 N/A US$ 777 Sky Limited - 〃 - US$ 760 N/A US$ 760 Canadian Natural Resources Limited - 〃 - US$ 744 N/A US$ 744 Warner Media, LLC - 〃 - US$ 741 N/A US$ 741 Hyundai Capital Services, Inc. - 〃 - US$ 738 N/A US$ 738 National Australia Bank Limited - 〃 - US$ 730 N/A US$ 730 Sodexo, Inc. - 〃 - US$ 729 N/A US$ 729 Sinopec Group Overseas Development (2017) Limited - 〃 - US$ 712 N/A US$ 712 Norsk Hydro ASA - 〃 - US$ 705 N/A US$ 705 Abbott Laboratories - 〃 - US$ 684 N/A US$ 684 Stryker Corporation - 〃 - US$ 676 N/A US$ 676 State Of Washington - 〃 - US$ 658 N/A US$ 658 Bell Canada, Inc. - 〃 - US$ 651 N/A US$ 651
(Continued)

- 64 -
Held Company Name Marketable Securities Type and Name Relationship with the Company Financial Statement Account
September 30, 2021
Note Shares/Units (In Thousands)
Carrying Value (Foreign Currencies
in Thousands)
Percentage of Ownership (%)
Fair Value (Foreign Currencies
in Thousands) TSMC Global Florida Hurricane Catastrophe Fund Finance Corporation - Financial assets at fair value through other
comprehensive income - US$ 632 N/A US$ 632
Republic Services, Inc. - 〃 - US$ 632 N/A US$ 632 Glencore Funding LLC - 〃 - US$ 631 N/A US$ 631 QUALCOMM Incorporated - 〃 - US$ 625 N/A US$ 625 UBS AG (LONDON BRANCH) - 〃 - US$ 621 N/A US$ 621 Intact U.S. Holdings Inc. - 〃 - US$ 619 N/A US$ 619 American Water Capital Corp. - 〃 - US$ 618 N/A US$ 618 Sinopec Group Overseas Development (2012) Ltd. - 〃 - US$ 612 N/A US$ 612 Ohio Power Company - 〃 - US$ 600 N/A US$ 600 Port of Morrow - 〃 - US$ 600 N/A US$ 600 Discover Bank (New Castle, Delaware) - 〃 - US$ 596 N/A US$ 596 Arizona Public Service Company - 〃 - US$ 589 N/A US$ 589 Dormitory Authority of the State of New York - 〃 - US$ 585 N/A US$ 585 Duke Energy Progress, LLC - 〃 - US$ 579 N/A US$ 579 Shell International Finance B.V. - 〃 - US$ 572 N/A US$ 572 Fifth Third Bank, National Association - 〃 - US$ 560 N/A US$ 560 State of Hawaii - 〃 - US$ 550 N/A US$ 550 United Parcel Service, Inc. - 〃 - US$ 547 N/A US$ 547 Trane Technologies Luxembourg Finance S.A. - 〃 - US$ 544 N/A US$ 544 Simon Property Group, L.P. - 〃 - US$ 516 N/A US$ 516 TTX Company - 〃 - US$ 514 N/A US$ 514 Altria Group, Inc. - 〃 - US$ 513 N/A US$ 513 174 Power Global Corporation - 〃 - US$ 507 N/A US$ 507 Commonwealth Bank of Australia - 〃 - US$ 502 N/A US$ 502 DENSO Corporation - 〃 - US$ 496 N/A US$ 496 Brazos Higher Education Authority Inc - 〃 - US$ 467 N/A US$ 467 Target Corporation - 〃 - US$ 443 N/A US$ 443 University of Massachusetts Building Authority - 〃 - US$ 433 N/A US$ 433 MUFG Union Bank, National Association - 〃 - US$ 433 N/A US$ 433 PayPal Holdings, Inc. - 〃 - US$ 433 N/A US$ 433 Sierra Pacific Power Company - 〃 - US$ 421 N/A US$ 421 McKesson Corporation - 〃 - US$ 421 N/A US$ 421 Comerica Bank - 〃 - US$ 420 N/A US$ 420 Entergy Corporation - 〃 - US$ 418 N/A US$ 418 Banco del Estado de Chile - 〃 - US$ 415 N/A US$ 415 Komatsu Finance America, Inc. - 〃 - US$ 407 N/A US$ 407 Honeywell International Inc. - 〃 - US$ 407 N/A US$ 407 Duke Energy Corporation - 〃 - US$ 400 N/A US$ 400 The Norinchukin Bank - 〃 - US$ 398 N/A US$ 398 PepsiCo, Inc. - 〃 - US$ 391 N/A US$ 391 StanCorp Financial Group Inc. - 〃 - US$ 378 N/A US$ 378 Principal Financial Group, Inc. - 〃 - US$ 364 N/A US$ 364 First Republic Bank - 〃 - US$ 357 N/A US$ 357 Pernod Ricard SA - 〃 - US$ 355 N/A US$ 355 WEC Energy Group, Inc. - 〃 - US$ 350 N/A US$ 350 Coöperatieve Rabobank U.A., New York Branch - 〃 - US$ 348 N/A US$ 348 Amgen Inc. - 〃 - US$ 339 N/A US$ 339 Mid-America Apartments, L.P. - 〃 - US$ 335 N/A US$ 335 The Allstate Corporation - 〃 - US$ 326 N/A US$ 326
(Continued)

- 65 -
Held Company Name Marketable Securities Type and Name Relationship with the Company Financial Statement Account
September 30, 2021
Note Shares/Units (In Thousands)
Carrying Value (Foreign Currencies
in Thousands)
Percentage of Ownership (%)
Fair Value (Foreign Currencies
in Thousands) TSMC Global BP Capital Markets p.l.c. - Financial assets at fair value through other
comprehensive income - US$ 322 N/A US$ 322
TotalEnergies Capital International - 〃 - US$ 313 N/A US$ 313 América Móvil, S.A.B. de C.V. - 〃 - US$ 306 N/A US$ 306 BOC Aviation (USA) Corporation - 〃 - US$ 302 N/A US$ 302 salesforce.com, inc. - 〃 - US$ 301 N/A US$ 301 Qatar Petroleum - 〃 - US$ 298 N/A US$ 298 Aon Corporation - 〃 - US$ 296 N/A US$ 296 Johnson Controls International plc - 〃 - US$ 293 N/A US$ 293 Mondelez International, Inc. - 〃 - US$ 279 N/A US$ 279 Starbucks Corporation - 〃 - US$ 277 N/A US$ 277 Southern Natural Gas Company, L.L.C. - 〃 - US$ 275 N/A US$ 275 Equitable Holdings, Inc. - 〃 - US$ 256 N/A US$ 256 Sales Tax Securitization Corporation Of Chicago - 〃 - US$ 255 N/A US$ 255 The Huntington National Bank - 〃 - US$ 255 N/A US$ 255 Capital One Bank (USA), National Association - 〃 - US$ 251 N/A US$ 251 E. I. du Pont de Nemours and Company - 〃 - US$ 250 N/A US$ 250 Waste Management, Inc. - 〃 - US$ 245 N/A US$ 245 Children's Hospital Of Orange County - 〃 - US$ 221 N/A US$ 221 Nasdaq, Inc. - 〃 - US$ 220 N/A US$ 220 The Pennsylvania State University - 〃 - US$ 214 N/A US$ 214 Deere & Company - 〃 - US$ 212 N/A US$ 212 Suncor Energy Inc. - 〃 - US$ 207 N/A US$ 207 Oregon Education Districts - 〃 - US$ 205 N/A US$ 205 Riverside County Infrastructure Financing Authority - 〃 - US$ 205 N/A US$ 205 Saudi Arabian Oil Company - 〃 - US$ 201 N/A US$ 201 NongHyup Bank - 〃 - US$ 200 N/A US$ 200 San Francisco Public Utilities Commission - 〃 - US$ 189 N/A US$ 189 Nucor Corporation - 〃 - US$ 185 N/A US$ 185 Hoover Alabama Board Of Education - 〃 - US$ 180 N/A US$ 180 The New York State Urban Development Corporation - 〃 - US$ 146 N/A US$ 146 Electricité de France S.A. - 〃 - US$ 109 N/A US$ 109 Municipal Improvement Corporation of Los Angeles - 〃 - US$ 80 N/A US$ 80 Pima County, Arizona - 〃 - US$ 80 N/A US$ 80 State of Wisconsin - 〃 - US$ 65 N/A US$ 65 Huntington Beach California - 〃 - US$ 50 N/A US$ 50 City of Worcester, MA - 〃 - US$ 30 N/A US$ 30 Nueces County - 〃 - US$ 25 N/A US$ 25 Wells Fargo & Company - Financial assets at amortized cost - US$ 30,460 N/A US$ 31,331 Goldman Sachs Group Inc/The - 〃 - US$ 14,950 N/A US$ 15,121 JPMorgan Chase & Co. - 〃 - US$ 10,060 N/A US$ 10,169 Government bond United States Department of The Treasury - Financial assets at fair value through other
comprehensive income - US$ 803,895 N/A US$ 803,895
Emirate of Abu Dhabi - 〃 - US$ 1,504 N/A US$ 1,504 Qatar - 〃 - US$ 1,368 N/A US$ 1,368 Agency bonds/Agency mortgage-backed securities Federal National Mortgage Association - Financial assets at fair value through other
comprehensive income - US$ 644,930 N/A US$ 644,930
Government National Mortgage Association - 〃 - US$ 294,649 N/A US$ 294,649
(Continued)

- 66 -
Held Company Name Marketable Securities Type and Name Relationship with the Company Financial Statement Account
September 30, 2021
Note Shares/Units (In Thousands)
Carrying Value (Foreign Currencies
in Thousands)
Percentage of Ownership (%)
Fair Value (Foreign Currencies
in Thousands) TSMC Global Federal Home Loan Mortgage Corporation - Financial assets at fair value through other
comprehensive income - US$ 238,182 N/A US$ 238,182
GOVERNMENT NATIONAL MORTGAGE ASSOCIATION 2 - 〃 - US$ 36,599 N/A US$ 36,599 Asset-backed securities JPMBB Commercial Mortgage Securities Trust 2014-C24 - Financial assets at fair value through other
comprehensive income - US$ 10,529 N/A US$ 10,529
Wells Fargo Commercial Mortgage Trust 2016-Bnk1 - 〃 - US$ 7,642 N/A US$ 7,642 Morgan Stanley Capital I Trust 2021-L6 - 〃 - US$ 7,070 N/A US$ 7,070 Bank 2020-BNK26 - 〃 - US$ 7,033 N/A US$ 7,033 Bank 2017-Bnk6 - 〃 - US$ 6,399 N/A US$ 6,399 Benchmark 2019-B11 Mortgage Trust - 〃 - US$ 6,374 N/A US$ 6,374 Wells Fargo Commercial Mortgage Trust 2016-C35 - 〃 - US$ 6,238 N/A US$ 6,238 Citigroup Commercial Mortgage Trust 2014-GC21 - 〃 - US$ 5,828 N/A US$ 5,828 Hudson Yards 2016-10HY Mortgage Trust - 〃 - US$ 5,809 N/A US$ 5,809 Wells Fargo Commercial Mortgage Trust 2021-C59 - 〃 - US$ 5,625 N/A US$ 5,625 WFRBS Commercial Mortgage Trust 2013-C13 - 〃 - US$ 5,561 N/A US$ 5,561 CSAIL 2018-CX11 - 〃 - US$ 5,504 N/A US$ 5,504 BBCMS 2018-Tall Mortgage Trust - 〃 - US$ 5,483 N/A US$ 5,483 UBS-Barclays Commercial Mortgage Trust 2012-C2 - 〃 - US$ 5,392 N/A US$ 5,392 Morgan Stanley Bank America Merrill Lynch Trust 2016-C30 - 〃 - US$ 5,190 N/A US$ 5,190 Commerce 2015-CCRE24 Mortgage Trust - 〃 - US$ 5,022 N/A US$ 5,022 GM Financial Revolving Receivables Trust 2021-1 - 〃 - US$ 5,000 N/A US$ 5,000 Morgan Stanley Bank America Merrill Lynch Trust 2013-C10 - 〃 - US$ 4,962 N/A US$ 4,962 MRCD 2019-Prkc Mortgage Trust - 〃 - US$ 4,849 N/A US$ 4,849 Msbam 2016-C29 - 〃 - US$ 4,691 N/A US$ 4,691 Bank 2017 - BNK7 - 〃 - US$ 4,662 N/A US$ 4,662 Bank 2019-Bnk22 - 〃 - US$ 4,248 N/A US$ 4,248 JPMCC 2017-JP7 - 〃 - US$ 4,188 N/A US$ 4,188 Bank 2019-Bnk17 - 〃 - US$ 4,163 N/A US$ 4,163 BANK 2017-BNK5 - 〃 - US$ 4,161 N/A US$ 4,161 Morgan Stanley Bank of America Merrill Lynch Trust 2013-C7 - 〃 - US$ 3,984 N/A US$ 3,984 J.P. Morgan Chase Commercial Mortgage Securities Trust 2012-
LC9 - 〃 - US$ 3,710 N/A US$ 3,710
GS Mortgage Securities Trust 2015-GC32 - 〃 - US$ 3,207 N/A US$ 3,207 UBS Barclays Commercial Mortgage Trust 2013-C6 - 〃 - US$ 3,207 N/A US$ 3,207 Wells Fargo Commercial Mortgage Trust 2017-C40 - 〃 - US$ 3,074 N/A US$ 3,074 UBS Commercial Mortgage Trust 2018-C10 - 〃 - US$ 3,009 N/A US$ 3,009 JPMBB Commercial Mortgage Securities Trust 2015-C28 - 〃 - US$ 2,994 N/A US$ 2,994 GS Mortgage Securities Corporation Trust 2018-RIVR - 〃 - US$ 2,991 N/A US$ 2,991 Benchmark 2018-B3 Commercial Mortgage Trust - 〃 - US$ 2,938 N/A US$ 2,938 JPMDB 2017-C7 - 〃 - US$ 2,920 N/A US$ 2,920 Hyundai Auto Receivables Trust 2018-A - 〃 - US$ 2,887 N/A US$ 2,887 GS Mortgage Securities Trust 2013-GCJ12 - 〃 - US$ 2,686 N/A US$ 2,686 UBS-Barclays Commercial Mortgage Trust 2012-C3 - 〃 - US$ 2,651 N/A US$ 2,651 Ford Credit Auto Owner Trust 2020-Rev1 - 〃 - US$ 2,585 N/A US$ 2,585 Wells Fargo Commercial Mortgage Trust 2020-C55 - 〃 - US$ 2,520 N/A US$ 2,520 BBCMS Mortgage Trust 2020-C8 - 〃 - US$ 2,409 N/A US$ 2,409 Bank 2021-bnk33 - 〃 - US$ 2,389 N/A US$ 2,389 Dolp Trust 2021-NYC - 〃 - US$ 2,335 N/A US$ 2,335 Morgan Stanley Capital I Trust - 〃 - US$ 2,316 N/A US$ 2,316
(Continued)

- 67 -
Held Company Name Marketable Securities Type and Name Relationship with the Company Financial Statement Account
September 30, 2021
Note Shares/Units (In Thousands)
Carrying Value (Foreign Currencies
in Thousands)
Percentage of Ownership (%)
Fair Value (Foreign Currencies
in Thousands) TSMC Global Citigroup Commercial Mortgage Trust 2016-C3 - Financial assets at fair value through other
comprehensive income - US$ 2,316 N/A US$ 2,316
Mhc Commercial Mortgage Trust 2021-Mhc - 〃 - US$ 2,292 N/A US$ 2,292 Morgan Stanley Bank of America Merrill Lynch Trust 2012-C6 - 〃 - US$ 2,183 N/A US$ 2,183 UBS Commercial Mortgage Trust 2018-C11 - 〃 - US$ 2,126 N/A US$ 2,126 Commerce 2013-CCRE12 Mortgage Trust - 〃 - US$ 2,124 N/A US$ 2,124 Benchmark 2018-B4 Mortgage Trust - 〃 - US$ 2,106 N/A US$ 2,106 Morgan Stanley Capital I Trust 2018-H3 - 〃 - US$ 2,092 N/A US$ 2,092 CGCMT 2017-P8 Mortgage Trust - 〃 - US$ 2,073 N/A US$ 2,073 Msbam 2016-C31 - 〃 - US$ 2,010 N/A US$ 2,010 Wells Fargo Commercial Mortgage Trust 2015-C30 - 〃 - US$ 1,748 N/A US$ 1,748 Citigroup Commercial Mortgage Trust 2016-P5 - 〃 - US$ 1,675 N/A US$ 1,675 Morgan Stanley Capital I Trust 2021-L5 - 〃 - US$ 1,669 N/A US$ 1,669 COMM 2020-CBM Mortgage Trust - 〃 - US$ 1,594 N/A US$ 1,594 Morgan Stanley Bank of America Merrill Lynch Trust 2013-C8 - 〃 - US$ 1,577 N/A US$ 1,577 JPMBB Commercial Mortgage Securities Trust 2013-C12 - 〃 - US$ 1,537 N/A US$ 1,537 BX Commercial Mortgage Trust 2018-IND - 〃 - US$ 1,359 N/A US$ 1,359 WFRBS Commercial Mortgage Trust 2013-UBS1 - 〃 - US$ 1,336 N/A US$ 1,336 Toyota Auto Receivables 2018-D Owner Trust - 〃 - US$ 1,313 N/A US$ 1,313 Dbgs 2018-Biod Mortgage Trust - 〃 - US$ 1,301 N/A US$ 1,301 Wells Fargo Commercial Mortgage Trust 2012-LC5 - 〃 - US$ 1,299 N/A US$ 1,299 Honda Auto Receivables 2021-2 Owner Trust - 〃 - US$ 1,298 N/A US$ 1,298 Commerce 2014-Ccre17 Mortgage Trust - 〃 - US$ 1,179 N/A US$ 1,179 WFRBSCommercial Mortgage Trust 2013-C17 - 〃 - US$ 1,148 N/A US$ 1,148 Morgan Stanley Capital I Trust 2015 - UBS8 - 〃 - US$ 1,088 N/A US$ 1,088 GS Mortgage Securities Trust 2014-GC22 - 〃 - US$ 1,080 N/A US$ 1,080 Benchmark 2019-B14 Mortgage Trust - 〃 - US$ 988 N/A US$ 988 Morgan Stanley Capital I Trust 2019-H6 - 〃 - US$ 973 N/A US$ 973 Citigroup Commercial Mortgage Trust 2013-GCJ11 - 〃 - US$ 968 N/A US$ 968 COMM 2013-LC6 Mortgage Trust - 〃 - US$ 938 N/A US$ 938 Morgan Stanley Bank Of America Merrill Lynch Trust 2013-C13 - 〃 - US$ 931 N/A US$ 931 COMM 2012-CCRE5 Mortgage Trust - 〃 - US$ 924 N/A US$ 924 Wells Fargo Commercial Mortgage Trust 2015-LC20 - 〃 - US$ 915 N/A US$ 915 GS Mortgage Securities Trust 2014-GC24 - 〃 - US$ 913 N/A US$ 913 GS Mortgage Securities Trust 2019-GSA1 - 〃 - US$ 905 N/A US$ 905 280 Park Avenue Trust 2017 - 280P - 〃 - US$ 830 N/A US$ 830 Benchmark 2019-B9 Mortgage Trust - 〃 - US$ 781 N/A US$ 781 Morgan Stanley Bank Of America Merrill Lynch Trust 2013-C12 - 〃 - US$ 745 N/A US$ 745 Bbcms Mortgage Trust 2017-C1 - 〃 - US$ 724 N/A US$ 724 Benchmark 2019-B15 Mortgage Trust - 〃 - US$ 698 N/A US$ 698 JPMBB Commercial Mortgage Securities Trust 2014-C19 - 〃 - US$ 668 N/A US$ 668 CF 2019-CF1 Mortgage Trust - 〃 - US$ 665 N/A US$ 665 Wells Fargo Commercial Mortgage Trust 2015-C28 - 〃 - US$ 634 N/A US$ 634 Bank 2019-BNK23 - 〃 - US$ 625 N/A US$ 625 Morgan Stanley Capital I Trust 2019-H7 - 〃 - US$ 617 N/A US$ 617 Gs Mortgage Securities Corporation Trust 2020-Uptn - 〃 - US$ 616 N/A US$ 616 Wells Fargo Commercial Mortgage Trust 2015-NXS3 - 〃 - US$ 595 N/A US$ 595 Citigroup Commercial Mortgage Trust 2014-GC23 - 〃 - US$ 576 N/A US$ 576 COMM 2015-CCRE22 Mortgage Trust - 〃 - US$ 506 N/A US$ 506 Wells Fargo Commercial Mortgage Trust 2016-C36 - 〃 - US$ 480 N/A US$ 480
(Continued)
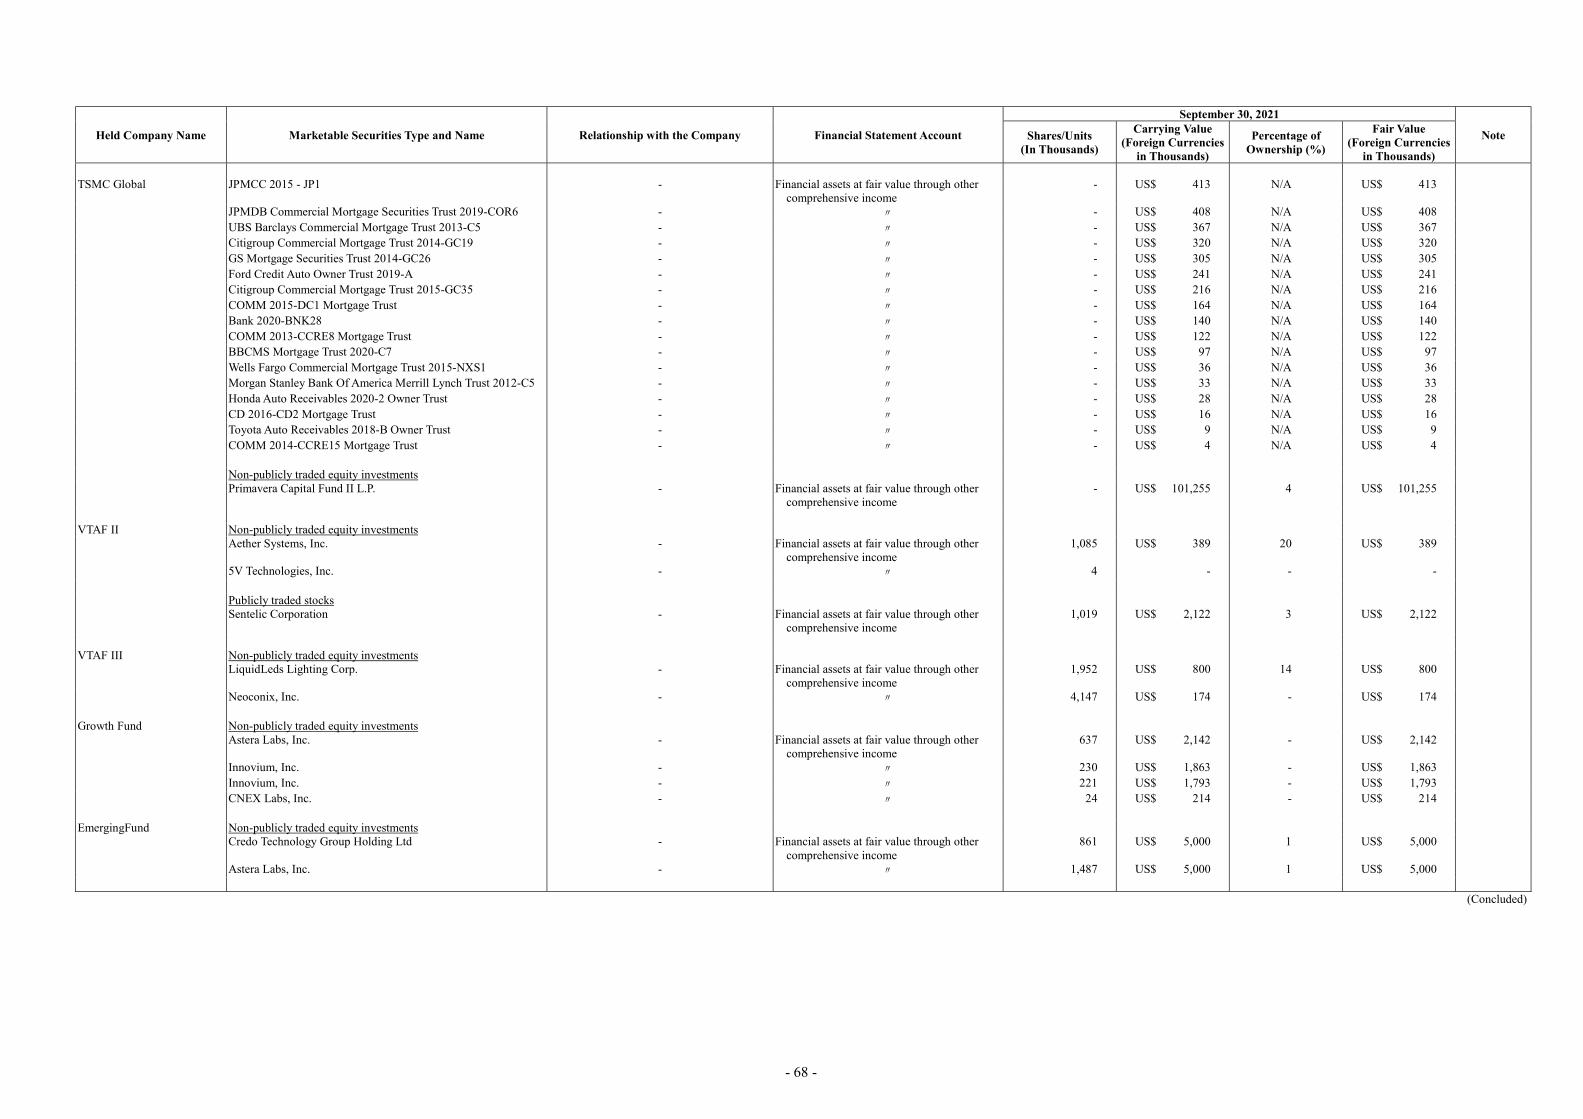
- 68 -
Held Company Name Marketable Securities Type and Name Relationship with the Company Financial Statement Account
September 30, 2021
Note Shares/Units (In Thousands)
Carrying Value (Foreign Currencies
in Thousands)
Percentage of Ownership (%)
Fair Value (Foreign Currencies
in Thousands) TSMC Global JPMCC 2015 - JP1 - Financial assets at fair value through other
comprehensive income - US$ 413 N/A US$ 413
JPMDB Commercial Mortgage Securities Trust 2019-COR6 - 〃 - US$ 408 N/A US$ 408 UBS Barclays Commercial Mortgage Trust 2013-C5 - 〃 - US$ 367 N/A US$ 367 Citigroup Commercial Mortgage Trust 2014-GC19 - 〃 - US$ 320 N/A US$ 320 GS Mortgage Securities Trust 2014-GC26 - 〃 - US$ 305 N/A US$ 305 Ford Credit Auto Owner Trust 2019-A - 〃 - US$ 241 N/A US$ 241 Citigroup Commercial Mortgage Trust 2015-GC35 - 〃 - US$ 216 N/A US$ 216 COMM 2015-DC1 Mortgage Trust - 〃 - US$ 164 N/A US$ 164 Bank 2020-BNK28 - 〃 - US$ 140 N/A US$ 140 COMM 2013-CCRE8 Mortgage Trust - 〃 - US$ 122 N/A US$ 122 BBCMS Mortgage Trust 2020-C7 - 〃 - US$ 97 N/A US$ 97 Wells Fargo Commercial Mortgage Trust 2015-NXS1 - 〃 - US$ 36 N/A US$ 36 Morgan Stanley Bank Of America Merrill Lynch Trust 2012-C5 - 〃 - US$ 33 N/A US$ 33 Honda Auto Receivables 2020-2 Owner Trust - 〃 - US$ 28 N/A US$ 28 CD 2016-CD2 Mortgage Trust - 〃 - US$ 16 N/A US$ 16 Toyota Auto Receivables 2018-B Owner Trust - 〃 - US$ 9 N/A US$ 9 COMM 2014-CCRE15 Mortgage Trust - 〃 - US$ 4 N/A US$ 4 Non-publicly traded equity investments Primavera Capital Fund II L.P. - Financial assets at fair value through other
comprehensive income - US$ 101,255 4 US$ 101,255
VTAF II Non-publicly traded equity investments Aether Systems, Inc. - Financial assets at fair value through other
comprehensive income 1,085 US$ 389 20 US$ 389
5V Technologies, Inc. - 〃 4 - - - Publicly traded stocks Sentelic Corporation - Financial assets at fair value through other
comprehensive income 1,019 US$ 2,122 3 US$ 2,122
VTAF III Non-publicly traded equity investments LiquidLeds Lighting Corp. - Financial assets at fair value through other
comprehensive income 1,952 US$ 800 14 US$ 800
Neoconix, Inc. - 〃 4,147 US$ 174 - US$ 174 Growth Fund Non-publicly traded equity investments Astera Labs, Inc. - Financial assets at fair value through other
comprehensive income 637 US$ 2,142 - US$ 2,142
Innovium, Inc. - 〃 230 US$ 1,863 - US$ 1,863 Innovium, Inc. - 〃 221 US$ 1,793 - US$ 1,793 CNEX Labs, Inc. - 〃 24 US$ 214 - US$ 214 EmergingFund Non-publicly traded equity investments Credo Technology Group Holding Ltd - Financial assets at fair value through other
comprehensive income 861 US$ 5,000 1 US$ 5,000
Astera Labs, Inc. - 〃 1,487 US$ 5,000 1 US$ 5,000
(Concluded)

- 69 -
TABLE 4
Taiwan Semiconductor Manufacturing Company Limited and Subsidiaries MARKETABLE SECURITIES ACQUIRED AND DISPOSED OF AT COSTS OR PRICES OF AT LEAST NT$300 MILLION OR 20% OF THE PAID-IN CAPITAL FOR NINE MONTHS ENDED SEPTEMBER 30, 2021 (Amounts in Thousands of New Taiwan Dollars, Unless Specified Otherwise)
Company Name Marketable Securities
Type and Name Financial Statement
Account Counterparty
Nature of Relationship
Beginning Balance Acquisition Disposal Ending Balance (Note 1)
Shares/Units (In Thousands)
Amount (Foreign
Currencies in Thousands)
Shares/Units (In Thousands)
Amount (Foreign
Currencies in Thousands)
Shares/Units (In Thousands)
Amount (Foreign
Currencies in Thousands)
Carrying Value (Foreign
Currencies in Thousands)
Gain/Loss on Disposal (Foreign
Currencies in Thousands)
Shares/Units (In Thousands)
Amount (Foreign
Currencies in Thousands)
TSMC Non-publicly traded equity
investments
VisEra Tech Investments accounted for using equity method
19 institutional investors, including: GIC, Capital Group, Fidelity International, Cathay Life Insurance Co., Ltd., Fubon Life Insurance Co., Ltd., Yuanta Securities, KGI Securities and Securities and Futures Investors Protection Center etc.
- 253,120 $ 6,363,099 - $ - 39,501 $ 9,451,798 $ 1,045,516 Note 2 213,619 $ 6,142,094
TSMC Arizona 〃 - - 30 842,745 723 20,297,939 - - - - 753 18,503,814 TSMC Global Corporate bond Bank of America Corporation Financial assets at fair value
through other comprehensive income
- - - US$ 58,724 - US$ 24,882 - US$ 18,692 US$ 18,526 US$ 166 - US$ 63,674
JPMorgan Chase & Co. 〃 - - - US$ 29,759 - US$ 16,303 - US$ 2,320 US$ 2,303 US$ 17 - US$ 43,083 Citigroup Inc. 〃 - - - US$ 41,827 - US$ 10,939 - US$ 14,291 US$ 14,120 US$ 171 - US$ 37,797 HSBC Holdings plc 〃 - - - US$ 16,113 - US$ 11,814 - US$ 3,508 US$ 3,365 US$ 143 - US$ 24,097 Oracle Corporation 〃 - - - US$ 7,822 - US$ 13,979 - US$ 2,000 US$ 2,000 US$ - - US$ 19,931 BNP Paribas SA 〃 - - - US$ 13,202 - US$ 11,559 - US$ 7,154 US$ 6,882 US$ 272 - US$ 17,317 NTT Finance Corporation 〃 - - - US$ - - US$ 14,780 - US$ 1,941 US$ 1,945 US$ (4) - US$ 12,714 Morgan Stanley 〃 - - - US$ - - US$ 12,035 - US$ - US$ - US$ - - US$ 12,063 Verizon Communications Inc. 〃 - - - US$ 10,558 - US$ 16,617 - US$ 15,534 US$ 15,440 US$ 94 - US$ 11,633 Morgan Stanley 〃 - - - US$ 23,053 - US$ - - US$ 11,390 US$ 11,125 US$ 265 - US$ 11,272 AstraZeneca Finance LLC 〃 - - - US$ - - US$ 10,933 - US$ - US$ - US$ - - US$ 10,899 Wells Fargo & Company Financial assets at amortized
cost - - - US$ 180,487 - US$ - - US$ 150,000 US$ 150,000 US$ - - US$ 30,460
(Continued)

- 70 -
Company Name Marketable Securities
Type and Name Financial Statement
Account Counterparty
Nature of Relationship
Beginning Balance Acquisition Disposal Ending Balance (Note 1)
Shares/Units (In Thousands)
Amount (Foreign
Currencies in Thousands)
Shares/Units (In Thousands)
Amount (Foreign
Currencies in Thousands)
Shares/Units (In Thousands)
Amount (Foreign
Currencies in Thousands)
Carrying Value (Foreign
Currencies in Thousands)
Gain/Loss on Disposal (Foreign
Currencies in Thousands)
Shares/Units (In Thousands)
Amount (Foreign
Currencies in Thousands)
TSMC Global JPMorgan Chase & Co. Financial assets at amortized
cost - - - US$ 95,058 - US$ - - US$ 85,000 US$ 85,000 US$ - - US$ 10,060
Citigroup Global Market Inc. 〃 - - - US$ 99,965 - US$ - - US$ 100,000 US$ 100,000 US$ - - US$ - Government bond United States Department of The
Treasury Financial assets at fair value
through other comprehensive income
- - - US$ 182,533 - US$ 1,035,081 - US$ 710,789 US$ 713,651 US$ (2,862) - US$ 500,205
United States Department of The Treasury
〃 - - - US$ 287,012 - US$ 74,148 - US$ 73,800 US$ 73,775 US$ 25 - US$ 282,182
United States Department of The Treasury
〃 - - - US$ - - US$ 49,806 - US$ 28,307 US$ 28,302 US$ 5 - US$ 21,508
United States Department of The Treasury
〃 - - - US$ 3,073 - US$ 11,190 - US$ 14,389 US$ 14,218 US$ 171 - US$ -
Agency bonds/Agency
mortgage-backed securities
Government National Mortgage Association
Financial assets at fair value through other comprehensive income
- - - US$ - - US$ 302,380 - US$ 133,199 US$ 133,548 US$ (349) - US$ 167,806
Federal National Mortgage Association
〃 - - - US$ 96,211 - US$ 321,047 - US$ 325,973 US$ 327,882 US$ (1,909) - US$ 88,109
Federal National Mortgage Association
〃 - - - US$ 49,027 - US$ 1,067,214 - US$ 1,047,297 US$ 1,047,645 US$ (348) - US$ 67,868
Federal National Mortgage Association
〃 - - - US$ 4,035 - US$ 691,072 - US$ 636,153 US$ 635,445 US$ 708 - US$ 59,234
Government National Mortgage Association
〃 - - - US$ 17,896 - US$ 338,963 - US$ 309,103 US$ 309,814 US$ (711) - US$ 46,595
Federal National Mortgage Association
〃 - - - US$ 56,510 - US$ 2,460 - US$ 12,353 US$ 12,825 US$ (472) - US$ 45,302
GOVERNMENT NATIONAL MORTGAGE ASSOCIATION 2
〃 - - - US$ - - US$ 47,464 - US$ 10,662 US$ 10,651 US$ 11 - US$ 36,599
Federal National Mortgage Association
〃 - - - US$ - - US$ 281,478 - US$ 254,806 US$ 254,719 US$ 87 - US$ 26,731
Federal National Mortgage Association
〃 - - - US$ 7,969 - US$ 211,777 - US$ 197,778 US$ 198,147 US$ (369) - US$ 21,412
Federal Home Loan Mortgage Corporation
〃 - - - US$ - - US$ 84,563 - US$ 69,285 US$ 69,347 US$ (62) - US$ 15,017
Government National Mortgage Association
〃 - - - US$ 9,795 - US$ 169,747 - US$ 168,830 US$ 168,890 US$ (60) - US$ 10,580
Government National Mortgage Association
〃 - - - US$ 30,307 - US$ 38,746 - US$ 59,918 US$ 60,811 US$ (893) - US$ 7,846
Federal National Mortgage Association
〃 - - - US$ 18,019 - US$ - - US$ 11,462 US$ 11,078 US$ 384 - US$ 6,276
Government National Mortgage Association
〃 - - - US$ 14,244 - US$ 314,329 - US$ 322,753 US$ 322,849 US$ (96) - US$ 5,719
Federal National Mortgage Association
〃 - - - US$ 18,997 - US$ 2,026 - US$ 14,999 US$ 15,235 US$ (236) - US$ 5,700
Federal Home Loan Mortgage Corporation
〃 - - - US$ - - US$ 78,240 - US$ 73,765 US$ 73,681 US$ 84 - US$ 4,529
Federal National Mortgage Association
〃 - - - US$ 24,084 - US$ - - US$ 19,681 US$ 18,991 US$ 690 - US$ 4,274
(Continued)

- 71 -
Company Name Marketable Securities
Type and Name Financial Statement
Account Counterparty
Nature of Relationship
Beginning Balance Acquisition Disposal Ending Balance (Note 1)
Shares/Units (In Thousands)
Amount (Foreign
Currencies in Thousands)
Shares/Units (In Thousands)
Amount (Foreign
Currencies in Thousands)
Shares/Units (In Thousands)
Amount (Foreign
Currencies in Thousands)
Carrying Value (Foreign
Currencies in Thousands)
Gain/Loss on Disposal (Foreign
Currencies in Thousands)
Shares/Units (In Thousands)
Amount (Foreign
Currencies in Thousands)
TSMC Global Government National Mortgage
Association Financial assets at fair value
through other comprehensive income
- - - US$ 27,389 - US$ - - US$ 22,955 US$ 22,743 US$ 212 - US$ 3,818
Federal National Mortgage Association
〃 - - - US$ 23,776 - US$ 3,283 - US$ 23,445 US$ 23,032 US$ 413 - US$ 3,444
Government National Mortgage Association
〃 - - - US$ 24,481 - US$ - - US$ 20,555 US$ 20,128 US$ 427 - US$ 3,401
Federal Home Loan Mortgage Corporation
〃 - - - US$ 20,247 - US$ 23,181 - US$ 40,162 US$ 40,121 US$ 41 - US$ 3,106
Federal National Mortgage Association
〃 - - - US$ 19,673 - US$ 141,101 - US$ 158,589 US$ 158,532 US$ 57 - US$ 2,229
Government National Mortgage Association
〃 - - - US$ 1,067 - US$ 21,365 - US$ 20,609 US$ 20,627 US$ (18) - US$ 1,801
Government National Mortgage Association
〃 - - - US$ 5,381 - US$ 43,351 - US$ 48,190 US$ 48,193 US$ (3) - US$ 533
Federal National Mortgage Association
〃 - - - US$ 21,409 - US$ 160,214 - US$ 181,298 US$ 181,274 US$ 24 - US$ 322
Federal Home Loan Mortgage Corporation
〃 - - - US$ - - US$ 145,065 - US$ 145,122 US$ 145,065 US$ 57 - US$ -
Federal National Mortgage Association
〃 - - - US$ 31,980 - US$ 171,131 - US$ 202,799 US$ 202,880 US$ (81) - US$ -
Government National Mortgage Association
〃 - - - US$ 199,835 - US$ 82,010 - US$ 278,349 US$ 280,290 US$ (1,941) - US$ -
Federal National Mortgage Association
〃 - - - US$ 8,394 - US$ 89,440 - US$ 97,826 US$ 97,829 US$ (3) - US$ -
GOVERNMENT NATIONAL MORTGAGE ASSOCIATION 2
〃 - - - US$ - - US$ 97,498 - US$ 97,545 US$ 97,498 US$ 47 - US$ -
Government National Mortgage Association
〃 - - - US$ 18,900 - US$ 121,784 - US$ 140,660 US$ 140,610 US$ 50 - US$ -
Federal Home Loan Mortgage Corporation
〃 - - - US$ 11,872 - US$ - - US$ 11,654 US$ 11,120 US$ 534 - US$ -
Federal National Mortgage Association
〃 - - - US$ 5,253 - US$ 11,906 - US$ 17,015 US$ 17,228 US$ (213) - US$ -
Note 1: The ending balance includes the realized gain/loss on equity investment, the amortization of premium/discount on bonds investments and other related adjustment Note 2: To facilitate VisEra’s IPO in Taiwan, 39,501 thousand common shares of VisEra at a price of NT$240 were sold by TSMC and an increase of NT$8,406,282 thousand in capital surplus was recognized. TSMC’s shareholding in VisEra decreased from 87% to 73%. This disposal was accounted
for as an equity transaction since the transaction did not change TSMC’s control over VisEra. (Concluded)

- 72 -
TABLE 5
Taiwan Semiconductor Manufacturing Company Limited and Subsidiaries ACQUISITION OF INDIVIDUAL REAL ESTATE PROPERTIES AT COSTS OF AT LEAST NT$300 MILLION OR 20% OF THE PAID-IN CAPITAL FOR THE NINE MONTHS ENDED SEPTEMPER 30, 2021 (Amounts in Thousands of New Taiwan Dollars, Unless Specified Otherwise)
Company Name
Types of Property
Transaction Date
Transaction Amount (Foreign
Currencies in Thousands)
Payment Term Counterparty Nature of
Relationships
Prior Transaction of Related Counterparty
Price Reference
Purpose of Acquisition
Other Terms Owner Relationships Transfer Date Amount
TSMC Real estate February 09, 2021
(Note) $ 52,100,000
(Note) Based on the terms in
the purchase order 85 counterparties (Note),
including: - N/A N/A N/A N/A Price
comparison and price negotiation
Manufacturing purpose
None
ABB Ltd. Accudevice Co., Ltd. Air Liquide Far Eastern Ltd. Allis Electric Co., Ltd. Am-Power Machine
International Enterprise Co., Ltd.
Atlas Copco Taiwan Ltd. Atlas Technology Corp. Capital Machinery Limited Chen Yuan International Co.,
Ltd.
Chenfull International Co., Ltd.
Cheng Deh Fire Protection Industrial Corp.
Chien Kuo Construction Co., Ltd.
China Steel Structure Co., Ltd.
Chun Yuan Steel Industry Co., Ltd.
Chung-Lin General Contractors, Ltd.
Cica-Huntek Chemical Technology Taiwan Co., Ltd.
Confederate Technology Co., Ltd.
(Continued)

- 73 -
Company Name
Types of Property
Transaction Date
Transaction Amount (Foreign
Currencies in Thousands)
Payment Term Counterparty Nature of
Relationships
Prior Transaction of Related Counterparty
Price Reference
Purpose of Acquisition
Other Terms Owner Relationships Transfer Date Amount
TSMC Real estate Da-Cin Construction Co.,
Ltd.
Desiccant Technology Corporation
Evergreen Steel Corporation Exyte Taiwan Co., Ltd. Fortune Electric Co., Ltd. Fu Tsu Construction Co.,
Ltd.
Hantech Engineering Co., Ltd.
Hsieh Kun Co., Ltd. Hueng Luei Process Industry
Co., Ltd.
Ingersoll-Rand Southeast Asia (Pte) Ltd. Taiwan Branch (Singapore)
J.C. Yang Architect and Associates
JG Environmental Technology Co., Ltd.
JJmr-Clean-Air Solution Tech.Services Co., Ltd.
Jusun Instruments Co., Ltd. Kedge Construction Co., Ltd. Kinetics Technology
Corporation
L&K Engineering Co., Ltd. Lead-Fu Industrials
Corporation
Lee Ming Construction Co., Ltd.
Li Jin Engineering Co., Ltd. Mandartech Interiors Inc. Marketech International
Corp.
Mega Union Technology Incorporated
National Institute of Advanced Industrial Science & Technology
(Continued)

- 74 -
Company Name
Types of Property
Transaction Date
Transaction Amount (Foreign
Currencies in Thousands)
Payment Term Counterparty Nature of
Relationships
Prior Transaction of Related Counterparty
Price Reference
Purpose of Acquisition
Other Terms Owner Relationships Transfer Date Amount
TSMC Real estate Organo Technology Co., Ltd. Ovivo Taiwan Co., Ltd. Pan Asia (Engineers &
Constructors) Corporation
Ruentex Engineering & Construction Co., Ltd.
San Fu Chemical Co., Ltd. Schneider Electric Taiwan
Co., Ltd.
Shihlin Electric & Engineering Corporation
Siemens Limited Solomon Technology
Corporation
Swift Engineering Co., Ltd. Taiwan Gleno Enterprise Co.,
Ltd.
Taiwan Obayashi Corporation
Taiwan Puritic Corp. TASA Construction
Corporation
Techgo Industrial Co., Ltd. Trusval Technology Co., Ltd. Tung Kang Steel Structure
Corp.
Uangyih-Tech Industrial Co., Ltd.
Unelectra International Corp. United Integrated Services
Co., Ltd.
Versum Materials Taiwan Co., Ltd.
Weltall Technology Corporation
Wholetech System Hitech Limited
Yangtech Engineering Co., Ltd.
Yankey Engineering Co., Ltd.
(Continued)

- 75 -
Company Name
Types of Property
Transaction Date
Transaction Amount (Foreign
Currencies in Thousands)
Payment Term Counterparty Nature of
Relationships
Prior Transaction of Related Counterparty
Price Reference
Purpose of Acquisition
Other Terms Owner Relationships Transfer Date Amount
TSMC Real estate Ying Pao Technology Inc. Zhao-Cheng Corp. Real estate April 22, 2021
(Note) $ 9,500,000
(Note) Based on the terms in
the purchase order 70 counterparties (Note),
including: - N/A N/A N/A N/A Price
comparison and price negotiation
Manufacturing purpose
None
J. Cypress Co., Ltd. L&K Engineering Co., Ltd. Marketech International
Corp.
Mega Union Technology Incorporated
Organo Technology Co., Ltd. Taiwan Puritic Corp. Uangyih-Tech Industrial Co.,
Ltd.
United Integrated Services Co., Ltd.
Real estate June 09, 2021 (Note)
54,500,000 (Note)
Based on the terms in the purchase order
101 counterparties (Note), including:
- N/A N/A N/A N/A Price comparison and price negotiation
Manufacturing purpose
None
ABB Ltd. Accudevice Co., Ltd. Air Liquide Far Eastern Ltd. Allis Electric Co., Ltd. Am-Power Machine
International Enterprise Co., Ltd.
Atlas Copco Taiwan Ltd. Atlas Technology Corp. Capital Machinery Limited Chen Yuan International Co.,
Ltd.
Chenfull International Co., Ltd.
Cheng Deh Fire Protection Industrial Corp.
(Continued)

- 76 -
Company Name
Types of Property
Transaction Date
Transaction Amount (Foreign
Currencies in Thousands)
Payment Term Counterparty Nature of
Relationships
Prior Transaction of Related Counterparty
Price Reference
Purpose of Acquisition
Other Terms Owner Relationships Transfer Date Amount
TSMC Real estate Chien Kuo Construction Co.,
Ltd.
China Steel Structure Co., Ltd.
Chun Yuan Steel Industry Co., Ltd.
Chung-Lin General Contractors, Ltd.
Cica-Huntek Chemical Technology Taiwan Co., Ltd.
Confederate Technology Co., Ltd.
Da-Cin Construction Co., Ltd.
Desiccant Technology Corporation
Evergreen Steel Corporation Exyte Taiwan Co., Ltd. Fortune Electric Co., Ltd. Fu Tsu Construction Co.,
Ltd.
Hantech Engineering Co., Ltd.
Hsieh Kun Co., Ltd. Hueng Luei Process Industry
Co., Ltd.
Ingersoll-Rand Southeast Asia (Pte) Ltd. Taiwan Branch (Singapore)
J.C. Yang Architect and Associates
JG Environmental Technology Co., Ltd.
JJmr-Clean-Air Solution Tech.Services Co., Ltd.
Jusun Instruments Co., Ltd. Kao Hsin Engineering Co.,
Ltd.
Kedge Construction Co., Ltd. Kinetics Technology
Corporation
(Continued)

- 77 -
Company Name
Types of Property
Transaction Date
Transaction Amount (Foreign
Currencies in Thousands)
Payment Term Counterparty Nature of
Relationships
Prior Transaction of Related Counterparty
Price Reference
Purpose of Acquisition
Other Terms Owner Relationships Transfer Date Amount
TSMC Real estate L&K Engineering Co., Ltd. Lead-Fu Industrials
Corporation
Lee Ming Construction Co., Ltd.
Mandartech Interiors Inc. Marketech International
Corp.
Mega Union Technology Incorporated
Organo Technology Co., Ltd. Ovivo Taiwan Co., Ltd. Pan Asia (Engineers &
Constructors) Corporation
Ruentex Engineering & Construction Co., Ltd.
San Fu Chemical Co., Ltd. Schneider Electric Taiwan
Co., Ltd.
Shihlin Electric & Engineering Corporation
Siemens Limited Solomon Technology
Corporation
Swift Engineering Co., Ltd. Taiwan Gleno Enterprise Co.,
Ltd.
Taiwan Obayashi Corporation
Taiwan Puritic Corp. TASA Construction
Corporation
Techgo Industrial Co., Ltd. Trane Taiwan Distribution
Limited
Trusval Technology Co., Ltd. Tung Kang Steel Structure
Corp.
Uangyih-Tech Industrial Co., Ltd.
(Continued)

- 78 -
Company Name
Types of Property
Transaction Date
Transaction Amount (Foreign
Currencies in Thousands)
Payment Term Counterparty Nature of
Relationships
Prior Transaction of Related Counterparty
Price Reference
Purpose of Acquisition
Other Terms Owner Relationships Transfer Date Amount
TSMC Real estate Unelectra International Corp. United Integrated Services
Co., Ltd.
Versum Materials Taiwan Co., Ltd.
Weltall Technology Corporation
Wholetech System Hitech Limited
Yangtech Engineering Co., Ltd.
Yankey Engineering Co., Ltd.
Ying Pao Technology Inc. Zhao-Cheng Corp. Real estate August 10, 2021
(Note) $168,000,000
(Note) Based on the terms in
the purchase order 100 counterparties (Note),
including: - N/A N/A N/A N/A Price
comparison and price negotiation
Manufacturing purpose
None
ABB Enterprise Software Inc.
ABB Ltd. Accudevice Co., Ltd. Air Liquide Far Eastern Ltd. Allied Supreme Corp. Allis Electric Co., Ltd. Am-Power Machine
International Enterprise Co., Ltd.
Atlas Copco Taiwan Ltd. Atlas Technology Corp. Capital Machinery Limited Chen Yuan International Co.,
Ltd.
Chenfull International Co., Ltd.
Cheng Deh Fire Protection Industrial Corp.
Chien Kuo Construction Co., Ltd.
(Continued)
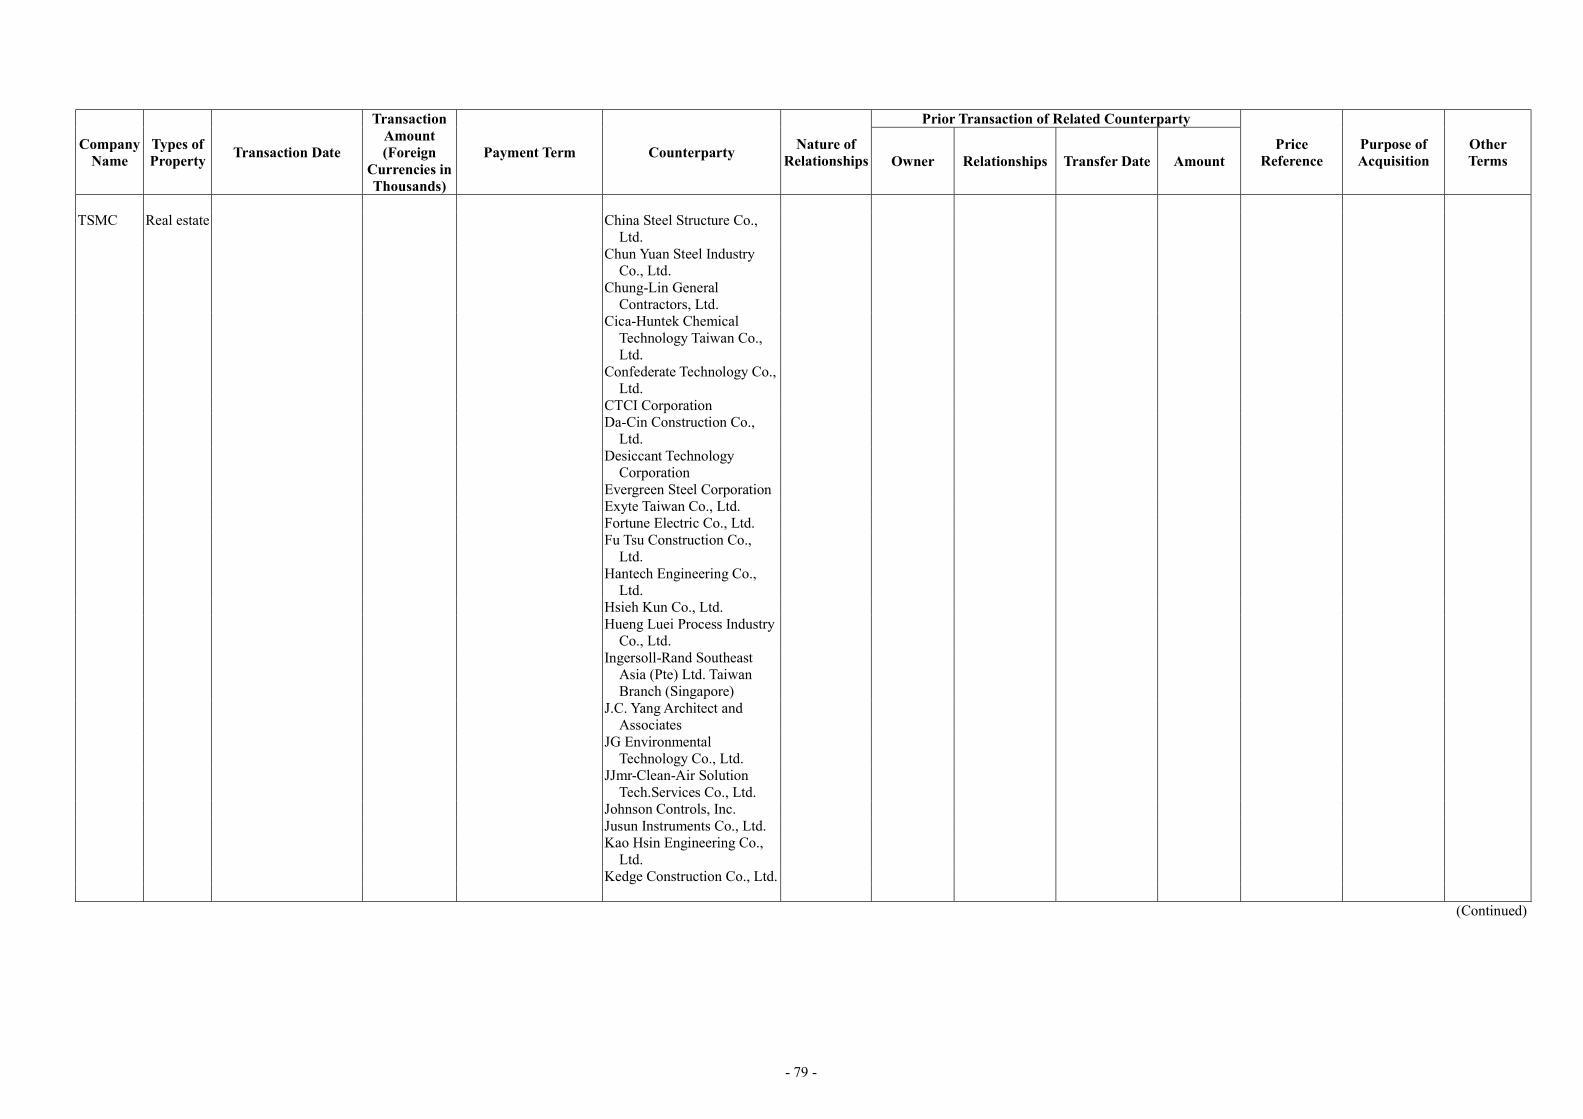
- 79 -
Company Name
Types of Property
Transaction Date
Transaction Amount (Foreign
Currencies in Thousands)
Payment Term Counterparty Nature of
Relationships
Prior Transaction of Related Counterparty
Price Reference
Purpose of Acquisition
Other Terms Owner Relationships Transfer Date Amount
TSMC Real estate China Steel Structure Co.,
Ltd.
Chun Yuan Steel Industry Co., Ltd.
Chung-Lin General Contractors, Ltd.
Cica-Huntek Chemical Technology Taiwan Co., Ltd.
Confederate Technology Co., Ltd.
CTCI Corporation Da-Cin Construction Co.,
Ltd.
Desiccant Technology Corporation
Evergreen Steel Corporation Exyte Taiwan Co., Ltd. Fortune Electric Co., Ltd. Fu Tsu Construction Co.,
Ltd.
Hantech Engineering Co., Ltd.
Hsieh Kun Co., Ltd. Hueng Luei Process Industry
Co., Ltd.
Ingersoll-Rand Southeast Asia (Pte) Ltd. Taiwan Branch (Singapore)
J.C. Yang Architect and Associates
JG Environmental Technology Co., Ltd.
JJmr-Clean-Air Solution Tech.Services Co., Ltd.
Johnson Controls, Inc. Jusun Instruments Co., Ltd. Kao Hsin Engineering Co.,
Ltd.
Kedge Construction Co., Ltd.
(Continued)

- 80 -
Company Name
Types of Property
Transaction Date
Transaction Amount (Foreign
Currencies in Thousands)
Payment Term Counterparty Nature of
Relationships
Prior Transaction of Related Counterparty
Price Reference
Purpose of Acquisition
Other Terms Owner Relationships Transfer Date Amount
TSMC Real estate Kinetics Technology
Corporation
L&K Engineering Co., Ltd. Lead-Fu Industrials
Corporation
Lee Ming Construction Co., Ltd.
Lumax International Corp., Ltd.
Mandartech Interiors Inc. Marketech International
Corp.
Mega Union Technology Incorporated
OBR Cooling Towers, Inc. Okland Construction
Company, Inc.
Organo Technology Co., Ltd. Ovivo Taiwan Co., Ltd. Pan Asia (Engineers &
Constructors) Corporation
Propersys Corp. Ruentex Engineering &
Construction Co., Ltd.
San Fu Chemical Co., Ltd. Schneider Electric Taiwan
Co., Ltd.
Shihlin Electric & Engineering Corporation
Siemens Limited Solomon Technology
Corporation
Swift Engineering Co., Ltd. Taiwan Gleno Enterprise Co.,
Ltd.
Taiwan Obayashi Corporation
Taiwan Puritic Corp. Taiwan Valqua Engineering
International, Ltd.
(Continued)

- 81 -
Company Name
Types of Property
Transaction Date
Transaction Amount (Foreign
Currencies in Thousands)
Payment Term Counterparty Nature of
Relationships
Prior Transaction of Related Counterparty
Price Reference
Purpose of Acquisition
Other Terms Owner Relationships Transfer Date Amount
TSMC Real estate TASA Construction
Corporation
Techgo Industrial Co., Ltd. Trane Taiwan Distribution
Limited
Trusval Technology Co., Ltd. Tung Kang Steel Structure
Corp.
Uangyih-Tech Industrial Co., Ltd.
Unelectra International Corp. United Integrated Services
Co., Ltd.
Versum Materials Taiwan Co., Ltd.
Weltall Technology Corporation
Wholetech System Hitech Limited
Yangtech Engineering Co., Ltd.
Yankey Engineering Co., Ltd.
Ying Pao Technology Inc. Zhao-Cheng Corp. Note: The disclosures are expected information based on the capital appropriation approved by the Board of Directors (Right-of-use assets are included). The actual information shall be subject to the final purchase order of TSMC.
(Concluded)

- 82 -
TABLE 6
Taiwan Semiconductor Manufacturing Company Limited and Subsidiaries TOTAL PURCHASES FROM OR SALES TO RELATED PARTIES OF AT LEAST NT$100 MILLION OR 20% OF THE PAID-IN CAPITAL FOR THE NINE MONTHS ENDED SEPTEMBER 30, 2021 (Amounts in Thousands of New Taiwan Dollars, Unless Specified Otherwise)
Company Name Related Party Nature of Relationships
Transaction Details Abnormal Transaction Notes/Accounts Payable or
Receivable Note
Purchases/ Sales
Amount (Foreign Currencies
in Thousands)
% to Total
Payment Terms Unit Price Payment Terms Ending Balance
(Foreign Currencies in Thousands)
% to Total
TSMC TSMC North America Subsidiary Sales $ 751,970,294 66 Net 30 days from invoice date
(Note) - (Note) $ 134,483,131 77
GUC Associate Sales 3,928,195 - Net 30 days from the end of the month of when invoice is issued
- - 595,876 -
TSMC Nanjing Subsidiary Purchases 19,504,043 22 Net 30 days from the end of the month of when invoice is issued
- - (1,854,832) 4
TSMC China Subsidiary Purchases 15,735,716 17 Net 30 days from the end of the month of when invoice is issued
- - (1,752,627) 4
WaferTech Indirect subsidiary Purchases 5,661,994 6 Net 30 days from the end of the month of when invoice is issued
- - (595,852) 1
SSMC Associate Purchases 2,921,637 3 Net 30 days from the end of the month of when invoice is issued
- - (419,846) 1
VIS Associate Purchases 2,799,317 3 Net 30 days from the end of the month of when invoice is issued
- - (305,298) 1
TSMC North America GUC Associate of TSMC Sales 1,353,249 - Net 30 days from invoice date - - 82,191 - (US$ 48,376) (US$ 2,950) VisEra Tech Xintec Associate of TSMC Sales 588,239 9 Net 60 days from the end of the
month of when invoice is issued - - 181,077 11
Note: The tenor is determined by the payment terms granted to its clients by TSMC North America.

- 83 -
TABLE 7
Taiwan Semiconductor Manufacturing Company Limited and Subsidiaries RECEIVABLES FROM RELATED PARTIES AMOUNTING TO AT LEAST NT$100 MILLION OR 20% OF THE PAID-IN CAPITAL SEPTEMBER 30, 2021 (Amounts in Thousands of New Taiwan Dollars, Unless Specified Otherwise)
Company Name Related Party Nature of Relationships Ending Balance
(Foreign Currencies in Thousands)
Turnover Days (Note 1)
Overdue
Amounts Received in Subsequent
Period
Allowance for Bad Debts Amount Action Taken
TSMC TSMC North America Subsidiary $ 137,787,407 43 $ - - $ - $ - TSMC Nanjing Subsidiary 212,661 Note 2 - - - - GUC Associate 595,876 32 - - - - TSMC 3DIC TSMC Parent company 185,593 Note 2 - - - - (JPY 742,670) TSMC China TSMC Nanjing The same parent company 24,156,541 Note 2 - - - - (RMB 5,602,686) TSMC Parent company 1,752,627 30 - - - - (RMB 406,493) TSMC Nanjing TSMC Parent company 1,854,832 26 - - - - (RMB 430,198) VisEra Tech Xintec Associate of TSMC 181,077 86 - - - - TSMC Technology TSMC The ultimate parent of the
Company 320,051 (US$ 11,486)
Note 2 - - - -
WaferTech TSMC The ultimate parent of the
Company 595,852 (US$ 21,384)
31 - - - -
TSMC Development Parent company 105,691 Note 2 - - - - (US$ 3,793) Note 1: The calculation of turnover days excludes other receivables from related parties. Note 2: The ending balance is primarily consisted of other receivables, which is not applicable for the calculation of turnover days.

- 84 -
TABLE 8
Taiwan Semiconductor Manufacturing Company Limited and Subsidiaries INTERCOMPANY RELATIONSHIPS AND SIGNIFICANT INTERCOMPANY TRANSACTIONS FOR THE NINE MONTHS ENDED SEPTEMBER 30, 2021 (Amounts in Thousands of New Taiwan Dollars)
No. Company Name Counterparty Nature of
Relationship (Note 1)
Intercompany Transactions
Financial Statements Item Amount Terms
(Note 2)
Percentage of Consolidated Net Revenue
or Total Assets
0 TSMC TSMC North America 1 Net revenue from sale of goods $ 751,970,294 - 65% Receivables from related parties 134,483,131 - 4% Other receivables from related parties 3,304,276 - - Accrued expenses and other current liabilities 8,049,910 - - Other noncurrent liabilities 75,709,274 - 2% TSMC Japan 1 Marketing expenses - commission 171,413 - - TSMC JDC 1 Research and development expenses 261,087 - - TSMC 3DIC 1 Research and development expenses 187,131 - - TSMC Europe 1 Marketing expenses - commission 352,884 - - TSMC China 1 Purchases 15,735,716 - 1% Marketing expenses - commission 195,303 - - Payables to related parties 1,752,627 - - TSMC Nanjing 1 Purchases 19,504,043 - 2% Payables to related parties 1,854,832 - - TSMC Canada 1 Research and development expenses 227,409 - - TSMC Technology 1 Research and development expenses 2,110,316 - - Payables to related parties 320,051 - - WaferTech 1 Purchases 5,661,994 - - Payables to related parties 595,852 - -
1 TSMC China TSMC Nanjing 3 Other receivables from related parties 24,156,541 - 1%
Note 1: No. 1 represents the transactions from parent company to subsidiary.
No. 3 represents the transactions between subsidiaries. Note 2: The sales prices and payment terms of intercompany sales are not significantly different from those to third parties. For other intercompany transactions, prices and terms are determined in accordance with mutual agreements.

- 85 -
TABLE 9
Taiwan Semiconductor Manufacturing Company Limited and Subsidiaries NAMES, LOCATIONS, AND RELATED INFORMATION OF INVESTEES OVER WHICH THE COMPANY EXERCISES SIGNIFICANT INFLUENCE (EXCLUDING INFORMATION ON INVESTMENT IN MAINLAND CHINA) FOR THE NINE MONTHS ENDED SEPTEMBER 30, 2021 (Amounts in Thousands of New Taiwan Dollars, Unless Specified Otherwise)
Investor Company Investee Company Location Main Businesses and Products
Original Investment Amount Balance as of September 30, 2021 Net Income
(Losses) of the Investee (Foreign
Currencies in Thousands)
Share of Profits/Losses
of Investee (Note 1) (Foreign
Currencies in Thousands)
Note
September 30, 2021
(Foreign Currencies in Thousands)
December 31, 2020
(Foreign Currencies in Thousands)
Shares (In Thousands)
Percentage of Ownership
Carrying Value (Foreign
Currencies in Thousands)
TSMC TSMC Global Tortola, British Virgin Islands Investment activities $ 355,162,309 $ 355,162,309 11 100 $ 378,722,890 $ 1,247,547 $ 1,247,547 Subsidiary TSMC Partners Tortola, British Virgin Islands Investing in companies involved in the
semiconductor design and manufacturing, and other investment activities
31,456,130 31,456,130 988,268 100 53,793,566 1,305,382 1,305,382 Subsidiary
TSMC Arizona Phoenix, Arizona, U.S.A. Manufacturing, sales and testing of integrated circuits and other semiconductor devices
21,153,537 855,599 753 100 18,503,814 (2,474,086) (2,474,086) Subsidiary
VIS Hsin-Chu, Taiwan Manufacturing, sales, packaging, testing and computer-aided design of integrated circuits and other semiconductor devices and the manufacturing and design service of masks
10,180,677 10,180,677 464,223 28 9,623,603 8,103,749 2,291,311 Associate
SSMC Singapore Manufacturing and sales of integrated circuits and other semiconductor devices
5,120,028 5,120,028 314 39 6,604,176 1,937,154 751,422 Associate
VisEra Tech Hsin-Chu, Taiwan Research, design, development, manufacturing, sales, packaging and test of color filter
4,224,082 5,005,171 213,619 73 6,142,094 1,645,161 1,253,107 Subsidiary
TSMC North America San Jose, California, U.S.A Sales and marketing of integrated circuits and other semiconductor devices
333,718 333,718 11,000 100 4,789,407 260,501 260,501 Subsidiary
Xintec Taoyuan, Taiwan Wafer level chip size packaging and wafer level post passivation interconnection service
1,988,317 1,988,317 111,282 41 2,860,422 1,424,494 584,503 Associate
GUC Hsin-Chu, Taiwan Researching, developing, manufacturing, testing and marketing of integrated circuits
386,568 386,568 46,688 35 1,343,198 945,175 329,289 Associate
TSMC Europe Amsterdam, the Netherlands Customer service and supporting activities 15,749 15,749 - 100 520,615 16,645 16,645 Subsidiary TSMC JDC Yokohama, Japan Engineering support activities 410,680 302,560 15 100 378,267 11,009 11,009 Subsidiary TSMC 3DIC Yokohama, Japan Engineering support activities 278,986 - 11 100 330,689 54,058 54,058 Subsidiary Emerging Fund Cayman Islands Investing in technology start-up companies 298,618 - - 99.9 290,103 (8,081) (8,073) Subsidiary VTAF III Cayman Islands Investing in technology start-up companies 1,321,594 1,318,846 - 98 253,714 (7,079) (6,938) Subsidiary TSMC Japan Yokohama, Japan Customer service and supporting activities 83,760 83,760 6 100 137,414 4,997 4,997 Subsidiary VTAF II Cayman Islands Investing in technology start-up companies 260,300 260,300 - 98 90,938 (369) (362) Subsidiary TSMC Korea Seoul, Korea Customer service and supporting activities 13,656 13,656 80 100 40,122 1,717 1,717 Subsidiary TSMC Partners TSMC Development Delaware, U.S.A Investing in companies involved in
semiconductor manufacturing 16,354,463 (US$ 586,939)
16,354,463 (US$ 586,939)
- 100 30,335,367 (US$ 1,088,694)
1,090,231 (US$ 38,976)
Note 2 Subsidiary
TSMC Technology Delaware, U.S.A Engineering support activities 397,954 397,954 - 100 802,124 39,443 Note 2 Subsidiary (US$ 14,282) (US$ 14,282) (US$ 28,787) (US$ 1,403) TSMC Canada Ontario, Canada Engineering support activities 64,087 64,087 2,300 100 274,421 19,649 Note 2 Subsidiary (US$ 2,300) (US$ 2,300) (US$ 9,849) (US$ 703) VTAF III Growth Fund Cayman Islands Investing in technology start-up companies 72,551 69,765 - 100 170,147 (859) Note 2 Subsidiary (US$ 2,604) (US$ 2,504) (US$ 6,106) (US$ (31)) Mutual-Pak New Taipei, Taiwan Manufacturing of electronic parts, wholesaling
and retailing of electronic materials, and researching, developing and testing of RFID
44,397 (US$ 1,593)
44,397 (US$ 1,593)
4,693 28 23,776 (US$ 853)
(15,545) (US$ (552))
Note 2 Associate
TSMC Development WaferTech Washington, U.S.A Manufacturing, sales and testing of integrated circuits and other semiconductor devices
- - 293,637 100 5,607,782 (US$ 201,255)
1,039,101 (US$ 37,149)
Note 2 Subsidiary
Note 1: The share of profits/losses of investee includes the effect of unrealized gross profit on intercompany transactions. Note 2: The share of profits/losses of the investee company is not reflected herein as such amount is already included in the share of profits/losses of the investor company.

- 86 -
TABLE 10
Taiwan Semiconductor Manufacturing Company Limited and Subsidiaries INFORMATION ON INVESTMENT IN MAINLAND CHINA FOR NINE MONTHS ENDED SEPTEMBER 30, 2021 (Amounts in Thousands of New Taiwan Dollars, Unless Specified Otherwise)
Investee Company Main Businesses and
Products
Total Amount of Paid-in Capital
(RMB in Thousands)
Method of Investment
Accumulated Outflow of
Investment from Taiwan as of
January 1, 2021 (US$ in
Thousands)
Investment Flows Accumulated Outflow of
Investment from Taiwan as of
September 30, 2021 (US$ in Thousands)
Net Income (Losses) of the
Investee Company
Percentage of Ownership
Share of Profits/Losses
Carrying Amount
as of September 30,
2021
Accumulated Inward
Remittance of Earnings as of September 30,
2021
Outflow (US$ in
Thousands) Inflow
TSMC China Manufacturing, sales,
testing and computer-aided design of integrated circuits and other semiconductor devices
$ 18,939,667 (RMB 4,502,080)
Note 1 $ 18,939,667 (US$ 596,000)
$ - $ - $ 18,939,667 (US$ 596,000)
$ 6,149,138 100% $ 6,209,867 (Note 2)
$ 70,673,347 $ -
TSMC Nanjing Manufacturing, sales,
testing and computer-aided design of integrated circuits and other semiconductor devices
30,521,412 (RMB 6,650,119)
Note 1 30,521,412 (US$ 1,000,000)
- - 30,521,412 (US$ 1,000,000)
8,507,377 100% 8,502,177 (Note 2)
42,149,551 -
Accumulated Investment in Mainland China
as of September 30, 2021 (US$ in Thousands)
Investment Amounts Authorized by Investment Commission, MOEA
(US$ in Thousands) Upper Limit on Investment
$ 49,461,079 (US$ 1,596,000)
$ 119,412,667 (US$ 3,596,000)
$1,246,992,186 (Note 3)
Note 1: TSMC directly invested US$596,000 thousand in TSMC China and US$1,000,000 thousands in TSMC Nanjing. Note 2: Amount was recognized based on the reviewed financial statements. Note 3: The upper limit on investment in mainland China is determined by sixty percent (60%) of the Company’s consolidated net worth.

- 87 -
TABLE 11
Taiwan Semiconductor Manufacturing Company Limited INFORMATION ON MAJOR SHAREHOLDERS SEPTEMBER 30, 2021
Shareholders (Note)
Shares
Total Shares Owned Ownership Percentage
ADR-Taiwan Semiconductor Manufacturing Company, Ltd. 5,321,441,383 20.52% National Development Fund, Executive Yuan 1,653,709,980 6.38% Note: Major shareholders shows the list of all shareholders with ownership of 5 percent or greater.