Trends in Investiment in Developing ountries - All...
62
IFD377 May 1999 1(1 DISCUSSION PAPER Trends in Private Investimentin Developing ountries Statistics for 1970-97 (This issue includes the resultsof a worldwide survey of obstacles to dioing business as perceived by executives in 74 countries) Guy P.Pfeffermann Gregory V. Kisunko Mariusz A.Sumlinski INTERNATIONAL FINANCE CORPORATION Public Disclosure Authorized Public Disclosure Authorized Public Disclosure Authorized Public Disclosure Authorized Public Disclosure Authorized Public Disclosure Authorized Public Disclosure Authorized Public Disclosure Authorized
Transcript of Trends in Investiment in Developing ountries - All...

IFD377May 1999 1(1
DISCUSSION PAPER
Trends in PrivateInvestiment in Developing
ountriesStatistics for 1970-97
(This issue includes the results of a worldwide survey of obstaclesto dioing business as perceived by executives in 74 countries)
Guy P. PfeffermannGregory V. Kisunko
Mariusz A. Sumlinski
INTERNATIONALFINANCE
CORPORATION
Pub
lic D
iscl
osur
e A
utho
rized
Pub
lic D
iscl
osur
e A
utho
rized
Pub
lic D
iscl
osur
e A
utho
rized
Pub
lic D
iscl
osur
e A
utho
rized
Pub
lic D
iscl
osur
e A
utho
rized
Pub
lic D
iscl
osur
e A
utho
rized
Pub
lic D
iscl
osur
e A
utho
rized
Pub
lic D
iscl
osur
e A
utho
rized

IFC Discussion Papers
No. 1 Private Business in Deceloping Countries: ImprovedProspects. Guy P. Pfeffermann
No. 2 Debt-Eqzaiy Sraps and Foreign Direct lnvestment in ,LauinAmenca Joel Bergsmanand Wayne Edisis
No. 3 ProspectsfortheBuinessSeetorinDeveopingCounties. Economics Department, IFC
No. 4 Strengthening Heath Servvesin Defeloping Countries through the Private SItor.Charles C. Griffin
No. 5 TheDevelopmentConribution of IFCOperaions. Economics Department, IFC
No. 6 TrendstnPPrxwteJnu%smentin Thiy DevffelopingCountri. Guy P. Pfeffermannand Andrea Madarassy
No. 7 Automotive Industry Trends and Prospctsfor Investment in Developing Countries.Yannis Karmokolias
No. 8 Exportingto Industrial Counties. ProspectsforB isies in Developing Countries.Economics Department, IFC
No.9 AfricanEntrepre s--PoneersofDer,lopment. Keith Marsden
No. 10 Privatizing Teonunm ansSysteyu: Buans Opp ortunities in DevelopingCountries.William W. Ambrose, Paul R. Hennemeyer, and Jean-Paul Chapon
No. 11 Trends in Private Investment in Developing Countries, 1990-91 Edition. Guy P. Pfeffermannand Andrea Madarassy
No. 12 FinangingCorporateGrowYthintheDewelopingWorld Economics Department, IFC
No.13 VentureCapiLessonsfromtheDevelopedWorldfortheDevelopingMarkets. Silvia B. Sagariwith Gabriela Guidotti
No. 14 Trends in Priate Investment in Developing Countries, 1992 edition. Guy P. Pfeffermannand Andrea Madarassy
No. 15 Private Sector Elermi&y in Developing Countries: Supply andDemnd Jack D. Glen
No. 16 Trends in Priwae Invetment in Developing Countries 1993: Statisticsfor 1970-91.Guy P. Pfeffermann and Andrea Madarassy
No. 17 How FirmsinDevelopingCoumtries,ManageRisk. Jack D. Glen
No. 18 Coping smit/ Capitalism: TheNew Polish Entrepreneurs. Bohdan Wyznikiewicz, Brian Pinto,and Maciej Grabowski
No. 19 IntelltProperty Protectin, Foreign Direct Inestment, and Technology Transfer.Edwin Mansfield
No. 20 Trends in Private Investmentin Developing Countries 1994: Statisticsfor 1970-92. Robert Millerand Mariusz Sumlinski
(Continued on the inside back covr)

INTERNATIONALFINANCE
____._L__ CORPORATION
DISCUSSION PAPER NUMBER 37
Trends in Privateinvestment in Developing
ountriesStatistics for 1970-97
Guy P. PfeffermannGregory V. Kisunko
Mariusz A. Sumlinski
The World BankWashington, D.C.

Copyright © 1999The World Bank and
International Finance Corporation1818 H Street, N.W.Washington, D.C. 20433, U.S.A.
All rights reservedManufactured in the United States of AmericaFirst printing May 1999
The Intemational Finance Corporation (IFC), an affiliate to the World Bank, promotes the economicdevelopment of its member countries through investment in the private sector. It is the world's largest multilateralorganization providing financial assistance directly in the form of loan and equity to private enterprises indeveloping countries.
To present the results of research with the least possible delay, the typescript of this paper has not been preparedin accordance with the procedures appropriate to formal printed texts, and the IFC and the World Bank accept noresponsibility for errors. The findings, interpretations, and conclusions expressed in this paper are entirely those ofthe author(s) and should not be attributed in any manner to the IFC or the World Bank or to members of theirBoard of Executive Directors or the countries they represent. The World Bank does not guarantee the accuracy ofthe data included in this publication and accepts no responsibility for any consequence of their use. Some sourcescited in this paper may be informal documents that are not readily available.
The material in this publication is copyrighted. The World Bank encourages dissemination of its work and willnormally grant permission promptly.
Permission to photocopy items for internal or personal use, for the internal or personal use of specific clients, orfor educational classroom use is granted by the World Bank, provided that the appropriate fee is paid directly toCopyright Clearance Center, Inc., 222 Rosewood Drive, Danvers, MA 01923, U.S.A., telephone 978-750-8400, fax978-750-4470. Please contact the Copyright Clearance Center before photocopying items.
For permission to reprint individual articles or chapters, please fax your request with complete information tothe Republication Department, Copyright Clearance Center, fax 978-750-4470.
All other queries on rights and licenses should be addressed to the World Bank at the address above or faxed to202-522-2422.
ISSN (IFC Discussion Papers): 1012-8069ISSN (Trends in Private Investment in Developing Countries): 1018-208XISBN 0-8213-4475-7
Guy P. Pfeffermann is director, Economnics Department, IFC, and economic adviser to the Corporation. Gregory V.Kisunko is country officer in the World Bank's Europe and Central Asia Regional Office. Mariusz A. Sumlinski is aresearch analyst in the Economics Department, IFC.
The first edition of this serial publication was cataloged by the Library of Congress as follows:
Library of Congress Cataloging-in-Publication Data
Pfeffermann, Guy Pierre.Trends in private investment in thirty developing countries / Guy
Pfeffermann, Andrea Madarassy.p. cm. - (Discussion paper / International Finance
Corporation; no. 6)Includes bibliographical references.ISBN 0-8213-1352-51. Investments-Developing countries. II. Madarassy, Andrea,1964- . II. Title. III. Series: Discussion paper (InternationalFinance Corporation) ; no. 6.HG5993.P48 1989332.6'7314'091724-dc2O 89-22588
CIP

Contents
Foreword ..... v
Abstract ... ; vii
Chapter I - Private and Public Investment Trends ......................................................... 1
Chapter II - Perceived Obstacles to Doing Business: Worldwide Survey Results .............5
The survey ..................................................... 5
Number of obstacles .................................................... 6
The nature of obstacles .................................................... 12
Country-specific responses ........................................................ 13
The dog that didn't bark ........................................................ 15
Obstacles and levels of private investment-econometric results .......................... 20
Appendix 1 - Methods and Sources ........................................................ 25
Appendix 2 - Statistics ........................................................ 27
Sub-Saharan Africa ........................................................ 29
Latin America and the Caribbean ........................................................ 33
Middle East and North Africa ........................................................ 37
Transition Countries ........................................................ 39
East Asia ........................................................ 41
South Asia ........................................................ 45
Table - Investment as a share of GDP ........................................................ 47
iii


Foreword
This is the tenth annual edition of "Trends in Private Investment in DevelopingCountries". In order to mark the anniversary, the discussion paper includes figures foreach of the countries for which data are available as well as the first country-specificresults of a worldwide survey of obstacles to doing business perceived by executives in74 countries (including several industrial countries for comparison). The rationale for thispublication is that standard UN national accounts do not break investment down betweenpublic and private; rather, they distinguish between central government and all otherinvestment, and the latter includes investments by state-owned enterprises. The IFCdiscussion papers pull together information provided by national organizations, WorldBank, and IMF economists in order to estimate levels of private investment.
Guy PfeffermannDirector, Economics Department
& Economic Adviser of the Corporation
v


Abstract
The first part of the discussion paper documents trends in private and public fixedinvestment. On average for the 47 countries covered (including, for the first time in thisseries, China), 1997 was a record year for private investment, which rose from a low of11.2 percent of GDP in 1985 to 14.3 percent in 1997, the last year for which data exist.Public investment declined to 7.2 percent of GDP, its lowest level since 1975. The largest1997 increases in private investment were in two transition countries where levels remainlow (Bulgaria and Romania) followed by Panama, CMte d'Ivoire, Bolivia, Argentina andChina. Ratios of private investment to GDP were highest in Papua New Guinea,Malaysia, the Republic of Korea, Thailand, and Indonesia, before the full effects of theAsian crisis were felt.
The second part presents country-specific results of a 1996/97 worldwide surveyof business executives. The discussion focuses on obstacles to doing business in each ofthe 74 countries covered (including industrial economies) and their relationship to levelsof private investment. A few factors emerge as being of particular importance to privateinvestment decisions: the real exchange rate, the rule of law, predictability of judiciarysystems, and the extent to which financing is available to enterprises.
vii


Chapter IPrivate and Public Investment Trends
In 1997, the latest year for which the data exist, private investment continued torise and public investment to decline on average in line with recent trends in the 47countries covered this year (see Figure 1). The data do not reflect the worsened economicconditions of many developing countries in the wake of the Asian crisis. "Investment"refers to gross domestic fixed capital and encompasses national as well as foreign directinvestment.
Fig. 1. Trends in Private and Public Investment(prcent of GDP)
-Pivate investment -Public investnent
1614121010
4201970 1973 1976 1979 1982 1985 1988 1991 1994 1997
Overall trends of the past few years mirror those in the four major regions shownin Figures 2 to 5. In all cases except most recently in East Asia trends in private andpublic investment clearly diverge. The drop in public investment is particularlypronounced in Africa.
1

Fig. 2. Latin America: Private and Public Investment(percent of GDP)
-0-Private investment -Public Investment
1614
12
1970 1973 1976 1979 1982 1985 1988 1991 1994 1997
Fig. 3. Sub-Saharan Africa: Private and Public Investrnent(percent of GOP)
-0Private investment -Public Investment
16
0 46
14
2
01970 1973 1976 1979 1982 1985 1988 1991 1994 1997
2

Fig. 4. South Asia: Private and Public Investment(percent of GDP)
-Private investment -Public Investment
14
121 10
06
201970 1973 1976 1979 1982 1985 1988 1991 1994 1997
Fig. 5. East Asia: Private and Public Investment(percent of GDP)
---Private investment -Public Investment
30
25
EL20
0~10
5
01970 1973 1976 1979 1982 1985 1988 1991 1994 1997
Individual country trends as well as the statistics are shown in Appendix 2.
3

The following table shows 1997 private investment ratios in descending order.
T-b- et. 1iJ$va%e Investment in 199 Unt of; GDP
Papua New Guinea 31.5 Belize 12.8Maaysia 30.9 South Africa 12.7Korea Rep. of* 27.1 Tunisia 12.4Thailalnd000 0 j30 :00 ::24j1 El Salvador 12.1Indonesia 22.1 Egypt 12.1tPanama 0 di :0:t0E ::t22.0 Kenya 11.3Peru 21.0 Cote d'Ivoire 11.2Philippines 2.9 Guatmal 11.1Dominican Republic 20.5 Benin 11.0Turkey000 0 0 0000 0 0 ji 4 ;;j0i$00020.5 0Morocco 11.Chile 20.4 Bangladesh 10.8Maur 4000 0 0004 0 000000titius :000 0 00020.0 P:land 10.3Nicaragua 19.8 Bolivia 10.3Argentina 18.4 Colombia 10.0India 16.1 Guinea-Bissau 9.2Mexico00 000 M16.0 Pakistan 8 9China 15.8 Mauritania 8.6Brazil : 15.8 i Uru i I:guay .8.6Paraguay 15.4 Venezuela 7.4Costa Rica00000000 t :: 0 15.0m Romani a R6.2Iran 13.8 Madagascar 5.5Ecuador00 ttttt 0 000 j0;13.31 Malawi 5.1Namibia 12.9 Bulgaria 4 8* 1996
Table 2 shows changes in ratios of private investment to GDP between 1990 and 1997.
Table I Chaae aiwPrivate luvestnient Ras )ent)
Bulgaria 443 Chile 11Romania 344 Philippines 11Panama 196 Guinea-Bissau 9C6te dIvoire....h i i 1128 El Salvadorf 9Bolivia 108 Guatemala 8Argentina :i: 95 Ecuadori 8China 92 Kenya 3Benm.j 1 lX|j;jl0)|i;00 lt ;l; 8-ti000lS3000 : ::Naminbia 2Nicaragua 77 Mauritius IPeru 72 Tunisia IBangladesh 68 Pakistan 0fakii04g:t0Si tggl66 South Africa -.2Papua New Guinea 57 Colombia -2Venezuela ; ;;j;000;00000 0 tttt 0 50 Mauitaia-7Malaysia 48 Korea Rep. of -9Turkey 31 Brazil -10Poland 21 Paraguay -15Mexicotit t4000000000 ti it0 :i017|;:; 0 ti ;00 Costa Rica -15India 16 Madagascar -21Indonesia i M Morocco -25Dominican Republic 12 Egypt -28l3elize:;000000 i3fi i$iiiX;T: >12 Thailand -30Uruguay 12 Malawi -56
4

Chapter IIPerceived Obstacles to Doing Business: Worldwide Survey Results
The survey
Why is investment, especially private investment, so low in some developingcountries and so high in others? Levels of investment and how efficiently it is being usedare affected by many factors, most of which can be grouped into (a) macroeconomicpolicies; (b) microeconomic incentives; and (c) institutional factors.
An earlier IFC Discussion Paper' as well as other publications2 draw on the viewsexpressed by CEOs or managers of businesses in groups of developing and, for purposesof benchmarking, mature industrialized economies. The present paper uses the samedata, which were collected under the aegis of the World Bank's 1997 World DevelopmentReport3 as well as additional ones gathered by researchers at the University of Basel (forBrazil, Hong Kong, China, Korea, Singapore, and Thailand).
The survey covers 3,951 firms in 74 countries, mostly in manufacturing andservices (about half each) plus some agricultural firms.4 The survey covers large andsmall firms with and without foreign participation. Interviews were conducted in thecountries where firms operate.
This paper addresses the question: which obstacles to doing business areconsidered to be most serious by private sector managers in particular countries?The answer might help to identify policy domains (macroeconomic, institutional)most relevant in each country and levels of national authority (central, local) mostappropriate to reduce obstacles to doing business.
Managers were asked to judge on a six points scale how problematic variousobstacles are for doing business. The six points range from "no obstacle" and "moderateobstacles," to "strong" and "very strong" obstacles.5 The areas listed are:
* Regulations for starting business/new operations
How Businesses See Government: Responses from Private Sector Surveys in 69 Countries. AymoBrunetti, Gregory Kisunko, and Beatrice Weder, IFC Discussion Paper No. 33, 1998.
2 Institutions in transition: reliability of rules and economic performance in former socialist countries.Aymo Brunetti, Gregory Kisunko, Beatrice Weder, Policy Research Working Paper No. 1809, 1997;Credibility of rules and economic growth: evidence from a worldwide survey of the private sector.Aymo Brunetti, Gregory Kisunko, Beatrice Weder, Policy Research Working Paper No. 1760, 1997;Institutional obstacles to doing business: Region-by-region results from a worldwide survey of theprivate sector. Aymo Brunetti, Gregory Kisunko and Beatrice Weder, Policy Research Working Paper,No. 1759, 1997.
3 The State in a Changing World, Oxford University Press, 1997.
4 The average number of respondents per country is 54 (ranging from 13 in Chad to 124 in Togo), themedian 49 and the standard deviation 29.
Each respondent was limited to checking no more than five "very strong" obstacles.
5

* Price controls* Foreign trade regulations (exports, imports)* Financing* Labor regulations* Foreign currency regulations* Tax regulations and/or high taxes* Infrastructure* Policy instability* Safety or environmental regulations. Inflation* General uncertainty regarding costs of regulations* Crime and theft* Corruption* Terrorism* As well as an open-ended category: "Other."
The discussion also draws on responses to a separate question: "Unpredictabilityof the judiciary presents a major problem for my business operations" for which the sixpoints scale ranges from "fully agree" to "strongly disagree." In order to integratejudiciary unpredictability issues with the other obstacles listed above, we equate "fullyagree" to "very strong obstacles" and "agree in most cases" to "strong obstacles."Throughout this paper, "obstacles" are drawn from the list above (includingunpredictability of the judiciary).
Number of obstacles
The bottom line on Table 3 shows the number of areas which 50 percent or moreof respondents considered to be serious ("strong" and "very strong" responses). It isimportant to bear in mind that the table reflects judgements on the part of businesspeople; the apparent absence of serious problems may mean that the items listed in thequestionnaire do not hinder businesses, and/or that business people have learned to getaround them. Furthermore, comparisons between countries are not straightforwardbecause it is quite possible that the "propensity to complain" varies from country tocountry.
6

Table 3. Reported obstadles to doing business--total number and ranking
Obstacles IIiiiI~~1Iiuaik4Unpredictability of the judiciary 2 ... .4 3 1 10 1 4 4 3Regulations for starting business/niew 3
operationsPnice controlsRegulations on foreign trade (exports, 6 5
imports)Financing 2 8 5 7 5 2 4Labor regulations1Foreign currency regulations 2 .4Tax regulations and/orhigh taxes .. 1 2 1 1 2 4 .. 2 3 1 2 1 1 1 Inadequate supply of infrastructure I .. ... .. . 2 . 9 1 .. 2 8 3Policy instability 3 2 .4 .. ... 6Safety or enviromnmental regulations 3Infation 6 4 1General uncertainty on costs of.. .. .5 . . 3
regulationsCrine and theft 4 4 .. 4 1 I 4Corruption 3 2. 1 5. 74. 23 2. 2Terrorism ... 4
Other
Total number ofsexious obstacles 4 1 4 4 7 4 5 0 10 5 1 4 8 6 2 5
per countr
(continued)

Table 3 (continued)
. .. i..i..i...iII.I.Unpredictability of the judiciary 1 4 1 2Regulations for starting business/new
operationsPrice controlsRegulations on foreign trade (exports,.
imnports)Financing 2 ... 2Labor regulations 4 1. ... 2Foreign currency regulations 4Tax regulations and/or high taxes I 2 2 1 1 4 1 2 1 1..Inadequate supply of infrastructure . .... 3.. . I 3 3Policy instability .
Safety or environmental regulationsnflation I .. .. .. I 2 .. . 2General uncertainty on costs of 4
regulationsCrime and theft 3 .. .. .... .. . ICorruption 2 3 ... 2 2 .4...4Terrorism
Other
Total number of serious obstades 2 4 0 6 2 2 1 2 4 2 0 2 2 1 3 4per county
8

Unpredictability of the judiciary .. 3 2 . 2 .1 1 .2 4 1Regulations for starting business/new .
operationsPrice controls. . . ... ...Regulations on foreign trade (exports, 7 . ...
imports)Financing 5 2 . 2 8 .. . 4 5Labor regulations . .. ..Foreign currency regulationsTax regulations and/or high taxes I114. 1 1111I 2 3 1.Inadequate supply of infrastruture 1.5 1.3Policy instability 4. 4.4Safety or environmental regulations Inflation 6 3General uncertainty on costs of .. .4 . ..
regulationsCrime and theft 6 62. 4 . . 72.5 3.Corruption 2 22. 3 3 3. 3.1 22Terrorism
Other
Total number of serious obstadles 1 7 5 0 4 4 3 2 8 3 0 2 0 5 5 3per countr
(continued)
9
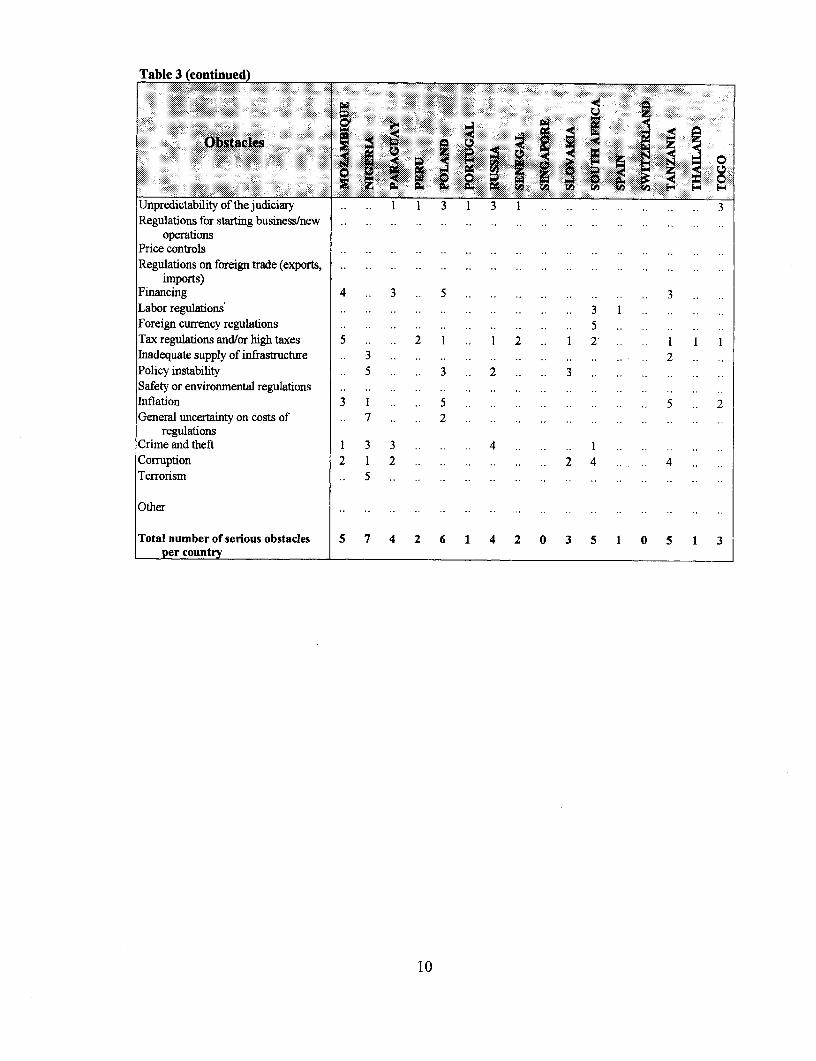
Table 3 (continued)
Unpredictability of thle judiciary 1 1 3 1 3 1 3Regulations for starting business/new
operationsPrice controlsRegulations on foreign trade (exports,
imports)Financing 4 3 5 . .3
Labor regulations'...3 Foreign currency regulations . ... 5Tax regulations and/or high taxes 5 2 1 1 2 1 2Inadequate supply of infrastructure 3.2Policy instability .. 5 3 .. 2 3Safety or enviromnental regulationsInflation 3 1 5.5 .. 2General uncertainty on costs of 7. . 2 . . .
regulationsCrimieand theft 1 3 3 .4 .Corruption 2 1 2.2 4 4Terrorism .. 5
Other
Total number of serious obstacles 5 7 4 2 6 1 4 2 0 3 5 1 0 5 1 3
er countr
1 0

Obtces
Unpredictability of the judcir 32 1 3 1 42
Regulations for starting business/new.11operations
Price controls..0 0
Regulations on foreign trade (exports, . 5 . 2 5 7
imnports)Financing .. 3 3. . . 2 22 30
Labor regulations 5 7 9
Foreign currency regulations. .. . 4. .. 5 7
Tax regulations and/or high taxes .. I 1 1 1 6 4 4 1 53 72
Inadequate supply of infrastructure. . ... . . . . 1 5 4 20 27
Policy instabihity I 2 4 1 3 1 8
Safety or environmnental regulations.2.2 3
Inflation 2.3 2 1 2 20 27
General uncertainty on costs of.5.8 1 1
regulationsCrime and theft 4 7 2 23 3 1
Corruption 2 . 6 3 2 3 35 47
Terrorism . .. .. 2 3
Other 0 0
Total number of serious obstacles 3 3 0 5 2 6 7 4 5 4per country _______________________________
The number of problematic areas ranges from zero (in 9 countries, 7 developingplus Switzerland and the UK) 6 to 7 and more (in seven countries). The surveys werecarried out in 1996/97; conditions may have changed since then. An updated survey ofbusiness conditions is being planned for 1999, which may make it possible to identifysuch changes. The average number of serious obstacles to doing buisiness is 3.7 in thedeveloping and transition countries and 1.5 in advanced industrial countries.
Table 4 shows the sensitivity of results to using a more restrictive definition ofwhat constitutes a serious problem area, lowering the bar from 50 percent or more ofrespondents to, respectively, 60, 70 and 75 percent. The average number of seriousobstacles changes as follows:
6 Korean, Malaysian, and Thai mianagers did not perceive "strong" obstacles to doing business in 1997; thismay reflect the fact that the survey was undertaken prior to the worst of the East Asian crisis, but mayalso reflect long-term fundamental strengths.

Table 4. Average number of serious obstacles to doing business per country
Number obfseiu btcepeconr-Percentageshare of repondents who view prblesa
serious50% or more 60% orme 70% omre75%or or
Average for developing and transition 3.7 2.2 1.2 0.7countries (63 countries)
Average for advanced developed 1.5 0.5 0.3 0.3countries (I11 countries)
Ratio of averages for developing/ 2.7 4.4 4 2.3transition and advanced developed,countries
The nature of obstacles
The last columns of Table 3 show obstacles to doing business in order offrequency in the countries where firms were surveyed. Using the 50 percent cut-offpoint, the table suggests that taxes are by far the most prevalent perceived obstacle todoing business (72 percent of the countries). The finding is ambivalent, however,because the question combines tax regulations and "high taxes." More meaningful is thefrequency of corruption and the unpredictability of the judiciary, which are perceived in47 and 42 percent respectively of the 74 countries to be a serious obstacle to doingbusiness. Next come, neck-and-neck, crime and theft (31 percent of countries), lack offinancing (30 percent), inadequate infrastructure (27 percent) and inflation (27 percent).In none of the countries were "other" obstacles to doing business considered to beserious, suggesting that the list of possible problem areas was quite comprehensive.
Table 5 compares the perceived seriousness of obstacles in developed anddeveloping countries. Labor regulations and safety and environment regulationsobstacles are considered to be serious obstacles to doing business in a number ofdeveloped countries, but do not loom large in developing economies. Taxes, as noted,are the most prevalent perceived obstacle for all countries (in 90 percent of transitioneconomies and in 64 and 65 percent, respectively, of developed and other developingcountries). Inflation is considered to be a serious obstacle in 35 percent of non-transitiondeveloping countries and 25 percent of transition economies. Infrastructure is considereda problem in 9 percent of developed, 10 percent of transition and 40 percent of othersurveyed developing economies. Obstacles related to political instability and generaluncertainty in the cost of regulations are much more prevalent in transition then in otherdeveloping economies (40 versus 12, and 30 versus 5 percent respectively). Lastly,regulations related to foreign economic activities are more of an obstacle in transitioncountries.
12

Table 5. Obstacles to doing business considered serious by 50% or more of respondents
(percent of countries)
Obstacles All Developed All_ Transition Othercountries :countries deing ies dev-eloping
. --- ~~~~~~~countries - --- countries:Unpredictability of the judiciary 42 9 48 50 47Regulations for starting 1 9 0 0 0
business/new operationsPrice controls 0 0 0 0 0Regulations on foreign trade 7 0 8 15 5
(exports, imports)Financing 30 0 35 30 37Labor regulations 9 36 5 0 7
Foreign currency regulations 7 0 8 15 5Tax regulations and/or high taxes 72 64 73 90 65Inadequate supply of 27 9 30 10 40
infrastructurePolicy instability 18 0 21 40 12Safety or environmental 3 18 0 0 0
regulationsInflation 27 0 32 25 35
General uncertainty on costs of 11 0 13 30 5regulations
Crimeandtheft 31 0 37 40 35
Corruption 47 0 56 60 53Terrorism 3 0 3 0 5
Other 0 0 0 0 0
Count,y-specific responses
Table 3 ranks the most serious obstacles identified by business people in each
country surveyed. It shows, the relative importance attached to different obstacles (caseswhere 50 percent or more of respondents judged a particular obstacle to be "strong" or
"very strong"). So for example a number 1 means that a particular area was mentionedby the largest proportion of respondents as being a serious obstacle to doing business, a 2the second-most frequent mention and so forth. The ranking of country-specificobstacles to doing business might help governments and aid agencies to prioritize privatesector development strategies, especially in combination with Table 6, which delineatesprimary policy domains on which the lessening of different obstacles depends.
13

Table 6. Policy domains
CentratFiscal XInstitutional InstitutionalGo000Evernment0 0 (1cal fauthorities) (00itral (local autharities)
aut :(iiii:; ialuthoraities)
. Tax . Tax . Crime and theft . Crime and theft.egulations regulationsand/or high and/or hightaxes taxes
. Inflation . Corruption . Corruption
. Policy . Unpredictability . Inadequate supplyinstability of the judiciary of infrastructure
. Financing . Inadequate . Generalsupply of uncertainty on costsinfrastructure of regulations
. Foreign . Financing . Terrorismcurrencyregulations
. Labor . General . Regulations forregulations uncertainty on starting
costs of business/newregulations operations
. General . Terrorism . Safety oruncertainty on environmentalcosts of regulationsregulations
. Inadequate . Regulations forsupply of startinginfrastructure business/new
operations
. Regulations of . Safety orforeign trade environmental(exports, regulationsimports)
. Price controls
Some of the obstacles pertain to several policy domains; the balance ofresponsibilities for lessening obstacles between central government and local authoritiesdepends largely on the degree of decentralization existing in specific countries. The mainpoint of Table 5 is that the removal of obstacles to doing business is a sharedresponsibility which requires government commitment at many different levels. Civilsociety can of course play an important role in helping to bring about policy changes.
14

The dog that didn't bark
It is also of interest to map out institutional and policy areas which are notconsidered to be obstacles to doing business. Table 7 (which is similar in layout to Table3) flags ar-eas which 50 percent or more of respondents in each country judged to be "noobstacle" to doing business (checking 1 or 2 on a scale of 6).
Table 7. Reported problem-free areas--total number and ranking
d~ ~~
Areas in M .....de.at.o
Unpredictability of the judiciary 4 7 2
Regulations for starting business/newoperations
Price controls 3 2 121IRegulations on foreign trade (exports, 4 9
imports)FinancingLabor regulations I .. .. ..Foreign currency regulations 4 .. .. . 5Tax regulations and/or high taxesInadequate supply of infrastructure .. . .. .. .. . 6
Policy instability 4 3. 3 .. .. . 4Safety or environmental regulations 2 1 1 . ..Infation 7 .. .... . 3General uncertainty on costs of
regulationsCrime and theft 7 .8Corruption 7 3Terrorism I .1 2 . 1 1 1 2
Other -.... .
Number of unproblematic areas .14 0 9 1 1 0 2 3 0 0 9 0 1 1 2 2
(continued)
1 5

Table 7 (continued)
Unpredictability of the judiciary .. 12Regulations for starting business/new 4 3
operationsPrice controls 2 1 3 13 21 8 1 42 1Regulations on foreign trade (exports. .. .. .5 6
imports)Financing . . . . . . ... 4Labor regulations 3. .. .. 13 . .. . .. .Foreign currency regulations 1 3 .. ... 5.. . 1 . 7 .. 2Tax regulations and/or high taxes. .... 5hinadequate supply of infrastruture. . . . . .4. .. 10Policy instability I 1. .9 4Safety or environmental regulationshiflation 1 5. . .2General uncertainty on costs of
regulationsCrime and theft 5 .. . 1.I1 7Corruption . .... 7 3Terrorism.21 . 1 I 1 1 2. 2 1 1 3
Other
Number of unprobtematic areas 3 0 4 1 3 1 7 2 2 1 13 0 2 8 2 3
1 6

Unpredictability of the judiciary.Regulations for stating business/new ..
operationsPrice controls 3 .. 3 .. .. 2 3Regulations on foreign trade (exports, .. 3
imports)Financing ... 4 . . . . .Labor regulationsForeip currency regulations 1 2.6 .. 2Tax regulations and/or high taxeshinadequate supply of infrastructurePolicy irnstability..2.2Safety or environmnental regulations.I3Inflation.2General uncertainty on costs of
regulationsCrime and theft 2.4.2Corruption..Terrorism 1. 2 1. 1 2 1. 111
Other
Number of unproblematic areas 2 0 3 1 1 2 2 2 0 4 6 1 2 0 0 3
(continued)
17

Table 7!continued)
Unpredictability of the judiciary 6 6Regulations for starting business/new 10
operationsPrice controls I 1 2 6 7 2Regulations on foreign trade (exports, 10
imports)Financing . . . . . . . . . 12.Labor regulationsForeign currency regulations ... .2. . . 9 .. ... 8Tax regulations and/or high taxesInadequate supply of infrastructure. . . . . . . .6 . .4Policy instabiity. .. .. 2 2 .. ... 2 . ..Safety or environmental regulations .. . .. .... . . .. 5Inflation 2 .. 5Generaluncertainty on costs of. .. .. .1 . ..
regulationsCrime and theft. . . . . . . . 1 . .9 . . .Corruption . .. .. 2 .. ... 3 . ..Terrorism 1. . . I 1 2 .. 1..
Other.. . .. . .. . .. . .. .
Number of unproblematic areas 1 0 1 2 2 2 0 2 10 0 0 0 12 2 0 0
1 8

Unpredictability of the judiciary .. .. .. .. .. .. .. .. .. .. 6 8Regulations for starting business/new .. .. .. .. .. .. .. 3 4
operationsPrice controls 1 5 . .5 1 1 33 45Regulations on foreign trade (exports, . .. 5.... .. 7 9
imports)Financing ...... 3 4Labor regulations ....... 3 4Foreign currency regulations 1 2 .. .I I 19 26Tax regulations and/or high taxes .. .. . . . . . I IInadequate supply of infrastructure .. 7 .. . . .. .. 6 8Policy instability . ...... 13 18Safety or environmental regulations .. .. .. .... .. 4 7 9Inflation 1 .. .. .. .. .. .. 9 12Generaluncertaintyon costs of 2 .... .. 2 3
regulationsCrime and theft .... 2 11 15Corruption 2 ...... 7 9Terrorism 2 I I 1 2 3 2 43 58
Other 0 0
Number of unproblematic areas 1 2 7 1 1 1 0 5 3 2
Table 8 aggregates countries by groups, as in Table 5. It suggests that in 58percent of the surveyed countries (73 percent of developed, 65 percent of developing and35 percent of transition countries) terrorism is not perceived to be a serious problem bybusiness people, nor are price controls, which are not considered to be a serious problemin 45 percent of the countries (73 percent of developed, 44 percent of developing and 30percent of transition countries, respectively).
19

Table 8. Reported problem-free areas (percent of countries)
............. .. .. .- eveloped eAl l Transition i thert000Ares i consideratin tk ll .cFountries40 Coun0. itrie devel0oping eco4;nomie eeloping0i^^}i
iEEi;i .i Ei; cou,ntries countnresUnpredictability of the 8 27 5 0 7
judiciaryRegulations for starting 4 0 5 5 5
business/new operationsPrice controls 45 73 40 30 44Regulations on foreign trade 9 45 3 0 5
(exports, imports)Financing 4 9 3 0 5Labor regulations 4 0 5 10 2Foreign currency regulations 26 55 21 15 23Tax regulations and/or high 1 0 2 0 2
taxesInadequate supply of 8 36 3 0 5
infrastructurePolicy instability 18 55 11 5 14Safety or environmental 9 0 11 20 7
regulationsInflation 12 64 3 5 2General uncertainty on costs of 3 18 0 0 0
regulationsCrime and theft 15 45 10 0 14Corruption 9 45 3 0 5Terrorism 58 73 56 35 65
Other 0 0 0 0 0
Looked at together with problem areas in Table 3 it seems that neither pricecontrols, foreign trade controls or foreign exchange regulations were considered in1996-97 to be serious obstacles to doing business except in a handful countries (Belarus,Bulgaria, Republic of Congo, Fiji, Kazakhstan, Ukraine, Uzbekistan, West Bank andGaza, and South Africa). Regulations for starting a new business were found to be anobstacle in only one of the surveyed countries, surprisingly a developed one (Austria).These results are indicative of the depth and breadth of liberalization which has takenplace over the last decades.
Obstacles and levels ofprivate investment-econometric results
Econometric calculations presented in Table 97 show that, unsurprisingly, in manycases a definite link exists between 1996 private investment and problems (or lack of
7 The specifications we tested have the following form:Private Inv./GDP96 = aO + al LN(GDP/Const. 87 PPP,90) + a2 LN(Sec school enrol., 1990)+ a3 OBST +
u. Private Inv./GDP96 is a ratio of private investment to GDP in 1996. LN(GDP/Const. 87 PPP,90) isthe logarithm of 1990 GDP per capita calculated at PPP in 1987 prices from a World Barik data base.LN(Sec school enrol., 1990) is the logarithm of growth secondary school enrollment in 1990 also takenfrom a World Bank data base. OBST is an additional variable drawn from the set of 16 obstacles (weran separate tests for "problem" and "problem-free" values of the variable).
20

them) in policy areas relevant to doing business. In some cases the share of businessexecutives reporting that a particular policy area is problematic is significant, in somecases the share of problem-free responses and in other areas both responses are relatedsignificantly to investment. These results are to be treated as preliminary, if only becauseof the small number of countries (23) common to both data sets. Nevertheless, out of 16policy areas 7 are significant for private investment levels when there is a perceivedserious problem in these areas. At the same time, 9 out of the 16 policy areas aresignificant to levels of private investment when they are problem-free. And 4 areas outof 16 (financing, labor regulations, foreign currency regulations, and crime and theft) aresignificant in both cases.
Table 9. Summary regression output (dependent variable-private investment/GDP, 1996, numberof observations - 23)
Variables:- . ..... . . - . .... --. . .... .. ,, , 1 : :
Intercept 3.841 14.488: 0.265 0.7941 -15.346 17.4 . -0.878 0.391
LN(GDP/Const. 87 PPP,90) 1.312 2.5931 0.506 0.619 2.102 3.161 0.665 0.514
LN(Sec school enrol., 1990) 2.291 2.870 0.798 0.435 2.108 3.524 0.598 0.557
Unpredictability of the -0.169 0.049 -3.425 0.003 0.175 0.138 1.273 0.219Audiciary ___
Adjusted R Squarem__ 0.410 0.121
Intercept -9.852 17.537 -0.562 0.581 -25.294 21.662 -1.168 0.257
LN(GDP/Const. 87 PPP,90) 2.026 3.266 0.620 0.542 3.483 3.462 1.006 0.327
LN(Sec school enrol., 1990) 2.750 3.625 0.759 0.4571 1.838 3.591 0.512 0.615
Regulations for starting -0.091 0.157 -0.581 0.568 0.118 0.103 1.147 0.265business/new operations_________
Adjusted R Square 0.063 0.108-
Intercept -8.974 16.706 -0.537 0.597 -19.122 15.915 -1.202 0.2441
LN(GDP/Const. 87 PPP,90) 2.710 3.147 0.861 0.400 1.665 2.878 0.579 0.570
LN(Sec school enrol., 1990) 1.605 3.504 0.458 0.652 3.819 3.229 1.183 0.252
Pric controls -0.277 0.181 -1.529 0.143 0.274 0.113 2.419 0.026
Adjusted R Squarem__ 0.151 0.271
Intercept -5.776 18.1621 -0.318 0.754 -12.543 14.724 -0.852 0.405LN(GDP/Const. 87 PPP,90) 1 .172 3.234 0.610 0.549 0.987 2.752 0.359 0.724
LN(Sec school enrol., 1990) 2.295 3.606 0.636 0.532 3.580 3.050 1.174 0.255
Regulationson foreigntrade -0.154 0.189 -0.814 0.426 0.338 0.116 2.918 0.009(exports, imports)_
(continued)
2 1

Table 9 (continued)
Var iables o _
Adjusted R Square ___0.079 0.342
Intercept 9.462 15.217 0.622 0.541 -23.107 13.767 -1.678 0.110
LN(GDP/Const. 87 PPP,90) 0.229 2.661 0.086 0.932 2.446 2.483 0.985 0.337
LN(Sec school enrol., 1990) 3.687 2.9161 1.265 0.2211 2.908 2.7511 1.057 0.3041
Financing -0.250 0.075 -3.335 0.003 . 0.430 0.113 3.801 0.001
Adjusted R Square 0.399 ___0.458
Intercept -22.060 16.532 -1.334 0.198 -12.652 16.404 -0.771 0.450
LN(GDP/Const. 87 PPP,90) 4.099 3.0681 1.336 0.197 1.386 3.053 0.454 0.655
LN(Sec school enrol., 1990) 3.056 3.238 0.944 0.3571 2.938 3.375 0.870 0.395
Labor regulations -0.223 0.098 -2.282 0.034 ** 0.177 0.098 1.806 0.087*
Adjusted R Square 0.252 0.186
Intercept -4.065 16.680 -0.244 0.810 -0.554 15.148 -0.037 0.971
LN(GDP/Const. 87 PPP,90) 1.909 3.040 0.628 0.537 -0.7891 2.906 -0.271 0.789
LN(Sec school enrol., 1990) 2.118 3.382 0.626 0.539 4.7671 3.141 1.518 0.146,
Foreign currency -0.185 0.102 -1.802 0.087 * 0.389~ 0.136 2.865 0.010*regulations
Adjusted R Square 0.186 _ 0.334
hitercept 12.237 16.957 0.722 0.479 -5.639 16.924 -0.333 0.743
LN(GDPfConst. 87 PPP,90) -0.677 2.930 -0.231 0.820 0.893 3.172 0.282 0.781
LN(Sec school enrol., 1990) 4.901 3.189 1.537 0.141 2.770 3.442 0.805 0.431
Tax regulations and/or high -0.195 0.070 -2.771 0.012 ** 0.234 0.152 1.539 0.140taxes
Adjusted R Square 0.321 ___0.1521
Intercept 5.447 24.151 0.226 0.824 -15.085 17.846 -0.845 0.408LN(G-DP/Const. 87 PPP,90) 0.183 3.729 0.049 0.961 2.227 3.211 0.694 0.496
LN(Sec school enrol., 1990) 3.078 3.607 0.853 0.4041 2.859 3.554, 0.804 0.431
Inadequate supply of -0.081 0.8 0900.369 0.076 0.072 1.054 0.305infrastructure
22

-- ~~~~~g N --aiA d0 a1t Va4riables
Adjusted R Square _ ____ __ 0.087 0.099
Intercept -10.993 16.568 -0.663 0.515 -2.567 17.874 -0.144 0.887LN(GDP/Const. 87 PPP,90) 2.294 3.088 0.743 0.467 1.301 3.185 0.409 0.687LN(Sec school enrol., 1990) 3.183 3.433 0.927 0.365 3.259 3.529 0.923 0.3671Policy instability -0.128 0.078 -1.638 0.118 -0.250 0.191 -1.311 0.206
Adjusted R Square 0.164 0.126
Intercept -28.823 19.750 -1.459 0.161_ -11.125 16.947 -0.656 0.519LN(GDP/Const. 87 PPP,90) 1.197 3.088 0.388 0.703 2.037 3.149 0.647 0.526LN(Sec school enrol., 1990) 6.538 4.093 1.597 0.127 2.096 3.512 0.597 0.558Safety or environmental 0.389 0.226 1.719 0.102 0.123 0.093 1.322 0.202
regulations _ _
Adjusted R Square 0.175 0.127
Intercept -7.608 17.031 -0.447 0.660 -14.764 14.311 -1.032 0.315LN(GDP/Const. 87 PPP,90) 3.118 3.278 0.951 0.353 1.719 2.648 0.649 0.524LN(Sec school enrol., 1990) 0.322 3.897 0.083 0.935 2.260 2.938 0.769 0.451Inflation -0.109 0.082 -1.319 0.203 0.499 0.155 3.215 0.005
Adjusted R Square 0.126 0.382
Intercept -9.577 16.992 -0.564 0.580 -12.319 15.190 -0.811 0.427LN(GDP/Const. 87PPP,90) 2.288 3.173 0.721 0.480 2.403 2.826 0.850 0.406LN(Sec school enrol., 1990) 2.588 3.504 0.739 0.469 1.043 3.184 0.328 0.7471General uncertainty on costs -0.154 0.122 -1.265 0.221 0.211 0.081 2.617 0.017 *
of regulations
Adjusted R Square 0.121 0.299
Intercept -1.461 16.043 -0.091 0.928 -6.562 16.445 -0.399 0.694LN(GDP/Const. 87 PPP,90) 2.291 2.908 0.788 0.441- 1.157 3.066 0.377 0.710LN(Sec school enrol., 1990) 0.697 3.323 0.210 0.836 = 2.340 3.372 0.694 0.496Crime and theft -0.128 0.055 -2.323 0.031 ** 0.320 0.177 1.813 0.086 *
(continued)
23

Table 9(cVntinued
XM MlE:.i. j :2E E
.1;.~~~~~~~~~~~~~~~~~;
i . Ei.ij20ijjjj j jgtjjjEi.gi0i .............. -E ..lg iif. 1i2 :ff;4 .id............ ji00i. .ii; i#SS t :0 0ti: : , I 0: : f d: :tf j:0 .....................:::..j ....Ei
Adjusted R Square 0.257 0.187
Intercept 9.878 17.925 0.551 0.588 -15.458 17.453 -0.886 0.387LN(GDP/Const. 87 PPP,90) 0.795 2.954 0.269 0.791 1.457 3.172 0.459 0.651LN(Sec school enrol., I1990) 2.202 3.236 0.6811 0.504 3.777 3.610 1.046 0.309
Corruption -0.190 0.083 -2.286 0.034 ** 0.089 0.069 1.301 0.209
Adjusted R Square 0.252 0.124
Intercept -9.088 17.106 -0.531 0.601 -6.765 16.493 -0.410 0.686LN(GDP/Const. 87 PPP,90) 1.727 3.182 0.543 0.594 1.623 3.052 0.532 0.601LN(Sec school enrol., 1990) 3.295 3.574 0.922 0.368 2.047 3.395 0.603 0.554Terrorism -0.139 0.119 -1.167 0.258 0.330 0.186 1.770 0.093 =
Adjusted R Square I0.11 0.181
* Significant on the 10 percent confidence level.** Significant on the 5 percent confidence level.
IntecepSignificant on the 1 percenit confidence level.
Source for private n vestment data: Jack Glen and Ma5usz A. Sunlinsl, "Trends in Prvate Investment in DevelopingCountriestatistics for 1970-96," IFC Discussion Papr 34, Wash=2igton, D.C., 1998.
The highest statistical significance for depressing private investment (on the 1
percent confidence level) is for unpredictability of the judiciary and lack of financing.Where financing is not a serious problem this is very positively associated to levels ofprivate investment (significance on the 1 percent confidence level). In contrast, lack ofserious problems with the judiciary are not related significantly to high levels of privateinvestment. The same asymmetrical relationship seems to characterize tax regulationsand corruption-where these are serious problems they depress private investment, butlow taxes and lack of corruption do not by themselves stimulate private investment.
24

Appendix IMethods and Sources
1. Fixed Investment Data
National accounts normally do not break down gross domestic investment into itsprivate and public sector components. Private investment is defined in this publication asthe difference between total gross domestic investment (from national accounts) andconsolidated public investment. Consolidated public investment data for each countrywere compiled mainly from World Bank Country Economic Memoranda, PublicInvestment Reviews, Public Expenditure Reviews, and other World Bank countryreports. They reflect efforts by World Bank missions to compile public sector data.Where World Bank data are not available, country data were used.
The countries included in this edition represent all the developing countries forwhich the relevant data are available. Minor changes were made in the last two or threeyears for most countries as a result of revisions in their national accounts data. Updatesare not available (at the time of this writing) through 1997 for Korea.
Table 1 presents investment figures for each country, including total fixedinvestment (GDFIIGDP); private fixed investment (PRIVATE I/GDP); and public fixedinvestment (Public I/GDP). The ratios are computed using local currency units at currentprices.
25


Appendix 2Statistics
27


Sub-Saharan Africa
Benin
C6te d'Ivoire
Guinea-Bissau
Kenya
Madagascar
Malawi
Mauritania
Mauritius
Namibia
South Africa
29

Benin Kenya
35 35tPia. ... Publc[ I tj7 bi
15. ........... 15.............
10 *.10 . -..
0 0
C6te dIlvoire Madagascar
35 ...... .......... .................................... ... 5
30 P...... ... .... I. ...... ......P....b....i....... ........ e Pu li33~~~~~~~ ~~~~~~~~~~~~~~~~~~~~~~~0............................. ........ ....
25 ...... . ....... .. .. . ........ .. .... .. ....... ........
5 ........ .........
0 0
]9ff 1967 1 9 l 1 1971 1992 1973 1ON 1975 w 199717 7 19M 1971 1993 1975 1977
Guinea-Bissau Malawi
--------- Privt e ... ubh1i-cit Mt~ ~ 17i33 . .... .~~~~~~~~~~~~~~~~~~~~~~.. ~~~~~ 30 .....................
25.
............ 10 .........
30

966 f661 Z661 (t 05t I¶ 966 Z66 X1
-0
.- ~ - -w .*. * 01;b-- - -
......... ..................................................................... ...........................O
.............. tA Ji
,..._..........._... _..._..._..._.._.1,_,.... 01
:.. .............................. ............. . ......
Sl ~~~~~~~............................................. .......................... :.'.: ' 5
, w~~~~~~~~~~~~~~~~~~~~~~~~~~~~~~~~~~~~~~~~~~~~~In . s. . jv Ap ,
1661 1661 1661 R661 6661 Z661 6161 9161 £161 0161 1661~~~~~~~fi Wb 96 1 6661 66 £66 Z661 T66 9661
06.~~~~~~~~~~~~~~~~~~~06
,~~~'J , , OS , S!UU
, ............ .... + . .* . OE ... ~~~~~~~~~~~~~~~~~~... ,^........................................... ........... ...... --................ .. .........
.. _w_o ... _ _ _ _ _ _ _.,_ .. _ _ _ _ _ _._ .. _ SE .... :_ _._._._ ......... _.,_ .. _, _ _ _.,._............._._ ...... ... _.SE
ea!ltlllos e!ue!sneyV~~~~~~~~~~~~.......................................................s


Latin America and the Caribbean
Argentina
Belize
Bolivia
Brazil
Chile
Colombia
Costa Rica
Dominican Republic
Ecuador
El Salvador
Guatemala
Mexico
Nicaragua
Panama
Paraguay
Peru
Uruguay
Venezuela
33

L661 r661 Lff61
£651 6661 1661 891 SW1 ME 666! 9L6 £6h 61 066
0
C..~~~~~~~~~~~~~~~............
.~~~~~~~~~~~~~~~01
........ .............. ~.................... o
¾ ~ ~ ~ ~ ~ ~~~~........................................ --- -... .. .. .. .. ... .. .. .. .. ... .- .. .. .. ... .. .. .. .. ... .. .. .. .. .... .. .. ¾
~ ~~~~~IzU Jg w ui;u~~~~~~~~~~........... ........ ..............................v

.91
169 P60 M M M M &O Wg M M~~1~q15.-. 9
L661 M M M M ZZI 6661 9LO EL61 OL6~~~~~~~~~~~~1:
0.............................
.91.191~~~~...................... ..........
................................ 0 .. ...
.... . . ....... .... .. .... .......
1611 1611 1611 ~~~1 ~~1 Z~ 9161 9161 £161 £661 £611 t611 ~~~~~ ~1 16..1....91.6.............0.61
. 91.~~~~~~~~~~~~~~~~~~~~~~~~~~~~~...... ..... ............... 91
............... .......................................... CZ
...........................................................

9£
L661561 S0i t66 Ka i M 61 166 055 dl MK ¢lV SNS SW Pil L651 M6 166 MI5 SSi D15 6l6 916 E;!61 f6l
',. ~~~~~~~~~~~~~~~~~~~~~~~~~~~~~............... ...,S' ,;\;-;; --"
. ............ .e 46 + + .6.iE......... .... .... .... . ........ 6. . .......... . ... ....... . ,. . ........
, I allQnd,., 9le^IJd__ I t I allqtld ~~~~~~~~~~~~~~~~.......................................................................... ~M S E.. _ *.E6.>..................... ......w. ........................... SE
...... ........................................................... ........................... 51 .......................... ......... ..... ............
................... ............................................. ... ...... s ..................... ......... ......... .. sz. .............. ..........................
.............. , ^ ...................................... OE ....... , . .6. .,,,,, + .. e+ ..................... I.............. OE
Tlid. .. | d v!lqnd ... aluA!ld_ S.,, , , ,. S~~~~~~~~~~~~~~~~~E . . .d. *, .....
L62 t61 1661l 1W 6F ZR5I S^1 9 E851W lRil aR61 S< 651 m il1i 2661 %166 OSS1
: .......... _ O , .... ~~~~~ ~ ~ ~~~~~~~~~~~~....................... . ......... : .::... ..... . : . :.: ...................... .. .. vS..... ............... ......... . . . ........ 5
,~~~~~~~~~~~~~~~~~~~~~~~0 ... ........... '..'..''............................ 0_w 1
.* 66* .- * , 6++ * , , S~~~~~~~~~~~Z ....... ... ...... -. ....... .................. ....... ............ . ... 5Z
......... ................... ..................,.,...........OE....... ... ............... .. ..... .... .. . OE
I O lnlq ,, e 'I 3tlmi d ,, sal
L6~~~~~~~~~~51 91, _,6,_ _S661 K _ M _ ba- 9661 -w-s6--es-51 E 1 Z 61 05
nsaa enSese3!N~~~~~~0

Middle East and North Africa
Egypt
Iran
Morocco
Tunisia
Turkey
37

Egypt Tunisia
.................................... ~.-...-..-.....-........-.20.. .......... 2 3.......... .. ..... ..........................
25 .................. ............. 5 .......
0 ~~~~~~~~~~~~~~~~~~~~~~~~0
Iran Turkey
35 ----- . . . .. 35 . ------ --- . .... ......
5..0.- . . ....... S...... ................
C C-
Mo ro cco
Pri--P ubi,305............................... ......................
25 ...................................... ..........
15 . ... .....I. .............. ..... ; .......
10 .......... .... ...
S....................................... .........
0
1975 197g 91 I(M IM IM M 7 IM 1MI 1M IM 15
38

Transition Countries
Bulgaria
Poland
Romania
39

0t7
Ob~~~~~~~V
L651 9661 Sit 161 6661
0
_ .. ~~~~~~~......... ''..::.L:.:.'.'.'.:................ . ,...... .................................
, St
..... .......... ...............................I ............................... OE
|~~~~~~~~~ - --------- *IAd
00
....... ........ I..... . .................... ._. ..... _.___........... ~._.... _(
........ %
....................... ..................... ............................................... / S
~~~~~~~~~~~~~~~........................................................................ ,.... ,S
..................................................... . ............... ............... , ,
...................................... ................................................. . O...........,5
|1 auijndg «78da|S

East Asia
China
Indonesia
Korea
Malaysia
Papua New Guinea
Philippines
Thailand
41

ztl~~~~~~~~~~~~~~~~~~~*U
L661 9%1i E661 16t;1 6fti LSS Sib EF 1F 6l6 U616 SUil i651 Z661 taI Z9il U61 ZC6
0 0
..... .
................ w... .. ,I ;i..01.. ..... ............... ;: ' .:.::.:.......... ol ............. 0 1
~i~qt o ............. 9L1 ...... .... .;. .S1
................................ o...................................... ........ a 9 O
..................................................................... ................ ...... g............... 5E.. ... .. ... ...... yS
......................................................... .................... -------- s. +OE ......... ..... O
........................................ I l= d - ] <Id- SE. E
sauddUl!qd c nouXd DS 3qWdaH
_l 5 _661 E661 51_ _ _6_1 _ l S1 ER51 lRIl L661 v661 1661 i ESS1 1951
~t~qfO . O
................... - ....... S .............. ... .. ..~~~~~~~~~~~~~~~~~~~~~~~~~~~~~~~~~~~~~~~~................ ... ,,'0 . ............. .... :.:. ... '..__0
;. ..... . .... ............ , .............................
/ ~ ~ ~ ~~~~~~~~~~~~~~~~~~~~~~o ............ ....... ........ OE..,............
DI[qlid,, SIBAISd, 
b~~~~~~~~~~~~~~~~~~
. .
.. ................ e;&..... ............... ..............._.......
.. ~~~~~~~~~~~~~~~~ J
. . ....... ...... . . .... ........... ....... ........................................... 0
........ ... ....................................,


South Asia
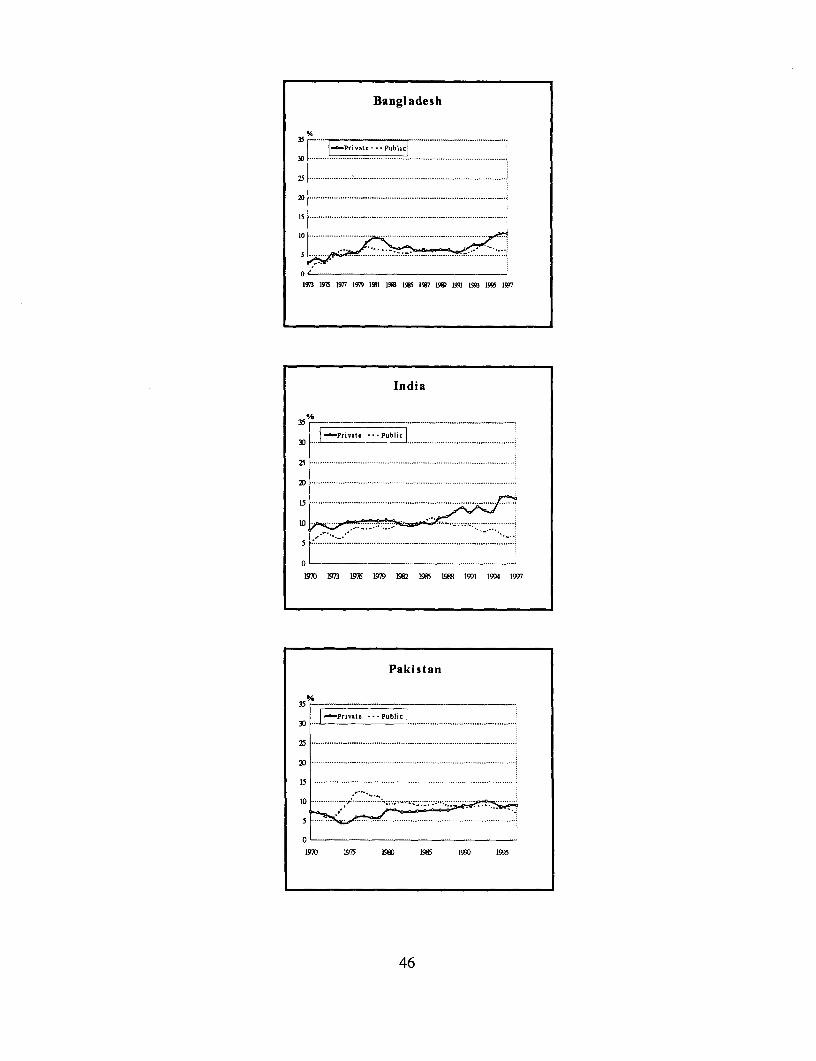
Bangladesh
India
Pakistan
45
Bangladesh
35 - ____l_.
30 . ...... ., ...
25 . ............... ..
is ....... ................................. ..................10.
05
1973 1975 1977 1919 1511 19 1E5 1907 19 1991 13 1995 1907
India
35
Z rvate* -Pubic :{0 1........ ........................................25 ......................... ........ .....................................................
A) .................................................................. I............
10 .........
* b......................................... ............................................
0
I91 IM L76 L9XIg9 Ig ISS IRE Ml9 1994 MW7
Pakistan
35
| v Pil^e -Public.I30 M - ... P bi ................................................
25 .... .......... ... ......... .... ................. ........... ....................
U5 .......................... ............. ............... .......... ......... ...........
10 --------- .. .....5 ......................................... ........
19 I1510 19B5 SEX 19; 5
46

Table I. Investmerit as a share of GDP (in %)Country/Year 1970 1971 1972 1973 1974 1975 1976 1977 1978 1979 1980 1981 1982 1983 1984 1985 1986 1987 1988 1989 1990 1991 1992 1993 1994 1995 1996 1997
Argentina GDIJGDP 21.2 20-.9 20.7- 18.2 19.3 25.9 26.8 27.2 24. 22.7 25.3 22.7 21.8 20.9 20.0 17.6 17.5 19.6 18.6 15.5 14.0 14.6 16.7 182 19.9 18.3 18.5 20.1
Private I/GDP 13.1 12.8 12.5 11.6 12.5 16.1 15.1 15.0 13.4 14.1 19.2 16.9 16.6 14.8 14.9 12.5 13.2 15.7 14.4 12.2 9.4 12.7 14.9 166 18.1 16.6 16.8 18.4
____________________Public IIGDP 8.1 8.1 8.2 6.6 6.8 9.8 11.7 12.2 11.0 8.6 6.1 5.8 5.2 6.1 5.0 5.1 4.3 3.9 4.3 3.3 4.6 1.9 1.8 1.7 1.8 1.7 1.7 1.7
Bargladesh GDl/GDP 3.0 7.1 6.3 9.9 11.1 11.8 11.3 15.3 16.2 15.5 13.4 12.4 12.9 12.5 12.9 12.4 12.9 12.8 11.5 12.1 14.3 15.4 16.6 17.0 17.3
Privatve 1GDP 2.9 4.2 3.4 5.4 4.9 5.6 5.7 8.2 9.6 9.1 7.2 6.7 7.4 6.3 6.2 6.4 6.5 6.4 5.8 6.6 7.8 7.8 9.4 10.7 10.8
Public I/GDP 0.1 2.9 2.9 4.6 6.2 6.2 5.6 7.1 6.7 6.4 6.2 5.7 5.6 6.3 6.7 6.0 6.4 6.4 5.7 5.5 6.4 7.6 7.2 6.3 6.5
Belize GDFI/GDP 26.2 23.5 27.1 25.3 28.7 28.0 28.5 26.6 22.7 24.8 22.5 18.9 20.3 17.4 17.4 21.5 25.7 27.4 25.6 28.5 29.3 29.8 24.1 20.6 18.8 23.3
Private /GDP 17.8 15.2 14.8 16.6 18.5 16.1 11.7 9.8 11.1 13.5 9.8 8.5 11.8 8.7 8.4 13.8 17.1 17.4 11.4 8.1 10.0 16.3 13.0 12.7 12.2 12.8
Public I/GDP 8.4 8.3 12.3 8.7 10.2 11.9 16.8 16.8 11.5 11.3 12.7 10.4 8.6 8.7 9.0 7.7 8.6 10.0 14.2 20.4 19.3 13.5 11.1 7.9 6.6 10.5
Bernin CiD1IGDP 13.4 13.5 13.3 1ISfI 35.5 17.3 16.6 1S. 5
Private I/GDP 6.0 6.1 6.7 7.9 6.2 6.9 9.1 11.0
Public 1/GDP 1.4 7.4 6.6 7.1 9.3 10.4 7.5 7.5
BolMia c3DFIGDP 12.1 12.7 12.0 12.6 14.5 16.3 16.3 14.8 15.5 15.8 17.2
Private I/GDP 5.9 4.0 3.6 5.0 5.8 6.6 7.4 6.4 7.6 8.4 10.3
Public I/GDP 6.2 8.1 8.4 7.6 8.7 9.7 8.9 8.4 8.0 7.5 6.9
Brazil GDFI/GDP 18.8 19.7 20.2 21.4 22.8 24.4 22.5 21.3 21.8 22.8 23.6 24.3 23.0 19.9 18.9 18.0 20.0 23.2 24.3 26.9 22.9 19.6 19.6 20.4 20.7 20.5 19.1 19.6
PrivaleI/GDP 12.8 14.2 14.4 16.2 15.8 16.9 14.2 14.7 14.1 12.5 17.0 16.6 16.0 13.8 13.7 12.9 14.4 16.8 17.9 21.1 17.6 14.4 13.9 155 15.8 16.8 15.3 15.8
Public I/GDP 6.0 5.5 5.8 5.2 7.0 7.5 8.3 6.6 7.7 10.3 6.6 7.7 7.0 6.1 5.2 5.1 5.6 6.4 6.4 5.8 5.3 5.2 5.7 4.9 4.9 3.7 3.9 3.8
Bulgaria GDFI/GOP 24.4 18.2 16.2 13.0 13.8 15.3 13.6 11.3
Private 1/CIDP 0.9 0.5 0.3 2.9 5.4 6.8 5.3 4.8
Public I/GDP 23.5 17.7 15.9 10.0 8.4 8.5 8.4 6.5
Chile GDFI/CiODP 16.4 14.5 12.2 7.9 21.2 13.9 12.8 14.5 17.8 17.8 16.6 18.6 14.2 12.0 12.4 16.8 17.1 19.4 20.3 23.0 23.1 19.9 22.4 24.9 23.3 23.9 24.8 25.2
Private I/GDP 9.5 6.5 4.5 0.5 9.2 3.2 4.8 7.6 11.4 12.6 11.2 13.4 9.5 7.4 6.4 14.1 13.6 13.1 14.4 18.2 18.4 15.0 16.7 18.9 18.0 19.9 19.6 20.4
Public 1/GDP 6.9 8.0 7.7- 7.4 12.0 10.7 8.0 6.9 6.4 5.2 5.4 5.2 4.7 4.7 6.0 2.8 3.5 6.4 5.9 4.8 4.8 4.9 5.8 6.0 5.3 3.9 5.2 4.8
China GDFIIGDP 20.2 19.8 23.2 24.1 25.6 28.4 30.6 31.7 31.8 26.1 24.4 25.9) 30.3 37.7 36.4 34.2 33.8 33.4
Private IKIDP 3.7 6.0 7.3 8.1 9.0 9.6 10.2 11.2 11.6 9.5 8.3 8.7 9.7 14.9 15.9 15.6 16.1 15.8
Public I/GDP 16.5 13.7 16.0 16.0 16.5 18.7 20.4 20.5 20.2 16.6 16.1 17.2 20.6 22.9 20.6 18.6 17.7 17.5
Colombia GDFI/GDP 18.0 17.5 16.1 15.8 16.4 15.3 15.9 14.3 15.4 15.4 16.8 17.7 17.5 17.2 17.0 17.5 17.7 17.4 19.5 18.1 16.6 14.6 15.6 18.8 20.5 19.7 17.2 16.9
Private I/GDP 12.4 11.6 9.8 10.1 11,5 9.9 10.3 7.9 9.9 10.0 9.8 10.3 9.4 9.7 8.5 8.4 9.2 10.2 11.5 10.2 10.2 8.3 8.6 10.8 13.3 12.0 8.2 10.0
Public JYGDP 5.6 6.0 6.3 5.7 4.9 5.4 5.6 6.6 5.5 5.4 7.0 7.3 8.1 7.5 8.5 9.2 8.5 7.3 8.0 7.8 6.4 6.3 7.0 8.0 7.1 7.7 8.9 6.9
Costa Rica GDFI/GDP 19.4 22.1 21.9 20.5 21.3 20.7 23.5 22.4 23.0 26.2 23.9 24.1 20.3 18.0 20.0 19.3 18.7 19.8 18.9 20.5 22.4 19.7 20.8 23.2 19.8 19.3 18.4 19.5
Private IIGDP 15.0 16.4 15.1 14.7 15.8 14.4 15.1 14.2 15.6 17.3 14.7 15.2 13.1 11.6 13.7 12.3 12.8 15.4 14.8 16.0 17.7 15.5 16.6 18.3 15.0 14.8 14.0 15.0
__________________ Public IIGDP 4.4 5.7 6.8 5.8 5.5 6.3 8.4 8.2 7.4 8.9 9.2 8.9 7.2 6.4 6.4 7.0 5.8 4.4 4.1 4.5 4.7 4.2 4.1 4.9 4.9 4.4 4.4 4.5
M6e d¶lvoiee GDFI/GDP 14.8 14.1 13.8 12.2 8.5 8.6 8.5 7.8 11.1 12.9 13.9 16.0
Private I/GDP 7.9 6.7 6.8 5.9 4.9 5.1 4.7 4.1 7.0 8.7 9.6 11.2
__________________Public I/GDP 6.9 7.4 7.0 6.3 3.6 3.4 3.8 3.7 4.1 4.2 4.3 4.8
Domirica Republic GDFI/GDP 19.1 17.9 19.8 22.2 23.3 24.5 22.3 21.7 21.0 23.9 23.9 22.8 18.7 20.3 21.0 18.3 20.6 26.0 27.1 28.2 24.9 21.6 22.2 26.4 25.9 23.9 24.2 24.7
Private I/GDP 14.0 12.4 12.2 15.1 15.9 16.5 16.0 15.6 14.8 18.8 16.3 16.1 14.3 15.6 17.6 12.9 16.0 16.2 16.8 18.1 18.2 15.3 15.1 17.9 17.3 16.8 17.1 20.5
____________________PubIicI/GDP 5.1 5.5 7.6 7.1 7.4 8.0 6.3 6.1 6.2 5.1 7.6 6.7 4.4 4.7 3.4 5.4 4.6 9.7 10.3 10.2 6.7 6.3 7.1 8.5 8.6 7.1 7.1 4.2
Ecuador GDFI/GDP 16.7 21.8 18.0 17.6 18.2 23.2 22.2 23.6 26.2 23.7 23.6 22.3 22.7 16.6 15.4 16.1 -18.8 22.7 21.3 20.7 18.4 19.7 19.5 19.9 18.8 18.6 17.8 19.0
Private I/GDP 10.0 14.7 11.4 10.8 10.2 14.5 13.0 13.4 16.8 14.5 14.1 11.7 13.0 8.6 9.0 9.5 9.6 13.4 12.7 11.6 12.4 12.6 12.4 13.2 12.8 13.1 11.7 13.3
Public IIGDP 6.7 7.1 6.6 6.8 8.0 8.7 9.2 10.2 9.4 9.2 9.5 10.6 9.7 8.0 6.4 6.6 9.2 9.3 8.6 9.2 6.1 7.0 7.1 6.7 6.0 5.5 6.1 5.7
Egypt GDFI/GDP 30.1 34.2 32.1 32.1 34.4 27.4 34.5 30.6 26.9 22.2 19.1 16.2 16.6 16.2 16.0 17.6
Private I/GDP 9.1 13.9 13.1 12.7 13.2 10.1 13.3 16.0 16.7 13.1 10.5 9.2 10.5 10.7 10.5 12.1
__________________Public I/GDP 21.0 20.3 19.0 19.4 21.3 17.3 21.2 14.6 10.2 9.2 8.5 7.1 6.1 5.5 5.5 5.6
El Sahlvaor GDIGP 10.7 11.2 14.1 12.4 14.2 23.0 20.1 21.2 21.4 17.6 13.6 13.6 12.6 11.6 11.5 12.0 13.1 13.6 12.6 13.3 13.7 15.2 17.2 17.8 18.5 18.7 15.8 15.7
PGrDivFate G/DGPDP 8.4 8.3 10.1 8.8 9.5 15.0 13.9 13.9 15.6 11.5 6.4 6.2 6.5 7.0 7.6 8.7 10.6 10.7 9.5 9.8 11.2 12.3 13.2 13.7 14.7 15.1 11.6 12.1
Public IIGDP 2.3 2.9 4.0 3.6 4.7 8.0 6.2 7.3 5.8 6.1 7.1 7.3 6.1 4.6 3.9 3.3 2.5 2.9 3.1 3.5 2.5 2.8 4.0 4.0 3.7 3.6 4.1- 3.6
Guatemala GDIIGDP 12.6 13.3 13.0 13.9 14.8 15.6 20.6 18.9 20.0 18.7 16.4 16.8 15.0 10.5 9.6 11.0 10. 1 12.4 13.4 13.7 13.0 12.2 15.6 16.1 14.2 14.5 13.3 13.9
Private IGDP 10.2 10.4 9.8 10.5 11.9 12.1 14.0 13.0 14.4 12.4 t0.5 8.9 8.9 6.6 6.7 8.8 8.1 9.7 10.5 10.6 10.3 9.8 13.2 13.3 11.8 12.2 10.9 11.1
___________________Public L'GDP 2.4 2.9 3.2- 3.4 2.9 3.5 6.6 5.9 -5.6 6.3 5.9- 7.8 6.1 3.9 2.9 2.1 1.9 2.7 2.9 3.2 2.7 2.4 2.4 2.7 2.4 2.3 2.4 2.8
Guinea-B3inaa GDFI/GDP 35.2 44.7 39.0 29.9 31.0 48.3 30.9 21.8 22.3 18.9 24.8
Private ItGDP 7.3 14.1 8.7 8.4 7.8 20.0 6.3 1.4 7.1 4.2 9.2
__________________ Public 1/GDP 27.9 30.6 30.3 21.5 23.2 28.3 24.6 20.4 15.2 14.8 15.6(continued.. .i)

Table 1. (contiued)
Cpimtry/Year- - 1970 1971 1972 1973 1974 1975 1976 1977 1979 1979 1980 1991 1982 1993 1984 1985 1986 1997 1988 1989 1990 1991 1992 1993 1994 1995 1996 1997
India GDFVGDP 13.1 16.4 16.9 15.3 15.7 17.9 19.1 19.2 19.3 19.8 193 19.7 20.1 19.3 19.7 20.7 21.2 21.7 21.6 22.5 23.2 22.1 22.5 20.9 21.4 23.8 23.2 22.9
Private I/GDP 8.1 9.9 9.3 8.5 9.6 10.3 10.3 10.6 10.7 10.5 10.7 10.6 9.6 9.4 9.6 10.2 9.9 11.3 11.6 12.9 13.8 12.6 14.0 13.1 12.9 16.3 16.6 16.1
Pubhc FGDP 5.0 6.5 7.6 6.8 6A 7.6 9.8 8.6 8.6 9.3 9.6 9.1 10.4 9.9 10.1 10.5 11.4 10.4 10.1 9.6 9.4 9.5 8.5 7.8 9.6 7.5 6.6 6.8
Indonesia GDFVGDP 24.2 30.5 25.1 22.5 23.6 24.2 24.9 26.1 3 28.4 28.1 27.3 25.9 27.8 28.4 29.6 28.4
Privato IIGDP 13.7 18.2 13.2 12.5 13.5 16.2 17.3 17.7 18.7 19.2 19.5 17.7 16.1 18.1 22.5 23.9 22.1
Pubfiv I/GDP 10.5 12.3 IL9 9�9 10.1 8.0 7.5 8.4 8.6 9.3 9.6 9.5 9.8 9.7 5.9 5.7 6.3
GDFVGDP 21.7 19.1 17.5 21.5 20.9 17.5 15.4 13.3 13.3 13.3 15.5 21.6 22.0 22.1 23.3 23.7 25.8 24.9
Private I/GDP 11.4 9.3 7.4 12.0 12.4 10.6 9.6 7.8 7.9 8.2 8.3 13.2 13.0 11.4 I2.9 13.3 14.3 13.8
Pubfic IIGDP 10.4 9.8 10.0 9.4 8.5 6.9 6.7 5.5 -5.4 5.1 7A 8.5 9.0 10�7 10.4 10.4 11.5 11.1
Ktnya GDFVGDP 19.7 22.7 22.1 20.8 19.2 20.2 20.0 21.0 25.1 23.7 23-6 23.9 19.0 18.0 19-1 17.9 19.6 19-6 20.1 19.3 20.6 19.0 16�6 16.9 I&9 21A 19�8 1&2
Pri%,21c I/GDP 13.7 14.0 13.6 11.4 10.5 11.7 11.6 12,1 15.6 12.8 13.0 13.3 10.4 11.1 10.5 10.7 11.5 12.5 11.9 11.2 10.9 10.5 9.2 9.6 9.9 13.5 12.3 11.3
Pubho l/GDP 6.0 8.7 8.5 9.4 9.7 8.5 9.4 8.9 9.5 10.9 10.7 10.6 8.6 6.9 7.5 7.2 9.1 7.1 8.3 9.1 9.7 8.5 7.3 73 9.0 7.9 7.5 7.0
Koma, Rep. of GDFJ/GDP 20.4 23.0 25.4 25.0 24.0 26.9 30.9 32.7 32.1 29.0 29.4 29.2 28.9 29.6 29.2 29A 29A 31-9 37.1 39.4 36.6 36.0 35-7 36.6 36.9
Pxivato 11GDP 13.9 18.0 20.5 19.3 18.8 20.7 24.5 25.8 24.3 20.3 21.2 22.7 22.4 21.3 21.3 23.3 24.1 25.9 29.6 29.5 27.3 27.2 27.0 27.8 27.1
Pubfic I/GDP 6.5 5.0 4.9 5.7 5.2 6.2 6.4 6.9 7.8 7.7 7.2 6.5 6.5 7.3 6.9 5.7 5.5 6.0 7.4 9.0 9.3 8.8 8.7 8.8 9.9
Madag- GDFI/GDP 9.5 9.0 10.1 13.3 13.4 14.2 10.6 II.S 11.4 10-9 10 9 11.6 IT.5t
Privato l/GDP 2.6 3.6 3.1 6.4 3.7 6.9 4.6 3.7 3,7 4.7 4.9 5.0 5.5
Pubfic I/GDP 6.0 5.4 7.0 6.9 9.7 7.9 5.9 7.6 7.8 6.2 &O 6.7 6.3
Malawt GDFI`GDP 20A I&9 2C9 21 1 22.2 30.9 26.9 22.2 15.1 14.6 13.7 13.0 13.3 12.0 13.9 15.3 16.7 19.7 20.2 19.9 15.2 29.3 16.6 12.4 12.3
Private VGDP 7.8 7.3 7.8 8.5 9.4 12.3 7.5 4.7 4.9 6.1 5.4 3.3 5.0 2.0 5.9 7.2 9.0 11.7 11.9 9.7 6.8 14.1 7.4 5.8 5.1
Pubhe I/GDP 12.6 11.6 17.1 13.6 12.8 18.6 19.3 17.5 10.2 8.4 8.3 9.9 8.3 10.0 7.9 8.2 7.6 8.0 8.3 10.2 9.4 15.3 9.2 6.6 7.1
Malaysia GDFI(GDP 18.9 22.1 23.9 23.7 26.9 26.6 23.4 24.3 24.7 26.4 31.1 36.0 36.4 36.1 31.9 29.9 26.4 23.0 24.1 29.3 32.4 33.4 36.0 38.3 40.1 43.0 42.2 42.4
Private l(GDP 12.8 15.5 15.2 16.5 19.3 16,6 14.0 14.2 15.7 17.5 19.5 19.9 18.2 17.7 16.8 15.8 14.3 13.8 15.4 18.5 20.9 22.7 21.5 23.8 27.2 30.4 30.9 30.9
Pubho l(GDP 6.1 6.6 8.7 7.2 7.6 10.0 9.4 10.1 9.0 8.9 11.6 16.1 18.2 18.4 15.1 14.0 12.1 9.1 8.7 10.9 11.5 10.7 14.5 14.6 13.0 12.6 11.4 11.5
Mauritwua C3DFYC3DP 20.0 17.9 20.5 23.5 14.4 16.0 19.2 17.5
Pfi"te I/GDP 9.2 7.9 6.9 10A 4.8 7.4 12.1 8.6
Pubbe l(GDP 10.7 10.0 13.7 13.2 9.6 8.7 7.1 8.9
Mauritius GDFVUUP 28.4 27.7 29.3 25.7 23.3 22.0 17.9 18.0 18.0 18.7 19.7 21.6 28.7 26.5 31.2 29.9 27.8 29.4 30.8 24.3 2 W.-1 27.2
Private IIGDP 20.3 19.9 18.3 17.7 14.9 13.5 11.5 11.6 12.3 12.6 12.8 14.3 16.6 19.5 19.7 20.7 19.2 20.6 21.7 16.3 16A 20.0
Public. I(GDP 8.1 8.8 10.0 8.0 8.4 8.5 6.4 6.4 5.7 6.0 7.0 7.3 12.2 7.1 11.5 8.2 9.6 7.9 9.1 8.0 9.3 7.2
mmdco GDFI/GDP 19.8 17.8 18.9 19.2 19.9 21.4 21.0 19.7 21.2 23.7 24,8 26.3 23.0 17.5 18.0 19.2 19.6 18.5 19.5 17.2 17.9 19.6 19.6 19.6 19.4 16.2 19.0 19.6
Private I/GDP 13.2 13.2 12.8 11.7 12.3 12.4 12.8 11.9 12.8 13.5 13.9 14.3 12.8 11.0 11.4 12.5 13.0 13.3 14.1 13.0 13.6 14.6 15.8 14.8 15.6 12.8 14.2 16.0
Pubhc FGDP 6.6 4.6 6.1 7,5 7.6 9.0 8.2 7.8 8.4 10.2 10.9 12.1 10.2 6.6 6.6 6.7 6.6 5.2 4.4 4.2 4.3 4.1 3.8 3.8 3.8 3.3 3.9 3.6
Morocco GDFl1GDP 24.8 29.7 32.0 24.9 24.0 22.2 26.0 27.3 24.4 23.1 23.1 21.3 20.2 19.3 22.8 25.4 22.2 22.5 22.1 20.5 22. 19.6 20.7
Private I/GDP 9.8 12.9 14.5 13.5 11.4 11.9 11.4 13.4 11.9 11.2 12.1 12.2 11.6 11.9 13.2 14.5 11.8 11.3 7.7 7.7 10.6 10.2 11.0
Public I/GDP 15.0 16.7 17.5 11.4 12.6 10.4 14.5 13.9 12.6 11.9 11.0 9.1 8.6 7.6 9.6 10.8 10.5 11,2 14.4 12.8 11.4 9.4 9.7
Nambia GDFVGD? 26.0 26.0 21.7 17.4 14.5 13.7 13.3 13.9 14.9 16.1 20.4 15.6 20.2 21.6 21.0 21.6 23.5 20.7
Private ItGDP 10.9 9.7 6.9 6.1 5.9 4.9 5.7 6.5 7.9 10.4 12.6 8.2 10.5 13.4 12.7 14.0 15.5 12.9
Pubfic. I/GDP 15.1 16.3 14.9 11.3 9.6 9.9 7.6 7.5 6.9 5.7 7.8 7.3 9.7 8.1 8.3 7.6 9.0 7.8
GDFLIGDP 20.4 19.3 19.5 18,9 22.1 24.0 29.0 31.6
Privatc VGDP 11.2 10.7 9.7 8.9 9.8 10.6 14.1 19.8
Public VGDP 9.3 7.6 9.8 10.0 12.4 13.4 14.9 11.8
Paldstan GDFI/GDP 14.3 14.0 12.6 11.5 12.2 I4.4 18.2 19.6 17.3 17.0 17.1 17.1 16.8 17.0 16.5 16.5 17.0 17.5 16.5 17.3 17.3 17.4 18.6 19.1 17.9 16.9 17.0 15.8
Private I/GDP 7.3 7.0 6.6 5.6 4.4 4.6 5.9 6.2 5.8 5.8 7.7 7.8 7.2 7.4 7.5 7.6 7.8 7.7 7.7 8.3 8.9 9.9 9.8 10.0 9.6 9.7 8.9 8.9
Public I/GDP 7.0 7.0 6.0 5.9 7.9 9.8 12.3 12.4 11.5 11.2 9.4 9.4 9.7 9.6 9.0 9.9 9.2 9.7 8.8 9.0 8.4 8.5 8.8 9.1 9.3 8.2 8.1 6.9
Panarna GDF1/GDP 19.3 9.8 6,5 8.5 15.0 19.3 23.8 24.2 24.9 25.1 26.4
Private VGDP 16.8 5.7 4.5 7.4 12.0 15.1 19.9 20.8 21.5 21.3 22.0
Pubfic VGDP 2.4 3.1 2.0 1.1 3.0 3.1 4.0 3.4 3.4 3.8 4.4
Papua New Guinea GDFI/GDP 26.9 33.0 29.7 23.9 18.4 21.0 19.3 23.3 26.0 25.1 28.0 23.8 19.8 13.9 22.3 27.6 37.0
Privatt IIGDP 18.1 26.1 23.6 17.6 12.1 14.5 14.0 18.3 21.2 20.0 23.3 18.6 12.5 11.1 19.0 24.0 31.5
Pubfic VGDP 8.7 6.9 6.1 6.2 6.3 6A 5.3 5.0 43 5.1 4.7 5.2 6.3 2.9 3.4 3.6 5.6
Paraguay GDFI/GDP 14,8 14.0 15.5 15.6 17.9 19.9 22.7 23.8 25.2 27.0 27.2 27.4 24.0 20.1 21.6 20.7 23.5 23.7 23.1 22.7 21.0 22.0 19.8 19.6 22.5 23.1 22.5 22.7
Pfivate LIGDP 10.8 10.3 11.0 12.3 15.2 15.7 13.5 15.2 17.9 20.7 22.4 216 19.5 13.3 13.2 14.2 18.5 17.6 16.3 16.0 18.2 18.7 16.1 15.4 19.0 17.7 19.1 15.4
Public I/GDP 4.0 3.7 4.5 3.3 2.7 4.2 9.2 8.6 73 6.3 C9 CS C5 6.9 9.4 6.5 5.1 6.1 6.9 6.7 2.9 3.3 3.7 3.2 3.5 5.3 4.4 7.3
(confmued /)

Table 1. (contlued)
country/Yewr 1970 1971 1972 1973 1974 1975 1976 1977 1978 1979 1980 1981 1982 1983 1984 1985 1986 1987 1988 1989 1990 1991 1992 1993 1994 1995 1996 1997
Peru GDFI/GDP 28.8 29.5 23.7 20.2 18.2 18.5 17.8 19.7 16.6 14.7 14.5 15.2 16.8 21.0 23.5 23.5 24.8
PTivate VIGDP 21.5 20.8 15.1 12.1 12.0 13.2 13.4 15.5 13.1 12.2 11.7 12.0 13.4 16.9 19.5 19.6 21.0
Public 1/GDP 7.3 8.7 8.7 8.1 6.1 5.4 4.4 4.2 3.5 2.5 2.7 3.1 3.4 4.0 4.0 3.9 3.9
Philippines GDFI/GDP 24.7 26.4 25.1 25.2 27.5 27.2 27.8 27.5 29.8 24.5 17.5 16.8 16.5 17.8 20.8 23.1 20.0 20.9 23.8 23.6 22.2 23.4 24.5Private I/GDP 20.6 16.1 17.9 18.2 20.1 18.8 16.8 20.0 23.7 19.1 13.7 14.0 13.7 14.9 17.3 18.9 15.9 16.0 18.8 18.7 17.6 18.8 20.9Pubhic lGDt' 4.1 10.3 7.2 7.0 7.4 8.5 10.9 7.5 6.1 3.4 3.7 2.8 2.8 2.9 3.6 4.2 4.1 4.9 3.0 4.9 4.6 4.6 3.6
Poland GDFV/GDP 16.0 20.7 20..8 17.5 15.8 16.1 19.3 17.0 19.3
Privat I/GDP 2,7 8.5 12.3 7.7 6.8 7.1 6.8 7.8 10.3Pubiic 1/GDP 13.3 12.1 8.5 9.8 9.1 9.0 12.5 9.2 9.0
Romania GDFI/GDP 14.2 14.7 14.1 16.1 18.0 19.3 15.4Privat I/GDP 1.4 2.8 4.3 6.7 8.5 9.4 6.2
_________________Public I/GDP 12.9 11.9 9.8 9.4 9.6- 9.9 9.2
south Africa GDFI/GDP 24.7 26.2 26.9 25.4 25.1 29.4 30.1 28.0 26.4 26.2 26.2 27.8 27.9 26.8 24.4 23.3 20.2 18.5 19.8 20.6 19.6 17.8 16.6 15.5 16.1 16.9 17.2 17.4Private I/GDP 14.1 14.5 14.0 13.5 13.4 14.8 14.7 13.7 13.0 12.7 13.3 15.5 15.9 15.6 14.6 13.1 11.6 11.2 13. 2 13.2 12.9 11.9 11.4 10.8 11.7 12.6 12.6 12.7
Public I/GDP 10.6 11.7 12.8_ 11.9 11.7 14.6 15.5 14.3 13.4 13.5 12.9 12.3 12.0 11.2 9.9 10.2 8.6 7.3 6.7 7.4 6.8 5.9 5.2 4.7 4.4 4.3 4.6 4.7
Thailand GDFIIGDP 23.8 23.3 22.7 22.4 23.3 22.9 22.9 26.0 25.3 25.6 27.8 28.0 26.9 28.5 28.6 27.2 25.8 27.6 30.7 34.6 40.4 41.6 39.3 39.5 40.0 41.1 41.1 35.6
Private IfGDP 16.7 16.6 16.0 17.3 19.6 17.7 16.1 18.6 17.6 18.0 18.9 19.0 19.1 20.5 20.3 18.5 15.4 21.7 25.6 29.6 34.2 34.4 31.1 31.6 31.3 32.2 30.8 24.1Public ItGDP 7.1 6.7 6.7 5.1 3.7 5.2 6.8 7.4 7.7 7.6 8.8 8.9 7.9 8.0 8.3 8.7 7.4 6.0 5.0 5.0 6.1 7.2 8.1 7.9 8.7 8.9 10.2 11.5
Tunisia GDFI/GDP 20.4 19.8 19.8 20.5 20.8 25.7 29.0 30.7 30.9 30.5 28.3 31.0 34.0 31.8 32.1 28.1 25.0 21.6 20.5 22.5 24.4 24.1 24.6 25.5 24.9 24.2 23.2 24.5
PrivateIVGDP 8.5 7.7 8.8 10.7 10.5 12.3 11.6 10.9 11.7 12.0 13.3 14.8 15.4 15.9 15.7 14.5 12.1 11.1 11.3 12.4 12.3 12.7 13.2 12.7 13.1 12.3 11.8 12.4
__________________Public I/GDP 11.9 12.1 11.0 9.8 10.3 13.4 17.4 19.8 19.2 18.5 15.0 16.2 18.6 16.0 16.4 13.7 12.8 10.5 9.3 10.1 12.0 11.4 11.4 12.8 11.8 11.9 11.4 12.1
Turkey GDF1/IDP 22.5 20.2 21.7 21.4 19.9 22.1 24.4 25.7 23.1 21.9 22.1 20.1 19.4 20.1 19.5 20.3 22.8 24.7 26.1 22.8 22.9 23.8 23.6 26.5 24.6 23.8 25.0 26.1
Privat 1/GDP 12.6 11.6 13.0 12.9 11.3 11.7 13.2 13.2 12.4 10.7 13.3 11.0 11.1 11.4 11.4 11.1 12.6 14.7 17.2 15.2 15.6 16.2 16.2 19.3 18.9 19.9 20.3 20.5_________________Public I/GDP 9.9 8.6 8.7 8.5 8.6 10.4 11.2 12.5 10.7 11.2 8.8 9.2 8.3 8.7 8.1 9.2 10.2 10.0 8.9 7.6 7.3 7.6 7.4 7.3 5.7 3.9 4.7 5.6
ruguay GDFIIGDP 11.8 11.5 9.8 9.0 10.3 13.3 15.5 15.2 16.0 16.2 16.7 15.7 15.1 13.7 10.9 9.6 9.9 11.4 1 1.9 11.6 10.8 11.9 12.5 13.8 12.8 11.5 11.8 12.0
Private I/GDP 8.8 8.3 7.5 7.1 7.7 8.7 9.0 8.2 8.0 9.7 11.4 10.7 7.9 8.6 6.4 6.1 6.2 7.4 7.9 7.2 7.7 7.8 9.0 9.5 8.3 8.2 8.4 8.6Public, l/GDP 3.0 3.2 2.3 1.9 2.6 4.6 6.5 7.0 8.0 6.5 5.3 5.0 7.2 5.1 4.5 3.5 3.7 4.0 4.0 4.3 3.1 4.1 3.4 4.3 4.5 3.3 3.4 3.3
Venemuela GDFI/CGDP 16.0 17.3 20.4 21.2 22.8 16,9 14.1 18.2 21.1 20.0 17.6 16.1 14.8 16.9
Private I/GDP 10.5 11.1 10.9 12.1 12.3 7.2 4.9 7.6 8.9 9.0 8.2 6.7 5.1 7.4__________________Public I/GDP 5.5 6.2 9.5 9.1 10.5 9.7 9.2 10.6 12.2 11.0 9.4 9.4 9.7 9.5
East Asia GDFIIGDP 21.3 22.7 22.3 23.0 25.2 24.8 24.2 25.6 26.5 28.0 27.7 27.2 29.4 28.9 26.5 24.8 24.7 24.6 26.2 28.0 30.1 30.8 30.6 31.4 31.1 32.6 33.5 33.5
Pri-a,eL/GDP 14.8 16.1 15.0 17.3 19.8 18.6 16.3 17.9 19.0 20.4 17.0 16.3 18.6 18.5 16.8 14.9 15.6 16.4 18.2 20.1 21.6 21.9 20.3 20.7 21.3 23.6 24.5 24.2
Public YGrDP 6.6 6.7 7.3 5.8 5.4 6.2 7.9 7.7 7.5 7.7 10.7 10.9 10.8 10.4 9.7 9.8 9.1 8.1 8.0 7.9 8.5 8.9 10.3 10.8 9.8 9.0 9.0 9.3
South Asia GDFIIGDP 13.7 15.2 14.8 9.9 11.7 12.9 15.7 16.3 16.1 16.0 17.2 17.7 17.5 16.5 16.2 16.7 16.9 17.3 16.9 17.6 17.8 17.0 17.7 18.1 18.2 19.1 19.1 18.7
Private IIGDP 7.7 8.5 8.0 5.7 6.1 6.1 7.2 7.2 7.4 7.3 8.9 9.3 8.6 8.0 7.9 8.4 8.0 8.4 8.6 9.2 9.7 9.1 10.1 10.3 10.1 11.5 12.1 11.9
Publicll/GDP 6.0 6.8 6.8 4.3 5.6 6.8 8.6 9.1 8.8 8.7 8.4 8.4 8.8 8.6 8.3 8.3 8.9 8.9 8.3 8.3 8.0 7.9 7.6 7.8 8.1 7.6 7.0 6.7
LAC GDF7/GDP 16.6 16.9 17.4 16.7 19.0 20.5 21.1 20.9 21.7 21.7 21.2 21.8 20.0 17.2 16.9 16.6 17.5 18.8 18.8 18.3 17.5 17.7 18.9 20.1 20.0 19.6 19.3 20.5
Private I/GDP 11.5 11.6 11.5 11.1 12.5 13.2 13.1 12.8 13.6 13.6 13.7 14.1 12.7 10.8 10.9 11.0 11.9 13.0 12.7 12.3 12.0 11.8 12.7 14.0 14.2 14.2 13.7 15.0
Public IIGDP 5.1 5.3 6.0 5.6 6.5 7.3 8.0 8.1 8.1 8.1 7.5- 7.7 7.3 6.4 6.0 5.6 5.7 5.8 6.1 5.9 5.4 5.9 6.3 6.1 5.8 5.4 5.7 5.5
SSAFR GDFTIGDP 22.2 24.4 24.5 22.2 21.1 24.8 25.2 24.7 27.7 25.6 24.3 23.0 20.2 18.8 17.6 15.9 15.5 18.3 21.3 20.5 19.8 18.3 20.3 18.6 19.0 18.0 17.9 18.4
Private I/GDP 13.9 14.2 13.8 10.9 10.4 11.4 13.8 13.5 14.8 12.7 11. 11.4 10.2 10.0 9.3 8.2 7.9 8.4 10.5 10.2 10.3 9.5 10.1 9.4 9.4 9.9 10.3 10.7
PubliCL/GDP 8.3 10.2 10.7 -11.3 10.7 13.4 11.4 11.2 12.9 12.9 12.9 11.6 10.1 8.8 8.3 7.7 7.7 9.9 10.8 10.3 9.5 8.8 10.2 9.3 9.6 8.1 7.6 7.7
Total GDFIIGDP 17.8 18.3 18.8 17.7 19.2 21.2 22.3 22.6 23.2 23.0 22.7 23.0 22.6 21.2 20.1 19.1 19.3 19.9 20.9 20.8 20.8 20.3 21.1 21.3 21.3 21.3 21.3 21.6
Total Private l/tDP 11.6 11.8 11.8 11.2 12.2 12.8 12.9 13.1 13.7 13.5 13.2 13.4 13.0 12.4 11.9 11.2 11.5 12.1 12.8 12.9 12.8 12.4 12.5 13.0 13.3 14.0 14.1 14.4
Total Public /GDP 6.2 6.6 7.0 6.5 7.0 8.4 9.4 9.6 9.4 9.5 9.5 9.6 9.6 8.8 8.2 7.9 7.8 7.8 8.1 7.9 8.0 8.0 8.6 8.3 8.0 7.4 7.2 7.1
Note: UnLless otherwise noted the sources are: national authonitie & World BankfIMF staff estansates
Data for 1996/97 are prelainernay/estimates,Chass- private investment uincludes: mnvestment by collectrv-owned units, joint-owned uniits, share-holding uniits,
foreigri-fianded iunts, Hong KongMacao-Tawn-funded units and by individuals.
Brazi - source 1990-1997: FIBU, C;entro de Escudos de Econoinia and Governo/IBRE/FGV, previous yearn World Bank.
1990-9? - privsce irvesrteent mncludes investment by enteiprises controlled by state and local rmuncipalities.
Republic ofKorea - public inestmnent = capital expenditur of consolidated nonfmancia public sector
Mexico - I S88-97 data based 008a new INGI methodology.
Morocco - up to 1990 public inrestmuent are estimtated by investment of 1 4 higgest public companies; 1990-1997 data for the whole economy.
Poland - 1 995-97 GDP includes estimates of "the gey economy"
South Africa - Source: Quarterly Bulletin of South African Reserve Bank.

Distributors ofWorld Bank Group Publications
Prirs and mitemsn aryfrom CECHREPUBLIC I1NDI EulyeooPubishinWgCo., Ltd. PERU SWEDENcountlry to countOy. Coesult your USIS. HIS Prodejn A eoPublishes Ltd. 46-. Susong-Dong Editoral Desaroltlo SA Wetnergren-Wiltoo ABlocal distrlbutor beore placing an Haveolkva 22 751 Mount Road Jegro-Gu Apartado 3824. Ica 242 OF. 106 P 0. Box 1305order. 130 00 Pgue 3 Madras - 600002 Seoul Urma1 5-171 25 Solna
Tel: (420 2) 2423 1486 Tel: (82 2) 734-3515 Tel: (SI 14) 285380 Tel: (46 8) 705-97-50ARGENTINA Fax: (420 2) 2423 114 Fax: (91 44)852-0649 Fau: (822) 732-0154 Fax: (51 14) 286628 Fax: (468) 27-00-71World Pt 877ons SA URL: http vww .ns.caV INDONESIA LEBANON PHILIPPINES E-mail: [email protected] Cua d te Buenos Aires DENMARK Pt. Indira Umited Libraine du Liban Intemationa' Booksource Center Inc. SWITZERLANDTel: (3411) 481541S6 SamfurndsLitteratur Jalan Borobudur 20 P.O. Bo 11-9232 1127-A Antipolo St, BarangaY. Ubraide Payot Service InstitubonnelFae: (54 11)48158156 RosenoemsAtel11 P.O. Box 181 Beirut Venezueb C(trres-de-Montbenon30E-mail: wpboeelrirfovia.com.ar DK-1970 Fredenksberg C Jukarta 10320 Tel:)(961 9)217944 Makabti City 1 02LausanneTel: (4535)351942 Tel: (6221) 390-4290 Fax (9619)217 434 Tel (63 2) 896 6501 6505 6507 Tel: (41 21)341-3220AUSTALIA, FIJI, PAPUJA NEW For: (45 35) 357822 Fax: (62 21) 390-4289 C-maO: hsayeghrSibrairie-du- Fax: (63 2)9896 1741 Fax (41 211 341-3235GUINEA. SOLOMON ISLANDS, URL: http:l)www.sl.cbs.dk IRAN litaincom.lb n-VANUATU, AND SAMOA iUon corn/w l 1b aiecu POLAND AD0C0 Vae DiemrenD.A. lnformabon Services ECUADOR Ketab Sara Co. Publishers Intemabonal Publishing Service EditConsTecnriqes648 Whitehorse Road Libn Mundi Khaled Eslamboli Ave., 61h Street libuncornlb Ul. Piekn 31/37 Ch. de Lacuez 41Mltcham 3132. Victona Libreda lntemacional Delafnooz Alley No. 8 MALAYSIA 00-677 Warzawa CH1807 BlonayTel: (61) 3 9210 7777 P.O. Box 17-01-3029 P0 BoX 15745-733 University of Malaya Cooperative Tel: (48 2) 628-6089 Tel: (41 21M 943 2673FPx: 161) 3 9210 7788 Joan Leon Mera 851 Tehran 15117 Bookshop, Limited FPx: (48 2) 621-7255 Fax: (41 21) 943 3605E-mail: [email protected] Qulto Tel: (98 21) 8717819:8716194 P.O. Boo 1127 C-mail. books%ipo@*ikp.atrn.esm.pi THAILANDURL: htp:l/www.dadireci.com au Tn(593 2) 521-606 (593 2) 544- Fax: (98 21) 8712479 Jalan Pantai Barnu URL: Conlrol Books SistHibUN01 E-mail: ketab-sararieda.ret.ir 59700 KuoAa Lumpur htIp://ww.ipscg.waw.plIps/exporl 3Ceal BooksDstribue onAUS'roIA Far (593 2) 504-209 Kowkab Publishem Tel (60 3) 756-5t00 PORTUGAL Sangkok 10500Gerold aind Co. E-mail librnliffiinriouid.cornec PO Box 19575-511 Funa (603) 755-4424 Livnria Portugal Tel: (66 2) 2336930-9-tiOt osem - Tehnn . et.my Apartado 2681 Rua Do Carm Fax. (66 2) 237-8321
Tel: (43 1) 512-47-31-0 COEe: (98 21) 250-3723 MEXICO 070-74TRNDD&OBGPus (43(1512-47-31-29 Ruiz de Castilla 763 Edit. Expocolor Fax: (9821)258-3723 INFOTEC 1200 Lisbon TRINIDAD6T T 8BAGoURL: htpl/ www gervld.coratonline Prner piso Ctf. 2 IRELAND Av San Fernando No. 37 Tel: (1) 347-4982 SystemabcsAstudieAkLiln Co) Toriello Guerra FPus (11 347-0264 Syt.mugusin Shoppies LId. eANULADESH Tei/Faxs (593 21 507-383* 253-091 Govemment Supplies Agency 14050 Mexco, DF Est asin .St Augustrpping CenterMicro lnidustries Development E-mall: codeuoimrpsatnelec O-5g an ISOolao Tel: 52 5) 624-2800 Eastern Main Road St AugustineAssistance Society(MIDAS) EGYPT. ARA REPUBLIC OP Dobb 2acul o Fax: 152 SI 624-2822 ROMANIA Invidud & Isolago West nomesHouse S Rued 16EYF.ARBRPBIOF Dbi2EmilinoertnntmCopnDeLbaiBcustSADharnmodi R/Area Al Ahram Distnbution Agency Tel: (35311661-3111 aiL: itS2 ne@rn n! Co m3psani D Libar no 26 sector 3o A x 0681 643-0496Dhaka 12M ~~~~Al Galua WStert Fax: (353 11 475-2670 EA-mt:/t.etreSrLprni5 6sco ay. to060) 645-0467Tel: (889 2) 329427 CaoISRAEL Mueli-Prnsa Mevis35964d oeGANDsFax: (880 2) 811136 Tel: (20 2 578-6083 Yozmot Lilerature Ltd. c/Rio Panuco. 141-Colonra CV Tel: t40 1! 313 9645 GuAtro Ud
JEanDoL annMoy ThytMiddle East Observer 3 avanuundrStre20066008MesicO Bo 56055 06500 Mexico DF RUSSIAN FEDERATION P0 e 9 MJoa du toi 202 41 Sherf Street Tel Aviv 61560 Tel: (52 5) 533-5658 lsdabelstvo <Ves Miss Plot 16/4 i Rd8608 russels Caro Tel: (9723)5285-397 Fax:(525)514-6799 9a Kolpachniy PereulokeTv 1256 4r i 251 4671060 Brusse2 2)538-51Tel: (20 2) 393-9732 FaP: (972 3) 5285-397 NEPAL Moscow 109831 Fax: (256 411 251468
Fax: (32 2) 538-041 Fax: (20 2) 393-9732 R o.Y International Everest Media Internabonal Services Tel (7 295) 917 07 49 E-ma9: gus0swifluganda comBRaxIL FINLANDP5Boo 1305 (P.) Ltd. Fax: (7 095( 917 92 59 0md [email protected] Tecnicas Internaaonais Akiateeminen lKirlakauppa Tel Aviv 61130 Gporoin Boy 544 gETA .CI UID KINGOM ALtcla~~ PF Dosx 125 Tel. (972 3) 649 9469 Kathmiandu SINGAPORE: TAIWAN. CHINA MieOil LBD3reaPkAloLIds. ~~~~~~~~~~~~~~~~~~~ ~ ~~~~~~~~Tel. 1977 11i 416 026 MYANMAR: BRUNEI P s mg ai loRua Peixoto Gomide. 209 F118-00101 Heloinki Fax (972 3) 648039 Fax: (9771! 224 431 Hemisphere Publcatioo Services Hampshire GU34 2PG01409 Sao Paulo, SR. Tel (358 0( 121 4410 E-mail: royi60netvsicoln.nel.il Fa:1 1K24a31Me laorigr Psriuddivg Srvaices-0 Hngandsr 03 Tel: (55 11) 259-6eo Fax: (35800) 121-4435 URL: http:/lwwwe roylntCoDA NETHAERLANDS Golden Wheloel boilding FTe: (44 14201 89694Fa:(5 11( 250-6990 6-mail: akatilaus@stockmann ti Palestinian AuthontylMiddle 0as1 Dr LrndeboomAntrnatornalesu Singaporo 349316 Fx 4 40 98E-mail: postmasterpti uolhbr UIL: http://wwwakateemieencom ondes Information Services Publicaties So- Tel: 1651 741-5166 E-mail ssaOenierornlo.co.ukURL: http://www uol br FRANCE P .8. 19502 Jerusalem Po Box 202. 7460 AE Haaksbergen Fax (65) 742-9356 URL: http:/swww micointo.cc.ua,CANADA Ed vions Eska: DBJ Tel: (972 2)6271219 Tel (31 53) 574-0904 E-mail: ashgatlerasianconnect com The Stationery OticeRensut Publishing Co. Lid 48 rae Gay Lissac Fax~ (972 2) 6271634 Faa: 131 53) 572-9296 SLOVENIA 51 Nice Elms Lass5369 Canotek Road 15O ai ITALY, LIBERIA E-mail: Imlitdbvoovworldvnline.n1 Lontdon SW8 5OPOttawa, Ontario K1J 9J3 Tel: (33-1) 55-423 L C ii i eP .tOd:/Ho wvwworldonline0l,-lin- Gosyodarski vestnik PubOshing Tel: (44 171) 873-8400Tel: (813) 745-2665 P~~ay. (33-1) 43-29-01-6- Vicoa Due misDioCalria. Sanson ebsoAGroupI
Tel (613) 745-2665 Via Duca Di Calabria, III deboo Oun~~~~~~~~aoaska cestao Fax. 144 171( 973-9242Pau: (613) 745-7660 GERMANY Caseila Postale 552 NEW ZEALAND 1909 LjaOljana SURL http:1/wwwvIhe-statorerv-E-mail: UNO-Verlag 30125 Fihenze NEWc Z LOOO T:8 1337 2 3 ohice.coulnb
orderLdepjtrrenoutooks com PoDpelsdorferAllee55 Tel: (39 551645-415 Prile Mail Bag 9914 Fax (38661)1338030 VENEZUELAURL: hItp-l1 www2 enoutbooks9com 53'1 -nn Fai: c39 55)641-257 New Market E-mail repansekj@gvestnik si Tecni-Ciencia brsos S3ACHINA Fiucu eo e FTe: (40 228)91149020 EURaL lioafic Auckland SOUTH AFRICA. BOTSWANA CetoudaCmrclTmno
ChinaFinanial Econmic OaLx O4ltp8// 1742 UL.stop-vwwfrbag.deos Tel: (64 91 524-01 19 Psi single stles: Nlyer C2 CarGasaPublishing Heuse Fae 164 91524-967 Tel: 15 2 959 5547 5035 00160. DOs Si ong Jie E-muil: uoovetlbg@ool comO Ian Randle Publiohers Ltd Af ricaoa 5 )9953Beijing GhANA 206 Old Hope Road Kingston 6 Oasis Offcial Vasco Boulevard Goodwood ZAMBIATel: (8610)6401-7365 Epp Books Services Tel: 876-927-2085 RO Box 3627 P.O Box 12119. Nl City 7463 University BooKshop Unmverstv orFax:186 10) 6401-7365 PQ Bos 44 Fax: 876-977-0243 Wellington Cape Town ZambiaChinaBookimport Centre ATUC E-mail: [email protected] Tel: (64 4)4991551 Tel: (272115954400 Gruel East Road CampusPO a 2825 cca JAPAN Fax: (64 4) 499 1972 Fax (27 2i) 595 4430 P.O Box 32379Beijint F2T: 233713 77 Eastern Book Service E-mail oasis0actrix.gen nz E-mail: oxord@oupcoza Lusaka
Fax 223 21 779099 lorPromotion GR3-13 Hongo 3-chome. Bsunkyo-ku GRL httP://wwwoasisbooksco.nzi Foresubscrpionordel: Telc (260 1I253576ChIniese Corporation let Promotion GREECE Tokyo 113 Ineatoa Sbcip nSevc Fx 26 )25A5at Ilumaxitien NInleAPOuBeox Subsrip onIMBrvWe52. You Fang Hu Tong, Papasonce SA. Tel: 01 3)3818-086 University Press Umited FO.Bo 410e95 ZM BE ) 5Xuan tNei Sa Jie 35 Stournara SIr Fax: 181 3) 3018-0864 Three Crowns Boilding Jerrchs Johannesburgdmicsa2Bu0o4Boos-PI Berirron 106 92 Athens E-mail: [email protected] Ensure Muir Boo 5095 Jbnobt 04LdTel (86 10) 660 72494 Tel (3011364-1826 URL. fnaclan Tel: (27 11180-1448 4 Conald Road GranitesideFa: (8610) 660 72 494 Fax: (30 1) 364-0254 htp:w//ww bekkoarne or jpP-svu Tel (234 22) 41-1356 Fa: (27 11 ) 90-6248 PO Box 567COLOMBIA HAITI es Fae 1234 22)41-2056 E-mail: [email protected] Hararelnetonlace Ltda Culture Dhtusion KENYA SPAFN Tel( 263 4 755435Carrer6 No. 51-21 5 Rue capois Afnca Book Service (E.A.) Ltd. PAKISTAN Mundi-Prensa Libros. SA Fax. 263 4 791913
0 Aerso 34270 C.P. 257 ~~~~Quaran House Sfatuguno Street Mirzo Book Agency Castello 37=tade Beota. D Port-au-Prince PO. Box 45245 65 Shahrah-e-Ouaid-e-Azam 28001 MadridTel: (57 1) 2 .52796 Tel (509) 23 9260 Nairobi Lahore 54000 Tel: (34 91)43637DWFaP: ($711 285-2798 Fax (509) 234058 Tel: (2542) 223 641 Tel: (9242) 7353601 Fax: 134 91s5 753998
HONG KONG, CHINA: MACAO Fax: (254 2) 330 272 Fax: (92 42) 576 3714 E-mail: libreta*rmundiprensa.esCOTE OtRRE A 20I Legy Evko 0: hilp:iwwwrmundprensa.com/Ceeter d'Edillont etad Dffiusorn Asi 200 Lted 0en Legac Houkse Oxlord University Preos Mundi-Prensa BarcelonaAfricaines (CEDA) 32Suaw ttird usan epaMte zz oianinue 5 Bangalore Town Conseil de Cent. 391
84b.P.a 041 22-29 Wyndhamn Street. Central P.O Boo 68077 SaeFia 06009 BarcelonaTel: (228i 24 6510 24 051 1 Hong Knoe, China Nairobi PO Bax 13033 Tel: (34 31 488-3492(tx- 225 25 0567 Tel (052) a53E 1409 Tel: (254) 2-330853, 221426 Karachi-75350 Fax: (34 3) 487S769Fax: (852) 2526-1107 Fax: (2541 2-330B54. 561654 Tel (92 21) 446307 E-mail: banelona7mundiprensa.esCYPRUS E-maol: salensia2000O.com hik E-mnail: [email protected] Fax: (92 21) 4547640E-albteon radprnasCenter for1Applied Research URLR;http:/Awwasia2000com.hk E-mail: ouppaol74TheOfice.net SRI LANKA, THE MALDfVESCene ors AolledRsuc JL fp:/e ga00cmh KORtEA, REPUBLIC OF Lake House BooskatopC Dgees Stre Enmi HUNGARY Dayang Books Trading Co PAu Book Corporabon 100, Sir Cettitmpalam Gar6.. Diogee m et on Euro Into Servire Inturnosonal Divsmion Azm Chambers 21, Queen's Road MuwathaN uia 26Margiftzjeti Europa Haz 783-20 Fangba Bon-Dong, Lahore Colombo 2Tel. (3572(590730 H-1138 udapeost Socho-ko Tel: (9242)6363222 636 0885 Tel: (941)32105Fu (3572(66-2051 Tel: (361)3500024.3508025 Seoul FPu:(9242)6362328 Fax: (94 1)432104
Fax: (36 1) 350 90 32 Tel: (82 2) 536-9555 E-mail: [email protected] E-mail: [email protected]: euroinfo*emaid.matav.hu Fax: (82 2) 536-0025
Emuail: [email protected]

IFC Discussion Papers (continued)
No. 21 RadidlReformintheAutomotivelnd2ustry:PoliesinEmergingMarkets. Peter O'Brienand Yannis Karmokolias
No. 22 Debt or Equity? How Firms in Devloping Countries Choose. Jack Glen and Brian Pinto
No. 23 Fmna&gPrvaeInfratrePmrjPcts:Ene'gmgTrendsfrom IFCsExFz xen Gary Bondand Laurence Carter
No. 24 An Introdiontothe Mkrstrure of EmegngMarkeits. Jack Glen
No. 25 Trends mPrvateInvestmentinDevelopingCountries 1995: Statistisfor 1980-93. JackD. Glenand Mariusz A. Sumlinski
No. 26 DiitdendPolicyandPBehaorinEmeTgingMarkets ToPayorNottoPay. Jack D. Glen,Yannis Karmokolias, Robert R. Miller, and Sanjay Shah
No. 27 In0teuPropeAryProtWaion, Dtrectnwsmnt, and Terhnology Tranfeqr Game=zry, Japan,andathe United States. Edwin Mansfield
No. 28 Trends mPr7iateInvestmentinDevelopingCountries: Stasicsforl970-94. Frederick Z.Jaspersen, Anthony H. Aylward, and Mariusz A. Sumlinski
No. 29 InternationalJoint Venturesin DevelopingCountries: HappyMarmees? Robert R. Miller,Jack D. Glen, Frederick Z. Jaspersen, and Yannis Karmokolias
No. 30 Cost BenefitAnalysis of Private Sector Envronmental Investments A Case Study of the Km aCne-tFactory. Yannis Karmokolias
No. 31 TrendsinPrivateInvmestmentinDevelopingCountries: Statisticsfor1970-1995. Lawrence Bouton andMariusz A. Sumlinski
No. 32 The Business of Education: A LookatKenyds Prxvte Edoun Sector.Yannis Karmokolias and Jacob van Lutsenburg Maas
No. 33 low Businesses See Covernment: Responsesfrom Priate Sector Sur,eys in 69 CountriesAymo Brunetti, Gregory Kisunko, and Beatrice Weder
No. 34 Trends'mPrtelnmentmi DevelopingCountries:Statusticsforl97096. Jack D. Glenand Mariusz A. Sumlinski
No. 35 Corporations' Useofthelnternetin Developing Countries. John A. Daly and Robert R. Miller
No. 36 Trendsin VhenflureC dvineeinDevlopingCountrie. Anthony Aylward

L Lt i.INTERNATIONALFINANCE
0
CORPORATION
Headquarters1818 H Street, N.W.Washington, D.C. 20433 U.S.A.
Telephone: (202) 477-1234Telex: RCA 248423
TRT 197688Facsimile: (202) 477-6391World Wide Web:http://www.worldbank.org/ 9
E-mail: [email protected]
London4 MillbankLondon SWlP 3JA
Telephone: (71) 222-7711Telex: 919462Facsimile: (71) 976-8323
Paris ai
66, avenue d'I6na75116 Paris, France
Telephone: (1) 40.69.30.0054
Telex: 640651Facsimile: (1) 47.20.77.71
Tokyo10th Floor Fukoku Seimei Bldg.2-2-2 Uchisaiwai-choChiyoda-kuTokya 100-0011, Japan
Telephone: (813) 3597-6650Telex: 26838Facsimile: (813) 3597-6695 14475 FID
0-8213-14475Trends in Private Investmen
$ 22.00 15409 --
ISBN 0-8213-4475-7 c
e