Bradesco BBI – 1st Brazil Investiment Forum
40
Bradesco BBI - 1 st Brazil Investment Forum São Paulo – April 2014
-
Upload
generalshoppingriweb -
Category
Economy & Finance
-
view
213 -
download
1
Transcript of Bradesco BBI – 1st Brazil Investiment Forum
Bradesco BBI - 1st Brazil Investment Forum
São Paulo – April 2014
1 1 1
This presentation contains statements that are forward-looking within the meaning of Section 27A of the
Securities Act of 1933 and Section 21E of the Securities Exchange Act of 1934. Such forward-looking
statements are only predictions and are not guarantees of future performance. Investors are cautioned
that any such forward-looking statements are and will be, as the case may be, subject to many risks,
uncertainties and factors relating to the operations and business environments of General Shopping
and its subsidiaries that may cause the actual results of the companies to be materially different from
any future results expressed or implied in such forward-looking statements.
This material is published solely for informational purposes and is not to be construed as a solicitation or
an offer to buy or sell any securities or related financial instruments and should not be treated as giving
investment advice. It is not targeted to the specific investment objectives, financial situation or
particular needs of any recipient. No representation or warranty, either express or implied, is provided in
relation to the accuracy, completeness or reliability of the information contained herein. This material
should not be regarded by recipients as a substitute for the exercise of their own judgment.
Any opinions expressed in this material are expressed as of this date and subject to change without
notice and General Shopping is not under the obligation to update or keep current the information
contained herein. General Shopping and the respective affiliates, directors, partners and employees
accept no liability whatsoever for any loss or damage of any kind arising out of the use of all or any part
of this material. You should consult with your own legal, regulatory, tax, business, investment, financial
and accounting advisers to the extent that you deem it necessary, and make your own investment,
hedging and trading decision (including decisions regarding the suitability of this transaction) based
upon your own judgment and advice from such advisers as you deem necessary and not upon any
views expressed in this material.
Disclaimer
2 2 2
Agenda
Sector Overview
Company Overview
Financial Performance
3 3
Sector Overview
4 4 4
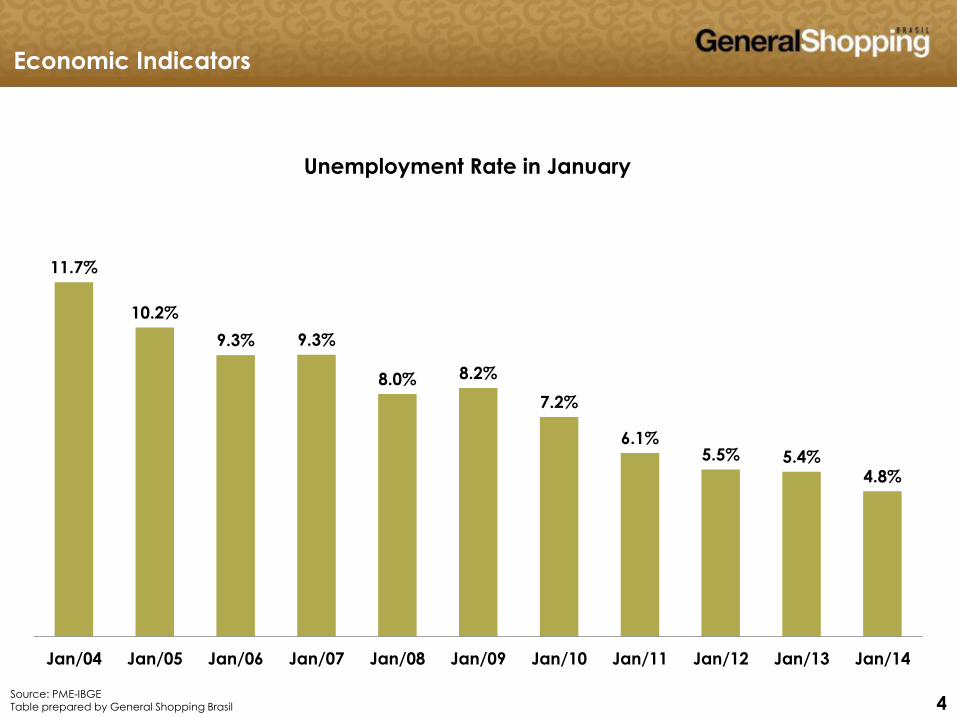
11.7%
10.2%
9.3% 9.3%
8.0% 8.2%
7.2%
6.1%5.5% 5.4%
4.8%
Jan/04 Jan/05 Jan/06 Jan/07 Jan/08 Jan/09 Jan/10 Jan/11 Jan/12 Jan/13 Jan/14
Unemployment Rate in January
Economic Indicators
Source: PME-IBGE Table prepared by General Shopping Brasil
5 5 5
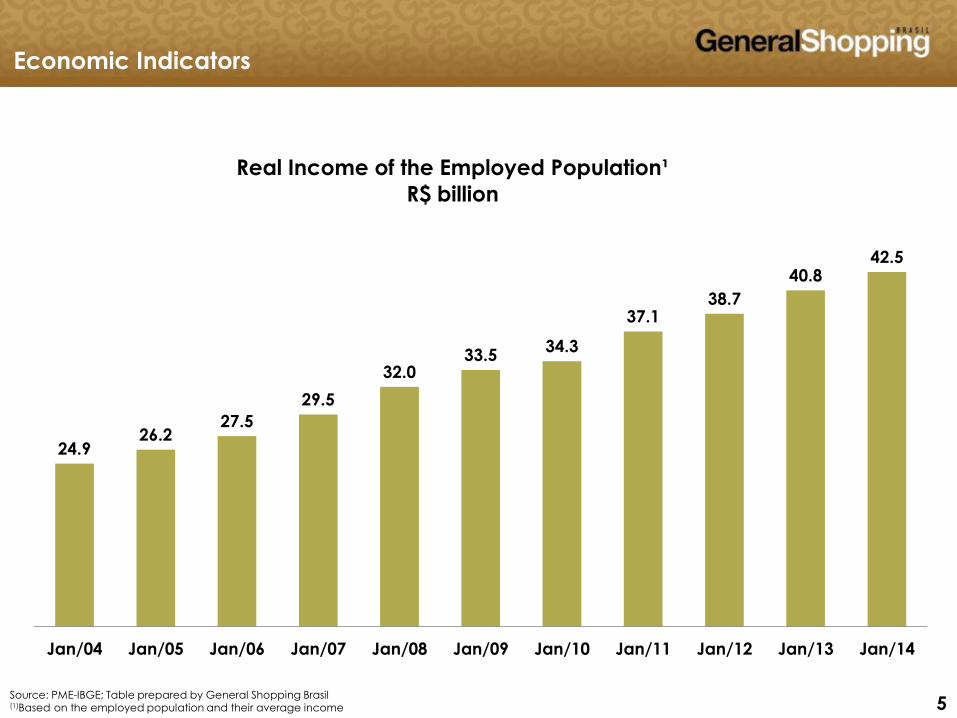
24.926.2
27.5
29.5
32.033.5
34.3
37.138.7
40.842.5
Jan/04 Jan/05 Jan/06 Jan/07 Jan/08 Jan/09 Jan/10 Jan/11 Jan/12 Jan/13 Jan/14
Real Income of the Employed Population¹
R$ billion
Economic Indicators
Source: PME-IBGE; Table prepared by General Shopping Brasil (1)Based on the employed population and their average income
6 6 6
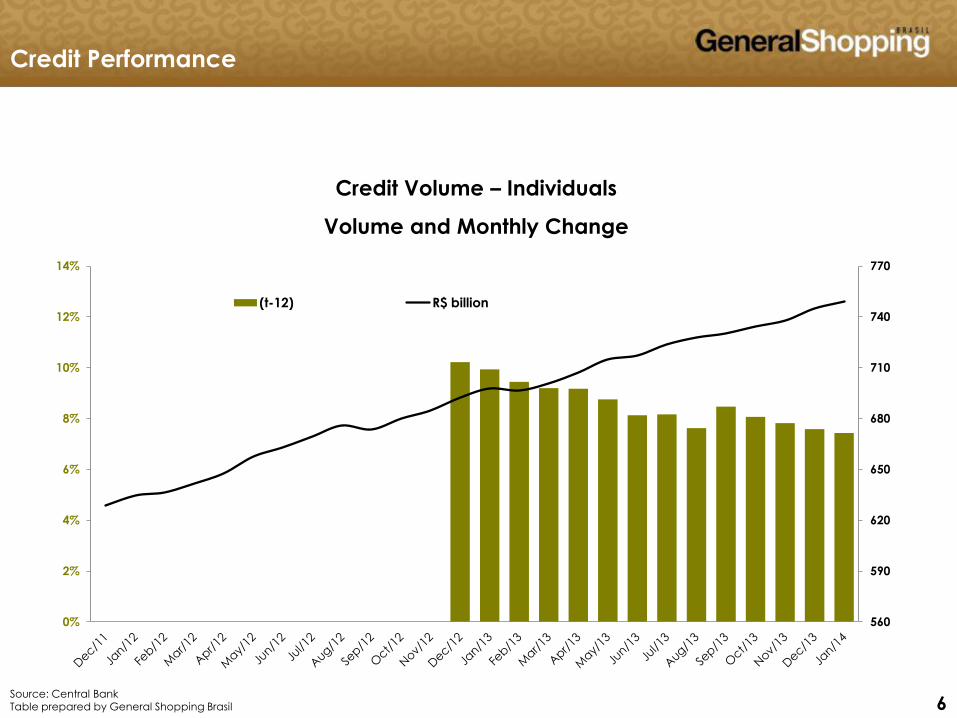
560
590
620
650
680
710
740
770
0%
2%
4%
6%
8%
10%
12%
14%
(t-12) R$ billion
Credit Performance
Credit Volume – Individuals
Volume and Monthly Change
Source: Central Bank Table prepared by General Shopping Brasil
7 7 7
6
7
8
9
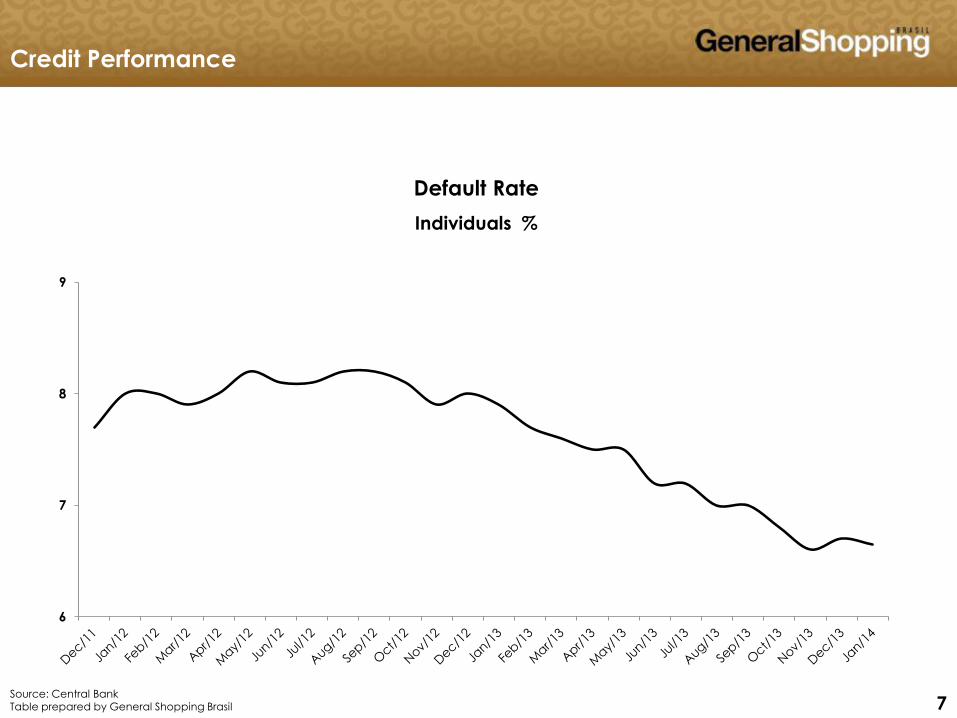
Default Rate
Individuals %
Credit Performance
Source: Central Bank Table prepared by General Shopping Brasil
8 8 8
100
105
110
115
120
125
130
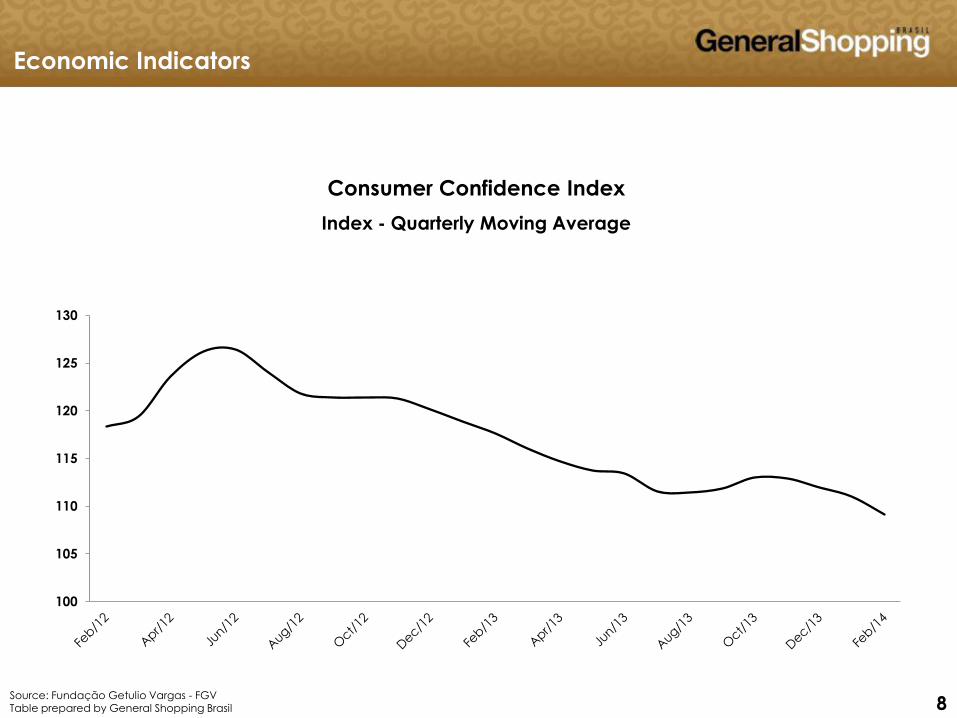
Economic Indicators
Consumer Confidence Index
Index - Quarterly Moving Average
Source: Fundação Getulio Vargas - FGV Table prepared by General Shopping Brasil
9 9 9
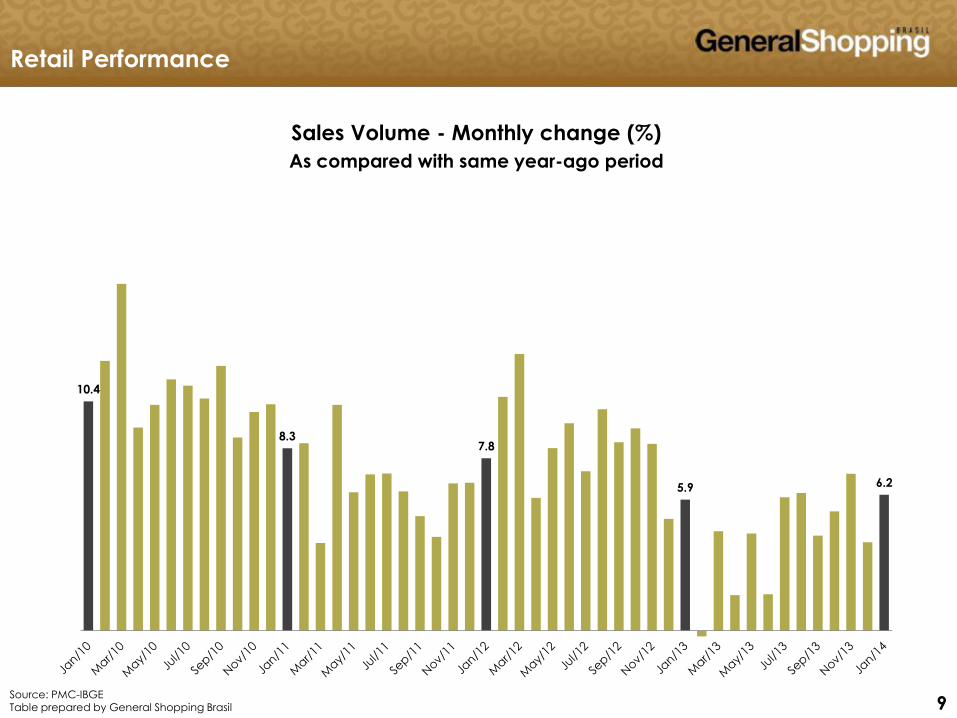
10.4
8.37.8
5.9 6.2
Retail Performance
Sales Volume - Monthly change (%)
As compared with same year-ago period
Source: PMC-IBGE Table prepared by General Shopping Brasil
10 10 10
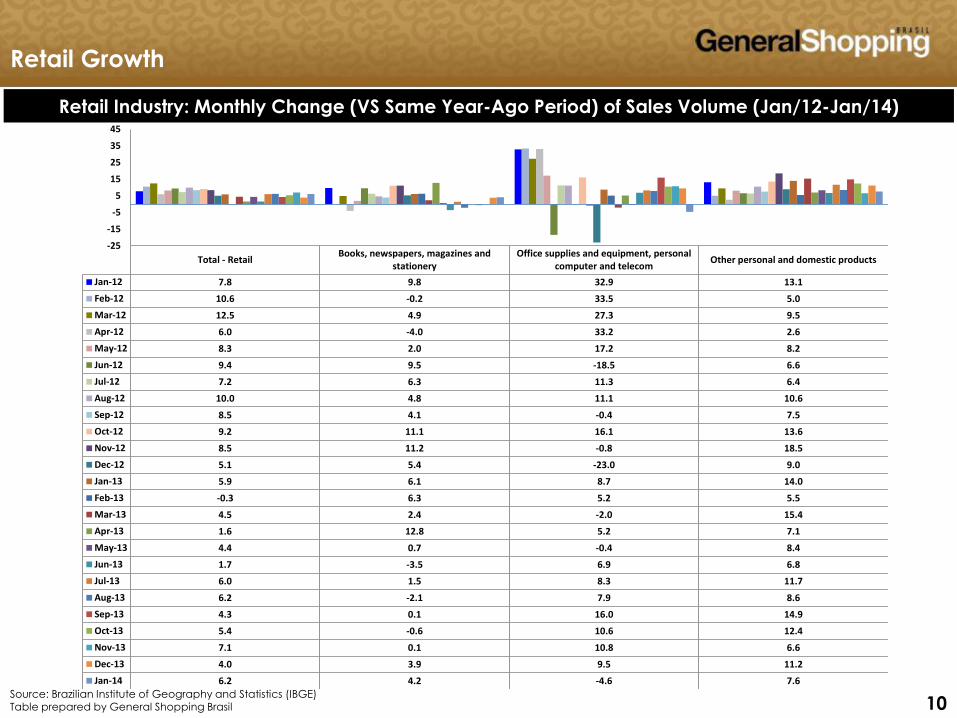
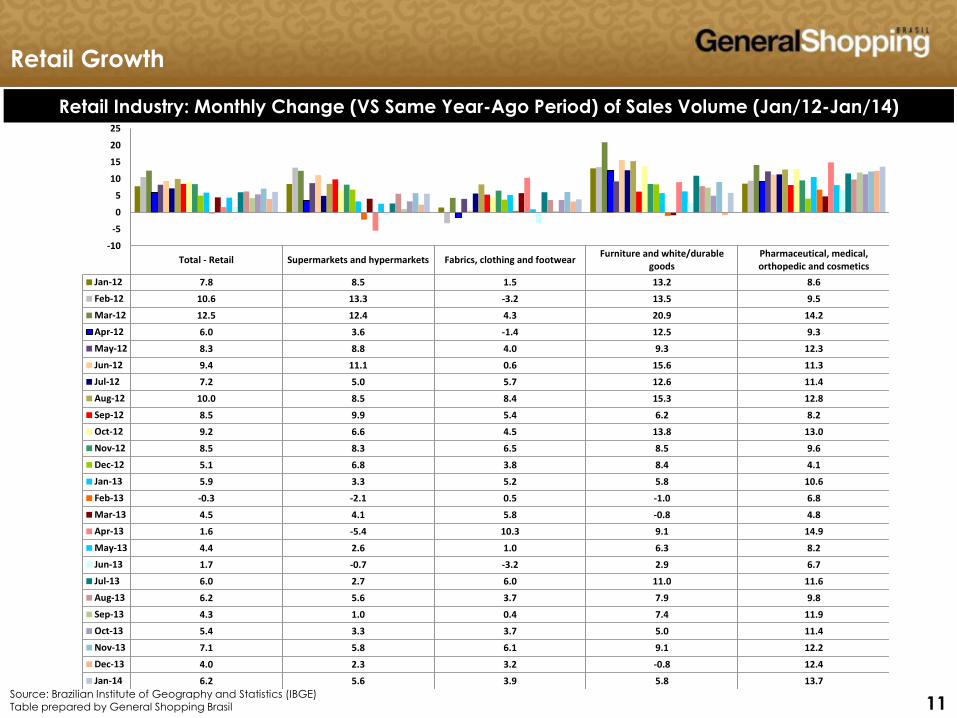
Retail Growth
Retail Industry: Monthly Change (VS Same Year-Ago Period) of Sales Volume (Jan/12-Jan/14)
Source: Brazilian Institute of Geography and Statistics (IBGE) Table prepared by General Shopping Brasil
Total - RetailBooks, newspapers, magazines and
stationeryOffice supplies and equipment, personal
computer and telecomOther personal and domestic products
Jan-12 7.8 9.8 32.9 13.1
Feb-12 10.6 -0.2 33.5 5.0
Mar-12 12.5 4.9 27.3 9.5
Apr-12 6.0 -4.0 33.2 2.6
May-12 8.3 2.0 17.2 8.2
Jun-12 9.4 9.5 -18.5 6.6
Jul-12 7.2 6.3 11.3 6.4
Aug-12 10.0 4.8 11.1 10.6
Sep-12 8.5 4.1 -0.4 7.5
Oct-12 9.2 11.1 16.1 13.6
Nov-12 8.5 11.2 -0.8 18.5
Dec-12 5.1 5.4 -23.0 9.0
Jan-13 5.9 6.1 8.7 14.0
Feb-13 -0.3 6.3 5.2 5.5
Mar-13 4.5 2.4 -2.0 15.4
Apr-13 1.6 12.8 5.2 7.1
May-13 4.4 0.7 -0.4 8.4
Jun-13 1.7 -3.5 6.9 6.8
Jul-13 6.0 1.5 8.3 11.7
Aug-13 6.2 -2.1 7.9 8.6
Sep-13 4.3 0.1 16.0 14.9
Oct-13 5.4 -0.6 10.6 12.4
Nov-13 7.1 0.1 10.8 6.6
Dec-13 4.0 3.9 9.5 11.2
Jan-14 6.2 4.2 -4.6 7.6
-25
-15
-5
5
15
25
35
45
11 11 11
Retail Growth
Retail Industry: Monthly Change (VS Same Year-Ago Period) of Sales Volume (Jan/12-Jan/14)
Source: Brazilian Institute of Geography and Statistics (IBGE) Table prepared by General Shopping Brasil
Total - Retail Supermarkets and hypermarkets Fabrics, clothing and footwearFurniture and white/durable
goodsPharmaceutical, medical,orthopedic and cosmetics
Jan-12 7.8 8.5 1.5 13.2 8.6
Feb-12 10.6 13.3 -3.2 13.5 9.5
Mar-12 12.5 12.4 4.3 20.9 14.2
Apr-12 6.0 3.6 -1.4 12.5 9.3
May-12 8.3 8.8 4.0 9.3 12.3
Jun-12 9.4 11.1 0.6 15.6 11.3
Jul-12 7.2 5.0 5.7 12.6 11.4
Aug-12 10.0 8.5 8.4 15.3 12.8
Sep-12 8.5 9.9 5.4 6.2 8.2
Oct-12 9.2 6.6 4.5 13.8 13.0
Nov-12 8.5 8.3 6.5 8.5 9.6
Dec-12 5.1 6.8 3.8 8.4 4.1
Jan-13 5.9 3.3 5.2 5.8 10.6
Feb-13 -0.3 -2.1 0.5 -1.0 6.8
Mar-13 4.5 4.1 5.8 -0.8 4.8
Apr-13 1.6 -5.4 10.3 9.1 14.9
May-13 4.4 2.6 1.0 6.3 8.2
Jun-13 1.7 -0.7 -3.2 2.9 6.7
Jul-13 6.0 2.7 6.0 11.0 11.6
Aug-13 6.2 5.6 3.7 7.9 9.8
Sep-13 4.3 1.0 0.4 7.4 11.9
Oct-13 5.4 3.3 3.7 5.0 11.4
Nov-13 7.1 5.8 6.1 9.1 12.2
Dec-13 4.0 2.3 3.2 -0.8 12.4
Jan-14 6.2 5.6 3.9 5.8 13.7
-10
-5
0
5
10
15
20
25
12 12
Company Overview
13 13 13
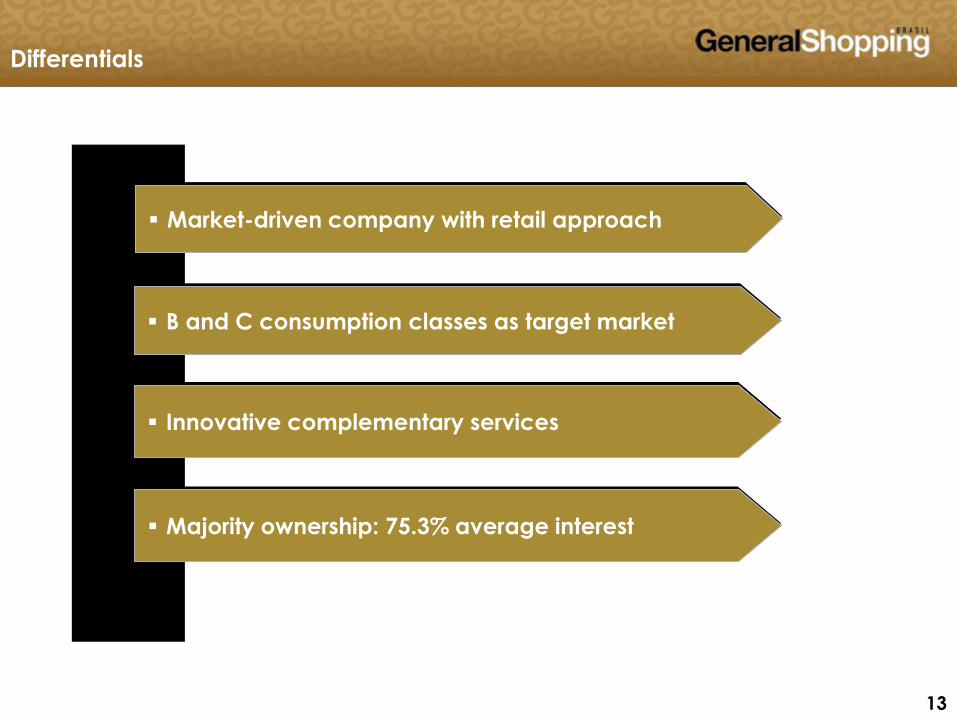
Market-driven company with retail approach
B and C consumption classes as target market
Innovative complementary services
Majority ownership: 75.3% average interest
Differentials
14 14 14
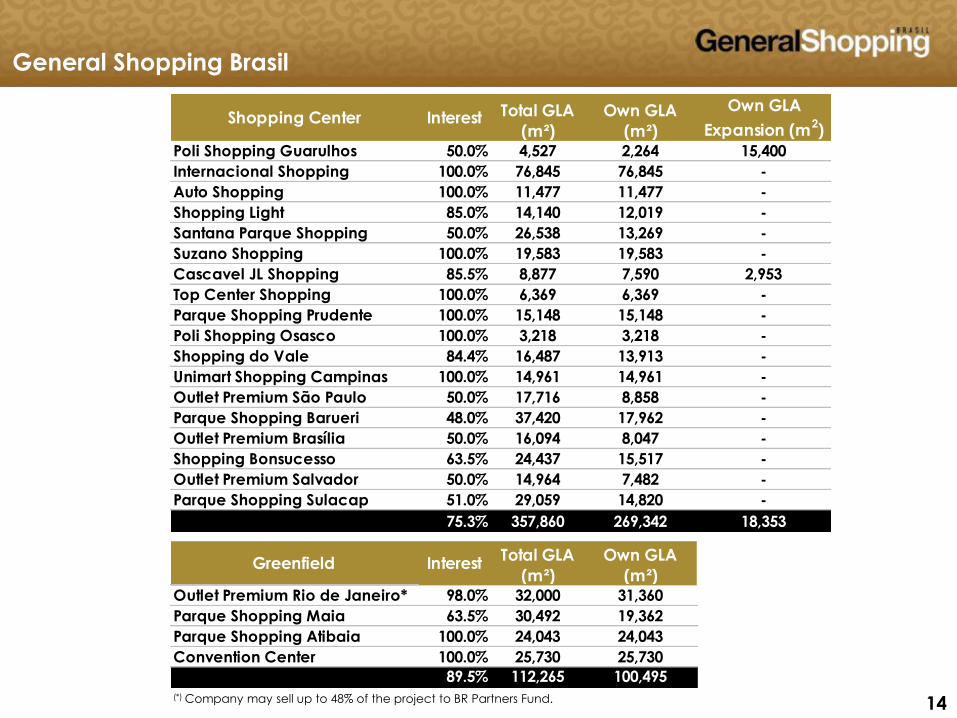
General Shopping Brasil
Poli Shopping Guarulhos 50.0% 4,527 2,264 15,400
Internacional Shopping 100.0% 76,845 76,845 -
Auto Shopping 100.0% 11,477 11,477 -
Shopping Light 85.0% 14,140 12,019 -
Santana Parque Shopping 50.0% 26,538 13,269 -
Suzano Shopping 100.0% 19,583 19,583 -
Cascavel JL Shopping 85.5% 8,877 7,590 2,953
Top Center Shopping 100.0% 6,369 6,369 -
Parque Shopping Prudente 100.0% 15,148 15,148 -
Poli Shopping Osasco 100.0% 3,218 3,218 -
Shopping do Vale 84.4% 16,487 13,913 -
Unimart Shopping Campinas 100.0% 14,961 14,961 -
Outlet Premium São Paulo 50.0% 17,716 8,858 -
Parque Shopping Barueri 48.0% 37,420 17,962 -
Outlet Premium Brasília 50.0% 16,094 8,047 -
Shopping Bonsucesso 63.5% 24,437 15,517 -
Outlet Premium Salvador 50.0% 14,964 7,482 -
Parque Shopping Sulacap 51.0% 29,059 14,820 -
75.3% 357,860 269,342 18,353
Outlet Premium Rio de Janeiro* 98.0% 32,000 31,360
Parque Shopping Maia 63.5% 30,492 19,362
Parque Shopping Atibaia 100.0% 24,043 24,043
Convention Center 100.0% 25,730 25,730
89.5% 112,265 100,495
Greenfield InterestTotal GLA
(m²)
Own GLA
(m²)
Shopping Center Interest Total GLA
(m²)
Own GLA
(m²)
Own GLA
Expansion (m2)
(*) Company may sell up to 48% of the project to BR Partners Fund.
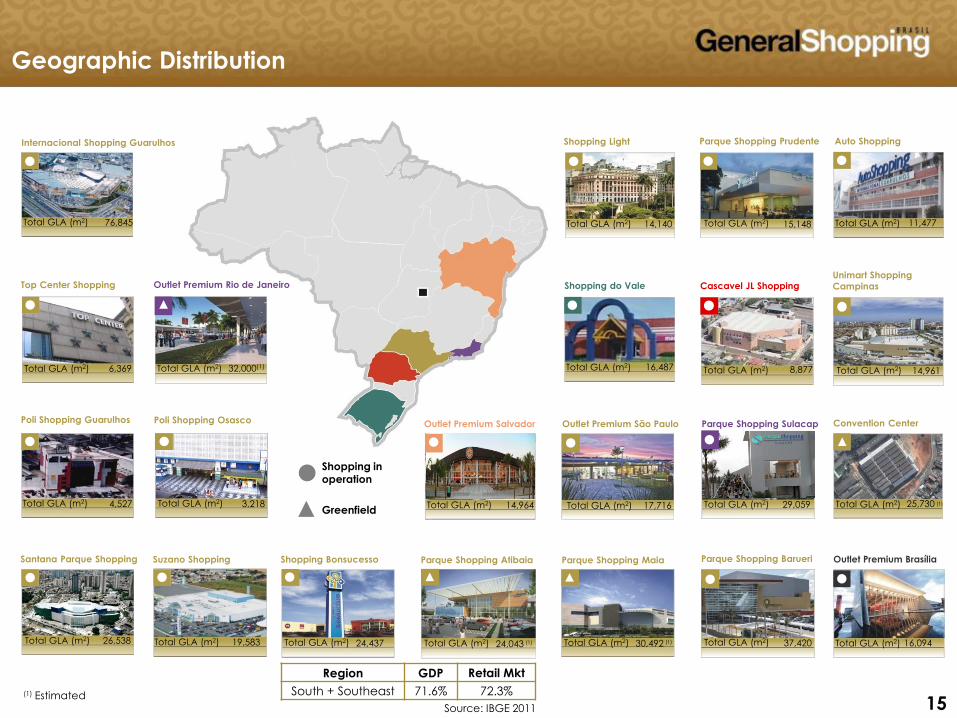
15 15 15
Top Center Shopping
Internacional Shopping Guarulhos
Poli Shopping Guarulhos
Santana Parque Shopping
Poli Shopping Osasco
Suzano Shopping
Shopping Light
Shopping do Vale
Parque Shopping Prudente Auto Shopping
Outlet Premium São Paulo Convention Center
Greenfield
Shopping in operation
25,730
Total GLA (m2)
16,487
Total GLA (m2)
Cascavel JL Shopping Unimart Shopping
Campinas
8,877
Total GLA (m2)
8
15,148
Total GLA (m2)
Total GLA (m2)
11,477
76,845 Total GLA (m2)
6,369
Total GLA (m2)
4,527
Total GLA (m2)
3,218
Total GLA (m2)
26,538
Total GLA (m2)
19,583
Total GLA (m2)
Outlet Premium Brasília
16,094
Total GLA (m2)
(1) Estimated Source: IBGE 2011
Parque Shopping Maia
30,492
(1) Total GLA (m2)
Parque Shopping Barueri
(1)
Region GDP Retail Mkt
South + Southeast 71.6% 72.3%
Parque Shopping Atibaia Shopping Bonsucesso
24,437
Total GLA (m2)
Geographic Distribution
Outlet Premium Rio de Janeiro
32,000(1)
Total GLA (m2)
(1) 24,043
Total GLA (m2)
14,961 Total GLA (m2)
37,420
Total GLA (m2)
Parque Shopping Sulacap
29,059
Total GLA (m2)
14,140
Total GLA (m2)
17,716
Total GLA (m2)
Outlet Premium Salvador
14,964
Total GLA (m2)
16 16 16
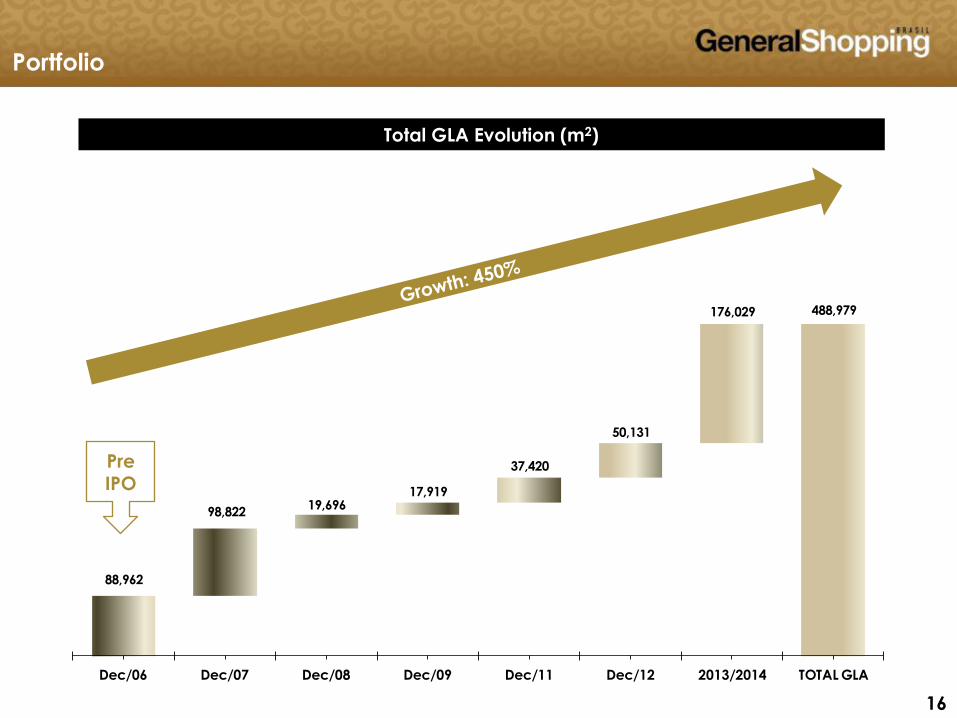
88,962
98,82219,696
17,919
37,420
50,131
176,029 488,979
Dec/06 Dec/07 Dec/08 Dec/09 Dec/11 Dec/12 2013/2014 TOTAL GLA
Total GLA Evolution (m2)
Portfolio
Pre IPO
17 17 17
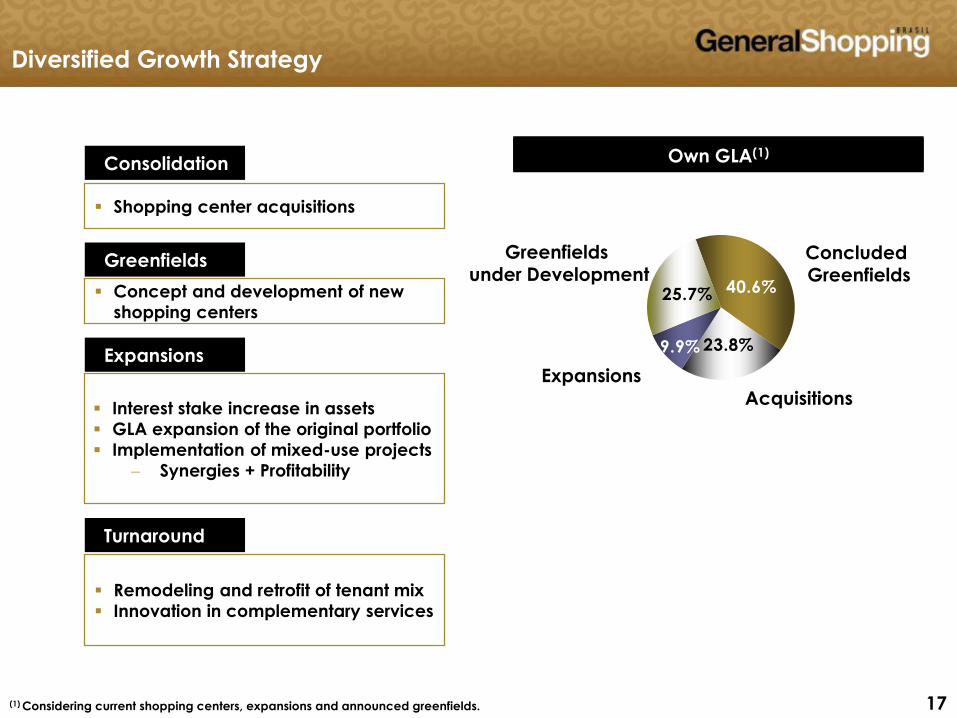
Diversified Growth Strategy
Consolidation
Shopping center acquisitions
Greenfields
Concept and development of new
shopping centers
Expansions
Interest stake increase in assets
GLA expansion of the original portfolio
Implementation of mixed-use projects
Synergies + Profitability
Turnaround
Remodeling and retrofit of tenant mix
Innovation in complementary services
(1) Considering current shopping centers, expansions and announced greenfields.
Concluded Greenfields
Acquisitions
Expansions
Greenfields under Development
Own GLA(1) Own GLA(1)
40.6%
23.8%9.9%
25.7%
18 18 18
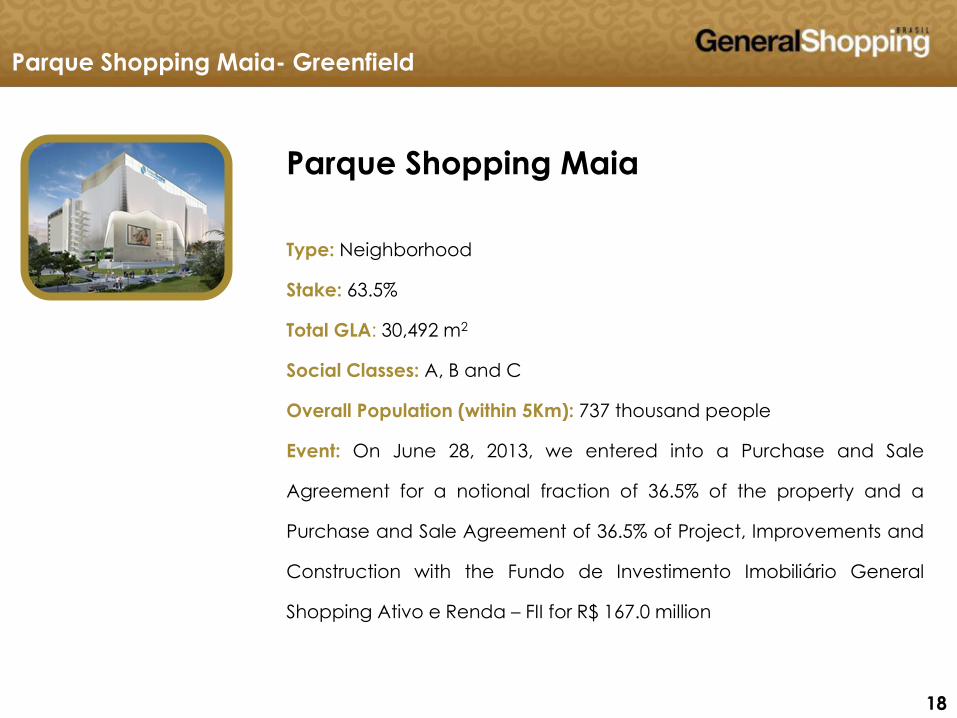
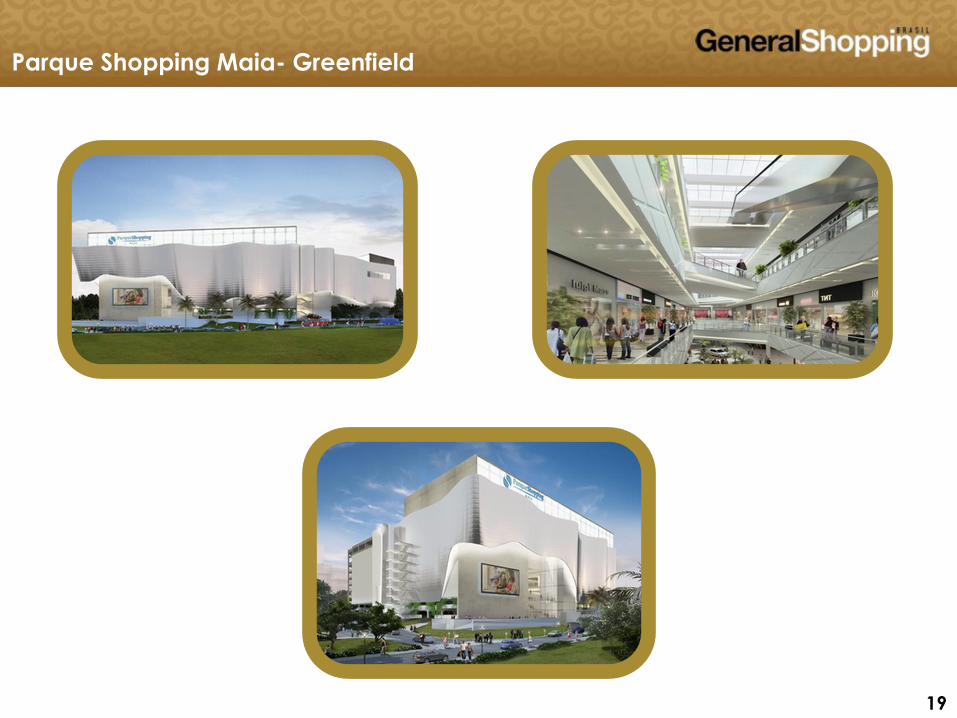
Parque Shopping Maia- Greenfield
Parque Shopping Maia
Type: Neighborhood
Stake: 63.5%
Total GLA: 30,492 m2
Social Classes: A, B and C
Overall Population (within 5Km): 737 thousand people
Event: On June 28, 2013, we entered into a Purchase and Sale
Agreement for a notional fraction of 36.5% of the property and a
Purchase and Sale Agreement of 36.5% of Project, Improvements and
Construction with the Fundo de Investimento Imobiliário General
Shopping Ativo e Renda – FII for R$ 167.0 million
19 19 19
Parque Shopping Maia- Greenfield
20 20 20
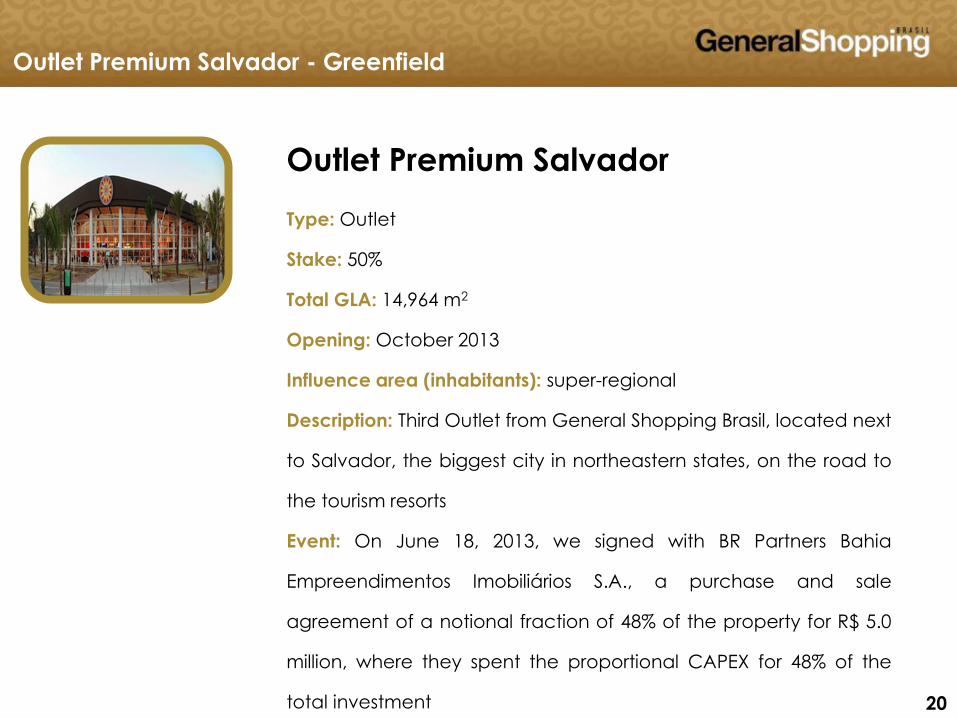
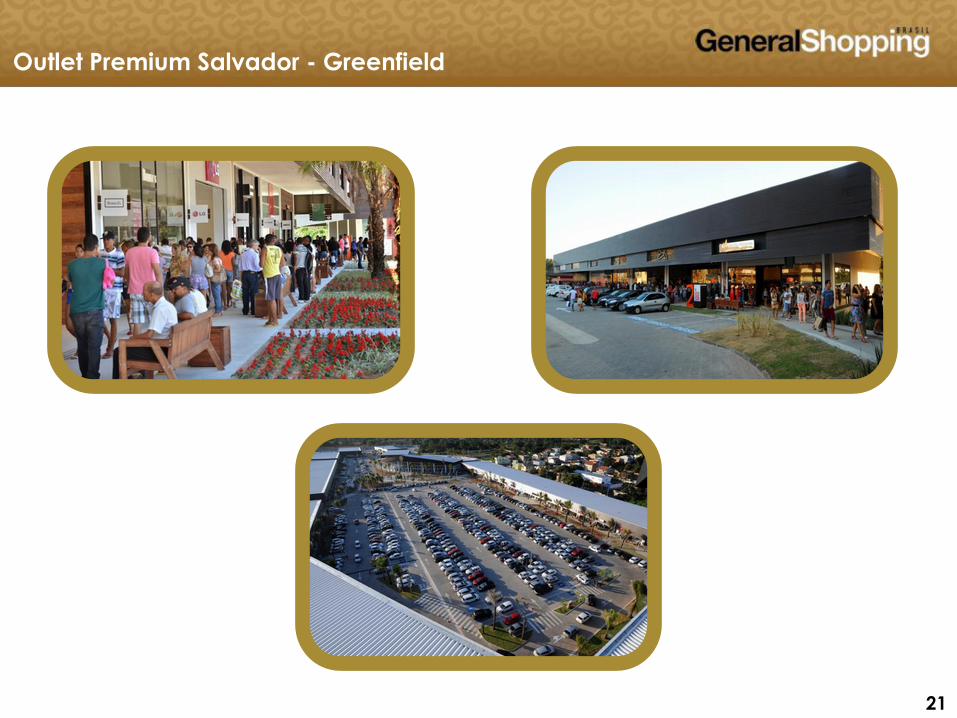
Outlet Premium Salvador
Type: Outlet
Stake: 50%
Total GLA: 14,964 m2
Opening: October 2013
Influence area (inhabitants): super-regional
Description: Third Outlet from General Shopping Brasil, located next
to Salvador, the biggest city in northeastern states, on the road to
the tourism resorts
Event: On June 18, 2013, we signed with BR Partners Bahia
Empreendimentos Imobiliários S.A., a purchase and sale
agreement of a notional fraction of 48% of the property for R$ 5.0
million, where they spent the proportional CAPEX for 48% of the
total investment
Outlet Premium Salvador - Greenfield
21 21 21
Outlet Premium Salvador - Greenfield
22 22 22
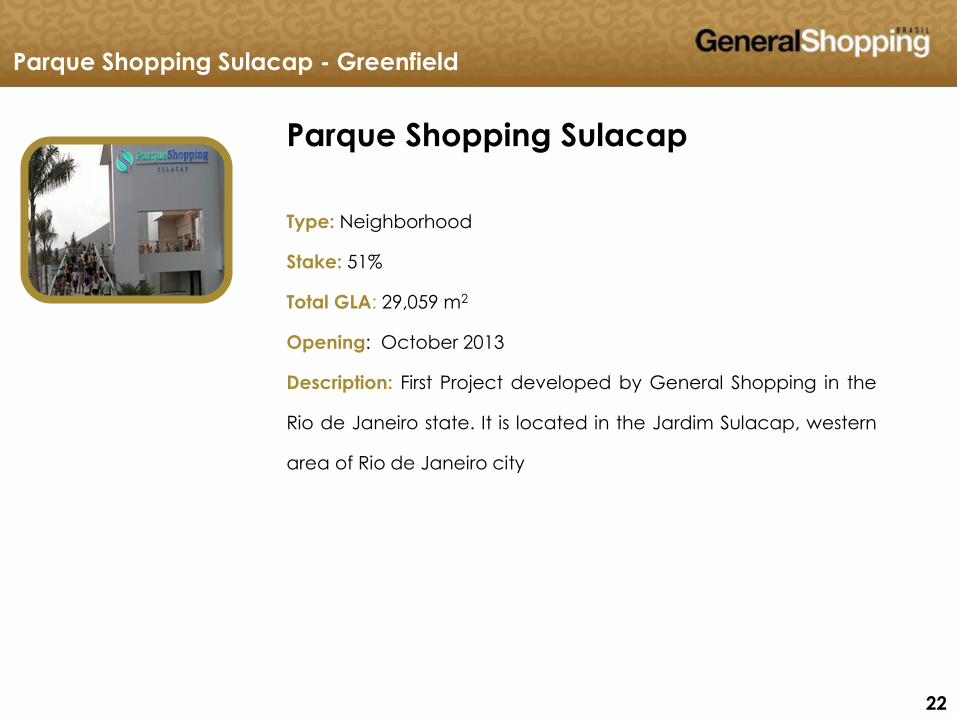
Parque Shopping Sulacap
Type: Neighborhood
Stake: 51%
Total GLA: 29,059 m2
Opening: October 2013
Description: First Project developed by General Shopping in the
Rio de Janeiro state. It is located in the Jardim Sulacap, western
area of Rio de Janeiro city
Parque Shopping Sulacap - Greenfield
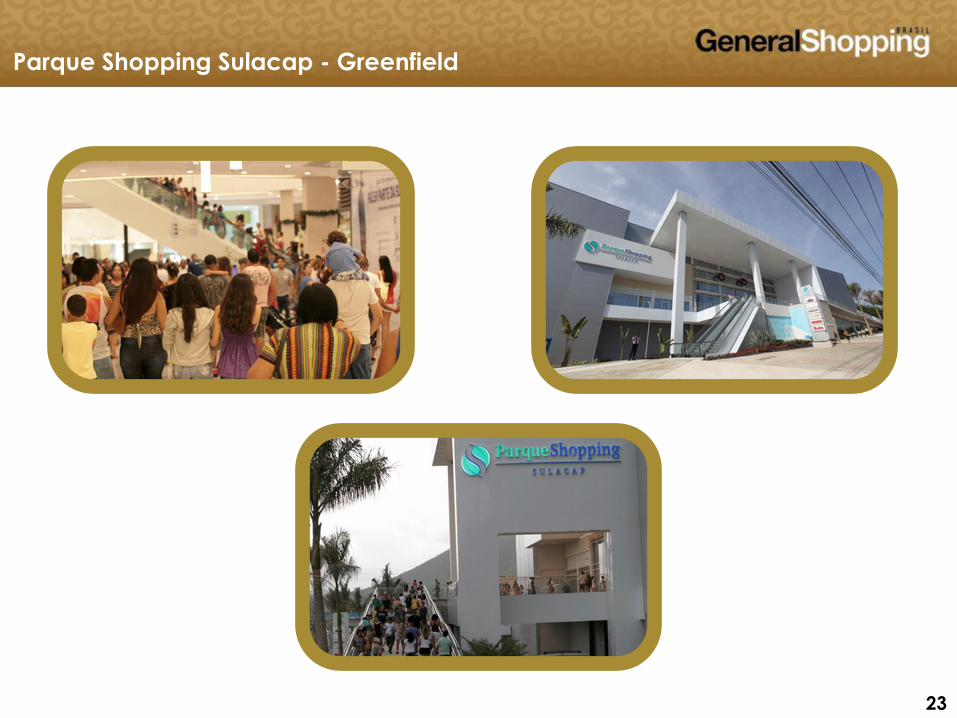
23 23 23
Parque Shopping Sulacap - Greenfield
24 24 24
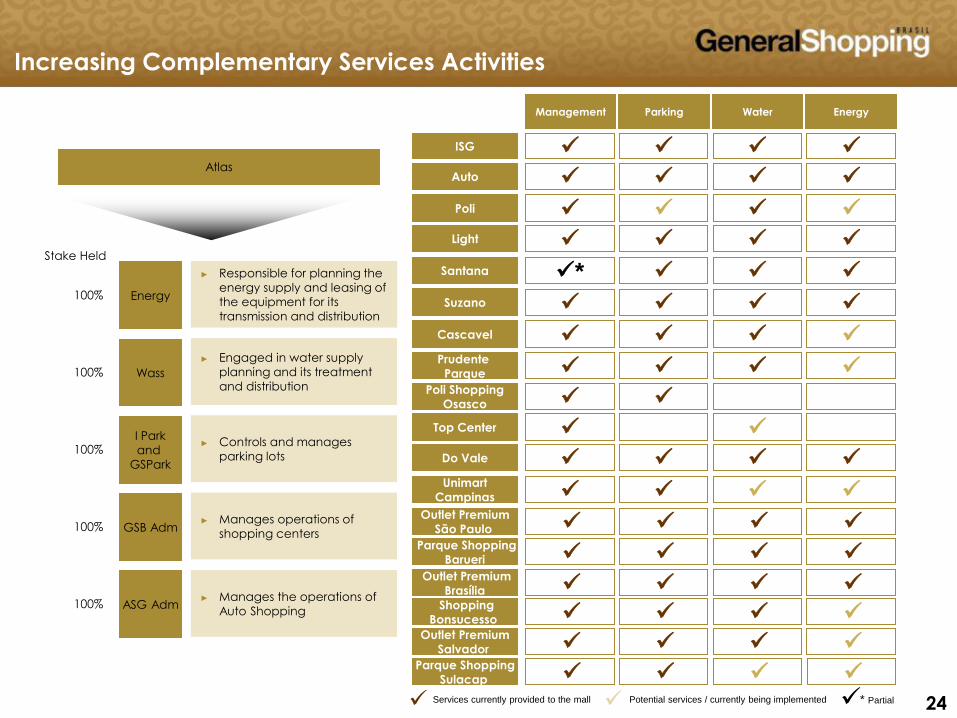
ISG
Auto
Poli
Light
Santana *
Cascavel
Prudente
Parque
Poli Shopping
Osasco
Top Center
Do Vale
Unimart
Campinas
Suzano
Outlet Premium
São Paulo
Parque Shopping
Barueri
Outlet Premium
Brasília
Shopping
Bonsucesso
Outlet Premium
Salvador
Parque Shopping
Sulacap
Atlas
Energy
Wass
I Park
and
GSPark
GSB Adm
ASG Adm
Stake Held
100%
100%
100%
100%
100%
► Responsible for planning the
energy supply and leasing of
the equipment for its
transmission and distribution
► Engaged in water supply
planning and its treatment
and distribution
► Controls and manages
parking lots
► Manages operations of
shopping centers
► Manages the operations of
Auto Shopping
Management Parking Water Energy
Services currently provided to the mall Potential services / currently being implemented * Partial
Increasing Complementary Services Activities
25 25 25
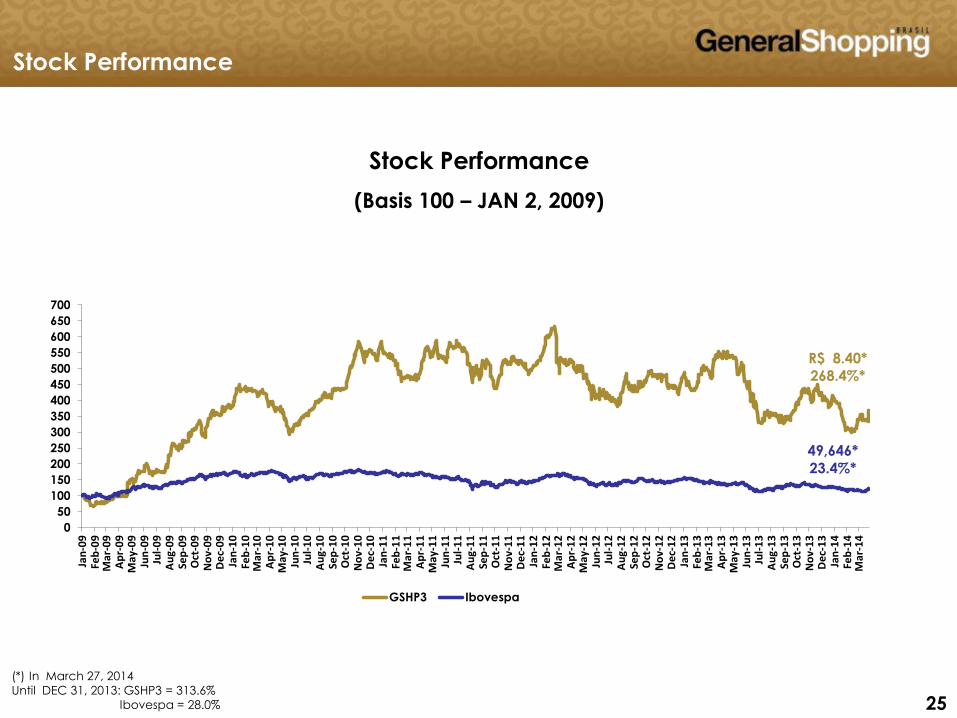
Stock Performance
(Basis 100 – JAN 2, 2009)
(*) In March 27, 2014
Until DEC 31, 2013: GSHP3 = 313.6%
Ibovespa = 28.0%
Stock Performance
R$ 8.40*
268.4%*
49,646*
23.4%*
0
50
100
150
200
250
300
350
400
450
500
550
600
650
700
Jan
-09
Feb
-09
Mar
-09
Ap
r-0
9M
ay-0
9Ju
n-0
9Ju
l-0
9A
ug-
09
Sep
-09
Oct
-09
No
v-0
9D
ec-
09
Jan
-10
Feb
-10
Mar
-10
Ap
r-1
0M
ay-1
0Ju
n-1
0Ju
l-1
0A
ug-
10
Sep
-10
Oct
-10
No
v-1
0D
ec-
10
Jan
-11
Feb
-11
Mar
-11
Ap
r-1
1M
ay-1
1Ju
n-1
1Ju
l-1
1A
ug-
11
Sep
-11
Oct
-11
No
v-1
1D
ec-
11
Jan
-12
Feb
-12
Mar
-12
Ap
r-1
2M
ay-1
2Ju
n-1
2Ju
l-1
2A
ug-
12
Sep
-12
Oct
-12
No
v-1
2D
ec-
12
Jan
-13
Feb
-13
Mar
-13
Ap
r-1
3M
ay-1
3Ju
n-1
3Ju
l-1
3A
ug-
13
Sep
-13
Oct
-13
No
v-1
3D
ec-
13
Jan
-14
Feb
-14
Mar
-14
GSHP3 Ibovespa
26 26 26
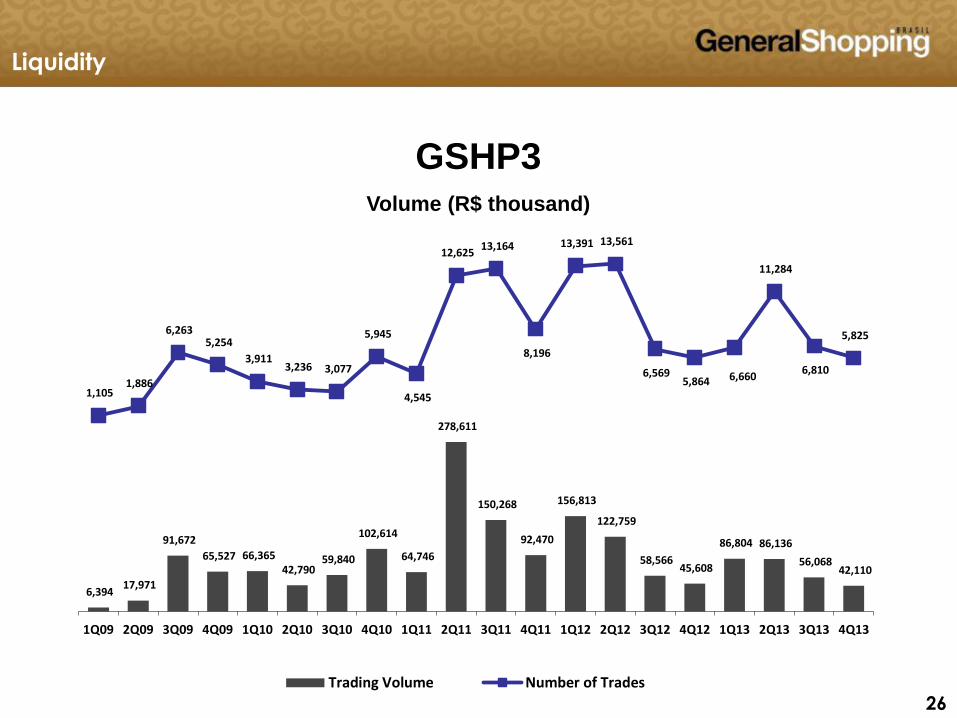
GSHP3 Volume (R$ thousand)
Liquidity
6,394 17,971
91,672
65,527 66,365 42,790
59,840
102,614
64,746
278,611
150,268
92,470
156,813
122,759
58,566 45,608
86,804 86,136
56,068 42,110
1,105 1,886
6,263 5,254
3,911 3,236 3,077
5,945
4,545
12,625 13,164
8,196
13,391 13,561
6,569 5,864 6,660
11,284
6,810
5,825
1Q09 2Q09 3Q09 4Q09 1Q10 2Q10 3Q10 4Q10 1Q11 2Q11 3Q11 4Q11 1Q12 2Q12 3Q12 4Q12 1Q13 2Q13 3Q13 4Q13
Trading Volume Number of Trades
27 27 27
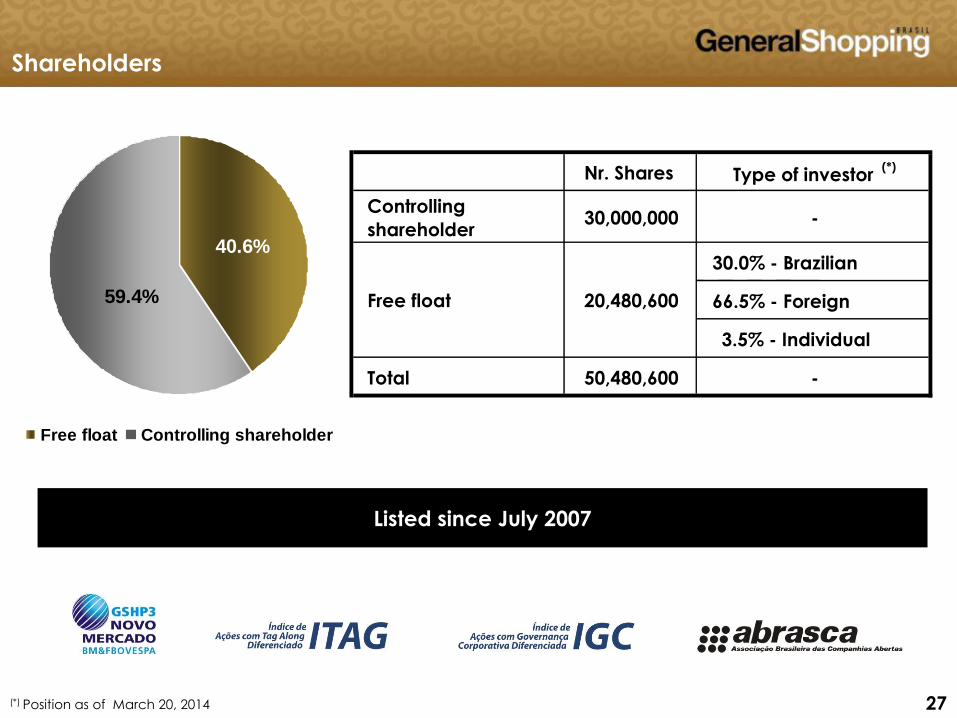
Shareholders
(*) Position as of March 20, 2014
59.4%
40.6%
Free float Controlling shareholder
Nr. Shares Type of investor (*)
Controlling
shareholder 30,000,000 -
30.0% - Brazilian
66.5% - Foreign
3.5% - Individual
Total 50,480,600 -
Free float 20,480,600
Listed since July 2007

28 28
Financial Performance
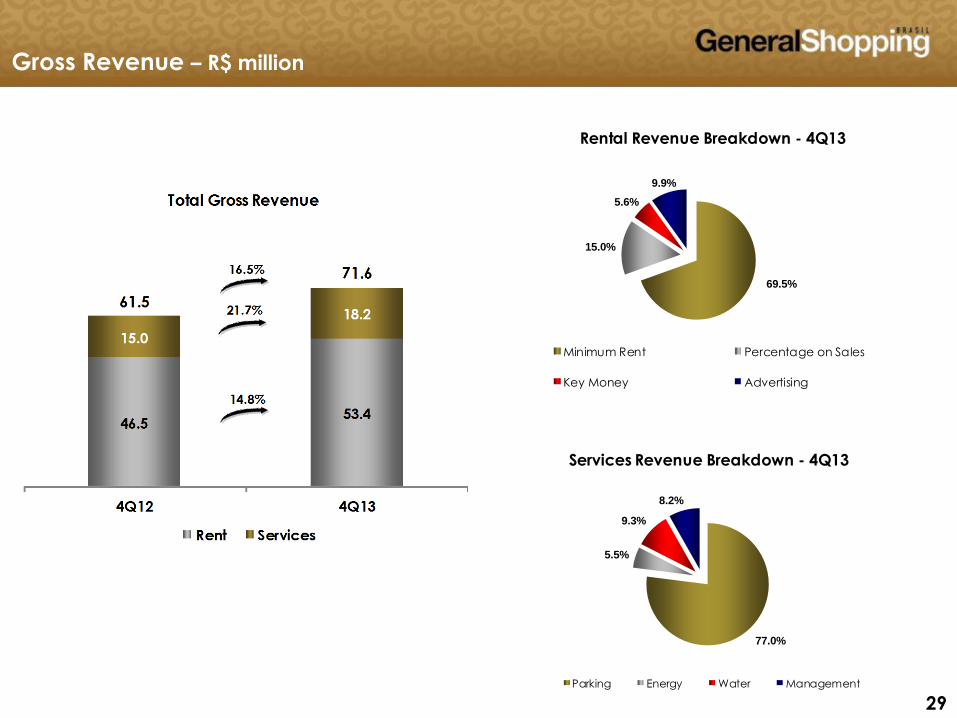
29 29 29
Services Revenue Breakdown - 4Q13
77.0%
5.5%
9.3%
8.2%
Parking Energy Water Management
Rental Revenue Breakdown - 4Q13
69.5%
15.0%
5.6%
9.9%
Minimum Rent Percentage on Sales
Key Money Advertising
Gross Revenue – R$ million
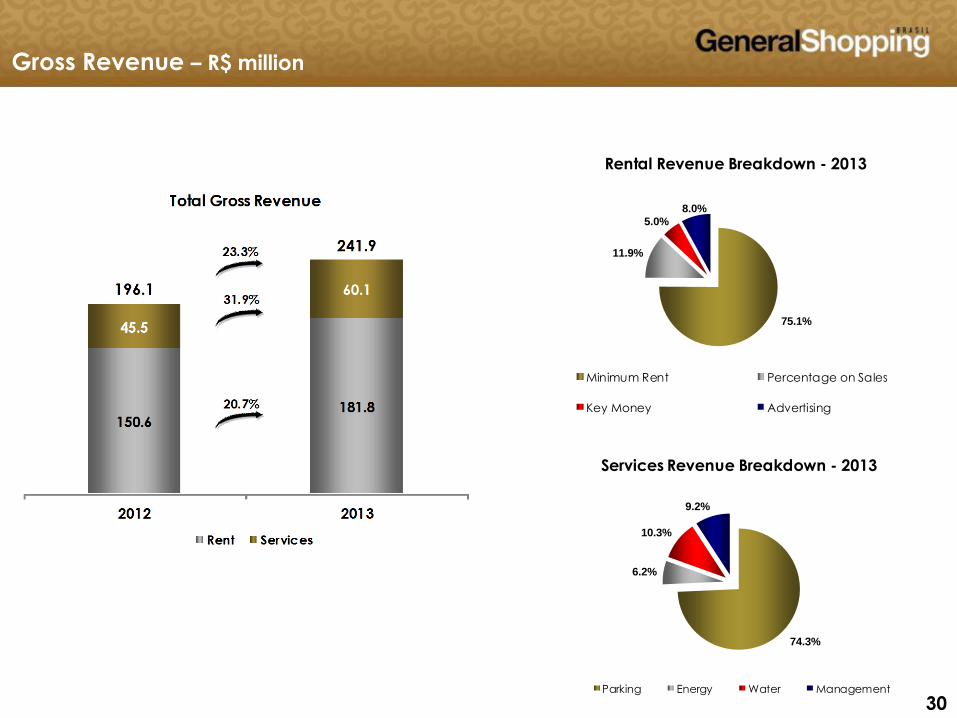
30 30 30
Rental Revenue Breakdown - 2013
75.1%
11.9%
5.0%
8.0%
Minimum Rent Percentage on Sales
Key Money Advertising
Gross Revenue – R$ million
Services Revenue Breakdown - 2013
74.3%
6.2%
10.3%
9.2%
Parking Energy Water Management
31 31 31
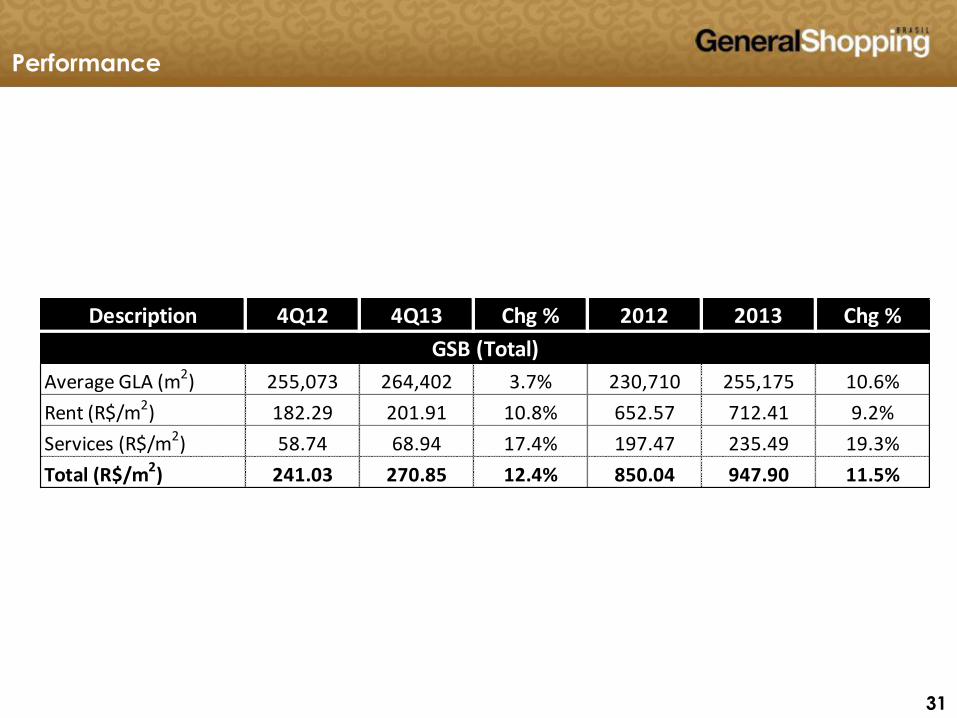
Performance
Description 4Q12 4Q13 Chg % 2012 2013 Chg %
Average GLA (m2) 255,073 264,402 3.7% 230,710 255,175 10.6%
Rent (R$/m2) 182.29 201.91 10.8% 652.57 712.41 9.2%
Services (R$/m2) 58.74 68.94 17.4% 197.47 235.49 19.3%
Total (R$/m2) 241.03 270.85 12.4% 850.04 947.90 11.5%
GSB (Total)
32 32 32
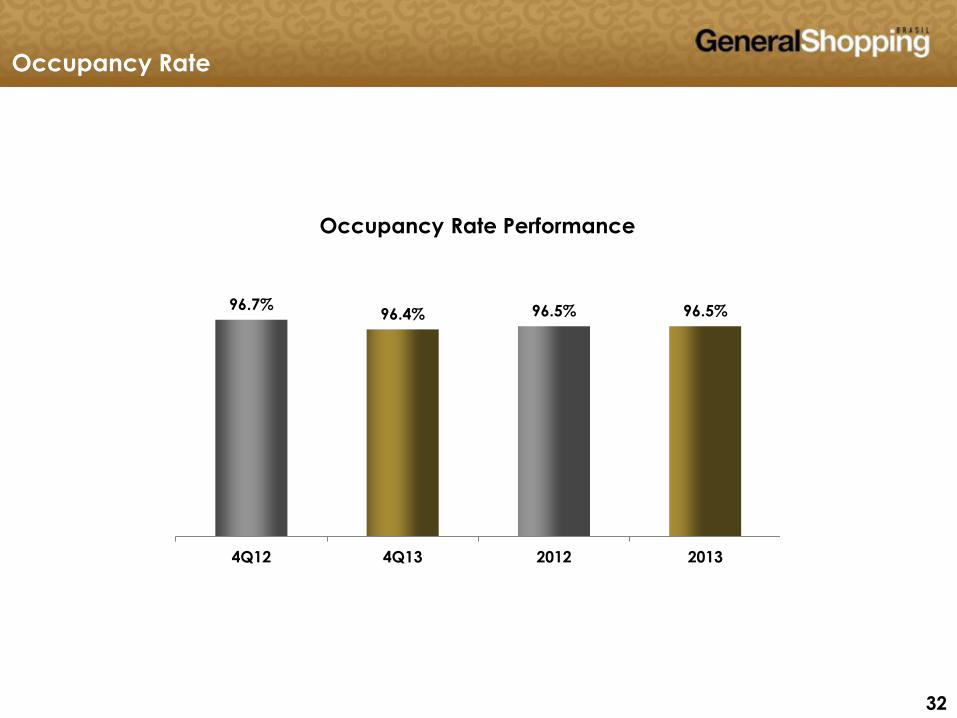
Occupancy Rate
Occupancy Rate Performance
96.7%96.4% 96.5% 96.5%
4Q12 4Q13 2012 2013
33 33 33
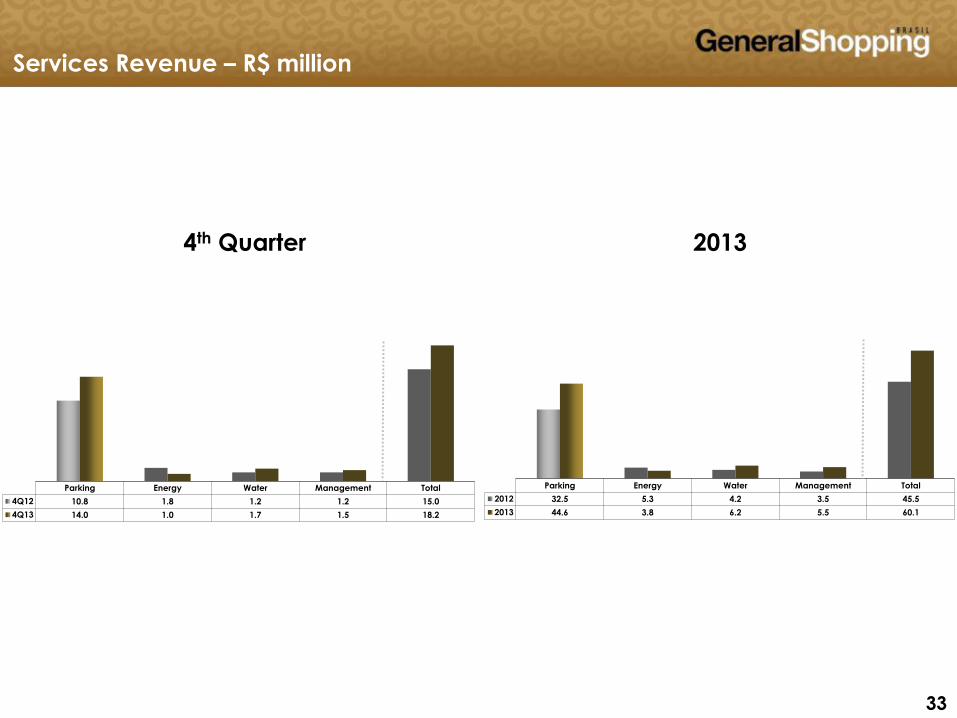
Parking Energy Water Management Total
2012 32.5 5.3 4.2 3.5 45.5
2013 44.6 3.8 6.2 5.5 60.1
4th Quarter 2013
Services Revenue – R$ million
Parking Energy Water Management Total
4Q12 10.8 1.8 1.2 1.2 15.0
4Q13 14.0 1.0 1.7 1.5 18.2
34 34 34
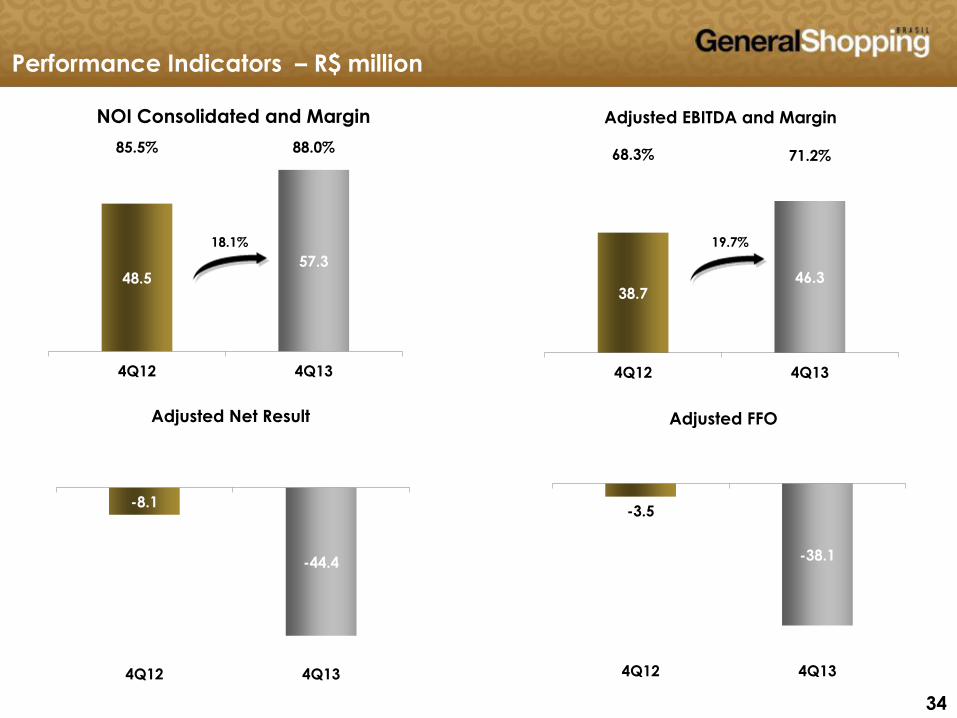
-3.5
-38.1
4Q12 4Q13
Adjusted FFO
-8.1
-44.4
4Q12 4Q13
Adjusted Net Result
38.746.3
68.3% 71.2%
4Q12 4Q13
Adjusted EBITDA and Margin
48.557.3
85.5% 88.0%
4Q12 4Q13
NOI Consolidated and Margin
18.1% 19.7%
Performance Indicators – R$ million
35 35 35
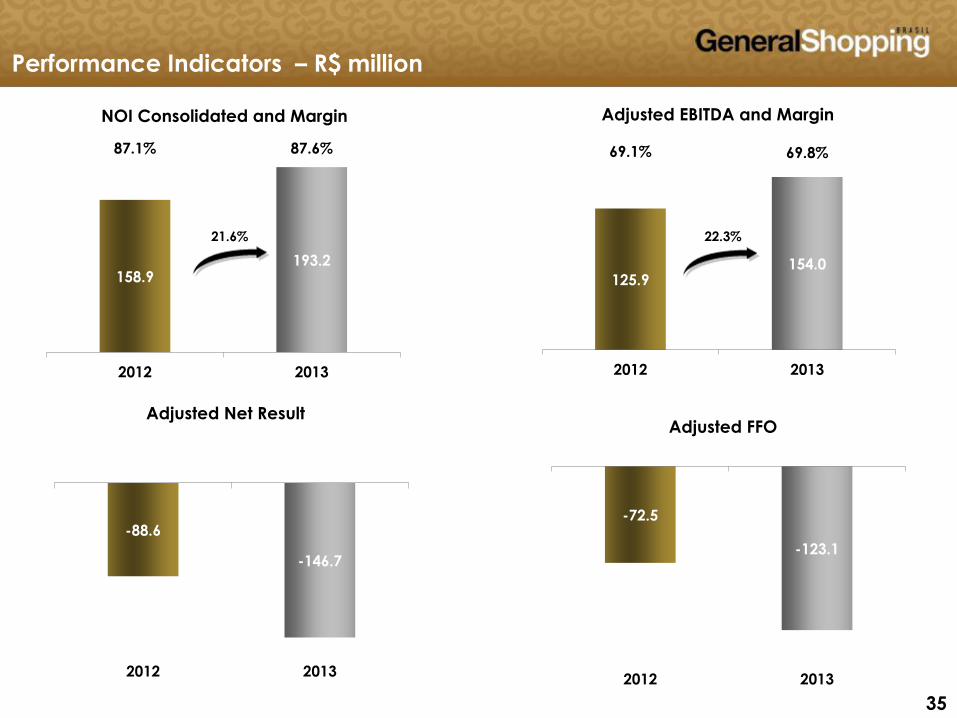
125.9154.0
69.1% 69.8%
2012 2013
Adjusted EBITDA and Margin
-72.5
-123.1
2012 2013
Adjusted FFO
-88.6
-146.7
2012 2013
Adjusted Net Result
158.9193.2
87.1% 87.6%
2012 2013
NOI Consolidated and Margin
21.6% 22.3%
Performance Indicators – R$ million
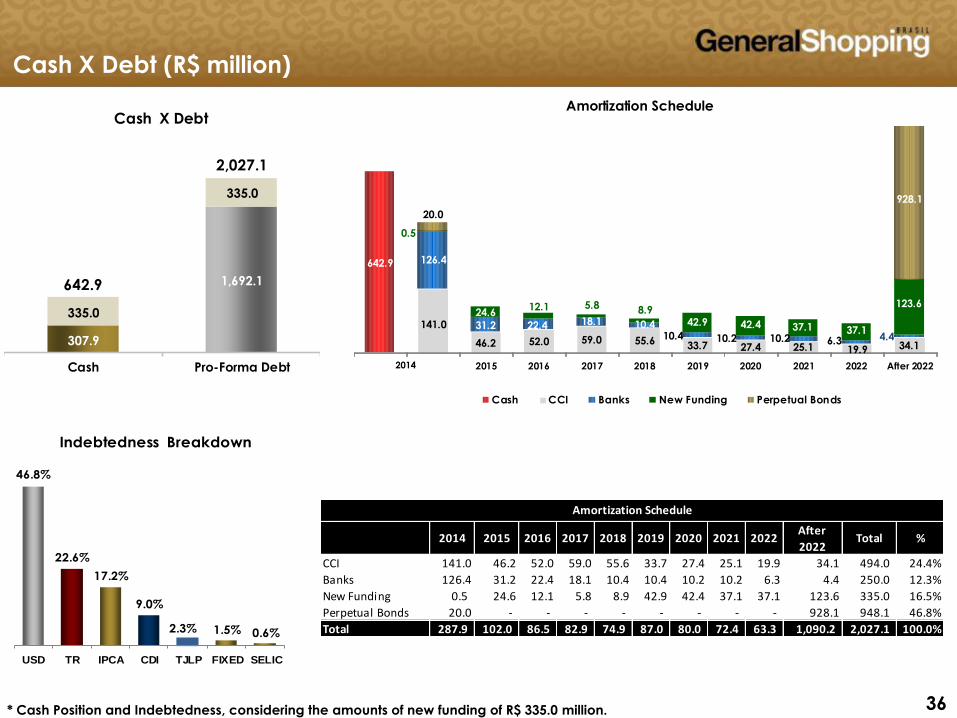
36 36 36
Amortization Schedule
642.9
141.0
46.2 52.0 59.0 55.6 33.7 27.4 25.1 19.9 34.1
126.4
31.2 22.4 18.1 10.410.4 10.2 10.2 6.3 4.4
24.612.1 5.8 8.9
42.9 42.4 37.1 37.1
123.6
20.0
2015 2016 2017 2018 2019 2020 2021 2022 After 2022
Cash CCI Banks New Funding Perpetual Bonds
0.5
928.1
Cash X Debt (R$ million)
2014
642.9
2,027.1
335.0
335.0
307.9
1,692.1
Cash Pro-Forma Debt
Cash X Debt
46.8%
22.6%
17.2%
9.0%
2.3% 1.5% 0.6%
USD TR IPCA CDI TJLP FIXED SELIC
Indebtedness Breakdown
* Cash Position and Indebtedness, considering the amounts of new funding of R$ 335.0 million.
2014 2015 2016 2017 2018 2019 2020 2021 2022After
2022Total %
CCI 141.0 46.2 52.0 59.0 55.6 33.7 27.4 25.1 19.9 34.1 494.0 24.4%
Banks 126.4 31.2 22.4 18.1 10.4 10.4 10.2 10.2 6.3 4.4 250.0 12.3%
New Funding 0.5 24.6 12.1 5.8 8.9 42.9 42.4 37.1 37.1 123.6 335.0 16.5%
Perpetual Bonds 20.0 - - - - - - - - 928.1 948.1 46.8%
Total 287.9 102.0 86.5 82.9 74.9 87.0 80.0 72.4 63.3 1,090.2 2,027.1 100.0%
Amortization Schedule
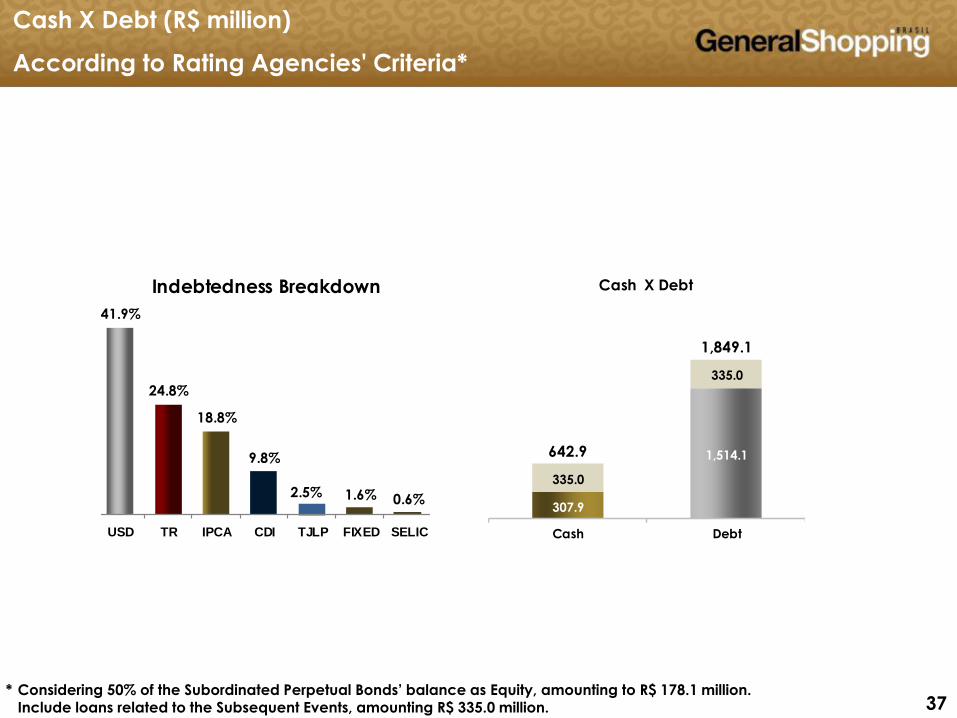
37 37 37
41.9%
24.8%
18.8%
9.8%
2.5% 1.6% 0.6%
USD TR IPCA CDI TJLP FIXED SELIC
Indebtedness Breakdown
Cash X Debt (R$ million)
According to Rating Agencies' Criteria*
307.9
1,514.1
335.0
335.0
642.9
1,849.1
Cash Debt
Cash X Debt
* Considering 50% of the Subordinated Perpetual Bonds’ balance as Equity, amounting to R$ 178.1 million. Include loans related to the Subsequent Events, amounting R$ 335.0 million.
38 38 38
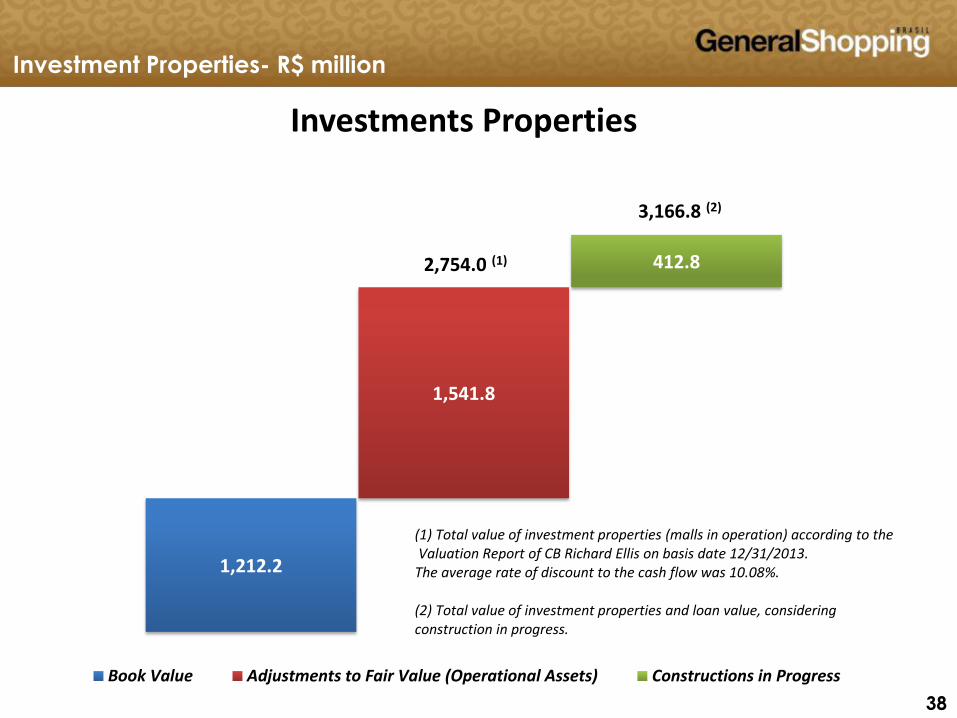
Investment Properties- R$ million
1,212.2
1,541.8
412.8
Investments Properties
Book Value Adjustments to Fair Value (Operational Assets) Constructions in Progress
2,754.0 (1)
3,166.8 (2)
(1) Total value of investment properties (malls in operation) according to theValuation Report of CB Richard Ellis on basis date 12/31/2013.
The average rate of discount to the cash flow was 10.08%.
(2) Total value of investment properties and loan value, considering construction in progress.
39 39 39
GSB INVESTOR RELATIONS
Alessandro Poli Veronezi
IR Officer
Marcio Snioka IR Superintendent
Rodrigo Lepski Lopes IR Analyst
55 11 3159-5100
www.generalshopping.com.br
Contacts