Translation and formatting of working paper
16
International Journal of Management Excellence Volume __ No.__ Month Year Impact of Financial Derivatives on the Real Economy Juraj Lazový 1 , Juraj Sipko 2 1 author's affiliation, lines of address & Email 2 Assoc. Prof. at Faculty of Economics and Business Pan European University, 85105 Bratislava, Slovakia [email protected] +421 2 6820 3615 Abstract- In this paper we use correlation analysis and Granger causality tests of time series to investigate the impact of financial derivatives on the real economy. We obtained statistically strong and mutually compatible results. Over the period under review have as exchange trade derivatives (1986-2012), as well as OTC derivatives (1998-2012) in principle a negative impact on the real economy. OTC derivatives measured by notional amounts outstanding reduce economic growth and increase unemployment, exchange traded derivatives (amounts outstanding) increase unemployment as well. On the other hand, both groups have a positive impact on reducing inflation. Tests of results confirmed the positive correlation and causality between economic growth and falling unemployment rate, respectively between economic growth and rising inflation. The conclusions are valid for the group of high income countries (according to the methodology of the World Bank), for the period 1986-2012. As compatible, but as well as disputable, is the result according to which the size of the OTC derivatives market in notional (notional amounts outstanding) and market value (gross market values) negatively correlated with each other. This finding will require further research to explain or deny. Keywords- financial derivatives; real economy; correlation analysis; Granger causality test 1. INTRODUCTION Financial derivatives, particularly over-the-counter (OTC) have been long time criticized for insufficient transparency, often too complicated structure and non-adequate risk management. Majority of academics, but also many financial markets professionals find the rapid development of these instruments as one of the main reasons for the fast spread of the financial crisis in 2007-09, as real risk for financial stability and thus for real economy also at present. Relationship between the development of financial derivatives and economic growth is a frequent subject of economic research. There are many sources with different views. We present just a few of the recent period. Chan-Lau 1 argues that derivatives allowing leverage, thus increasing risks of adverse price developments and may adversely affect economic growth. Blundell and Atkinson 2 similarly argue that derivatives are not used primarily on risk hedging, but on speculation and regulatory arbitrage. Derivatives 1 CHAN-LAU, J. 2007. The Globalization of Finance and its Implications for Financial Stability: An Overview of the Issues. Working Paper. Washinghton: IMF, April 2007. 2 BLUNDELL, A. - ATKINSON, P. 2011. Global SIFIs, Derivatives and Financial Stability. OECD Journal: Financial Market Trends. [online]. 2011, vol. 2011 © TechMind Research, Canada 1 | Page
-
Upload
antonia-ficova -
Category
Economy & Finance
-
view
14 -
download
2
Transcript of Translation and formatting of working paper

International Journal of Management Excellence Volume __ No.__ Month Year
Impact of Financial Derivatives on the Real Economy
Juraj Lazový 1, Juraj Sipko 2
1author's affiliation, lines of address & Email2 Assoc. Prof. at Faculty of Economics and BusinessPan European University, 85105 Bratislava, Slovakia
[email protected]+421 2 6820 3615
Abstract- In this paper we use correlation analysis and Granger causality tests of time series to investigate the impact of financial derivatives on the real economy. We obtained statistically strong and mutually compatible results. Over the period under review have as exchange trade derivatives (1986-2012), as well as OTC derivatives (1998-2012) in principle a negative impact on the real economy. OTC derivatives measured by notional amounts outstanding reduce economic growth and increase unemployment, exchange traded derivatives (amounts outstanding) increase unemployment as well. On the other hand, both groups have a positive impact on reducing inflation. Tests of results confirmed the positive correlation and causality between economic growth and falling unemployment rate, respectively between economic growth and rising inflation. The conclusions are valid for the group of high income countries (according to the methodology of the World Bank), for the period 1986-2012. As compatible, but as well as disputable, is the result according to which the size of the OTC derivatives market in notional (notional amounts outstanding) and market value (gross market values) negatively correlated with each other. This finding will require further research to explain or deny.
Keywords- financial derivatives; real economy; correlation analysis; Granger causality test
1. INTRODUCTION
Financial derivatives, particularly over-the-counter (OTC) have been long time criticized for insufficient transparency, often too complicated structure and non-adequate risk management. Majority of academics, but also many financial markets professionals find the rapid development of these instruments as one of the main reasons for the fast spread of the financial crisis in 2007-09, as real risk for financial stability and thus for real economy also at present. Relationship between the development of financial derivatives and economic growth is a frequent subject of economic research. There are many sources with different views. We present just a few of the recent period. Chan-Lau1 argues that derivatives allowing leverage, thus increasing risks of adverse price developments and may adversely affect economic growth. Blundell and Atkinson2 similarly argue that derivatives are
not used primarily on risk hedging, but on speculation and regulatory arbitrage. Derivatives shift, but do not reduce aggregate risk. By making use of leverage, ultimately increasing counterparty risk and can significantly increase the overall systemic risk in the economy. Sipko3 shows, how the growing volume of the derivatives significantly contributed to the global financial crisis. Financial Stability Board4 states that the largest contribution of derivatives to the financial markets is their ability to optimize price risk, increase market liquidity and facilitate market participants to manage their individual risks. The negative is the potential for the spread of infection and low transparency (OTC derivatives). Rodrigues, Schwarz a Seeger5 showed statistically and economically significant positive impact of essence of domestic derivatives exchanges on economic growth. At the same time they found evidence for a reduction in the volatility of
1 CHAN-LAU, J. 2007. The Globalization of Finance and its Implications for Financial Stability: An Overview of the Issues. Working Paper. Washinghton: IMF, April 2007.
2 BLUNDELL, A. - ATKINSON, P. 2011. Global SIFIs, Derivatives and Financial Stability. OECD Journal: Financial Market Trends. [online]. 2011, vol. 2011
3 SIPKO, J. 2011. Derivatives and the real economy. In Creative and knowledge society: international scientific journal. ISSN 1338-4465, 2011, issue 1, No. 1, p. 33-43.
4FINANCIAL STABILITY BOARD. 2013. OTC Derivatives Market Reforms: Sixth Progress Report on Implementation. Basel: FSB, September 2013.
5RODRIGUES, P. – SCHWARZ, C. – SEEGER, N. 2012. Does the Institutionalization of Derivatives Trading Spur Economic Growth?. Social Science Research Network, February 2012.
©TechMind Research, Canada 1 | P a g e

International Journal of Management Excellence Volume __ No.__ Month Year
economic growth. Stulz6 argues that the problem is non-regulated OTC derivatives and not exchange traded derivatives. Becchetti a Ciampoli7 even showed that the turnover of OTC derivatives have although weak, but positive impact on economic growth.
The goal of this paper is to examine the impact of derivatives on the real economy using correlation analysis and Granger causality test of time series. In the analysis we use global statistical data on the exchange traded and OTC derivatives, which publish the Bank for International Settlements8. For data on the real economy development, we used as a source The World Bank9.
2. FINANCIAL DERIVATIVES
Financial derivatives have achieved the largest growth of all financial markets over the last 15 to 20 years. For the period 1998-2012, the volume of open positions in all derivative financial instruments in the nominal amounts outstanding of the underlying assets has increased from 94,3 trillion USD to 685,0 trillion USD, that is growth of 627%. It is a value that is almost nine-fold the global GDP in 2012. Of that volume exchange traded transactions represent only 8%, the remainder being OTC transactions. They now represent the largest financial market in the world10. For the period 1998-2013 the annual trading
turnover in financial derivatives has increased from 694,3 trillion USD to 2.978,9 trillion USD, growth of 329%. Unlike the notional amounts outstanding, majority of turnover in 2013 amounted to exchange traded transactions (53%), only 47% to OTC11. At figure 1 there is a sharp increase in the volume of notional amounts outstanding and turnover from 2001 to 2007. In the context of the 2007-09 financial crises, we can see stagnation after 2007, in the case of exchange traded derivatives turnover even come to a significant decline.
Figure 1: Financial derivatives development, 1998 –2013
Source: Bank for International Settlements (BIS)
Source: Bank for International Settlements (BIS)
2.1 Exchange traded derivatives
For the period 1986 to 2012 year-end volume of amounts outstanding increased from 0,6 trillion USD to 52,5 trillion USD (Figure 2, left panel), representing an average annual growth of 21,4%. The annual turnover increased in the same period from 40,5 trillion USD to 1.568,5 trillion USD (Figure 2, right panel), with an average annual growth of 17,3%. The number of contracts outstanding grew from 4,2 million to 192,6 million, with an average annual growth rate of 17,8% (Figure 3, left panel). And an annual contracts turnover increased from 317,0 million in 1986 to 10.764,5 million (Figure 3, right panel), representing an average annual growth of 16,3%.
6STULZ, R. 2004. Should We Fear Derivatives? Journal of Economic Perspectives. [online]. 2004, vol. 18, no.3, p. 173–192.
7 BECCHETTI, L. – CIAMPOLI, N. 2012. What is new in finance-growth nexus: OTC derivatives, bank assets and growth. Research Paper. Roma: CEIS Tor Vergata, July 2012.8 BANK FOR INTERNATIONAL SETTLEMENTS (BIS). 2014. Derivatives statistics. Basel: BIS, 2014.9 THE WORLD BANK (WB). 2014. World DataBank. Washinghton (DC): WB, 2014.10 Available data do not allow an exact comparison of the size of the exchange traded and OTC financial derivatives. Common used statistical data overestimating the volume of OTC derivatives, even in comparison with other financial
©TechMind Research, Canada 2 | P a g e

International Journal of Management Excellence Volume __ No.__ Month Year
On both figures, we can see exponential growth by 2007, especially between 2000 and 2007. After the start of the global financial crisis in 2007, we can see, except the total contracts turnover, a significant decrease in other indicators. A similar trend can also be observed within the individual underlying assets (Figure 4).
Figure 2: Exchange traded derivatives – annual amounts, 1986 – 2012
Source: BIS Figure 3: Exchange traded derivatives - annual number of contracts, 1986 - 2012
Source: BIS
Source: BIS
instruments. For more information, please see for example LAZOVÝ, J. 2012. Vývoj na trhoch s finančnými derivátmi. In BIATEC – odborný bankový časopis. [online]. 2012, no. 10, p.17-23.11 Annual turnover of OTC derivatives is calculated from average daily turnover in April for currency and interest rate derivatives (due to data availability).
©TechMind Research, Canada 3 | P a g e

International Journal of Management Excellence Volume __ No.__ Month Year
Figure 4:Exchange traded derivatives – average annual changes
Source: BIS
2.2 OTC derivatives
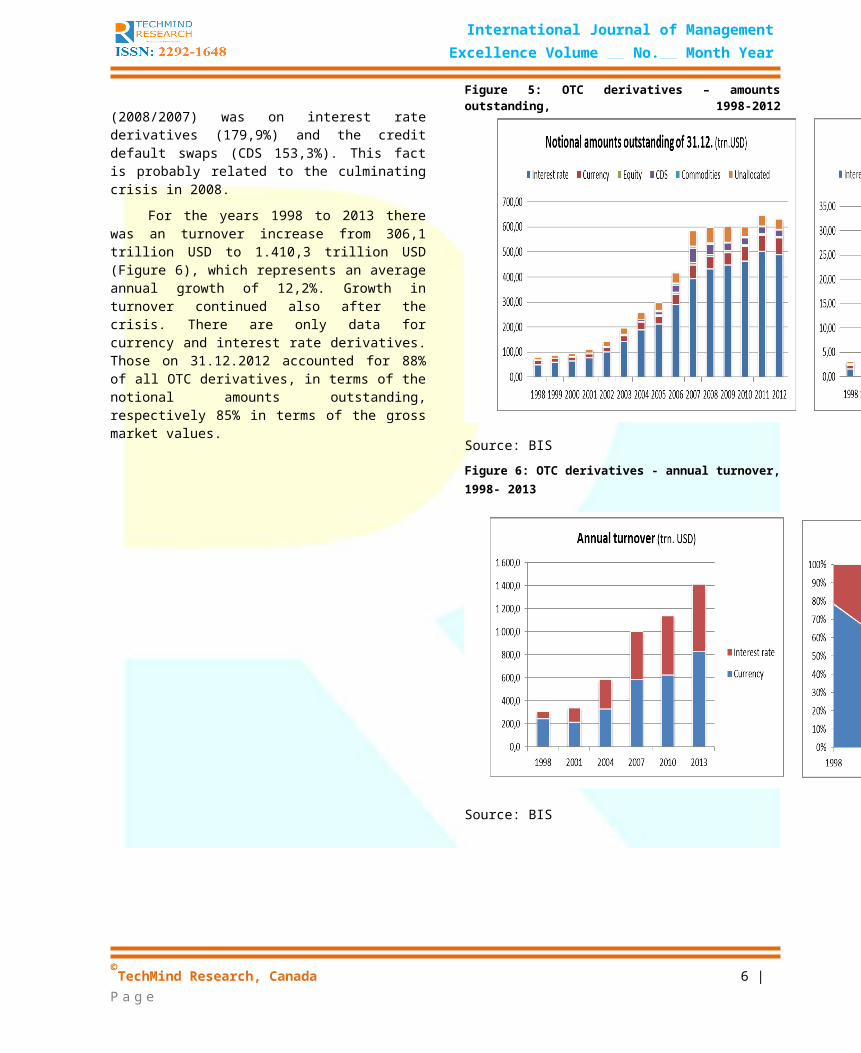
OTC derivatives currently represent the largest financial market in the world. For the period 1998 - 2012 year-end notional amounts outstanding increased from 79,9 trillion USD to 632,6 trillion USD (Figure 5, left panel), representing an average annual growth of 16,9%. The year-end gross market values12 has increased over the same period from 3,2 trillion USD to 24,7 trillion USD (Figure 5, right panel), with an average annual growth of 21,3%. On the figure we can see sharp increase in both of the observed variables to 2007. During the 2007-09 financial crises, there was a further slight increase in the notional amounts outstanding. In the case of the gross market values there was more than doubling in value in 2008 compared with 2007 for all of the underlying assets (excluding shares). The largest percentage increase
(2008/2007) was on interest rate derivatives (179,9%) and the credit default swaps (CDS 153,3%). This fact is probably related to the culminating crisis in 2008.
For the years 1998 to 2013 there was an turnover increase from 306,1 trillion USD to 1.410,3 trillion USD (Figure 6), which represents an average annual growth of 12,2%. Growth in turnover continued also after the crisis. There are only data for currency and interest rate derivatives. Those on 31.12.2012 accounted for 88% of all OTC derivatives, in terms of the notional amounts outstanding, respectively 85% in terms of the gross market values.
1229291
©TechMind Research, Canada 4 | P a g e

International Journal of Management Excellence Volume __ No.__ Month Year
Figure 5: OTC derivatives – amounts outstanding, 1998-2012
Source: BIS
Figure 6: OTC derivatives - annual turnover, 1998- 2013
Source: BIS
Source: BIS
3.1 Normal or Body TextPlease use a 10-point Times Roman font, or other Roman font with serifs, as close as possible in appearance to Times Roman in which these guidelines have been set. The goal is to have a 10-point text, as you see here. Please use sans-serif or non-proportional fonts only for special purposes, such as distinguishing source code text. If Times Roman is not available, try the font named Computer Modern Roman. On a Macintosh, use the font named Times. Right margins should be justified, not ragged.
3.2 This paragraph is a repeat of 3.1
©TechMind Research, Canada 5 | P a g e
International Journal of Management Excellence Volume __ No.__ Month Year
3. REAL ECONOMY DEVELOPMENT
Financial derivatives are used mainly in developed countries. Share of the two largest financial centers (London, New York) on the currency OTC derivatives turnover in 2013 was 59,7%, on the interest rate derivatives even 71,7% of the global market. For this reason, we are examining the impact of financial derivatives on the real economy focused on development in developed countries13.
For the purpose of this analysis we determined GDP growth, inflation and unemployment as parameters for the development of the real economy. We examined the development of these parameters for the period 1986-201214. We used the average values for the group of so-called high income countries published by the World Bank15.
We can see that the average annual GDP growth in the observed period ranged typically from 1% to 4% (Figure 7). The highest value of 4,78% reached in 1988, the lowest -3.57% in 2009. The trend is a slight decrease in growth of 0,08% per annum.
A similar situation is in the development of inflation (Figure 8). Average values typically range from 2% to 4%. Inflation reached the highest value in 1989 (5,08%), the lowest in 2009 (1,20%). The trend is again a slight decrease during the reporting period, about 0,07% per annum.
The average unemployment rate ranges from 6% to 8% (Figure 9). Lowest level reached just before the financial crisis in 2007 (5,66%), the highest as a result of the crisis in 2010 (8,27%). The trend over the analyzed period is practically unchanged.
1////11419921215////
©TechMind Research, Canada 6 | P a g e

International Journal of Management Excellence Volume __ No.__ Month Year
Figure 7: Average GDP growth for High income countries (annual %), 1986-2012
Source: The World Bank (WB)
Figure 8: Average inflation (consumer prices) for High Income countries (annual %), 1986-2012
Source: WB
©TechMind Research, Canada 7 | P a g e

International Journal of Management Excellence Volume __ No.__ Month Year
Figure 9: Average unemployment (% of total labor force) for High income countries 1986-2012
Source: WB
4. STATISTICAL METHODS
We used correlation analysis and Granger causality test of time series while analyzing the impact of the financial derivatives developments on the real economy. In statistical analysis of time series, it is necessary to have stationary time series (mean and dispersion do not change with time). Stationarity of time series was tested by the augmented Dickey Fuller test. If the original time series has no unit root the time series is stationary. If it has unit root, it is necessary to determine its multiplicity. Analogously to the original time series we tested first and, as appropriate, other differences, until we got a stationary time series16.
Subsequently, we performed a correlation analysis of pairs of stationary time series, where one side is stationary time series variables characterizing the development of the market for financial derivatives (notional amounts outstanding, gross market values, turnover for OTC derivatives, amounts outstanding, amounts turnover, contracts outstanding, contracts turnover for exchange traded derivatives), on the other hand, time series variables characterizing the real economy development (GDP growth, inflation and unemployment).
The obtained correlation coefficients, we further tested for statistical significance using the Pearson correlation coefficient17.
As a final step, we tested the causal dependence of the same pair of stationary time series using Granger causality test. We tested whether the variable X affects the variable Y, thus whether Y can be interpreted as the effect of the variable X and vice versa. A time series X is said to Granger-cause Y, if it can be shown, usually through a series of F-tests on lagged values of X (and with lagged values of Y also included), that those X values provide statistically significant information about future values of Y18. We tested exclusively unilateral causality, the impact of financial derivatives on the real economy.
5. RESULTS AND DISCUSSION
16517518 SHU, W. 2005. Monetary Policy and Long-term Interest Rates. Working paper. Lawrence (USA): University of Kansas, 2005.
©TechMind Research, Canada 8 | P a g e

International Journal of Management Excellence Volume __ No.__ Month Year
The obtained results are listed in Table 1. Statistically significant values are in bold19. Statistically significant correlation confirmed by Granger causality tests were obtained in 8 of 21 cases analyzed20. These conclusions we analyze in more detail below.
1. Growth of the notional amounts outstanding of OTC derivatives reduces economic growth. Correlation coefficient -0,42, F-statistics for the Granger test 3,62 (p-value 0,05) for the second lag. This is a very significant conclusion that supports negative views on OTC financial derivatives.
Table 1: The impact of financial derivatives on the
real economy
2. Growth of the notional amounts outstanding of OTC derivatives increases unemployment. Correlation coefficient 0,39, F-test statistics for Granger test 5,66 (p-value 0,01) for the second lag. At the general assumption, that the economic downturn causes the rise in unemployment, is the result compatible with the first conclusion.
Financial derivatives variable "X"
Real economy - variable "Y"GDP growth Unemployment Inflation
CorrelationGranger
test X → Y
CorrelationGranger
test X → Y
CorrelationGranger
test X → Y
OTC derivatives Notional amounts outstanding -0,42 3,62 0,39 5,66 -0,41 10,77Gross market values 0,23 5,82 -0,72 6,20 0,74 4,01Turnover -0,08 0,48 -0,15 0,27 0,06 0,25Exchange traded derivatives Amounts outstanding -0,24 25,36 0,49 15,87 -0,76 4,17Amounts turnover 0,26 1,13 -0,50 0,28 0,26 2,80Contracts outstanding -0,08 4,05 0,08 0,05 0,10 3,90Contracts turnover 0,40 2,03 -0,55 1,28 0,50 19,31
Source: Own processing
3. Growth of the notional amounts outstanding of OTC derivatives reduces inflation. Correlation coefficient -0,41, F-test statistics for Granger test 10,77 (p-value 0,00) for the first lag. In contrast to previous conclusions it comes to be a positive effect. Assuming that economic growth is correlated positive with inflation, this conclusion is compatible with the former two. Negative impact of OTC derivatives on growth and unemployment is compatible with the decline in inflation.
4. Growth of the gross market values of OTC derivatives decreases unemployment. Correlation coefficient -0,72, F-test statistics for Granger test 6,20 (p-value 0,01) for the second lag. The opposite
19520 In seven other issues, we obtain either a statistically significant correlation or causality.
©TechMind Research, Canada 9 | P a g e

International Journal of Management Excellence Volume __ No.__ Month Year
result as notional amounts outstanding of OTC derivatives21. This conclusion induces a presumption of negative correlation between notional amounts outstanding and gross market values of OTC derivatives. If this assumption is true, the conclusion is compatible with the other.
5. Growth of the gross market values of OTC derivatives increases inflation. Correlation coefficient 0,74, F-test statistics for Granger test 4,01 (p-value 0,03) for the second lag. Again, the opposite conclusion such as the notional amounts outstanding of OTC derivatives. A similar comment applies such as at the conclusion 4.
6. Growth of the amounts outstanding of exchange traded derivatives increases unemployment. Correlation coefficient 0,49, F-test statistics for Granger test 15,87 (p-value 0,01) for the first lag. A similar conclusion as in OTC derivatives (nominal amounts outstanding). We obtained negative correlation also between exchange traded derivatives and economy growth (-0,24), but it is not statistically significant at the 0,05 level.
7. Growth of the amounts outstanding of exchange traded derivatives decreases inflation. Correlation coefficient -0,76, F-test statistics for Granger test 4,17 (p-value 0,03) for the second lag. Again the similar conclusion as in OTC derivatives (nominal amounts outstanding).
8. Growth of the contracts turnover of exchange traded derivatives increases inflation. Correlation coefficient 0,50, F-test statistics for Granger test 19,31 (p-value 0,00) for the first lag. According to this result, activity in the exchange traded derivatives22 increases inflation, and thus has a negative impact on the economy.
From the results thus implies that the growth of the market in financial derivatives in the nominal values reduces economic growth (for OTC derivatives), increases unemployment and inflation (both for OTC and exchange traded derivatives). On the other hand, the growth of the OTC financial derivatives in the
2122226
gross market values decreases unemployment and increases inflation. And growth of the contracts turnover of exchange traded derivatives increases inflation.
To further explain, respectively to examine possible inconsistencies in the results, we next analyzed:
correlation and causality between economic growth and unemployment over the analyzed period (1990-2012) for high income countries. Correlation coefficient -0,40 (significance level 0,07) refers to an expected negative correlation between GDP growth and unemployment. Granger test (F-statistic 4,47, p value 0,05, the first lag) confirmed the causality between economic growth and unemployment. This result allows us to conclude, that there is no inconsistency between the above conclusions 1 and 2,
correlation and mutual causality between economic growth and inflation over the period (1986-2012) for high income countries. Correlation coefficient of 0,24 indicate a weak but positive correlation between economic growth and inflation. Coefficient is not, due to the number of data within the observed period, statistically significant. On the other hand, the test confirmed a strong mutual Granger causality (F-statistic 23,06, respectively 26,40, p value 0,00, the first lag in both cases). The result allows us to state again, that there is no inconsistency between the conclusions 1 and 3,
correlation and mutual causality between the size of the OTC derivatives market in notional amounts outstanding and gross market values during the analyzed period 1998-2012. Correlation coefficient -0,68 (significance level 0,00) shows a strong negative correlation between the nominal size (notional amounts outstanding) and the market value (gross market values) of the OTC derivatives market. This fact is clearly confirmed by the Granger test with a strong bilateral causality (F-statistic 20,46, respectively 10,73, p value 0,00, the first lag in both cases). The above result confirmed, that there is no inconsistency between the conclusions 1 to 3, respectively 4 and 5. But this result is at the same time, contrary to expectations. Growth in nominal value of the OTC derivatives markets should reduce its market value and thus the overall risk of the derivatives market. If this conclusion is true, so the growth in nominal value of OTC derivatives are used primarily to hedge the positions (in contrast to the exchange traded derivatives in the OTC derivatives mutually compatible open positions are not bilaterally netted, so the total open position is not set to zero, but it doubles) and thus to decline the market value of OTC derivatives. At the same time, it should be that the growth of the nominal value of OTC derivatives, which should reduce the overall risk of the
©TechMind Research, Canada 10 | P a g e

International Journal of Management Excellence Volume __ No.__ Month Year
derivatives market, has a negative impact on the real economy (economic growth, unemployment). And vice versa growth in the market value of OTC derivatives, which increases the overall market risk of the derivatives market, according to the results has in principle a positive impact on the real economy (drop in unemployment). Explanation of these discrepancies could be that small number of available data within the investigated time series, together with the dynamic development before and during the 2007-2009 financial crises, causes nonstandard results. Also a way of tracking gross market values may not be completely accurate or correct.
6. CONCLUSIONS
In this paper we have demonstrated, that financial derivatives have recorded fundamental growth in the period 1986-2007 and currently represent the largest segment of the financial markets. Its size exceeds several times the global GDP. After 2007, financial derivatives have stagnated and the exchange traded derivatives even come to a significant fall. At the same time we have shown, that there have been in developed countries during this period, slight decreases in trends of GDP growth and inflation, the trend of unemployment is practically constant.
By using correlation analysis and Granger causality tests of time series, we searched the effect of the financial derivatives on the real economy, over the period 1986-2012 for exchange trade derivatives and over the period 1998-2012 for OTC derivatives. We obtained total eight cases of statistically significant correlations confirmed by Granger test, with the following conclusions:
1. Exchange traded and OTC derivatives increases unemployment and decreases inflation. Growth of the OTC derivatives market also reduces economic growth. Findings apply to the market size at nominal value.
2. Market activity at the exchange traded derivatives, measured by the contracts turnover, increases inflation.
3. Growth of OTC derivatives measured by market value (gross market values) reduces unemployment and increase inflation.
4. All conclusions are compatible with each other and confirmed by other statistical tests.
5. As a controversial result appears to be that the size of OTC derivatives market in notional (notional amounts outstanding) and market value (gross market values) negatively correlated with each other. The finding is statistically highly significant and compatible with the other results. Therefore, we consider this be an important conclusion. It needs
further research to verify and explain it or deny this finding.
The paper brought statistically significant and compatible results not only between the basic variables studied, but also between economic growth, unemployment and inflation, the size of the OTC derivatives market in notional and market value.
REFERENCES
[1] BANK FOR INTERNATIONAL SETTLEMENTS (BIS). 2014. Derivatives statistics. Basel: BIS, 2014. Available at http://www.bis.org/statistics/derstats.htm
[2] BANK FOR INTERNATIONAL SETTLEMENTS (BIS). 2009. Guide to the international financial statistics. Basel: BIS, July 2009, p. 30-31. Available at http://www.bis.org/statistics/intfinstatsguide.pdf
[3] BECCHETTI, L. – CIAMPOLI, N. 2012. What is new in finance-growth nexus: OTC derivatives, bank assets and growth. Research Paper. Roma: CEIS Tor Vergata, July 2012. Available at http://papers.ssrn.com/sol3/papers.cfm?abstract_id=2114072
[4] BLUNDELL, A. - ATKINSON, P. 2011. Global SIFIs, Derivatives and Financial Stability. OECD Journal: Financial Market Trends. [online]. 2011, vol. 2011, issue 1. Available at http://www.oecd.org/finance/financial-markets/48299884.pdf
[5] CHAN-LAU, J. 2007. The Globalization of Finance and its Implications for Financial Stability: An Overview of the Issues. Working Paper. Washinghton: IMF, April 2007. Available at http://www.inderscience.com/info/inarticle.php?artid=20240
[6] FINANCIAL STABILITY BOARD. 2013. OTC Derivatives Market Reforms: Sixth Progress Report on Implementation. Basel: FSB, September 2013. Available at http://www.financialstabilityboard.org/publications/r_130902b.pdf
[7] LAZOVÝ, J. 2012. Vývoj na trhoch s finančnými derivátmi. In BIATEC – odborný bankový časopis. [online]. 2012, no. 10, p.17-23. Available at http://www.nbs.sk/_img/Documents/_PUBLIK_NBS_FSR/Biatec/Rok2012/10-2012/05_biatec12-10_lazovy.pdf
[8] RODRIGUES, P. – SCHWARZ, C. – SEEGER, N. 2012. Does the Institutionalization of Derivatives Trading Spur Economic Growth?. Social Science Research Network, February 2012. Available at http://papers.ssrn.com/sol3/papers.cfm?abstract_id=2014805
[9] SHU, W. 2005. Monetary Policy and Long-term Interest Rates. Working paper. Lawrence (USA): University of Kansas, 2005. Available at
©TechMind Research, Canada 11 | P a g e

International Journal of Management Excellence Volume __ No.__ Month Year
Author’s Photo
Author’s Photo
http://www2.ku.edu/~kuwpaper/2005Papers/200512.pdf
[10] SIPKO, J. 2011. Derivatives and the real economy. In Creative and knowledge society: international scientific journal. ISSN 1338-4465, 2011, issue 1, No. 1, p. 33-43.
[11] STULZ, R. 2004. Should We Fear Derivatives? Journal of Economic Perspectives. [online]. 2004, vol. 18, no.3, p. 173–192. Available at http://www.cob.ohio-state.edu/fin/faculty/stulz/publishedpapers/Should%20We%20Fear%20Derivatives.pdf
[12] THE WORLD BANK (WB). 2014. World DataBank. Washinghton (DC): WB, 2014. Available at http://data.worldbank.org/
Author’s Biography with Photo
Ist Author’s Biography
2nd Author’s Biography
©TechMind Research, Canada 12 | P a g e
http://www.cob.ohio-state.edu/fin/faculty/stulz/publishedpapers/Should%20We%20Fear%20Derivatives.pdf
http://www.cob.ohio-state.edu/fin/faculty/stulz/publishedpapers/Should%20We%20Fear%20Derivatives.pdf