Transient Stability Control of Power System with Windmill...
7
International Journal of Science and Research (IJSR) ISSN (Online): 2319-7064 Index Copernicus Value (2013): 6.14 | Impact Factor (2013): 4.438 Volume 4 Issue 5, May 2015 www.ijsr.net Licensed Under Creative Commons Attribution CC BY Transient Stability Control of Power System with Windmill Interaction Ashish Baral 1 , Abhijit Mandal 2 1, 2 Chhattisgarh Swami Vivekanand Technical University, Bhilai, India Abstract: This paper presents a transient stability analysis for power system with wind farm interaction for different types of large perturbations such as three phase fault in power system. Power system integrated with wind mill may be exposed to various large disturbances such as three phase faults, short circuit faults etc, the unbalance caused by these faults can be addressed with the help of a power system stabilizer. This paper analyses the integrated power system grid with and without Power system stabilizer. The above mentioned conditions are realized by a simulation model in PSCAD and this simulation model is ran for results for a three phase fault in three phase circuit for different fault lasting durations. Keywords: PSCAD, Power system stability, power system stabilizer, transient stability, wind energy conversion systems. 1. Introduction The modern power systems are extensively interconnected, as it provides operating flexibility, economy and reliability. Power system interconnection presents several benefits but along with that it also has some drawbacks. Due to interconnection power system may lead to various problems such as small signal stability, large signal stability, power quality, voltage fluctuations, power system unbalance, power system shut downs etc. As the interconnection has become a common practice now to meet the ever increasing demand of electricity, possible stability issues have also become significant. Wind power demand in power systems is exceedingly mounting around the world as it is the most significant of all existing renewable energy sources present as of today. It offers several benefits such as pollution free electric power, cost friendly compared to other available renewable energy sources and short gestation time requisite for setting up wind mills. Wind flow is a great substitute to fossil fuels for electricity production as it is available in abundance and has no unpleasant environmental effect and it is competitively economical in comparison to conventional power generation if social and environmental costs are taken into account [1]- [9]. The exchange of power in the integrated system depends on angular separation between the rotors of the machines of generating units, during the synchronization of integrated system, generating units may be subjected to some sudden variations and there may be a probability that these variations may excite relative angular swings between synchronous machines which is already present in the system and doesn’t die down out with time. These swings may further be triggered or enhanced by perturbations such as continuous load changes, three phase faults etc. these phenomena may hinder system stability at small scale or at large scale. Hence when interconnection is carried out damping controller such as a power system stabilizer is required [1]-[12]. The aim of this paper is to present a transient stability analysis of power system integrated with wind mill with and without a power system stabilizer for large disturbances such as a three-phase fault during synchronization and operation. This paper is organized as follows. In section 1 the paper was introduced. In section 2 an overview of power system stability and its types are described. In section 3 the power system stabilizer structure is presented. In section 4 the simulation model of power system integrated with wind mill is presented & discussed. In section 5 results and graphs obtained from simulation by PSCAD is presented & discussed. Finally, in section 6 the conclusions are summarized. 2. Power System Stability Power system stability is that property of a power system that facilitates it to stay put in state of operating equilibrium under normal operating state and to reclaim an acceptable status of equilibrium after being exposed to a perturbation [11]-[17]. Types of power system stability: Rotor angle stability Voltage stability Angular stability can further be subcategorized mainly into the following types: Small signal stability Transient stability 2.1 Rotor angle stability Rotor angle stability is that property of a power system comprises of interconnected synchronous machines that facilitates it to stay put in synchronism when the system is exposed to miniature perturbations. These instability tribulations involve problems of electromechanical swings, which are inherent in power systems and may affect amount of power produced by synchronous machines and the interchange power between machines [11]–[17]. Paper ID: SUB154694 2108
Transcript of Transient Stability Control of Power System with Windmill...
International Journal of Science and Research (IJSR) ISSN (Online): 2319-7064
Index Copernicus Value (2013): 6.14 | Impact Factor (2013): 4.438
Volume 4 Issue 5, May 2015
www.ijsr.net Licensed Under Creative Commons Attribution CC BY
Transient Stability Control of Power System with
Windmill Interaction
Ashish Baral1, Abhijit Mandal
2
1, 2 Chhattisgarh Swami Vivekanand Technical University, Bhilai, India
Abstract: This paper presents a transient stability analysis for power system with wind farm interaction for different types of large
perturbations such as three phase fault in power system. Power system integrated with wind mill may be exposed to various large
disturbances such as three phase faults, short circuit faults etc, the unbalance caused by these faults can be addressed with the help of a
power system stabilizer. This paper analyses the integrated power system grid with and without Power system stabilizer. The above
mentioned conditions are realized by a simulation model in PSCAD and this simulation model is ran for results for a three phase fault
in three phase circuit for different fault lasting durations.
Keywords: PSCAD, Power system stability, power system stabilizer, transient stability, wind energy conversion systems.
1. Introduction
The modern power systems are extensively interconnected, as
it provides operating flexibility, economy and reliability.
Power system interconnection presents several benefits but
along with that it also has some drawbacks. Due to
interconnection power system may lead to various problems
such as small signal stability, large signal stability, power
quality, voltage fluctuations, power system unbalance, power
system shut downs etc. As the interconnection has become a
common practice now to meet the ever increasing demand of
electricity, possible stability issues have also become
significant.
Wind power demand in power systems is exceedingly
mounting around the world as it is the most significant of all
existing renewable energy sources present as of today. It
offers several benefits such as pollution free electric power,
cost friendly compared to other available renewable energy
sources and short gestation time requisite for setting up wind
mills. Wind flow is a great substitute to fossil fuels for
electricity production as it is available in abundance and has
no unpleasant environmental effect and it is competitively
economical in comparison to conventional power generation
if social and environmental costs are taken into account [1]-
[9].
The exchange of power in the integrated system depends on
angular separation between the rotors of the machines of
generating units, during the synchronization of integrated
system, generating units may be subjected to some sudden
variations and there may be a probability that these variations
may excite relative angular swings between synchronous
machines which is already present in the system and doesn’t
die down out with time. These swings may further be
triggered or enhanced by perturbations such as continuous
load changes, three phase faults etc. these phenomena may
hinder system stability at small scale or at large scale. Hence
when interconnection is carried out damping controller such
as a power system stabilizer is required [1]-[12].
The aim of this paper is to present a transient stability
analysis of power system integrated with wind mill with and
without a power system stabilizer for large disturbances such
as a three-phase fault during synchronization and operation.
This paper is organized as follows. In section 1 the paper was
introduced. In section 2 an overview of power system
stability and its types are described. In section 3 the power
system stabilizer structure is presented. In section 4 the
simulation model of power system integrated with wind mill
is presented & discussed. In section 5 results and graphs
obtained from simulation by PSCAD is presented &
discussed. Finally, in section 6 the conclusions are
summarized.
2. Power System Stability
Power system stability is that property of a power system that
facilitates it to stay put in state of operating equilibrium
under normal operating state and to reclaim an acceptable
status of equilibrium after being exposed to a perturbation
[11]-[17].
Types of power system stability:
Rotor angle stability
Voltage stability
Angular stability can further be subcategorized mainly into
the following types:
Small signal stability
Transient stability
2.1 Rotor angle stability
Rotor angle stability is that property of a power system
comprises of interconnected synchronous machines that
facilitates it to stay put in synchronism when the system is
exposed to miniature perturbations. These instability
tribulations involve problems of electromechanical swings,
which are inherent in power systems and may affect amount
of power produced by synchronous machines and the
interchange power between machines [11]–[17].
Paper ID: SUB154694 2108
International Journal of Science and Research (IJSR) ISSN (Online): 2319-7064
Index Copernicus Value (2013): 6.14 | Impact Factor (2013): 4.438
Volume 4 Issue 5, May 2015
www.ijsr.net Licensed Under Creative Commons Attribution CC BY
2.2 Small signal stability
Small signal stability is that property of a power system that
facilitates it to uphold synchronism under miniature
perturbations [11]-[17].
2.3 Transient stability
Transient stability is that property of a power system that
facilitates it to preserve synchronism when exposed to large
perturbations. In other words it is the ability of power system
to retain its stability under large disturbances such as three
phase faults, large load changes, short circuits, switching
surges etc [11], [17].
3. Power System Stabilizer
Power system stabilizer is basically used in a power system
to augment the system stability by further improving damping
of oscillations. Besides improving damping PSS should not
apply changes in the system in steady state condition when it
is not required. Different components of power system
stabilizer are shown in Figure 1 below in the structure
diagram of PSS:
Figure 1: Structure of PSS
PSS input signal is generally taken from a filter, which
generally is represented by a 1st order transfer function.
Washout Circuit ensures no operation of PSS in steady state
condition.
Washout circuit is represented by transfer function
which has unity gain for high frequency and for low
frequency gain of the transfer function is zero hence it passes
the transient signals and blocks the steady state values and so
limits operation of PSS in steady state condition.
Compensator provides lead-lag phase shift to the input
signal. Limiter limits the PSS operation i.e. ensures that PSS
doesn’t alter reference value of Automatic Voltage Regulator
beyond a limit [18]-[24].
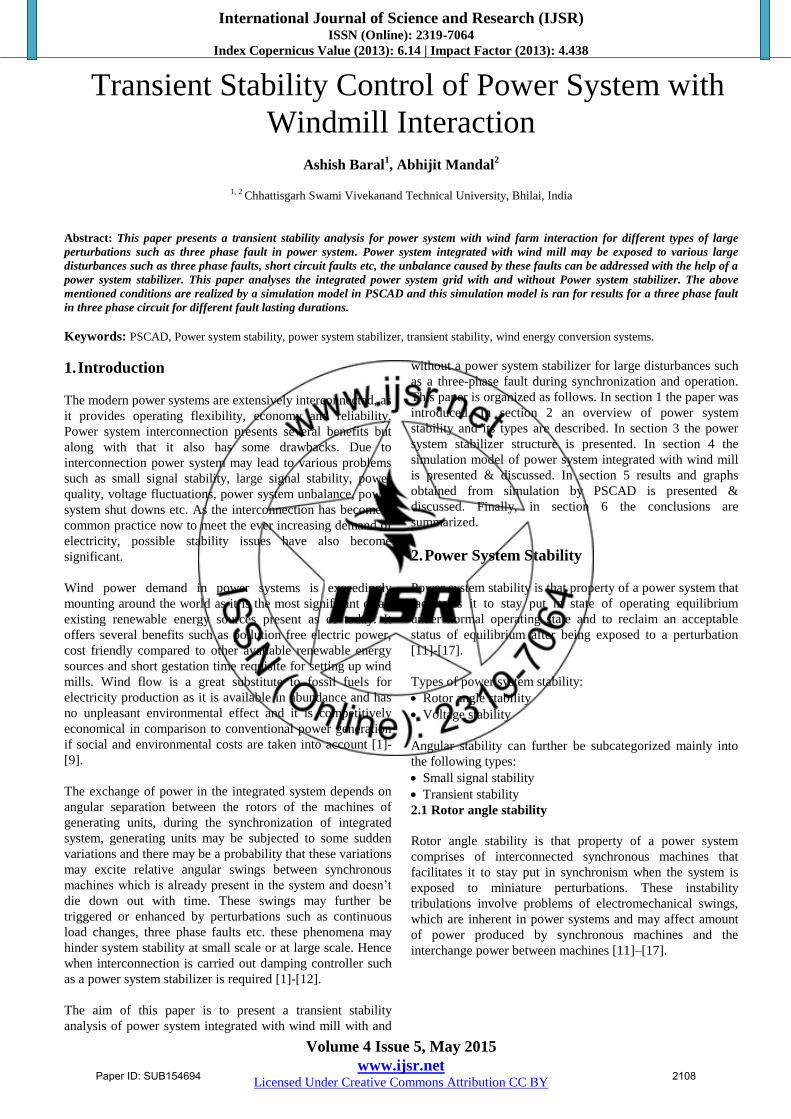
4. Line Diagram of Simulation Model in PSCAD
In this paper an integrated system is realized as shown in
Figure 2 in PSCAD by connecting two three-phase voltage
source components modeling two 132 kV generators at two
buses of 4-bus system, in which one generator is an ideal
source and the other is with some load angle. These buses are
connected by a 200 KM long transmission line forming a
power system grid. Wind mill generator is connected at
another bus with one of the generators via a step up
transformer for generated power transfer. In the simulation
model a power system stabilizer is introduced as damping
controller, the synchronous generator connected to the wind
mill turbine has an exciter connected for excitation control,
this exciter offers option to connect or disconnect the PSS for
simulating integrated system response with and without PSS.
Figure 2: Line Diagram of Simulation Model in PSCAD
5. Results & Discussions
The simulation model of integrated power grid is simulated
using PSCAD for transient stability. The integrated system’s
transient stability is analysed by creating a three-phase fault
and by observing the system behaviour under effect of this
transient with and without PSS. Simulation in PSCAD is ran
for 30 seconds for analysing the changing behaviour of
power system integrated with wind mill under the presence of
a three phase faults for different fault lasting durations and
various results obtained for the integrated system are as
under:
5.1 When there is a three phase fault at time 10.0 s and
the fault duration is 0.1s
The changes in integrated system behavior are analyzed by
creating a three phase fault at 10 sec and for the duration of
0.1 sec.
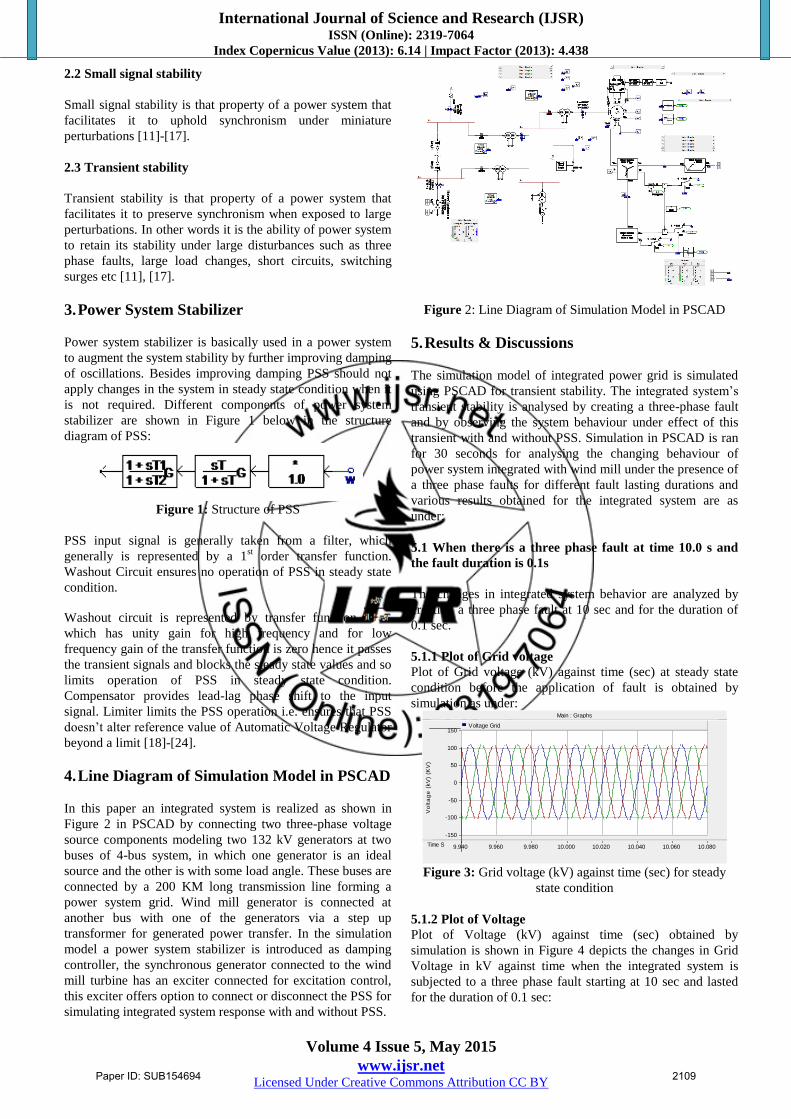
5.1.1 Plot of Grid voltage
Plot of Grid voltage (kV) against time (sec) at steady state
condition before the application of fault is obtained by
simulation as under: Main : Graphs
Time S 9.940 9.960 9.980 10.000 10.020 10.040 10.060 10.080 ...
...
...
-150
-100
-50
0
50
100
150
Vo
lta
ge
(kV
) (K
V)
Voltage Grid
Figure 3: Grid voltage (kV) against time (sec) for steady
state condition
5.1.2 Plot of Voltage
Plot of Voltage (kV) against time (sec) obtained by
simulation is shown in Figure 4 depicts the changes in Grid
Voltage in kV against time when the integrated system is
subjected to a three phase fault starting at 10 sec and lasted
for the duration of 0.1 sec:
Paper ID: SUB154694 2109
International Journal of Science and Research (IJSR) ISSN (Online): 2319-7064
Index Copernicus Value (2013): 6.14 | Impact Factor (2013): 4.438
Volume 4 Issue 5, May 2015
www.ijsr.net Licensed Under Creative Commons Attribution CC BY
Main : Graphs
Time S 9.900 9.950 10.000 10.050 10.100 10.150 10.200 ...
...
...
-10.0
-7.5
-5.0
-2.5
0.0
2.5
5.0
7.5
10.0 V
olt
ag
e (
kV
)
Vins
Figure 4: Voltage (kV) against time (sec) for a 3-phase fault
of 0.1 sec duration
5.1.3 Plot of Fault current
Plot of Fault current (kA) against time (sec) obtained by
simulation is shown in Figure 5 depicts the Fault current (kA)
in the grid against time (sec) for the three phase fault of 0.1
sec duration:
Main : Graphs
Time S 9.900 9.950 10.000 10.050 10.100 10.150 10.200 ...
...
...
-6.0
-4.0
-2.0
0.0
2.0
4.0
6.0
Fa
ult
Cu
rre
nt
(kA
)
Ifa Ifb Ifc
Figure 5: Fault current (kA) against time (sec) for 0.1 sec
5.1.4 Plot of Active power
Plot of Active power against time (sec) with and without
PSS, obtained by simulation is shown in Figure 6 depicts the
changes in Active power against time (sec) with and without
PSS when the integrated system is subjected to a three phase
fault starting at 10 sec and lasted for the duration of 0.1 sec.
Changes in Active power with PSS is depicted by blue curve
and changes without PSS is depicted by red curve, where it
can be observed from the below plot that at t = 10 sec, there
is no magnitude difference in Active power oscillations but at
t = 12 sec, oscillations in Active power are from 2 to 2.8
without PSS and from 2 to 2.5 with PSS, which depicts
decease in magnitude of oscillation by 37.5%. At t = 14 sec,
oscillations are from 2 to 2.4 without PSS and from 2 to 2.1
with PSS, which shows oscillation decrement by 75%. At 15
sec the decrement is almost 100%.
Main : Graphs
Time S 8.0 10.0 12.0 14.0 16.0 18.0 20.0 22.0 24.0 26.0 ...
...
...
-1.0
0.0
1.0
2.0
3.0
4.0
5.0
Acti
ve
Po
we
r
Active Pow erw ith No PSS Active Pow erw ith PSS
Figure 6: Active power against time (sec) for a 3-phase fault
of 0.1 sec duration with and without PSS
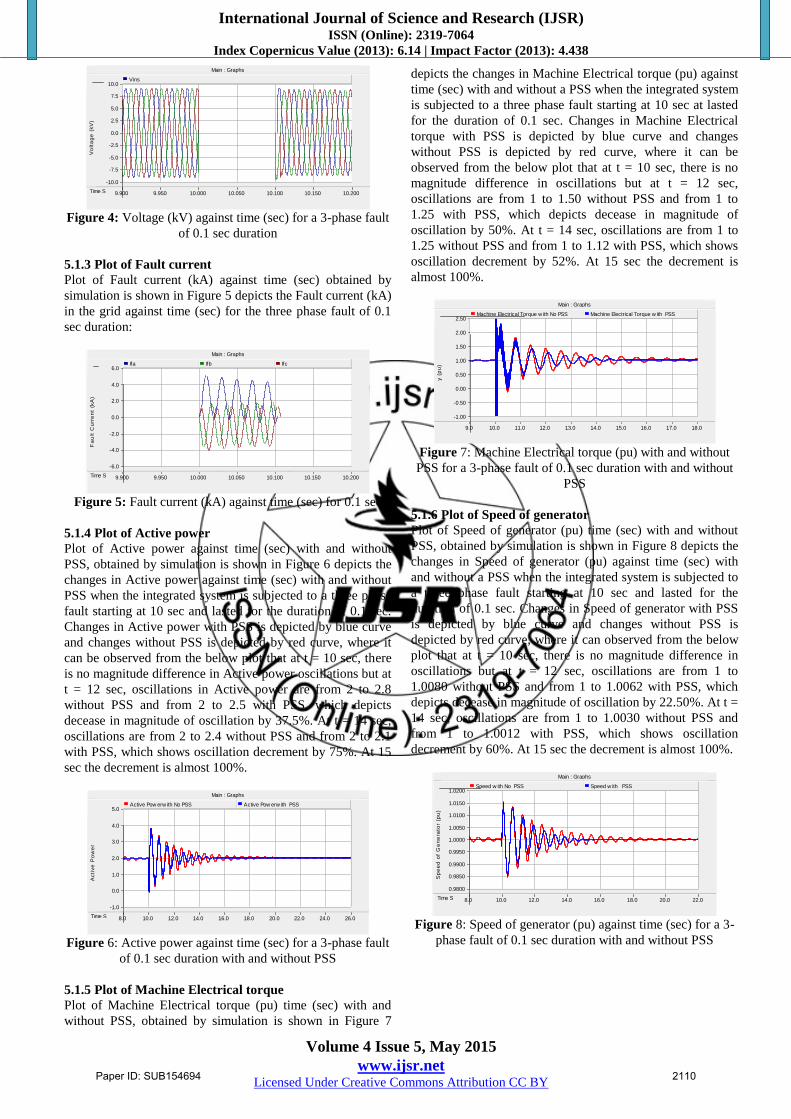
5.1.5 Plot of Machine Electrical torque
Plot of Machine Electrical torque (pu) time (sec) with and
without PSS, obtained by simulation is shown in Figure 7
depicts the changes in Machine Electrical torque (pu) against
time (sec) with and without a PSS when the integrated system
is subjected to a three phase fault starting at 10 sec at lasted
for the duration of 0.1 sec. Changes in Machine Electrical
torque with PSS is depicted by blue curve and changes
without PSS is depicted by red curve, where it can be
observed from the below plot that at t = 10 sec, there is no
magnitude difference in oscillations but at t = 12 sec,
oscillations are from 1 to 1.50 without PSS and from 1 to
1.25 with PSS, which depicts decease in magnitude of
oscillation by 50%. At t = 14 sec, oscillations are from 1 to
1.25 without PSS and from 1 to 1.12 with PSS, which shows
oscillation decrement by 52%. At 15 sec the decrement is
almost 100%.
Main : Graphs
9.0 10.0 11.0 12.0 13.0 14.0 15.0 16.0 17.0 18.0 ...
...
...
-1.00
-0.50
0.00
0.50
1.00
1.50
2.00
2.50
y (
pu
)
Machine Electrical Torque w ith No PSS Machine Electrical Torque w ith PSS
Figure 7: Machine Electrical torque (pu) with and without
PSS for a 3-phase fault of 0.1 sec duration with and without
PSS
5.1.6 Plot of Speed of generator
Plot of Speed of generator (pu) time (sec) with and without
PSS, obtained by simulation is shown in Figure 8 depicts the
changes in Speed of generator (pu) against time (sec) with
and without a PSS when the integrated system is subjected to
a three phase fault starting at 10 sec and lasted for the
duration of 0.1 sec. Changes in Speed of generator with PSS
is depicted by blue curve and changes without PSS is
depicted by red curve, where it can observed from the below
plot that at t = 10 sec, there is no magnitude difference in
oscillations but at t = 12 sec, oscillations are from 1 to
1.0080 without PSS and from 1 to 1.0062 with PSS, which
depicts decease in magnitude of oscillation by 22.50%. At t =
14 sec, oscillations are from 1 to 1.0030 without PSS and
from 1 to 1.0012 with PSS, which shows oscillation
decrement by 60%. At 15 sec the decrement is almost 100%.
Main : Graphs
Time S 8.0 10.0 12.0 14.0 16.0 18.0 20.0 22.0 ...
...
...
0.9800
0.9850
0.9900
0.9950
1.0000
1.0050
1.0100
1.0150
1.0200
Sp
ee
d o
f G
en
era
tor
(pu
)
Speed w ith No PSS Speed w ith PSS
Figure 8: Speed of generator (pu) against time (sec) for a 3-
phase fault of 0.1 sec duration with and without PSS
Paper ID: SUB154694 2110
International Journal of Science and Research (IJSR) ISSN (Online): 2319-7064
Index Copernicus Value (2013): 6.14 | Impact Factor (2013): 4.438
Volume 4 Issue 5, May 2015
www.ijsr.net Licensed Under Creative Commons Attribution CC BY
5.2 When there is a three phase fault at time 10.0 s and
the fault duration is 0.2s
The changes in integrated system behavior are analyzed by
creating a three phase fault at 10 sec and this time with 0.1
sec increase in the fault duration i.e. system analyzed under
the effect of fault for 0.2 sec.
5.2.1 Plot of Voltage
Main : Graphs
Time S 9.900 9.950 10.000 10.050 10.100 10.150 10.200 10.250 10.300 ...
...
...
-10.0
-7.5
-5.0
-2.5
0.0
2.5
5.0
7.5
10.0
Vo
lta
ge
(kV
)
Vins
Figure 9: Voltage (kV) against time (sec) for a 3-phase fault
of 0.2 sec duration
Plot of Voltage (kV) against time (sec) obtained by
simulation is shown in Figure 10 depicts the changes in Grid
Voltage in kV against time when the integrated system is
subjected to a three phase fault starting at 10 sec and lasted
for the duration of 0.2 sec:
5.2.2 Plot of Fault current
Plot of Fault current (kA) against time (sec) obtained by
simulation is shown in Figure 10 depicts the Fault current
(kA) in the grid against time (sec) for the three phase fault of
0.2 sec duration.
Main : Graphs
Time S 9.900 9.950 10.000 10.050 10.100 10.150 10.200 10.250 10.300 ...
...
...
-6.0
-4.0
-2.0
0.0
2.0
4.0
6.0
Fa
ult
Cu
rre
nt
(kA
)
Ifa Ifb Ifc
Figure 10: Fault current (kA) against time (sec) for 0.2 sec
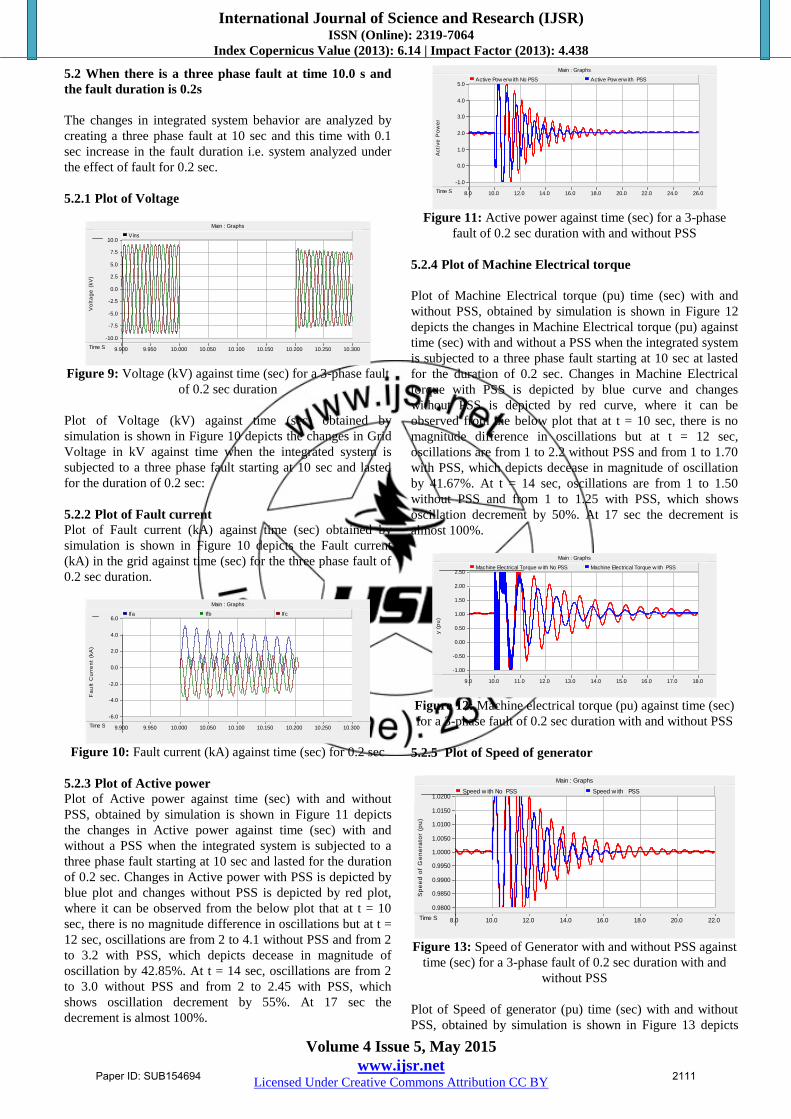
5.2.3 Plot of Active power
Plot of Active power against time (sec) with and without
PSS, obtained by simulation is shown in Figure 11 depicts
the changes in Active power against time (sec) with and
without a PSS when the integrated system is subjected to a
three phase fault starting at 10 sec and lasted for the duration
of 0.2 sec. Changes in Active power with PSS is depicted by
blue plot and changes without PSS is depicted by red plot,
where it can be observed from the below plot that at t = 10
sec, there is no magnitude difference in oscillations but at t =
12 sec, oscillations are from 2 to 4.1 without PSS and from 2
to 3.2 with PSS, which depicts decease in magnitude of
oscillation by 42.85%. At t = 14 sec, oscillations are from 2
to 3.0 without PSS and from 2 to 2.45 with PSS, which
shows oscillation decrement by 55%. At 17 sec the
decrement is almost 100%.
Main : Graphs
Time S 8.0 10.0 12.0 14.0 16.0 18.0 20.0 22.0 24.0 26.0 ...
...
...
-1.0
0.0
1.0
2.0
3.0
4.0
5.0
Acti
ve
Po
we
r
Active Pow erw ith No PSS Active Pow erw ith PSS
Figure 11: Active power against time (sec) for a 3-phase
fault of 0.2 sec duration with and without PSS
5.2.4 Plot of Machine Electrical torque
Plot of Machine Electrical torque (pu) time (sec) with and
without PSS, obtained by simulation is shown in Figure 12
depicts the changes in Machine Electrical torque (pu) against
time (sec) with and without a PSS when the integrated system
is subjected to a three phase fault starting at 10 sec at lasted
for the duration of 0.2 sec. Changes in Machine Electrical
torque with PSS is depicted by blue curve and changes
without PSS is depicted by red curve, where it can be
observed from the below plot that at t = 10 sec, there is no
magnitude difference in oscillations but at t = 12 sec,
oscillations are from 1 to 2.2 without PSS and from 1 to 1.70
with PSS, which depicts decease in magnitude of oscillation
by 41.67%. At t = 14 sec, oscillations are from 1 to 1.50
without PSS and from 1 to 1.25 with PSS, which shows
oscillation decrement by 50%. At 17 sec the decrement is
almost 100%.
Main : Graphs
9.0 10.0 11.0 12.0 13.0 14.0 15.0 16.0 17.0 18.0 ...
...
...
-1.00
-0.50
0.00
0.50
1.00
1.50
2.00
2.50
y (
pu
)
Machine Electrical Torque w ith No PSS Machine Electrical Torque w ith PSS
Figure 12: Machine electrical torque (pu) against time (sec)
for a 3-phase fault of 0.2 sec duration with and without PSS
5.2.5 Plot of Speed of generator
Main : Graphs
Time S 8.0 10.0 12.0 14.0 16.0 18.0 20.0 22.0 ...
...
...
0.9800
0.9850
0.9900
0.9950
1.0000
1.0050
1.0100
1.0150
1.0200
Sp
ee
d o
f G
en
era
tor
(pu
)
Speed w ith No PSS Speed w ith PSS
Figure 13: Speed of Generator with and without PSS against
time (sec) for a 3-phase fault of 0.2 sec duration with and
without PSS
Plot of Speed of generator (pu) time (sec) with and without
PSS, obtained by simulation is shown in Figure 13 depicts
Paper ID: SUB154694 2111
International Journal of Science and Research (IJSR) ISSN (Online): 2319-7064
Index Copernicus Value (2013): 6.14 | Impact Factor (2013): 4.438
Volume 4 Issue 5, May 2015
www.ijsr.net Licensed Under Creative Commons Attribution CC BY
the changes in Speed of generator (pu) against time (sec)
with and without a PSS when the integrated system is
subjected to a three phase fault starting at 10 sec and lasted
for the duration of 0.2 sec. Changes in Speed of generator
with PSS is depicted by blue curve and changes without PSS
is depicted by red curve, where it can be observed from the
below plot that at t = 10 sec, there is no magnitude difference
in oscillations but at t = 12 sec, oscillations are from 1 to
1.0200 without PSS and from 1 to 1.0140 with PSS, which
depicts decease in magnitude of oscillation by 30%. At t = 14
sec, oscillations are from 1 to 1.0090 without PSS and from 1
to 1.0050 with PSS, which shows oscillation decrement by
44.44%. At 17 sec the decrement is almost 100%.
5.3 When there is a three phase fault at time 10.0 s and
the fault duration is 0.3s
The changes in integrated system behavior are analyzed by
creating a three phase fault at 10 sec and again by increasing
the duration of fault by 0.1 sec i.e. this time the integrated
system analyzed under the effect of fault duration of 0.3 sec.
5.3.1 Plot of Voltage
Plot of Voltage (kV) against time (sec) obtained by using
simulation is shown in Figure 14 depicts the changes in Grid
Voltage in kV against time when the integrated system is
subjected to a three phase fault starting at 10 sec and lasted
for the duration of 0.3 sec:
Main : Graphs
Time S 9.900 9.950 10.000 10.050 10.100 10.150 10.200 10.250 10.300 10.350 10.400 ...
...
...
-10.0
-7.5
-5.0
-2.5
0.0
2.5
5.0
7.5
10.0
Vo
lta
ge
(kV
)
Vins
Figure 14: Grid voltage (kV) against time (sec) for a 3-phase
fault of 0.3 sec duration
5.3.2 Plot of Fault current
Plot of Fault current (kA) against time (sec) obtained by
simulation is shown in Figure 15 depicts the Fault current
(kA) in the grid against time (sec) for the three phase fault of
0.3 sec duration:
Main : Graphs
Time S 9.900 9.950 10.000 10.050 10.100 10.150 10.200 10.250 10.300 10.350 10.400 ...
...
...
-6.0
-4.0
-2.0
0.0
2.0
4.0
6.0
Fa
ult
Cu
rre
nt
(kA
)
Ifa Ifb Ifc
Figure 15: Fault current (kA) against time (sec) for 0.3 sec
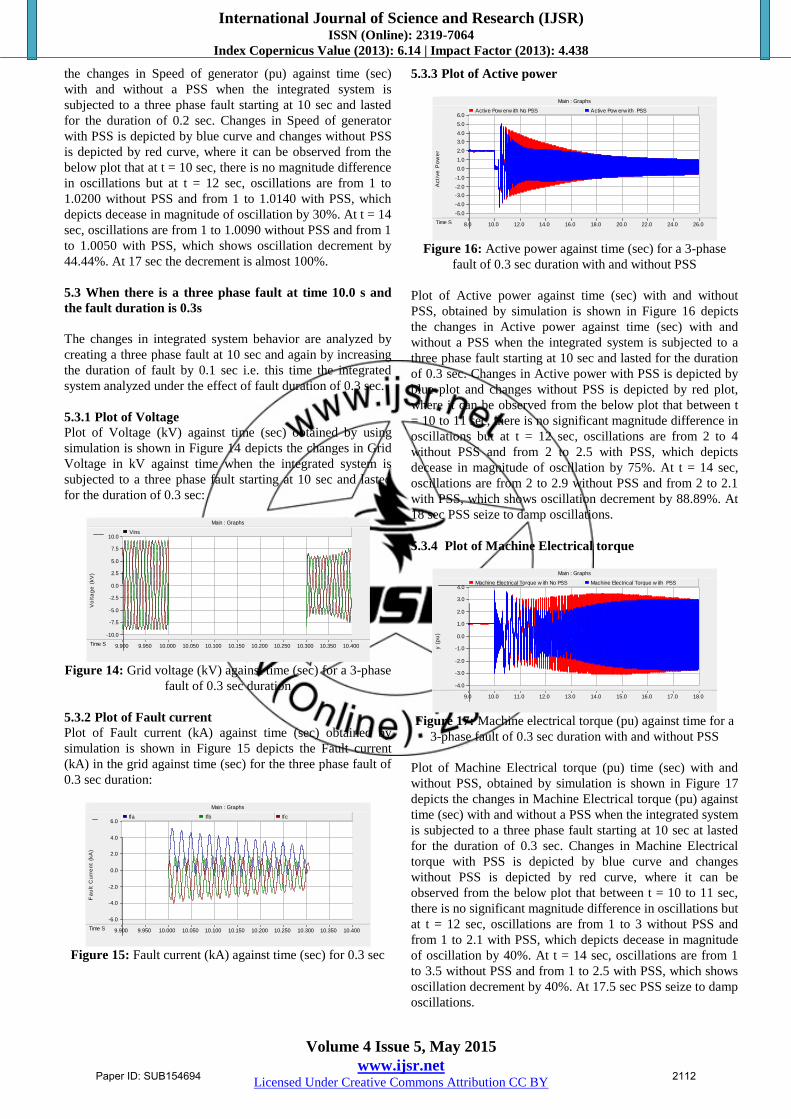
5.3.3 Plot of Active power
Main : Graphs
Time S 8.0 10.0 12.0 14.0 16.0 18.0 20.0 22.0 24.0 26.0 ...
...
...
-5.0
-4.0
-3.0
-2.0
-1.0
0.0
1.0
2.0
3.0
4.0
5.0
6.0
Acti
ve
Po
we
r
Active Pow erw ith No PSS Active Pow erw ith PSS
Figure 16: Active power against time (sec) for a 3-phase
fault of 0.3 sec duration with and without PSS
Plot of Active power against time (sec) with and without
PSS, obtained by simulation is shown in Figure 16 depicts
the changes in Active power against time (sec) with and
without a PSS when the integrated system is subjected to a
three phase fault starting at 10 sec and lasted for the duration
of 0.3 sec. Changes in Active power with PSS is depicted by
blue plot and changes without PSS is depicted by red plot,
where it can be observed from the below plot that between t
= 10 to 11 sec, there is no significant magnitude difference in
oscillations but at t = 12 sec, oscillations are from 2 to 4
without PSS and from 2 to 2.5 with PSS, which depicts
decease in magnitude of oscillation by 75%. At t = 14 sec,
oscillations are from 2 to 2.9 without PSS and from 2 to 2.1
with PSS, which shows oscillation decrement by 88.89%. At
18 sec PSS seize to damp oscillations.
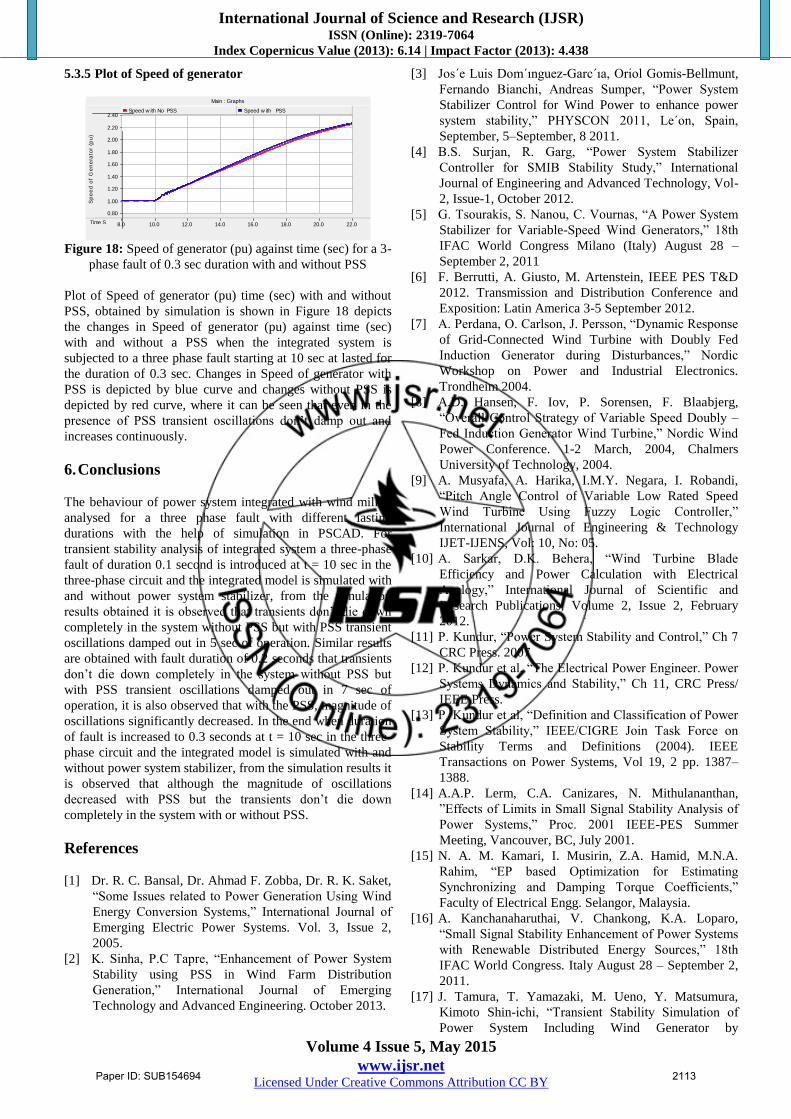
5.3.4 Plot of Machine Electrical torque
Main : Graphs
9.0 10.0 11.0 12.0 13.0 14.0 15.0 16.0 17.0 18.0 ...
...
...
-4.0
-3.0
-2.0
-1.0
0.0
1.0
2.0
3.0
4.0
y (
pu
)
Machine Electrical Torque w ith No PSS Machine Electrical Torque w ith PSS
Figure 17: Machine electrical torque (pu) against time for a
3-phase fault of 0.3 sec duration with and without PSS
Plot of Machine Electrical torque (pu) time (sec) with and
without PSS, obtained by simulation is shown in Figure 17
depicts the changes in Machine Electrical torque (pu) against
time (sec) with and without a PSS when the integrated system
is subjected to a three phase fault starting at 10 sec at lasted
for the duration of 0.3 sec. Changes in Machine Electrical
torque with PSS is depicted by blue curve and changes
without PSS is depicted by red curve, where it can be
observed from the below plot that between t = 10 to 11 sec,
there is no significant magnitude difference in oscillations but
at t = 12 sec, oscillations are from 1 to 3 without PSS and
from 1 to 2.1 with PSS, which depicts decease in magnitude
of oscillation by 40%. At t = 14 sec, oscillations are from 1
to 3.5 without PSS and from 1 to 2.5 with PSS, which shows
oscillation decrement by 40%. At 17.5 sec PSS seize to damp
oscillations.
Paper ID: SUB154694 2112
International Journal of Science and Research (IJSR) ISSN (Online): 2319-7064
Index Copernicus Value (2013): 6.14 | Impact Factor (2013): 4.438
Volume 4 Issue 5, May 2015
www.ijsr.net Licensed Under Creative Commons Attribution CC BY
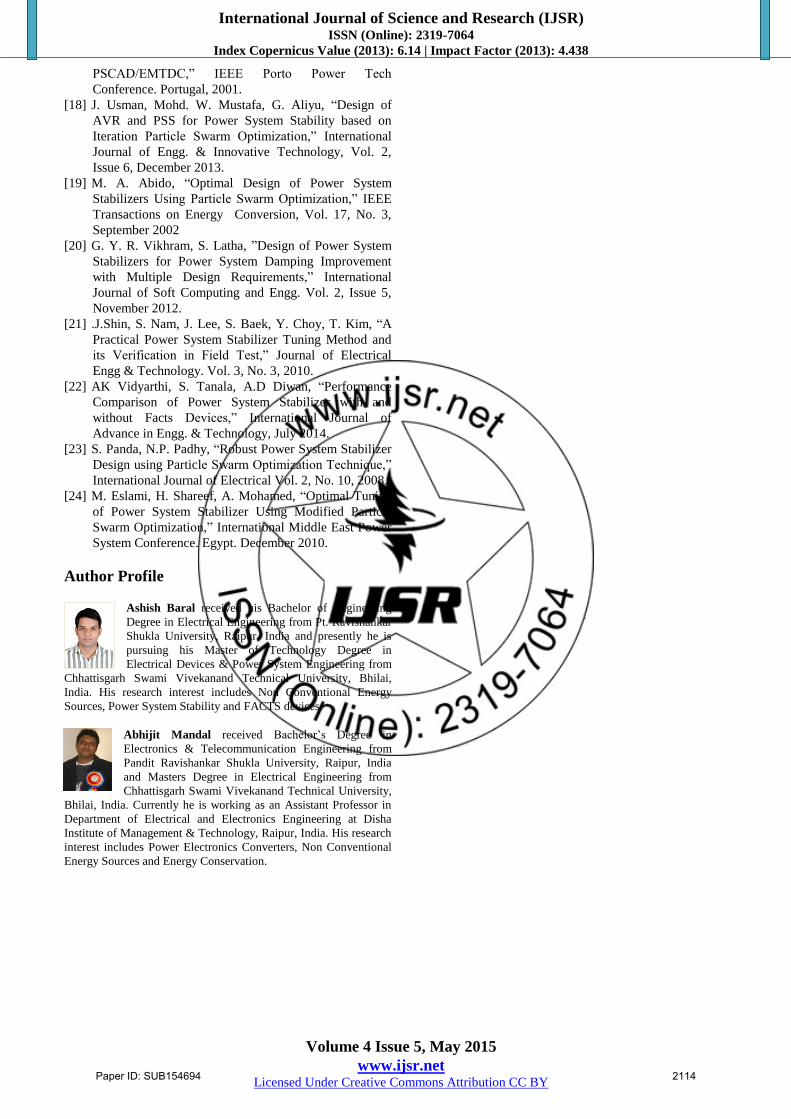
5.3.5 Plot of Speed of generator
Main : Graphs
Time S 8.0 10.0 12.0 14.0 16.0 18.0 20.0 22.0 ...
...
...
0.80
1.00
1.20
1.40
1.60
1.80
2.00
2.20
2.40
Sp
ee
d o
f G
en
era
tor
(pu
)
Speed w ith No PSS Speed w ith PSS
Figure 18: Speed of generator (pu) against time (sec) for a 3-
phase fault of 0.3 sec duration with and without PSS
Plot of Speed of generator (pu) time (sec) with and without
PSS, obtained by simulation is shown in Figure 18 depicts
the changes in Speed of generator (pu) against time (sec)
with and without a PSS when the integrated system is
subjected to a three phase fault starting at 10 sec at lasted for
the duration of 0.3 sec. Changes in Speed of generator with
PSS is depicted by blue curve and changes without PSS is
depicted by red curve, where it can be seen that even in the
presence of PSS transient oscillations don’t damp out and
increases continuously.
6. Conclusions
The behaviour of power system integrated with wind mill is
analysed for a three phase fault with different lasting
durations with the help of simulation in PSCAD. For
transient stability analysis of integrated system a three-phase
fault of duration 0.1 second is introduced at t = 10 sec in the
three-phase circuit and the integrated model is simulated with
and without power system stabilizer, from the simulation
results obtained it is observed that transients don’t die down
completely in the system without PSS but with PSS transient
oscillations damped out in 5 sec of operation. Similar results
are obtained with fault duration of 0.2 seconds that transients
don’t die down completely in the system without PSS but
with PSS transient oscillations damped out in 7 sec of
operation, it is also observed that with the PSS, magnitude of
oscillations significantly decreased. In the end when duration
of fault is increased to 0.3 seconds at t = 10 sec in the three-
phase circuit and the integrated model is simulated with and
without power system stabilizer, from the simulation results it
is observed that although the magnitude of oscillations
decreased with PSS but the transients don’t die down
completely in the system with or without PSS.
References
[1] Dr. R. C. Bansal, Dr. Ahmad F. Zobba, Dr. R. K. Saket,
“Some Issues related to Power Generation Using Wind
Energy Conversion Systems,” International Journal of
Emerging Electric Power Systems. Vol. 3, Issue 2,
2005.
[2] K. Sinha, P.C Tapre, “Enhancement of Power System
Stability using PSS in Wind Farm Distribution
Generation,” International Journal of Emerging
Technology and Advanced Engineering. October 2013.
[3] Jos´e Luis Dom´ınguez-Garc´ıa, Oriol Gomis-Bellmunt,
Fernando Bianchi, Andreas Sumper, “Power System
Stabilizer Control for Wind Power to enhance power
system stability,” PHYSCON 2011, Le´on, Spain,
September, 5–September, 8 2011.
[4] B.S. Surjan, R. Garg, “Power System Stabilizer
Controller for SMIB Stability Study,” International
Journal of Engineering and Advanced Technology, Vol-
2, Issue-1, October 2012.
[5] G. Tsourakis, S. Nanou, C. Vournas, “A Power System
Stabilizer for Variable-Speed Wind Generators,” 18th
IFAC World Congress Milano (Italy) August 28 –
September 2, 2011
[6] F. Berrutti, A. Giusto, M. Artenstein, IEEE PES T&D
2012. Transmission and Distribution Conference and
Exposition: Latin America 3-5 September 2012.
[7] A. Perdana, O. Carlson, J. Persson, “Dynamic Response
of Grid-Connected Wind Turbine with Doubly Fed
Induction Generator during Disturbances,” Nordic
Workshop on Power and Industrial Electronics.
Trondheim 2004.
[8] A.D. Hansen, F. Iov, P. Sorensen, F. Blaabjerg,
“Overall Control Strategy of Variable Speed Doubly –
Fed Induction Generator Wind Turbine,” Nordic Wind
Power Conference. 1-2 March, 2004, Chalmers
University of Technology, 2004.
[9] A. Musyafa, A. Harika, I.M.Y. Negara, I. Robandi,
“Pitch Angle Control of Variable Low Rated Speed
Wind Turbine Using Fuzzy Logic Controller,”
International Journal of Engineering & Technology
IJET-IJENS, Vol: 10, No: 05.
[10] A. Sarkar, D.K. Behera, “Wind Turbine Blade
Efficiency and Power Calculation with Electrical
Analogy,” International Journal of Scientific and
Research Publications, Volume 2, Issue 2, February
2012.
[11] P. Kundur, “Power System Stability and Control,” Ch 7
CRC Press. 2007
[12] P. Kundur et al, “The Electrical Power Engineer. Power
Systems Dynamics and Stability,” Ch 11, CRC Press/
IEEE Press.
[13] P. Kundur et al, “Definition and Classification of Power
System Stability,” IEEE/CIGRE Join Task Force on
Stability Terms and Definitions (2004). IEEE
Transactions on Power Systems, Vol 19, 2 pp. 1387–
1388.
[14] A.A.P. Lerm, C.A. Canizares, N. Mithulananthan,
”Effects of Limits in Small Signal Stability Analysis of
Power Systems,” Proc. 2001 IEEE-PES Summer
Meeting, Vancouver, BC, July 2001.
[15] N. A. M. Kamari, I. Musirin, Z.A. Hamid, M.N.A.
Rahim, “EP based Optimization for Estimating
Synchronizing and Damping Torque Coefficients,”
Faculty of Electrical Engg. Selangor, Malaysia.
[16] A. Kanchanaharuthai, V. Chankong, K.A. Loparo,
“Small Signal Stability Enhancement of Power Systems
with Renewable Distributed Energy Sources,” 18th
IFAC World Congress. Italy August 28 – September 2,
2011.
[17] J. Tamura, T. Yamazaki, M. Ueno, Y. Matsumura,
Kimoto Shin-ichi, “Transient Stability Simulation of
Power System Including Wind Generator by
Paper ID: SUB154694 2113
International Journal of Science and Research (IJSR) ISSN (Online): 2319-7064
Index Copernicus Value (2013): 6.14 | Impact Factor (2013): 4.438
Volume 4 Issue 5, May 2015
www.ijsr.net Licensed Under Creative Commons Attribution CC BY
PSCAD/EMTDC,” IEEE Porto Power Tech
Conference. Portugal, 2001.
[18] J. Usman, Mohd. W. Mustafa, G. Aliyu, “Design of
AVR and PSS for Power System Stability based on
Iteration Particle Swarm Optimization,” International
Journal of Engg. & Innovative Technology, Vol. 2,
Issue 6, December 2013.
[19] M. A. Abido, “Optimal Design of Power System
Stabilizers Using Particle Swarm Optimization,” IEEE
Transactions on Energy Conversion, Vol. 17, No. 3,
September 2002
[20] G. Y. R. Vikhram, S. Latha, ”Design of Power System
Stabilizers for Power System Damping Improvement
with Multiple Design Requirements,” International
Journal of Soft Computing and Engg. Vol. 2, Issue 5,
November 2012.
[21] .J.Shin, S. Nam, J. Lee, S. Baek, Y. Choy, T. Kim, “A
Practical Power System Stabilizer Tuning Method and
its Verification in Field Test,” Journal of Electrical
Engg & Technology. Vol. 3, No. 3, 2010.
[22] AK Vidyarthi, S. Tanala, A.D Diwan, “Performance
Comparison of Power System Stabilizer with and
without Facts Devices,” International Journal of
Advance in Engg. & Technology, July 2014.
[23] S. Panda, N.P. Padhy, “Robust Power System Stabilizer
Design using Particle Swarm Optimization Technique,”
International Journal of Electrical Vol. 2, No. 10, 2008.
[24] M. Eslami, H. Shareef, A. Mohamed, “Optimal Tuning
of Power System Stabilizer Using Modified Particle
Swarm Optimization,” International Middle East Power
System Conference. Egypt. December 2010.
Author Profile
Ashish Baral received his Bachelor of Engineering
Degree in Electrical Engineering from Pt. Ravishankar
Shukla University, Raipur, India and presently he is
pursuing his Master of Technology Degree in
Electrical Devices & Power System Engineering from
Chhattisgarh Swami Vivekanand Technical University, Bhilai,
India. His research interest includes Non Conventional Energy
Sources, Power System Stability and FACTS devices.
Abhijit Mandal received Bachelor’s Degree in
Electronics & Telecommunication Engineering from
Pandit Ravishankar Shukla University, Raipur, India
and Masters Degree in Electrical Engineering from
Chhattisgarh Swami Vivekanand Technical University,
Bhilai, India. Currently he is working as an Assistant Professor in
Department of Electrical and Electronics Engineering at Disha
Institute of Management & Technology, Raipur, India. His research
interest includes Power Electronics Converters, Non Conventional
Energy Sources and Energy Conservation.
Paper ID: SUB154694 2114