Trail Town Business Survey Final Report · 2012 Trail Town Business Survey Report for The Progress...
21
2012 Trail Town Business Survey Report for The Progress Fund May, 2012 Center for Regional Progress College of Business Frostburg State University Frostburg, Maryland 21532
Transcript of Trail Town Business Survey Final Report · 2012 Trail Town Business Survey Report for The Progress...

2012 Trail Town Business Survey Report for
The Progress Fund
May, 2012
Center for Regional Progress College of Business
Frostburg State University Frostburg, Maryland 21532
2012 Trail Town Survey Center for Regional Progress Frostburg State University May, 2012 Page 1
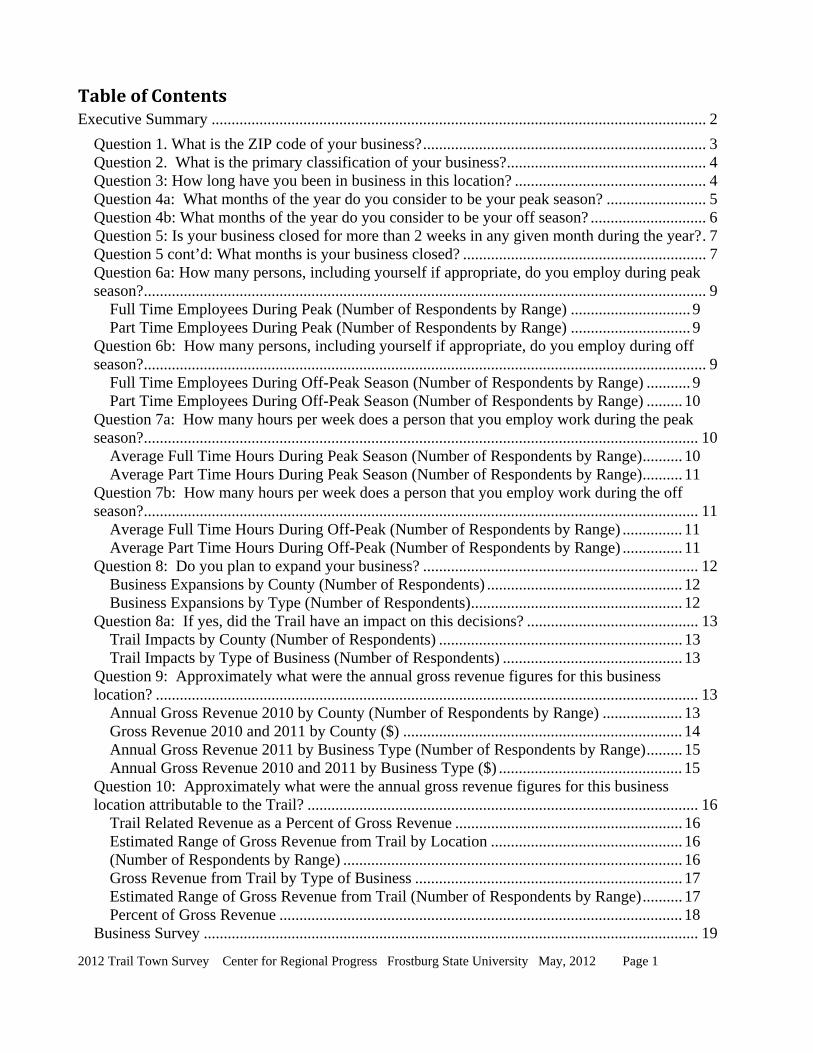
Table of Contents Executive Summary ............................................................................................................................ 2
Question 1. What is the ZIP code of your business? ....................................................................... 3 Question 2. What is the primary classification of your business? .................................................. 4 Question 3: How long have you been in business in this location? ................................................ 4 Question 4a: What months of the year do you consider to be your peak season? ......................... 5 Question 4b: What months of the year do you consider to be your off season? ............................. 6 Question 5: Is your business closed for more than 2 weeks in any given month during the year? . 7 Question 5 cont’d: What months is your business closed? ............................................................. 7 Question 6a: How many persons, including yourself if appropriate, do you employ during peak season? ............................................................................................................................................. 9
Full Time Employees During Peak (Number of Respondents by Range) .............................. 9 Part Time Employees During Peak (Number of Respondents by Range) .............................. 9
Question 6b: How many persons, including yourself if appropriate, do you employ during off season? ............................................................................................................................................. 9
Full Time Employees During Off-Peak Season (Number of Respondents by Range) ........... 9 Part Time Employees During Off-Peak Season (Number of Respondents by Range) ......... 10
Question 7a: How many hours per week does a person that you employ work during the peak season? ........................................................................................................................................... 10
Average Full Time Hours During Peak Season (Number of Respondents by Range) .......... 10 Average Part Time Hours During Peak Season (Number of Respondents by Range) .......... 11
Question 7b: How many hours per week does a person that you employ work during the off season? ........................................................................................................................................... 11
Average Full Time Hours During Off-Peak (Number of Respondents by Range) ............... 11 Average Part Time Hours During Off-Peak (Number of Respondents by Range) ............... 11
Question 8: Do you plan to expand your business? ..................................................................... 12 Business Expansions by County (Number of Respondents) ................................................. 12 Business Expansions by Type (Number of Respondents) ..................................................... 12
Question 8a: If yes, did the Trail have an impact on this decisions? ........................................... 13 Trail Impacts by County (Number of Respondents) ............................................................. 13 Trail Impacts by Type of Business (Number of Respondents) ............................................. 13
Question 9: Approximately what were the annual gross revenue figures for this business location? ........................................................................................................................................ 13
Annual Gross Revenue 2010 by County (Number of Respondents by Range) .................... 13 Gross Revenue 2010 and 2011 by County ($) ...................................................................... 14 Annual Gross Revenue 2011 by Business Type (Number of Respondents by Range) ......... 15 Annual Gross Revenue 2010 and 2011 by Business Type ($) .............................................. 15
Question 10: Approximately what were the annual gross revenue figures for this business location attributable to the Trail? .................................................................................................. 16
Trail Related Revenue as a Percent of Gross Revenue ......................................................... 16 Estimated Range of Gross Revenue from Trail by Location ................................................ 16 (Number of Respondents by Range) ..................................................................................... 16 Gross Revenue from Trail by Type of Business ................................................................... 17 Estimated Range of Gross Revenue from Trail (Number of Respondents by Range) .......... 17 Percent of Gross Revenue ..................................................................................................... 18
Business Survey ............................................................................................................................ 19

2012 Trail Town Survey Center for Regional Progress Frostburg State University May, 2012 Page 2
Executive Summary
The Great Allegheny Passage runs through several counties and affects a variety of businesses because of the number of visitors to the trail. The 91 businesses that responded to this survey were in five counties: Allegheny, PA, Westmoreland, PA, Fayette, PA, Somerset, PA, and Allegany, MD. The majority of responding businesses were classified as a hotel/motel/B&B. Retail/gift/specialty stores and Bike rental/sales/supplies store were the second most cited groups. Most responding businesses (18) had been open of 6-10 years. However, the distribution was relatively equal with those that been open 3-5 years (17) equal to those that had been opened 21-40 years. One average the businesses had been open 16.7 years.
Not surprisingly, summer and fall were the peak seasons for the trail businesses. Winter was the season that most businesses saw a downturn in trail user business. However, only 23 of the 88 responding businesses close for more than two weeks during the year, most commonly in December and January.
The responding trail businesses were generally small in terms of employment. Most responding businesses (43 of 88) use one to five full time employees. Most responding businesses (33 of 88) also use one to five part time employees.
The same pattern occurs for the off peak season. Most responding businesses (37 of 88) use
one to five full time employees. Most responding businesses (23 of 88) also use one to five part time employees.
The majority of responding businesses (42) said that full time employees worked between
31 and 40 hours per week in the off peak season. The majority of responding businesses (24) said that part time employees worked between 16 and 30 hours per week in the off peak season.
When asked if they planned to expand, only 30 percent of businesses said yes. This is
somewhat below the 32% that said yes in the 2008-2009 survey. When asked if the trail affected this decision 14 of the 30 businesses said yes.
About one-fourth of responding businesses reported gross revenue of more than $250K.
Comparing 2010 and 2011, responding businesses in every county reported an increase in gross revenues. Responding businesses in all but two business types reported an increase also. Retail and outdoor trail business showed a small percent decrease. Responding businesses reported about one-third of their gross revenue can be attributed to the trail.
On average about 30 percent of gross revenues were attributed to the trail. This is higher
than the 25.5% reported in the 2008-2009 survey.

2012 Trail Town Survey Center for Regional Progress Frostburg State University May, 2012 Page 3
Estimated annual revenues generated from the trail per establishment was computed using reported annual gross revenue values, and the reported percentage of gross revenue from trail use. At the county aggregation level, the weighted average annual revenue generated from the trail per establishment was about $650,000. At the firm type aggregation level, the weighted average annual revenues generated from the trail per establishment was $2.1 million.
Question 1. What is the ZIP code of your business?
Total % Lodging Restaurant RetailOutdoor/Trail
Business Other 88 31 22 12 9 14
Allegheny County, PA 8 9.1% 3 3 0 1 1 Westmoreland County, PA 6 6.8% 1 2 1 1 1
Fayette County, PA 19 21.6% 6 3 3 3 4 Somerset County, PA 33 37.5% 15 9 2 2 5 Allegany County, MD 22 25.0% 6 5 6 2 3
All (100.0%) of the respondents reported that their business location to be in one of the five primary counties through which the trail passes: Allegheny, Westmoreland, Fayette, and Somerset Counties in Pennsylvania and Allegany County in Maryland compared to 70.0% in 2007.
2012 Trail Town Survey Center for Regional Progress Frostburg State University May, 2012 Page 4
Question 2. What is the primary classification of your business?
Primary Business Classification
Percent Responses: 91 Lodging 32 35.2% Hotel/motel/B&B (23) Campgrounds (9) Restaurant/tavern/café/ice cream shop 24 26.4% Retail 24 26.4% Retail/gift/specialty store (16) Convenience/grocery store (8) Outdoor/Trail related business 9 9.9% Bike rental/sales/supplies (7) Outdoor recreation/outfitter (2) Other 2 2.2%
Most of the respondents (35.2%) of the respondents described their business as either a lodging. Approximately one fourth (26.4%) mentioned operating a restaurant/café/ice cream shop and about ten percent operated an outdoor/trail related businesses.
Question 3: How long have you been in business in this location?
• Age of Business (Number of Respondents by Range)
•
Total Lodging Restaurant RetailOutdoor/Trail
Business OtherResponses: 84 32 20 12 9 11 1-2 years 11 4 3 2 0 2 3-5 years 17 8 5 1 3 0 6-10 years 18 7 4 2 3 2 11-20 years 14 6 4 1 1 2 21-40 years 17 6 1 5 2 3 More than 40 years 7 1 3 1 0 2 Mean (years) 16.7 13.2 15.9 18.9 11.4 26.0
•

2012 Trail Town Survey Center for Regional Progress Frostburg State University May, 2012 Page 5
On Average, the respondents tended to have businesses that were in these locations for a period of 16.7 years.
This average was influenced primarily by the majority (58.3%) of respondents that cited either 6-20 years (38.1%) or 21-40 years (20.2%).
Fewer than one in four businesses each reported operating at their current locations for
either 1-2 years, 3-5 years, or more than 40 years (13.1%, 20.2%, and 8.3%, respectively).
Question 4a: What months of the year do you consider to be your peak season?
Peak Season Months (Number of Respondents)
Total Lodging Restaurant RetailOutdoor/Trail
Business OtherTotal Months
Selected: 463 158 136 59 45 65 (Net) Spring 89 23 31 9 11 15
% Spring Months 19.2% March 9 0 4 1 0 4 April 30 8 9 3 4 6 May 50 15 18 5 7 5
(Net) Summer 200 74 52 22 26 26 % Spring Months 43.2%
June 66 24 17 7 9 9 July 67 25 17 7 9 9
August 67 25 18 8 8 8 (Net) Fall 138 58 41 19 8 12
% Fall Months 29.8% September 62 29 18 7 5 3
October 55 26 15 7 3 4 November 21 3 8 5 0 5
(Net) Winter 36 3 12 9 0 12 % Winter Months 7.8%
December 22 1 9 6 0 6 January 5 1 1 1 0 2
February 9 1 2 2 0 4
More than three in four (85.7%) of the reported that they experience the majority and/or all of their peak sales months during what is considered to be the bike season (April to October).

2012 Trail Town Survey Center for Regional Progress Frostburg State University May, 2012 Page 6
Approximately half (50.9%) of the respondents each mentioned peak sales months during either summer (June, July and/or August) (43.2%) and/or winter (December, January and/or February) (7.7%).
Question 4b: What months of the year do you consider to be your off season?
Off Season Months (Number of Respondents)
Total Lodging Restaurant RetailOutdoor/Trail
Business OtherResponses: 340 145 75 30 48 42 (Net) Spring 86 45 15 9 10 7
% Spring Months 25.3% March 50 25 10 5 7 3 April 27 15 5 3 3 1 May 9 5 0 1 0 3 (Net) Summer 21 3 8 2 0 8
% Spring Months 6.2% June 6 2 2 0 0 2 July 8 1 4 1 0 2 August 7 0 2 1 0 4 (Net) Fall 62 25 12 5 12 8
% Fall Months 18.2% September 6 0 1 1 1 3 October 13 2 3 2 3 3 November 43 23 8 2 8 2 (Net) Winter 171 72 40 14 26 19
% Winter Months 50.3% December 47 24 7 3 8 5 January 64 24 17 5 9 9 February 60 24 16 6 9 5
Accordingly, businesses most frequently mentioned experiencing off-peak sales during winter (50.3% -- December, January and/or February). About one in four (25.3%) respondents reported that they experience off-peak sales during spring (March, April and/or May) and less than one in ten (6.2%) mentioned summer (June, July and/or August).

2012 Trail Town Survey Center for Regional Progress Frostburg State University May, 2012 Page 7
Question 5: Is your business closed for more than 2 weeks in any given month during the year?
Closures (Number of Respondents)
Total Lodging Restaurant Retail Outdoor/Trail Business
Other
Responses: 89 33 22 12 9 14 Less than 2 Weeks
66 24 19 8 5 10
More than 2 Weeks
23 9 3 4 4 4
Most firms were closed less than two weeks and this occurred primarily in the winter months.
Question 5 cont’d: What months is your business closed?
0 5 10 15 20 25
Jan
Feb
Mar
Apr
May
Jun
Jul
Aug
Sep
Oct
Nov
Dec

2012 Trail Town Survey Center for Regional Progress Frostburg State University May, 2012 Page 8
Closure Months (Number of Respondents)
Total Lodging Restaurant Retail
Outdoor / Trail
Business Other Total Months
Selected: 52 19 8 8 9 8 January 22 8 2 4 4 4
February 21 8 2 4 4 3 March 16 7 1 4 2 2 April 5 1 1 1 1 1 May 0 0 0 0 0 0 June 0 0 0 0 0 0 July 0 0 0 0 0 0
August 1 0 1 0 0 0 September 0 0 0 0 0 0
October 3 1 1 0 1 0 November 11 4 2 1 2 2 December 16 6 2 2 3 3
Of the months that businesses were closed January, February and December had closure from each type of business including lodging, restaurant and retail stores.

2012 Trail Town Survey Center for Regional Progress Frostburg State University May, 2012 Page 9
Question 6a: How many persons, including yourself if appropriate, do you employ during peak season?
Full Time Employees During Peak (Number of Respondents by Range)
Total Lodging Restaurant Retail
Outdoor/ Trail
Business OtherResponses: 68 24 20 7 7 10 1- 5 people 43 14 14 5 5 5
6- 10 people 11 2 3 1 1 4 11- 25 people 8 3 2 1 1 1 More than 25 3 2 1 0 0 0
Mean 16.25 5.3 5.0 1.8 1.8 2.5
Part Time Employees During Peak (Number of Respondents by Range)
Total Lodging Restaurant Retail
Outdoor/ Trail
Business OtherResponses: 63 22 19 7 7 8 1- 5 people 33 16 5 4 4 4
6- 10 people 14 1 8 1 3 1 11- 25 people 11 2 5 1 1 2 More than 25 5 3 1 0 0 1
Mean 15.75 5.5 4.75 1.5 2 2
Most businesses used more full than part time employees during the peak season. Most businesses employed less than 5 persons in both full and part time capacity.
Question 6b: How many persons, including yourself if appropriate, do you employ during off season?
Full Time Employees During Off-Peak Season (Number of Respondents by Range)
Total Lodging Restaurant Retail
Outdoor/ Trail
Business OtherResponses: 63 20 17 7 8 11 1- 5 people 37 11 12 4 6 4
6- 10 people 10 3 3 1 0 3 11- 25 people 5 1 1 1 0 2 More than 25 2 1 1 0 0 0
Mean 13.5 4.0 4.25 1.5 1.5 2.25

2012 Trail Town Survey Center for Regional Progress Frostburg State University May, 2012 Page 10
Part Time Employees During Off-Peak Season (Number of Respondents by Range)
Total Lodging Restaurant Retail
Outdoor/ Trail
Business Other Responses: 56 20 14 6 8 8 1- 5 people 23 12 2 3 3 3
6- 10 people 9 0 7 1 0 1 11- 25 people 9 3 4 0 0 2 More than 25 2 0 1 0 0 1
Mean 10.8 3.8 3.5 1.0 0.8 1.8
Most of these businesses tend to staff full time employees during their off-peak than they do part time employees. The majority of businesses employ 1-5 people, who are either part or full time (50.4%). Less than one in twenty of these businesses will employ more than 25 people.
Question 7a: How many hours per week does a person that you employ work during the peak season?
Average Full Time Hours During Peak Season (Number of Respondents by Range)
Total Lodging Restaurant Retail
Outdoor/ Trail
Business Other Responses: 61 17 17 9 8 10
15 hours or less 0 0 0 0 0 0 16 - 30 hours 3 2 1 0 0 0 31 - 40 hours 42 6 16 6 5 9
More than 40 hours 14 6 2 3 2 1 Mean 19.7 4.7 6.3 3.0 2.3 3.3
In the peak season the average hours worked by full time employees was 19.7. No employees worked less than 15 hours that was employed at full time. The majority of employees worked between 31 to 40 hours.

2012 Trail Town Survey Center for Regional Progress Frostburg State University May, 2012 Page 11
Average Part Time Hours During Peak Season (Number of Respondents by Range)
Total Lodging Restaurant RetailOutdoor/ Trail
Business OtherResponses: 62 22 18 7 6 9
15 hours or less 15 12 1 0 2 0 16 - 30 hours 39 5 17 5 4 8 31 - 40 hours 6 3 0 2 0 1
More than 40 hours 1 1 0 0 0 0 Mean 15.3 5.3 4.5 1.8 1.5 2.3
For part time hours that average was 15.3 hours, but majority worked no more than 30 hours.
Question 7b: How many hours per week does a person that you employ work during the off season?
Average Full Time Hours During Off-Peak (Number of Respondents by Range)
Total Lodging Restaurant Retail
Outdoor/ Trail
Business Other Responses: 58 15 15 9 8 11
15 hours or less 2 2 0 0 0 0 16 - 30 hours 8 0 3 1 4 0 31 - 40 hours 32 7 11 5 1 8
More than 40 hours 9 3 1 3 1 1 Mean 12.8 3.0 3.8 2.3 1.5 2.3
Average Part Time Hours During Off-Peak (Number of Respondents by Range)
Total Lodging Restaurant Retail
Outdoor/ Trail
Business Other Responses: 52 17 14 5 7 9
15 hours or less 13 8 2 0 2 1 16 - 30 hours 24 3 12 3 1 5 31 - 40 hours 2 0 0 1 0 1
More than 40 hours 1 1 0 0 0 0 Mean 10.0 3.0 3.5 1.0 0.8 1.8
Full-time employees on average worked 14.8 hours per week during peak sales months, and 12.8 hours per week during off-peak sales months. Additionally, part-time employees worked an average of 15.3 hours per week during peak sales months, and 10.0 hours during off-peak sales months.

2012 Trail Town Survey Center for Regional Progress Frostburg State University May, 2012 Page 12
Generally speaking, part-time employees working for either restaurants or lodging worked longer hours on average than did those working in any of the other business types.
Question 8: Do you plan to expand your business?
Business Expansions by County (Number of Respondents)
Total Allegheny,
PA Westmoreland,
PA Fayette,
PA Somerset,
PA Allegany,
MD Responses 80 8 6 19 33 22
Expand 30 3 3 9 8 7 Not Expand 47 4 3 9 24 15
Unknown 3 1 0 1 1 0
Business Expansions by Type (Number of Respondents)
Total Lodging Restaurant Retail
Outdoor / Trail
Business Other Responses 89 33 22 12 9 14
Expand 30 11 10 3 4 2 Not Expand 47 22 12 9 5 12
Unknown 3 3 0 0 0 0
30 %
57 %
0 10 20 30 40 50 60
Yes
No

2012 Trail Town Survey Center for Regional Progress Frostburg State University May, 2012 Page 13
Most businesses did not plan to expand. Of those that did, the majority were in the lodging and restaurant businesses.
Question 8a: If yes, did the Trail have an impact on this decisions?
Trail Impacts by County (Number of Respondents)
Total Allegheny,
PA Westmoreland,
PA Fayette,
PA Somerset,
PA Allegany,
MD Responses 30 3 3 9 8 7
Trail Affected 14 1 2 2 5 4 Not Affected 12 2 0 5 2 3
Unknown 4 0 1 2 1 0
Trail Impacts by Type of Business (Number of Respondents)
Total Lodging Restaurant Retail
Outdoor / Trail
Business Other Responses 30 11 10 3 4 2
Trail Affected 14 7 4 0 3 0 Not Affected 12 4 4 1 1 2
Unknown 4 0 2 2 0 0 About half of the businesses said that the trail affected their decision to expand.
Question 9: Approximately what were the annual gross revenue figures for this business location?
Annual Gross Revenue 2010 by County (Number of Respondents by Range)
Total Allegheny,
PA Westmoreland,
PA Fayette,
PA Somerset,
PA Allegany,
MD Responses: 84 8 6 18 30 22
Less than $50K 12 0 1 2 8 1 $50K - $149K 8 1 0 2 4 1
$150K - $249K 7 0 1 1 4 1 More than $250K 19 4 1 4 4 6
Refused/don't know 38 3 3 9 10 13
Mean (dollars) $750,697 $1,450,200 $449,231 $768,549 $351,618 $733,889
Of the businesses providing annual gross revenue information, the average gross revenue was approximately $751,000 for 2010 and $3.4 million for 2011, though there was a wide range of

2012 Trail Town Survey Center for Regional Progress Frostburg State University May, 2012 Page 14
values across the five county regions. This same pattern was seen for 2010 and 2011. The firms may have had more ready information for 2011 than for 2010 but several counties experienced a significant rise in the average gross revenue.
Annual Gross Revenue 2011 by County (Number of Respondents by Range)
Total Allegheny,
PA Westmoreland,
PA Fayette,
PA Somerset,
PA Allegany,
MD Responses: 85 8 6 18 31 22
Less than $50K 16 0 1 5 8 2 $50K - $149K 9 1 1 2 5 0
$150K - $249K 9 0 1 1 5 2 More than $250K 20 4 1 4 4 7
Refused/don't know 31 3 2 6 9 11 Mean (dollars) $3,454,494 $1,558,000 $418,653 $663,557 $349,094 $14,283,164
Gross Revenue 2010 and 2011 by County ($)
Total Allegheny,
PA Westmoreland,
PA Fayette,
PA Somerset,
PA Allegany,
MD Responses: 45 5 3 9 19 9
2010 gross revenue $647,533 $1,450,200 $449,231 $768,549 $369,388 $733,889 2011 gross revenue $705,519 $1,558,000 $531,537 $879,598 $388,241 $785,644
% difference 9.0% 7.4% 18.3% 14.4% 5.1% 7.1%
Annual Gross Revenue 2010 by Business Type (Number of Respondents by Range)
Total Lodging Restaurant Retail
Outdoor/ Trail
Business Other Responses: 85 30 21 12 8 14
Less than $50K 12 10 0 1 1 0 $50K - $149K 8 2 2 1 2 1
$150K - $249K 7 2 3 1 1 0 More than $250K 20 7 5 1 4 3
Refused/don't know 38 9 11 8 0 10 Mean (dollars) $1,534,954 $4,730,078 $429,262 $242,250 $307,368 $1,965,812

2012 Trail Town Survey Center for Regional Progress Frostburg State University May, 2012 Page 15
Annual Gross Revenue 2011 by Business Type (Number of Respondents by Range)
Total Lodging Restaurant Retail
Outdoor/ Trail
Business Other Responses: 86 31 21 12 8 14
Less than $50K 16 11 0 4 1 0 $50K - $149K 9 3 2 1 2 1
$150K - $249K 9 2 5 1 1 0 More than $250K 21 7 5 2 4 3
Refused/don't know 31 8 9 4 0 10 Mean (dollars) $5,258,056 $4,581,077 $413,468 $18,874,475 $303,735 $2,117,526
Annual Gross Revenue 2010 and 2011 by Business Type ($)
Total Lodging Restaurant Retail Outdoor/Trail
Business Other Responses: 46 20 10 4 8 4 2010 gross
revenue $1,751,648 $ 4,928,806 $ 427,169 $242,250 $307,368 $ 1,965,812
2011 gross revenue $1,866,633 $ 5,263,799 $ 465,161 $230,200 $303,735 $ 2,117,526
% difference 6.6% 6.8% 8.9% -5.0% -1.2% 7.7%
When looking at the businesses by type all but two types had experienced an increase in revenue from 2010 to 2011. Retail showed the highest decrease in revenue, but was still very close to the numbers of the previous year.
2012 Trail Town Survey Center for Regional Progress Frostburg State University May, 2012 Page 16
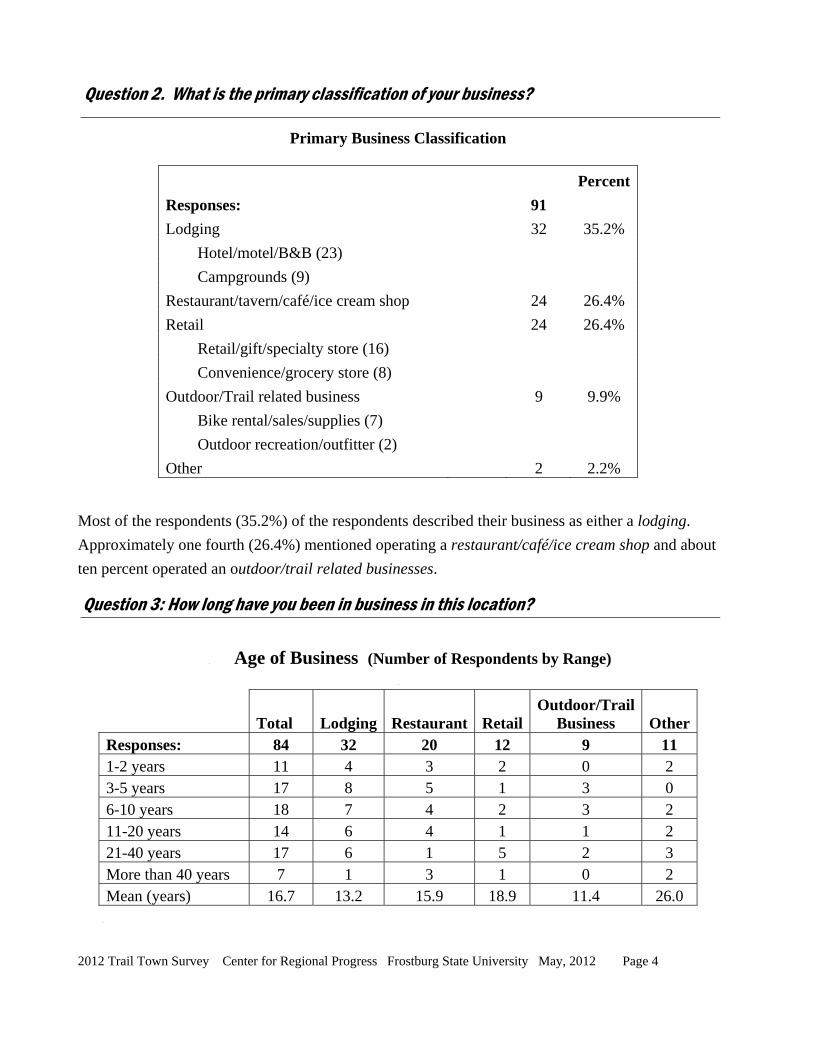
Question 10: Approximately what were the annual gross revenue figures for this business location attributable to the Trail?
Trail Related Revenue as a Percent of Gross Revenue
Estimated Range of Gross Revenue from Trail by Location
(Number of Respondents by Range)
Total Allegheny,
PA Westmoreland,
PA Fayette,
PA Somerset,
PA Allegany,
MD Responses (number): 80 8 6 19 33 22
None 9 1 0 0 2 6 Less than 5% 14 3 0 3 2 6
5% - 10% 11 1 1 1 4 4 11% - 50% 16 0 2 8 6 3
51% - 100% 17 1 2 3 14 2 Refused/don't know 13 2 1 4 5 1 Mean (percentage) 30.6% 17.0% 46.0% 35.0% 48.0% 14.0%
There was a wide variation in the percentage of gross revenue attributed to the trail. Some locations may serve more trail users exclusively, while other locations may serve a larger proportion of local patrons. On average about 30 percent of gross revenues were attributed to the trail.
17.0%
46.0%
35.0%
48.0%
14.0%
0.0% 10.0% 20.0% 30.0% 40.0% 50.0% 60.0%
Allegheny, PA
Westmoreland, PA
Fayette, PA
Somerset, PA
Allegany, MD

2012 Trail Town Survey Center for Regional Progress Frostburg State University May, 2012 Page 17
Gross Revenue from Trail by Type of Business
Estimated Range of Gross Revenue from Trail (Number of Respondents by Range)
Total Lodging Restaurant Retail
Outdoor/ Trail
Business OtherResponses: 90 33 22 12 9 14
None 9 4 1 0 0 4 Less than 5% 14 4 5 2 1 2
5% - 10% 11 4 1 3 1 2 11% - 50% 20 7 7 3 2 1
51% - 100% 23 12 3 2 5 1 Refused/don't know 13 2 5 2 0 4 Mean (percentage) 32.2% 42.0% 25.0% 27.0% 53.0% 14.0%
Of the business that responded outdoor/trail businesses and lodging have revenues that are the most effected by the trail usage.
42.0%
25.0%
27.0%
53.0%
14.0%
0.0% 10.0% 20.0% 30.0% 40.0% 50.0% 60.0%
Lodging
Restaurant
Retail
Outdoor/ Trail Business
Other

2012 Trail Town Survey Center for Regional Progress Frostburg State University May, 2012 Page 18
Trail Location Revenue by County
Overall Allegheny,
PA Westmoreland,
PA Fayette, PA Somerset,
PA Allegany,
MD Mean percentage of revenue associated with the trail per
establishment 30.6% 17.0% 46.0% 35.0% 48.0% 14.0%
x Mean gross revenue (dollars) per establishment $3,454,494 $1,558,000 $418,653 $663,557 $349,094 $14,283,164
= dollars associated with Trail Activity per
establishment $1,057,075 $264,860 $192,580 $232,245 $167,565 $1,999,643
Trail Location Revenue by Business Type
Overall Lodging Restaurant Retail Outdoor/
Trail Business
Other
Mean percentage of revenue associated with the trail per
establishment 32.2% 42.0% 25.0% 27.0% 53.0% 14.0%
x Mean gross revenue (dollars) per establishment $5,258,056 $4,581,077 $413,468 $18,874,475 $303,735 $2,117,526
= dollars associated with Trail Activity per
establishment $1,693,094 $1,924,052 $103,367 $5,096,108 $160,980 $296,454
The trail has a positive effect on each county and business type by the revenue that it brings to the area that without the trail would not be occurring.
Question 11: What percent of your 2011 annual revenue would you estimate was generated through the indicated activities?
Percent of Gross Revenue Rentals Repairs Sales Supplies Other
Number of Responding Businesses 31 9 41 5 5 Percentage of Annual Revenue 74% 41% 84% 26% 40%
Responding businesses with more than 75% annual revenue from activity 23 33
2012 Trail Town Survey Center for Regional Progress Frostburg State University May, 2012 Page 19
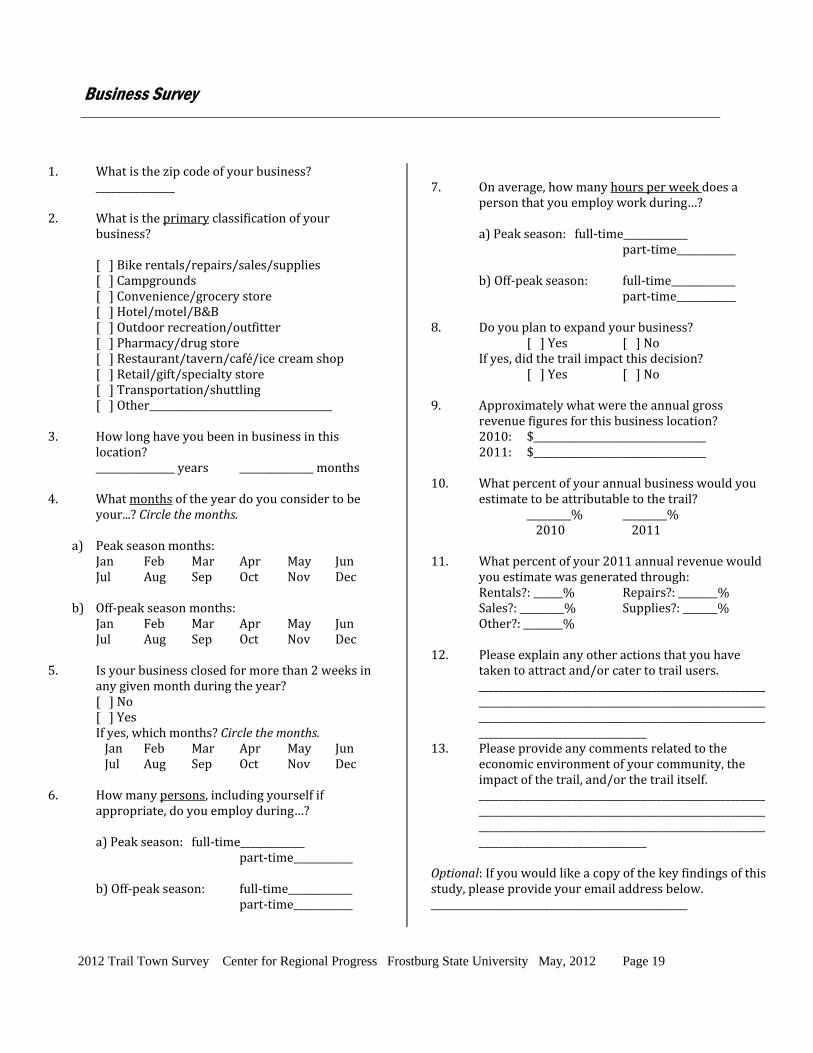
Business Survey
1. What is the zip code of your business? ________________
2. What is the primary classification of your
business?
[ ] Bike rentals/repairs/sales/supplies [ ] Campgrounds [ ] Convenience/grocery store [ ] Hotel/motel/B&B [ ] Outdoor recreation/outfitter [ ] Pharmacy/drug store [ ] Restaurant/tavern/café/ice cream shop [ ] Retail/gift/specialty store
[ ] Transportation/shuttling [ ] Other_____________________________________ 3. How long have you been in business in this
location? ________________ years _______________ months
4. What months of the year do you consider to be
your...? Circle the months.
a) Peak season months: Jan Feb Mar Apr May Jun Jul Aug Sep Oct Nov Dec
b) Off‐peak season months:
Jan Feb Mar Apr May Jun Jul Aug Sep Oct Nov Dec
5. Is your business closed for more than 2 weeks in any given month during the year?
[ ] No [ ] Yes
If yes, which months? Circle the months. Jan Feb Mar Apr May Jun Jul Aug Sep Oct Nov Dec 6. How many persons, including yourself if
appropriate, do you employ during…? a) Peak season: full‐time_____________ part‐time____________ b) Off‐peak season: full‐time_____________ part‐time____________
7. On average, how many hours per week does a
person that you employ work during…? a) Peak season: full‐time_____________ part‐time____________ b) Off‐peak season: full‐time_____________ part‐time____________ 8. Do you plan to expand your business? [ ] Yes [ ] No
If yes, did the trail impact this decision? [ ] Yes [ ] No
9. Approximately what were the annual gross revenue figures for this business location? 2010: $___________________________________ 2011: $___________________________________
10. What percent of your annual business would you estimate to be attributable to the trail?
_________% _________% 2010 2011
11. What percent of your 2011 annual revenue would you estimate was generated through:
Rentals?: ______% Repairs?: ________% Sales?: _________% Supplies?: _______% Other?: ________% 12. Please explain any other actions that you have
taken to attract and/or cater to trail users. ________________________________________________________________________________________________________________________________________________________________________________________________________________
13. Please provide any comments related to the economic environment of your community, the impact of the trail, and/or the trail itself. ________________________________________________________________________________________________________________________________________________________________________________________________________________
Optional: If you would like a copy of the key findings of this study, please provide your email address below. ____________________________________________________