totally COVID-19 Study Ontario - Wave 2 - iPolitics
48
1 totally COVID-19 Study Ontario - Wave 2 April 22, 2020 - For Immediate Release
Transcript of totally COVID-19 Study Ontario - Wave 2 - iPolitics

1
totally
COVID-19 Study Ontario - Wave 2
April 22, 2020 - For Immediate Release

2
EXECUTIVE SUMMARY
April 22, 2020, Toronto
- Incidence of COVID-19 symptoms in Ontario households is now characteristic of one in seven (15%), down from one in five (19%) one week ago.
- The key symptoms of COVID-19: fever, cough and shortness of breath, are characteristic of just 1-in-20 households (5%) compared to more one week ago (8%).
- One in twenty households now has a member who's been tested for COVID-19 (5%), up from one in fifty last week (2%).
- Of these tests, one fifth returned positive (17%). This is just more than one half of one percent of the population (0.7%).
- More than one third of Ontarians report an underlying condition which might aggravate a COVID-19 infection (32%). Of these, the most common is asthma (22% of those reporting a condition).
- About one fifth report being extremely or very emotionally stressed (18%).
- About one fifth report being somewhat or very pessimistic about the future (18%).
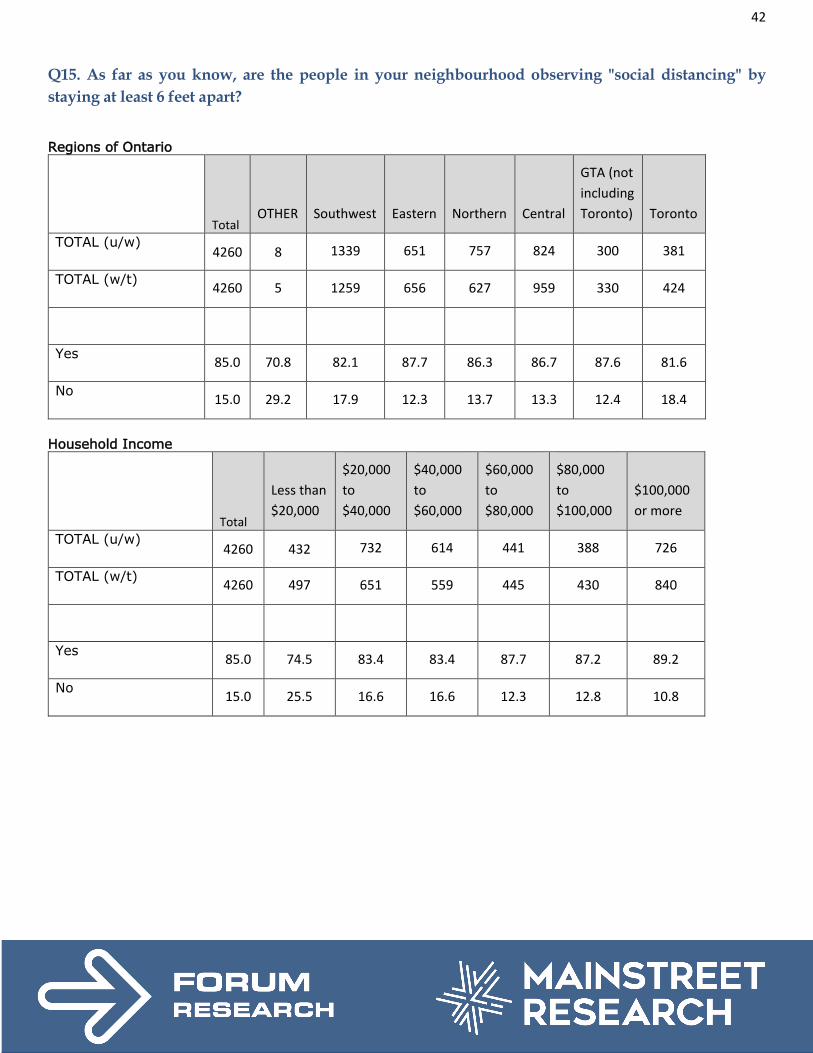
- In order to avoid "social desirability bias", or the impulse to give a socially acceptable answer, researchers often ask how "people in the neighbourhood" behave, as a proxy for respondent behaviour.
- The wide majority of household members say those in their neighbourhood are observing social distance (85%) and staying at home (91%), and this draws almost universal approval.

3
DETAILED FINDINGS
INCIDENCE OF HAVING ONE OR MORE SYMPTOMS CONSISTENT WITH COVID-19 HAS DECLINED SINCE LAST WEEK In the second wave of interviewing for a new poll conducted jointly by Forum Research and Mainstreet Research
among 4260 randomly selected Ontario households on April 19, about one in seven reported at least one of seven listed
symptoms of COVID-19 (15%). This represents a decline from last week (April 11/12 - 19%). The symptoms listed were a
new fever (2% this week, 3% last week), cough (4% this week and last), headaches (7%, down from 10%), sore throat (5%
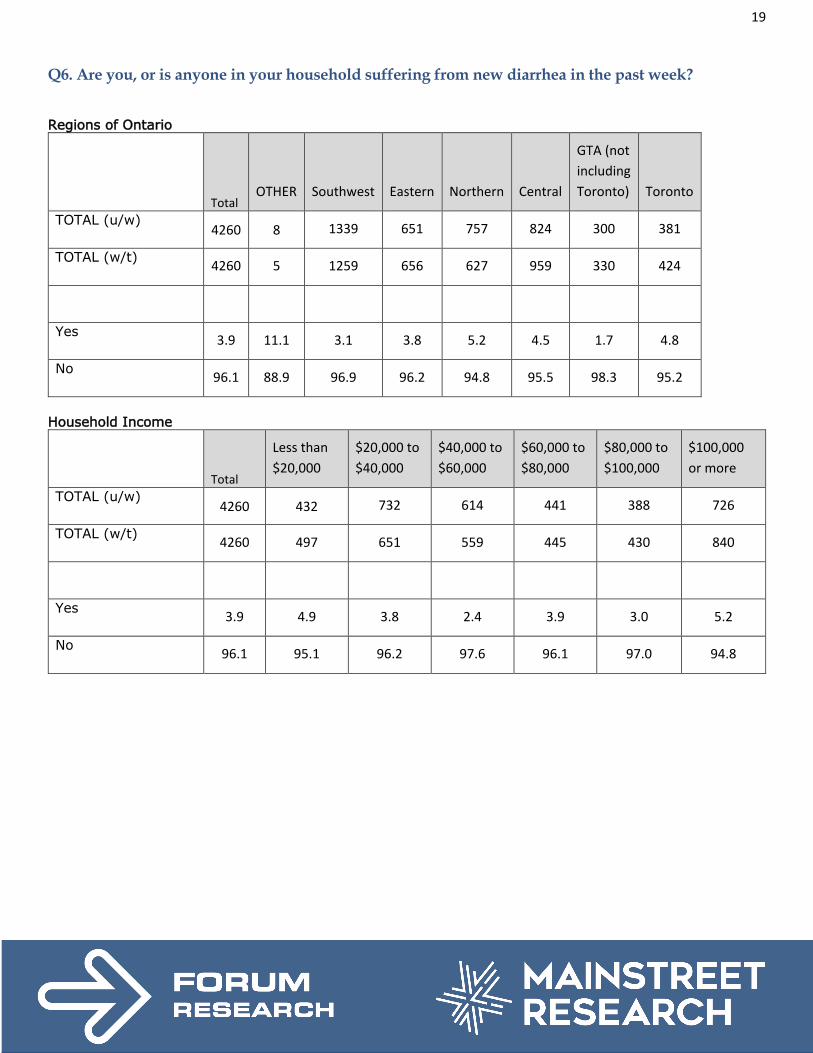
now and then), diarrhea (4% now, 5% last week), loss of taste or smell (2% both weeks), or shortness of breath (2% this
week, 3% last week).
INCIDENCE OF KEY SYMPTOMS (FEVER, COUGH, SHORTNESS OF BREATH) HAS ALSO DECLINED IN ONE WEEK Three of the seven listed symptoms are seen as key indicators; fever, cough, and shortness of breath. Together,
incidence of having one or more of these three symptoms in the household is one in twenty (5%), and this is about half
the rate noted last week (8%).
INCIDENCE OF HAVING BEEN TESTED FOR COVID-19 HAS MORE THAN DOUBLED IN ONTARIO One in twenty households have had a member tested for COVID-19 by the end of last week (5%). This number closely
matches the reported actual penetration of testing in Ontario as of April 12 (4%). This represents a cumulative increase
in incidence from 2% having been tested by the end of last week (2% actual penetration). Among those reporting any
symptoms, 1-in-10 have been tested (9%), while among those with the three key symptoms, close to one fifth have had
a test (17%), and these numbers are up from 5% and 10%, respectively. Of those tested, more than one fifth (23%) are
still awaiting results, up from one seventh last week (15%).
...OF THOSE, FEWER THAN ONE FIFTH HAVE TESTED POSITIVE THIS WEEK Among the very small group of households that report having been tested for COVID-19, just less than a fifth report a
positive test (17%), and this is stable since last week (15%). This may be more common in single person households, in
those with less formal education and among the lowest income households (caution: small sample sizes). Among the
total population, just more than one half of one percent have been tested (0.7%). Among those with any symptoms,
close to half have received a positive result (45%), up from one third last week (32%), while among those with the three
key symptoms, slightly more have a positive result (49%, up from 39%).

4
ONE THIRD HAVE A HEALTH CONDITION WHICH MIGHT AGGRAVATE COVID-19 AND THIS IS STABLE SINCE LAST WEEK More than one third of Ontarians report an underlying health condition which might aggravate a COVID-19 infection
(32%, relatively stable from 37% last week), and this is most likely to be asthma (22% among those reporting a condition)
followed by diabetes (21%) a lung condition (16%) or a heart condition (16%).
ONE FIFTH STILL REPORT BEING "EXTREMELY/VERY STRESSED" EMOTIONALLY One fifth of Ontario households say their level of emotional stress is "extremely/very stressed" (18%, compared to 20%
last week).
ONE FIFTH CONTINUE TO REPORT BEING "SOMEWHAT/VERY PESSIMISTIC" ABOUT THE
FUTURE
One fifth of Ontarians say they are "somewhat/very pessimistic" about the future (18%, compared to 22% last week).
AVOIDING "SOCIAL DESIRABILITY BIAS" In order to avoid "social desirability bias", or the impulse to give a socially acceptable answer, researchers often ask
how "people in the neighbourhood" behave, as a proxy for respondent behaviour.
WIDE MAJORITY CONTINUE OBSERVING SOCIAL DISTANCING AND STAYING HOME The very wide majority of Ontario households are observing social distancing (85% reported of neighbours, compared
to 86% last week) and are staying home (91% this week and last).
ALMOST ALL STILL APPROVE OF SOCIAL DISTANCING AND STAYING HOME Virtually all Ontarians approve of social distancing (96% this week, 97% last week) and staying home (94% this week,
95% last week).
"Compared to last week this wave of polling shows a decrease in the proportion of households reporting symptoms of COVID-19. At the same time, symptomatic households are reporting testing at twice last week's rate, consistent with Ontario's recent expansion of COVID-19 testing. These findings are encouraging, although it is too early to conclude that the symptomatic curve is being flattened. There continues to be much room for expansion of COVID-19 testing among community-dwelling people with symptoms in Ontario" said Dr. Lauren Lapointe-Shaw of the findings of this survey. Dr. Lapointe-Shaw is supporting this project by sharing her clinical and research expertise to ensure results are directly relevant to public health administrators and other policymakers.

6
BACKGROUND This poll represents the second Ontario wave of an unprecedented collaboration between two of Canada's leading
market research and public opinion polling firms, Forum Research and Mainstreet Research. These two firms have come
together to demonstrate proof-of-concept of a nationwide COVID-19 symptoms screening poll, conducted by telephone,
using Interactive Voice Response (IVR) technology, as an effective method of measuring prevalence and location of
people with symptoms of COVID-19 infection, and identifying clusters, or potential "hot spots" before they become too
advanced to manage.
"Symptom surveillance will provide a better understanding of the scale and evolution of COVID-19 in Canada. This is
because symptoms start 1-2 weeks before test results, and at present many people with symptoms cannot access
testing," said Dr Lauren Lapointe-Shaw, when asked about the efficacy of this methodology.
There are key advantages to this methodology:
- Based on a random probability sample
- Projectable to the general population
- Extremely robust sample sizes
- Conducted in real time
- Regular tracking, ongoing reporting, dashboard presentation
- SMS text messaging included in sampling scheme
- Interactive functionality allows targeted messaging
- Eliminates self-selection bias
- Limits social desirability bias
- Cost effective
Our methodology captures an extremely robust probability sample, from which statistically valid projections can be
made, while the freshness of the data, which can be gathered nightly and reported on a dashboard the next day,
ensures key decisions can be made based on real time data. SMS text messaging is included in the data collection
protocol. Other benefits include interactive functionality missing in web-based applications, and the elimination of any
self-selection bias

7
This methodology has already been pilot-tested in two municipalities in Canada, the City of Brampton and the Regional
Municipality of Wood Buffalo (Fort MacMurray), on very large samples, on March 30.
PARTICIPANTS IN THE STUDY With offices across Canada and around the world, 100% Canadian-owned Forum Research is one of the country’s
leading survey research firms, having been the only poll to correctly call a Liberal majority in 2015. Forum Research is a
member of the American Association for Public Opinion Research (AAPOR) and the Canadian Research and Insights
Council (CRIC).
Differentiated by its large sample sizes, Mainstreet Research provides accurate snapshots of public opinion, predicting
the majority NDP government in Alberta, the 2018 Ontario election and a CAQ majority win in the 2018 Quebec election.
Mainstreet Research is a member of the World Association for Public Opinion Research (WAPOR) and the Market
Research Intelligence Association (MRIA) and meets international and Canadian publication standards.
Lauren Lapointe-Shaw, MD, PhD, is an Assistant Professor and Clinician Scientist in the Department of Medicine at the
University of Toronto, and a Staff General Internal Medicine Physician at the University Health Network. She was
previously awarded a CIHR Fellowship Award and CIHR-IHSPR’s Rising Star Award for her doctoral thesis in Clinical
Epidemiology and Healthcare Research. Her research is broadly focused on measuring the quality of healthcare and the
effects of health policy on patient outcomes.
- 30 -
MEDIA CONTACTS: William Schatten, CAIP Vice President Forum Research (416) 960 1310 [email protected] Dr Lauren Lapointe-Shaw, MD, PhD Assistant Professor of Medicine University of Toronto [email protected] @lapointeshaw
Quito Maggi President Mainstreet Research (416) 570 3762 [email protected]

8
METHODOLOGY
THIS POLL Polling across Ontario was conducted by Mainstreet Research, on April 19, among a randomly selected sample of 4260
Ontario residents. Respondents were interviewed by landline and cell phone. Data was tabulated by Forum Research.
Polling was conducted by Interactive Voice Response (Smart IVR) and has a margin of error of plus or minus 1.5%,
nineteen out of twenty times asking. Sample is segmented by 14 Local Health Integrated Networks (LHINs) at
approximately 300 interviews each. Margin of error on individual LHIN samples is plus or minus 5.7%, nineteen out of
twenty times asking.
Where appropriate, data have been weighted to ensure that data matches the actual population profile according to
the latest Statistics Canada data. Totals may not add up to 100% due to rounding.

9
Q1. Have you, or has anyone in your household had a fever, that is, a temperature above 38 degrees Celsius or about 100 degrees Fahrenheit, in the past week?
Regions of Ontario
Total OTHER Southwest Eastern Northern Central
GTA (not including Toronto) Toronto
TOTAL (u/w) 4260 8 1339 651 757 824 300 381
TOTAL (w/t) 4260 5 1259 656 627 959 330 424
Yes 1.7 0.0 1.3 2.6 1.8 2.1 0.8 1.6
No 98.3 100.0 98.7 97.4 98.2 97.9 99.2 98.4
Household Income
Total
Less than $20,000
$20,000 to $40,000
$40,000 to $60,000
$60,000 to $80,000
$80,000 to $100,000
$100,000 or more
TOTAL (u/w) 4260 432 732 614 441 388 726
TOTAL (w/t) 4260 497 651 559 445 430 840
Yes 1.7 1.5 2.2 2.3 0.6 1.1 2.3
No 98.3 98.5 97.8 97.7 99.4 98.9 97.7

10
Household Size
Total
Just one person, myself 2 people 3 people 4 people 5 or more
TOTAL (u/w) 4260 830 1610 643 681 496
TOTAL (w/t) 4260 576 1238 752 954 741
Yes 1.7 2.1 1.7 1.2 2.2 1.4
No 98.3 97.9 98.3 98.8 97.8 98.6
Symptom Assessment / Testing Assessment
Total No Symptoms
Any New Symptom
New
High-Risk Symptom
Positive or a Pending COVID-19 Test
TOTAL (u/w) 4260 3688 572 205 52
TOTAL (w/t) 4260 3624 636 232 53
Yes 1.7 0.0 11.6 31.9 28.4
No 98.3 100.0 88.4 68.1 71.6

11
Q2. Are you, or is anyone in your household currently suffering from a new cough in the past week?
Regions of Ontario
Total OTHER Southwest Eastern Northern Central
GTA (not including Toronto) Toronto
TOTAL (u/w) 4260 8 1339 651 757 824 300 381
TOTAL (w/t) 4260 5 1259 656 627 959 330 424
Yes 3.5 0.0 2.6 3.4 3.8 4.6 2.7 4.5
No 96.5 100.0 97.4 96.6 96.2 95.4 97.3 95.5
Household Income
Total
Less than $20,000
$20,000 to $40,000
$40,000 to $60,000
$60,000 to $80,000
$80,000 to $100,000
$100,000 or more
TOTAL (u/w) 4260 432 732 614 441 388 726
TOTAL (w/t) 4260 497 651 559 445 430 840
Yes 3.5 6.5 2.9 3.6 2.3 1.8 4.6
No 96.5 93.5 97.1 96.4 97.7 98.2 95.4

12
Household Size
Total
Just one person, myself 2 people 3 people 4 people 5 or more
TOTAL (u/w) 4260 830 1610 643 681 496
TOTAL (w/t) 4260 576 1238 752 954 741
Yes 3.5 2.9 3.0 3.7 4.0 4.2
No 96.5 97.1 97.0 96.3 96.0 95.8
Symptom Assessment / Testing Assessment
Total No Symptoms
Any New Symptom
New
High-Risk Symptom
Positive or a Pending COVID-19 Test
TOTAL (u/w) 4260 3688 572 205 52
TOTAL (w/t) 4260 3624 636 232 53
Yes 3.5 0.0 23.7 65.1 32.9
No 96.5 100.0 76.3 34.9 67.1

13
Q3. Are you, or is anyone in your household currently suffering from new headaches in the past week? Regions of Ontario
Total OTHER Southwest Eastern Northern Central
GTA (not including Toronto) Toronto
TOTAL (u/w) 4260 8 1339 651 757 824 300 381
TOTAL (w/t) 4260 5 1259 656 627 959 330 424
Yes 7.4 0.0 6.6 6.0 7.8 9.1 5.8 8.6
No 92.6 100.0 93.4 94.0 92.2 90.9 94.2 91.4
Household Income
Total
Less than $20,000
$20,000 to $40,000
$40,000 to $60,000
$60,000 to $80,000
$80,000 to $100,000
$100,000 or more
TOTAL (u/w) 4260 432 732 614 441 388 726
TOTAL (w/t) 4260 497 651 559 445 430 840
Yes 7.4 7.0 6.9 6.2 5.1 8.2 9.6
No 92.6 93.0 93.1 93.8 94.9 91.8 90.4

14
Household Size
Total
Just one person, myself 2 people 3 people 4 people 5 or more
TOTAL (u/w) 4260 830 1610 643 681 496
TOTAL (w/t) 4260 576 1238 752 954 741
Yes 7.4 5.3 5.4 8.2 10.1 7.9
No 92.6 94.7 94.6 91.8 89.9 92.1
Symptom Assessment / Testing Assessment
Total No Symptoms
Any New Symptom
New
High-Risk Symptom
Positive or a Pending COVID-19 Test
TOTAL (u/w) 4260 3688 572 205 52
TOTAL (w/t) 4260 3624 636 232 53
Yes 7.4 0.0 49.3 39.7 39.7
No 92.6 100.0 50.7 60.3 60.3

15
Q4. Are you, or is anyone in your household suffering from a new sore throat in the past week?
Regions of Ontario
Total OTHER Southwest Eastern Northern Central
GTA (not including Toronto) Toronto
TOTAL (u/w) 4260 8 1339 651 757 824 300 381
TOTAL (w/t) 4260 5 1259 656 627 959 330 424
Yes 4.8 0.0 3.9 5.1 5.7 5.5 5.1 4.0
No 95.2 100.0 96.1 94.9 94.3 94.5 94.9 96.0
Household Income
Total
Less than $20,000
$20,000 to $40,000
$40,000 to $60,000
$60,000 to $80,000
$80,000 to $100,000
$100,000 or more
TOTAL (u/w) 4260 432 732 614 441 388 726
TOTAL (w/t) 4260 497 651 559 445 430 840
Yes 4.8 6.7 4.8 3.8 3.9 4.9 5.5
No 95.2 93.3 95.2 96.2 96.1 95.1 94.5

16
Household Size
Total
Just one person, myself 2 people 3 people 4 people 5 or more
TOTAL (u/w) 4260 830 1610 643 681 496
TOTAL (w/t) 4260 576 1238 752 954 741
Yes 4.8 4.4 3.2 4.9 5.2 7.2
No 95.2 95.6 96.8 95.1 94.8 92.8
Symptom Assessment / Testing Assessment
Total No Symptoms
Any New Symptom
New
High-Risk Symptom
Positive or a Pending COVID-19 Test
TOTAL (u/w) 4260 3688 572 205 52
TOTAL (w/t) 4260 3624 636 232 53
Yes 4.8 0.0 32.2 35.0 33.3
No 95.2 100.0 67.8 65.0 66.7

17
Q5. Are you, or is anyone in your household suffering from a loss of taste or smell in the past week?
Regions of Ontario
Total OTHER Southwest Eastern Northern Central
GTA (not including Toronto) Toronto
TOTAL (u/w) 4260 8 1339 651 757 824 300 381
TOTAL (w/t) 4260 5 1259 656 627 959 330 424
Yes 1.6 0.0 0.7 1.6 2.1 2.2 1.3 2.2
No 98.4 100.0 99.3 98.4 97.9 97.8 98.7 97.8
Household Income
Total
Less than $20,000
$20,000 to $40,000
$40,000 to $60,000
$60,000 to $80,000
$80,000 to $100,000
$100,000 or more
TOTAL (u/w) 4260 432 732 614 441 388 726
TOTAL (w/t) 4260 497 651 559 445 430 840
Yes 1.6 2.0 1.9 1.9 1.0 1.4 1.6
No 98.4 98.0 98.1 98.1 99.0 98.6 98.4

18
Household Size
Total
Just one person, myself 2 people 3 people 4 people 5 or more
TOTAL (u/w) 4260 830 1610 643 681 496
TOTAL (w/t) 4260 576 1238 752 954 741
Yes 1.6 2.6 1.4 0.9 1.7 1.6
No 98.4 97.4 98.6 99.1 98.3 98.4
Symptom Assessment / Testing Assessment
Total No Symptoms
Any New Symptom
New
High-Risk Symptom
Positive or a Pending COVID-19 Test
TOTAL (u/w) 4260 3688 572 205 52
TOTAL (w/t) 4260 3624 636 232 53
Yes 1.6 0.0 10.6 18.2 18.5
No 98.4 100.0 89.4 81.8 81.5
19
Q6. Are you, or is anyone in your household suffering from new diarrhea in the past week?
Regions of Ontario
Total OTHER Southwest Eastern Northern Central
GTA (not including Toronto) Toronto
TOTAL (u/w) 4260 8 1339 651 757 824 300 381
TOTAL (w/t) 4260 5 1259 656 627 959 330 424
Yes 3.9 11.1 3.1 3.8 5.2 4.5 1.7 4.8
No 96.1 88.9 96.9 96.2 94.8 95.5 98.3 95.2
Household Income
Total
Less than $20,000
$20,000 to $40,000
$40,000 to $60,000
$60,000 to $80,000
$80,000 to $100,000
$100,000 or more
TOTAL (u/w) 4260 432 732 614 441 388 726
TOTAL (w/t) 4260 497 651 559 445 430 840
Yes 3.9 4.9 3.8 2.4 3.9 3.0 5.2
No 96.1 95.1 96.2 97.6 96.1 97.0 94.8

20
Household Size
Total
Just one person, myself 2 people 3 people 4 people 5 or more
TOTAL (u/w) 4260 830 1610 643 681 496
TOTAL (w/t) 4260 576 1238 752 954 741
Yes 3.9 3.5 2.7 3.8 5.8 4.0
No 96.1 96.5 97.3 96.2 94.2 96.0
Symptom Assessment / Testing Assessment
Total No Symptoms
Any New Symptom
New
High-Risk Symptom
Positive or a Pending COVID-19 Test
TOTAL (u/w) 4260 3688 572 205 52
TOTAL (w/t) 4260 3624 636 232 53
Yes 3.9 0.0 26.2 18.3 27.0
No 96.1 100.0 73.8 81.7 73.0

21
Q7. Are you, or is anyone in your household suffering from a new shortness of breath in the past week?
Regions of Ontario
Total OTHER Southwest Eastern Northern Central
GTA (not including Toronto) Toronto
TOTAL (u/w) 4260 8 1339 651 757 824 300 381
TOTAL (w/t) 4260 5 1259 656 627 959 330 424
Yes 1.6 0.0 1.9 0.6 2.0 2.3 0.4 1.4
No 98.4 100.0 98.1 99.4 98.0 97.7 99.6 98.6
Household Income
Total
Less than $20,000
$20,000 to $40,000
$40,000 to $60,000
$60,000 to $80,000
$80,000 to $100,000
$100,000 or more
TOTAL (u/w) 4260 432 732 614 441 388 726
TOTAL (w/t) 4260 497 651 559 445 430 840
Yes 1.6 2.0 2.5 2.3 1.4 1.7 0.6
No 98.4 98.0 97.5 97.7 98.6 98.3 99.4

22
Household Size
Total
Just one person, myself 2 people 3 people 4 people 5 or more
TOTAL (u/w) 4260 830 1610 643 681 496
TOTAL (w/t) 4260 576 1238 752 954 741
Yes 1.6 2.0 1.6 0.6 1.5 2.6
No 98.4 98.0 98.4 99.4 98.5 97.4
Symptom Assessment / Testing Assessment
Total No Symptoms
Any New Symptom
New
High-Risk Symptom
Positive or a Pending COVID-19 Test
TOTAL (u/w) 4260 3688 572 205 52
TOTAL (w/t) 4260 3624 636 232 53
Yes 1.6 0.0 11.0 30.2 23.1
No 98.4 100.0 89.0 69.8 76.9

23
Q8. Have you, or has anyone with symptoms in this household been tested for COVID-19 since the onset of symptoms?
Regions of Ontario
Total OTHER Southwest Eastern Northern Central
GTA (not including Toronto) Toronto
TOTAL (u/w) 4260 8 1339 651 757 824 300 381
TOTAL (w/t) 4260 5 1259 656 627 959 330 424
Yes 4.8 0.0 4.2 5.1 6.4 4.0 4.7 5.9
No 95.2 100.0 95.8 94.9 93.6 96.0 95.3 94.1
Household Income
Total
Less than $20,000
$20,000 to $40,000
$40,000 to $60,000
$60,000 to $80,000
$80,000 to $100,000
$100,000 or more
TOTAL (u/w) 4260 432 732 614 441 388 726
TOTAL (w/t) 4260 497 651 559 445 430 840
Yes 4.8 5.9 5.1 3.9 5.0 3.6 4.9
No 95.2 94.1 94.9 96.1 95.0 96.4 95.1

24
Household Size
Total
Just one person, myself 2 people 3 people 4 people 5 or more
TOTAL (u/w) 4260 830 1610 643 681 496
TOTAL (w/t) 4260 576 1238 752 954 741
Yes 4.8 5.2 4.3 3.0 5.4 6.6
No 95.2 94.8 95.7 97.0 94.6 93.4
Symptom Assessment / Testing Assessment
Total No Symptoms
Any New Symptom
New
High-Risk Symptom
Positive or a Pending COVID-19 Test
TOTAL (u/w) 4260 3688 572 205 52
TOTAL (w/t) 4260 3624 636 232 53
Yes 4.8 4.1 9.2 16.9 100.0
No 95.2 95.9 90.8 83.1 0.0

25
Q9. Did you, or did anyone in this household test positive for COVID-19?
Base: Respondents with symptoms who have been tested for COVID-19
Regions of Ontario
Total OTHER Southwest Eastern Northern Central
GTA (not including Toronto) Toronto
TOTAL (u/w) 213 0 60 39 36 42 13 23
TOTAL (w/t) 206 0 53 33 40 39 15 25
Yes 13.5 0.0 8.1 10.8 15.1 11.0 5.4 34.7
No 86.5 0.0 91.9 89.2 84.9 89.0 94.6 65.3
Household Income
Total
Less than $20,000
$20,000 to $40,000
$40,000 to $60,000
$60,000 to $80,000
$80,000 to $100,000
$100,000 or more
TOTAL (u/w) 213 27 42 20 23 16 37
TOTAL (w/t) 206 29 33 22 22 15 41
Yes 13.5 27.5 20.5 17.6 9.0 9.0 4.6
No 86.5 72.5 79.5 82.4 91.0 91.0 95.4

26
Household Size
Total
Just one person, myself 2 people 3 people 4 people 5 or more
TOTAL (u/w) 213 40 73 22 39 39
TOTAL (w/t) 206 30 53 23 51 49
Yes 13.5 22.8 19.7 1.8 10.6 9.6
No 86.5 77.2 80.3 98.2 89.4 90.4
Symptom Assessment / Testing Assessment
Total No Symptoms
Any New Symptom
New
High-Risk Symptom
Positive or a Pending COVID-19 Test
TOTAL (u/w) 213 157 56 40 52
TOTAL (w/t) 206 147 59 39 53
Yes 13.5 10.5 21.0 29.4 52.9
No 86.5 89.5 79.0 70.6 47.1

27
Q10. Are you, or is anyone in this household still waiting for their COVID-19 test result?
Base: Respondents with symptoms who have been tested for COVID-19
Regions of Ontario
Total OTHER Southwest Eastern Northern Central
GTA (not including Toronto) Toronto
TOTAL (u/w) 213 0 60 39 36 42 13 23
TOTAL (w/t) 206 0 53 33 40 39 15 25
Yes 17.4 0.0 16.8 24.0 30.1 5.6 19.5 6.4
No 82.6 0.0 83.2 76.0 69.9 94.4 80.5 93.6
Household Income
Total
Less than $20,000
$20,000 to $40,000
$40,000 to $60,000
$60,000 to $80,000
$80,000 to $100,000
$100,000 or more
TOTAL (u/w) 213 27 42 20 23 16 37
TOTAL (w/t) 206 29 33 22 22 15 41
Yes 17.4 23.9 16.3 13.3 13.0 20.8 20.3
No 82.6 76.1 83.7 86.7 87.0 79.2 79.7

28
Household Size
Total
Just one person, myself 2 people 3 people 4 people 5 or more
TOTAL (u/w) 213 40 73 22 39 39
TOTAL (w/t) 206 30 53 23 51 49
Yes 17.4 23.2 15.2 33.4 22.3 3.6
No 82.6 76.8 84.8 66.6 77.7 96.4
Symptom Assessment / Testing Assessment
Total No Symptoms
Any New Symptom
New
High-Risk Symptom
Positive or a Pending COVID-19 Test
TOTAL (u/w) 213 157 56 40 52
TOTAL (w/t) 206 147 59 39 53
Yes 17.4 6.4 44.9 49.4 68.0
No 82.6 93.6 55.1 50.6 32.0

29
Q11. Do you, or does anyone in your household have an underlying health condition which might aggravate a COVID-19 infection?
Regions of Ontario
Total OTHER Southwest Eastern Northern Central
GTA (not including Toronto) Toronto
TOTAL (u/w) 4260 8 1339 651 757 824 300 381
TOTAL (w/t) 4260 5 1259 656 627 959 330 424
Yes 32.5 40.3 32.8 29.4 39.3 32.0 30.3 28.7
No 67.5 59.7 67.2 70.6 60.7 68.0 69.7 71.3
Household Income
Total
Less than $20,000
$20,000 to $40,000
$40,000 to $60,000
$60,000 to $80,000
$80,000 to $100,000
$100,000 or more
TOTAL (u/w) 4260 432 732 614 441 388 726
TOTAL (w/t) 4260 497 651 559 445 430 840
Yes 32.5 27.6 31.5 35.1 32.5 24.4 31.9
No 67.5 72.4 68.5 64.9 67.5 75.6 68.1

30
Household Size
Total
Just one person, myself 2 people 3 people 4 people 5 or more
TOTAL (u/w) 4260 830 1610 643 681 496
TOTAL (w/t) 4260 576 1238 752 954 741
Yes 32.5 31.5 36.3 35.9 28.1 28.9
No 67.5 68.5 63.7 64.1 71.9 71.1
Symptom Assessment / Testing Assessment
Total No Symptoms
Any New Symptom
New
High-Risk Symptom
Positive or a Pending COVID-19 Test
TOTAL (u/w) 4260 3688 572 205 52
TOTAL (w/t) 4260 3624 636 232 53
Yes 32.5 30.8 41.9 45.5 58.1
No 67.5 69.2 58.1 54.5 41.9

31
Q12. Please indicate what kind of condition this is.
Base: Respondents who have underlying health conditions which might aggravate a COVID-19 infections Regions of Ontario
Total OTHER Southwest Eastern Northern Central
GTA (not including Toronto) Toronto
TOTAL (u/w) 1595 3 495 242 318 310 99 128
TOTAL (w/t) 1383 2 412 193 247 307 100 122
A heart condition 16.3 0.0 15.7 23.0 18.0 13.3 19.4 9.9
A lung or pulmonary condition 15.8 0.0 16.8 15.0 16.0 16.7 12.3 14.3
Diabetes 20.6 20.7 17.7 16.9 16.3 27.1 26.6 23.4
Asthma 21.7 27.5 20.0 17.1 22.5 26.7 14.4 26.5
Mobility issues 3.8 51.8 4.6 3.3 5.7 1.6 4.4 2.1
Other 21.8 0.0 25.2 24.7 21.5 14.6 22.9 23.9
Household Income
Total
Less than $20,000
$20,000 to $40,000
$40,000 to $60,000
$60,000 to $80,000
$80,000 to $100,000
$100,000 or more
TOTAL (u/w) 1595 147 268 249 166 113 267
TOTAL (w/t) 1383 137 205 196 145 105 268
A heart condition 16.3 16.0 13.8 15.2 17.5 17.1 16.7
A lung or pulmonary condition 15.8 21.5 17.8 13.0 17.7 10.6 19.2
Diabetes 20.6 15.3 28.7 23.4 17.2 22.6 17.1

32
Asthma 21.7 21.9 18.0 23.5 16.3 28.2 21.8
Mobility issues 3.8 5.8 3.9 1.5 5.0 0.5 2.1
Other 21.8 19.5 17.8 23.4 26.3 21.0 23.1
Household Size
Total
Just one person, myself 2 people 3 people 4 people 5 or more
TOTAL (u/w) 1595 277 676 267 208 167
TOTAL (w/t) 1383 181 450 270 268 214
A heart condition 16.3 17.8 18.4 15.1 12.4 17.1
A lung or pulmonary condition 15.8 18.1 18.1 16.3 16.4 7.9
Diabetes 20.6 17.8 19.3 21.3 22.8 21.8
Asthma 21.7 14.7 17.2 23.2 26.4 29.4
Mobility issues 3.8 4.9 4.2 2.3 1.6 6.3
Other 21.8 26.8 22.8 21.7 20.4 17.5
Symptom Assessment / Testing Assessment
Total No Symptoms
Any New Symptom
New
High-Risk Symptom
Positive or a Pending COVID-19 Test
TOTAL (u/w) 1595 1341 254 97 26
TOTAL (w/t) 1383 1116 266 105 31
A heart condition 16.3 16.0 17.8 18.9 27.6

33
A lung or pulmonary condition 15.8 15.4 17.7 17.0 1.4
Diabetes 20.6 20.7 20.0 19.1 22.2
Asthma 21.7 22.3 19.1 24.6 12.7
Mobility issues 3.8 3.4 5.1 6.5 9.4
Other 21.8 22.2 20.3 13.8 26.6

34
Q13. What is your current level of emotional stress?
Regions of Ontario
Total OTHER Southwest Eastern Northern Central
GTA (not including Toronto) Toronto
TOTAL (u/w) 4260 8 1339 651 757 824 300 381
TOTAL (w/t) 4260 5 1259 656 627 959 330 424
NET: TOP2 17.8 0.0 18.3 13.3 15.2 20.8 18.7 19.2
NET: BTM3 82.2 100.0 81.7 86.7 84.8 79.2 81.3 80.8
Extremely stressed 4.5 0.0 5.0 3.0 4.3 5.2 3.4 4.6
Very stressed 13.3 0.0 13.3 10.4 10.9 15.6 15.3 14.6
Somewhat stressed 39.6 40.3 41.3 39.6 40.2 37.4 37.5 39.8
Not very stressed 29.1 27.8 26.8 34.0 30.6 28.9 30.0 26.3
Not stressed at all 13.5 31.9 13.6 13.0 14.0 12.8 13.9 14.7
Household Income
Total
Less than $20,000
$20,000 to $40,000
$40,000 to $60,000
$60,000 to $80,000
$80,000 to $100,000
$100,000 or more
TOTAL (u/w) 4260 432 732 614 441 388 726
TOTAL (w/t) 4260 497 651 559 445 430 840
NET: TOP2 17.8 25.9 20.5 17.4 15.7 12.4 14.6
NET: BTM3 82.2 74.1 79.5 82.6 84.3 87.6 85.4
Extremely stressed 4.5 6.8 4.3 4.9 4.8 3.2 3.7

35
Very stressed 13.3 19.1 16.2 12.6 10.8 9.2 10.9
Somewhat stressed 39.6 32.6 33.6 39.3 40.6 47.0 47.5
Not very stressed 29.1 24.1 28.8 28.6 31.1 28.2 28.1
Not stressed at all 13.5 17.3 17.1 14.7 12.6 12.5 9.8
Household Size
Total
Just one person, myself 2 people 3 people 4 people 5 or more
TOTAL (u/w) 4260 830 1610 643 681 496
TOTAL (w/t) 4260 576 1238 752 954 741
NET: TOP2 17.8 15.7 14.7 20.1 18.8 20.8
NET: BTM3 82.2 84.3 85.3 79.9 81.2 79.2
Extremely stressed 4.5 3.6 3.4 5.6 4.9 5.3
Very stressed 13.3 12.1 11.3 14.4 13.9 15.6
Somewhat stressed 39.6 35.9 38.2 43.8 42.3 36.8
Not very stressed 29.1 30.4 33.0 25.9 25.8 29.3
Not stressed at all 13.5 18.0 14.2 10.2 13.1 13.0

36
Symptom Assessment / Testing Assessment
Total No Symptoms
Any New Symptom
New
High-Risk Symptom
Positive or a Pending COVID-19 Test
TOTAL (u/w) 4260 3688 572 205 52
TOTAL (w/t) 4260 3624 636 232 53
NET: TOP2 17.8 15.8 28.9 35.0 37.4
NET: BTM3 82.2 84.2 71.1 65.0 62.6
Extremely stressed 4.5 3.6 9.3 12.0 17.1
Very stressed 13.3 12.2 19.6 23.0 20.3
Somewhat stressed 39.6 40.1 36.5 36.9 27.5
Not very stressed 29.1 29.5 27.3 21.9 28.9
Not stressed at all 13.5 14.6 7.3 6.2 6.2

37

38
Q14. How optimistic or pessimistic are you about the future right now?
Regions of Ontario
Total OTHER Southwest Eastern Northern Central
GTA (not including Toronto) Toronto
TOTAL (u/w) 4260 8 1339 651 757 824 300 381
TOTAL (w/t) 4260 5 1259 656 627 959 330 424
NET: TOP2 46.2 27.8 46.8 46.7 49.8 46.4 37.8 44.5
NEITHER 27.5 29.2 28.7 29.4 26.1 25.7 30.0 24.9
NET: BTM2 17.8 31.9 16.9 14.9 15.0 18.5 23.7 22.5
Very optimistic 13.1 0.0 12.2 12.6 16.5 14.7 8.6 11.4
Somewhat optimistic 33.1 27.8 34.7 34.1 33.3 31.7 29.2 33.1
Neither optimistic nor pessimistic 27.5 29.2 28.7 29.4 26.1 25.7 30.0 24.9
Somewhat pessimistic 13.9 31.9 13.1 10.8 11.2 14.7 19.3 18.4
Very pessimistic 3.9 0.0 3.8 4.0 3.9 3.8 4.4 4.1
Don't know 8.5 11.1 7.6 9.0 9.1 9.4 8.5 8.0

39
Household Income
Total
Less than $20,000
$20,000 to $40,000
$40,000 to $60,000
$60,000 to $80,000
$80,000 to $100,000
$100,000 or more
TOTAL (u/w) 4260 432 732 614 441 388 726
TOTAL (w/t) 4260 497 651 559 445 430 840
NET: TOP2 46.2 42.9 43.3 43.9 52.9 51.3 50.7
NEITHER 27.5 27.8 26.1 25.5 26.0 28.8 27.5
NET: BTM2 17.8 16.5 15.5 21.2 16.2 16.5 20.3
Very optimistic 13.1 16.1 14.1 12.4 13.4 16.4 12.3
Somewhat optimistic 33.1 26.7 29.3 31.5 39.5 34.9 38.3
Neither optimistic nor pessimistic 27.5 27.8 26.1 25.5 26.0 28.8 27.5
Somewhat pessimistic 13.9 11.4 11.4 15.7 12.4 14.7 17.4
Very pessimistic 3.9 5.1 4.0 5.6 3.8 1.8 2.9
Don't know 8.5 12.9 15.1 9.3 4.9 3.4 1.5

40
Household Size
Total
Just one person, myself 2 people 3 people 4 people 5 or more
TOTAL (u/w) 4260 830 1610 643 681 496
TOTAL (w/t) 4260 576 1238 752 954 741
NET: TOP2 46.2 39.1 48.8 46.6 45.5 47.8
NEITHER 27.5 28.3 25.8 31.3 27.4 25.7
NET: BTM2 17.8 19.0 16.7 16.0 21.0 16.5
Very optimistic 13.1 12.2 12.4 12.8 12.1 16.5
Somewhat optimistic 33.1 26.9 36.5 33.8 33.4 31.3
Neither optimistic nor pessimistic 27.5 28.3 25.8 31.3 27.4 25.7
Somewhat pessimistic 13.9 15.2 12.2 12.4 17.4 12.7
Very pessimistic 3.9 3.8 4.6 3.6 3.6 3.8
Don't know 8.5 13.6 8.6 6.2 6.1 10.0

41
Symptom Assessment / Testing Assessment
Total No Symptoms
Any New Symptom
New
High-Risk Symptom
Positive or a Pending COVID-19 Test
TOTAL (u/w) 4260 3688 572 205 52
TOTAL (w/t) 4260 3624 636 232 53
NET: TOP2 46.2 46.3 45.7 45.4 50.5
NEITHER 27.5 28.0 24.6 24.5 23.9
NET: BTM2 17.8 17.0 22.4 22.8 18.9
Very optimistic 13.1 12.6 16.0 17.1 20.7
Somewhat optimistic 33.1 33.7 29.8 28.3 29.8
Neither optimistic nor pessimistic 27.5 28.0 24.6 24.5 23.9
Somewhat pessimistic 13.9 13.1 18.6 18.4 16.1
Very pessimistic 3.9 3.9 3.9 4.4 2.8
Don't know 8.5 8.8 7.2 7.2 6.7
42
Q15. As far as you know, are the people in your neighbourhood observing "social distancing" by staying at least 6 feet apart?
Regions of Ontario
Total OTHER Southwest Eastern Northern Central
GTA (not including Toronto) Toronto
TOTAL (u/w) 4260 8 1339 651 757 824 300 381
TOTAL (w/t) 4260 5 1259 656 627 959 330 424
Yes 85.0 70.8 82.1 87.7 86.3 86.7 87.6 81.6
No 15.0 29.2 17.9 12.3 13.7 13.3 12.4 18.4
Household Income
Total
Less than $20,000
$20,000 to $40,000
$40,000 to $60,000
$60,000 to $80,000
$80,000 to $100,000
$100,000 or more
TOTAL (u/w) 4260 432 732 614 441 388 726
TOTAL (w/t) 4260 497 651 559 445 430 840
Yes 85.0 74.5 83.4 83.4 87.7 87.2 89.2
No 15.0 25.5 16.6 16.6 12.3 12.8 10.8

43
Household Size
Total
Just one person, myself 2 people 3 people 4 people 5 or more
TOTAL (u/w) 4260 830 1610 643 681 496
TOTAL (w/t) 4260 576 1238 752 954 741
Yes 85.0 83.8 85.3 84.2 87.8 82.5
No 15.0 16.2 14.7 15.8 12.2 17.5
Symptom Assessment / Testing Assessment
Total No Symptoms
Any New Symptom
New
High-Risk Symptom
Positive or a Pending COVID-19 Test
TOTAL (u/w) 4260 3688 572 205 52
TOTAL (w/t) 4260 3624 636 232 53
Yes 85.0 85.7 81.0 83.7 94.0
No 15.0 14.3 19.0 16.3 6.0

44
Q16. Do you approve or disapprove of "social distancing"?
Regions of Ontario
Total OTHER Southwest Eastern Northern Central
GTA (not including Toronto) Toronto
TOTAL (u/w) 4260 8 1339 651 757 824 300 381
TOTAL (w/t) 4260 5 1259 656 627 959 330 424
Approve 95.8 100.0 94.8 97.7 95.1 95.9 97.3 95.9
Disapprove 4.2 0.0 5.2 2.3 4.9 4.1 2.7 4.1
Household Income
Total
Less than $20,000
$20,000 to $40,000
$40,000 to $60,000
$60,000 to $80,000
$80,000 to $100,000
$100,000 or more
TOTAL (u/w) 4260 432 732 614 441 388 726
TOTAL (w/t) 4260 497 651 559 445 430 840
Approve 95.8 93.3 94.7 96.5 94.5 97.7 97.4
Disapprove 4.2 6.7 5.3 3.5 5.5 2.3 2.6

45
Household Size
Total
Just one person, myself 2 people 3 people 4 people 5 or more
TOTAL (u/w) 4260 830 1610 643 681 496
TOTAL (w/t) 4260 576 1238 752 954 741
Approve 95.8 94.9 96.8 94.7 95.6 96.5
Disapprove 4.2 5.1 3.2 5.3 4.4 3.5
Symptom Assessment / Testing Assessment
Total No Symptoms
Any New Symptom
New
High-Risk Symptom
Positive or a Pending COVID-19 Test
TOTAL (u/w) 4260 3688 572 205 52
TOTAL (w/t) 4260 3624 636 232 53
Approve 95.8 95.8 96.3 96.0 100.0
Disapprove 4.2 4.2 3.7 4.0 0.0

46
Q17. As far as you know, are your neighbours staying home as much as possible?
Regions of Ontario
Total OTHER Southwest Eastern Northern Central
GTA (not including Toronto) Toronto
TOTAL (u/w) 4260 8 1339 651 757 824 300 381
TOTAL (w/t) 4260 5 1259 656 627 959 330 424
Yes 91.0 100.0 88.2 92.6 91.1 91.9 96.2 90.2
No 9.0 0.0 11.8 7.4 8.9 8.1 3.8 9.8
Household Income
Total
Less than $20,000
$20,000 to $40,000
$40,000 to $60,000
$60,000 to $80,000
$80,000 to $100,000
$100,000 or more
TOTAL (u/w) 4260 432 732 614 441 388 726
TOTAL (w/t) 4260 497 651 559 445 430 840
Yes 91.0 82.0 91.3 91.5 93.0 91.7 93.1
No 9.0 18.0 8.7 8.5 7.0 8.3 6.9

47
Household Size
Total
Just one person, myself 2 people 3 people 4 people 5 or more
TOTAL (u/w) 4260 830 1610 643 681 496
TOTAL (w/t) 4260 576 1238 752 954 741
Yes 91.0 89.9 92.5 91.5 93.0 86.2
No 9.0 10.1 7.5 8.5 7.0 13.8
Symptom Assessment / Testing Assessment
Total No Symptoms
Any New Symptom
New
High-Risk Symptom
Positive or a Pending COVID-19 Test
TOTAL (u/w) 4260 3688 572 205 52
TOTAL (w/t) 4260 3624 636 232 53
Yes 91.0 91.4 88.5 91.8 97.3
No 9.0 8.6 11.5 8.2 2.7

48
Q18. Do you approve or disapprove of staying at home as much as possible?
Regions of Ontario
Total OTHER Southwest Eastern Northern Central
GTA (not including Toronto) Toronto
TOTAL (u/w) 4260 8 1339 651 757 824 300 381
TOTAL (w/t) 4260 5 1259 656 627 959 330 424
Approve 93.9 100.0 92.4 93.1 94.6 96.1 95.8 91.8
Disapprove 6.1 0.0 7.6 6.9 5.4 3.9 4.2 8.2
Household Income
Total
Less than $20,000
$20,000 to $40,000
$40,000 to $60,000
$60,000 to $80,000
$80,000 to $100,000
$100,000 or more
TOTAL (u/w) 4260 432 732 614 441 388 726
TOTAL (w/t) 4260 497 651 559 445 430 840
Approve 93.9 94.6 94.3 94.7 92.8 94.7 92.2
Disapprove 6.1 5.4 5.7 5.3 7.2 5.3 7.8

49
Household Size
Total
Just one person, myself 2 people 3 people 4 people 5 or more
TOTAL (u/w) 4260 830 1610 643 681 496
TOTAL (w/t) 4260 576 1238 752 954 741
Approve 93.9 93.3 95.5 93.3 92.7 93.7
Disapprove 6.1 6.7 4.5 6.7 7.3 6.3
Symptom Assessment / Testing Assessment
Total No Symptoms
Any New Symptom
New
High-Risk Symptom
Positive or a Pending COVID-19 Test
TOTAL (u/w) 4260 3688 572 205 52
TOTAL (w/t) 4260 3624 636 232 53
Approve 93.9 93.8 94.3 94.7 97.0
Disapprove 6.1 6.2 5.7 5.3 3.0