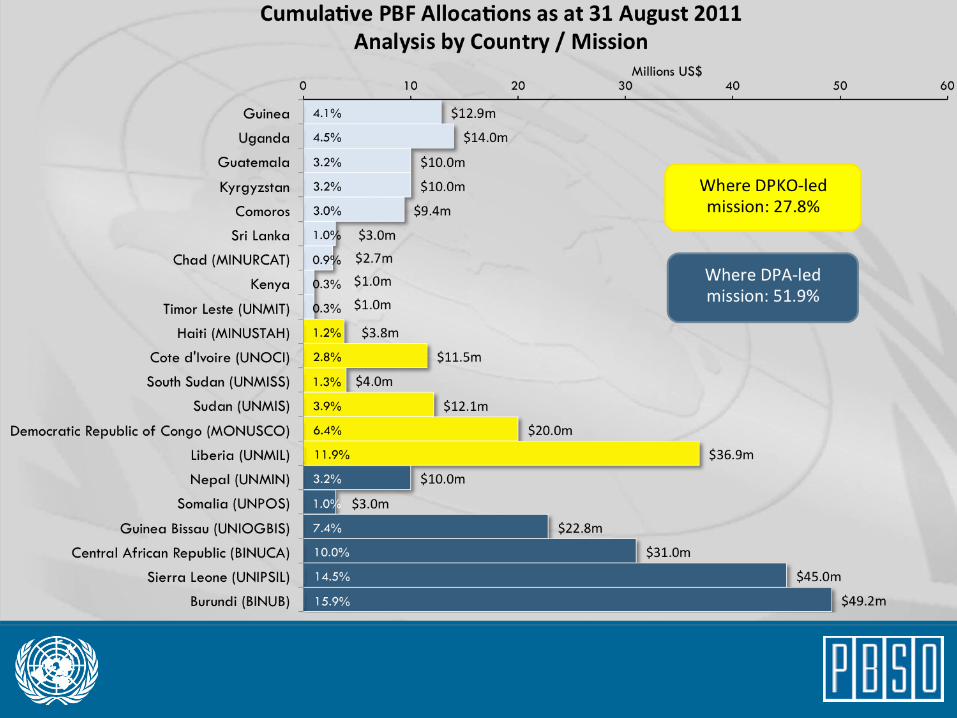
Total Country Allocations = Amount allocated to countries (decision by PBF HQ)
9
Total A llocations and Transfers (2007 -2011) 76.46 39.10 73.25 52.40 80.11 41.15 35.15 42.48 46.52 89.36 - 10.00 20.00 30.00 40.00 50.00 60.00 70.00 80.00 90.00 100.00 2007 2008 2009 2010 2011 $ m illion Total C ountry Allocations Total ProjectTransfers Total Country Allocations = Amount allocated to countries (decision by PBF HQ) Total Project Transfers = Amount transferred to UN agencies for project implementation (decision by Joint Steering Committee, or by PBF HQ if IRF)
description
Total Country Allocations = Amount allocated to countries (decision by PBF HQ) Total Project Transfers = Amount transferred to UN agencies for project implementation (decision by Joint Steering Committee, or by PBF HQ if IRF). 64%. 36%. 63%. 52%. 48%. 37%. - PowerPoint PPT Presentation
Transcript of Total Country Allocations = Amount allocated to countries (decision by PBF HQ)

Total Allocations and Transfers (2007 - 2011)
76.46
39.10
73.25
52.40
80.11
41.1535.15
42.4846.52
89.36
-10.0020.0030.0040.0050.0060.0070.0080.0090.00
100.00
2007 2008 2009 2010 2011
$ m
illio
n
Total Country Allocations Total Project Transfers
Total Country Allocations = Amount allocated to countries (decision by PBF HQ) Total Project Transfers = Amount transferred to UN agencies for project implementation (decision by Joint Steering Committee, or by PBF HQ if IRF)

Total PBF income(actual and expected receipts)
0.00
20.00
40.00
60.00
80.00
100.00
120.00
140.00
2006 2007 2008 2009 2010 2011 2012 2013 2014 2015
$ m
illio
n
Contributions received Expected contributions
$100m Target


PBF Allocations: PBC vs non-PBC
197.73
112.58
39.70 43.6036.7625.50
0.00
50.00
100.00
150.00
200.00
250.00
Cumulative 2010 2011
$m
PBC Non-PBC
64%
36%
52% 48% 63%37%

Approved Project Budgets by Priority Area and Outcome Areaas at 31 August 2011
TechnicalSupport
Youth Employment
National Recon.
Security Sector
Infrastructure
PrivateSector
Good Governance
Rule of Law
IDPs
PBF priority areas
DDR
HumanRights
PBF outcome areasin USD million
Women
Dialogue
$0.0 $20.0 $40.0 $60.0 $80.0 $100.0 $120.0
(Re)-establish essentialadministrative services
Revitalise the economy andgenerate immediate peace
dividends
Promote coexistence and peacefulresolution of conflict
Support the implementation ofpeace agreements and political
dialogue

Top 5 recipients in 2011 (to date): (from bottom) UNDP, UNOPS, UNICEF, UNHCR, UNFPA
Agency share of approved projects
0%
20%
40%
60%
80%
100%
120%
2007 2008 2009 2010 2011
Year
Prop
ortio
n of
pro
ject
ap
prov
als
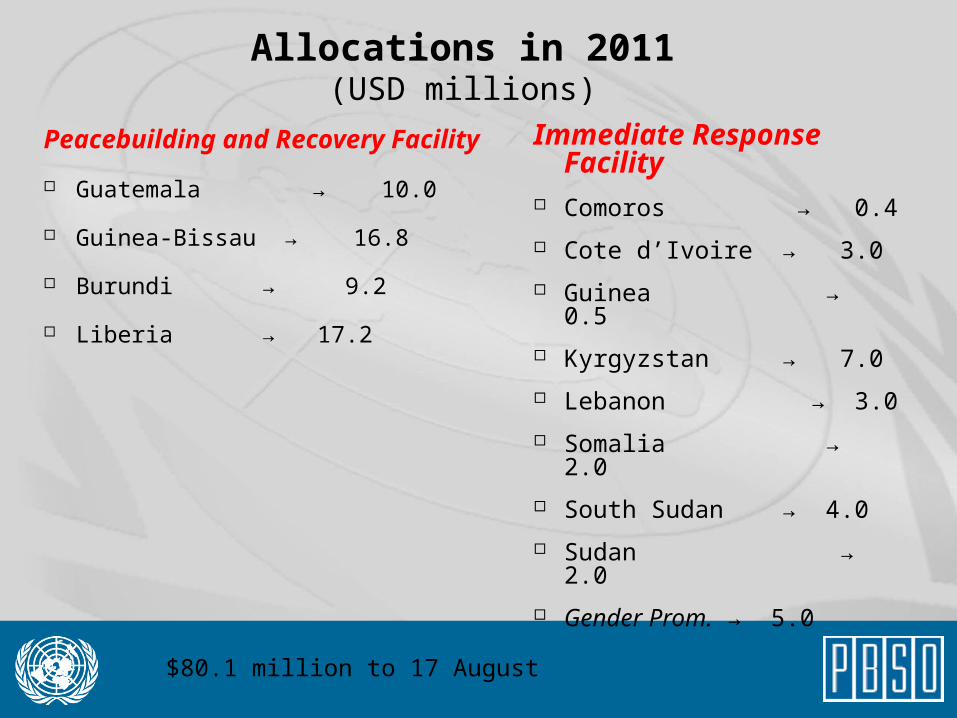
Allocations in 2011(USD millions)
Peacebuilding and Recovery Facility
Guatemala → 10.0
Guinea-Bissau → 16.8
Burundi → 9.2
Liberia → 17.2
Immediate Response Facility
Comoros → 0.4
Cote d’Ivoire → 3.0
Guinea → 0.5
Kyrgyzstan → 7.0
Lebanon → 3.0
Somalia → 2.0
South Sudan → 4.0
Sudan → 2.0
Gender Prom. → 5.0
$80.1 million to 17 August

Country Engagement - Active Countries List
(Target: 20 countries maximum) Currently “Active” Other requests
PRF (+ IRF in some cases)1. Burundi* 2. CAR*3. Comoros 4. Côte d'Ivoire 5. DRC ** 6. Guatemala7. Guinea* 8. Guinea Bissau*9. Lebanon 10. Liberia*11. Nepal 12. Sierra Leone*13. Sudan 14. Uganda (Northern)
IRF-only 15. Chad** 16. Kyrgyzstan ** 17. Somalia 18. South Sudan
Countries that close before end 201219. Haiti 20. Kenya21. Sri Lanka 22. Timor Leste
Requests since January 2011Bosnia Herzegovina Mali Jamaica Sudan – DarfurTunisia (exploratory only)
(Pre-2011 requests) Haiti IraqRepublic of Congo (Brazzaville) Timor LesteTunisia
* = Peacebuilding Commission ** = PRF Eligibility declared by Secretary-General in 2011