TOPOGRAPHIC CHARACTERISTICS OF … CHARACTERISTICS OF DRAINAGE BASINS ... The configuration of the...
36
If yon no longer need this publication write to the Geological Surrey in Washington for official mailing label to use in returning it UNITED STATES DEPARTMENT OF THE INTERIOR TOPOGRAPHIC CHARACTERISTICS OF DRAINAGE BASINS GEOLOGICAL SURVEY WATER-SUPPLY PAPER 968-C
Transcript of TOPOGRAPHIC CHARACTERISTICS OF … CHARACTERISTICS OF DRAINAGE BASINS ... The configuration of the...
If yon no longer need this publication write to the Geological Surrey in Washington for official mailing label to use in returning it
UNITED STATES DEPARTMENT OF THE INTERIOR
TOPOGRAPHIC CHARACTERISTICS
OF DRAINAGE BASINS
GEOLOGICAL SURVEY WATER-SUPPLY PAPER 968-C

UNITED STATES DEPARTMENT OF THE INTERIOR J. A. Krug, Secretary
GEOLOGICAL SURVEY W. E. Wrather, Director
Water-Supply Paper 968-C
TOPOGRAPHIC CHARACTERISTICS
OF DRAINAGE BASINS
BY WALTER B. LANGBEINAND OTHERS
Contributions to the hydrology of the United States, 1944
(Pages 125-158)
UNITED STATES
GOVERNMENT PRINTING OFFICE
WASHINGTON : 1947
For sale by the Superintendent of Documents, U. S. Government Printing Office, Washington 25, D. C.Price 15 cents
NOTE. This report was prepared in 1941. Conditions arising out of the war have delayed its publication.

CONTENTS
Abstract__________________________.___________ 125Introduction_____________________________________________________ 125Cooperation and personnel_____________________________________ 127Meteorologic factors affecting runoff _________________________________ 127Differences in character of drainage basins____-___________-_____ __ 128Previous studies _______________________________________________ 128Purpose and scope of the present study____________________________ 130Methods of work______ ________________ _ ________ 132
Maps._____________________________________ 132Area of basins______________________________________________ 133Stream density _______________________________________ 133Area-distance distribution._________________________________ 134Length of basin______.___________-__________________________ 135Land slope______________________________________________ 135Channel slope_________________________________________________ 138Area-altitude distribution_______________________________ 140Area of water surfaces________---_______-____---____________--_ 141Summary of results_______________-.___________-______________-_ 142
Index_____________________________________ __ 157
ILLUSTRATIONS
Page PLATE 2. Topographic map of Little Androscoggin River Basin above
South Paris, Maine______________________________ In pocketFIGURE 48. Hydrographs of two streams in New Jersey during flood of
June 1938_____________________________ 12949. Relation between area of drainage basin and S al________ 13650. Variation of computed slope of tributary streams with number
of subareas, West River at Newfane, Vt_________________ 13951. Typical hypsometric curves of drainage basins___________ 14052. Graph showing general variation in stream slopes and altitude
in relation to size of drainage basin__ _________________ 143m

TOPOGRAPHIC CHARACTERISTICS OF DRAINAGE BASINS
By WALTER B. LANGBEIN and others
ABSTRACT
River floods are the result of many causes, and one of the primary objectives of scientific hydrology is the segregation and evaluation of the causative factors. The climatic factor and the soil-vegetation com plex are variables that exercise their principal influence on the volume of runoff. The topography of drainage basins is a sensibly permanent characteristic which influences mainly the concentration or time distribution of the discharge from a drainage basin. River systems differ in their efficiency as agencies for collecting and conducting water. In some systems, surface waters are quickly assembled, and the dis charge reflects somewhat sensitively the variations of the available supply. In others, the surface drainage is longer delayed and the discharge is released slowly.
As a basis for quantitative studies of these evident differences in behavior, selected topographic features for about 340 drainage basins in the northeastern United States were studied, using Geological Sur vey topographic maps. The data were compiled in cooperation with the Work Projects Administration of the Federal Works Agency and included information on drainage area, length of streams, stream density, land slope, channel slope, area-altitude distribution, and area of water bodies of basins that ranged in extent from 1.64 to 7,797 square miles. Considerable effort was made to assure accuracy of the computations by appropriate checks, and the results are summa rized in the table at the end of this report.
The results indicate that none of the topographic factors are unique, but each reflects a condition that also influences the olhers. For example, steep land slopes are generally associated with stpbp channel slopes and conversely. A significant variation of slope awd altitude with area of basin is found, and stream density tends to vary^with theland slope.
INTRODUCTION
This report presents a compilation of topographic data on drainage basins in the northeastern United States. The configuration of the earth reflects the impact of many natural forces, and it in turn exer cises profound influence upon man. Most of these influences are so
125

126 CONTRIBUTIONS TO HYDROLOGY, 1944
basic that they have shaped life and civilization into conformity with them. Mountains, plains, valleys, and rivers each favor or retard man's search for economic stability. Within human history the first three have remained unchanged. Rivers, on the other hand, fluctuate in size from day to day and from year to year. The ampli tude and frequency of these fluctuations, so significant with respect to navigation, water power, irrigation, and such riparian developments as cities and highways, are largely determined by three separate, yet interdependent features, namely climate, physiography, and the soil- vegetation complex. The interrelation of these three features with the behavior of rivers is imperfectly understood and is the subject of much investigation. This report singles out the physiography of the land for attention.
The relations between the rate, volume, and fluctuations of rivers and the topographic characteristics of the land they drain and through which they flow may be readily determined after discerning examina tion of the terrain and river developments, but expressing them in the quantitative terms necessary for the economic design of structures for river utilization or control requires first, topographic maps, and second, records of river flow of length adequate to define the behavior.
The stream-gaging program of the Geological Survey is Nation wide and now includes over 4,500 river-measurement stations, at which more than 65,000 station years of record were available in 1942. These records furnish an adequate source of material concern ing stream behavior. The mapping program of the Geological Sur vey, also Nation-wide, is in general not so complete. Although about 50 percent of the country has been mapped, only States in the north eastern part have been completely covered; the scattered areas mapped in other States generally do not cover completely the areas in which stream-gaging has been carried OD, so that only a small fraction of them are suitable for use in comparisons of stream-flow character istics or river morphology.
In the northeastern and north-central States the range hi topog raphy is sufllcient to furnish a basis for studying its effect on stream flow. The^topographic characteristics compiled from the maps and summarized in this report can only be evaluated by a considera tion of the hydrology of stream flow, the assembling of waters in a drainage system, and the hydraulic elements that regulate velocity of flow. Many stream-flow characteristics are related either directly or indirectly to topographic features. It would seem, however, that the factors most sensitive to topographic difference would be those relating to floods. In this study, therefore, particular although not exhaustive attention is given to the correlation of flood-flow charac teristics with topography. This information will serve as a basis for
CHARACTERISTICS OF DRAINAGE BASINS 127
further study of such correlations and also of other characteristics, such as volume yield, erosion, and deposition of sediments. Similarly the topographic data offers basic material for studies of river mor phology, as geologic evidence suggests that a significant portion of river-channel development takes place during flood.
COOPERATION AND PERSONNEL,
The cooperative project for the compilation of topographic data was undertaken in 1939 by the Works Progress Administration, which on April 25, 1939, became the Work Projects Administration under the Federal Works Agency. Their cooperation in organizing compe tent working groups is especially acknowledged. The Geological Survey sponsored the project and furnished technical direction, maps, and supplies. This work was carried on by W. B. Langbein, under the general direction of K. W. Davenport, chief of the Division of Water Utilization. The project at Boston, Mass., was under the supervision of H. B. Kinnison, district engineer, and his associates, particularly C. E. Knox, M. A. Benson, and B. R. Colby. The con duct of the work at Pittsburgh, Pa., was ably managed by Wm. S. Crozier, supervisor for the Works Projects Administration. Mr. Crozier died January 21, 1941, near the close of the project. H. M. Erskine, associate engineer of the Geological Survey at Pittsburgh, maintained close contact with the project there, and its continuity and efficiency may be largely credited to his competent administration.
METEOROL.OGIC FACTORS AFFECTING RUNOFF
River floods are the result of many causes, and one of the primary objectives of hydrologic study is the segregation of the causative factors and the evaluation of their effects on the resultant floods under various associated conditions.
Readily apparent is the source of the water, generally an unusual amount of rainfall, which may be characterized by great intensity and in many regions may be augmented by water from melting snow. Water in excess of that which can be absorbed by the ground or evap orated into the air directly or through vegetation collects in the stream channels that drain the area. Once in 'the stream system, the runoff flows to the mouth through channels which, as the trunk of a network of streams, progressively increase in size as contributions are received from tributary streams.
The quantity of rainfall or snow melt, its time distribution, and the associated soil, vegetal, and climatic conditions that determine the portion of the supply that becomes direct runoff are to a large extent variable characteristics of individual storms. These variable edaphic and climatic factors are separate phases of the rainfall-runoff relation.

128 CONTRIBUTIONS TO HYDROLOGY, 1944
The channel system, however, is a relatively permanent characteristic of a drainage basin. Some influential changes may take place in this system; for example, variations in seasonal vegetation along the banks may affect the hydraulic conveyance, floods may scour or deposit sediments, and old bends may be cut through and new ones created. Although the effect of thes.e changes on local flood stages may be considerable, it is assumed that the resultant effect on total discharge from a basin will tend to be compensating and that even the cumulative effect on flood-discharge characteristics during a period as short as the usual stream-gaging record would be minor.
DIFFERENCES IN CHARACTER OF DRAINAGE BASINS
River systems differ in their efficiency as agencies for collecting and conducting water. In some systems the surface waters are quickly assembled, and the discharge therefrom reflects somewhat sensitively the variations of the available supply. In others 'the surface drainage is longer delayed and the discharge is released slowly. This difference is illustrated in figure 48, which shows the hydrographs of two nearby streams, each draining about 50 square miles of coastal areas of New Jersey, during a flood in June 1938. The rainfall causing these floods and the volume discharged were nearly the same for both areas. The difference in behavior illustrated by the hydrographs is normal for these two basins and may be accounted for largely by the differences in physiographic characteristics, Manasquan River having about twice the gradient of Great Egg River and about one-fifth the swamp area.
PREVIOUS STUDIES
The fact of relationship between the time distribution of discharge during a flood and the size, shape, and gradient of a drainage system is widely recognized. Few attempts have heretofore been made to determine this relationship quantitatively, probably because of the volume of labor required to evaluate the topographic factors.
Horton 1 in 1926 and again in 1932 discussed the desirability and need for a quantitative rational procedure and proposed methods for evaluating certain pertinent physiographic factors.
Pettis 2 in 1927 presented a formula to compute the maximum flood discharge, in which the five-fourths power of the average basin width was used.
Gregory and Arnold 3 in 1932 developed in detail certain expressions1 Horton, R. E., in Jarvis, C. S., Flood-flow characteristics: Am. Soc. Civil Eng. Trans., vol. 89, pp.
1881-1086,1926; Drainage-basin characteristics: Am. Geophys. Union Trans., No. 13, pp. 350-361,1932.8 Pettis, C. B., A new theory of river flood flow (published privately, copyrighted 1927).* Gregory, B. L., and Arnold, C. E., Eational runoff formulas: Am. Soc. Civil Eng. Trans., vol. 96, pp.
1038-1175, 1932.

CHARACTERISTICS OF DRAINAGE BASINS 129
1600
1400
1200
llOOO
Ul£800
I
600
400
200
MANASQUAN RIVER AT SOUANKUM, NEW JERSEY
GREAT EGG RIVER AT FOLSOM, NEW JERSEY
26 27 28 29 30 I 23 4 5> 6 JUNE JULY
FIGUEE 48. Hydrographs of two streams in New Jersey during flood of June 1938.
and procedures applicable to small drainage areas for translating rain fall into rates of stream flow in terras of basin characteristics.
Bernard 4 carried Gregory and Arnold's expressions somewhat further and presented formulas applicable to a few selected basins.
* Bernard, M. M., An approach to determinate stream flow: Am. Soc. Civil Eng. Trans., vol. 100, pp. 347-395, 1935.
747049 47 2

130 CONTRIBUTIONS TO HYDROLOGY, 1944
Sherman 5 in 1932 presented unit hydrographs for four streams whose drainage areas and slopes differed widely. He explained how the unit hydrographs expressed these differences and suggested that basins having physical characteristics similar to the four types pre sented would have similar hydrographs.
McCarthy 6 in 1937 also used the unit hydrograph as an expression of the runoff characteristics of a drainage basin, stating further that "the agreements between graphs developed from May and November storms substantiate the contention that primarily the unit hydrograph is a function not of surface cover, which may be subject to seasonal change, but of topographic features of a watershed." From this postulate he derived a working relationship between the crest dis charge and the length of base of unit hydrographs of 25 drainage basins* in the Connecticut River Basin, in terms of the area, mean slope, and stream pattern, determined by inspection and expressed as one-stem basin, two-stem basin, and so on, for application to flood- control design.
Morgan and Hullinghorst 7 in 1939 stated:The factors which determine the discharge characteristics of any watersned
are innumerable, some having a major bearing on those characteristics while others are of negligible consequence. It was determined by examination of nine gaged basins having complete unit hydrograph and watershed data, and corrob orated by examination of a number of gaged basins with data ranging from almost complete to fragmentary, that the discharge characteristics can be attri buted principally to three fundamental, definite watershed characteristics, namely,
a. Area of the watershed in square miles,b. Mean length of travel in miles, andc. Mean height of watershed above outflow station in feet.
On this basis, empirical relations between these three factors were established for nine streams tributary to the Chemung River in New York.
PURPOSE AND SCOPE OF THE PRESENT STUDY
The present project was designed to provide basic material whereby investigations such as those outlined can be carried further, the range being limited, of course, to areas adequately mapped, which are mainly in the northeastern United States. Prior to this study, refer ences to the subject were read with the view to determining which topographic factors were considered to have major influence upon
Sherman, L. K., The relation of hydrographs of runoff to size and character of drainage basins: Am. Qeophys. Union Trans., No. 13, pp. 332-339, 1932.
McCarthy, O. T., The unit hydrograph and flood routing (unpublished manuscript presented at con ference of North Atlantic Division, Corps of Engineers, II. S. Army, June 24, 1938).
i Morgan, K., and Hullinghorst, D. W., Unit hydrographs for gaged and ungaged watersheds: U. S. Engineer Office, Binghamton, N. Y., July 1939. [Processed.]

CHARACTERISTICS OF DRAINAGE BASINS 131
discharge characteristics, and, so far as practicable, the suggestions thus obtained were incorporated in the project as proposed for cooper ation to the Works Progress Administration (succeeded on April 25, 1939, by the Work Projects Administration). The compilation was based upon the topographic maps of the Geological Survey covering areas tributary to gaging stations of the Geological Survey.
In the organization of a surface-water system, and of a large part of the ground-water system as well, the drainage basin is a natural hydrologic land unit. Surface runoff is divided into drainage basins by the watersheds, and within each basin it follows a system of water courses in which the flow undergoes retardation, acceleration, or other changes that are distinctly related to the physical characteristics of that basin. Similar conditions exist with respect to all or most of. the ground-water runoff. Essentially all the water within a given basin, except that which is lost by evaporation or transpiration, drains out through a common outlet or mouth.
For purposes of analysis, a major stream basin may be subdivided by considering the area tributary to the stream at any given point, for example, a gaging station, as a basin having its own characteristics. The separate characteristics of several contributory areas may then be combined to obtain the resultant for the major basin.
Geographic and topographic characteristics of drainage basins, based largely on certain horizontal and vertical dimensions, were selected for compilation and study. Geographic characteristics include water bodies, direction of stream flow, latitude, and longitude. Topographic characteristics include horizontal dimensions covering basin area, stream length, and area-distance distribution, and vertical dimensions covering land slope, tributary and principal stream slopes, and basin altitude.
In selecting basins for this study preference was given to those for which long-term stream-flow records are available and to those free from artificial regulation. In addition to areas in the northeastern States and the Ohio River Basin a few surveyed areas in Wisconsin and Kentucky were included to spread the range in geographic extent and topographic characteristics. Many basins in New York, Penn sylvania, and New Jersey that might otherwise have been included were not studied because of insufficient time.
Besides listing topographic and hydrologic data, the original records afford a gazetteer of streams and lakes. Maps were prepared showing the stream skeleton of each basin, with names of streams, length from confluence to confluence, and drainage areas and altitudes pertinent to the subdivisions. A list of lakes and ponds, giving names, locations, and approximate altitudes and areas was also prepared, much of the

132 CONTRIBUTIONS TO HYDROLOGY, 1944
data for basins in New York State being based on a gazetteer by E. M. Douglas.8
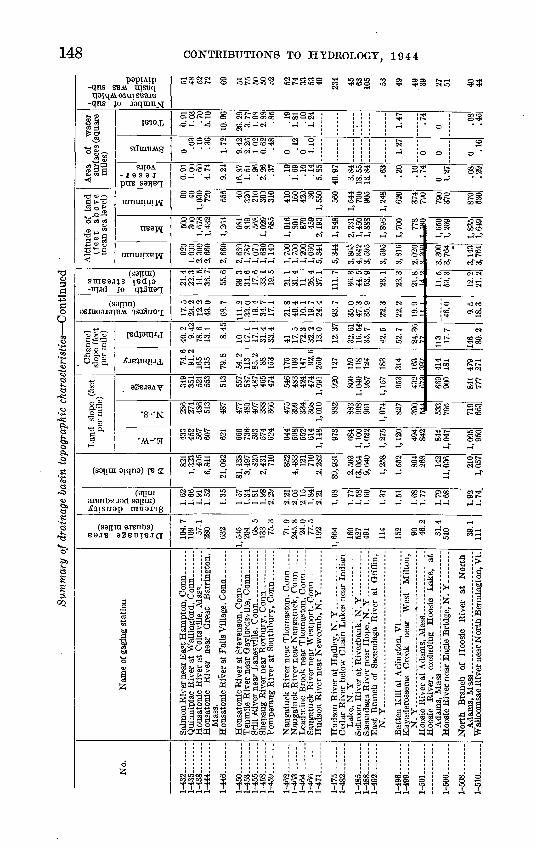
The summarized results of the compilation, covering about 340 basins, are given in the table on pages 145-155. The original records are on file at the office of the Geological Survey in Washington, D. C., and the computations for basins in New England (except Maine) are on file also at the Boston -office of the Geological Survey.
METHODS OF WORK
MAPS
Quadrangle maps on the scale 1:62,500, are the basis of this com pilation, except for a few areas in New Jersey where more detailed maps were available. On these maps the gaging stations were located and the tributary basins with sub-basin divisions were outlined. Generally, each basin was divided into 50 to 75 sub-basins. Care was taken that the sub-basins crossed the streams only at confluence points. To systematize the necessary tabulations, the sub-basins were numbered in accord with the following system, which is illus trated on plate 2.
The headwater basin farthest upstream (the one farthest removed from the gaging station along the main stream) is called no. 1; the sub-basin which it joins at the first confluence point is called no. 2; the sub-basin (or intervening area along the combined channel) below the confluence of sub-basins 1 and 2 is called no. 3; the next tributary sub-basin is called no. 4, and so on. Where a large tributary stream that has been subdivided joins the main stream, the next consecutive number is assigned to the farthest upstream sub-basin of this tribu tary. This constitutes the lowest number on such tributary, and the sub-basins of the tributary system are then numbered in the same manner as those of the main stream, down to the sub-basin immedi ately above the confluence of the tributary with the main stream. The succeeding number is assigned to the sub-basin along the main river immediately below the confluence, as before. The highest number in a basin is that of the sub-basin immediately above the mouth of the main stream; it indicates the number of sub-basins into which that drainage area is divided. As shown on plate 2 the number of each sub-basin is the large integer near its center; the smaller figures represent area, length of stream, and altitude.
8 Douglas, E. M., Gazetteer of the lakes, ponds, and reservoirs of the State of New York: Map Informa tion Office, Board of Surveys and Maps, 44 pp., Washington, 1926. [Processed.]

CHARACTERISTICS OF DRAINAGE BASINS 133
AREA OF BASINS
The total area of the basin within the watershed lines above the selected gaging station is the primary basin factor. In a humid climate the volume of discharge varies directly with the size of the tributary drainage area. Accordingly, the area in square miles was measured, not only of the main basin above the gaging station but also of a number of sub-basins (generally over 50). The size of the basins included in this compilation ranges from 1.64 to 7,797 square miles. In general, large streams were excluded because the size of sheets became unwieldy, because some contained unsurveyed areas, and because their stream-flow characteristics could best be determined by synthesis of their components.
STREAM DENSITY
The runoff from the several parts of the drainage basin is discharged by the streams, and, other factors being constant, the time required for the water to flow a given distance is directly proportional to the stream length. The stream or drainage density is-the ratio between the total length of all streams within the drainage basin and the total area of the basin and is an indication of the drainage development. Accordingly, the length of all streams down to the smallest shown on the topographic maps was measured to determine the stream density and the area-distance distribution.
The number of small headwater streams shown on the topographic maps would vary with the season and the wetness of the particular year during which the survey was made, as well as with the judgment of the topographer and cartographer as to the amount of detail to be shown on the map. These circumstances introduce a measure of inconsistency in stream-density results as determined from maps.
The ratio of stream density for the basins included in this compila tion, all of which are in the humid region, ranges from 0.89 to 3.37 miles per square mile and averages 1.65 miles per square mile. Other factors being equal,high drainage density indicates a more effective oper ation, of the agencies of stream incision. Greater incision, for example, would be associated with steep land slopes. Opportunity for incision would be greater also where most of the discharge occurs as surface runoff rather than through ground-water channels; such a condition exists in areas where the ground is sufficiently impervious to shed storm rainfall.. Drainage density is greater in humid regions than in arid regions; it would approach zero in flat, sandy desert regions and would approach a maximum in steep, rocky, humid regions.

134 CONTRIBUTIONS TO HYDROLOGY, 1944
The variation of stream density with'the land slope is shown by the following data derived from groups of basins in New England.
Variation of stream density with land slope
Range in stream Average landdensity slope
(miles per square (feet permile) mile)
1.00 to 1.25.__.__._._______.____._-_-_-_____ 290 1.26 to 1.50____________--._._-----________ 550 1.51 to 2.00.____.___---._._.______-_.____ 600 2.01 to 2.25________________________________ 700
The mean land slopes for basins in New England having drainage densities within the ranges indicated in the above data were averaged, and the results indicate that, in general, in a given region the higher drainage densities are associated with the steeper land slopes. The reciprocal of the drainage density is the average distance between streams, and half the reciprocal of drainage density is the average horizontal distance between the streams and appurtenant watershed lines, measured at right angles to the streams. Drainage density appears to be inversely related to the distance of overland flow as distinguished from flow in stream channels. However, hi basins sufficiently permeable so that all rainfall can be taken directly into the soil through infiltration, the drainage density approaches zero and is associated with zero, overland flow.
AREA-DISTANCE DISTRIBUTION
The concentration of runoff from drainage basins of equal size may be greatly affected by the distribution of the area with respect to dis tance from the gaging station or outlet. Other factors being equal, the runoff from areas close to the gaging station should reach it sooner than water from remote areas. Accordingly, a drainage basin whose tributaries are compactly organized, so that water from- all parts of the basin has a comparatively short distance to travel, will discharge its runoff more quickly and reach greater flood crests than one in which the larger part of the area is remote from the gaging station or outlet. This basin characteristic is expressed in the sum mary table by the quantity Sal, computed by multiplying each partial area in the basin (a) by the channel distance from the midpoint of the mam stem serving it, downstream to the gaging station (1). Distances along the stream channels were measured in 0.1 mile chords.
In a sense this quantity is also a measure of the volume of channel storage in the basin. For example, if under a given regime of flow the cross-sectional area of a river at a given place varies directly as the drainage area above, then the volume in any given reach would vary as the product of a coefficient by mean drainage area above the

CHARACTERISTICS OF DRAINAGE BASINS 135
reach by the length of the reach. The coefficient would be a function of the stage of the regime selected, the slope of the reach, friction al resistance, and other hydraulic factors. No method is proposed for evaluating the coefficient. However, the sum of the products of mean drainage area and length of reaches for a given basin is equal to the product Sal which was derived by both methods of computation.
The most compact drainage basin would be a glory-hole inlet, and the product. Sal for such a basin is 0.375 A 1>6° where A represents total area; for an equilateral triangle, with reference to an outlet at one of the vertices, the product is 0.94 A. 1 -50 ; and for a square, with reference to a corner, it is 0.76 A 1 -50 . Figure 49 shows the results of plotting the products Sal against the corresponding drainage area. Only enough points are shown to define the line of regression, whose equation is 0.90 A 1 - 56, or more approximately 1.2 A 1 -50, within the range shown. Natural basins are generally less compact than any of the geometric shapes mentioned.
Additional subdivision of a basin beyond the 50 to 75 sub-basins generally used would tend to increase the value of the product Sal. However, a study of West River Basin, above Newfane, Vt., indicates that the product Sal for 20 sub-basins was 6,620, for 50 sub-basins 6,810, and for 100 sub-basins 6,860. The values given in this report may therefore be considered essentially correct limiting values.
Points on the right of the trend line (fig. 49) represent basins less compact than the average, and those on the left the more compact. The regression line therefore furnishes a standard for comparing the relative compactness of different basins.
LENGTH OF BASIN
The table «(pp. 145-155) lists the length of longest watercourse in each basin measured in 0.1-mile chords to the source of the most headward stream. This length, when divided by the mean velocity of flow will give the time of concentration as used in the rational formula for the computation of flood discharge.
The mean length of travel of runoff or the distance to the center of gravity of the drainage system may be found by dividing the quantity Sal by the drainage area in square miles. This quotient is commonly identified by the symbol Lca . The table also lists the length of princi pal streams as defined under "Channel slope."
LAND SLOPE
Rainfall or snow melt which becomes direct runoff flows over the surface of the ground or, where the surface soil is shallow and per meable, immediately beneath it over the bedrock. The average distance water travels before entering a stream channel may be

136 CONTRIBUTIONS TO HYDROLOGY, 1944
Y
Efll. I betw
V
gsmw aavnbs KE '

CHARACTERISTICS OF DRAINAGE BASINS 137
expressed in terms of stream density. (See p. 133.) The rapidity with which the water travels to the streams likewise depends on the slope of the land.
The contours on the topographic maps provide a basis for determing the slope of the land by the intersection-line method outlined by Horton 9 as follows:
The intersection-line method. In order to reduce the labor of computation of slope of large areas the author has utilized the following method. An area the slope of which is to be determined is subdivided into squares of equal size by lines forming the boundaries between adjacent squares. The number of contours crossed by each subdividing line is counted and the lengths of the lines are scaled. Then the average scale-distance I' between contour crossing in the subdivision lines is v
F-51 N
where N is the number of contours crossed and 2i is the total length of the sub dividing lines. If a is the horizontal angle at which each of two parallel contours crosses an intersection line, then I' sin a is the horizontal distance between the two contours measured normal to the contours. Contours may cross the intersection lines at all angles from 0° to 90°. The mean value of sin a for angles from 0° to 90° is
yJ o
If D is the contour interval or difference in elevation in feet, and L is the average normal horizontal distance between contours, then
L= 0.6366 V
and the mean slope Sg of the area is
0.6366 =.
t * » = 1.571 -g-
In applying this method it is assumed that each contour crossed represents a difference of elevation along the subdivisional line equal to the contour interval. Of course it may happen that two adjacent contours are at the same elevation and are separated by land only a little higher or lower. On an average, however, the elevations of summits or depressions between equal contours will differ from that of the adjacent contours by an amount equal to one-half the contour interval, and it can readily be seen that the average declivity between a pair of contours of equal elevation is nearly the same as if the contours were separated by the contour interval D, so that the method gives nearly correct results even where the sub division lines cross adjoining contours of equal elevation, as in the case of summits and depressio'ns.
Horton, R. E., Drainage-basin characteristics: Am. Geophys. Union Trans., No. 13, pp. 350-361, 1932. 747049-47 3

138 CONTRIBUTIONS TO HYDROLOGY, 1644
By making the subdivision lines sufficiently frequent, the average slope of an area may be determined with whatever degree of accuracy is required.
This method has been tested by comparison of slope for the same area computed from the measured total lengths of contours, with, in general, good agreement.
In carrying out this computation, the slope along the meridian lines is computed separately from the slope along the parallels of latitude. Where there is a great difference between the land slope in the two directions, the orientation of the basin is determined by the axis of least slope. Where the east-west slope and the north-south slope are nearly the same, the line of orientation may be approximately midway between the two, or it may not be clearly defined in either direction in a cup-shaped or fan-shaped basin. Land slopes listed in the table range from 1,598 feet per mile for the upper Pemigewasset River Basin in New Hampshire to 55 feet for Great Egg River in Coastal New Jersey.
Paulsen 10 found, during the flood of September 1938 in the North Atlantic States, that the infiltration index tends to increase with decrease in mean land slope. He states that "although the slope of the land itself might influence the retentive capacity of the ground, this tendency may be due to other factors related to slope, such as depth of soil cover."
CHANNEL SLOPE
Upon leaving the land the runoff enters the channel system, through which it flows in channels that increase progressively in size with the entrance of additional water. Channels in a drainage basin are clas sified for study as principal and tributary. The principal streams of a basin are defined as those that drain 10 percent or more of the total area of the basin; tributaries are defined as those that drain less than 10 percent of the area of the basin. The average slope of the tribu taries and of the principal streams is computed separately as the quotient of the total fall divided by the corresponding total length and is reported in the summary table.
In computing the slope of the stream channels, only the largest stream in each sub-basin is considered. Thus, if a basin is divided into 75 sub-basins only 75 stream lengths and falls are measured. These stream lengths are classified as principal or tributary, and the average slope of each is computed. As only one stream in each sub- basin is included in the classification, many minor headwater streams are excluded from consideration; consequently, the reported slope of the tributary stream is affected by the number of subareas into which the basin is divided. The reported mean slope of the tributary
"" Paulsen, C. G., Hurricane floods of September 1938: U. S. Qeol. Survey Water-Supply Paper 867, pp. 440-441, 1940.

CHARACTERISTICS OF DRAINAGE BASINS 139
streams increases as the number of subareas becomes larger, thus embracing more steep minor headwater streams. This is illustrated in figure 50, which shows the result of a comprehensive study of the slope of tributaries of West River at Newfane, Vt. The asymptote resulting from that study is about 225 feet per mile, whereas the channel slope obtained with 53 subareas (see table, No. 1-354) is 200 feet per mile.
The slope information for the several drainage basins listed in the table discloses that a steep land slope is generally associated with
zo 80 90 10030 40 50 60 70NUMBER OF SUBAREAS
FIQPEB 60. Variation of computed slope of tributary streams with number of subareas, West River atNewfane, Vt.
steep tributary and principal channel slopes and conversely, as might be expected. There is, however, no systematic variation; moreover, according to geometric analysis by Horton, 11 the ratio between principal channel slope and average land slope is a measure of the horizontal angle that the lateral slope makes relative to the stream slope. A low slope ratio indicates that the laterals tend to enter the. streams at right angles, whereas the angle of inflow into the stream becomes more acute as the channel slope approaches equality with the ground slope. This slope ratio tends to decrease with increase in drainage area, but varies considerably between drainage basins of equal size.
» Horton, R. E., op. cit., p. 360.
140 CONTRIBUTIONS TO HYDROLOGY, 1944-47
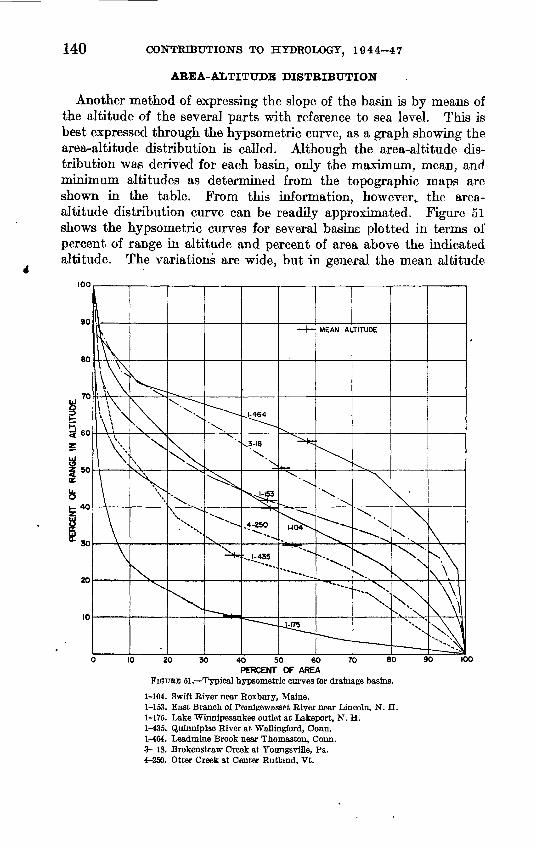
AREA-ALTITUDE DISTRIBUTION
Another method of expressing the slope of the basin is by means of the altitude of the several parts with reference to sea level. This is best expressed through the hypsometric curve, as a graph showing the area-altitude distribution is called. Although the area-altitude dis tribution was derived for each basin, only the maximum, mean, and minimum altitudes as determined from the topographic maps are shown in the table. From this information, however^ the area- altitude distribution curve can be readily approximated. Figure 51 shows the hypsometric curves for several basins plotted in terms of percent of range in altitude and percent of area above the indicated altitude. The variations are wide, but in general the mean altitude
100
20 30 70 8040 50 60 PERCENT OF AREA
FIGTTBB 51. Typical hypsometric curves for drainage basins.
1-104. Swift Biver near Eoxbury, Maine.1-153. East Branch of Pemigewasset Eiver near Lincoln, N. H.1-175. Lake Winnipesaukee outlet at Lakeport, N. H.1-435. Quinnipiac Eiver at Wallingford, Conn.1-464. Leadmine Brook near Thomaston, Conn.3- 18. Brokenstraw Creek at Youngsville, Pa.4-250. Otter Creek at Center Rutland, Vt.
90

CHARACTERISTICS OF DRAINAGE BASINS 141*
of a basin is located at 0.34 of the range between the minimum and maximum; thus a basin is comparable to the surface of a cone.
The area-altitude distribution curve has several applications. For example, snow surveys generally show an increase hi depth of cover and water equivalent with increase in altitude; the area-altitude rela tion provides a means for estimating the mean depth of snow or its water equivalent over a drainage basin. Barrows 12 describes a signifi cant variation in annual precipitation and runoff in the Connecticut River Basin with respect to altitude. The obvious variation in temperature with change in altitude is further indication of the utility of the area-altitude distribution curve.
The mean altitude of the basin above the altitude at the outlet or gaging station represents the potential head of a uniform depth of water over the basin with respect to the outlet or gaging station, and as such is a factor in determining the rate at which the waters are collected and discharged. The data in the summary table shows that, hi general, the land slopes and channel slopes vary with the mean altitude of the basin above the outlet. Thus steep slopes are associ ated with a high altitude above the outlet, and conversely. A rough average relation between slope and mean altitude is as follows:
where Ki=0.31
K2 ranges from 0.97 at 50 square miles to 3.0 at 1,000 square miles.KZ ranges from 3.5 at 50 square miles to 23.4 at 1,000 square miles.<Si=mean land slope, in feet per mile.St= slope of tributary streams, in feet per mile.S9 slope of principal streams, in feet per mile.
AREA OF WATER SURFACES
The effect of storage in retaining flood runoff and prolonging its discharge until the flood^in channels farther downstream^has 'begun to subside tends to reduce flood peaks and increase the time lag be tween rainfall and its consequent runoff. Natural storage in lakes and ponds and artificial storage in reservoirs aids this retardation. A measure of the amount of storage available for such modification of flood discharge can be derived from the surface area of the water bodies shown on the topographic map. (See table.) The computa tions at Boston included the determination of swamp areas, which had been part of an earlier project carried on hi 1936 in cooperation with the Works Progress Administration; this covered compilations for the Merrimac and Connecticut River Basins, both in square miles and
i' Barrows, H. K.( Precipitation and runoff and altitude relations for Connecticut River: Am. Geophys Union Trans., 14th Ann. Meeting, pp. 396-406, 1933.

142 CONTRIBUTIONS TO HYDROLOGY, 1944
in drainage percent.13 The computations made at Pittsburgh did not include swamp areas.
The areas of swamps as reported would be affected by the hydro- logic conditions under which the topographic surveys were made. Surveys made in spring or early summer would probably show a greater swamp area than those made in late summer or fall, and surveys in a wet year would show marked contrast with those made in a dry year. It is not known to what extent the results given in the table were affected by hydrologic conditions.
It should be pointed out that the area of water surfaces is only one measure of their effect on the time distribution of flood discharge. The position of the water bodies in the river system is also important; thus a large pond near the headwaters would affect but a small part of the runoff, whereas one of the same size farther downstream would affect a larger part of the runoff.
In addition to the effect of storage in modifying the shape of flood waves or the time distribution of runoff, the total volume of runoff may be influenced by evaporation from lakes, reservoirs, and swamps. The loss of water by evaporation from water surfaces in the northeast is about twice that from land surfaces, per unit of area. Accordingly, basins with a large proportion of water and swamp surfaces may be expected to yield less runoff than those with a small proportion.
In many of the basins listed in the table the proportion of lake and swamp areas exceeds 10 percent, and in a few, especially in New Eng land, it approaches 20 percent; doubtless the effect on water losses is significant. The percentage of lake area is highest in New England and northern New York and generally in the glaciated portions of the areas studied.
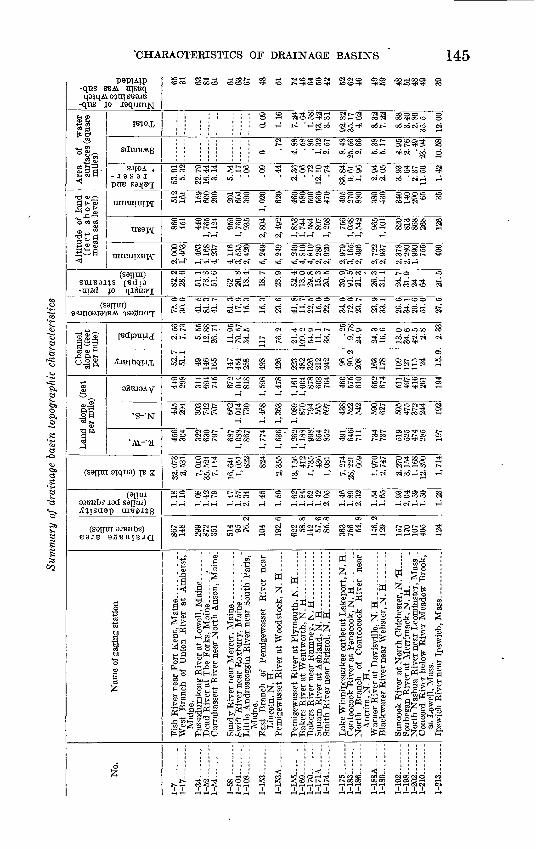
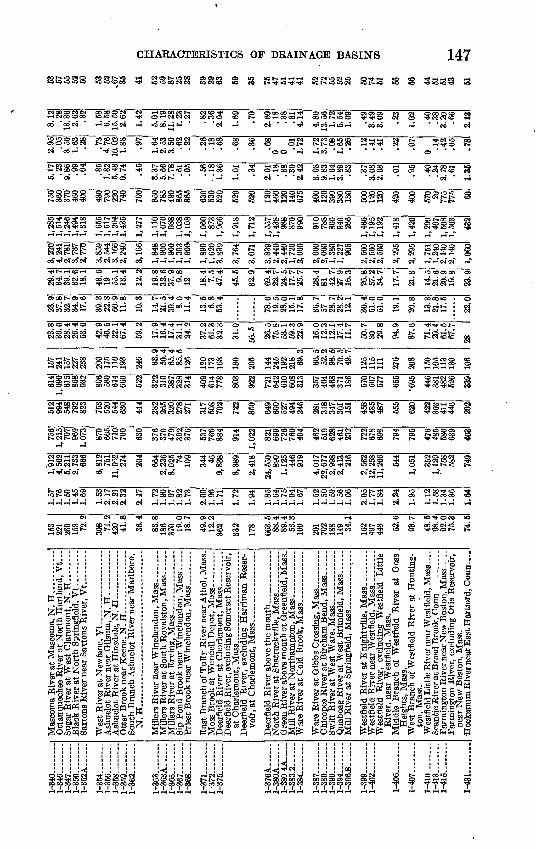
SUMMARY OF RESULTS
The summary table that follows gives the results of measurements on topographic maps on a scale of 1:62,500. It includes about 22,000 areas covering 145,000 square miles. A total of 240,000 miles of stream length was measured, and nearly a million contours on the topographic maps were counted and translated into land and channel slopes.
Reference has already been made to general relationships between the topographic factors listed in the table. Each item is not neces sarily unique, but it may reflect a condition that also influences the others, consequently other relationships between them may be found. For example, figure 52 shows that, in general, larger drainage areas are associated with flatter stream slopes; but average land slopes and
» Grover, N. O., The floods of March 1936, pt. 1: U. S. Geol. Survey Water-Supply Paper 798, pp. 335-338, 1937.

CHARACTERISTICS OP DRAINAGE BASINS 143
mean altitudes of drainage basins above outlets or gaging stations show a tendency to increase with drainage area. The points shown on figure 52 correspond to averages of groups of drainage basins within limited ranges in size. If individual basins were plotted on figure 52, material scattering of points would result, the basins plotting on the left being relatively flatter than those on the right. The average curve therefore provides a means fdr comparing the slopes and alti-
SUOPE OF TRIBUTARY STREAMS <FE£T PER MILE)
SLOPE OF PRINCIPAL STREAMS (FEET PER MILE) \
POINTS SHOWN ARE FORAVERAGES OF GROUPS WITHIN
LIMITED RANGE IN DRAINAGE AREA \
\
MEAN LAND SLOPE (FEET PER MILgl
;IEAN ALTITUDE OF BASIN i >BOVE GAGING STATION/
(FEET) /
2 K> | 100 1000 SLOPES. IN FEET PER MILE AND ALTITUDES, IN FEET
FIGURE 52. Graph showing general variation in stream slopes and altitude in relation to size of drainagebasini
thetudes of basir»s of different size, showing principal channel slope and the slope ratio of the basins analyzed in drainage area.
A principal shortcoming of the c istics may be that it was not practicable distribution of stream and land sloj within every area. Steep slopes on average slope considerably, yet thess flood-peak discharges. Moreover,
divergent trends of the lines average land slope indicate that
tends to decrease with increase
omputations of physical character- to determine in detail the
es and of lake and swamp areas i few tributaries may increase the
slopes may have little effect on course of a river in a given1,he

144 CONTRIBUTIONS TO HYDROLOGY, 1944
length may be characterized either by uniform slope or by a series of pools with intervening rapids or perhaps cataracts. The velocity in a stretch of uniform slope would probably be the greater if other fac tors were constant, as pools have a detention storage effect and the fall at rapids or cataracts imparts but little horizontal velocity to the water. A lake on the headwaters of a stream may have no noticeable effect, whereas a lake of the same size on the main channel near the lower reaches of an otherwise flashy stream may greatly modify flood discharges. Also, steep slopes or abnormally high elevations in the part of a drainage basin upstream from a lake may affect considerably the average land slope and the mean elevation of a basin, but the lake may decrease the flood discharges so much that the outflow from the lake would differ little from that of a basin in which the slopes and elevations were much less.
Storage capacity was not computed, as topographic maps furnish no information'from which channel and lake cross sections at different stages can be determined, except that they might be crudely corre lated with the stream slopes.
^CHARACTERISTICS OF DRAINAGE BASINS 145papjAip
-qns SBM. urstjq qoiqm o;m siare
-qns jo j'aqinnjvj
Area of water surfaces (square
miles)
Altitude of land (feet above mean sea level)
MOJ,
SdOTBM.S
SJtOA .- 1 as'a i PUB sa^Bq;
ramn;nrp\[
TTBaj/V[
rannnxBi^;
(sanm) smears ledjo -nud jo qjgnaT;
(saiim) asanoDja^oM. ;sa3uoT
Channel slope (feet per mile)
<£>11
CD
flm h
t3 ft
1
IBdrama,!
XJB^nquj,
8SBJ8AV
S-N
'M.-K
(sarftn oiqno) re z
^ * (9um, arenbs iad S9[ini)^insnap niBea^s
(saijui aaenbs)B8JB ' aSBniBJO:
Name of gaging station
o ^
lOrH COt-lrH CD CO CD 00 CD
rHCM OS-* * OS CO t^-^ rH
CO to C^' CO CO IO CMrH
C^ rH OSO O t-4 CO to Q OS tO rH rH CO C^
CO IO -*ICOCNao^f "? t^t-4
Q co co co r--§§ SSc^C^TH ^H -^t *tf
WCO t-tCOCO
W* GO* TH* CC t-T 00 CS| US J>. »0
O OS 1C CO !>
!> CO **t< QQ-^
S CO IO OO t-1 J>- iCoOlr--
(N t iO (M CDt-i W
J>- t-i
Cq ,4 os CO iO iO U5 *& TfH CD
O500 -ti^>»O ^ OS t-1 O5 -# ^t" <N CO CO J>-
Tji O5 O TfH O ^ C^ CO !> J>-
iO O W CO O5
CO rH O -!T< Tt*ss ssaCMCM l^tO t-CO CO
CO O 00 CM OS rHt-l O^lt-
rHcor- oo r-tCD CD CD Tfl »O
8 CD rH
O rH
(Mr~0
S t^CO OS Til 1-1 O O Til
>o
rH -t< O O Oooos cq cq(N CD M O CD
g OtO ^ c-5 O CO O OS
OS lr~ OS GO ^f
t-T C-f C<f
CO »O O OS OS r-l CO CM * f rHIO *> IM (M
* CO C-5 IO IO
COTt< t- OS
IN O CO 00 CO' COCSrH rH C-5
CO OS CO CO CO
rH t^ IO to COCD t-4 rH rH W
>o t^OStOlO CM
rHOS-* t- CO rH !>. CO t 1 1>-
t^ * 00 00 CO Tf t£> to OS 03, fl <M * fCM -H CO 00 00t-~ -^ r- i os r~CO OOO to *
CM **< O 00 CO
3SS g 5
rH t-4 CM ^ tO 3 to O1 (N to
O CO 00 CO
tO r-l CM
t-~ t-- ^fn to O sff trt CO -^ to
TtlcO^lOINt-TtlCOlOTtl
**< fOOlNrH (MCO1O-* CO
tC t-1 CO' CO
OO CO CO CM t~00 tO 00 CO to
Til t-4<N
cocoes O-*
ci <N
ooooo cooooco t^ ^ to tO to -^
CO ^ ̂ f 1-^ -30 tO Tf OO O tO CO 1^ O 00 CM
OS O O O O^ ̂ H t-4 00 C5 CM OO CO CM OS
W*I-*CMIM
t< O OO CO to<N' co' os' to otOr-(CMi-IIM
00 t^ tOOO
Y-H f C-l IO CN1 **,-l CMt-IM
* CM OS i-H t^
CM OtOrtCO
CO CM CO CM CM CM OO W t-4 ^t CM fCOC^ C<5
t-4 ^ 00 CO -^t CO O l-~ O CO«-i ococo r-
§ t^« OS CO OS co r^ to co
CO '30 OS tO to CM r-t OS CO 00
tO O) to CC <H *O r-t CO CO OO t-H <* |-~ -^ O
CO I-H t-4
CM ifi C<5 CM IOCO 00 CO -^ O
(MIMCD O5O5 UJCDTtl TtllO
(M t^(M (M(MCOi CD CON
<N to *' oo r-iOS CO
CO COCD 00 t^ **< tOcD CO t-«
OOtOlM 1O1O
ft-4CO * IOoocoos osoco' os' t-i IN IM'CO
os r*- oo GO co
COCO (M tOtHto co -^ co o
OS to CO CM E-^ l~ CO OS C-l CO
CM CO (M C1! (M
OSlO CO » CO t-4
OS r-l t-H CO t-4 COOSIN C<5 CO
OOt~ OSi-H
c^S^ R8tocoCMt^OS COCO
Cft ^ -^ CD C-l CM t-4
C<5
CO O 00 CO 00 Oi Ol O CD 1^
Cq t-4 t-H
O to O W <* CO l~^ t-H tO t^»
COCM CM O t- CO CN ^|1 OS CMTftOtO 1OCO
OS Tfi t-4 CO CO * CO t~ t^ t~
Scico t^^iC^ CN CO OS t^
t-00 ^CM
CO Cft Cq ^ tofooco toco
.00 i-H 00 OS OS *fr( IO T^ 1^ CO
OOOCD O 00-*lOOtO O
odcocsito INCO r-l
"SCDOS-* 00 OS t^-*OS to
-*(N CO 0
TO^II^CD CM OSCOCOIO *CO CMi-H r-l
O O O to to
Q CO OO 00 CD C^ t-4 CO CD CM OOOOOOCM r1
ills 1CM Cq r-l
t^ OS to
* ,4^ f i-iC<JCO C^CD CM
COt-4COCD >O
C^coSS C^
O CDtOCO CO
2SS^ N °*OS
OS t~ to Tt< »O OCMt-l C-5 r-l
t-4 t^ CO t-4 -^* t-H OS t-4 CO OS tO^t<-*l(M r-l
IO tO C-l * <M O t^ l-^ -^ OS "5 -*>COCM r-l
t-4 Cq 1-^ 30 OS tOlO-JICq r-t
Of OOO * t^ IO CO & r-l N r-l t-4 CO t-
CM CO t-4 CM r-l
S3SS &
rtrt rtrt(_ rtMCq rH ^ «r-,r-,r-,CM rH r-4 CM rH rH rH N rH rH
t~ 00 OS <M rHco HH os r^ to00 r-l CM OO CO
Fish River near Fort Kent, Maine.. -. _ _ . West Branch of Union River at Amherst,
Maine.
Passadumkeag River at Lowell, Maine ._....- Dead River at The Forks, Maine..--. - . _ _ . Carrabassett River near North Anson, Maine.
b-i -*C<l-*i
^7 <???
CM CD
* "5 CD' * CM°rH OS f*» O OS IO T-l r-l
Sandy River near Mercer, Maine.- ____ ... Swift River near Roxbury, Maine- ------ _ _ Little Androscoggin River near South Paris,
Maine.
East Branch of Pemigewasset River near
Lincoln, N.H.
Pemigewasset River at Woodstock, N. H__--_
! <]^ CO CO CO00 o o to »o
ill I I
oo coooOl 00 C-l t~ id<M to -^ to 00tO t-4
Pemigewasset River at Plymouth, N. H-_ .... Bakers River at Wentworth, N. H-.- __ ...
Bakers River near Rumnev, N. H_ ----------- Squam River at Ashland, N. H_ _ - __ . ....
Smith River near Bristol, N. H.. ______ -
IO OS O t-H -*1 to CO t*- 1^- i^-
III 1
00 CM
CO CO "*' CC OSCO O to -^ CM
Lake Winnipesaukee outlet at Lakeport, N. H- Contoocook River at Penacook, N. H---_-_--_ North Branch of Contoocook River near
Antrim, N. H.
Warner River at Davisville, N. H... _____ Blackwater River near Webster, N. EL. ___
i <i>OCO CD 00 OSt^ OOOO 00 00
71"? 77
t^ O 1^ to «*< to t-OO <M
Suncook River at North Chichester, N.B _ . Souhegan River at Merrimack, N. H-_------_ North Nashua River near Leominster, Mass- -
Concord River below River Meadow Brook,
at Lowell, Mass.
Ipswich River near Ipswich, Mass- ____ ...
CMOO CMO CO
1 1 1 1 1

Sum
mar
y of
dra
inag
e ba
sin
topo
grap
hic
char
acte
rist
ics
Con
tinu
ed
No.
1-2
13.5
.---
-1-2
16
1-2
18
1-2
20A
. -
1-2
22
1-2
23
1-2
25
1-2
27
l-230
1-2
32
A.
1-2
32
B.
1-2
37A
J
1-24
9A-
1-26
4
1-2
67
1-2
72 _
.1
-275
1-27
9A _
1-2
82 __
_1
-284
1-2
89 . .
..1
-29
4A
.
1-2
95
.5
1
-298 .
1-3
01
_
1-3
29A
.
1-33
2... 1
1
-334
1-3
36
.8A
....
1-3
39
A
-
Nam
e of
gag
ing
stat
ion
Cha
rles
Riv
er a
t C
harle
s R
iver
Vill
age,
Mas
s.
Qui
nsig
amon
d R
iver
at
Nor
th G
raft
on, M
ass.
Will
iman
tic R
iver
nea
r Sou
th C
oven
try,
Con
n.
Shet
ucke
t R
iver
nea
r W
illim
antic
, C
onn _
_ .
Am
mon
oosu
c R
iver
at
Bet
hleh
em J
unct
ion,
N
. H
Mas
com
a R
iver
at W
est C
anaa
n. N
. H...
Drainage area
(square
miles)
23.3
18
3 25
1 35.2
26
0 42.2
31
.3
139.
2 41
7 26.1
27.8
93
.3
199.
8 12
1 40
1 76.2
16
9 93.8
15
7 33
1
711 27
.7
58.7
83
.5
88.6
88.5
39
5 24
1 30.5
80
.5
Stream
density (mile
s per
square mile
)
2.34
1.
27
1.37
1.
27
1.28
1.20
1.
69
1.36
1.
32
1.57
1.14
1.
47
1.51
1.
69
1.62
1.61
1.
63
1.46
1.
57
1.55
1.56
1.
62
1.
61
1.51
1.
67
1.72
1.
53
2.09
1.
99
1.60
S al
(cubic
miles) 97
3,
638
8,12
6 20
2 3,
738
327
164
1,86
1 8,
184
139
117
966
3,41
6 1,
775
6,81
5
707
2,32
0 99
3 2,
362
6,33
2
22, 4
77
141
617
723
738
968
8,57
5 4,
272
172
622
Lan
d sl
ope
(fee
t pe
r m
ile)
$ H 359
270
273
200
129
158
458
414
370
374
293
323
298
471
414
377
424
579
549
478
420
449
355
319
351
1,22
5 1,
034
1,37
8 1,
168
734
i z 257
210
223
159
105
129
308
279
262
248
275
213
228
312
293
303
280
330
319
291
261
274
237
220
271
1,05
6 85
5 1,
236
693
486
Average 30
1 23
6 24
4 17
6 11
6
141
371
337
307
301
283
260
258
378
344
334
341
436
415
369
328
348
285
262
305
1,13
0 93
1 1,
295
890
588
Cha
nnel
sl
ope
(fee
t pe
r m
ile)
Tributary
49.6
22
.6
20.7
35
.3
13.5
24.0
77
.9
58.7
41
.5
101 97
.6
59.0
55
.6
91.4
61
.7
114 79
.9
60.2
56
.1
51.0
42.1
76
.6
70.9
68
.7
64.0
575
274
350
375
234
Principal
12.8
4.
24
3.57
19
.2
3.28
11.6
41
.5
12.5
12
.3
20.0
46.1
21
.6
15.1
25
.1
13.3
20.7
22
.0
8.97
12
.2
13.7
12.1
37
.4
26.2
24
.3
24.9
75.8
35
.9
21.8
11
9.0
39.2
Longest watercourse
(miles)
8.3
38.7
59
.8
11.6
26
.7
15.0
11
.5
26.5
44
.5
9.8
7.6
17.0
27
.7
25.3
32
.6
19.6
26
.5
19.1
28
.3
38.1
65.3
9.
5 17
.8
16.5
16
.4
20.2
50
.7
31.3
10
.1
15.2
ga a« CD
hi
"8 t
o s"3!
3*1
2°~ 9.4
31.9
44
.1
14.6
36
.6
15.3
13
26
.5
48
10.5
11.4
19
.9
39
27.9
49
.6
16.9
33
17
.8
24.7
45
.3
69.5
13
.1
18.3
20
.6
20.1
22.3
52
.4
32.8
11
.8
20.2
Alti
tude
of
land
(f
eet
above
mea
n se
a le
vel)
Maximum 360
580
580
540
420
440
1,40
0 1,
400
1,40
0 76
0
910
805
805
1,28
0 1,
290
1,01
5 1,
290
1,28
0 1,
280
1,28
0
1,28
0 1,
080
940
860
760
6,28
8 6,
288
3,80
0 2,
300
3.22
0
i 124
232
211
213 99 195
746
611
495
496
637
500
392
698
620
605
614
825
779
696
553
744
536
512
406
2,51
2 1,
712
1,80
1 1,
324
1.40
2
Minimum
15
100 20
60
10 70
48
0 27
0 13
0 36
0
360
200 15
25
0 16
0
280
190
540
380
240 80
49
0 22
0 22
0 11
0
1,19
0 46
0 55
0 64
0 84
0
Are
a of
w
ater
su
rfac
es (s
quar
e m
iles)
Lakes
and r e ser -
voirs
0.54
2.
88
3.86
1.
02
13.9
5
.92
1.36
5.
90
12.9
6 1.
50
1.44
3.
02
4.88
1.
82
4.12 .90
1.30
2.
94
3.46
10
.12
16.1
9 1.
18
1.64
.6
1 2.
02 .01
.83
0 0 1.50
Swamps
0.48
3.
54
8.50
.0
4 12
.24
.25
.03
.08
2.29
0 0 1.
50
8.02
.0
6 3.
42 .10
3.22
1.
16
1.23
3.
04
9.28
0 .7
6 3.
16
.42
.07
2.28
.0
8 .1
2 1.
33
H
"8 EH 1.02
6.
42
12.3
6 1.
06
26.1
9
1.17
1.
39
5.98
15
.25
1.50
1.44
4.
52
12.9
0 1.
88
7.54
1.00
4.
52
4.10
4.
69
13.1
6
25.4
7 1.
18
2.40
3.
77
2.44 .08
3.11
.0
8 .1
2 2.
83
Number of
sub- areas into
which
basin was sub divided
C*J
26
O
9 §
28
i-3
65
£S
21
§
21
2
49
3
72
O
30
!2j
CD
34
50
1-3
57
O
51
..
66
W
H51
257
W
48
0
50
£60
8
73
^
28
45
"-*.
44
<=>55
£64
"
60
56
31
50
1 «i
jrt
1-346
1-3
47-.
. .-
1-3
50.
1-3
52
A......
1-35
41-3
56 .
1-3
58 ..
1-3
59
1-3
62
.
1-3
63........
1-36
3A-
1-3
65
..
..1
-367
1-3
68..
1-3
71.
1_?7
9
1-3
75
1-37
6A _
...
1-3
80
A
1-
380.
4A...
.. 1
-38
3.2
....
..1-
384
1-3
87..
1-3
89
1-3
90 .
1-3
94
1-3
96.8
-.
1-3
99
1-4
02
1-4
06
....
....
1-4
07
1-4
10
...
1-4
13
1-4
16
1-4
31
- ..
.-
Otta
uque
chee
Riv
er a
t N
orth
Har
tlan
d, V
t
Sout
h B
ranc
h A
shue
lot
Riv
er n
ear
Mar
lbor
o,N
.H..
. _
...
Dee
rfle
ld R
iver
, exc
ludi
ng S
omer
set R
eser
voir
,
Dee
rfle
ld R
iver
, ex
clud
ing
Har
rim
an R
eser
-
Gre
en R
iver
abo
ve m
outh
at G
reen
fiel
d, M
ass.
M
ill R
iver
at
Nor
tham
pton
, M
ass.
....
....
...
Wes
tfle
ld R
iver
at
Kni
ghtv
ille,
Mas
s... ..
....
Wes
tfle
ld R
iver
nea
r W
estf
leld
, M
ass _
__
..W
estf
leld
Riv
er,
excl
udin
g W
estf
ield
Lit
tle
Riv
er,
near
Wes
tfle
ld,
Mas
s.
Mid
dle
Bra
nch
of W
estf
leld
R
iver
at
Gos
sH
eigh
ts,
Mas
s.
Wes
t B
ranc
h of
Wes
tfle
ld R
iver
at
Hun
ting
-to
n, M
ass.
W
estf
leld
Lit
tle
Riv
er n
ear W
estf
leld
, Mass
-
near
New
Bos
ton,
Mas
s.
Hoe
kanu
m R
iver
nea
r Eas
t Har
tior
d, C
onn.
...
153
221
269
158 72
.2
308 71
.242
0 41.8
36.4
83.8
186
370 19
.018
.7
49.9
12.2
362
332
178
663.
588
.489
.4
53.3
100
201
702
188
149 34
.1
162
497
448 62
.6
93.7
48.5
98.4
92.0
75.3
74.5
1.57
1.76
1.59
1.45
1.69
1.53
2.17
2.21
2.32
2.17
1.72
1.90
1.97
1.82
1.73
2.00
1.96
1.71
1.72
1.94
1.85
1.64
1.75
1.
941.
67
1.52
1.50
1.59
1.56
1.06
2.05
1.77
1.84
2.24
1.95
1.12
1.58
1.34
1.36
1.64
1.91
24,
562
5,21
12,
733
666
6,81
275
111
, 9^2 274
204
664
2,23
68,
025 74 109
344 46
9,83
8
8,38
9
2,41
8
24,5
50 890
1,12
5 44
691
9
4,01
722
, 677
2,99
82,
413
216
2,56
212
,258
11, 2
66 544
1,05
1
352
1,12
9'
758
582
749
756
1,21
570
796
91,
073
879
665
710
700
630
376
370
479
392
376
537
768
884
914
1,02
2
821
699
726
760
4fl
4
402
519
628
461
232
722
678
698
794
795
476
485
580
639
403
512
994
548
792
823
753
520
544
630
444
282
265
320
278
271
317
508
702
722
850
649
600
527
494
246
281
318
ld.7
301
151
458
485
487
555
620
422
303
411
446
292
614
1,09
061
586
893
2
806
580
614
660
522
322
310
387
328
314
409
778
803
922
721
642
610
608
313
357
404
468
371
186
570
567
577
655
695 44
638
148
252
6
339
157
241
157
227
238
200
175
110
193
246 63
.950
.465
.485
.512
6
120
173
168
180
205
144
245
192
218 69
.3
66.5
52.2
98.5
70.5
49.7
125
115
111
276
208
150
105
113
130
106
23.8
30.0
28.4
26.4
53.6
42.9
40.5
22.1
67.4
59.2
17.9
16.4
17.4
31.1
24.2
37.2
61.3
32.3
31.0
56.5
26.5
75.8
53.1
59
.322
.9
16.0
12.3
12.1
17.4
11.7
50.7
30 29.8
94.9
87.6
71.4
20.4
61.5
67.7
28
23.9
37.8
32.7
34.9
17.6
39.3
22.8
60.9
11.8
10.3
14.7
21.5
39.4
8.0
11.4
13.5
6.8
53.4
78.0
19.5
28.0
15
.117
.8
36.7
57 28.7
28.2
12.1
30.4
51.0
51.0
19.1
20.8
13.3
21.8
17.5
22.0
29.4
34.?
39.1
32.6
18.1
43.6
19 55.1
13.4
12.2
19.8
32.6
37.9
9.8
12 18.4 7.5
47.4
45.5
32.9
69.4
22.7
24.5
17
.725
.7
28.4
81 42.7
27.9
16.3
26.8
57.2
54.7
17.7
21.3
14.5
21.6
20.9
19.8
23.9
3,22
04,
241
2,78
13,
737
2,77
0
3,85
92,
544
3,16
62,
240
3,16
6
1,84
81,
900
1,90
01,
303
1,90
0
1,89
01,
620
3,83
9
3,76
4
3,07
1
3,83
92,
440
2,44
0 1,
720
2,00
0
2,00
02,
000
1,38
01,
227
905
2,56
02,
560
2,56
0
2,29
5
2,29
5
1,75
11,
240
2,14
02,
140
1,06
0
1,28
51,
514
1,24
61,
494
1,31
8
1,65
51,
517
1,20
41,
435
1,27
7
1,11
01,
070
988
1,03
81,
108
1,06
087
31,
966
1,91
8
1,71
2
1, 5
571,
438
988
870
990
910
788
800
840
266
1,46
61,
395
1,19
2
1,41
8
1,42
0
1,29
04
fl7
1,50
81,
503
432
750
360
370
460
400
430
790
220
740
700
850
785
490
865
865
630
530
520
520
520
120
460
120
140
675
400
120
390
380
130
500
120
120
420
400
570 20 775
775 60
6.17 .23
9.86 .9
9.0
4
.85
1.82
5.48
0.74 .45
3.37
5.66
7.78 .61
.05
.56
.18
1.36
1.01 .34
2.01 .18
.38
.30
2.42
3.08
9.83
1.64
3.89 .83
.37
3. O
S2.
68
.01
.95
.40
.24
2.78 .61
1.35
2.95 .05
3.50
1.63 .28
.73
4.76
10.0
21.
88 .97
1.64
2.53
3.50 .62
.22
.26
.18
.68
.68
.36
.68
0 0 .01
1.72
1.72
3.73 .08
1.65 .26
.12
.41
.41
.22
.07
0 .14
.42
.05
.78
8.12 .28
13.3
62.
62 .32
1.58
6.58
15.5
02.
62
1.42
5.01
8.19
11.2
81.
23 .27
.82
.36
2.04
1.69 .70
2.69 .18
.38
.31
4.14
4.80
13.5
61.
725.
541.
09 .49
3.49
3.09
.23
1.02 .40
.38
3.20 .66
2.13
53 67 55 52 50 53 52 ,67 35 41 52 59 87 25 28 39 29 63 35 76 47 51 41 41 52 72 55 52 25 60 74 51 66 56 44 51 51 43 51
I i B B * 00
Sum
mar
y of
dra
inag
e ba
sin
topo
grap
hic
char
acte
rist
ics
Con
tinu
ed
No.
1-4
32
1-4
35
1-4
38
1-4
44 . .
1-4
46
1-4
60 .
1-4
53
1-45
5.
1-4
58
1-4
59 -
1-4
62 .
1-4
63
1-4
64 .
1-4
66
1-4
71
1-4
76
1-4
82
1-4
85
1-4
88
.
1-4
92
1-4
96
1-4
99
1-5
01
1-5
06
1-5
08
_
1-5
10
Nam
e of
gag
ing
stat
ion
Hou
sato
nic
Riv
er
near
G
reat
B
arri
ngto
n,M
ass.
Nau
gatu
ck R
iver
nea
r T
hom
asto
n, C
onn.....
Nau
gatu
ck R
iver
nea
r N
auga
tuck
, C
onn.
. ..
.
Hud
son
Riv
er n
ear
New
com
b, N
. Y
__ ......
Hud
son
Riv
er a
t H
adle
y, N
. Y
.. ...
....
....
..C
edar
Riv
er b
elow
Cha
in L
akes
nea
r In
dian
L
ake,
N. Y
.... ..
... ..
..Sc
hroo
n R
iver
at
Riv
erba
nk,
N.
Y ..
..........
Eas
t B
ranc
h of
Sac
anda
ga R
iver
at
Gri
ffin
, N
. Y
..
....
.. ..
. ... ..
. ..... ..
.. ..
. ...
Bat
ten
Kill
at
Arl
ingt
on,
Vt.
_
_ _
_ .
Kay
ader
osse
ras
Cre
ek
near
W
est
Mil
ton,
N
. Y
-- ..
.. ..
....
.. ..
. *...... ..
.. ..
..
Hoo
sic
Riv
er,
excl
udin
g H
oosi
c L
ake,
at
Nor
th
Bra
nch
of
Hoo
sic
Riv
er
at
Nor
th
Wal
loom
sac
Riv
er n
ear N
orth
Ben
nins
ton.
Vt.
Drainage area
(square
miles)
104.
7 10
9 57.1
28
0
632
1, 5
45
204 68
.5
133 75
.3
71.9
24
5.8
24.0
77
.5
192
1,66
4
160
527
491
114
152 90
46
.2
31.4
51
0 39.1
11
1
Stream
density (mil
es per
square mil
e)
1.62
1.
66
1.91
1.
52
1.35
1.57
1.
34
1.81
1.
98
2.29
2.21
2.
05
2.15
1.
84
2.21
1.68
1.77
1.
58
1.60
1.37
1.51
1.68
1.
77
1.79
1.
68
1.92
1.
74
S
al
(cubic
miles) 82
1 1,
323
405
6,84
1
21,0
92
81, 1
38
3,49
7 82
0 2,
431
710
822
4,48
3 12
1 71
0 2.
282
89, 9
31
2,50
3 13
,054
9,
640
1,25
8
1,55
2
894
268
142
11, 0
36 210
1.05
7
Lan
d sl
ope
(fee
t pe
r m
ile)
H 433
452
567
607
621
666
736
593
574
624
644
598
552
614
1,14
8
973
684
1,10
0 1,
022
1,27
5
1,12
0
494
842
844
1,04
7
1,00
5 95
0
CQ 1 fc
286
274
486
513
487
477
480
407
388
366
475
399
334
368
1,01
0
882
883
998
961
1,07
4
827
390
144
533
795
719
653
Average 34
9 35
1 52
1 55
3
543
557
537
487
465
474
546
483
424
474
1,09
1
920
800
1,04
0 98
7
1,15
7
953
432
669
900
841
777
Cha
nnel
sl
ope
(fee
t pe
r m
ile)
£ 74.6
91
.2
165
135
79.8
54.2
11
385
.2
88
153
175
103
147 92
.6
250
127
159
118
124
183
314
163
3Q7
414
181
479
271
Principal
40.2
9.
42
78.6
13
.1 8.45
10
17.1
17
.1
31.4
33
.4
41
17.5
72
.3
32.2
13
.0
12.3
7
32.6
1 16
.54
35.7
42.5
52.7
24.3
67
7
113 17
.7
146 80
.2
& 8 OJ s \
-J
J W |t S' a o i-l 17.5
23
.2
12.2
43
.0
63.7
111.
2 33
.0
19.4
34
.7
17.1
21.8
40
.4
10.1
19
.7
24.4
93.7
35.0
47
.3
35.9
22.3
22.2
19.9
11
1
46.0
9.5
18.3
II
"S
!0 21
.4
22.3
14
.5
36.7
55.6
99.3
31
.6
17.6
33
.1
19.5
21.1
31
.4
11
26.4
37
.1
111.
7
36.3
44
.5
53.9
23.1
23.3
21.8
14
9
11.5
53.3
12.2
21
.2
Alt
itud
e of
lan
d (f
eet
above
mea
n se
a le
vel)
Maximum 920
1,00
0 2,
300
2,66
0
2,66
0
2,66
0 1,
787
1,
070
1,68
0 1,
140
1,70
0 1,
700
1,20
0 1,
060
5,34
4
5,34
4
3,86
5 4,
842
3,59
5
3,59
5
3, 8
16
2,02
0
3,30
0 3,
764
3,14
3 3.
764
OJ 50
0 30
0 1,
678
1,43
2
1,26
4
981
819
568
1,02
9 68
5
1,01
6 80
1 87
0 45
9 2,
193
1,84
8
2, 2
31
1,45
01,
888
1,89
6
1,70
0
778
1,65
0 1,
269
1,83
5 1.
649
Minimum 90
40
1,
030
720
555 40
320
210
300
310
410
160
420 30
1,55
0
560
1,54
4 70
0 90
5
1,24
8
620
374
790
790
370
870
530
Are
a of
w
ater
su
rfac
es (
squa
re
mile
s)
Lakes
and r e s e r -
voirs
0.91
1.
00
.60
4.74
9.24
16.8
7 1.
51
.96
2.26
.3
7
.19
1.69
.1
0 .1
4 5.
85
40.9
7
3.84
18
.55
13.8
4
.63
.20
.10
.74
0 1.27 .08
.29
a to 0 .03
.10
.36
1.72
9.42
2.
26
1 02
0.
62
.48
0 .12
0 1.10
1.27
0 0 0 .16
3 o e 0.91
1.
03
.70
5.10
10.9
6
26.2
9 3.
77
1.98
2.88
.8
5
.19
1.81
.1
0 1.
24
1.47 .74
0 .08
.45
Number of
sub- areas into
which
basm was sub divide
d
8
51
0
48
o
52
y
72
369
3
W
51 d
75
1-3
50
g
50
202
§
52
LJ
74
§
33
53
hj49
323
4 §
45
2
63
O
105
O
53
49
£
.49
tf»
39 27
51 40
44

CHARACTERISTICS OF DRAINAGE BASINS 149cocoi-t i-irHi-nocft cftoooa cftr- S"-* *O*Q CO OO> »O
5 CO <N 10 10 F- rH CO
i j Ii ! i
oco«or-l
M t~-
coScft
co'ofcfCO CO r-l
2jodgj
OOrlTf
§S5I
^00 00
T-(>0<N
t-
CO »O U5It- Cft O
-*COCft
Cft CD r-l
3SgOU5CO CO t-» »O CD ^ I^»
CO
1*O »O CD O3 t~<N
j j 1! ! t
Sio^oor-l CO r-l
C£> CO rH i-t
kO CO OS CO O OOCOOl^** OO OOOO <N Tj*
cor- t~<N
oa o. Cft co co
S§g5SSTt«00<Nt>-rH
ggs^s
CO rH r-H
g CM JJ 0^ r-H
GO CO *O -^* CO
O ^ CO OS (G
"S555t- 00» OU5Tj* CO C35 CO CO
j I
i IOCftS
coco
OO O O
SSco
CftCD<N T-HOCT
t*. CD CD
r- Cft IN
r-l CO N
CftCftO
r-KOCO
00 r-l Cft
r-l CO OS
CO"* 00
lii
U5COOO
CD OS CN CD O CO (MCOCO
CD O **< CO OtO
Cft COO
ii
c5S(N
1OOO CO IO c5lN
-g§r-l i-l
28
CO Cft
rHCO
Cft CO
^^00
rH rH
s§11oo00 <O IO OO
r-T
,OCD
\sico'
iSoo»o oca ^ *N t-<N
OCft<N<N00 <N r-l 00
Iggg
oocoo-W r-l Tj*C4
* *
SSSS5
^o^t-"5 od 06 coCOrHrHc5
OWOSCOIO O>O> r-* rH rH r-H CO
0>
rH CO rH lQ
CD <N CO »O
CO ""*< ^O JT-*Oi iO O O> »OrHCO^*
§§§§
CN OCO OO Cft CD'* 00
CDIMOIO
00
§SIO
§t~-<NCO
rH
C?
CO
Cft
I3
CO
c«
00o
CD
i i °jo !
10 i 0
Cft 00 O >OOOCOCO(M
00 0
sags s gasss
t~- W OO GO r^- CO»OCOCOrH
CMOOCOC^ CO OTfCOCDO> C^CDcQrH rH" C^lO^O'OCO
r-H r-j rH rH
(NOOOSCD CO CDCOCD^OO
S^-^S S5 tJScS^^rHrH
SS2CO CO
t-Cft C
00 Cftt-» »oCO<N
§100 >0 COIN
cncn * * ooc
IOCDC;
CO CM CO
Mohawk River near Little Falls, N. Y_. _...._East Canada1 Creek at Dolgeville, N. Y. ... Kmderhook Creek at Rossman, N. Y __ ....
up Sup
00 CO** r-1 <NOS OO ^< r-l OO
COrHt-i-1
Catskill Creek at Oak Hill, N. Y_. ........... Rondout Creek at Rosendale, N. Y.... .. Wallkill River near Unionville, N. Y.. __ .. . Wallkill River at Gardiner, N.Y___ __ .---.. Wappinger Creek near Wappinger Falls, N. Y.
IO »O *O *O IO
IO IO CO
Passaic River near Millington, N. J . ... Passaic River at Paterson, N. J..... .. ... Rockaway River above Reservoir at Boonton,
j |IO t-<N«t- oooc
rH
N.J.
Whippany River at Morristown, N. J _ ... Ramapo River near Mahwah, N. J. .......
si
CD Cft CO
r-l S
Ramapo River at Pompton Lakes, N. J _ .... Saddle River at Lodi, N. J..... ...... ......... Rahway River at Rahway, N. J_ -.----....... South Branch Raritan River near High Bridge,
N.J.
South Branch of Raritan River at Stanton,
N.J.
ljj= 2
i*J
I*- CO CO "O *' * 1 1 C* <N
t~- coco *
3 s gSgSS
- § i§§£3
IQ ^* ^ rH rH CO <N
^ CO Tft rH (N "O O
^* "^* "^i rH rH CO <N
CO 1-4 OpOOOOOJO
t>. o oocoe^ao.-<CO O OS *O £- O "3*
CM . i 1 1 CO i I I i
1 1 1 1 1 1 CO i i i i
i-4 OS O OOt-0 r-» N rH 0
<N CO 0000 O*.-* rH,-*
(N CO -^* "f CO r-H OCO CD Oi
oSSSoCO CO O3 rH W
rHOSt'-CQCO
SS28S
COCOt'-rHCD
C*q rH *sf I>- l>-
W OS 00 t-t-
OO CO OO *O CO
rHCDW CO
£2332
i 1 i 1
^* CO O ̂ r-H rH CO t* IO t-
CO C-l ""*< t> CD
OO (N OS CD Oos <N co oa o
3OS
si-ICO O 00 O"O CO O
ON CO CO
83SI |
Slel |OS t** CO O O
co" «"t~--*rH *sa'-B g
r-cncoco Cft
SS^co fe
O^IMM CO
CO >O !> CO t^rH
W O T-H CO O
W5 U5 COOS l^-
CO *£ ^H iM O IO »O CO OO » 1
S ^H OS T^ O CD >O ^ O
<N 00
"^ {°| ^
§3S§§ fe
(N 00 l>*0
CO O (N rHOOOiod CS OS CO t-- »O "3*
i-4 rH <N
Raritan River at Manville, N. J.. .. . Neshanic River at Reaville, N. J....... _ . ... Walnut Brook near Flemington, N. J.---..--.
North Branch of Raritan River near Far
Hills, N. J.
North Branch of Raritan River at Milltown,
N.J.
Black River near Pottersville, N. J __ ..... Millstone River near Kingston, N. J.._.. ..... Millstone River at Blackwells Mills, N. J .....
Green Brook at Plainfleld, N. J ____ _ .
Swimming River near Red Bank, N. J _ .....
1 10 ' f?
*5«*.
Manasquan River at Squankum. N. J..... ... Toms River near Toms River, N. J ___ . ... Cedar Creek at Lanoka Harbor, N. J... ...
Batsto River at Batsto, N. J. _ ......
East Branch of Wading River at Harrisville,
N.J.
M
CO CO
<o co <M' co <£> lO-HdoO J;
i-l t* Oco~
Great Egg River at Folsom, N. J. . ......... Maurice River at Norma, N. J...._ ........... Manantico Creek near Millville, N. J . ..... East Branch of Delaware River at Fishs
Eddy, N. Y.
Delaware River at Port Jervis, N. Y.....
JWf

150 CONTRIBUTIONS TO HYDROLOGY, " 19 4 4
papiAtp -qns SBM tnsBq
-qns jo
,-< i-lb-lOfOrH 1-lC IO iQ^f*4Q4Q^ »O "
w q
rea surfa mile
sduTBMg
SJTOA - J 8 S '9 J PUB
>O O3 CM OO *O *Q O *O QO i-H -^ »O O *Q CO i I ^tl CO Is* C4OSOCO«3»O h-t-«t>.OO CMOCO h- O OO t-«i-*O
cio "ci * " '^jiio * - - 0 " 00
8
O
ltitude of land (feet above mean sea level)
to O -*«O"MO
UB9J1I
a? a? e«fICOi-HOi-H C^i-<COCOOi COOC1 OO C*i-H»O«Or-<
-tnjd jo « j-t kO TH
cqcococob- «ot-»cor-»^ coco oa eo--ico^*a
(S9HTII)<iO»ocOOi lOtO-^H COO
Channel slope (fee per mile) IBdtomjj o«-HOr4c5 t^iowccM ^icocd coco ^c
co c*5 oTHr-l S
to co cor-ioi tO tO CO O5
9SGJ9AV
S-'N M^ IO N «-l CO C 5C1»OCS| r-)(N
>COCDTH OiNt-» QCO t-»COOiOOCO C-1O^
(sanra oiqno) IB sIM IN * O5 C tO 00 1 Or
(9I11IIwsnbs J9d sanin)
S O CO t-»«O CO-^-^ Oi C 3& t-« O CO O r-» TH r-U
KCMC^i-l CS|r-(CO
(S9[I1H 9-lBnbS) B9JB '
CSl to -^ to f-HCNI to to w co OCOCSIOOOS COf11-1
j ̂ _^
. CO CO r- C
toco nic4-"°
Delh Edd
J. a
includ excludi
at Riegelsville, N. Delaware River elaware River at er at Hawley, Pa. k Reservoir) .
er at Hawley, Pa. Reservoir).
at f D ive ckDelaware River West Branch o
N. Y.
West Branch of
N. Y.
Lackawaxen Ri Wallenpaupac Lackawaxen Ri WallenpaupacNeversinfc Riv Flat Brook nea McMichaels C Paulins Kill at
Pequest River
Pequest River at Pequest, N. Beaver Brook near Belvidere, Lehigh River at Tannery, Pa. Lehigh River at Bethlehem, P Tohickon Creek near Pipersvil
^ SP*' ' ^H SM«««
?|l!l ll?°i
3-*-j-*-»Mn p~^ M rl Bi""i 8wSo 0^^ ^ISP'^'o^iSI -sa S^oSo
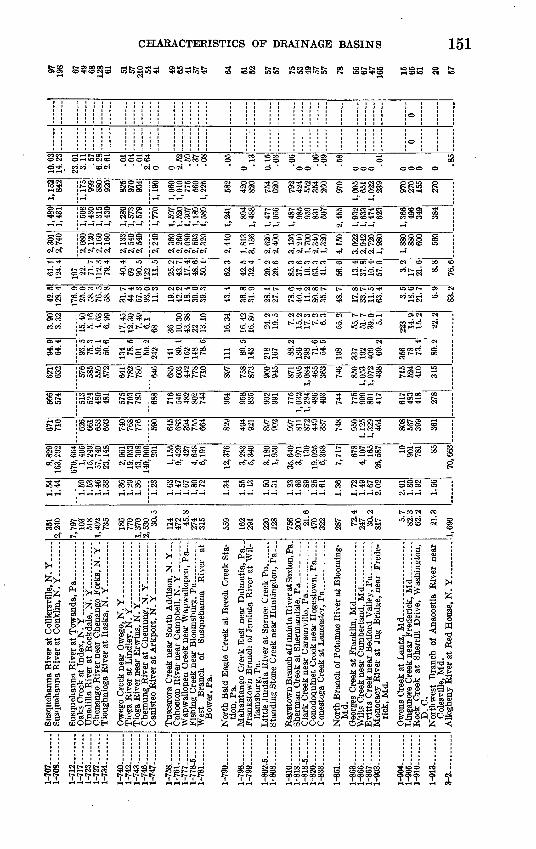
CHARACTERISTICS OF DRAINAGE BASINS 151OOOOOrH ,-11-O TH TH
! i .' I ! i III
! ! ! ! ! ! ! ! i
SS5STH
OiHlOCNCD
coco «>c4
SI
IS1H O
MTf
ScM
^
t*.CS
a
g <M CO
CCCO
O.TH
ctS
§§IS
6fiO»N«OS
sCO
ST?
IO TH CO CM
CM"
Susquehanna River at Colliersville, N. Y .....
Susquehanna River at Conklin, N. Y ____
JJ
TH TH TH TloooccCN
S1SI 811OOOIOO
1C THCOT?
Occ C3>
CT U31O
OO CM CO CD
t-CCTH
CM FH oics!
O C>7 »O OO
O 00 CO 00CM ic r~ ic
ICICTHCO
1C CO TH CD
CO 1C OS OS
CO >O OS CM
IO IO O IO
CC TH OS TH TH<N 00 00 lOlOTH TH
CM CO 1C OS
§ OS O OO -f THTH
TH CM t TH
TH lO't-^COr-i IC<M
OS CO CD CO >O>OTHCO
CO O O
CM"CM"CM"
ill! ! ! 1 O
!!i! i ! ! o
O
g
g
| CT
TH >O >O
OosO WTHTh CD OS CM TH
t^THCOOCO
cSSioSiS
lOOOi THCO TH TH
IO IM
TH 00 TH O' CM COt-O>OT|; iH TH CM
TH CM O CD SOOOO Tl<
t^ t^ CO
1C CO CO OPt^. os oo orIO !>. t*» CD
O OO CO OTHcor- 3s
TH CO OO O i-( SCOO5CO
OCOOCM
CM os cogiH TH TH
888
1s CO OO CM IOOS O T-H OS COIs T 1 1C TP 1>»
Susquehanna River at Towanda, Pa ........ Oaks Creek at Index, N. Y _ . - . _ ... Unadilla River at Rockdale, N. Y... _ -- .
Chenango River near Chenango Forks, N. Y .
Tioughnioga River at Itaska, N. Y..- ____
Wi
CDOOC
TH'CM
§3
1C
Owego Creek near Owego, N. Y... ...........
Tioga River at Lindley, N. Y ________ .
Tioga River near Erwins, N. Y__ .............. Chemung River at Chemung, N. Y ...........
Canisteo River at Arkport, N. Y .......
O CM CO CD J-^ THTHTjTpTH
SgfooOCM
O O t^. »O CM
OS « O 00 00 >OlCCOiHlO
CO CM O »O CO
CM* C>f W of CM
CN f TH CO i '
1C CO t^ OO O IM,H THTH S
CM CM-* CO CO
OS « OO O OSTH THTH CO CO
O OO O
TH >O
T OCMOOOO TH OO 1C TH t^
IOCOIM OOO
TH 06 O5 1C CD CD CO CO t- CD
1C OS t 00 TH
THOS THCD
STH&SS
00
HTH"*CMCO
Tuscarora Creek near South Addison, N. Y ... Cohocton River near Campbell, N. Y _ . .... Wapwallopen Creek near Wapwallopen, Pa ... Fishing Creek near Bloomshurg, Pa .......... West Branch of Susquehanna River at
Bower, Pa.
J J IQ j STHt-00 TH
co J-- r go
>O CO IOCOO TH TH O
0 0 '
OO CM CM 1C CM »O TH OO t^-CD
TH Th 00 t CO
TH OO ST?
CM" 1-1 co CM CM"CO >O TH CM CO
g 98 SSTH OOO5 THt~
3 %$ %&
^f WO CM »OCO ** OO . .
CD CC CO* « i l
i-H OS* CO OO t*- T-I OO Th i I CO
1 g£ IITH QOlO CN i-.
OO Th OS 00 OS
il ii Hic-f co-io" «oi-f
CO 1C i-H »S CO
OS CM i-H O OO 1C CD OS CN CM »O » « CN (N TH
North Bald Eagle Creek at Beech Creek Sta
tion, Pa.
Mahantango Creek East near Dalmatia, Pa.. Frankstown Branch of Juniata River at Wil-
liamsburg, Pa.
Little Juniata River at Spruce Creek Pa.. ..... Standing Stone Creek near Huntingdon, Pa _
f jji
o SoOO
CMTH CNTHQ
t »O Cft iH t-00 00 >O COOTH os osooio
IH CM r co coCOCNTHCMTH
CO CO CO CO COic r o co THOOCOTHCOTH
COTHCMOOt^-OOOiHO>O
CM CM CO C-J CO
CM CDIO
OO CO O5 t 1C
t~ O5 00 CO CO 00 OOO * CO
>O CM-* CO CO r CO OO OO O t-OlM TH TH
r F-H CM os r g i i r~ TH co
00 00 * CO
S TH O »O OO t CO <M CO
CO OS TH O CO
IOCO" Of CD*
cmcooi'OTHCN CO 00 CM CD
CO CD O .H O CM
Raystown Branch ef Juniata River at Saxton, Pa.
Sherman Creek at Shermandale, Pa
Clark Creek near Carsonville, Pa.. _ .... - Conodoquinet Creek near Hogestown, Pa _ ..
Conestoga Creek at Lancaster, Pa __ _ ___
O OO OO O CO 00 00 00 op Op
o
gTH
sTH
CO
st~00 TH
CM>O>o
2
g
ss18
1
North Branch of Potomac River at Blooming-
Md.
,
0 OOO
1OTHCMO583 S3
O> CDTH CD
CMNOO CM-* CM 00
CO CM CM iH
THOOTHO5cot-ot-iHCOTHiO
OOt^-lOTH
t~ CO TH CO rHCOTHCD
B' iH OS IO "OCO
CM
Hll §
O CO (N OO25 iQ r*- CO QQOOTh
1C OS T-H 1s
t OS OO TH
l§ IH
CDTHlHlO^ g"CM OS t- CMt^-THCOO
TH CM
^S
Georges Creek at Franklin, Md ________
Wills Creek near Cumberland, Md ............Evitts Creek near Bedford Valley, Pa.. . Monocacy River at Jug Bridge, near Frede
rick, Md.
MJj
OOO
0010 t» f 1C C3JCMTH
CD CD C3> COOJTH COTHCO
III
CM CD
lOCDt-
ro 2S
&*TH
S OOCO t*. >^*CO
ss§t^-coooTHOOTH CDTHTH
§ COOS >oco
2gg
SSS1
t^-COCM
00 CD
Owens Creek at Lantz, Md __ ...... ........
Linganore Creek near Frederick, Md ... . Rock Creek at Sherrill Drive, Washington,
D. C.
Mi
o
g
X
§00 CD 00 C£
O CMCO g
CM
CM
sIO
ftX
>o w
g
2CO
s §
Northwest Branch of Anacostia River near
Colesville, Md.
Allegheny River at Red House, N. Y _____
? s

152 CONTRIBUTIONS TO HYDROLOGY, 1944
Summary of drainage basin topographic characteristics Continued
pgpiAip -qns se.« mseq
-qns jo j'gqnm^j
Area of water surfaces (square
miles)
Altitude of land (feet above mean sea level)
mox
«*»*SJIOA
- I 9 S '9 J
iutiiu;mp\[
nE9j\[
tannrixBj\[
(sgrtm)
-mud jo qjSaaq;
(sgrjcn)
Channel slope (feet per mile)
1
*&13 ft
IBdTOUIlJ
ilJBjnqiJJL
eJto.y
S-N
M-a
(sgrtrn oiqno) re z
9-renbs jgd sgrini)
(S9[ira arenfcs)
Name of gaging station
*
ggS5S
Sc
1>^t oc
§c<
CN
6 1 1^
Ss
ftrg
O rH GO CO OS O CO OS CO OS OO to ' tfl 1^- to
CM 10 CO CO O OS CO to CO f~ "* 5 CM rH "*
t-HiO 10 CO CO IO ^t*^* OO rH
IOO5
i c^^ Tji
\
SSS
OS CM O
IO OS 1C
IO CO CO
K§S KCM Ot-H
iisliO OS to CM t--
tO rH OS OOr^H
c^ o o
<»OO(MOO 1^- to (MI^- (M 4s- Ol OS Ol Ol
OS CO t- to <M tO to ^ OS (M
CM
to T-H CO 0 CMO
O O
co" I-H"CM""
o i~- co H* oCM CO T-H CM 0
^ to co oo t>-Or^C?00
o
to 00 (MC O
os oo i~- oo os
Siils
00
CM
CM CO CM OOt-H OS O CM
I-H O
10 OCM CMO
OO OS OS OS OO
* 10 CM O OO 1C 10 CO CM t--CMOl-Ht-HOS
8 o
CMOto 35
isCMC5O
OS T-H OO
Tj< 00
to 10 coTJ<COCO
OS iO OS
CO CM CO
CMOOCO
I-H-£> CO
00 CO
S'T-H CO OCO
- S "
^MrH Tfl !>. CO
to ,D CO
O CM-* O O CO «O OO
OlOCOrH
I00 rH CD CO cD ^
oo i-- o co CMOS CO CO CM CO
Allegheny River at Franklin, Pa __ _ -------
Allegheny River at Parkers Landing, Pa.. ...- Brokenstraw Creek at Youngs ville, Pa_.. ..... Tionesta Creek at Lvnch, Pa___ _ ---------- French Creek at Saegerstown, Pa__ . ......
OOOOTt!
ooooos00 CM CM t~ OS
CO T-H OS CM
OO to CO CO CM
OSr-HOOCM-*
10 CM f t-- O OS CM -^ CM to
cCtOt-tM^H
CO .0^.00 OS
CD W CO OO
CO OS 00 CD rH
o O i>- CD r-CO l> Is- l>- to
f iO O (M (MTri CO "O C1) C^ CO CD t>- OS O
O OCO O OO
Oo'rHOO'cM O"
CO QO O rH to T^H I-- OS CO CD
O rH CO rH t>-
French Creek at Utica, Pa._ --_.--_ _ .___ Mahoning Creek at Punxsutawney, Pa_ ______ Mahoning Creek near Dayton, Pa_- __ __ _ Crooked Creek at Idaho, Pa__- ___-------__.__
Conemaugh River at Seward, Pa_ ----------
'to to kO
(MCOcScO^
to t^ CD to ootnKM iO to <M (M ^o CO rH to
co o (M r- 10CD OS CD CO CD O CO CO rH CD
M ^I-OS
^(MrH
CD OO h-
O (M ^ C^ to OO rH Ol O ""-D to CO !>. Cl (M
SSBfcS
^ OS Xh rH QOgss^so o to o oT-H CM CO CO OS
T-H 00 10 rH W
to o -^ o t--i-- 1~- CO OO O
to O IO O "^ CM OS CO ^ OO 00 CO CM CO CO
Kiskiminetas River at Vandergrift, Pa ...... Blacklick Creek at Blacklick, Pa ---------- Loyalhanna Creek at New Alexandria, Pa,- Tygart River at Fetterman, W. Va._- _ __ . West Fork River at Clarksburg, W. Va-.___-
wi
OS CO CO CMO
"0 HH 10 00 CM
ScMO-* 01
t~ OO CM CO IO
CO OS O? O OO
CO CO CO to
"SSSfS
SSSoSoS
r~ o t^j co co1--CNO100O
o c: to r~ toOS O OS CM OS CM IO CO IO *$<
CO ^ T-H OO *£
CM 33 O S O»C t~ ^ CO t-H
CM CO
OS T-H T-H CHt--CM T-H r- co O
CM to
S CO CO CM -^ oo CM 00 CM
t-- CO CO
West Fork River at Enterprise, W. Va __ - Blackwater River at Davis, W. Va _ . -- _ Youghiogheny River at Connellsville, Pa.- ... Casselman River at Markleton, Pa ___ . _ . Big Piney Run near Salisbury, Pa.-- __ ...--
^TTtCO CO OS CO CO
0 OOO O OOCC-^1 t^OO
OO Cl T-H OO -^
O t-H to OS CO CO OS-* CO CM
* CM T-H 00 OS
O CM T-H OO O CO OO T-H to CM
CO ^H-* So 10
CO CO* CO CM O rH
(MOOCM OS
OO CO CX) t-- OS* CM CM CO -* OO
CM rHCXlScM
SSggg
OO T-H O t^ CMOO -^ CO O O
CO CO CO OO t-H CO CM T-H
0» CO OO CO CM
t^OS to OO -^ TJ<OS CO OOO CM OO CM to rHCM"
Mahoning River near Berlin Center, Ohio..-. Mahoning River at Youngstown, Ohio _ _ _
Beaver River at Wampum, Pa _______ _
Shenango River at Sharpsville, Pa. __._ _____ Little Shenango River near GreenvDle, Pa....
r-LloL
CO CO CO CO CO
§ 0000 CO "^ CO t-H
tO CM OO ^ to
S CM OS 00 CM CO CM CM
CO 00 CM CO 00
CM IO CO tO t-H
CM CO
I-HCOCO >a
****$
CONOCO (M TJ4 rH OO CO (M ^ c^ to c1^ os
CO CD OS CO Tt< rH OS (MCOOS
00 CM rH CO OS ^ (M CO (M O
llia^O CM CO CM rH
S CO CO CO t~ 10 T-HOCO
Slippery Rock Creek at Wurtemburg, Pa. .... Tuscarawas River at Clinton, Ohio.-. ........ Sandy Creek at Waynesburg, Ohio. . ____
Nimishillen Creek at North Industry, Ohio. _ - Home Creek near New Philadelphia, Ohio _
.oU 'rH-
CO CO CO CO CO
ooCO *
asOS 00
ooCM»O
rH^
t~t~
IOCO
t-H IO
O OS
OCMOOCM t-H CO
li-a
KS3i-H rH
ss
Jerome Fork at Jeromeville, Ohio-- .. __ . _ Kokosing River near Millwood, Ohio.- .......
88coco

3-161
3-1
63
3-1
66
3-1
67
3-1
69
..
3-1
70-
3-17
5
3-17
6
3_OA
Q
3-20
5
3
-206
3-2
08
3-21
1
3-2
13
3-2
16
3-2
17
3-2
20
3-2
22
3-2
24
3-2
27
3-2
30
3-2
32
3-23
3
3-2
35
.3
3-2
35.7
..
3-2
36
3-23
8.5-
3-2
38
.5A
3-24
3
3
-250
.5
3-2
52
3-25
3 _
3
-254.5
3-2
55
3-2
56
3-2
57
3-2
58
3-2
61
3-2
61
.5
3-2
62
3-2
67
3-2
69
_
.
3-2
78
Kill
buck
Cre
ek a
t K
illbu
ck,
Ohi
o....
...
Will
iam
s E
iver
at
Dye
r, W
. V
a... ..
_____
Elk
Riv
er a
t C
entr
alia
, W
. Va
Lit
tle
Coa
l Riv
er a
t M
adis
on,
W. V
a
Big
Wal
nut
Cre
ek a
t R
ees,
Ohio
- - _
____
Dee
r C
reek
at
Will
iam
spor
t, O
hio
. _
_ --
---
Lit
tle
Mia
mi
Riv
er a
t M
ilfor
d, O
hio.
_ ..
... .
Ohi
o.
Mia
mi
Riv
er a
t Si
dney
, O
hio.
....
....
....
....
466 27
.514
0
672
386
913
460
438
540
1,35
723
61,
315
128
150
287
281
1,14
5
393
267
587
762
1,22
6
389
1,22
52,
150
198
209
255 73
.338
743
819
5
544
IQft
533
331
808
286 76
.51,
195
477
545
1.87
2.22
2.26
1.98
2.26
2.40
2.09
2.29
2.03
2.14
1.42
1.46
1.56
1.40
1.40
1.26
1.56
1.80
1.87
2.12
1.59
2.10
2.12
2.09
2.17
1.77
1.64
1.64
1.39
1.16
1.37
1.37
1.42
1.32
1.37
1.62
1.05
1.64
2.09
2.17
1.62
1.73
1.44
12, 1
96 129
1,89
1
16, 4
1410
, 822
35, 3
6410
, 582
40,2
34
15, 1
3017
,475
91, 9
885,
597
74, 8
48
2,04
11,
569
7,54
211
,004
88, 4
56
12, 7
264,
740
23, 2
0332
, 960
91, 6
46
15, 2
4656
, 421
149,
121
5,43
66,
708
5,37
396
79,
778
13, 7
333,
533
17, 0
905,
060
21, 3
399,
800
31,9
60
6,27
155
160
,323
16, 8
37
13,5
09
421
882
650
368
1,66
11,
677
546
737
1,34
51,
534
1,43
11,
317
1,34
4
1,25
71,
334
1,21
21,
764
1,83
2
2,26
02,
294
802
2,01
32,
098
2,59
42,
343
2,28
12,
495
2,11
3
103 64 96 97 147
132
136
110 83 227
1,05
981
121
419
9
136
414
731
667
358
1,61
01,
670
532
746
1,33
21,
606
1,47
41,
349
1,30
2
1,37
31,
481
1,13
31,
774
1,72
2
2,14
92,
169
853
1,99
32,
061
2,51
12,
268
2,21
12,
077
2,49
6
100 56 102
118
134
130
116
107
226
983
802
218
162
118
417
. 79
966
0
363
1,64
21,
673
540
742
1,33
81,
575
1,45
51,
335
1,32
1
1,31
81,
414
1,18
31,
768
1,77
0
2,21
82,
244
830
2,00
22,
077
2,56
32,
302
2,24
22,
325
2,33
9
102 60 100
110
140
131
146
114 96 227
1,01
680
621
618
3
126
39.5
127 74
.5
26.4
76.6
54.6
32.7
29.5
108
154
114
275
148
347
259
130
285
145
140
198 26
.513
011
8
171
113 86
.112
012
0 19.4
11.9
17.8
18.1
29 26.6
28 22.7
16.8
24.2
59.9
64.5
19.6
21.4
17
3.01
19.2
39.
97
8.21
6.99
3.97
4.97
2.44
22.7
617
.19
10.5
227
.19
25.1
5
44.1
272
.76
18.5
935
.41
11.5
6
24.1
18.2
12.
2811
.26
7.01
18.0
613 8.
027.
797.
30
2.19
4.8
5.4
4.85
12.0
4
6.47
6.75
5.28
7.32
7.51
7.07
7.06
6.72
8.5
2.52
56.8 9.4
29.3
51.4
61.6
86.9
44.1
81.8
74.3
64.4
139.
243
.310
5.5
31.6
21.1
44.3
64.8
152.
6
61.9
34.7
79.9
86.3
142.
7
69.1
86.8
135.
552
.258
.4
43.0
22.8
54.0
63.4
36.2
60.0
51.1
68.0
57.7
80.5
38.4
14.8
92.4
77.5
44.4
46.2
10.4
28.7
62.2
55.4
85.4
53.3
76.9
63.3
75.7
128.
151
.211
6 29.1
34.8
47.4
65.6
142 61 50
.985
.585
.211
9.7
63 94.3
137.
757
.964
.1
33.8
27.4
64.4
65.4
33.8
87.5
44 86.5
53.3
84.8
34.8
15.7
101.
470 38
.1
1,40
01,
280
1,26
0
1,40
02,
800
2,80
01.
-240
1,24
0
4,30
04,
842
4,84
24,
710
4,71
0
4,71
04,
524
4,37
24,
839
4,83
9
3,40
03,
350
1,10
03,
536
3,53
6
3,09
53,
765
3, 7
652,
500
2,50
0
1,22
01,
050
1,42
01,
420
1,42
0
1,42
01,
220
1,49
01,
300
1,34
3
1,20
01,
000
1,20
01,
200
1,55
0
999
958
960
1,00
21,
195
1,08
191
587
9
2,39
23,
068
2,76
42,
990
2,70
3
3,16
63,
079
2,76
12,
587
1,85
6
1,58
11,
370
761
1,72
31,
399
1,66
51,
649
1,37
81,
129
1,11
1
997
972
1,03
81,
018
1,06
1
989
927
950
963
970
856
749
868
884
1,03
6
796
785
745
754
702
664
730
638
1,44
42,
080
1,52
21,
995
675
2,18
52,
076
1,85
692
560
8
635
674
574
704
561
694
639
569
618
601
910
905
879
830
820
708
735
715
720
667
584
630
500
516
928
010 0 4
4?0 0 0 .0
7
.10
0 .04
0 0 0 0 0 0 0 0 0 .14
0 0 0 01 .01
0 0 0 0 ,04
.04
,01 01 03 ,08
,01
.01
0 0 ,03
0 8.96
- -
00
53 112 67 104 61 115 74 258 47 45 172 55 53 67 95 180 61 120
215 37 40 87 31 93 108 83 164 66 92 76 134 87 45 81 57

154 CONTRIBUTIONS TO HYDROLOGY, 1944
papiAip -qns SBM. nisBq
-qns jo
t^o»*3C$a» cpwcr ICT CO CO i ( *O T I C
a»ep »-icoo»oa» co»5 t-»oeo»oco
COt-l v-4co as CO
wate quar
ea urfSJJOA
- J as a j PITS
§ sC)O *OO
3 SS&S CN ' '
CO>0 rlCO
G e
<es, e&
"X5
V fSstg
Altitude of land (feet above mean sea level) uiniuimpj;
WQWT iO OO CO
OO Oi 00 r* *O O lOQOiO
treapjCOCD io o o as
rH O»OQ O O U
a> o as So T i c 11
o o t-* t-» § O O T-H iOO (M<N O
xtt T^ CD CD CO
cfw" csT^eo*
(sailor)
-mad jo
ONOOOO
§' t-^ai G> cc COP3 WO
CD T-IOOi CD
OTHOOOOas eo oo -O
^ T | T I O CD J>^ ***
S^COCDN <MCD
(Mt-eoCD Ng
(saitni) 1O OOrHlOlO
NOOO NN ^ *£ 06 o6»H (M^5 ob-lr*
Ch slop per
CO 00-fO CO5< rtcoT-noj>ri uScowrHrHNINC
ocoocot^lOOOt^CNCO * N-H-HCO
COM
OlOOOKM
COINoood
rHCDOi <M
) lO CD T-H cd CO rH-OS CO i I *OCDiOl--C!
cl ES|T 1 Oi >O CO COCOi003NI-» W CO CN »< -»l t^. »O »O
58 S! -oioas *as as^t-^
is a ft
S CD CO O T-I GO »O iO CO T-I W C COOSCDN N CDOOOOS co ^ !3 KSS
(MOO<M OO5 NOOOOt^rHCO CO «** 00 »O
'Mr'3. " § r-THr-HOi t-. >oICI10
(satior 3tqn3) re s3 iO OO b-- O "O T-t
JH ^r
aiBnbs aad sajiin) | ^ ̂ ̂ ̂ ̂CD CDOOOiO- O510O5 (MCO COt^OOOOO
(M 00 00 -» CD CO *O »O C
(saijor aaenbs) N , 0 0 10B9JB a3BULBJCT »o rH **< co
CO CO Oi CS» IO CO r- -* »< OJ C
OtOCDiOtO COOO >OCOOOii^cOOO t^ »O CO CrHNOOCO Oi CN COt
S«-S sgfe«0 s^S-oaiSS5,?«SoS^^
Elkhorn C fort, Ky. Cedar Creek Sandusky Ri Sandusky Ri Sandusky Ri
Little Cuyahoga Ri Buffalo Creek at Oa Cayuga Creek near La Cazenovia Creek at E
Little Tonawanda C
Genes Genes Genes Mor Can Fall
East Bch Black River Black River Moose River
Indepen
".;- Sal^S^rlSB«p^SaS>n s«-s§>I ".glo-rt
OtS O«CQ
444#f^ oBo>Qpa g9£3
444 43 44444 H

CHARACTERISTICS OF DRAINAGE BASINS
*Ot-Q*Oi-i <Npll> n;p ^ ILQ CO "^ CO 00 i-
155
ICOOCXN t-HCO-Mi«COi-l COCO*O
liQ^i^H * *CO
ci * IN' co eo a oot^oooo
OI>-OO O O
CO >O 1 ' :»£*« coe r*-i>» co ft
. |N. rH *& O S" * ' Oi CO CO ^ CD »O C
JOOOCT-*
tOOOOOrt COco'co'co'ia'io"
00 U5 t-i OS U5 OOOOt^O t^oOt*COt^ CO <N
OOrHMTflTf CO fr»Oi-HO O 00 M N CO t^i
-O ^3,0 t-^o od c^uSeo 1^* ^c'C^^ico wSri-* N -^ »-l * CO "* CN» CO l>- i-l W CO rH i-l « C
S Oi OS CO *P ^i ^ M OS N -^OOSOS *H C
CI 00 M CO i-HOONMrH CO i-H>-0000 00 ^ r-tCTi-HiO CO t^t^Tfi t-.l
S c5 *--w NCNt*M»-« roi^-r* oooor* O»-H»«OO OQO-*
toeoosi-Hi-H oo t^ot^rH irst^-cooo eposi|^«t-»iO!-H ^*l CNOi'-HN OSeOCTCOOp OOiCOW5NOO1 »« OCOt^CO 00 O *O i ' C5 O 00
Ol-HOT CC U3 r-i "
i-T^-H ifl'i-TOSCO"^OC<|lOȣ5 rHC<f ^H^
OO CT « "O «COrdrdOO SD
ooooscoOt»t^«O
: i i>^ :i ; '& ' \* ' &'&&
H|2^fe s3 S o ^ csw Set, ^-.gg a w
^«-^s^°nfe a aS bPn 1^ 3
ll«2^**H J^ W *3
g.^---< fitH/M^'S C3
^>»&fl.5; SS|§« fi§S|a5 S^MXJJsSf S Soo^^
N. Y aven,
nd, V Vt
East Branch of Ausable
Forks, N. Y.
Bouquet River at Willsbor Poultney River below Fair Otter Creek at Center Rutl Otter Creek at Middlebury
Dog River at Northfleld Falls, Mad River near Moretown, Vt Clyde River at Newport, Vt- _ .. Little La Crosse River near Leon, Coon Creek at Coon Valley, Wis Coon Creek near Stoddard, Wis Kickapoo River at Steuben, Wis Ralston Creek at Iowa City, Iow
* *
5» ggl!>>O 1OIO>O

INDEX
Abstract .-.... . -. . 125Area-altitude distribution curve, expressing
slope of basin by._ _______ 140-141
Channel slope, computation of. _ ______ 138-139variation of with number of subareas.. _ 139
Channel storage, measurement of volume of 134Connecticut, drainage basins in..___ 146,147-148
Drainage basins, differences in character of. 128,129 relation of slope and altitude to size of._ 143 summary of topographic characteristics
of-_ 145-155 typical hypsometric curves for_,____ 140 use of maps in tabulating data on__ 132; pi. 2
Iowa, drainage basin in. ... __________ 155
Kentucky, drainage basins in_________ 153
Land slope, intersection-line method for deter mination of.. .- --._.. 137-138
Maine, drainage basins in.--_________ 145 Maryland, drainage basins in________ 150,151
Page Massachusetts, drainage basins in.. 145-146,147,148
New Hampshire, drainage basins ha _ 145,146-147New Jersey, drainage basins in 149,150New York, drainage basins in 148,
149,150,151,154-155
Ohio, drainage basins in.. 152-154
Pennsylvania, drainage basins in 150,151,152 Previous studies._.__ . - 128-130 Purpose and scope of present study. 130-132
Rhode Island, drainage basins in. ..._ 146 Runoff, effect of area-distance distribution
on i . 134-135,136 effect of area of water surfaces on. ___v 141-142 Meteorologic factors affecting. ___ 127-128
Stream density, features of._____-___ 133-134
Vermont, drainage basins in.- 146,147,148,155
West Virginia, drainage basins in______ 152,153 Wisconsin, drainage basins in.. 154,155
157
O