TNO report TNO 2020 R10867 Europlatform LiDAR measurement ...
23
TNO PUBLIC TNO PUBLIC TNO Energy Transition Westerduinweg 3 1755 LE Petten P.O. Box 15 1755 ZG Petten The Netherlands www.tno.nl T +31 88 866 50 65 TNO report TNO 2020 R10867 Europlatform LiDAR measurement campaign; Instrumentation Report Date 20 July 2020 Author(s) J.P. Verhoef, E.J. Werkhoven, G. Bergman, P.A. van der Werff Copy no No. of copies Number of pages 23 (incl. appendices) Number of appendices Sponsor Ministry of Economic Affair and Climate Policy Project name 2020 Wind conditions @ North Sea Project number 060.42447 All rights reserved. No part of this publication may be reproduced and/or published by print, photoprint, microfilm or any other means without the previous written consent of TNO. In case this report was drafted on instructions, the rights and obligations of contracting parties are subject to either the General Terms and Conditions for commissions to TNO, or the relevant agreement concluded between the contracting parties. Submitting the report for inspection to parties who have a direct interest is permitted. © 2020 TNO
Transcript of TNO report TNO 2020 R10867 Europlatform LiDAR measurement ...

TNO PUBLIC
TNO PUBLIC
TNO Energy Transition Westerduinweg 3 1755 LE Petten P.O. Box 15 1755 ZG Petten The Netherlands www.tno.nl T +31 88 866 50 65
TNO report TNO 2020 R10867
Europlatform LiDAR measurement campaign; Instrumentation Report
Date 20 July 2020 Author(s) J.P. Verhoef, E.J. Werkhoven, G. Bergman, P.A. van der Werff Copy no No. of copies Number of pages 23 (incl. appendices) Number of appendices
Sponsor Ministry of Economic Affair and Climate Policy Project name 2020 Wind conditions @ North Sea Project number 060.42447 All rights reserved. No part of this publication may be reproduced and/or published by print, photoprint, microfilm or any other means without the previous written consent of TNO. In case this report was drafted on instructions, the rights and obligations of contracting parties are subject to either the General Terms and Conditions for commissions to TNO, or the relevant agreement concluded between the contracting parties. Submitting the report for inspection to parties who have a direct interest is permitted. © 2020 TNO

TNO PUBLIC
TNO PUBLIC | TNO report | TNO 2020 R10867 2 / 20
Summary
In order to better understand the wind conditions at the North Sea for future offshore wind farms a ZXLidars ZX300 LiDAR was installed at the Europlatform platform in 2016. This report describes the background of the measurement campaign, the Europlatform itself, the used LiDAR system, data sources and operational aspects. The measurement data is available via the www.WindOpZee.net website Reference [4]. This report is an updated version of earlier released reports and covers the transition from ECN part of TNO to TNO Energy Transition.

TNO PUBLIC
TNO PUBLIC | TNO report | TNO 2020 R10867 3 / 20
Contents
Summary .................................................................................................................. 2
1 Introduction .............................................................................................................. 4
2 Europlatform (EPL) .................................................................................................. 6
3 ZXLidars ZX300 ........................................................................................................ 9
4 Installation ZXLidars ZX300 LiDAR ...................................................................... 10 4.1 Installation limitation ................................................................................................ 10 4.2 Installation possibilities ............................................................................................ 10 4.3 Mechanical installation............................................................................................. 10 4.4 Electrical installation ................................................................................................ 12 4.5 Orientation of the LiDAR .......................................................................................... 12 4.6 Obstacles ................................................................................................................. 12 4.7 LiDAR settings ......................................................................................................... 13
5 Data handling ......................................................................................................... 15 5.1 ZXLidars ZX300 data files ....................................................................................... 15 5.2 TNO data base ........................................................................................................ 15 5.3 Data export Europlatform ........................................................................................ 17 5.4 Additional data sets ................................................................................................. 17 5.5 Wind direction correction ......................................................................................... 18
6 Operation and maintenance aspects ................................................................... 19
7 References ............................................................................................................. 20

TNO PUBLIC
TNO PUBLIC | TNO report | TNO 2020 R10867 4 / 20
1 Introduction
An important step to achieve the renewable energy targets of the Netherlands is working towards 60GW offshore wind energy in 2050. The Offshore Wind Energy Act gives the government the option of issuing lots for the development of offshore wind farms. In line with these policy intentions to arrive at 3,500 MW from the first roadmap for offshore wind energy, lots have been issued in the wind energy areas Borssele and the Dutch coast (‘Hollandse Kust Noord’ (HKN) and ‘Hollandse Kust Zuid’ (HKZ)). The commissioning of wind farms within these plots, as described in the Roadmap 2023 (see Figure 1), meets the objective of the Energy Agreement for offshore wind energy, namely approximately 4,450 MW in 2023, Reference [1].
Figure 1 Offshore wind development plans in NL until 2030

TNO PUBLIC
TNO PUBLIC | TNO report | TNO 2020 R10867 5 / 20
To gain more knowledge about the meteorological conditions for the future offshore wind farms, the Dutch Government set up a measurement campaign on strategic points in the designated areas to collect data and determine the wind conditions at these locations. This helps developers to make accurate offshore wind farm business plans for the indicated lots. The three running campaigns within the Wind @ Sea – measurement campaign funded by the Dutch Ministry of Economic Affairs and Climate Policy are LiDAR measurements at Lichteiland Goeree (LEG), Europlatform (EPL) and K13-A. An important measurement campaign, the Meteorological Mast IJmuiden (MMIJ) measurements, was stopped in 2013. Data collected during this campaign still proofs to be of great value and can be retrieved via the Wind @ Sea website, Reference [4] . That measurement campaign, as well as the meteorological mast measurements at the Offshore Wind farm Egmond aan Zee (OWEZ) and the various floating LiDAR measurements in the Dutch offshore zones (Borssele, Hollandse Kust (Noord, West and South), “Ten Noorden van de Wadden” (TNW) and IJmuiden Ver) provide valuable data. As part of the Wind @ Sea measurement campaign, TNO started a LiDAR measurement campaign on Europlatform (EPL) in 2016. This report describes the instrumentation for the ZXLidars ZX300 LiDAR measurement campaign at EPL. Chapter 2 describes the platform EPL, its location and use. Chapter 3 describes the used instrumentation (eq. ZXLidars ZX300 LiDAR). Chapter 4 presents the mechanical as well as the electrical installation and gives the important information like measurement heights, North orientation, data format etc. Chapter 5 describes the data handling from measurements to checking and exporting of the generated data. Chapter 6 finally describes the operation and maintenance (O&M) aspects regarding the measurement campaign.

TNO PUBLIC
TNO PUBLIC | TNO report | TNO 2020 R10867 6 / 20
2 Europlatform (EPL)
The Europlatform is a platform located at a distance of about 60 km west from Hoek van Holland. The location of the platform can be seen in Figure 2.
Figure 2 Location of Europlatform
The platform serves as a measurement station for among others water level and wave height measurements. Also, meteorological measurements are being performed on the platform. A picture of the platform can be seen in Figure 3.

TNO PUBLIC
TNO PUBLIC | TNO report | TNO 2020 R10867 7 / 20
Figure 3 Europlatform
Some specific data concerning the Europlatform are: Coordinates : N51.99792° E3.27481° / 51°59'52.5"N 3°16'29.3"E Water depth : 32 meter (NAP). LAT = MSL - 114 cm NAP = LAT + 92 cm (Hoek van Holland) References for this information can be found in Reference [2] and Reference [3]. The platform consists of a helicopter deck on a height of 19 meter above MSL, with an accommodation deck below. The floor of this accommodation deck is on 16.2 meter above MSL. A top view of the platform can be seen in Figure 4.

TNO PUBLIC
TNO PUBLIC | TNO report | TNO 2020 R10867 8 / 20
Figure 4 Top view of the Europlatform
ZX300

TNO PUBLIC
TNO PUBLIC | TNO report | TNO 2020 R10867 9 / 20
3 ZXLidars ZX300
The Zephir Z300 LiDAR consists of a tripod-shaped housing, with dimensions of ca. 90 x 90 x 90 cm. The inclined top of the housing contains the lens through which the laser beam comes out. A picture of the system can be seen in Figure 5.
Figure 5 ZXLidars ZX300 LiDAR
The laser beam of this LiDAR points up with an angle of 30 degrees with respect to the vertical, and rotates to describe full circles, as can be seen in Figure 10. A big advantage of this way of measuring is that an object blocking the laser beam in some position does not make data-acquisition impossible. As long as enough data points can be measured around the circle, the LiDAR is able to determine the wind speed.

TNO PUBLIC
TNO PUBLIC | TNO report | TNO 2020 R10867 10 / 20
4 Installation ZXLidars ZX300 LiDAR
4.1 Installation limitation
The installation possibilities of the LiDAR are limited by the following conditions: • As the top of the platform is a helicopter landing, it is not possible to install the
Lidar on top of the platform, as no objects are allowed to protrude above the helicopter platform.
• The accommodation deck is fully covered by the helicopter deck. Therefore there is no location on the accommodation deck with free sight upward.
4.2 Installation possibilities
On the west side of the platform there is an escape ladder leading down from the helicopter deck to the accommodation deck. At this position the accommodation deck has an extension in outward direction. This way it is possible to come close below the edge of the helicopter platform. The extension can be seen in Figure 6.
Figure 6 Extension of accommodation deck
By extending this extension a little further, it is possible to create a location on which the LiDAR can stand and have a more or less free view upwards.
4.3 Mechanical installation
To create a suitable location for the LiDAR to stand, a small platform extension (ca. 1.75 x 1.75 m) has been connected to the existing extension of the accommodation platform, see Figure 7. On this new extension the LiDAR has been installed at an height of 16.2 meter above MSL, see Figure 8 and Figure 9.

TNO PUBLIC
TNO PUBLIC | TNO report | TNO 2020 R10867 11 / 20
Figure 7 Mounting platform extension
Figure 8 Schematic drawing of LiDAR position on extension platform

TNO PUBLIC
TNO PUBLIC | TNO report | TNO 2020 R10867 12 / 20
Figure 9 Installed LIDAR. North maker pointing to the right
4.4 Electrical installation
4.4.1 Power supply To be able to operate, the LiDAR needs a 230V AC power supply. The power requirements of the LiDAR in standard climate conditions it between the 69 and 111 Watt, see Appendix B. From the Lidar a power cable has been led along the railing, then upwards to an existing cable bundle, towards a cable gland where all cables go inside the computer room. There, the power cable has been plugged into an 230VAC socket in one of the equipment cabinets.
4.4.2 Communication To be able to transfer the data measured by the LiDAR to TNO, a 3G/4G modem has been installed in one of the equipment cabinets in the computer room of the platform. From this router an ethernet cable has been routed to the LiDAR along the installed power cable.
4.5 Orientation of the LiDAR
The LiDAR has been installed with the ‘North’ marker of the LiDAR pointing towards the platform North (to the right when looking at the LiDAR whilst standing on the existing accommodation deck extension), see Figure 4 and Figure 9.
4.6 Obstacles
As the LiDAR has been installed quite close to the helicopter platform and the LiDAR beam has an opening angle of 30 degrees with respect to the vertical, the view of the LiDAR upwards is not totally free from obstacles. The lens of the LiDAR is situated about 1 meter away from the netting of the helicopter deck in horizontal direction. The lens is situated at about 2 meters below

TNO PUBLIC
TNO PUBLIC | TNO report | TNO 2020 R10867 13 / 20
the netting, resulting in a beam radius of about 1.15 meters at the netting height. This means that likely a small part of the scanning circle is obstructed by the netting. Moreover, an exhaust of one of the Diesel motors of the platform is situated near the LiDAR, and can obstruct the scanning beam for a part of the scanning circle. The ZX300 LiDAR is equipped with a sonic wind direction sensor. This measurement is used by the LiDAR to more reliably determine the wind direction. Because the platform blocks the wind at the measurement height of this sensor the wind direction of the sensor is not always reliable. In some cases this results in an 180 degrees offset on the LiDAR wind directions.
4.7 LiDAR settings
4.7.1 Measuring heights We have chosen to measure wind speeds on the Europlatform on the same height as we are measuring wind speeds on the Licht Eiland Goeree platform, which are based on the meteorological mast (MMIJ) measurement height configuration, mentioned in chapter 1. The lens of the LiDAR is around 17 meters above sea level (MSL). The measuring heights as configured in LiDAR can be seen in Figure 10 and Table 1 gives also the corresponding measurement heights above MSL.
Figure 10 Height configuration of the ZX300 LiDAR

TNO PUBLIC
TNO PUBLIC | TNO report | TNO 2020 R10867 14 / 20
Table 1 LiDAR configuration and measurement height to MSL
No LiDAR height configuration (m) measurement height to MSL (m) 1 46 63 2 74 91 3 99 116 4 124 141 5 149 166 6 174 191 7 199 216 8 224 241 9 249 266
10 274 291

TNO PUBLIC
TNO PUBLIC | TNO report | TNO 2020 R10867 15 / 20
5 Data handling
In this chapter we will consider the three TNO data sources / flow as well as the additional available data sources, namely: • Standard produced ZXLidars ZX300 data files, 10-minute statistical data and
1-second data; • TNO database handling, checking, correction and filtering; • TNO data export via www.WindOpZee.net; • Additional LEG data from RWS and KNMI.
5.1 ZXLidars ZX300 data files
The ZX300 LiDAR delivers data files in binary format. To process the data you need to convert the binary format to a readable format like CSV or create software which can read the binary format. Conversion to a readable format can be done using the manufacturers software Waltz or the conversion tool ZPH2CSV. Two different files are created by the LiDAR on a daily basis, one file with the 10-minute statistical data, recognised from the prefix “Wind10_” and one file with the 1-second data with prefix “Wind_”. The complete filename is build up as described below: Wind10_”ID”@Yyyyy_Mmm_Ddd.ZPH (Wind_”ID”… in case of 1-second data file) - WLS7-XXXX: WINDCUBEv2 serial number - yyyy: year of data - mm: month of data - dd: day of data For an overview of the outputted signals see Appendix A. All the produced ZPH files are transferred on a daily bases from to the data server at TNO.
5.2 TNO data base
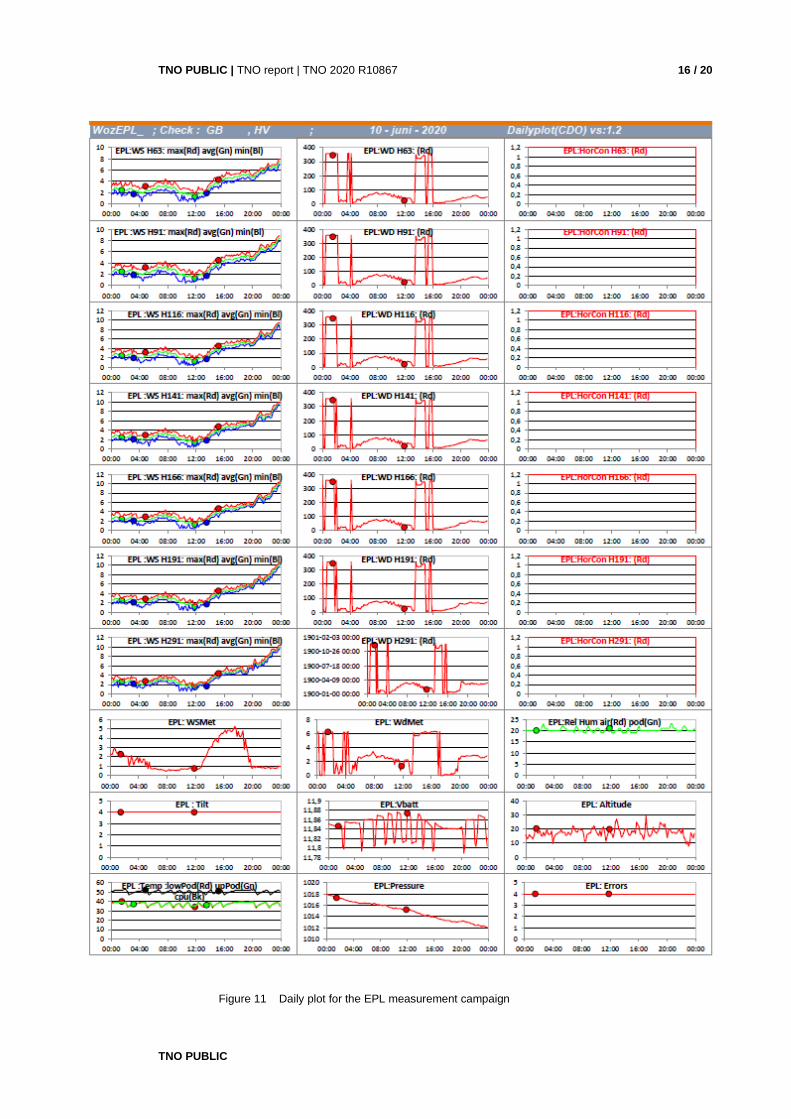
After data transfer the data is imported into the TNO data base and then the processing starts. The Lead Engineer will evaluate daily the “daily-plot”, see Figure 11, which is automatically created and sent by email. If needed the Lead Engineer can perform a post-validation on the data in the database so that a specific data period is marked as invalid and no longer is visible. In the database is also a automated wind direction correction active as explained in Chapter 5.5.
TNO PUBLIC
TNO PUBLIC | TNO report | TNO 2020 R10867 16 / 20
Figure 11 Daily plot for the EPL measurement campaign

TNO PUBLIC
TNO PUBLIC | TNO report | TNO 2020 R10867 17 / 20
5.3 Data export Europlatform
TNO makes the 10 minute statistical data available via the www.WindOpZee.net website Reference [4] . Here you can find the historical data of the LiDAR measurement campaign. The order for export and presentation on the website will be as follows: EPL-yyyy-mm.CSV for the previous month(s). After a quarter is completed the monthly files will be replaced by: EPL-yyyy-Qx.CSV (where x stands for the actual quarter) After the year is completed the quarterly files will be replaced by a yearly file: EPL-yyyy.CSV
5.4 Additional data sets
Besides the TNO LiDAR measurements, both KNMI and Rijkswaterstaat also perform measurements on EPL. Those measurements can be divided into Meteorological Measurements (KNMI), Reference [6] and Oceanographic measurements (Rijkswaterstaat), Reference [7]. Meteorological parameters include: • Air pressure • Wind speed / Wind direction • Air temperature • Relative humidity • Visibility Oceanographic parameters include: • Water level • Water temperature • Wave height The oceanographic parameters are measured with a Radac WaveGuide Radar F08 free space type which is installed on the jacket construction. The measurements are not carried out by TNO but they are important reference measurements. Together with the LiDAR data the availability and plausibility is checked on a daily basis.

TNO PUBLIC
TNO PUBLIC | TNO report | TNO 2020 R10867 18 / 20
5.5 Wind direction correction
The ZX300 is based on the continues wave technology. It changes focus point for every measurement height and per height is takes about 1 second to complete one 360 degree scan. Depending on the configured heights, it can take between 10 and 15 seconds to complete the measurements of all configured heights. Using the doppler shift in the backscattered data the wind speed can be determined but the direction of the doppler shift cannot be determined, which can result in a 180 degree shift. For this the ZX300 is equipped with an sonic anemometer mounted at a pole at the side of the LiDAR used as a reference wind direction. However when installed at the side of a platform like the LiDAR at the EPL platform, the sonic wind direction measurement is highly disturbed. This results in periods where the wind direction determination of the LiDAR fails and the wind direction is shifted 180 degrees. This 180 degrees shift of course can only be identified by having a secondary wind direction signal for comparison, which is available in the additional EPL platform data set from KNMI. In short the correction is done as follows: • Take the difference of the two wind direction timeseries; • Remove solitary spikes from this difference signal; • Identify the periods where the ZX300 wind direction is clearly reversed; • These periods can be extended under certain circumstances. The complete description of the wind direction correction method is found in Appendix C.

TNO PUBLIC
TNO PUBLIC | TNO report | TNO 2020 R10867 19 / 20
6 Operation and maintenance aspects
The ZXLidars ZX300 was first installed on May 10th, 2016. According to TNO quality system the LiDAR is replaced every two years and will be serviced every year. All operational aspects with respect to installing and maintaining the LiDAR are recorded in the Logbook. In the following table, an overview is given of the used LiDAR’s and the period that they were operational. It should be noted that before the LiDAR was installed at the EPL platform it was first calibrated at the TNO Ground based RSD Verification Facility, Reference [5] .
Table 2 Overview of applied LiDAR @ EPL
LiDAR TNO code Period Reason for replacement 308 DELI6110 10-05-2016 to 10-08-2018 Periodically replacement 315 DELI6111 10-08-2018 to 23-10-2019 Power failure 308 DELI6110 23-10-2019 to ….
Using the manufacturers software Waltz we can connect to the LiDAR at EPL and the status of components can be monitored, see Figure 12.
Figure 12 Screenshot of ZXLidars software Waltz

TNO PUBLIC
TNO PUBLIC | TNO report | TNO 2020 R10867 20 / 20
7 References
[1] Kamerbrief routekaart windenergy op zee 2030, Den Haag, Kamerbrief 27 maart 2019, kenmerk DGETM-E2020/17177527
[2] Rapportage veldmetingen Westerschelde september 1997 t/m december 2002, Ministerie van Verkeer en Waterstaat, December 2003, RIKZ/2003.052
[3] Memorie Noordzeereductiematrix 2006, Koninklijke Marine, Dienst Hydrografie, April 2007
[4] https://www.WindOpZee.net [5] TNO ground based RSD Verification Facility at EWTW Gerben Bergman and Hans Verhoef, ECN – Wind Energy TNO 2020 R10781, June 2020 [6] https://data.knmi.nl/ [7] https://noos.matroos.rws.nl/

Appendix A | 1/1
TNO PUBLIC
TNO PUBLIC | TNO report | TNO 2020 R10867
A Signal list EPL ZX300 LiDAR
Figure 13 Signal list EPL ZX300 LiDAR
Name Location Short name (Signal name) Sensor Unit installed Freq (Hz) CampaignLiDAR, Zephir300Battery Voltage EPL_VBat VMax temperature inside Lidar EPL_LowPodTemp deg CMin temperature inside Lidar EPL_UpPodTemp deg CCPU temperature in Lidar EPL_Tcpu deg CRelative humidity inside Lidar EPL_Hpod %Lidar bearing EPL_Bearing deg Lidar tilt angle EPL_Tilt deg Air temperature at Lidar position EPL_Tair2 deg CAir pressure at Lidar position EPL_Pair2 hPaRelative humidity at Lidar position EPL_Hair2 %Wind speed measured by Lidar meteo station EPL_WsMet m/sWind direction measured by Lidar meteo station EPL_WdMet degPrecipitation measured by Lidar meteo station EPL_Rain %Measuring height EPL_Altitude m/sExternal supply voltage EPL_VGen VError flags EPL_ErrorFlagsZP300 -GPS Lat. EPL_ZPHS_GPSDataFloatLatitude -GPS Lon. EPL_ZPHS_GPSDataFloatLongitude -For every measuring height (m): xxx : 63, 91, 116, 141, 166, 191, 216, 241, 266, 291Horizontal wind speed average EPL_Hxxx_WsHor_avg -Horizontal wind speed std deviation EPL_Hxxx_WsHor_std -Horizontal wind speed minimum EPL_Hxxx_WsHor_min -Horizontal wind speed maximum EPL_Hxxx_WsHor_max degVertical wind speed average EPL_Hxxx_WsVer_avg m/sWind direction EPL_Hxxx_Wd m/sSignal to noise ration EPL_Hxxx_BackScatter m/sHorizontalConfidence EPL_Hxxx_HorizontalConfidence m/sData package valid or invalid (only time series) EPL_Hxxx_DataValidity m/s# packets in fit EPL_Hxxx_npackets -# measuring points EPL_Hxxx_npts -# missed points EPL_Hxxx_Missed# packets in fit EPL_Hxxx_npacketsCS, diagnostic use only EPL_Hxxx_CS
Wind@Sea
ZXLidars ZX300
EPL
EPL TNO stat Wind@Sea
ZXLidars ZX300 TNO stat

Appendix B | 1/1
TNO PUBLIC
TNO PUBLIC | TNO report | TNO 2020 R10867
B Specifications of the ZXLidars ZX300 LiDAR
Figure B.14 ZXLidars ZX300 LiDAR specifications

Appendix C | 1/1
TNO PUBLIC
TNO PUBLIC | TNO report | TNO 2020 R10867
C Wind direction correction method ZX300 LiDAR
Short description: - Take the difference of the two wind direction timeseries. - Remove solitary spikes from this difference signal. - Identify the periods where the ZX300 wind direction is clearly reversed. - These periods can be extended under certain circumstances
Assumptions:
- Only 180 wind direction offsets are to be corrected; - WDcorrected = WDmeasured + Offset | Offset is 0° or Offset =180°; - The offset can only change at the start of 10 minute time frame; - Wind direction is only reliable measured above a wind speed of 1 m/s; - The offset changes occur longer then 20 minutes; - Reference platform wind vane data available (KNMI).
Method: 1. Extract the wind direction and wind speed data from the Lidar at the
lowest measuring height; 2. Acquire the wind direction data from the reference data source ( KNMI ); 3. Remove (set to NaN) all samples from the Lidar time series where the wind
speed > 100 m/s; 4. Calculate the wind direction difference between Lidar and reference time
series and take care of the north gap; 5. Derive 2 signals ( timeseries ): A and B
A: True; if wind speed is > 1 m/s and |wind direction difference| < 30° Offset =0° B: True; if wind speed is > 1 m/s and 150°< |wind direction difference| < 210° Offset = 180° In this way the timeseries is divided into intervals (‘sure‘ intervals) where it is sure whether the signal is switched or not switched, the intervals in between are the ‘unsure’ intervals. In a more mathematical way ‘sure’ interval mean signal A or signal B is true , ‘unsure’ interval mean signal A and signal B are both false;
6. Remove spikes from signal B.(remove solitary true or false values); 7. Intervals where signal B is true are investigated and extended as long as:
|wind direction difference| > 90°, solitary missing data points are skipped. In this way the ‘sure’ intervals where the signal is switched, can grow into the ‘unsure’ intervals until it is more likely that the signal is ‘not switched’;
8. In case two adjacent intervals where B is true are separated by a period where the wind direction difference signal was missing, the two intervals are combined to one;
9. The moments where the Offset changes from 0° to 180° and reverse are found there where signal B shows rising or falling edges.