TNK-BP Presentation to financial community - Credit … Presentation to financial community Credit...
31
TNK-BP Presentation to financial community Credit Suisse Moscow Oil & Gas Day 7 June 2007
Transcript of TNK-BP Presentation to financial community - Credit … Presentation to financial community Credit...

TNK-BP
Presentation to financial communityCredit Suisse Moscow Oil & Gas Day
7 June 2007

2
Cautionary StatementsForward Looking Statements Cautionary Statement
This presentation and the associated slides and discussion contain forward looking statements, particularly those regarding capital expenditure, capital investments, spending on integrity management, annual charges, cost inflation, production and impact of delays in projects on production, expected return to capacity of projects, share buybacks and other distributions to shareholders, group costs, divestment proceeds and their use, effective tax rate, future performance, gearing, growth opportunities, global economic growth, global oil demand growth, oil and gas prices, performance, oil and gas production, production growth, refining margins, refining availability and capacity, outlook for refining environment, the timing of major projects and their contribution to TNK-BP (or TNK-BP Holding) net resources and the application of technology.
By their nature, forward-looking statements involve risks and uncertainties because they relate to events and depend on circumstances that will or may occur in the future. Actual results may differ from those expressed in such statements, dependingon a variety of factors, including the timing of bringing new fields on stream; future levels of industry product supply; demand and pricing; operational problems; general economic conditions; political stability and economic growth in relevant areas of the world; changes in laws and governmental regulations; exchange rate fluctuations; development and use of new technology; changes in public expectations and other changes in business conditions; the actions of competitors; natural disasters and adverse weather conditions; wars and acts of terrorism or sabotage; and other factors discussed elsewhere in this presentation.
June 2007

3
TNK-BP at a glanceUPSTREAM
OilOil GasGas
3% organic oil & gas production growth in 2006 (excl. Slavneft)
1.5 mln bpd liquids production (excluding Slavneft)
7.81 billion barrels total proved liquids reserves (129% replacement)
$250 mln exploration spend; 60% E&A success rate
Growing portfolio of new oil opportunities
0.18 mln boe/day (1.05 bcf/d) of gas sales
Associated gas
Long term options:
Rospan
Kovykta
DOWNSTREAM
Refining & ExportsRefining & Exports Marketing & SalesMarketing & Sales
5 refineries (4 Russia, 1 Ukraine)
0.62 mln bpd refining capacity
Major exporter to Europe –50% of sales as crude, 24% as refined products
Multiple export channels
1,650 retail outlets in Russia and Ukraine
Focused retail expansion in major markets
Operation under BP and TNKbrands
Margin enhancement through building of marketing businesses in lubricants, bitumen
#11 global private oil producer #3 refiner in Russia, with diverse sales channels
4
Asset baseGeographically diverse
core production areas
project areas
Volga Urals
West Siberia
Moscow
East Siberia
Samotlor
Orenburg
RospanNyagan
Kovytka
VC
NNG
Uvat
refineries
Ryazan
Saratov
LINOS

5
TNK-BP Corporate Structure
Notes: This year TNK-BP Holding’s US GAAP consolidated financial statements (for 12M2006) are being prepared for the first time
50%
Businesses consolidated into TNK-BP International’s US GAAP financial statements
Businesses recorded as equity investments
Businesses which are not consolidated into TNK-BP International’s US GAAP financial statements but are consolidated into TNK-BP Limited’s US GAAP financial statements0
Upstream Refining Marketing
95%
50%
TNK-BP Ltd (BVI)
50%
63%
TNK Industrial Holdings Ltd(BVI)
STBP Holdings Ltd.
75%
RUSIA Petroleum
TNK-BP Holding
Slavneft(JV with
Gazprom Neft)
TNK-BP Finance S.A. (Luxembourg)
100%
100%
Lisichansk Refinery
(UKRAINE)
68%
Alfa, Access/Renova B P
TNK-BP International Ltd (BVI) 100%

6
Competitive contextRelative ranking of Russian VIOCs in 2006
Russian VIOCs with more refining cover and higher retail exposure enjoy a competitive advantage due to tax incentives to refine in current price environment
Nevertheless, on longer-term performance indicators (like F&D costs, ROACE, capex intensity) TNK-BP leads the industry, as well as maintaining top position in generating of free cash flow per boe production for 3 consecutive years.
Adjusted for assets sale TNK-BP’s production was up 1.0% (liquids) and 0.6% (oil & gas) in 4M07.Rosneft’s 5.0% growth was mainly due to YuganskNG (+7.7% growth y-o-y), while Rosneft's production without YuganskNG decreased by 1.1%; Lukoil’s oil and gas growth (5.3% y-o-y) was mainly due to Nahodkinskoye gas field’s contribution.
112323333Rosneft
223232121Lukoil
331111212TNK-BP
Oil & GasOilF&D costsROACECapex Intensityunit FCFEBITDA
per boeNet
MarginOps Cash
$/boe1 is best
Production organic growth, y-o-yLong-term indicatorsShort-term indicatorsRelative
ranking*;

7
Operating competitive contextProduction, 2006
0.0
0.20.4
0.60.8
1.0
Lukoil Rosneft TNK-BP (incl. Slavneft) Gazprom (incl.Gazprom neft and
Slavneft)
SurgutNG
mln
bpd
Refining Throughput, 2006
Yukos assets Slavneft
0.0
0.5
1.0
1.5
2.0
2.5
Rosneft (incl. YUKOS) Lukoil TNK-BP (incl. Slavneft) SurgutNG Gazprom (incl. Gazpromneft and Slavneft)
mln
bpd
Yukos assets Slavneft
Slavneft
Slavneft

8
Financial competitive context
2006 Dividend Yield, %14.8
1.4 0.7
4.53.0
02468
10121416
TNK-BP Lukoil Rosneft Emg MktOils
SuperMajors
2006 EBITDA, $/boe
11.215.6
11.1
25.4
34.7
0
10
20
30
40
TNK-BP Lukoil Rosneft Emg MktOils
SuperMajors
2006 Capex, $/boe
3.4
8.26.6
13.0 13.8
02468
10121416
TNK-BP Lukoil Rosneft Emg MktOils
SuperMajors
Note: Based on TNK-BP Ltd data (except div. yield computed for TBH)
2006 FCF, $/boe
3.8
0.2
9.6
12.6
-0.2
-2
0
2
4
6
8
10
12
14
TNK-BP Lukoil Rosneft Emg MktOils
SuperMajors
Note: Dividend yield = Dividends paid in 2006 / Year-avg MCap
Note: TNK-BP financials adjusted for gain from assets disposals and tax provisions

9
Financials
26%
17%14%
30%
21%
47%
27%14%
0
5
10
15
20
25
30
35
40
2003 2004 2005 2006
$ bn
0
10
20
30
40
50
60
70$/bbl
Net Revenues Export Duties and Excise taxes Urals CIF
0.0
2.0
4.0
6.0
8.0
10.0
12.0
2003 2004 2005 2006
$ bn
EBITDA Gain from assets disposals
Note:Based on TNK-BP Ltd data
xx% - share of excise taxes and export duties in gross revenues;yy% - Urals CIF price growth (y-o-y 2006)
* - Net income adjusted on tax provisions
Revenues vs. Oil price
EBITDA Net Income
0.0
1.0
2.0
3.0
4.0
5.0
6.0
7.0
2003 2004 2005 2006
$ bn
Net Income* Gain from assets disposals
10
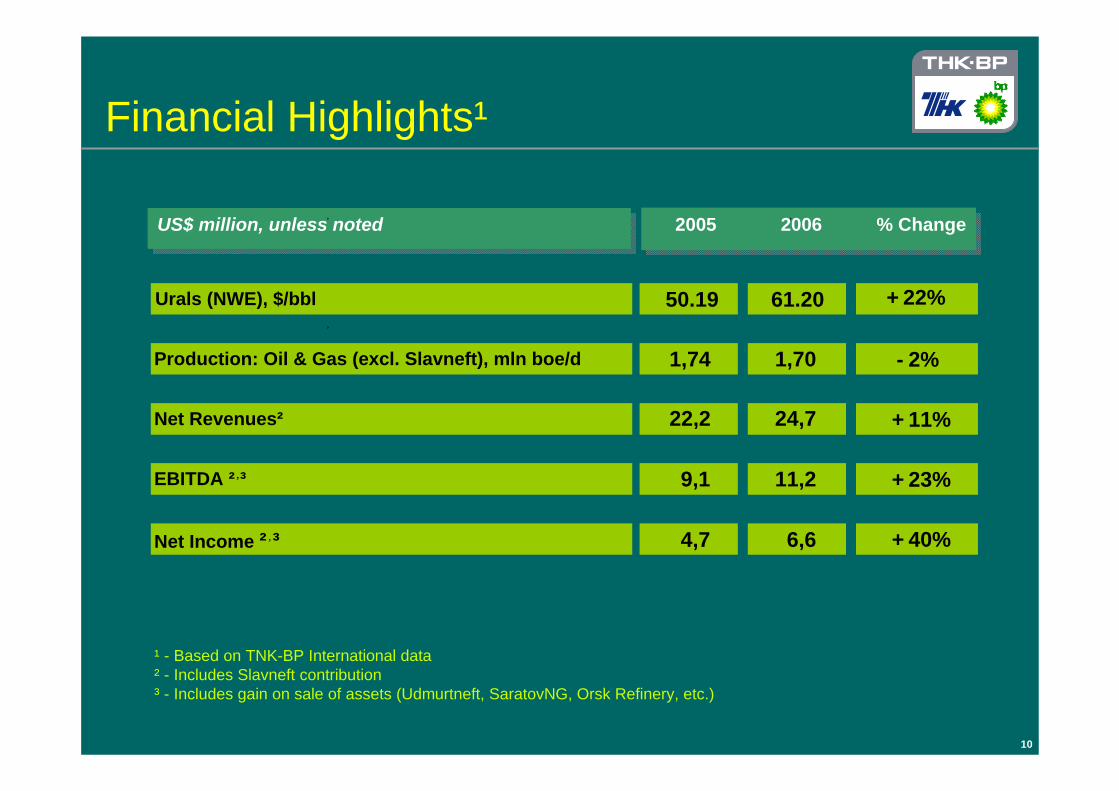
US$ million, unless notedUS$ million, unless noted 2005 2006 % Change
Urals (NWE), $/bbl 50.19 61.20 + 22%
Production: Oil & Gas (excl. Slavneft), mln boe/d 1,74 1,70 - 2%
Net Revenues² 22,2 24,7 + 11%
EBITDA ² ³ 9,1 11,2 + 23%
Net Income ² ³ 4,7 6,6 + 40%
Financial Highlights¹
¹ - Based on TNK-BP International data² - Includes Slavneft contribution³ - Includes gain on sale of assets (Udmurtneft, SaratovNG, Orsk Refinery, etc.)
, ,
,
,
,

11
Financial framework
• Target gearing (net debt / net debt + equity) range: 25-50%
• Credit Ratings: achieve and maintain investment grade ratings. Two out of three rating agencies at investment grade now
• Dividends: minimum 40% of net income and all surplus cash returned to shareholders
• Dividend levels consistent with majority shareholders
• Dividends paid twice yearly at AGM (2Q) and EGM (4Q). Over $8bn declared in 2006 and $0.9bn recommended for AGM in June 2007
TNK-BP Holding:TNK-BP Holding:
TNK-BP Limited:TNK-BP Limited:

12
TNK-BP Transaction
1. Deliver production growth
2. Deliver technology transfer
3. Deliver good corporate governance
4. Deliver socially responsible business conduct
At the time TNK-BP was established, the shareholders made four commitments that would define the Company’s activities going forward:

13
Production growthInitial production growth driven
by optimisation and wellwork:
• Well optimisation
• Frac programme
Improved base management:
• Voidage replacement
• Pattern reconfiguration
Access to additional oil:
• 3D imaging
• Infill drilling
• Sidetracks
• Idle well recovery
Portfolio optimisation:
• Tail disposals (Saratov, Udmurtneft)
• 50% Vanyoganneft acquisition
Oil & Gas ProductionMillion barrels per day
1.0
1.5
2.0
2.5
2003 2004 2005 2006 2007E
mln bpd
0
1
2
3
4
5$bn
Base Slavneft Disposed assets Capex

14
Underpin Brownfield production delivery
• Focus on base waterflood management; optimization of waterflood pattern conversions/target setting
• Waterflood pattern reconfiguration through sidetracking and idle well reactivations
• Putting large 3D seismic programs into use for well identification and planning
• Enhanced Oil recovery, including gas injection
Greenfield developments
• Active appraisal program at Uvat
• TNK-BP approved pilot production project and early oil scheme (EOS) at Verknechonskoye
• Pilot programs initiated for heavy oil project (Russkoye and Vanyoganskoye)
• Pilot designs for Bolshehetsky area in 2008 (Suzun and Tagul)
Reserves management
• Plans to maintain a reserve replacement ratio of at least 100% in the medium term (on a boe basis)
Exploration and Access
• 34 exploration and appraisal wells drilled in 2006 with a 71% success rate.
• Activity in Rospan (oil rim) and East Charsky
• Obtained 35 new licenses during 2006, including 3 in Volga River Delta (Astrakhan)
Technology is a key value driver that underpins brownfield growth and reserve replacement
Technology delivery

15
Refining – key to margin enhancement
• We have invested to improve integrity and product slate of our refineries increasing capacity (34 mtpa, up 15% on 2003) and utilization (to 92%).
• We completed a major upgrade at Ryazan in 2006, enabling production of de-sulphurised high quality fuels (Euro-4 standards)
• We also took advantage of favorable market conditions to restructure the composition of our refining assets through the disposal of the Orsk refinery in order to concentrate on the strategically better positioned plants in Ryazan, Saratov and Yaroslavl (run jointly with Gazprom Neft).
Refining ThroughputThousand barrels per day
Refining netback vs. Transneft export netback
10
20
30
30 40 50 60
Netback, $/bbl
Transneft export netback Simple refining netback
Brent, $/bbl
427 450
75 7172124 132 107
118 125128
130
341 366
120
0
200
400
600
800
2003 2004 2005 2006Russia Disposals Ukraine Slavneft
Due to export duty advantage of products vs. crude even simple refining netbacks exceed Urals export netbacks on Transneft’s core export routes in Brent price range from $50 to $60/bbl. This stimulates oil companies to increase refinery runs.

16
• $2.7 billion in capital and operating costs committed to HSE over next 5 years
• 2,000 hectares of polluted land remediated to end 2006
• 1,400 kilometres of new pipelines (distance equivalent to that between Moscow and Yekaterinburg) installed to replace old worn out lines to end 2006
• PPE equipment issued to all relevant staff, seatbelts fitted, trained inspectors, technical standards and training progressing and performance assessed
• In addition around $1.0 bn over the next 5 years to reduce flaring
HSEHSE
• 150,000 man-days of professional training and development delivered to end 2006
• $370 million worth of social investment programs delivered in 9 regions of Russia in 2005 and 2006
People and Social ProgramsPeople and Social Programs
• Paid over US$ 45 billion of taxes, duties and excise since inception
TaxesTaxes
Samotlor in 2004-2005: polluted acreage before remediation…
…after remediation
Community contribution

17
TNK-BP Vision and Strategy
Possible Winning Formula for Sustained Growth:
Old Oil (Brownfields)
+ New Oil (Greenfields)
+ Gas Development (Organic, influence NOT control)
– Divestments (Tail Assets)
+ Active Inorganics (possible, value additive only)
Vision:To be the leading integrated private Russian Oil and Gas company as measured by profitability and scale
Vision:To be the leading integrated private Russian Oil and Gas company as measured by profitability and scale
Strategy:• Resources to Reserves to Production• Margin Enhancement• Gas• Corporate Governance
Strategy:• Resources to Reserves to Production• Margin Enhancement• Gas• Corporate Governance
Tactics:• Continual Portfolio Management; New
resource access• World-class Health, Safety and Environmental
Standards• World-class Technology Application• World-class Operating Practices• The Best Retail Gasoline Brands in Russia and
the Ukraine• Continual Organizational Capability Growth• World-class Business Practices and Systems• Proactive Regulatory Reform and Competition
Enhancement• Transparency and Corporate Governance
0.0
0.5
1.0
1.5
2.0
2.5
3.0
3.5
4.0
2004 2006 2008 2010 2012 2014 2016
mln boed
Major projects, Access, Big GasBase, Waterflood, Wellwork & Drilling

18
TNK-BP strategic priorities• Resources to reserves to production
• Margin enhancement
• Gas
• Value enhancement through improved governance, transparency and performance management
• New Resource Access of 4.7 Bn boe Risked, 70% Exploration Success rate• Organic Reserve Replacement of 2.5 Bn Bo; ~ 125% +• Production growth of 30% since 2003
• $600 mln Ryazan Refinery Modernization, Refining throughputs > 15%• Moscow Retail Expansion & BP Ultimate, St Petersburg / Rostov / Krasnodar New
Entry• $5 Bn + Portfolio Rationalization Program
• Associated Gas Utilization Program• Kovykta Regional Gasification
• TNK-BP Holding (TBH) Restructuring• Accounting Transformation; 10 Day IAS / US GAAP Accounting Close• $45 Bn + in taxes, duties, excise taxes and fees to the state since Day 1• World Economic Forum Principles Against Corruption

19
Resources to reserves
0
10
20
30
40
50
0
1000
2000
3000
4000
5000
6000
7000SP
E pr
oved
Prob
able
Pos
sibl
e
International markets
Infrastructure access
Current production
Infill drilling
Near infrastructureled development
Drilling and re-completions
3P G
as re
sour
ce
Field optimisation
Improved Recovery
Kovykta and Rospan
mln tonnesbn boe 2003-06 Proved SEC Life of Field Reserves Billion barrels of oil equivalent
7.9 8.0 8.2 7.8
0.1 0.6
0.0
2.0
4.0
6.0
8.0
10.0
2003 2004 2005 2006
bn boe
Base Disposals
127%137%
129%
100%
110%
120%
130%
140%
2004 2005 2006
Organic Reserves Replacement Ratio
2006
New
lic
ense
s ac
cess
New licences purchase
Disposals

20
Undeveloped FieldsUndeveloped Fields
Active portfolio management
ExplorationExploration
Tail assets disposalsTail assets disposals
New License AccessNew License Access
Udmurtneft disposal to Sinopec (c. 950 mmbbl 2P reserves for $3.5 bn or $4 bn including Udmurtneft’s pre-sale dividends)
SaratovNG disposal to Russneft (c. 110 mmbbl 2P reserves for $600 mln; total deal amount inc. Orsk Refinery more than $0.8 bn)
In 2004-2006 – 53 new licenses acquired with more than 800 mt of oil and about 500 bcm of gas for about $400 mln
In 2006 alone – 35 new licenses acquired (including 12 Yugansk licenses).
License acreage size of Switzerland (> 40 000 sq km)
Purchase of the remaining 50% of the Vanyoganneft JV from Occidental for $485 mln – this asset has attractive synergies with our core Samotlor area and offers some 1.4 bn boe resource potential
Over 1 billion bbls SPE 2P reserves discovered in 2004-2006 at c. $0.50/bbl
Opportunities for rapid conversion to production in Brownfields (e.g. Orenburg)
SamotlorNG, Orenburgneft, Vanyoganneft, VarieganNG, Nizhnevartovsk, NovosibirskNGKamennoye
etc.
Udm
urtneft, SaratovNG
Uvat, Verkhnechonsk, Bolshekhetsky, Russkoye, new licenses
Astrakhan, new licenses
AcquisitionsAcquisitions
Key to future production growth in 2009 and beyond
Established portfolio with 10+ world scale projects

21
Greenfield Delivery: Uvat• Development of multiple fields across
17 leases stretching 230km
• Estimated reserves in the range of c. 1.3 bln bbls (Kalchenskoye, Urnenskoye,Ust-Tegusskoye, Severo-Demianskoye and Polunyakhskoye)
• Total estimated capex: c. $7-8 bln
• The first stage of commercial development will have production of 3-5 mln tons per annum (or 60 -100 th. bpd) by end of decade
• Active Exploration and Appraisal program continues
• Regional pipeline and road already sanctioned
• Existing Kalchinskoye production 1.5 mln tonnes in 2006
• Potential deeper horizons
• Gas options
,
WestSiberia
Khanti-Mansisk
SouthTyumen Oblast
Samotlor
Khanti Mansisk AOKhanti Mansisk AO
Urnenskoye
Kalchinskoye
South Tyumen OblastSouth Tyumen Oblast
Severo-Demianskoye
Polunyakh
Ust-Teguss
Future road, pipeline & power corridorFuture road, pipeline & power corridorTNK-BP licensesTNK-BP licenses
100 km

22
Greenfield Delivery: VerkhnechonskNG
• TNK-BP, together with a partner Rosneft, is carrying out additional appraisal activity and is progressing an early oil scheme to link the field with the Eastern Siberia Pacific Ocean pipeline now under construction by Transneft.
• In 2008 TNK-BP plans to be one of the first oil company to supply crude to this new pipeline.
• Estimated probable and possible reserves of c. 1.4 bn bbls of oil.
• Total estimated capex: c. $4 bln
• Plateau production: c. 7 -10 mlntons per annum ( 140 – 200 th. bopd)
• Active Appraisal and optimization program continues

23
Greenfield Delivery: Bolshekhetsky
• TNK-BP continues a focused appraisal and pilot production programme in the Bolshekhetsky area in the Krasnoyarsk region
• Seismic analysis and deep drilling have already doubled estimated resources to 100 million tons of oil (over 750 million barrels).
• Total estimated capex: c. $4 bn
• Plateau production: c. 8 - 10 mln tons per annum (or 160 –200 th. bopd)
• Active Exploration and Appraisal Program continues
• Pilot Production 2008Russkoe
TNK-BP licensesTNK-BP licenses
Suzunskoe
Tagulskoe
Russko-Rechenskoe
Vankorskoe
Lodochnoe
,
WestSiberia
Khanti-Mansisk
SouthTyumen Oblast
Samotlor

24
Greenfield Delivery: Kamennoye• The Kamennoye field is part of the
Nyagan group of fields and has estimated resources of 1.1 billion tons.
• These fields were discovered quite some time ago, but were then considered “undevelopable”.
• TNK-BP is using leading technology such as 3D seismic reservoir modeling, horizontal access, water injection and other enhanced recovery methods which has allowed us to revaluate the field’s potential.
• Currently drilling and production is underway in the least complex segments.
• Accelerated / select Phased developed approach being proven and pursued
NovosibirskNovosibirsk
TyumenTyumen
NyaganNyagan
• Total Phase I & Phase II capex: c. $4 bn
• Plateau production Phase I & II: c. 8 - 10 mln tons per annum (or c. 160 – 200 th. bopd)

25
Margin enhancement• Before 2006 key driver was optimisation of crude export routes via scarce pipeline capacity
• Export tax regime now favours refined product exports; refined product sales generated the highest netback in 2006 compared to other channels
• Pipeline export volumes are no longer constrained by Transneft capacity and have also experienced strong growth while rail and river crude export volumes have been reduced and redirected to domestic refining
• Domestic crude sales yield netbacks similar to pipeline exports
Far-abroad pipeline exports
Refined product sales Domestic sales CIS exports (incl. deliveries to LINOS)
Far-abroad rail & river exports
2006 avg $31.6/bbl
2004 avg $19.1/bbl
Netbacks in 2006 vs. 2004 by direction of sales
Notes: Pattern-coloured bars represent 2004 netbacksSource: TNK-BP Estimates
Distribution of Crude Sales, %
Net
back
, US
$/bb
l
2004
2006
30%
32% 8%
8%17%
8%
35%
41% 11%
10%

26
Marketing Strategy• Developing company owned and operated retail network in
high growth markets
• Rationalizing legacy assets in core regions and divesting in low demand regions
• Utilizing our 2 distinct Brands in the highest growth and value metropolitan markets
• Applying fully consistent TNK and BP branded offers, facilities and services
• Strengthen TNK jobber program in advantaged supply regions
• Enhancing existing lubricants business
• Developing offers for growing B2B channel
• Building capabilities to sustain current operations and future business

27
Gas business• Strategic priority: transformation from an oil company into a major oil and gas company
• Resource-rich gas portfolio with two world-class fields in Yamal (Rospan) and in East Siberia (Kovykta)
• With approximately 8-9 bcm sold annually, TNK-BP commercial gas sales in 2006 were 385 billion cubic feet (10.9 bcm), 13% up compared to 2005
• TNK-BP gas business has the potential to produce 50 bcma or more by 2015
• We plan to reach 95% associated gas utilization by 2008-2009
Rospan(100% owned by
TNK-BP)
Rospan(100% owned by
TNK-BP)
2006 Year end SPE reserves (SEC booked annual = production)
• Gas – 18.6 trillion cubic feet (525 bcm, probable and possible)
• Liquids – 1.0 bln bbl of oil (proved, probable and possible)
Commercial gas sales of 98.9 billion cubic feet (2.8 bcm) in 2006
Associatedgas
Associatedgas
• Associated gas utilisation projects on track as a platform to increase gas production and sales and reduce flaring
• JV agreement signed with Sibur in November 2006 to process associated gas produced by TNK-BP in the Nizhnevartovsk region.

28
Governance
• Corporate Restructuring
• Management Information Systems
• Accounting Transformation Project
• Upstream Asset Based Organization
• Strengthening External Audit
• New Policies and Standards
• Enterprise-Wide Risk Management

29
Corporate Policies and Standards
Code ofBusinessPolicies
Corporate Standards
Other normative documentsprocedure, process map; instruction
technical standard
Administrative documentsan order; a directive; a resolution
Organizational documentsorganizational structure; terms of reference; staffing plan job description
Ethical Conduct
• Managing conflict of interest• Principles of business
operations• Business gifts and
entertainment
Employees
• Employees
Security
• Information Security• Assets classification for
security purposes
External relationships
• External corporate relations
Health, Safety & Environment
• Health, Safety & Environment
Control and Finance
• Internal Control and Finance• Internal documents
Operations
• Enterprise-Wide Risk Management
• Procurement of Material and Services
• Purchase and Sale of Hydrocarbon Transportation and Refining Services
• Integrity Management

30
Majors
• Reserves Management• Production Growth• Midstream Options• Value Chain Optimisation
WACC reduction on:• Transparency• Governance
Control• Performance Mgt
Significant value upside
R / P Management
Netback enhancement
Market liberalisation
Gap due to:• Lower
diversification;• Value chain
limitations;• Distance to markets
Emerging Market company valuation ceiling; RF Progressive Tax
Corporate Governance
Country Risk
$2 / boe
Day 1 Sept 04
$12 / boe
$17 / boe
$3 / boe
$5 / boe
2006
TNK-BP

31
Summary
• Quality opportunity set
• High quality skilled workforce
• Resource base confirmed and robust
• Right technology application can deliver
• Focus on margin enhancement via channel optimization
• Gas will become increasingly important
• Governance progressing, more to do