Three-dimensionacultl esur modeling premalignant...
15
DOI 10.1515/hsz-2012-0252 Biol. Chem. 2012; 393(12): 1405–1416 Stefanie R. Mullins a , Mansoureh Sameni, Galia Blum b , Matthew Bogyo, Bonnie F. Sloane and Kamiar Moin* Three-dimensional cultures modeling premalignant progression of human breast epithelial cells: role of cysteine cathepsins Abstract: The expression of the cysteine protease cathep- sin B is increased in early stages of human breast cancer. To assess the potential role of cathepsin B in premalignant progression of breast epithelial cells, we employed a 3D reconstituted basement membrane overlay culture model of MCF10A human breast epithelial cells and isogenic vari- ants that replicate the in vivo phenotypes of hyperplasia (MCF10AneoT) and atypical hyperplasia (MCF10AT1). MCF10A cells developed into polarized acinar struc- tures with central lumens. In contrast, MCF10AneoT and MCF10AT1 cells form larger structures in which the lumens are filled with cells. CA074Me, a cell-permeable inhibitor selective for the cysteine cathepsins B and L, reduced proliferation and increased apoptosis of MCF10A, MCF10AneoT and MCF10AT1 cells in 3D culture. We detected active cysteine cathepsins in the isogenic MCF10 variants in 3D culture with GB111, a cell-permeable activity- based probe, and established differential inhibition of cathepsin B in our 3D cultures. We conclude that cathepsin B promotes proliferation and premalignant progression of breast epithelial cells. These findings are consistent with studies by others showing that deletion of cathepsin B in the transgenic MMTV-PyMT mice, a murine model that is predisposed to development of mammary cancer, reduces malignant progression. Keywords: activity-based probes; breast cancer; cysteine cathepsins; premalignant progression; protease inhibitors. a Present Address: MedImmune, Cambridge, UK b Present Address: School of Pharmacy, Institute for Drug Research, Hebrew University of Jerusalem, Jerusalem, Israel *Corresponding author: Kamiar Moin, Barbara Ann Karmanos Cancer Institute, Wayne State University School of Medicine, Detroit, MI 48201, USA; and Department of Pharmacology, Wayne State University School of Medicine, Detroit, MI 48201, USA, e-mail: [email protected] Stefanie R. Mullins: Barbara Ann Karmanos Cancer Institute, Wayne State University School of Medicine, Detroit, MI 48201, USA Mansoureh Sameni: Department of Pharmacology, Wayne State University School of Medicine, Detroit, MI 48201, USA Galia Blum: Departments of Microbiology & Immunology and Pathology, Stanford University School of Medicine, Stanford, CA 94305, USA Matthew Bogyo: Departments of Microbiology & Immunology and Pathology, Stanford University School of Medicine, Stanford, CA 94305, USA Bonnie F. Sloane: Barbara Ann Karmanos Cancer Institute, Wayne State University School of Medicine, Detroit, MI 48201, USA; and Department of Pharmacology, Wayne State University School of Medicine, Detroit, MI 48201, USA Introduction Cysteine cathepsins are papain-like cysteine proteases that function in protein turnover and degradation within endosomal-lysosomal vesicles (for reviews see Mohamed and Sloane, 2006; Reiser et al., 2010; Turk et al., 2012). Studies in knockout mice have identified both unique and redundant physiological functions for these cysteine cathepsins. For example, cathepsin B-deficient mice appear normal, yet are resistant to pathological stresses such as pancreatitis and liver injury (Halangk et al., 2000; Guicciardi et al., 2001). In cathepsin L-deficient mice there is hyperproliferation of keratinocytes, resulting in disreg- ulation of their hair cycle because of altered trafficking of EGF and the EGF receptor, as well as progressive dilated cardiomyopathy (Reinheckel et al., 2005). When cath- epsin B- and L-deficient mice are crossed, they develop severe brain and neural abnormalities that result in death shortly after birth (Felbor et al., 2002). Cysteine cathepsins have been implicated in diseases such as atherosclerosis, osteoarthritis and osteoporosis. Cathepsin K inhibitors are in clinical trials for the treatment of osteoporosis, osteoarthritis and bone metastasis, caused by the high levels of expression of cathepsin K in osteoclasts and the role of this enzyme in bone resorption (Felbor et al., 2002; Abbenante and Fairlie, 2005). Inhibitors of cathepsin S have been tested for the treatment of psoriasis and osteo- arthritis (Yasuda et al., 2005). In addition, cysteine cath- epsins are being studied as potential diagnostic targets. Brought to you by | Stanford University Authenticated | 171.67.216.22 Download Date | 9/5/13 12:11 PM
-
Upload
hoangkhanh -
Category
Documents
-
view
231 -
download
2
Transcript of Three-dimensionacultl esur modeling premalignant...
DOI 10.1515/hsz-2012-0252 Biol. Chem. 2012; 393(12): 1405–1416
Stefanie R. Mullins a , Mansoureh Sameni , Galia Blum b , Matthew Bogyo , Bonnie F. Sloane
and Kamiar Moin *
Three-dimensional cultures modeling premalignant progression of human breast epithelial cells: role of cysteine cathepsins
Abstract: The expression of the cysteine protease cathep-
sin B is increased in early stages of human breast cancer.
To assess the potential role of cathepsin B in premalignant
progression of breast epithelial cells, we employed a 3D
reconstituted basement membrane overlay culture model
of MCF10A human breast epithelial cells and isogenic vari-
ants that replicate the in vivo phenotypes of hyper plasia
(MCF10AneoT) and atypical hyperplasia (MCF10AT1).
MCF10A cells developed into polarized acinar struc-
tures with central lumens. In contrast, MCF10AneoT
and MCF10AT1 cells form larger structures in which the
lumens are filled with cells. CA074Me, a cell-permeable
inhibitor selective for the cysteine cathepsins B and L,
reduced proliferation and increased apoptosis of MCF10A,
MCF10AneoT and MCF10AT1 cells in 3D culture. We
detected active cysteine cathepsins in the isogenic MCF10
variants in 3D culture with GB111, a cell-permeable activity-
based probe, and established differential inhibition of
cathepsin B in our 3D cultures. We conclude that cathepsin
B promotes proliferation and premalignant progression of
breast epithelial cells. These findings are consistent with
studies by others showing that deletion of cathepsin B in
the transgenic MMTV-PyMT mice, a murine model that is
predisposed to development of mammary cancer, reduces
malignant progression.
Keywords: activity-based probes; breast cancer; cysteine
cathepsins; premalignant progression; protease inhibitors.
a Present Address: MedImmune, Cambridge, UK
b Present Address: School of Pharmacy, Institute for Drug Research,
Hebrew University of Jerusalem, Jerusalem, Israel
*Corresponding author: Kamiar Moin, Barbara Ann Karmanos
Cancer Institute , Wayne State University School of Medicine,
Detroit, MI 48201, USA ; and Department of Pharmacology , Wayne
State University School of Medicine, Detroit, MI 48201, USA ,
e-mail: [email protected]
Stefanie R. Mullins: Barbara Ann Karmanos Cancer Institute , Wayne
State University School of Medicine, Detroit, MI 48201, USA
Mansoureh Sameni: Department of Pharmacology , Wayne State
University School of Medicine, Detroit, MI 48201, USA
Galia Blum: Departments of Microbiology & Immunology and
Pathology , Stanford University School of Medicine, Stanford, CA
94305 , USA
Matthew Bogyo: Departments of Microbiology & Immunology and
Pathology , Stanford University School of Medicine, Stanford, CA
94305 , USA
Bonnie F. Sloane: Barbara Ann Karmanos Cancer Institute , Wayne
State University School of Medicine, Detroit, MI 48201, USA ; and
Department of Pharmacology , Wayne State University School of
Medicine, Detroit, MI 48201, USA
Introduction Cysteine cathepsins are papain-like cysteine proteases
that function in protein turnover and degradation within
endosomal-lysosomal vesicles (for reviews see Mohamed
and Sloane , 2006 ; Reiser et al. , 2010 ; Turk et al. , 2012 ).
Studies in knockout mice have identified both unique
and redundant physiological functions for these cysteine
cathepsins. For example, cathepsin B-deficient mice
appear normal, yet are resistant to pathological stresses
such as pancreatitis and liver injury (Halangk et al. , 2000 ;
Guicciardi et al. , 2001 ). In cathepsin L-deficient mice there
is hyperproliferation of keratinocytes, resulting in disreg-
ulation of their hair cycle because of altered trafficking of
EGF and the EGF receptor, as well as progressive dilated
cardiomyopathy (Reinheckel et al., 2005). When cath-
epsin B- and L-deficient mice are crossed, they develop
severe brain and neural abnormalities that result in death
shortly after birth (Felbor et al. , 2002 ).
Cysteine cathepsins have been implicated in diseases
such as atherosclerosis, osteoarthritis and osteoporosis.
Cathepsin K inhibitors are in clinical trials for the treatment
of osteoporosis, osteoarthritis and bone metastasis, caused
by the high levels of expression of cathepsin K in osteoclasts
and the role of this enzyme in bone resorption (Felbor et al. ,
2002 ; Abbenante and Fairlie , 2005 ). Inhibitors of cathepsin
S have been tested for the treatment of psoriasis and osteo-
arthritis (Yasuda et al. , 2005 ). In addition, cysteine cath-
epsins are being studied as potential diagnostic targets.
Brought to you by | Stanford UniversityAuthenticated | 171.67.216.22
Download Date | 9/5/13 12:11 PM
1406 S.R. Mullins et al.: Cysteine cathepsins in a 3D model of premalignant progression
Cathepsin L and S appear to be promising biomarkers for
atherosclerosis because of their increased expression in the
serum of patients with atherosclerotic stenosis (Liu et al.,
2006a, b; Lutgens et al. , 2007 ; Reiser et al. , 2010 ). Cathepsin
B is being targeted for diagnostic imaging in atherosclerosis
and cancer (Chen et al. , 2002 ; Alencar et al. , 2007 ). In a xen-
ograft model of colon cancer, a cathepsin B-activated smart
near-infrared probe accumulating in the tumor, detected
30-fold greater enzyme activity than in control animals
(Alencar et al. , 2007 ), suggesting the potential promise of
diagnostic imaging of cathepsin B.
Seven cysteine cathepsins have been linked to breast
cancer progression: cathepsins B, L, H, K, S, V and X
(for review see Watson and Kreuzaler , 2009 ). Microarray
analy ses identified cathepsin B as a gene which is highly
expressed in ductal breast carcinoma as compared with
lobular breast carcinoma (Wulfkuhle et al., 2002 ; Korkola
et al. , 2003 ). Proteomic analyses of matched normal and
ductal carcinoma in situ breast tissue revealed an increase
in the expression of cathepsin B protein in premalignant
ductal carcinoma in situ lesions (Zajc et al. , 2002 ). Compar-
ison of the MCF-10F breast epithelial cell line to the same
cell line transformed with the c-Ha-ras oncogene and then
treated with DMBA (7,12-dimethylbenz[a]anthracene) dem-
onstrated that both cathepsin B and cathepsin L protein
levels increase in parallel with an increase in invasiveness
(Premzl et al. , 2001 ). Indeed a role for cysteine cathepsins
in breast cancer invasion was postulated because of the
ability of these enzymes to degrade extracellular matrix
(Obermajer et al. , 2008 ) and was shown for cathepsin B in
the invasion of MCF10A variants by using small molecule
inhibitors selective for cathepsin B (Bervar et al. , 2003 ).
Animal studies have indicated that cysteine cath-
epsins may be involved at an earlier stage in tumor progres-
sion than invasion. For example, in a transgenic mouse
model for pancreatic islet carcinogenesis – RIP1-Tag2 – a
role for cysteine cathepsins in proliferation, tumor growth
and vascularity, as well as invasion, was demonstrated
(Joyce et al. , 2004 ; Gocheva et al. , 2006 ; Vasiljeva et al. ,
2006 ; Wang et al. , 2006 ). In the MMTV-PyMT transgenic
mouse model of breast cancer, a deficiency in cathepsin B
expression has been shown to decrease tumor onset and
growth rate (Vasiljeva et al. , 2006 ), whereas transgenic
expression of cathepsin B has been shown to increase pro-
liferation and promote progression (Sevenich et al. , 2011 ).
Elegant studies by Bissell and colleagues have shown
that 3D cultures of breast epithelial cells can be used to
analyze morphogenesis and functional differentiation
(Lo et al. , 2012 ) and 3D cultures of breast cancer cells are
predictive of clinical outcome (Martin et al. , 2008 ). We
and our colleagues (Li et al. , 2010 ) have shown that 3D
cultures of breast cells can be used to analyze kinase path-
ways and resistance to cytotoxic therapy. In the present
study, we analyzed the morphogenesis of a series of iso-
genic cell lines that represent stages prior to and early in
premalignant progression: the non-tumorigenic MCF10A,
c-H-ras transformed MCF10AneoT (Basolo et al. , 1991 ;
Miller et al. , 1993 ) and non-invasive MCF10AT1 (Miller
et al. , 1993 ) and the role of cysteine cathepsins in the mor-
phogenesis of these lines. We grew the MCF10A variants in
3D reconstituted basement membrane (rBM) overlay cul-
tures, using methods optimized by Brugge and colleagues
(Debnath et al. , 2003 , 2005 ) for analysis of the morpho-
genesis of MCF10A cells, and found that a selective inhibi-
tor that targets intracellular cathepsin B reduced prolif-
eration and increased apoptosis.
Results
Three-dimensional rBM overlay cultures model premalignant progression of breast epithelium
We extended the 3D rBM overlay culture system devel-
oped by Brugge and colleagues for MCF10A cells (Debnath
et al. , 2003 ) to include premalignant isogenic 10A vari-
ants, i.e., MCF10AneoT and MCF10AT1. As a baseline, we
first established the levels of expression and localization
of cathepsin B in the MCF10 variants at various time points
(Supplementary Figure 1 ). We also confirmed that, in our
hands, the MCF10A cells develop into polarized acini
( Figure 1A – C ) in which central lumens are surrounded by
a single layer of epithelial cells (Figure 1A) and cells within
the lumen undergo apoptosis (Figure 1B). We have shown
previously that MCF10A cells form polarized structures
by staining for β 1 integrin (Sameni et al. , 2012 in press).
Here, we confirm formation of polarized acini by staining
for the basal marker α 6 integrin (Figure 1B) (Nedvetskey
et al., 2012). The MCF10AneoT and MCF10AT1 cells, in
contrast to the MCF10A cells, grow into larger structures
that lack a central hollow lumen (Figure 1D – E, respec-
tively). MCF10AT1 cells can also form multi-acinar struc-
tures that do not have central lumens (Li et al. , 2008 )
(Figure 1F – G). This is consistent with the behavior of
these cells in vivo as subcutaneous xenografts where
MCF10AneoT and MCF10AT1 cells form simple ducts that
progress to benign hyperplastic and atypical hyperplastic
lesions, respectively (Dawson et al. , 1996 ). Thus, we have
in hand an in vitro model system that recapitulates the
premalignant progression of breast epithelium.
Brought to you by | Stanford UniversityAuthenticated | 171.67.216.22
Download Date | 9/5/13 12:11 PM

S.R. Mullins et al.: Cysteine cathepsins in a 3D model of premalignant progression 1407
Effect of cysteine protease inhibitors on MCF10A variants in 3D rBM overlay culture
Proteases of multiple classes including cysteine cath-
epsins have been implicated in the normal physiology and
pathogenesis of the mammary gland (Khokha and Werb ,
2011 ; Sloane , 2012 ). When cathepsin B-deficient mice
are crossed with MMTV-PyMT mice that are predisposed
to development of mammary carcinomas, the prolifera-
tion of primary tumors and lung metastases is reduced
(Vasiljeva et al. , 2008 ). In the skin, deficiencies in cathep-
sin L promote proliferation of keratinocytes (Reinheckel
et al. , 2005 ) and progression of squamous cell carcinoma
(Dennemarker et al., 2010), suggesting that cathepsin L
may play a protective or anti-tumor role. In a mouse model
for pancreatic ductal adenocarcinoma, loss of cathepsin
B leads to increases in the levels of active cathepsin L
(Gopinathan et al. , 2012 ). Thus, the interactions between
these two cysteine cathepsins may regulate the prolifera-
tion of tumors.
We examined the effect of inhibiting cysteine cath-
epsin activity on the morphogenesis of MCF10 variants
grown in 3D rBM overlay culture. The two inhibitors we
used were: E-64d, a broad-spectrum cell-permeable inhib-
itor of cysteine proteases (McGowan et al. 1989 ; Wilcox
and Mason 1992 ) and CA074Me, a selective cell-permeable
inhibitor of cysteine cathepsins B and L (Montaser et al. ,
2002 ). At 4 days, we assessed the polarity by staining for
the basal marker α 6 integrin (Figure 1F) (Nedvetsky et al. ,
2012 ) and GM130, a marker for the apical orientation of
the Golgi apparatus (Figure 1G); proliferation by staining
for Ki67 (Figure 1G); and apoptosis by staining for cleaved
caspase-3 (Figure 1F) (Debnath et al. 2003 ). Neither polari ty
nor apoptosis was affected by incubation with E64d or
CA074Me. Similar results were obtained in cultures grown
for 8, 12 and 16 days (data not shown). The presence of
Day 4
10 A
A
F G
B C D E
neoT
AT1
DMSO E64d CA074Me DMSO E64d CA074Me
Day 8 Day 12
Figure 1 In 3D rBM overlay culture, MCF10A cells form polarized acini with hollow central lumens (A – C), whereas MCF10AneoT (D) and
MCF10AT1 (E) cells do not.
Structures in (A) were stained for smooth muscle actin (phalloidin, green) and nuclei (propidium iodide, red). Bars, 20 μ m. In 12-day
cultures (B), apoptosis of cells in the central lumen, as shown by staining for cleaved caspase 3 (green), was observed. Nuclei (DAPI, blue)
were located adjacent to the basal membrane, which is stained here for α 6 integrin (red). Bar, 10 μ m. (C – E) depict optical sections, taken
at the equatorial plane of representative structures at 8 days of culture, of the actin cytoskeleton (phalloidin) of MCF10A, MCF10AneoT and
MCF10AT1 structures, respectively. Bar, 20 μ m. Panels (F) and (G) show that protease inhibitors did not affect the development of MCF10A
isogenic variants in 3D rBM overlay culture. Immunofluorescence staining was performed on day 4 structures using antibodies against
(F) α 6 integrin (red) and cleaved caspase 3 (green) or (G) GM130 (red) and Ki67 (green). Nuclei were stained with DAPI (blue). Cells were
grown in the presence of 0.1 % DMSO, 5 μ m E64d or 5 μ m CA074Me. Images represent a single confocal section at the equatorial plane of
the structures. Bar, 20 μ m.
Brought to you by | Stanford UniversityAuthenticated | 171.67.216.22
Download Date | 9/5/13 12:11 PM

1408 S.R. Mullins et al.: Cysteine cathepsins in a 3D model of premalignant progression
Ki67 staining in cultures incubated with the protease
inhibitors suggested that the cells remained able to prolife-
rate. The size of structures formed by the MCF10 variants
incubated with E64d was variable (Figure 1F and G). In
contrast, the size of structures formed by the MCF10 vari-
ants incubated with CA074Me was much smaller than that
of controls (Figure 1F and G).
To quantify the effect of the inhibitors on structure
size, we measured the equatorial areas of ten structures
after 8 days in culture (Figure 2 ). The broad-spectrum
inhibitor, E64d, even at a 10-fold higher concentration
than CA074Me, did not affect structure size. Conversely,
structures grown in the presence of CA074Me were signifi-
cantly smaller than control structures grown in the pre-
sence of the diluent. Cell-impermeable or non-methylated
forms of E64d and CA074Me, i.e., E64 and CA074, did not
affect proliferation of MCF10 variants in 3D rBM overlay
culture (Table 1 ).
Because of the dramatically reduced size of structures
in the presence of CA074Me, we also quantified the effect
of inhibitor treatment on proliferation by measuring Ki67
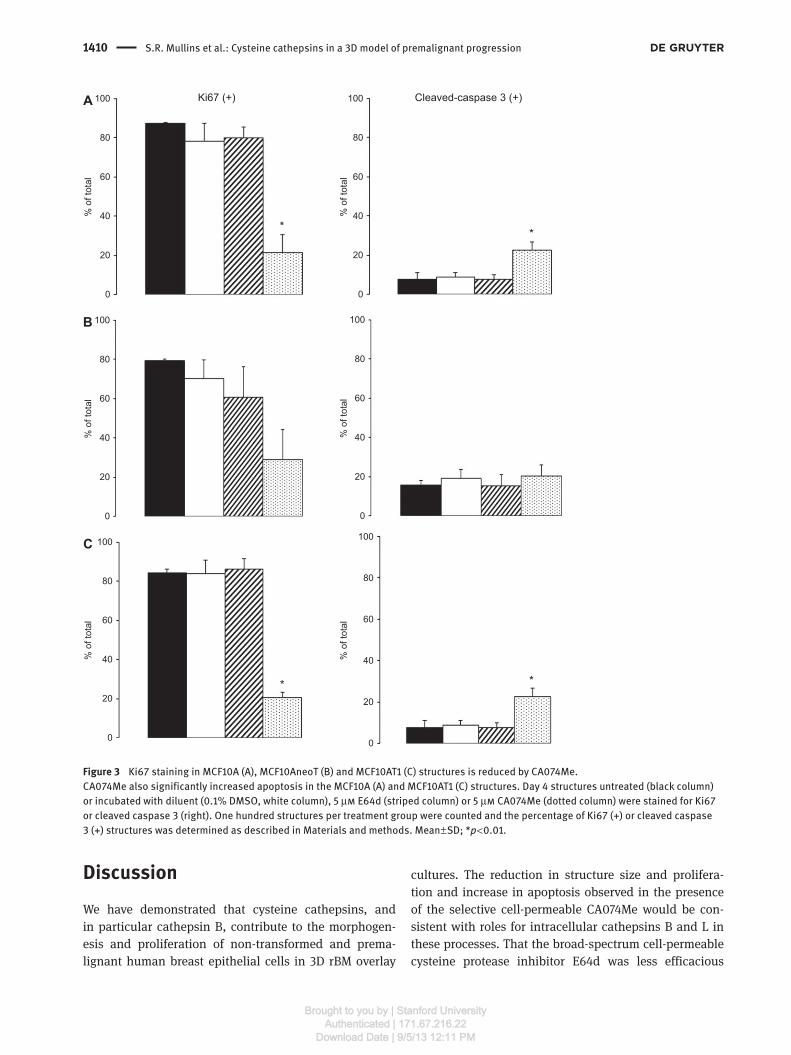
expression (Figure 3 ). CA074Me significantly reduced the
percentage of MCF10A and MCF10AT1 structures positive
for Ki67 and showed a trend to reduction of the percent-
age of MCF10AneoT structures positive for Ki67 (Figure 3,
left panel). These results are consistent with a decrease in
cell proliferation being responsible for the smaller size of
the structures. In contrast, E64d had no effect on the per-
centage of Ki67 positive structures (Figure 3, left panel). To
determine whether the change in structure size might be
related to increased apoptosis, we assessed the percent-
age of structures positive for cleaved caspase 3 for MCF10
variants grown in 3D rBM overlay culture in the presence
and absence of cysteine protease inhibitors (Figure 3, right
panel). The percentage of structures positive for cleaved
caspase 3 was higher for all MCF10 variants, but only sig-
nificantly elevated for the MCF10A and MCF10AT1 variants.
MTT [3-(4,5-dimethylthiazol-2-yl)-2,5 diphenyltetrazo-
lium bromide] assays were performed to further analyze
the effects of inhibitors on the proliferation of MCF10A,
MCF10AneoT and MCF10AT1 cells. We first examined the
effects in 2D monolayer cultures incubated with E64d
or CA074Me at a series of concentrations. E64d did not
affect proliferation (Supplementary Figure 2A ). Only the
highest concentration (10 μ m ) of CA074Me significantly
inhibited the proliferation of MCF10A (Supplementary
Figure 2B). Similar results were observed for MCF10AneoT
and MCF10AT1 cells in 2D culture (data not shown). We
adapted the MTT assays to the analysis of 3D rBM overlay
cultures as described in Materials and methods. A 10 μ m
concentration of CA074Me reduced the proliferation of
2.0A
B
C
1.5
1.0
Fold
cha
nge
0.5
0DMSO 100 μM E64d 10 μM CA074Me
*
2.0
1.5
1.0
Fold
cha
nge
0.5
0DMSO 100 μM E64d 10 μM CA074Me
*
2.0
1.5
1.0
Fold
cha
nge
0.5
0DMSO 100 μM E64d 10 μM CA074Me
*
Figure 2 Sizes of structures formed by MCF10A (A), MCF10A neoT
(B) or MCF10AT1 (C) cells are significantly reduced when grown for
8 days in the presence of CA074Me (10 μ m ).
The slight reduction in structure size in the presence of E64d
(100 μ m ) was not significant. Equatorial areas of ten acini per treat-
ment group were measured as described in Materials and methods.
Data are expressed as fold change (mean ± SD; * p < 0.001) in the area
of the structures treated with protease inhibitor as compared to the
area of the structures treated with diluent 0.1 % DMSO.
MCF10A, MCF10AneoT and MCF10AT1 cells in 3D rBM
overlay culture (Figure 4 ). In contrast E64d at a concentra-
tion of 100 μ m did not inhibit proliferation (Figure 4).
We also tested a variety of other protease inhibitors for
their ability to affect cell proliferation using MTT assays
(Table 1). Protease inhibitors shown to decrease cell pro-
liferation were: PD150606, an inhibitor of calpains, a
family of calcium-dependent cysteine proteases; GM6001,
Brought to you by | Stanford UniversityAuthenticated | 171.67.216.22
Download Date | 9/5/13 12:11 PM

S.R. Mullins et al.: Cysteine cathepsins in a 3D model of premalignant progression 1409
a broad-spectrum MMP inhibitor; SB3CT, an MMP inhibi-
tor with selectivity toward MMP 2 and 9 (Kleifeld et al. ,
2001 ); and Cbz-Phe-Ser(OBzl)-CHN 2 , a cysteine protease
inhibitor with selectivity for cathepsins B and L (Seyfried
et al. , 2001 ). In contrast, two inhibitors of cathepsin L
[Cbz-Phe-Phe(pNO 2 )-CHN
2 and Cbz-Phe-Tyr(OtBu)-CHN
2 ]
did not have any effect. These results implicate proteases
in addition to cathepsin B in proliferation of the MCF10
variants. As the cell-impermeable cathepsin B inhibitor,
CA074, and the cell-impermeable cysteine protease inhibi-
tor, E64, did not have any effect, our results support intra-
cellular rather than secreted cysteine cathepsins playing a
role in proliferation of the MCF10 variants.
Effects of cysteine protease inhibitors on cell viability
We used calcein AM and ethidium homodimer-1 to dif-
ferentiate live and dead cells, respectively, growing in 3D
rBM overlay cultures of MCF10 variants (Supplementary
Figure 3 ). Only a few dead cells could be observed in cul-
tures incubated with inhibitors. As indicated above, the
percentage of structures positive for cleaved caspase 3
was higher for all MCF10 variants, but only significantly
elevated for the MCF10A and MCF10AT1 variants (Figure 3,
right panel), confirming that the effect was not caused by
an adverse effect of the inhibitor on the cells directly.
Defining targets of CA074Me and E64d in 3D rBM overlay cultures of MCF10 variants with activity-based probes
In the studies above, greater effects were observed in
cultures incubated with CA074Me than with E64d. To
Inhibitor Target Highest concentration tested Inhibits proliferation
E64 Cysteine proteases 10 μ m –
E64d (intracellular) Cysteine proteases 100 μ m –
CA074 CTSB 10 μ m –
CA074Me (intracellular) CTSB, CTSL 50 μ m +
Cbz-Phe-Ser(OBzl)-CHN 2 CTSB, CTSL 20 μ m +
Cbz-Leu-Leu-Tyr-CHN 2 CTSB, CTSL, calpain 20 μ m +
Cbz-Phe-Phe(pNO 2 )-CHN
2 CTSL 20 μ m –
Cbz-Phe-Tyr(OtBu)-CHN 2 CTSL 20 μ m –
PD 150606 Calpain 100 μ m +
GM6001 MMPs 100 μ m +
SB3CT MMP-2 and -9, TACE 50 μ m +
Table 1 Effect of protease inhibitors on proliferation.
determine whether our findings reflected differential
effects of CA074Me and E64d on cathepsins B and L in
the MCF10 variants grown in 3D rBM overlay culture,
we used GB111, an activity-based probe (ABP) that cova-
lently binds to the active site of cysteine cathepsins
(Blum et al. , 2005 ). The active cysteine cathepsins
labeled by GB111 in the three MCF10 variants were of
similar molecular size (Figure 5 A). To identify the differ-
ent molecular weight bands labeled by GB111 (Figure 5B,
lane 3), we pretreated MCF10A 3D rBM overlay cul-
tures with cysteine protease inhibitors and harvested
cell lysates. We observed that 10 μ m CA074Me reduced
labeling of the 31 and 28 kDa bands (Figure 5B, lane 5),
whereas 10 μ m E64d reduced labeling of the 33 and 28
kDa bands (Figure 5B, lane 6). Even at a 10-fold higher
concentration, pretreatment with E64d did not elimi-
nate labeling of the 31 kDa band (Figure 5C). This band
was presumed to represent the single chain active form
of cathepsin B, which in tumors runs at ~ 31 kDa (Moin
et al. , 1992 ). Indeed, GB111 labeled a 31 kDa band in lanes
containing the single chain active form of recombinant
cathepsin B (Figure 5B, lane 1 and 5C, lane 7). We further
verified that the 31 kDa band labeled by GB111 in the 3D
cultures was cathepsin B by immunoprecipitation with
a cathepsin B antibody (Figure 5D). In contrast to the
observed differential efficacy in blocking binding of
GB111 to 31 kDa single chain cathepsin B, CA074Me and
E64d both blocked binding of GB111 to a 28 kDa band,
which was verified to be cathepsin L by immunoprecipi-
tation with a cathepsin L antibody (Figure 5E). GB111
labeling demonstrated that the targets of CA074Me and
E64d in lysates of 3D rBM overlay cultures of MCF10neoT
and MCF10AT1 cells were the same as in MCF10A cells
(data not shown). Our results are consistent with E64d
being less efficacious than CA074Me against cathepsin
B (at least under the conditions studied here).
Brought to you by | Stanford UniversityAuthenticated | 171.67.216.22
Download Date | 9/5/13 12:11 PM
1410 S.R. Mullins et al.: Cysteine cathepsins in a 3D model of premalignant progression
Discussion We have demonstrated that cysteine cathepsins, and
in particular cathepsin B, contribute to the morphogen-
esis and proliferation of non-transformed and prema-
lignant human breast epithelial cells in 3D rBM overlay
cultures. The reduction in structure size and prolifera-
tion and increase in apoptosis observed in the presence
of the selective cell-permeable CA074Me would be con-
sistent with roles for intracellular cathepsins B and L in
these processes. That the broad-spectrum cell-permeable
cysteine protease inhibitor E64d was less efficacious
100A
B
C
Ki67 (+) Cleaved-caspase 3 (+)
80
60
% o
f tot
al
40
20
*
0
100
80
60
% o
f tot
al
40
20
*
0
100
80
60
% o
f tot
al
40
20*
0
100
80
60
% o
f tot
al
40
20
0
100
80
60
% o
f tot
al
40
20
*
0
100
80
60
% o
f tot
al
40
20
0
Figure 3 Ki67 staining in MCF10A (A), MCF10AneoT (B) and MCF10AT1 (C) structures is reduced by CA074Me.
CA074Me also significantly increased apoptosis in the MCF10A (A) and MCF10AT1 (C) structures. Day 4 structures untreated (black column)
or incubated with diluent (0.1 % DMSO, white column), 5 μ m E64d (striped column) or 5 μ m CA074Me (dotted column) were stained for Ki67
or cleaved caspase 3 (right). One hundred structures per treatment group were counted and the percentage of Ki67 ( + ) or cleaved caspase
3 ( + ) structures was determined as described in Materials and methods. Mean ± SD; * p < 0.01.
Brought to you by | Stanford UniversityAuthenticated | 171.67.216.22
Download Date | 9/5/13 12:11 PM

S.R. Mullins et al.: Cysteine cathepsins in a 3D model of premalignant progression 1411
seemed puzzling. To our knowledge, our studies here,
using a combination of an ABP (GB111) and immunopre-
cipitation, are the first to establish that E64d is a less
effective inhibitor of cathepsin B than of cathepsin L. The
lack of membrane permeability of some inhibitors, e.g.,
CA074 and E64, does not preclude their eventual uptake
via other mechanisms such as endocytosis; nonetheless,
these inhibitors did not affect proliferation of the MCF10
variants (Table 1). On the basis of these findings, we con-
clude that intracellular cathepsin B plays a functional
role in the proliferation and premalignant progression of
human breast epithelial cells.
The role that cysteine cathepsins play in cell prolifera-
tion may differ based on the system analyzed, and is likely
complicated by the ability of these proteases to perform
redundant functions. Although cathepsin B knockout and
cathepsin L knockout mice are both viable, the double
knockout of cathepsins B and L is lethal (Felbor et al. ,
2002 ), thus supporting functional redundancy of the two
proteases. Both cathepsins B and L have been shown to
promote cell proliferation and tumor growth in the RIP1-
Tag2 transgenic mouse model for pancreatic islet carcino-
genesis (Gocheva et al. , 2006 ). In contrast, cathepsin L
plays a protective or anti-proliferative role in mouse
models for skin cancer, as a deficiency in cathepsin L pro-
motes progression and metastasis (Dennem ä rker et al.,
2010 ; Benavides et al. , 2011 ). These findings are consist-
ent with studies in cathepsin L knockout mice that dem-
onstrate increased proliferation of keratinocytes caused
by altered turnover of EGF and its receptor (Reinheckel
et al. , 2005 ). Studies in murine transgenic models for
mammary carcinoma have definitively linked cathepsin B
to proliferation and progression of these tumors (Vasiljeva
et al. , 2006, 2008 ; Sevenich et al. , 2011 ). Interestingly, a
recent study in a murine transgenic model for pancreatic
ductal adenocarcinoma has established that cathepsin B
increases proliferation and progression of these tumors in
part by negatively regulating the levels of active cathepsin
L (Gopinathan et al. , 2012 ). Although a reduction in cathepsin
B activity has been associated with increased apoptosis
(Gocheva et al. , 2006 ), others have shown that cathep-
sin B induces apoptosis (Kroemer and Jaattela , 2005 ; for
a general review on lysosomal cathepsins and cell death,
see Repnik et al. , 2012 ). Also of note is that cathepsin X
has been shown to compensate for cathepsin B in tumors
(for review see, Watson and Kreuzaler , 2009 ). Clearly, the
roles of proteases, including those of cysteine cathepsins,
in normal cellular function as well as malignant progres-
sion, are complicated. Delineation by multiple techniques
of the functions of individual proteases is critically needed
if we are to develop therapies targeted against proteases.
1.6A
B
C
1.2
0.8
0.4
0Day 1 Day 3 Day 5 Day 7
*
*
Fold
cha
nge
1.6
1.2
0.8
0.4
0Day 1 Day 3 Day 5 Day 7
**
Fold
cha
nge
1.6
1.2
0.8
0.4
0Day 1 Day 3 Day 5 Day 7
**
Fold
cha
nge
Figure 4 CA074Me decreases proliferation of MCF10A (A),
MCF10AneoT (B) and MCF10AT1 (C) cells grown in 3D rBM overlay
culture.
Cultures were grown in the presence of 100 μ m E64d ( □ ) or 10 μ m
CA074Me ( □ ) and MTT assays performed on days 1, 3, 5 and 7 post-
seeding. Fold change was compared to diluent control [DMSO, ( ○ )].
Mean ± SD; * p < 0.001.
Brought to you by | Stanford UniversityAuthenticated | 171.67.216.22
Download Date | 9/5/13 12:11 PM

1412 S.R. Mullins et al.: Cysteine cathepsins in a 3D model of premalignant progression
Materials and methods
Materials Dulbecco ’ s modifi ed Eagles medium/F12, hydrocortisone, insulin from
bovine pancreas, BSA, MTT were obtained from Sigma (St. Louis, MO).
Antibiotic-antimycotic (100 × ), Slowfade antifade reagent, and horse
serum were from Invitrogen (Carlsbad, CA). Epidermal growth factor
was from Upstate Cell Signaling Solutions (Lake, Placid, NY). Cultrex
was from Trevigen (Gaithersburg, MD). Phalloidin, Slowfade antifade
reagent, and LIVE/DEAD Viability/Cytotoxicity Kits for Animal Cells
were from Life Technologies (Grand Island, NY). The CytoTox 96 ® Non-
Radioactive Cytotoxicity Assay Kit was from Promega (Madison, WI);
and Protein A/G Plus-Agarose beads were from Pierce (Rockford, IL).
CA-074, CA-074Me, E64, and E64d were purchased from Pep-
tides International (Louisville, KY); GM6001 from Chemicon (Temec-
ula, CA); and PD150606 from Calbiochem (San Diego, CA). GB111 was
a kind gift from Dr. Matthew Bogyo (Stanford University, Stanford,
CA). SB-3CT was a kind gift from Dr. Shahriar Mobashery (University
of Notre Dame, South Bend, IN, USA). Cbz-Phe-Ser(Obzl)-CHN 2 , Cbz-
Leu-Leu-Tyr-CHN 2 , Cbz-Phe-Phe(pNO
2 )-CHN
2 and Cbz-Phe-Tyr(OtBu)-
CHN 2 were kind gift s from Dr. John Anagli (Banyan Biomarkers,
Alachua, FL , USA).
The rabbit anti-human Ki-67 was purchased from Zymed Labo-
ratories (San Francisco, CA, USA); the mouse anti-human CD49f
( α 6) antibody was from Chemicon (Temecula, CA, USA); the mouse
anti-human GM130 was from BD Biosciences (San Jose, CA, USA). The
rabbit anti-human cleaved caspase 3 (Asp 175) was from Cell Signal-
ing Technology. The fl uorescein-conjugated affi nity-purifi ed donkey
anti-rabbit IgG, Texas red-conjugated affi nity-purifi ed donkey anti-
mouse and anti-rat IgG, and normal donkey serum were from Jackson
ImmunoResearch (West Grove, PA, USA). Mouse anti-human cathep-
sin L was a kind gift from Dr. Ekkehard Weber (Martin Luther Univer-
sity Halle-Wittenberg, Halle, Germany). Rabbit anti-human cathepsin
B was made and characterized in our laboratory (Moin et al. , 1992 ).
All other chemicals were obtained from Sigma (St. Louis, MO, USA).
Methods
Cell lines and culture
MCF10A cells were a kind gift from Dr. Joan Brugge (Harvard Univer-
sity, Cambridge, MA, USA). MCF10AneoT and MCF10AT1 cells were
obtained from the Cell Resources Core of the Barbara Ann Karmanos
Cancer Institute (Detroit, MI, USA). Isogenic MCF10A variants were
AT1neoT
36 k
28 k
20 k
AT1neoT10A
A
C D EB
36 k
28 k
20 k
1 2 3 4 5 6 7 8 9 10 11 12 13 14 15
10A
Figure 5 Active cysteine cathepsins in MCF10A variants were imaged and profiled with GB111.
(A) Labeling of cysteine cathepsins is illustrated in optical sections taken at the equatorial plane of representative 12-day 3D rBM overlay
cultures. Cultures were incubated with GB111 overnight; unbound probe was removed by washing; and labeled active cysteine cathepsins
(green) were imaged with a Zeiss LSM-510 META confocal microscope. Magnification, 40 × . Similar bands of active cysteine cathepsins
were labeled in the MCF10 variants (A, far right panel). Their identity as cysteine cathepsins was confirmed by inhibition of GB111 binding in
MCF10A cells (grown in 3D rBM overlay culture for 4 days prior to overnight incubation with GB111). Controls for these studies were recombinant
cathepsin B (lanes 1 and 7); untreated MCF10A cell lysates (lanes 3, 8, 10, and 13); DMSO pretreated MCF10A cell lysate (lane 4); and
MCF10A lysates after immunoprecipitation with preimmune IgG (lanes 11 and 14). Experimental lanes represent MCF10A lysates pretreated
with 10 μ m CA074Me (lane 5); 10 or 100 μ m E-64d (lanes 6 and 9, respectively); or subjected to immunoprecipitation with antibodies to
cathepsin B (lane 12) or cathepsin L (lane 15). Bands corresponding to cathepsin B and cathepsin L are designated by CB and CL, respectively.
Brought to you by | Stanford UniversityAuthenticated | 171.67.216.22
Download Date | 9/5/13 12:11 PM
S.R. Mullins et al.: Cysteine cathepsins in a 3D model of premalignant progression 1413
maintained in 2D monolayer cultures in DMEM/F12 supplemented
with 5 % horse serum, 20 ng/ml EGF, 10 μ g/ml bovine insulin, 0.5
μ g/ml hydrocortisone and 1 × antibiotic-antimycotic. Isogenic MCF10
variants were established in 3D rBM overlay cultures as has been de-
scribed for MCF10A cells (Li et al. , 2008 ). Briefl y, 12-mm round glass
coverslips were each coated with 40 μ l of ice-cold rBM (Cultrex) and in-
cubated at 37 ° C for 20 min to allow the rBM to solidify. The coated cov-
erslips were placed in a 24-well plate with the rBM facing up. A trypsi-
nized single cell suspension containing 5000 cells in a 40 μ l volume
of the assay medium (DMEM/F12 containing 2 % horse serum, 5 ng/ml
EGF, 0.5 μ g/ml hydrocortisone, 10 μ g/ml insulin, 50 U/ml penicillin
and 50 μ g/ml streptomycin, supplemented with 2 % (v/v) of Cultrex)
was carefully loaded on top of the rBM, and the plate was incubated
at 37 ° C for 30 min to let the cells attach. Then, 500 μ l of the assay
medium was added per well, and the cells were cultured at 37 ° C and
5 % CO 2 , with the medium being changed every 4 days.
Analysis of morphogenetic parameters of 3D rBM overlay cultures
The time-course of morphogenesis of isogenic MCF10 variants in 3D
rBM overlay culture was evaluated at 4, 8, 12 and 16 days. Where in-
dicated, inhibitors were added every 48 h to the cultures. Structure
size was assessed from equatorial areas of individual structures in ten
phase contrast images per cell line that were acquired on a Zeiss Axi-
ophot epifl uorescent microscope with a SPOT RT camera using a 40 × lens (Gottingen, Germany). Area in pixels was calculated by tracing the
outer perimeter of the structure using Adobe Photoshop 7.0 Soft ware.
Structure morphology was assessed by phalloidin staining of
the actin cytoskeleton. Structures were fi xed with 3.7 % formalde-
hyde for 10 min, permeabilized for 5 min with PBST (PBS with Tween
20) and blocked with 0.2 % BSA in PBST for 10 min. Samples were
then incubated with phalloidin at a 1:40 dilution in PBST for 1 h,
washed with PBST and imaged with a Zeiss LSM-510 META confocal
microscope (Gottingen, Germany).
Cell polarity was analyzed by staining for the apical marker
GM130 and the basal marker α 6 integrin (Debnath et al. , 2003 ).
Structures were fi xed with 2 % paraformaldehyde for 20 min, permea-
bilized for 5 min with 0.2 % Triton X-100 at 4 ° C, and washed with PBS
three times at 10 min/wash. Samples were then blocked for 1 h in IF
(immunofl uorescent) buff er (130 m m NaCl, 7 m m Na 2 HPO
4 , 3.5 m m
NaH 2 PO
4 , 7.7 m m NaN
3 , 0.1 % BSA, 0.2 % Triton X-100, 0.05 % Tween
20) and incubated with primary antibodies overnight at 4 ° C. Sam-
ples were then washed with IF buff er three times at 20 min/wash and
incubated with corresponding secondary antibodies for 2 h at room
temperature. This was followed by three washes with IF buff er at
10 min each. Coverslips were then incubated with DAPI in PBS for
10 min, washed three times with PBS and mounted on glass slides
with Slowfade antifade reagent. Structures were imaged with a Zeiss
LSM-510 META confocal microscope (Gottingen, Germany).
Cathepsin B expression and distribution were analyzed by im-
munofl uorescence staining of the 3D rBM overlay cultures at 4, 8,
12 or 16 days in culture. Cultures were fi xed with 2 % paraformal-
dehyde for 20 min or cold methanol for 10 min, permeabilized for
5 min with 0.2 % Triton X-100 at 4 ° C, and washed with PBS three
times at 10 min/wash. Samples were then blocked for 1 h in IF buff er
(130 m m NaCl, 7m m Na 2 HPO
4 , 3.5 m m NaH
2 PO
4 , 7.7 m m NaN
3 , 0.1 %
BSA, 0.2 % Triton X-100, 0.05 % Tween 20) and incubated with the
primary antibody overnight at 4 ° C. Samples were washed with IF
buff er three times at 20 min/wash, incubated with secondary an-
tibody for 2 h at room temperature, followed by three washes with
IF buff er for 10 min each. Samples were incubated with propidium
iodide in PBS for 10 min, washed three times with PBS and mounted
on glass slides with Slowfade antifade reagent. Samples were im-
aged using a 40 × water immersion lens on a Zeiss LSM 510 confocal
microscope (Gottingen, Germany).
Cell proliferation and apoptosis assays
Cell proliferation and apoptosis were assessed by staining for a
proliferation marker, Ki67, or an apoptotic marker, cleaved caspase
3 (Debnath et al. , 2003 ), following the protocol described above for
the polarity markers. MCF10 variants were grown in 3D rBM over-
lay cultures as previously described (Li et al. , 2008 ) for 4 days and
were treated with 0.1 % DMSO, 5 μ m CA074Me or 5 μ m E64d. The
percentage of structures that were positive for Ki67 or cleaved cas-
pase 3 was determined by counting a total of 100 structures on two
separate cover slips with a Zeiss Axiophot epifl uorescent microscope
(Gottingen, Germany). Structures were considered Ki67 positive if
they contained at least one cell staining for Ki67. Structures were con-
sidered to be caspase 3 positive if they contained at least one cell that
was positive for cleaved caspase 3 and the positive cell(s) was not
localized in the center of a developing lumen.
Proliferation of MCF10 variants in 2D monolayer and 3D rBM
overlay cultures was also quantifi ed by MTT assays, which are based
on the ability of functional mitochondria in live cells to convert MTT
into formazan crystals. The crystals are released by cell lysis and
quantifi ed by measuring absorbance at 590 nm with absorbance
values being directly proportional to the number of live cells
(Alley et al. , 1988 ). For 2D cultures, 1000 cells/well were seeded in
24-well plates. For 3D cultures, cells were seeded as described above.
On days 0, 2, 4 and 6, DMSO or the indicated protease inhibitor was
added at specifi ed concentrations to wells maintaining the fi nal con-
centration of DMSO at 0.1 % DMSO. On days 1, 3, 5 and 7, cells were
incubated with 0.5 mg/ml MTT for 2 h at 37 ° C. Cells were lysed by
adding 500 μ l of 20 % SDS to each well and incubating overnight at
room temperature. Absorbance at 590 nm was measured on a Tecan
SpectraFluor Plus plate reader (Mannedorf, Switzerland).
Cell viability/cytotoxicity assays
2D culture: The viability of MCF10 variants in the presence of cysteine
protease inhibitors was measured with CytoTox 96 ® Non-Radioactive
Cytotoxicity Assay Kits (Promega, Madison, USA). This assay meas-
ures the amount of lactic dehydrogenase release upon loss of plas-
ma membrane integrity. Three × 10 5 cells/well were seeded in 6-well
plates. One ml of culture media containing the specifi ed concentra-
tion of DMSO or protease inhibitor was added to the cells. Media and
lysate samples were collected and assayed according to the manu-
facturer ’ s instructions. Absorbance at 485 nm was measured on a
Tecan SpectraFluor Plus plate reader. 3D culture: Viability of MCF10
variants in 3D rBM overlay culture in the presence and absence of
protease inhibitors was measured with a LIVE/DEAD Kit. This assay
is based on live cells with esterase activity and an intact membrane
Brought to you by | Stanford UniversityAuthenticated | 171.67.216.22
Download Date | 9/5/13 12:11 PM

1414 S.R. Mullins et al.: Cysteine cathepsins in a 3D model of premalignant progression
retaining the hydrolysis product of calcein AM, a fl uorogenic esterase
substrate to a green fl uorescent product and dead cells with compro-
mised membranes being permeable to ethidium homodimer-1, a red-
fl uorescent nucleic acid stain. Cultures were treated with 0.1 % DMSO
or cysteine protease inhibitors (100 μ m E64d or 10 μ m CA074Me) eve-
ry other day for 8 days. Cultures were then washed with PBS ( + Mg 2 +
and Ca 2 + ) 3 times and incubated at room temperature with PBS with
Mg 2 + and Ca 2 + and containing 2 μ m calcein AM and 4 μ m ethidium
homodimer-1 for 30 min. Fluorescence was imaged using a 40 × wa-
ter immersion lens on a Zeiss LSM-510 META confocal microscope
(Gottingen, Germany).
Use of ABPs to image and profile active cysteine cathepsins in intact cells
To image active cysteine cathepsins in live MCF10 variants in 3D rBM
overlay culture, we grew the cultures for 12 days and incubated with
GB111 (1 μ m ) overnight. The next day we acquired confocal image
stacks on a Zeiss LSM-510 META confocal microscope (Gottingen,
Germany). To determine the identity of the labeled cysteine cath-
epsins, cultures were washed four times with PBS and harvested in
RIPA buff er (50 m m Tris/HCl, pH 7.4, 150 m m NaCl, 5 m m EDTA, 0.5 %
deoxycholate and 0.1 % SDS). Equal amounts of cell lysate (normal-
ized to 1.6 μ g of DNA) were loaded in each lane, proteins separated on
12 % SDS-PAGE and labeled active cysteine cathepsins visualized by
scanning with a Typhoon (GE Health Care, Piscataway, USA) fl atbed
laser scanner (Ex/Em 532/580 nm).
The labeled proteases were identifi ed as cysteine cathepsins by
reduced binding of GB111 in the presence of cysteine protease inhibi-
tors and by immunoprecipitation with antibodies against cysteine
cathepsins. Briefl y, MCF10A cells in 3D rBM overlay culture for 4 days
were pretreated with 0.1 % DMSO or cysteine protease inhibitors (10
or 100 μ m E64d or 10 μ m CA074Me) for 2 h. GB111 (1 μ m ) was then add-
ed to the culture media. Aft er an overnight incubation with the ABP,
cell lysates were prepared as described above and adjusted with RIPA
buff er to a volume of 500 μ l. Rabbit anti-human cathepsin B or mouse
anti-human cathepsin L was added and mixed for 2 h at 4 ° C, followed
by Protein A/G Plus-Agarose beads (30 μ l) and mixing overnight at
4 ° C. Samples were centrifuged at 400 × g for 2 – 3 min, supernatant was
removed and beads were washed with RIPA buff er and then boiled
aft er addition of 2 × sample buff er (20 % glycerol, 100 m m Tris/HCl,
pH 6.8, 6 % SDS, and 10 % mercaptoethanol). One ml of cold acetone
was added to the supernatant. Aft er 2 h at -80 ° C, immunoprecipi-
tated proteins were collected by centrifugation at 9300 g at 4 ° C for
30 min, dried and dissolved by boiling in sample buff er. Samples
were separated on 12 % SDS-PAGE and labeled active cysteine cath-
epsins visualized by scanning with a Typhoon (GE Health Care, Pis-
cataway, USA) fl atbed laser scanner (Ex/Em 532/580 nm).
Statistical analysis Statistical signifi cance was determined by a two-tailed t -test with
assumed equal variance. A p value equal to or < 0.05 was considered
signifi cant.
Acknowledgements: This work was supported by U.S.
Public Health Service Grant CA 56586 and a Department of
Defense Breast Cancer Center of Excellence (DAMD17-02 – 1-
0693). The Microscopy, Imaging and Cytometry Resources
Laboratory was supported by National Institutes of Health
Center Grants P30ES06639 and P30CA22453, a Roadmap
Grant U54RR020843 and the Perinatal Research Branch of
the National Institutes of Health.
Received July 12, 2012; accepted October 4, 2012
References Abbenante, G. and Fairlie, D.P. (2005). Protease inhibitors in the
clinic. Med. Chem. 1 , 71 – 104.
Alencar, H., Funovics, M.A., Figueiredo, J., Sawaya, H., Weissleder,
R., and Mahmood, U. (2007). Colonic adenocarcinomas:
near-infrared microcatheter imaging of smart probes for early
detection – study in mice. Radiology 244 , 232 – 238.
Alley, M.C., Scudiero, D.A., Monks, A., Hursey, M.L., Czerwinski,
M.J., Fine, D.L., Abbott, B.J., Mayo, J.G., Shoemaker, R.H., and
Boyd, M.R. (1988). Feasibility of drug screening with panels of
human tumor cell lines using a microculture tetrazolium assay.
Cancer Res. 48 , 589 – 601.
Basolo, F., Elliott, J., Tait, L., Chen, X.Q., Maloney, T., Russo, I.H.,
Pauley, R., Momiki, S., Caamano, J., Klein-Szanto, A.J. et al.
(1991). Transformation of human breast epithelial cells by
c-Ha-ras oncogene. Mol. Carcinog. 4 , 25 – 35.
Benavides, F., Perez, C., Blando, J., Contreras, O., Shen, J., Coussen,
L.M., Fischer, S.M., Kusewitt, D.F., Digiovanni, J. and Conti, C.J.
(2011). Protective role of cathepsin L in mouse skin carcino-
genesis. Mol. Carcinog. 51 , 352 – 361.
Blum, G., Mullins, S.R., Keren, K., Fonovic, M., Jedeszko, C., Rice,
M.J., Sloane, B.F. and Bogyo, M. (2005). Dynamic imaging of
protease activity with fluorescently quenched activity-based
probes. Nat. Chem. Biol. 1 , 203 – 209.
Bervar, A., Zajc, I., Sever, N., Katunuma, N., Sloane, B.F., and
Lah, T.T. (2003). Invasiveness of transformed human breast
epithelial cell lines is related to cathepsin B and inhibited by
cysteine proteinase inhibitors. Biol. Chem. 384 , 447 – 455.
Chen, J., Tung, C.H., Mahmood, U., Ntziachristos, V., Gyurko, R.,
Fishman, M.C., Huang, P. L., and Weissleder, R. (2002). In vivo
imaging of proteolytic activity in atherosclerosis. Circulation
105 , 2766 – 2771.
Dawson, P.J., Wolman, S.R., Tait, L., Heppner, G.H., and Miller, F.R.
(1996). MCF10AT: a model for the evolution of cancer from
proliferative breast disease. Am. J. Pathol. 148 ,
313 – 319.
Debnath, J. and Brugge, J.S. (2005). Modelling glandular epithelial
cancers in three-dimensional cultures. Nat. Rev. Cancer. 5 ,
675 – 688.
Brought to you by | Stanford UniversityAuthenticated | 171.67.216.22
Download Date | 9/5/13 12:11 PM

S.R. Mullins et al.: Cysteine cathepsins in a 3D model of premalignant progression 1415
Debnath, J., Muthuswamy, S.K., and Brugge, J.S. (2003). Morpho-
genesis and oncogenesis of MCF-10A mammary epithelial acini
grown in three-dimensional basement membrane cultures.
Methods 30 , 256 – 268.
Dennem ä rker, J., Lohm ü ller, T., Mayerle, J., Tacke, M., Lerch,
M.M., Coussens, L.M., and Peters, C., Reinheckel, T. (2010).
Deficiency for the cysteine protease cathepsin L promotes
tumor progression in mouse epidermis. Oncogene 29 , 1611 – 21.
Felbor, U., Kessler, B., Mothes, W., Goebel, H.H., Ploegh, H.L.,
Bronson, R.T., and Olsen, B.R. (2002). Neuronal loss and brain
atrophy in mice lacking cathepsins B and L. Proc. Natl. Acad.
Sci. USA 99 , 7883 – 7888.
Gocheva, V., Zeng, W., Ke, D., Klimstra, D., Reinheckel, T., Peters, C.,
Hanahan, D., and Joyce, J.A. (2006). Distinct roles for cysteine
cathepsin genes in multistage tumorigenesis. Genes Dev. 20 ,
543 – 556.
Gopinathan, A., Denicola, G.M., Frese, K.K., Cook, N., Karreth, F.A.,
Mayerle, J., Lerch, M.M., Reinheckel, T., and Tuveson D.A.
(2012). Cathepsin B promotes the progression of pancreatic
ductal adenocarcinoma in mice. Gut 61 , 77 – 84.
Guicciardi, M.E., Miyoshi, H., Bronk, S.F., and Gores, G.J. (2001).
Cathepsin B knockout mice are resistant to tumor necrosis
factor-alpha-mediated hepatocyte apoptosis and liver injury:
implications for therapeutic applications. Am. J. Pathol. 159 ,
2045 – 2054.
Halangk, W., Lerch, M.M., Brandt-Nedelev, B., Roth, W.,
Ruthenbuerger, M., Reinheckel, T., Domschke, W.,
Lippert, H., Peters, C., and Deussing, J. (2000). Role of
cathepsin B in intracellular trypsinogen activation and the
onset of acute pancreatitis. J. Clin. Invest. 106 , 773 – 781.
Joyce, J.A., Baruch, A., Chehade, K., Meyer-Morse, N., Giraudo,
E., Tsai, F. Y., Greenbaum, D.C., Hager, J.H., Bogyo, M.,
and Hanahan, D. (2004). Cathepsin cysteine proteases
are effectors of invasive growth and angiogenesis during
multistage tumorigenesis. Cancer Cell 5 , 443 – 453.
Khokha, R. and Werb Z. (2011). Mammary gland reprogramming:
metalloproteinases couple form with function. Cold Spring
Harb. Perspect. Biol. 3 , 4.
Kleifeld, O., Kotra, L.P., Gervasi, D.C., Brown, S., Bernardo,
M.M., Fridman, R., Mobashery, S., and Sagi, I. (2001). X-ray
absorption studies of human matrix metalloproteinase-2
(MMP-2) bound to a highly selective mechanism-based
inhibitor. Comparison with the latent and active forms of the
enzyme. J. Biol. Chem. 276 , 17125 – 17131.
Korkola, J.E., DeVries, S., Fridlyand, J., Hwang, E.S., Estep, A.L.,
Chen, Y.Y., Chew, K.L., Dairkee, S.H., Jensen, R.M., and
Waldman, F.M. (2003). Differentiation of lobular versus ductal
breast carcinomas by expression microarray analysis. Cancer
Res. 63 , 7167 – 7175.
Kroemer, G. and Jaattela, M. (2005). Lysosomes and autophagy in
cell death control. Nat. Rev. Cancer 5 , 886 – 897.
Li, Q., Mullins, S.R., Sloane, B.F., and Mattingly, R.R. (2008).
p21-Activated kinase 1 coordinates aberrant cell survival
and pericellular proteolysis in a three-dimensional culture
model for premalignant progression of human breast cancer.
Neoplasia 10 , 314 – 329.
Li, Q., Chow, A.B., and Mattingly, R.R. (2010). Three-dimensional
overlay culture models of human breast cancer reveal a
critical sensitivity to mitogen-activated protein kinase kinase
inhibitors. J. Pharmacol. Exp. Ther. 332 , 821 – 828.
Liu, J., Sukhova, G.K., Yang, J.T., Sun, J., Ma, L., Ren, A., Xu, W.H.,
Fu, H., Dolganov, G.M., Hu, C. et al. (2006a). Cathepsin
L expression and regulation in human abdominal aortic
aneurysm, atherosclerosis, and vascular cells. Atherosclerosis
184 , 302 – 311.
Liu, J., Ma, L., Yang, J., Ren, A., Sun, Z., Yan, G., Sun, J., Fu, H., Xu, W.,
Hu, C. et al. (2006b). Increased serum cathepsin S in patients
with atherosclerosis and diabetes. Atherosclerosis 186 ,
411 – 419.
Lo, A.T., Mori, H., Mott, J. and Bissell, M.J. (2012). Constructing
three-dimensional models to study mammary gland branching
morphogenesis and functional differentiation. J. Mammary
Gland. Biol. Neoplasia. 17 , 103 – 10.
Lutgens, S.P., Cleutjens, K.B., Daemen, M.J., and Heeneman,
S. (2007). Cathepsin cysteine proteases in cardiovascular
disease. Faseb J. 21 , 3029 – 3041.
Martin, K.J., Patrick, D.R., Bissell, M.J., and Fournier, M.V. (2008).
Prognostic breast cancer signature identified from 3D culture
model accurately predicts clinical outcome across independent
datasets. PLoS One 3 , 1 – 9.
McGowan, E.B., Becker, E., and Detwiler, T.C. (1989). Inhibition of
calpain in intact platelets by the thiol protease inhibitor E-64d.
Biochem. Biophys. Res. Commun. 158 , 432 – 435.
Miller, F.R., Soule, H.D., Tait, L., Pauley, R.J., Wolman, S.R., Dawson,
P.J., and Heppner, G. H. (1993). Xenograft model of progressive
human proliferative breast disease. J. Natl. Cancer Inst. 85 ,
1725 – 1732.
Mohamed, M.M. and Sloane, B.F. (2006). Cysteine cathepsins:
multifunctional enzymes in cancer. Nat. Rev. Cancer. 6 , 764 – 775.
Moin, K., Day, N.A., Sameni, M., Hasnain, S., Hirama, T., and Sloane,
B.F. (1992). Human tumour cathepsin B. Comparison with
normal liver cathepsin B. Biochem. J. 285 , 427 – 434.
Montaser, M., Lalmanach, G., and Mach, L. (2002). CA-074, but not
its methyl ester CA-074Me, is a selective inhibitor of cathepsin
B within living cells. Biol. Chem. 383 , 1305 – 1308.
Nedvetsky, P.I., Kwon, S.H., Debnath, J., and Mostov, K.E. (2012).
cAMP regulates formation of mammary epithelial acini in vitro.
Mol. Biol. Cell. 23, 2973–2980. 2012 Jun 6. [Epub ahead of
print].
Obermajer, N., Jevnikar, Z., Doljak, B., and Kos, J. (2008). Role of
cysteine cathepsins in matrix degradation and cell signalling.
Connect Tissue Res. 49 , 193 – 196.
Premzl, A., Puizdar, V., Zavasnik-Bergant, V., Kopitar-Jerala, N., Lah,
T.T., Katunuma, N., Sloane, B.F., Turk, V., and Kos, J. (2001).
Invasion of ras-transformed breast epithelial cells depends on
the proteolytic activity of cysteine and aspartic proteinases.
Biol. Chem. 382 , 853 – 857.
Reinheckel, T., Hagemann, S., Dollwet-Mack, S., Martinez, E.,
Lohmuller, T., Zlatkovic, G., Tobin, D.J., Maas-Szabowski,
N., and Peters, C. (2005). The lysosomal cysteine protease
cathepsin L regulates keratinocyte proliferation by control of
growth factor recycling. J Cell Sci. 118 , 3387 – 3395.
Reiser, J., Adair, B., and Reinheckel, T. (2010). Specialized roles for
cysteine cathepsins in health and disease. J. Clin. Invest. 120 ,
3421 – 3431.
Repnik, U., Stoka, V., Turk, V., and Turk, B. (2012). Lysosomes and
lysosomal cathepsins in cell death. Biochim. Biophys. Acta
1824 , 22 – 23.
Sameni, M., Mullins, S.R., Moin, K., Sloane, B.F., and Osuala, K.
(2012). Modeling breast cancer progression in 4D. In:
Brought to you by | Stanford UniversityAuthenticated | 171.67.216.22
Download Date | 9/5/13 12:11 PM

1416 S.R. Mullins et al.: Cysteine cathepsins in a 3D model of premalignant progression
Breast Cancer Metastasis and Drug Resistance: Challenges
and Progress, A. Ahmad, ed. (Springer, New York,
in press).
Sevenich, L., Werner, F., Gajda, M., Schurigt, U., Sieber, C., M ü ller,
S., Follo, M., Peters, C., and Reinheckel, T. (2011). Transgenic
expression of human cathepsin B promotes progression and
metastasis of polyoma-middle-T-induced breast cancer in mice.
Oncogene 30 , 54 – 64.
Seyfried, D.M., Veyna, R., Han, Y., Li, K., Tang, N., Betts, R.L.,
Weinsheimer, S., Chopp, M., and Anagli, J. (2001). A selective
cysteine protease inhibitor is non-toxic and cerebroprotective
in rats undergoing transient middle cerebral artery ischemia.
Brain Res. 901 , 94 – 101.
Sloane, B.F. (2012). On How Mammary Gland Reprogramming
Metalloproteinases Couple Form with Function. Cold Spring
Harb. Perspect. Biol. 4, p. 7.
Turk, V., Stoka, V., Vasiljeva, O., Renko, M., Sun, T., Turk, B., and Turk,
D. (2012). Cysteine cathepsins: from structure, function and
regulation to new frontiers. Biochim. Biophys. Acta. 1824 ,
68 – 88.
Vasiljeva, O., Papazoglou, A., Kruger, A., Brodoefel, H., Korovin, M.,
Deussing, J., Augustin, N., Nielsen, B.S., Almholt, K., Bogyo, M.,
et al. (2006). Tumor cell-derived and macrophage-derived
cathepsin B promotes progression and lung metastasis of
mammary cancer. Cancer Res. 66 , 5242 – 5250.
Vasiljeva, O., Korovin, M., Gajda, M., Brodoefel, H., Bojic, L.,
Kruger, A., Schurigt, U., Sevenich, L., Turk, B., Peters, C., et
al. (2008). Reduced tumour cell proliferation and delayed
development of high-grade mammary carcinomas in
cathepsin B-deficient mice. Oncogene 27 , 4191 – 4199.
Wang, B., Sun, J., Kitamoto, S., Yang, M., Grubb, A., Chapman,
H.A., Kalluri, R., and Shi, G.P. (2006). Cathepsin S controls
angiogenesis and tumor growth via matrix-derived angiogenic
factors. J. Biol. Chem. 281 , 6020 – 6029.
Watson, C.J. and Kreuzaler, P.A. (2009). The role of cathepsins
in involution and breast cancer. J. Mammary Gland Biol.
Neoplasia 14 , 171 – 179.
Wilcox, D. and Mason, R.W. (1992). Inhibition of cysteine proteinases
in lysosomes and whole cells. Biochem. J. 285 , 495 – 502.
Wulfkuhle, J.D., Sgroi, D.C., Krutzsch, H., McLean, K., McGarvey,
K., Knowlton, M., Chen, S., Shu, H., Sahin, A., Kurek, R., et al.
(2002). Proteomics of human breast ductal carcinoma in situ.
Cancer Res. 62 , 6740 – 6749.
Yasuda, Y., Kaleta, J., and Bromme, D. (2005). The role of cathepsins
in osteoporosis and arthritis: rationale for the design of new
therapeutics. Adv. Drug Deliv. Rev. 57 , 973 – 993.
Zajc, I., Sever, N., Bervar, A., and Lah, T.T. (2002). Expression of
cysteine peptidase cathepsin L and its inhibitors stefins A
and B in relation to tumorigenicity of breast cancer cell lines.
Cancer Lett. 187 , 185 – 190.
Brought to you by | Stanford UniversityAuthenticated | 171.67.216.22
Download Date | 9/5/13 12:11 PM
DOI 10.1515/hsz-2012-0252SUP Biol. Chem. 2012; 393(12): Ad1–Ad3
Supplemental data
Day 4
C
B
A
Day 8 Day 12
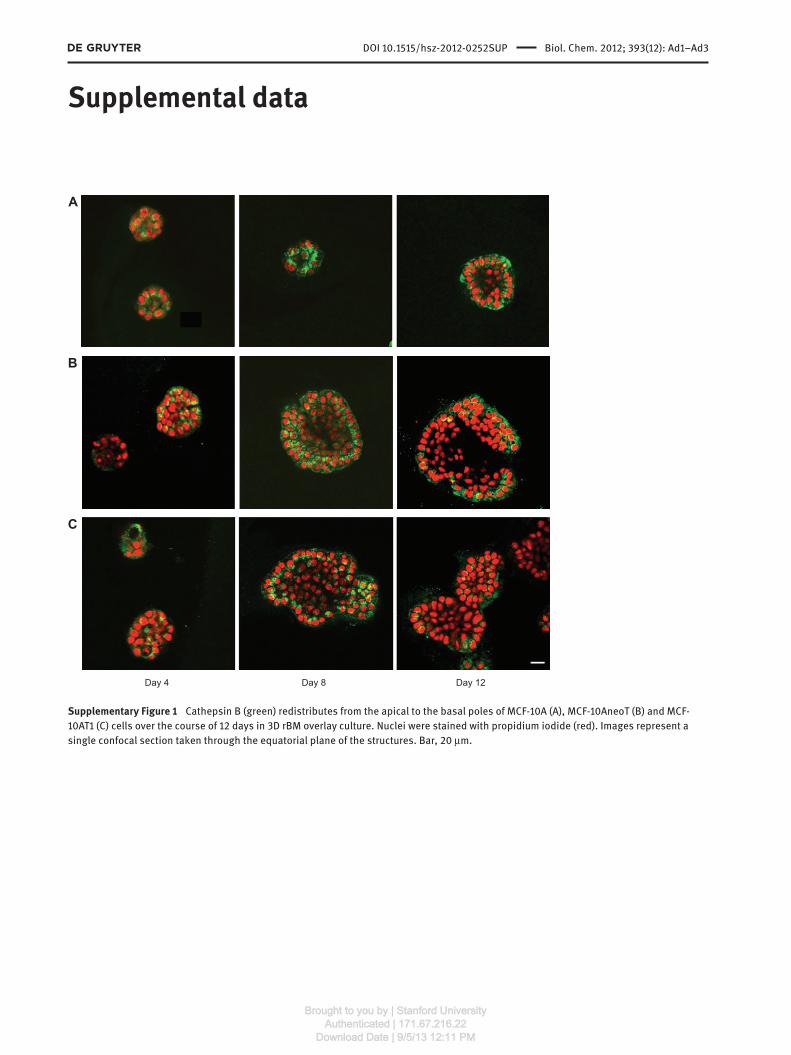
Supplementary Figure 1 Cathepsin B (green) redistributes from the apical to the basal poles of MCF-10A (A), MCF-10AneoT (B) and MCF-
10AT1 (C) cells over the course of 12 days in 3D rBM overlay culture. Nuclei were stained with propidium iodide (red). Images represent a
single confocal section taken through the equatorial plane of the structures. Bar, 20 μ m.
Brought to you by | Stanford UniversityAuthenticated | 171.67.216.22
Download Date | 9/5/13 12:11 PM

Ad2 S.R. Mullins et al.: Cysteine cathepsins in a 3D model of premalignant progression
1.6
1.2
0.8
Fold
cha
nge
0.4
0Day 1 Day 3 Day 5 Day 7
1.6B
A
1.2
0.8
Fold
cha
nge
0.4
0Day 1 Day 3 Day 5
* *
Day 7
Supplementary Figure 2 CA074Me decreased the proliferation of
MCF10 variants grown in 2D monolayer culture. Cells were grown in
the presence of 0.01 ( □ ), 0.1 ( � ), 1 ( � ), 10 ( ■ ) or 100 ( � ) μ m E64d
(A); or 0.01 ( □ ), 0.1 ( � ), 1 ( � ), 10 ( ■ ), or 100 ( � ) μ m CA074Me (B).
MTT assays were performed on days 1, 3, 5 and 7 post-seeding. Fold
change was compared to diluent control [DMSO, ( ○ )]. Mean ± SD;
* p < 0.001.
Brought to you by | Stanford UniversityAuthenticated | 171.67.216.22
Download Date | 9/5/13 12:11 PM
S.R. Mullins et al.: Cysteine cathepsins in a 3D model of premalignant progression Ad3
10AA
B
C
neoT AT1
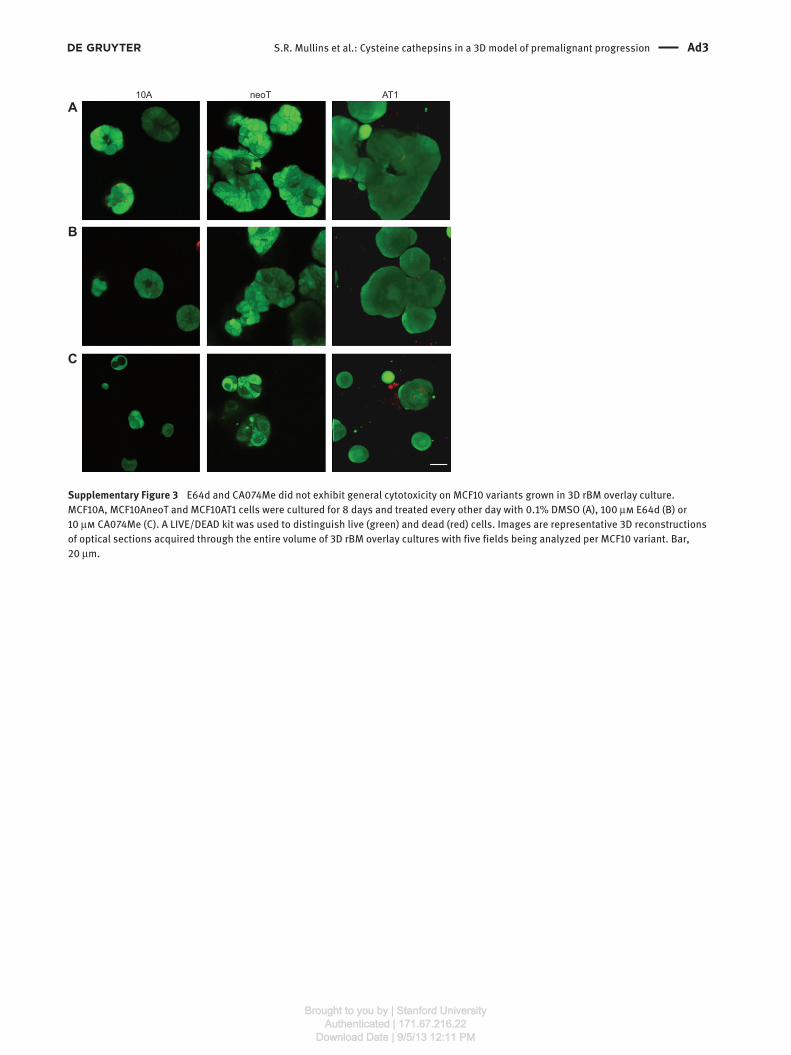
Supplementary Figure 3 E64d and CA074Me did not exhibit general cytotoxicity on MCF10 variants grown in 3D rBM overlay culture.
MCF10A, MCF10AneoT and MCF10AT1 cells were cultured for 8 days and treated every other day with 0.1 % DMSO (A), 100 μ m E64d (B) or
10 μ m CA074Me (C). A LIVE/DEAD kit was used to distinguish live (green) and dead (red) cells. Images are representative 3D reconstructions
of optical sections acquired through the entire volume of 3D rBM overlay cultures with five fields being analyzed per MCF10 variant. Bar,
20 μ m.
Brought to you by | Stanford UniversityAuthenticated | 171.67.216.22
Download Date | 9/5/13 12:11 PM