This presentation contains consolidated financial results ...
31
Copyright (C) 2014 Panasonic Corporation All Rights Reserved. 1 • This presentation contains consolidated financial results for fiscal 2014, ended March 31, 2014 and the current forecast for fiscal 2015.
Transcript of This presentation contains consolidated financial results ...
Copyright (C) 2014 Panasonic Corporation All Rights Reserved.
1
• This presentation contains consolidated financial results for
fiscal 2014, ended March 31, 2014 and the current forecast for
fiscal 2015.
Copyright (C) 2014 Panasonic Corporation All Rights Reserved.
2
• First, the financial results for fiscal 2014.
Copyright (C) 2014 Panasonic Corporation All Rights Reserved.
3
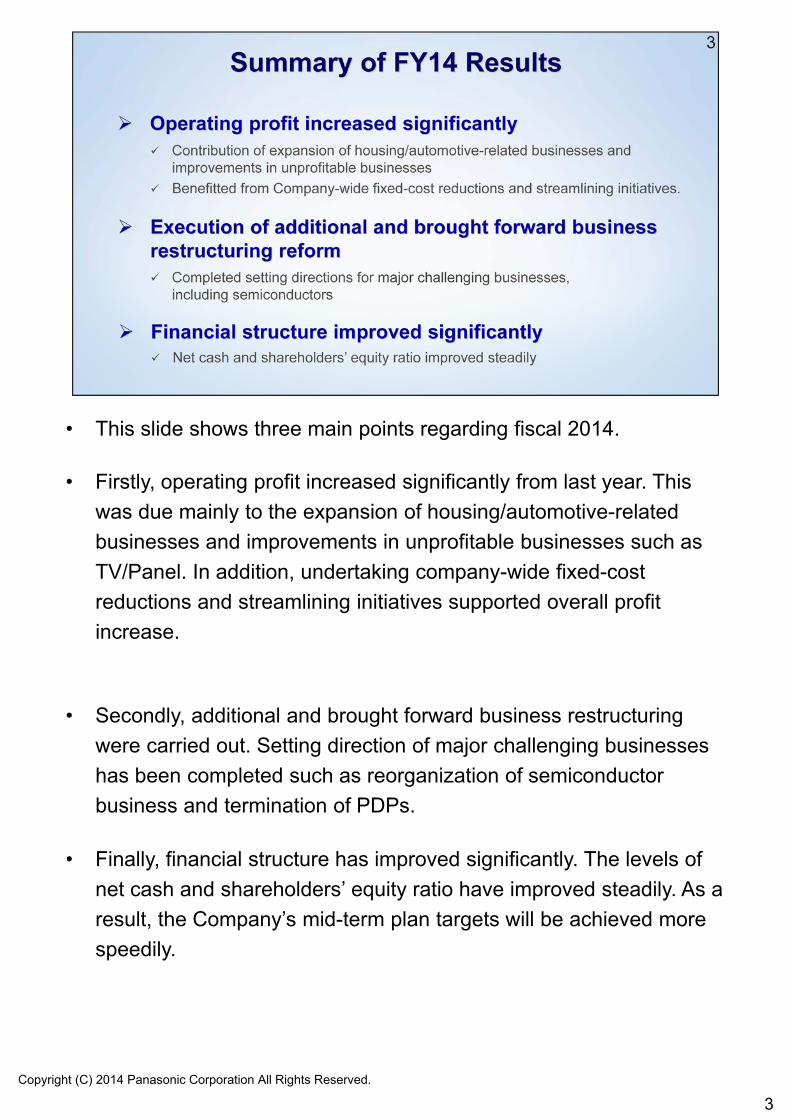
• This slide shows three main points regarding fiscal 2014.
• Firstly, operating profit increased significantly from last year. This
was due mainly to the expansion of housing/automotive-related
businesses and improvements in unprofitable businesses such as
TV/Panel. In addition, undertaking company-wide fixed-cost
reductions and streamlining initiatives supported overall profit
increase.
• Secondly, additional and brought forward business restructuring
were carried out. Setting direction of major challenging businesses
has been completed such as reorganization of semiconductor
business and termination of PDPs.
• Finally, financial structure has improved significantly. The levels of
net cash and shareholders’ equity ratio have improved steadily. As a
result, the Company’s mid-term plan targets will be achieved more
speedily.
Copyright (C) 2014 Panasonic Corporation All Rights Reserved.
4
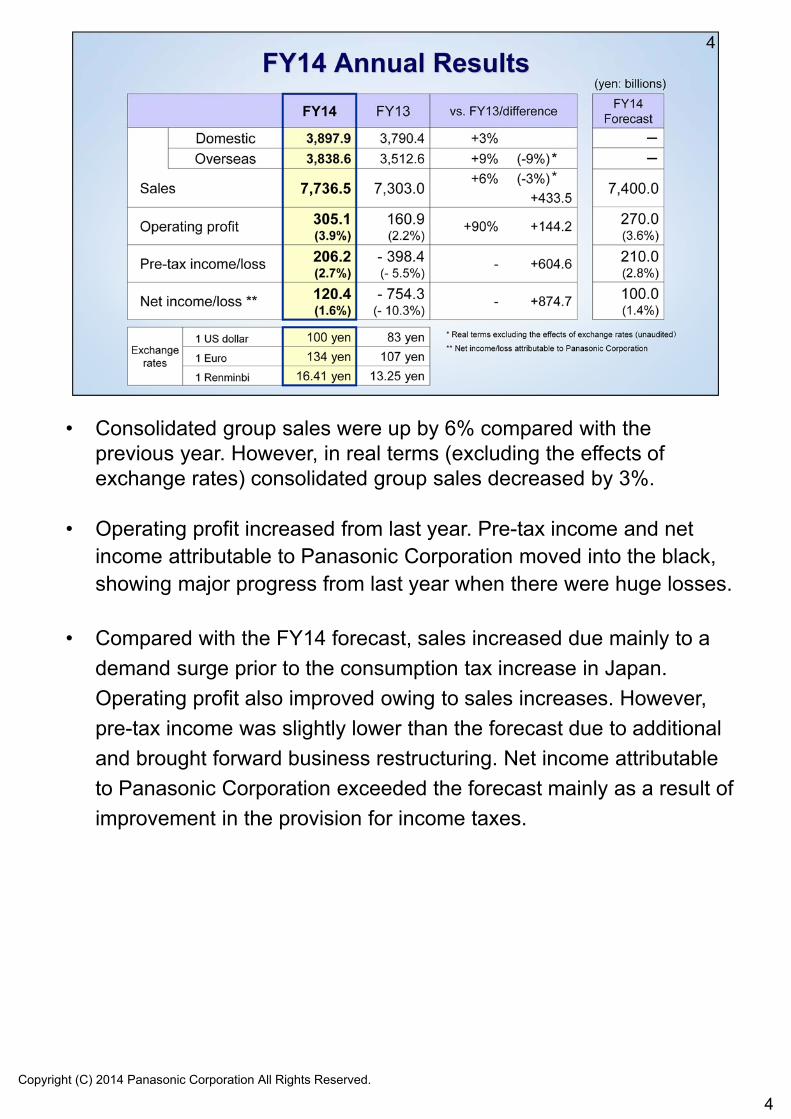
• Consolidated group sales were up by 6% compared with the previous year. However, in real terms (excluding the effects of exchange rates) consolidated group sales decreased by 3%.
• Operating profit increased from last year. Pre-tax income and net income attributable to Panasonic Corporation moved into the black, showing major progress from last year when there were huge losses.
• Compared with the FY14 forecast, sales increased due mainly to a
demand surge prior to the consumption tax increase in Japan.
Operating profit also improved owing to sales increases. However,
pre-tax income was slightly lower than the forecast due to additional
and brought forward business restructuring. Net income attributable
to Panasonic Corporation exceeded the forecast mainly as a result of
improvement in the provision for income taxes.
Copyright (C) 2014 Panasonic Corporation All Rights Reserved.
5
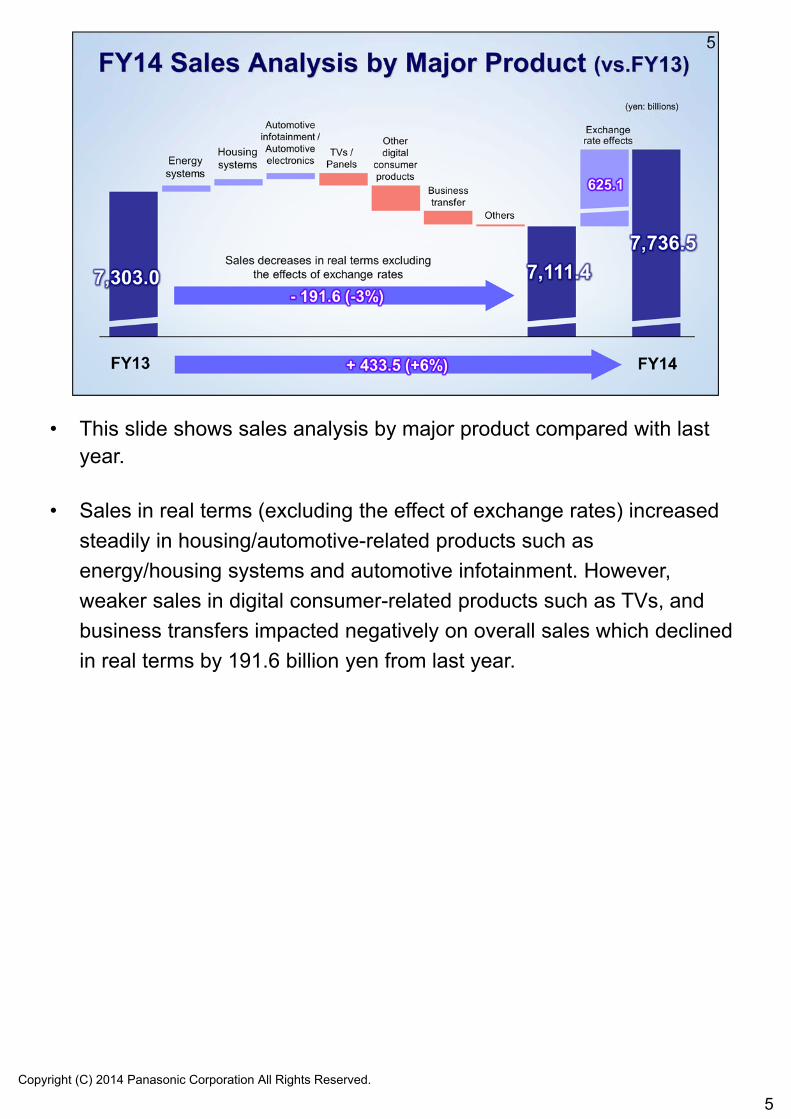
• This slide shows sales analysis by major product compared with last year.
• Sales in real terms (excluding the effect of exchange rates) increased
steadily in housing/automotive-related products such as
energy/housing systems and automotive infotainment. However,
weaker sales in digital consumer-related products such as TVs, and
business transfers impacted negatively on overall sales which declined
in real terms by 191.6 billion yen from last year.

Copyright (C) 2014 Panasonic Corporation All Rights Reserved.
6
• Next, operating profit analysis compared with last year.
• Although profitability declined by 67.0 billion yen due to sales
decreases in real terms, it improved by 50.0 billion yen as a result of
corporate-wide measures, including bonus reductions, and by 98.2
billion yen due to other fixed-cost reductions.
• A 40.0 billion yen benefit from restructuring was included in the fixed-
cost reductions.
• A 43.0 billion yen improvement due to streamlining on materials
which exceeded price declines, and a 20.0 billion yen benefit from
yen depreciation also contributed to the overall operating profit
improvement of 144.2 billion yen.
Copyright (C) 2014 Panasonic Corporation All Rights Reserved.
7
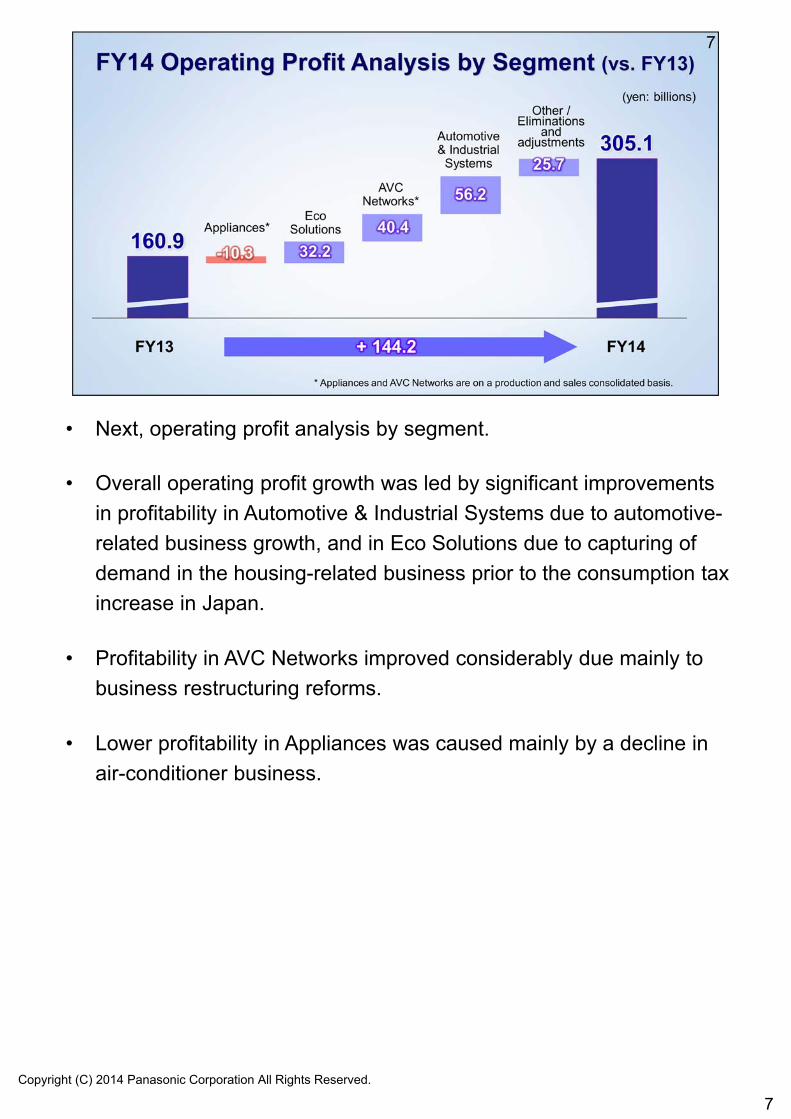
• Next, operating profit analysis by segment.
• Overall operating profit growth was led by significant improvements
in profitability in Automotive & Industrial Systems due to automotive-
related business growth, and in Eco Solutions due to capturing of
demand in the housing-related business prior to the consumption tax
increase in Japan.
• Profitability in AVC Networks improved considerably due mainly to
business restructuring reforms.
• Lower profitability in Appliances was caused mainly by a decline in
air-conditioner business.

Copyright (C) 2014 Panasonic Corporation All Rights Reserved.
8
• Next, sales and operating profit results by segment.
• Operating profit in the Eliminations and adjustments improved by
33.9 billion yen from last year due mainly to the improved profitability
in consumer-related sales division.
• Business promotion through integration of production and sales
management is now bearing fruit, showing steady profit improvement.
Copyright (C) 2014 Panasonic Corporation All Rights Reserved.
9
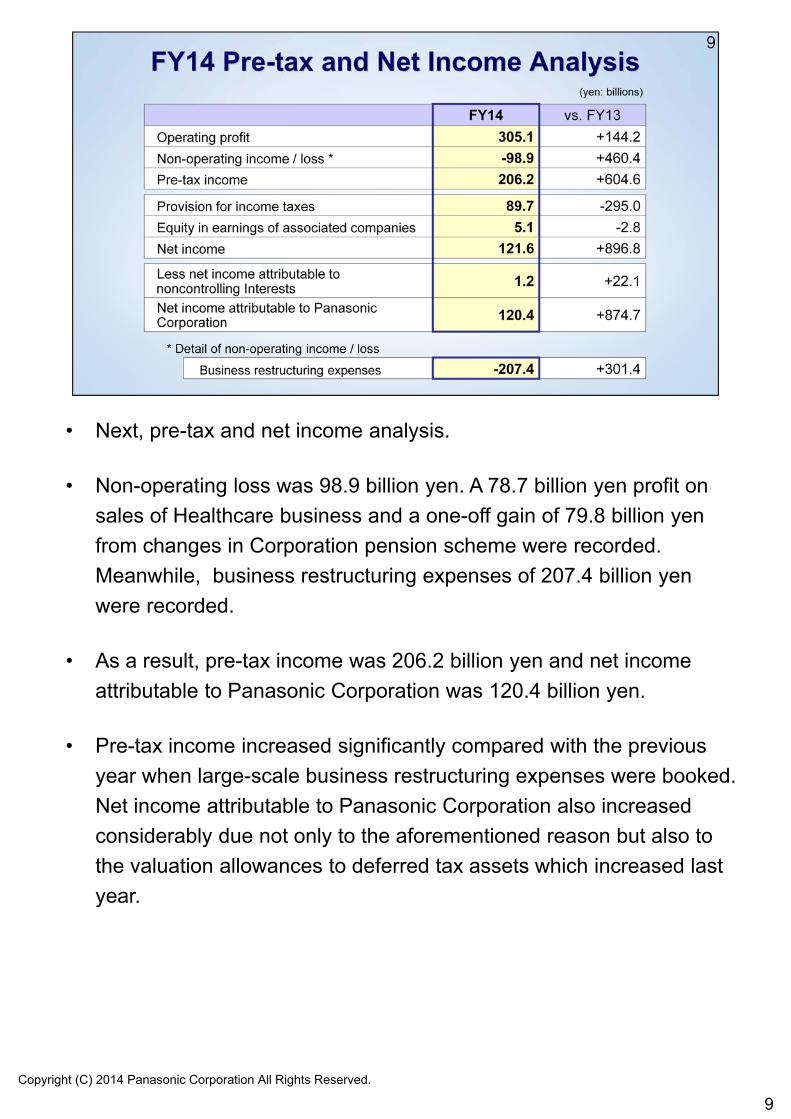
• Next, pre-tax and net income analysis.
• Non-operating loss was 98.9 billion yen. A 78.7 billion yen profit on
sales of Healthcare business and a one-off gain of 79.8 billion yen
from changes in Corporation pension scheme were recorded.
Meanwhile, business restructuring expenses of 207.4 billion yen
were recorded.
• As a result, pre-tax income was 206.2 billion yen and net income
attributable to Panasonic Corporation was 120.4 billion yen.
• Pre-tax income increased significantly compared with the previous
year when large-scale business restructuring expenses were booked.
Net income attributable to Panasonic Corporation also increased
considerably due not only to the aforementioned reason but also to
the valuation allowances to deferred tax assets which increased last
year.
Copyright (C) 2014 Panasonic Corporation All Rights Reserved.
10
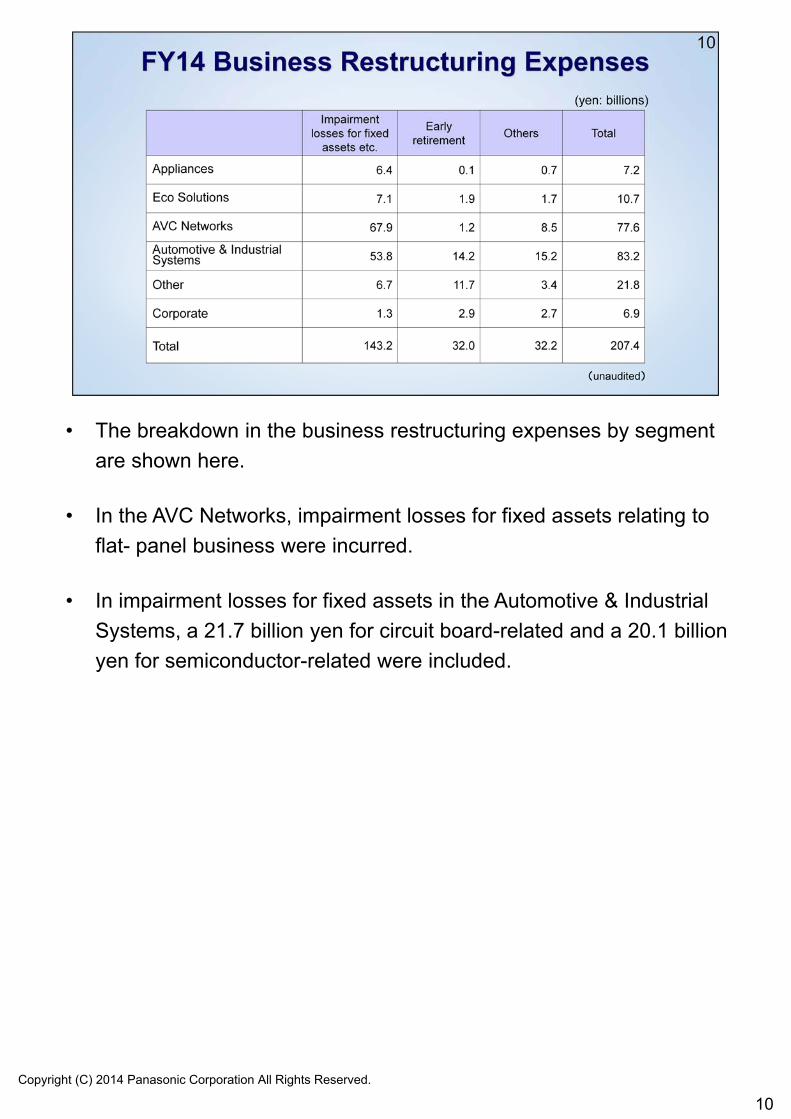
• The breakdown in the business restructuring expenses by segment
are shown here.
• In the AVC Networks, impairment losses for fixed assets relating to
flat- panel business were incurred.
• In impairment losses for fixed assets in the Automotive & Industrial
Systems, a 21.7 billion yen for circuit board-related and a 20.1 billion
yen for semiconductor-related were included.
Copyright (C) 2014 Panasonic Corporation All Rights Reserved.
11
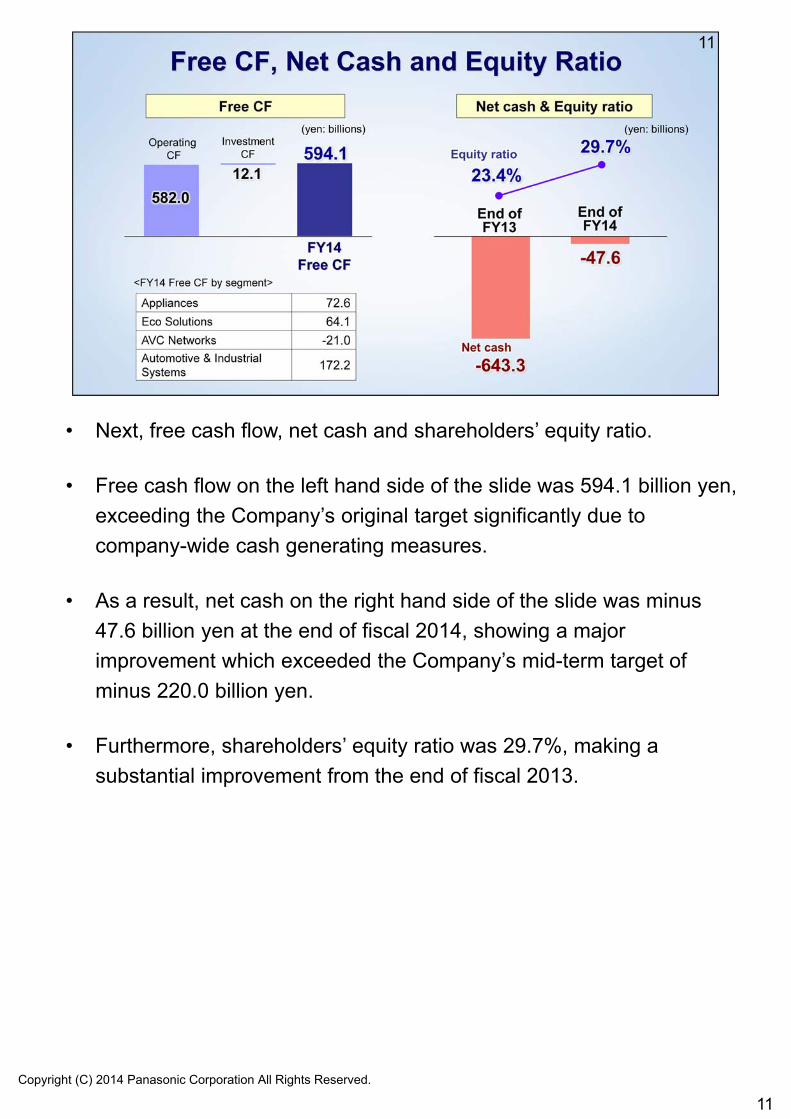
• Next, free cash flow, net cash and shareholders’ equity ratio.
• Free cash flow on the left hand side of the slide was 594.1 billion yen,
exceeding the Company’s original target significantly due to
company-wide cash generating measures.
• As a result, net cash on the right hand side of the slide was minus
47.6 billion yen at the end of fiscal 2014, showing a major
improvement which exceeded the Company’s mid-term target of
minus 220.0 billion yen.
• Furthermore, shareholders’ equity ratio was 29.7%, making a
substantial improvement from the end of fiscal 2013.
Copyright (C) 2014 Panasonic Corporation All Rights Reserved.
12
• Next, financial forecast for fiscal 2015.
Copyright (C) 2014 Panasonic Corporation All Rights Reserved.
13
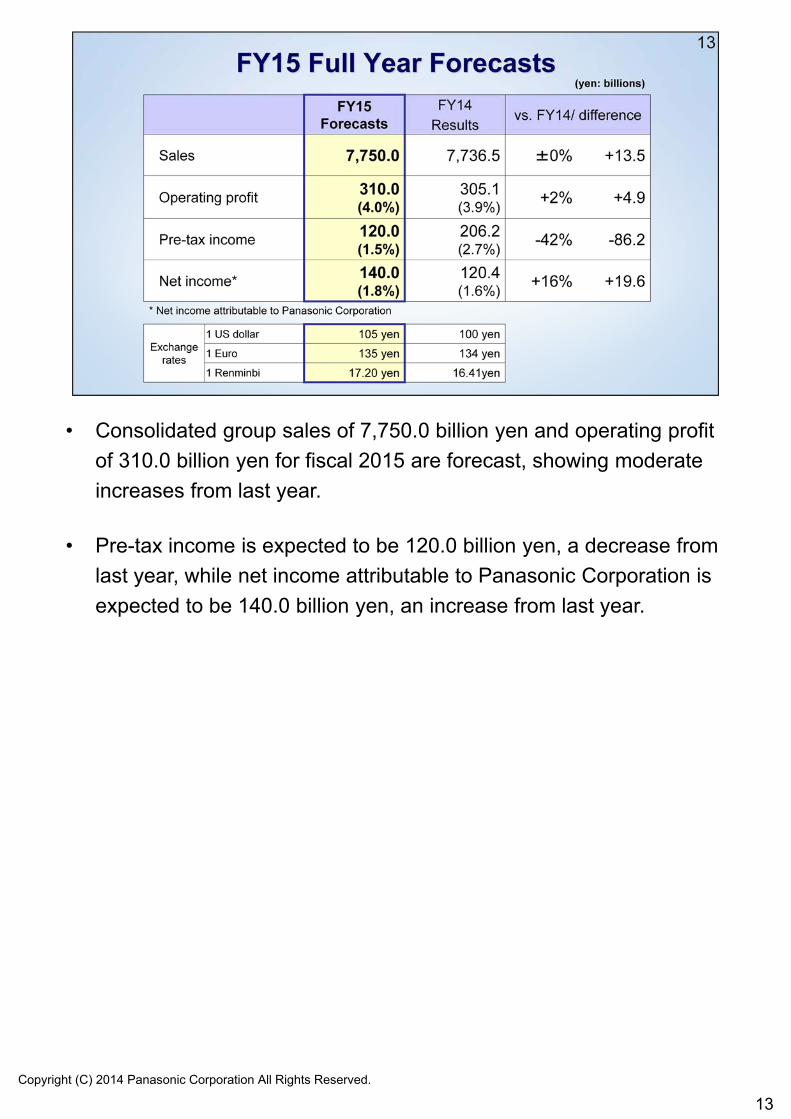
• Consolidated group sales of 7,750.0 billion yen and operating profit
of 310.0 billion yen for fiscal 2015 are forecast, showing moderate
increases from last year.
• Pre-tax income is expected to be 120.0 billion yen, a decrease from
last year, while net income attributable to Panasonic Corporation is
expected to be 140.0 billion yen, an increase from last year.
Copyright (C) 2014 Panasonic Corporation All Rights Reserved.
14
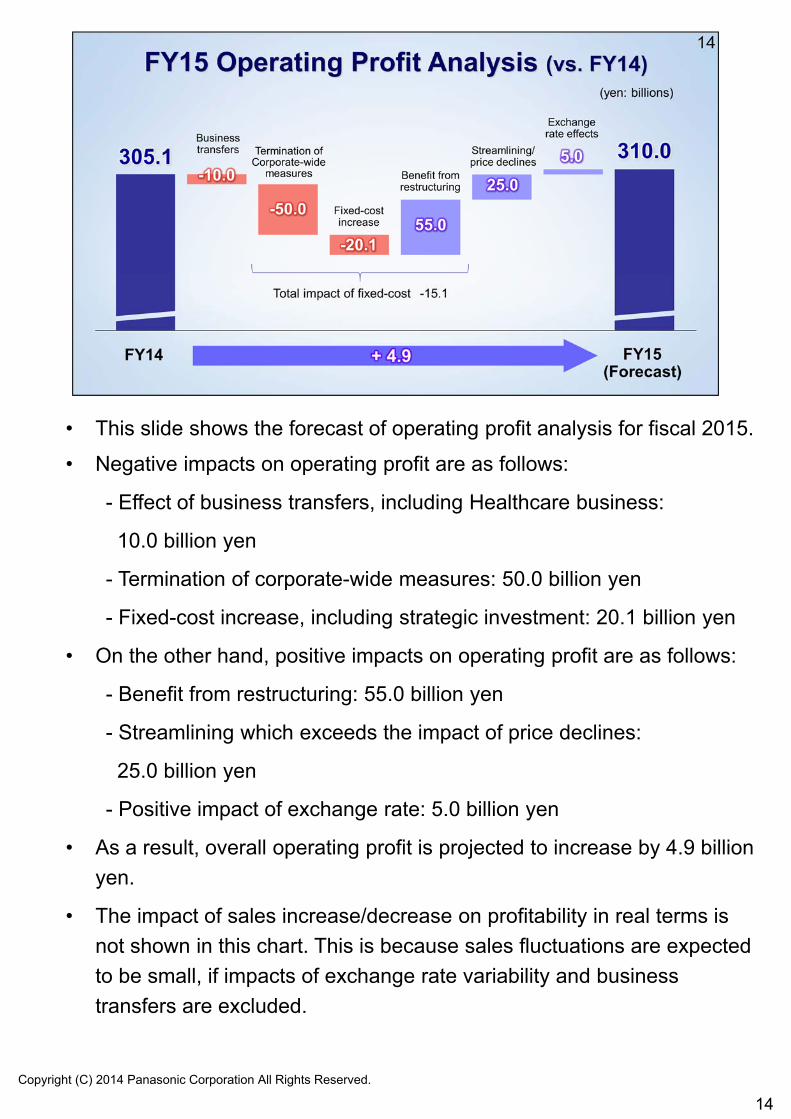
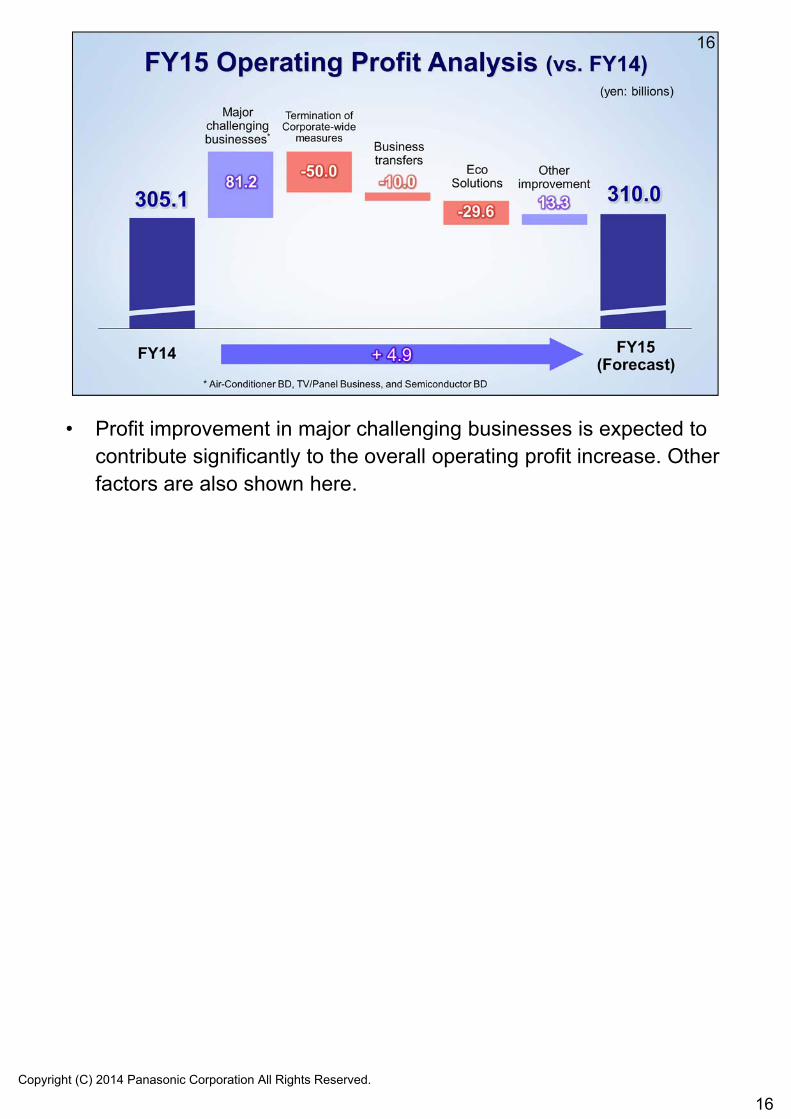
• This slide shows the forecast of operating profit analysis for fiscal 2015.
• Negative impacts on operating profit are as follows:
- Effect of business transfers, including Healthcare business:
10.0 billion yen
- Termination of corporate-wide measures: 50.0 billion yen
- Fixed-cost increase, including strategic investment: 20.1 billion yen
• On the other hand, positive impacts on operating profit are as follows:
- Benefit from restructuring: 55.0 billion yen
- Streamlining which exceeds the impact of price declines:
25.0 billion yen
- Positive impact of exchange rate: 5.0 billion yen
• As a result, overall operating profit is projected to increase by 4.9 billion
yen.
• The impact of sales increase/decrease on profitability in real terms is
not shown in this chart. This is because sales fluctuations are expected
to be small, if impacts of exchange rate variability and business
transfers are excluded.
Copyright (C) 2014 Panasonic Corporation All Rights Reserved.
15
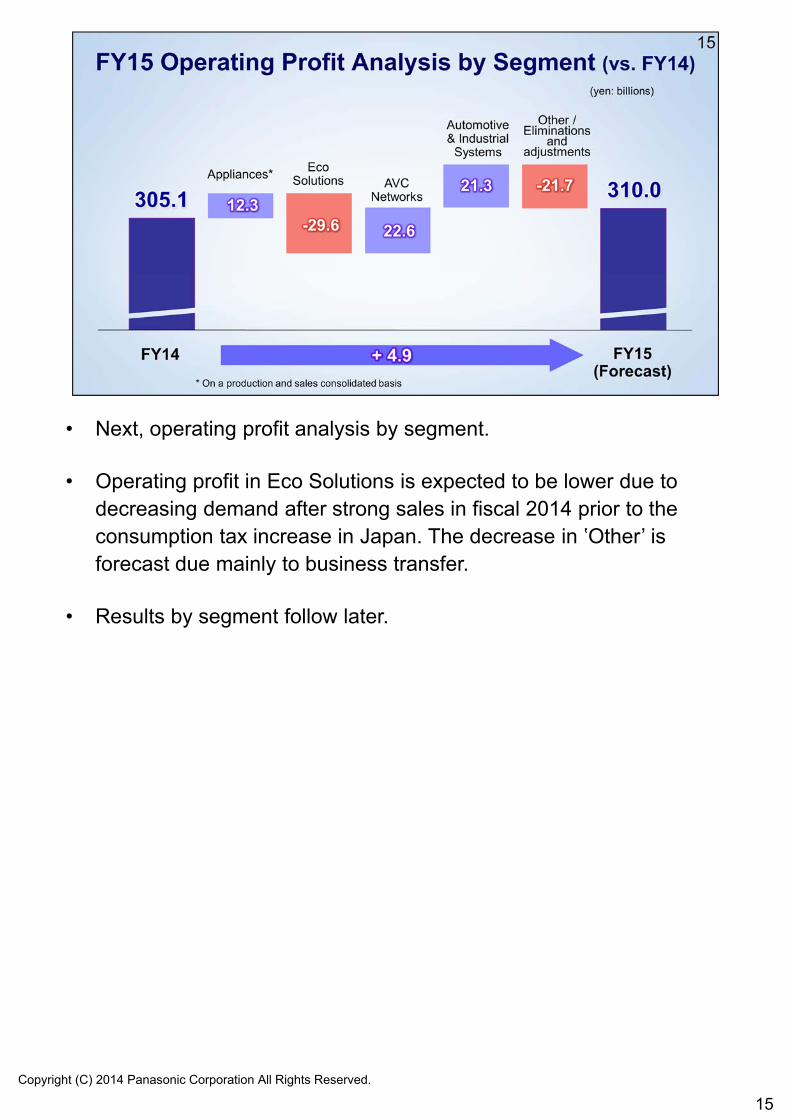
• Next, operating profit analysis by segment.
• Operating profit in Eco Solutions is expected to be lower due to decreasing demand after strong sales in fiscal 2014 prior to the consumption tax increase in Japan. The decrease in ‛Other’ is forecast due mainly to business transfer.
• Results by segment follow later.
Copyright (C) 2014 Panasonic Corporation All Rights Reserved.
16
• Profit improvement in major challenging businesses is expected to contribute significantly to the overall operating profit increase. Other factors are also shown here.
Copyright (C) 2014 Panasonic Corporation All Rights Reserved.
17
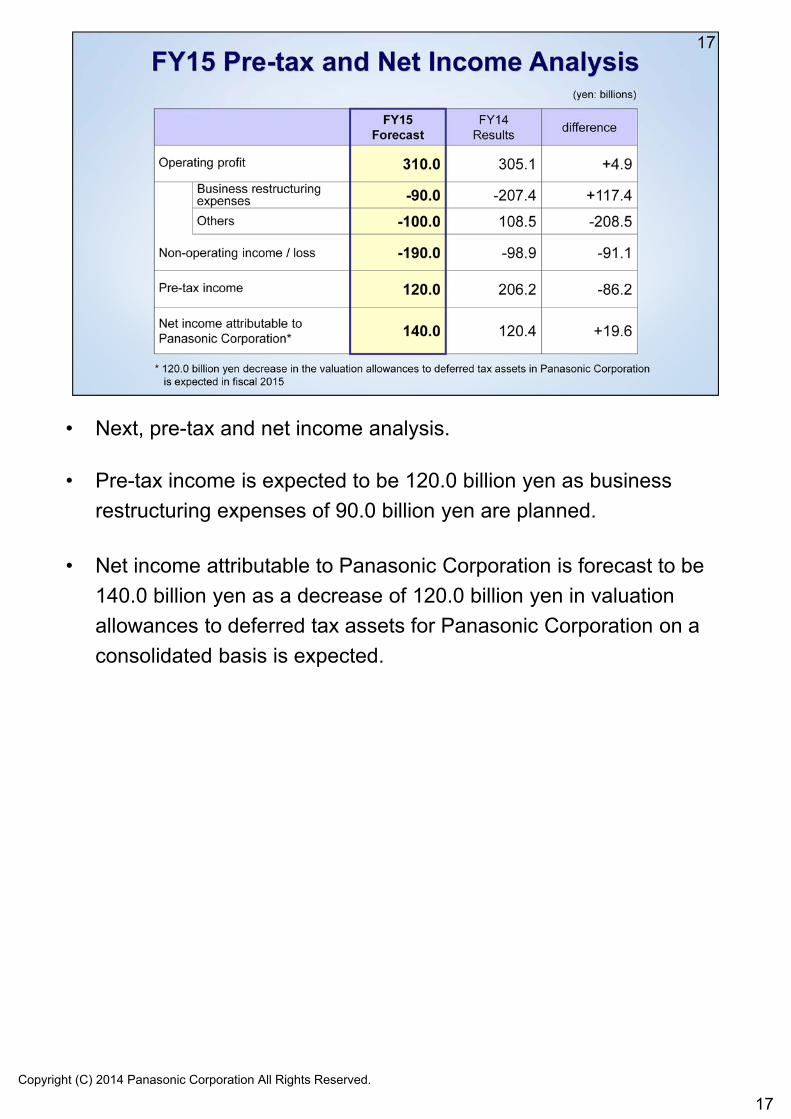
• Next, pre-tax and net income analysis.
• Pre-tax income is expected to be 120.0 billion yen as business
restructuring expenses of 90.0 billion yen are planned.
• Net income attributable to Panasonic Corporation is forecast to be
140.0 billion yen as a decrease of 120.0 billion yen in valuation
allowances to deferred tax assets for Panasonic Corporation on a
consolidated basis is expected.
Copyright (C) 2014 Panasonic Corporation All Rights Reserved.
18
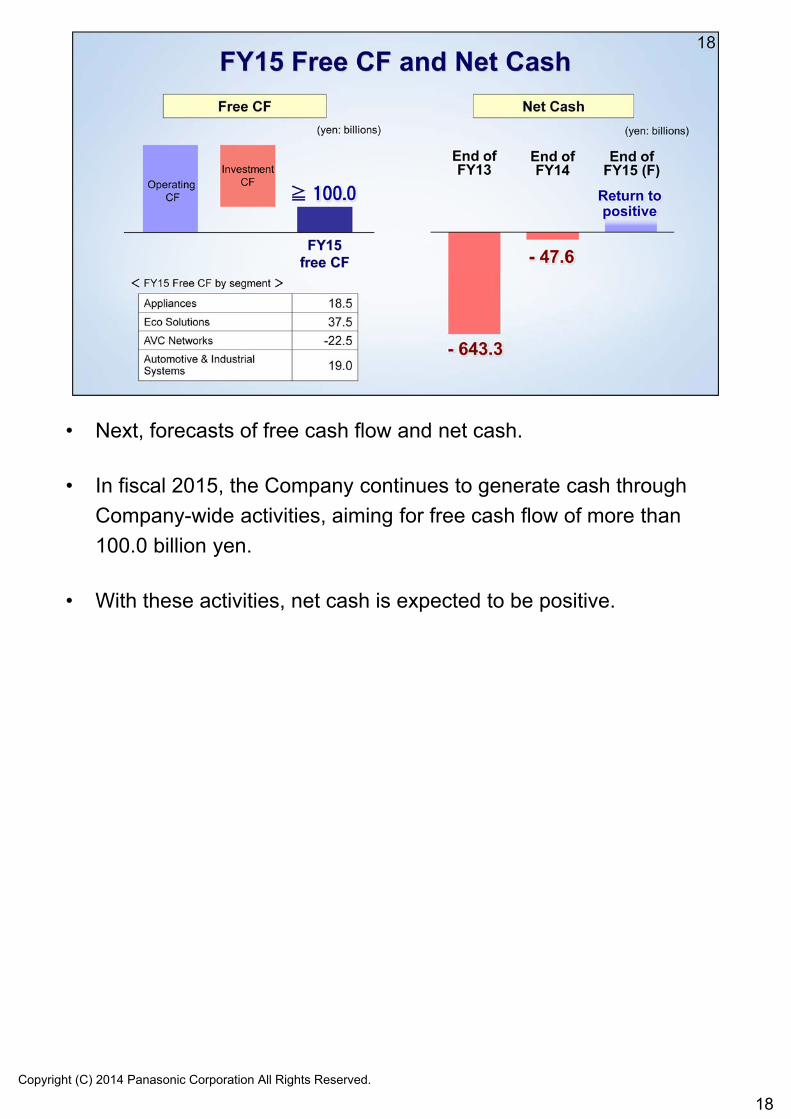
• Next, forecasts of free cash flow and net cash.
• In fiscal 2015, the Company continues to generate cash through
Company-wide activities, aiming for free cash flow of more than
100.0 billion yen.
• With these activities, net cash is expected to be positive.
Copyright (C) 2014 Panasonic Corporation All Rights Reserved.
19
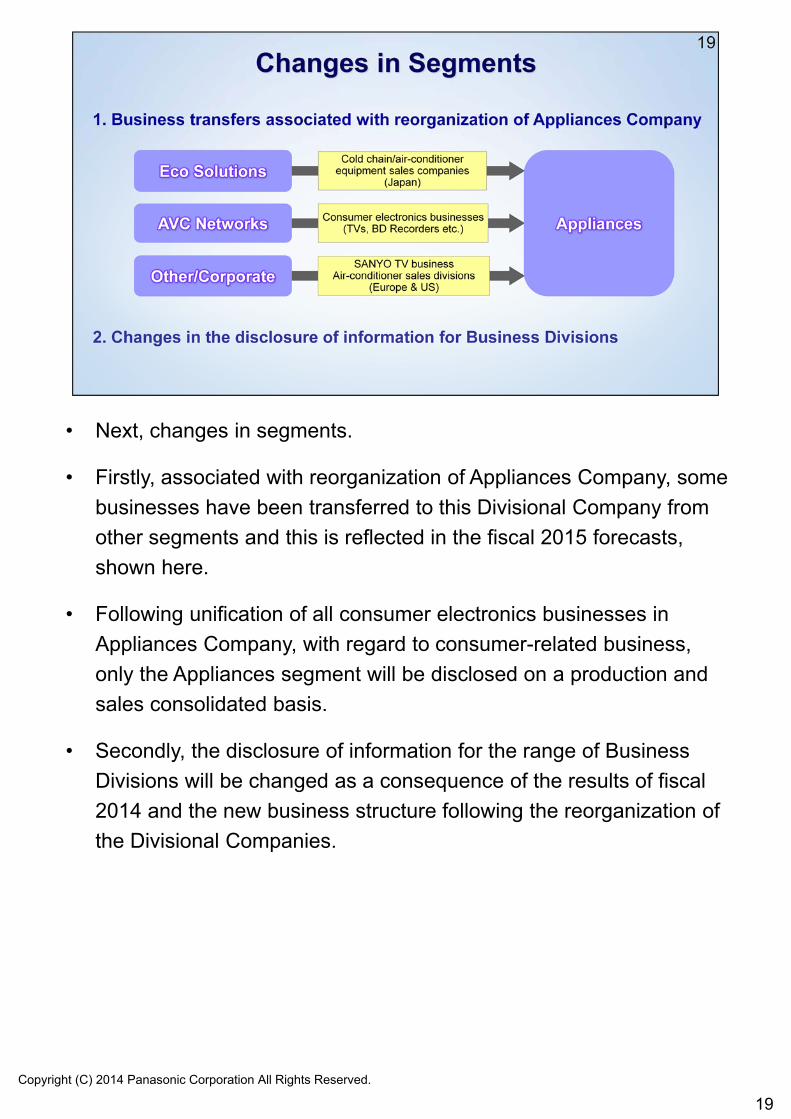
• Next, changes in segments.
• Firstly, associated with reorganization of Appliances Company, some
businesses have been transferred to this Divisional Company from
other segments and this is reflected in the fiscal 2015 forecasts,
shown here.
• Following unification of all consumer electronics businesses in
Appliances Company, with regard to consumer-related business,
only the Appliances segment will be disclosed on a production and
sales consolidated basis.
• Secondly, the disclosure of information for the range of Business
Divisions will be changed as a consequence of the results of fiscal
2014 and the new business structure following the reorganization of
the Divisional Companies.
Copyright (C) 2014 Panasonic Corporation All Rights Reserved.
20
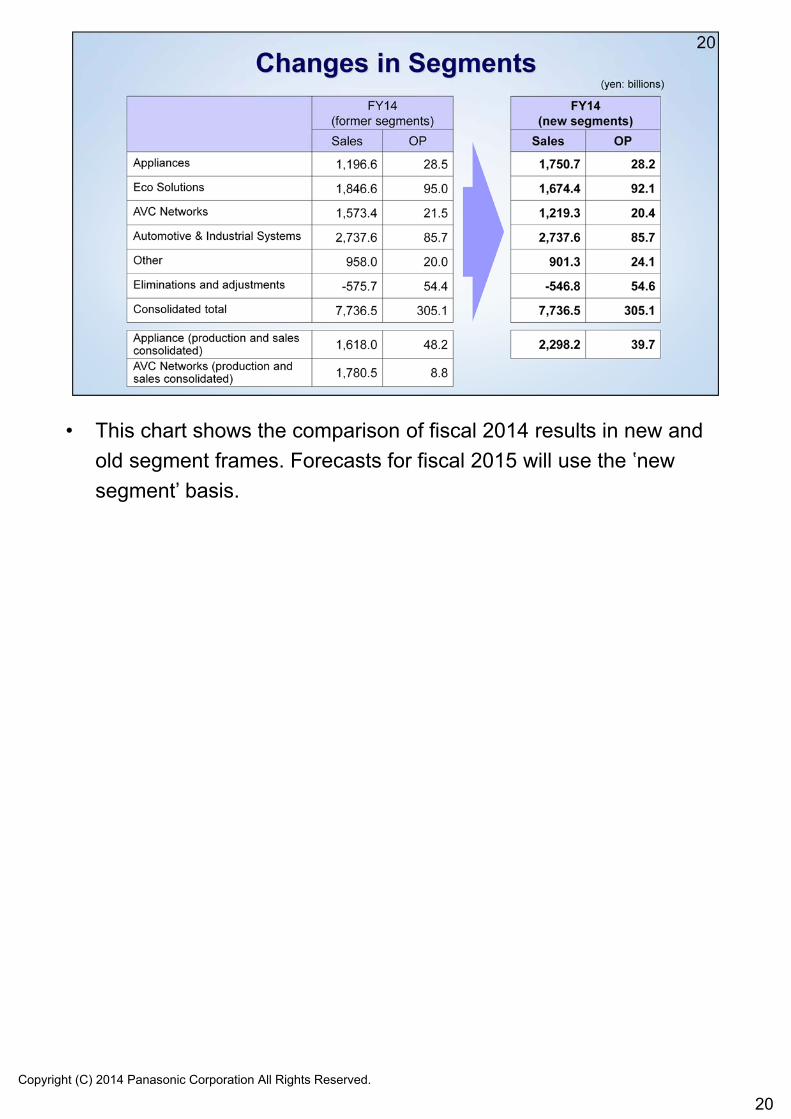
• This chart shows the comparison of fiscal 2014 results in new and
old segment frames. Forecasts for fiscal 2015 will use the ‛new
segment’ basis.
Copyright (C) 2014 Panasonic Corporation All Rights Reserved.
21
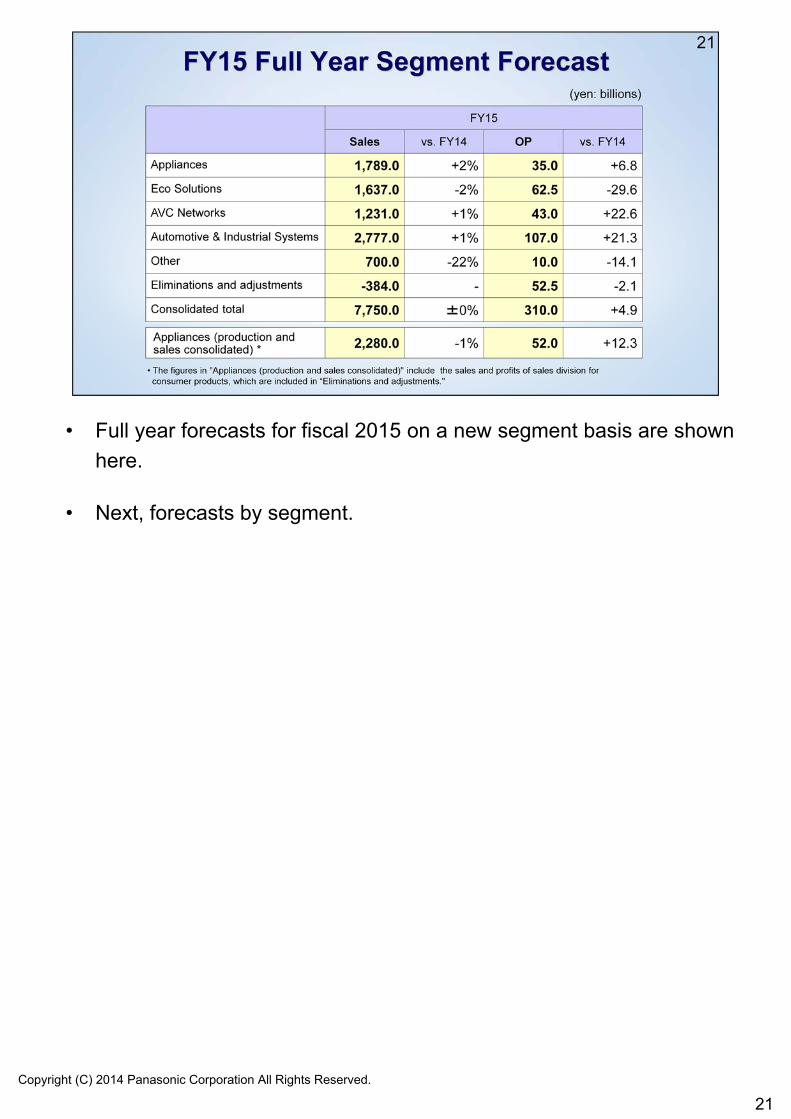
• Full year forecasts for fiscal 2015 on a new segment basis are shown
here.
• Next, forecasts by segment.
Copyright (C) 2014 Panasonic Corporation All Rights Reserved.
22
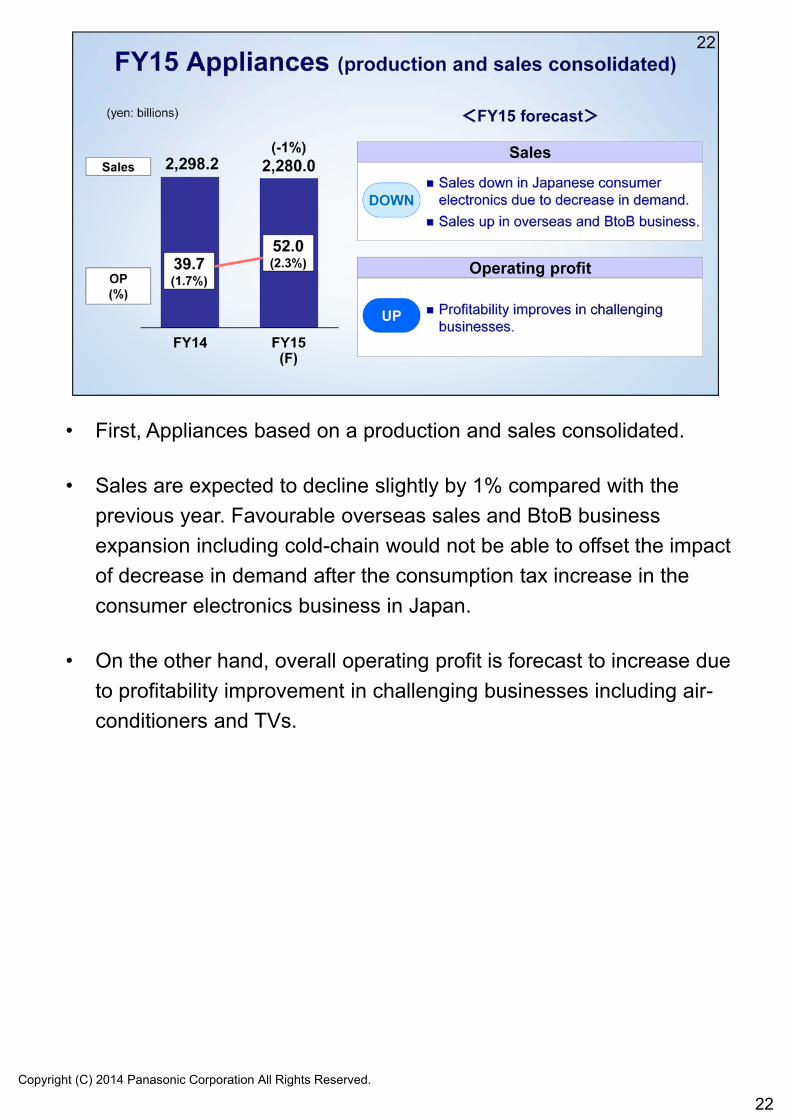
• First, Appliances based on a production and sales consolidated.
• Sales are expected to decline slightly by 1% compared with the
previous year. Favourable overseas sales and BtoB business
expansion including cold-chain would not be able to offset the impact
of decrease in demand after the consumption tax increase in the
consumer electronics business in Japan.
• On the other hand, overall operating profit is forecast to increase due
to profitability improvement in challenging businesses including air-
conditioners and TVs.
Copyright (C) 2014 Panasonic Corporation All Rights Reserved.
23
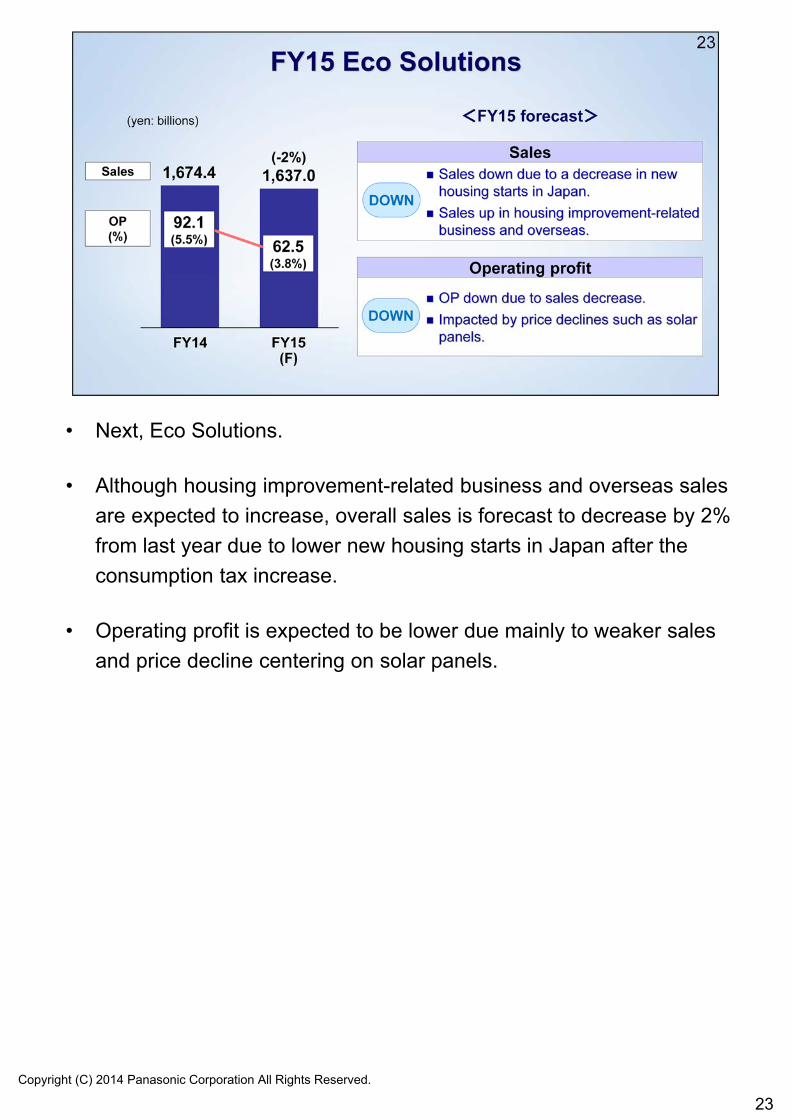
• Next, Eco Solutions.
• Although housing improvement-related business and overseas sales
are expected to increase, overall sales is forecast to decrease by 2%
from last year due to lower new housing starts in Japan after the
consumption tax increase.
• Operating profit is expected to be lower due mainly to weaker sales
and price decline centering on solar panels.
Copyright (C) 2014 Panasonic Corporation All Rights Reserved.
24
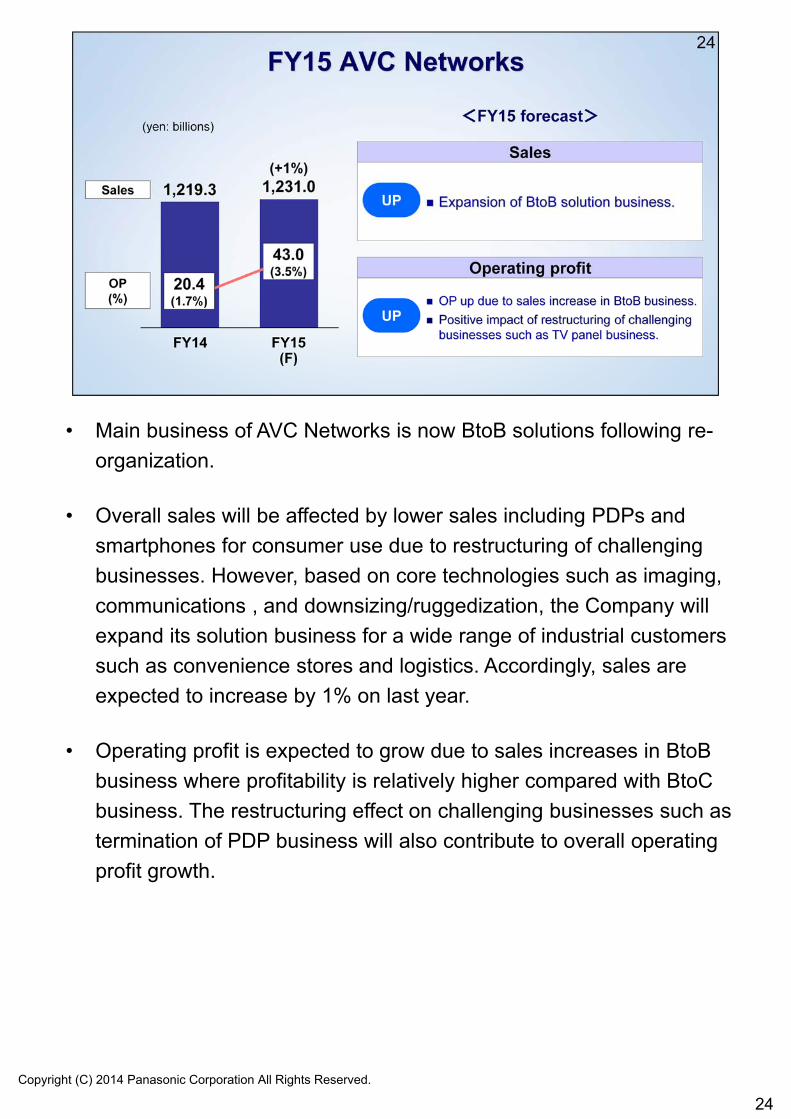
• Main business of AVC Networks is now BtoB solutions following re-
organization.
• Overall sales will be affected by lower sales including PDPs and
smartphones for consumer use due to restructuring of challenging
businesses. However, based on core technologies such as imaging,
communications , and downsizing/ruggedization, the Company will
expand its solution business for a wide range of industrial customers
such as convenience stores and logistics. Accordingly, sales are
expected to increase by 1% on last year.
• Operating profit is expected to grow due to sales increases in BtoB
business where profitability is relatively higher compared with BtoC
business. The restructuring effect on challenging businesses such as
termination of PDP business will also contribute to overall operating
profit growth.
Copyright (C) 2014 Panasonic Corporation All Rights Reserved.
25
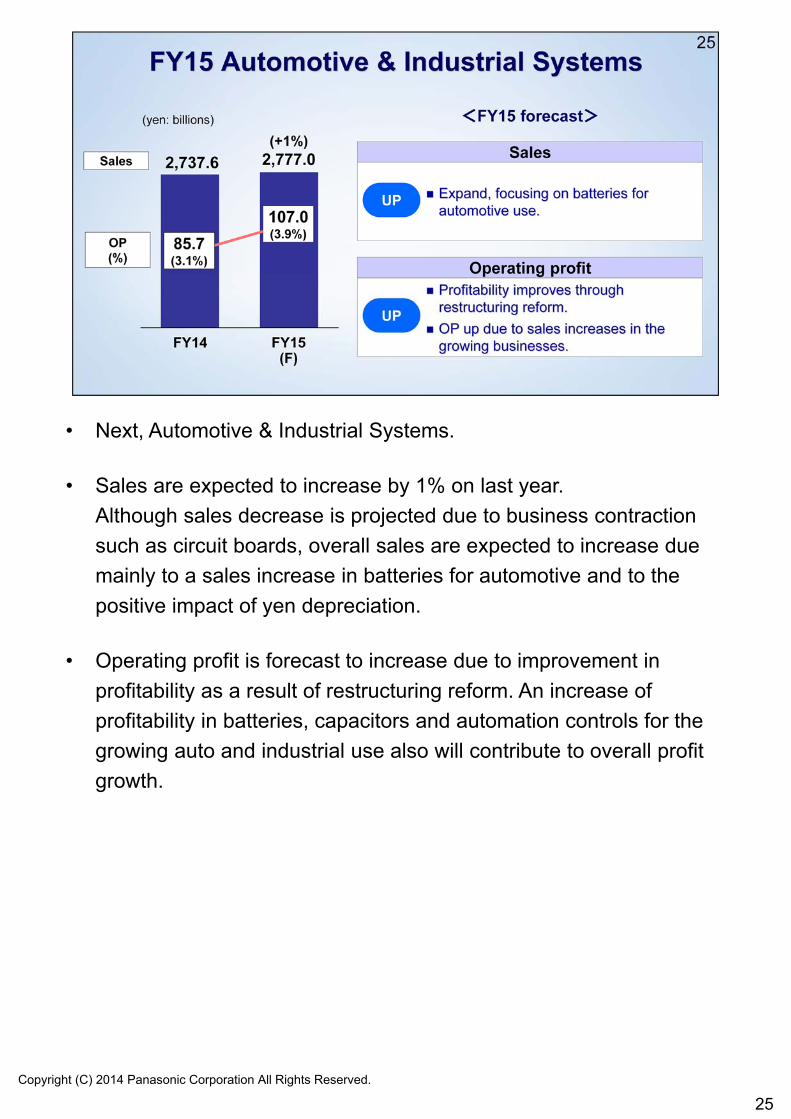
• Next, Automotive & Industrial Systems.
• Sales are expected to increase by 1% on last year.
Although sales decrease is projected due to business contraction
such as circuit boards, overall sales are expected to increase due
mainly to a sales increase in batteries for automotive and to the
positive impact of yen depreciation.
• Operating profit is forecast to increase due to improvement in
profitability as a result of restructuring reform. An increase of
profitability in batteries, capacitors and automation controls for the
growing auto and industrial use also will contribute to overall profit
growth.
Copyright (C) 2014 Panasonic Corporation All Rights Reserved.
26
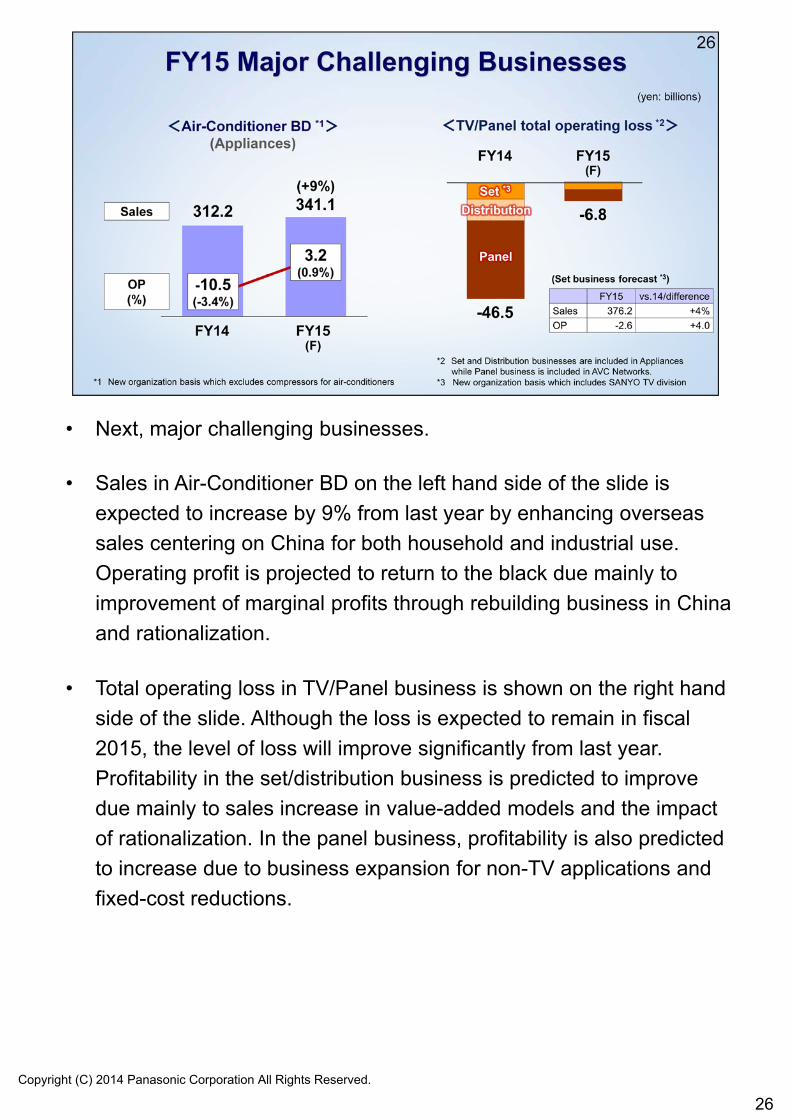
• Next, major challenging businesses.
• Sales in Air-Conditioner BD on the left hand side of the slide is
expected to increase by 9% from last year by enhancing overseas
sales centering on China for both household and industrial use.
Operating profit is projected to return to the black due mainly to
improvement of marginal profits through rebuilding business in China
and rationalization.
• Total operating loss in TV/Panel business is shown on the right hand
side of the slide. Although the loss is expected to remain in fiscal
2015, the level of loss will improve significantly from last year.
Profitability in the set/distribution business is predicted to improve
due mainly to sales increase in value-added models and the impact
of rationalization. In the panel business, profitability is also predicted
to increase due to business expansion for non-TV applications and
fixed-cost reductions.
Copyright (C) 2014 Panasonic Corporation All Rights Reserved.
27
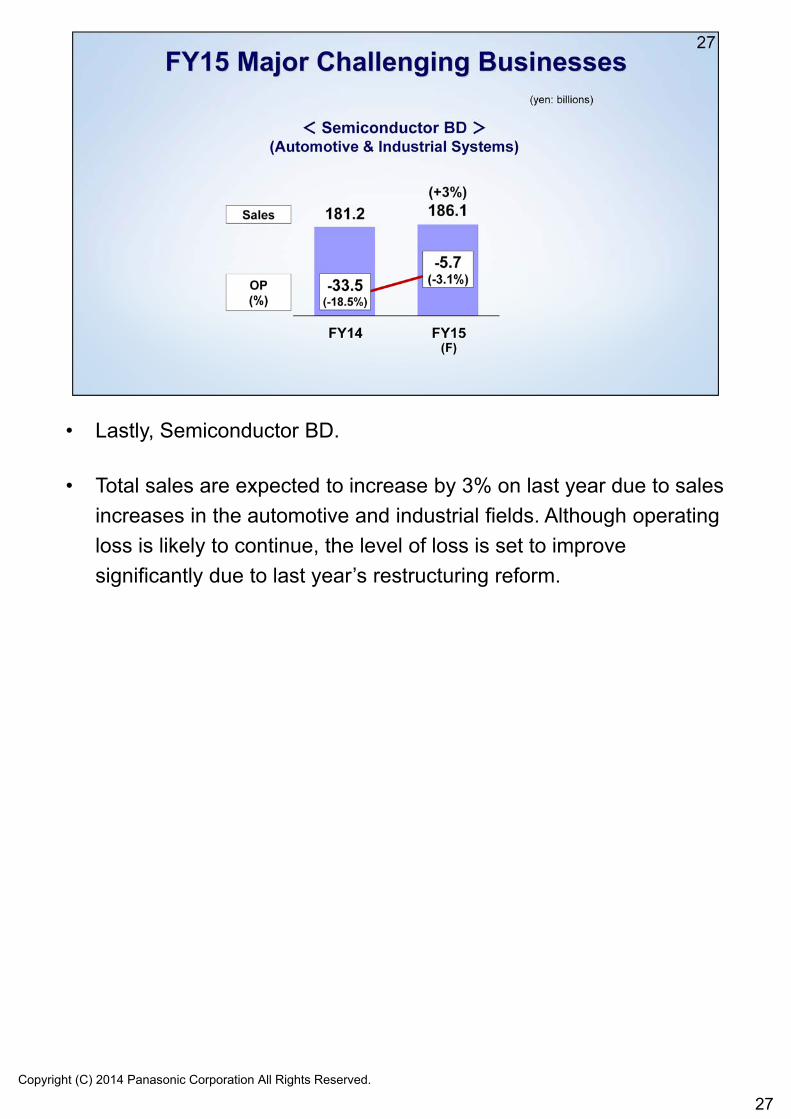
• Lastly, Semiconductor BD.
• Total sales are expected to increase by 3% on last year due to sales
increases in the automotive and industrial fields. Although operating
loss is likely to continue, the level of loss is set to improve
significantly due to last year’s restructuring reform.
Copyright (C) 2014 Panasonic Corporation All Rights Reserved.
28
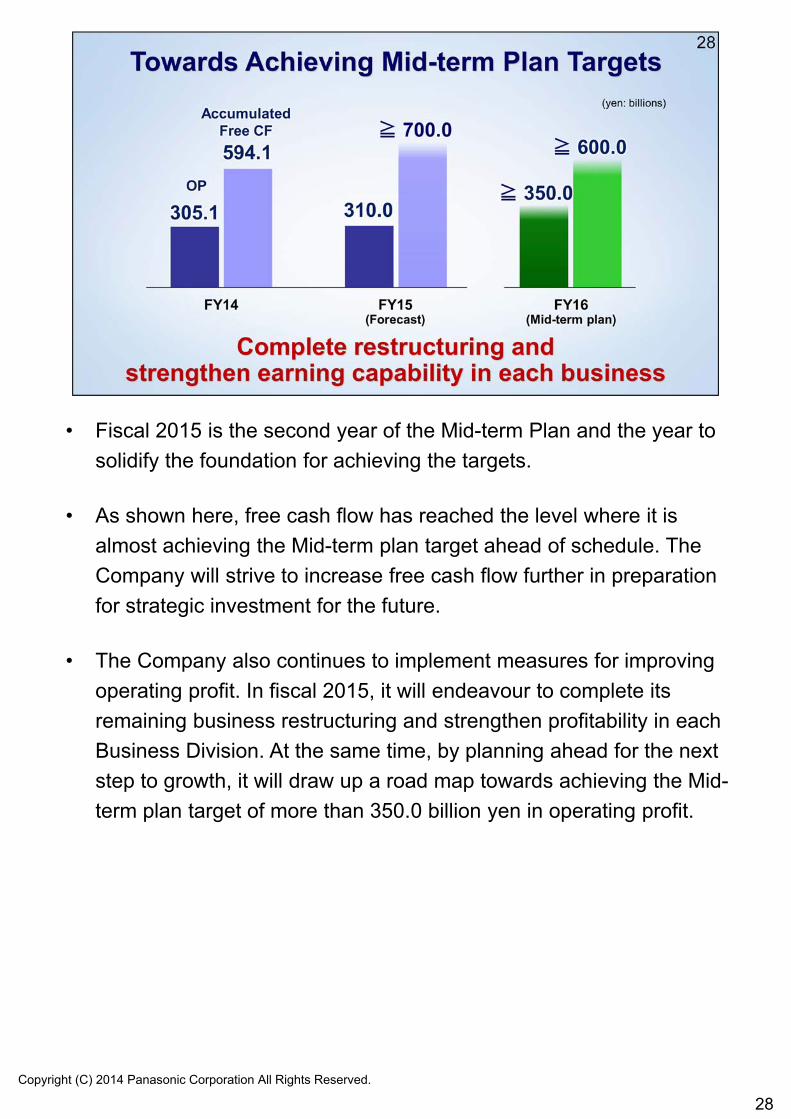
• Fiscal 2015 is the second year of the Mid-term Plan and the year to
solidify the foundation for achieving the targets.
• As shown here, free cash flow has reached the level where it is
almost achieving the Mid-term plan target ahead of schedule. The
Company will strive to increase free cash flow further in preparation
for strategic investment for the future.
• The Company also continues to implement measures for improving
operating profit. In fiscal 2015, it will endeavour to complete its
remaining business restructuring and strengthen profitability in each
Business Division. At the same time, by planning ahead for the next
step to growth, it will draw up a road map towards achieving the Mid-
term plan target of more than 350.0 billion yen in operating profit.
Copyright (C) 2014 Panasonic Corporation All Rights Reserved.
29
• Thank you for your continued support.
Copyright (C) 2014 Panasonic Corporation All Rights Reserved.
30
Copyright (C) 2014 Panasonic Corporation All Rights Reserved.
31