
Thermodynamic Structure of Tropical Cyclones From Aircraft Reconnaissance Kay Shelton University at...
11
Thermodynamic Thermodynamic Structure of Tropical Structure of Tropical Cyclones From Aircraft Cyclones From Aircraft Reconnaissance Reconnaissance Kay Shelton University at Albany/SUNY, Albany, New York
-
date post
21-Dec-2015 -
Category
Documents
-
view
227 -
download
3
Transcript of Thermodynamic Structure of Tropical Cyclones From Aircraft Reconnaissance Kay Shelton University at...

Thermodynamic Structure Thermodynamic Structure of Tropical Cyclones From of Tropical Cyclones From Aircraft ReconnaissanceAircraft Reconnaissance
Kay SheltonUniversity at Albany/SUNY,
Albany, New York

• US Air Force reconnaissance flights.– Archive maintained by John Knaff (CIRA).
• 1995-2003, 77 storms 619 flights.• Equivalent potential temperature e.
– Bolton (1980).
• Case-study: Bret, 1999.– Comparison of e and windspeed through storm
evolution from tropical depression through to category 4 hurricane.
• Composite of all storms.– Data every 30s, averaged into 20km radial bins
– (>5 points per bin to be included)– Categorised average e profiles by level and
intensity.
DATA AND METHODOLOGYDATA AND METHODOLOGY

• Instrument wetting errors (IWE). – Eastin et al. (2002).
LIMITATIONLIMITATION
Adapted from Eastin et al. 2002b
• IWE minimised away from eyewall.
• In eyewall, maximum mean error < 3K.
• Removal of IWE acts to move maximum radial gradient towards outer edge of eyewall.
• Errors may be larger for individual cases.

• Hurricane Bret, 1999.
– Organised to TD at 18Z on 18th August, in Bay of Campeche.
– Bret strengthened to category 4, then decreased to category 3 prior to landfall on Padre Island, TX at 00Z on 23rd August.
– Scatter plots of e and windspeed in six flights will be shown.
CASE STUDYCASE STUDY

<500m TD-TS
TS <500m
<500m
<500m
e Windspeed

TS
H1-H2
~850hPa
~850hPa
~850hPa
~850hPa
37.5km
e Windspeed
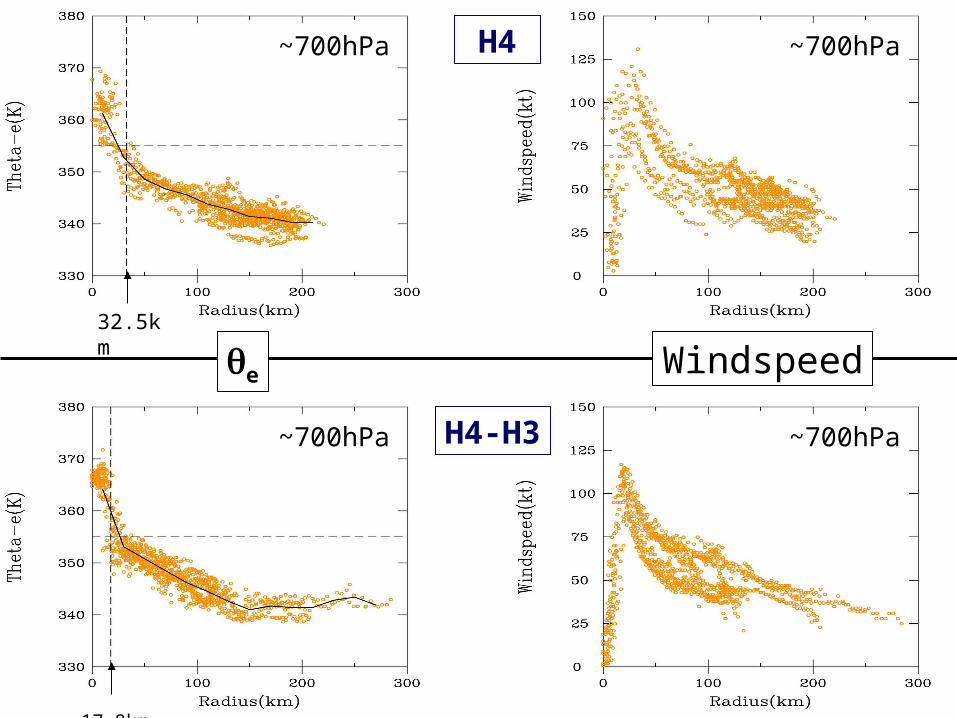
H4
H4-H3
~700hPa
~700hPa~700hPa
~700hPa
17.8km
32.5km e Windspeed

COMPOSITECOMPOSITE
Intensity LevelMax. # Flights
TD <500m 52
<500m 138
~850hPa 115
~850hPa 73
~700hPa 67
H2 ~700hPa 47
H3 ~700hPa 47
H4 ~700hPa 34
TS
H1
• Flight level must increase as storms intensify.
• Weaker systems have fewer flights above PBL, stronger systems have fewer flights below 700hPa.
• Comparison between levels at a given intensity is limited to TS and H1.

COMPOSITE COMPOSITE INWARD RADIAL INWARD RADIAL GRADIENT OF GRADIENT OF ee -
e/
r (K/100km)
-
e/
r (K/100km)
-
e/
r (K/100km)
<500m
~850hPa ~700hPa

ee DIFFERENCE BETWEEN 2 DIFFERENCE BETWEEN 2 LEVELSLEVELS
TS: e(BL) – e(850hPa) H1: e(850hPa) – e(700hPa)
e (
K)
Arrows indicate relevant tropical environment e/p (Jordan, 1958)

SUMMARYSUMMARYRADIAL
• TD: |e/r| ~ 0 at all radii• TS: e increases first in the core (r<90km)• H1-H4: |e/r| increases with intensity, within
r=100km
VERTICAL• TS and H1: In lower troposphere convective
instability increases outward.– Both profiles are close to convective neutrality near
storm centre and convective instability increases outwards to their respective tropical environmental values.