Thermocouple materials - GPO · metals 39 102.Electricalresistivitiesofceramicinsulating materials...
54
NBS MONOGRAPH 40 Thermocouple Materials U.S. DEPARTMENT OF COMMERCE NATIONAL BUREAU OF STANDARDS
Transcript of Thermocouple materials - GPO · metals 39 102.Electricalresistivitiesofceramicinsulating materials...

NBS MONOGRAPH 40
Thermocouple Materials
U.S. DEPARTMENT OF COMMERCE
NATIONAL BUREAU OF STANDARDS

UNITED STATES DEPARTMENT OF COMMERCE • Luther H. Hodges, Secretary
NATIONAL BUREAU OF STANDARDS • A. V. Astin, Director
Thermocouple Materials
F. R. Caldwell
National Bureau of Standards Monograph 40
Issued March 1, 1962
Reprinted with corrections, February 1969
For sale by the Superintendent of Documents, U.S. Government Printing Office
Washington, D.C. 20402 - Price 50 cents

ContentsPage
1. Introduction 1
2. Bare thermocouple wires 2
2.1. Noble metals 2
a. Platinum and platinum-rliodimn alloys 2
b. Iridium versus iridium-rhodium alloys 10
c. Platinum-iridium 15 percent versus palladium 13
d. Platinel thermocouples 16
2.2. Base metals 16
a. ISA type K thermocouples 17
b. Geminol thermocouples 18
c. Iron-constantan thermocouples (ISA types Y and J) 19
d. Copper-constantan thermocouples (ISA type T) 20
e. Chromel-constantan thermocouples 21
f. Properties of base-metal thermocouple materials 21
2.3. Refractory metals 29
2.4. Carbon and carbides 35
3. Ceramic-packed thermocouple stock 37
3.1. Thermocouple wires 37
4. Conclusion 39
5. References 39
6. Appendix 42
ii
Tables
Page
1. Errors due to assuming the temperature of thereference junction of a Pt-Rh 30% versusPt-Rh 6% thermocouple to be at 0 °C whenit is at some higher temperature 3
2. Errors due to assuming the temperature of thereference junction of a Pt-Rh 10% versusPt thermocouple to be at 0 °C when it is atsome higher temperature 3
3. Thermal emf and thermoelectric power of typeR, type S, and Pt-Rh 30% versus Pt-Rh 6%(30-6) thermocouples 4
4. Grades of platinum 65. Tensile strenaiths of platinum and platinum-
rhodium 10% at room temperature and at1,000 °C (1,832 °F) 6
6. Tensile strength of platinum-rhodium 10% atelevated temperatures 6
7. Tensile strengths of several platinum-rhodiumalloys at 20 °C (68 °F) 7
8. Proportional limits of platinum and platinum-rhodium 10% 7
9. Relative electrical resistivities at temperaturesto 1,500 °C of platinum, Pt-Rh 10%, andPt-Rh 13% 7
10. Electrical resistivity at 20 °C of four Pt-Rhalloys 7
11. Density at 20 °C of some platinum-rhodiumalloys 7
12. Thermal expansion of platinum, Pt-Rh 20%,and rhodium relative to length at 0 °C{I,Ho) 8
13. Mean specific heat above 20 °C of platinum 814. True specific heats of platinum and rhodium. _ 815. Thermal conductivity of platinum 816. Total emissivity, e, of platinum 917. Spectral emissivities of platinum 918. Emissivity and brightness temperature of
platinum at 0.660 n 919. Spectral emissivity of platinum in the infrared
at 1,125 °C 920. Volatilization of platinum in vacuo 921-. Calculated liquidus-solidus temperatures for
three iridium-rhodium alloys 1022. Thermal emf of iridium versus Pt 27 1223. Temperature coefficient of electrical resistance
of iridium 1224. Electrical resistivity of iridium 1225. Thermal expansion of iridium relative to length
atO°C(Z,/Zo) 1226. True specific heat of iridium 1327. Normal spectral emissivities of iridium at
295 °K 1328. Reflectivity of iridium 1329. Thermal emf of platinum-iridium 15% and
palladium versus Pt 27 1330. Ultimate tensile strength of platinum-iridium
alloys, psi 1431. Tensile strength of commercial palladium at
temperatures up to 1,100 °C 1432. Electrical resistivity and temperature coeffi-
cient of resistance of some platinum-iridiumalloys 15
33. Electrical resistivity of palladium at tempera-tures up to 1,400 °C, and relative resistivity
up to 800 °C 1534. Coefficient of thermal expansion of the plati-
num-iridium 20% alloy 1535. Thermal expansion of palladium 1536. True and mean specific heats of palladium 1537. Total emissivity of palladium 1638. Properties of Platinel 1639. Calibration of Platinel thermocouples 1640. ISA types of base-metal thermocouples 17
41. Special tolerances for different sizes of Chromel-Alumel thermocouple wire 17
42. Maximum recommended operating tempera-tures for type K thermocouples 17
43. Changes in the calibration of Chromel-Alumel(type K) thermocouples heated in air (elec-
tric furnace) ^ 1844. Thermoelectric power of Geminol 1845. Maximum recommended temperatures for
Geminol thermocouples 1946. Recommended upper temperatures for diiferent
wire sizes, iron-constantan 1947. Changes in the calibration of iron-constantan
thermocouples heated in air (electric furnace) 2048. Recommended upper temperatures for different
wire sizes, copper-constantan 2049. Thermal electromotive force of different sizes
of constantan wire drawn from the same coil
(reference material NBS Pt 27) 2050. Thermoelectric power of the Chromel-constan-
tan thermocouple - _ 2151. Compositions of type K thermocouples.
, 2152. Some physical properties of type K thermo-
couple wires 2253. Resistance of type K thermocouple wires at
elevated temperatures 2254. Resistance and length per pound of several
sizes of Chromel-Alumel and Kanthal wires. 2255. Thermal coefficient of expansion of Tophel and
J^jg^J 2356. Specific heat or80'%Ni-20%'Cr]!!]"'"III" 2357. Thermal conductivity of Tophel and Nial 2358. Calibrations for Chromel-platinum and Alumel-
platinum thermocouples 2359. Some physical properties of Geminol P and
Geminol N 2460. Resistance and length per pound of several sizes
of Geminol P and Geminol N wires 2461. Thermal emf of Geminol P and Geminol N
versus Pt 27 2462. Chemical and spectrographic analyses of iron
samples 2463. Variation of tensile strength and modulus of
elasticity of Armco iron with temperature 2564. Results of hardness measurements on samples
of iron wire 2565. Electrical resistivity of iron relative to the re-
sistivity at 0 °C {R,/Ro) 2566. Thermal expansion of electrolytic iron 2667. True and mean specific heats of electrolytic
iron 2668. Thermal conductivity of Armco iron 2669. Thermal emf of iron versus Pt 27 2670. Some comparative stress-strain relations of
tough-pitch and oxygen-free copper 2771. Softening temperature of pure copper contain-
ing individual impurity additions 2772. Some physical properties of copper 2773. Electrical resistivity of copper relative to the
resistivity at 0 °C {R,/Ro) 2874. True and mean thermal coefficients of expan-
sion of copper 2875. True and mean specific heats of copper 2876. Thermal conductivity of copper 2877. Thermal emf of copper relative to platinum 2878. Some properties of constantan 2979. Thermal emf of constantan versus Pt 27 2980. Electrical resistivity of constantan (55'Cu-45
Ni) relative to the resistivity at 0 °C {R,/Ro) . 2981. Physical properties of tungsten 3082. Chemical properties of tungsten 3183. Physical properties of molybdenum 3184. Chemical properties of molybdenum 32
iii
Tables—Continued
Page
85. Thermal emf of the tungsten versus molyb-denum thermocouple 32
86. Analysis of rhenium, molybdenum, and tung-sten 33
87. Tensile and elongation data for annealed andcold-rolled rhenium sheet 33
88. Electrical resistivity of rhenium from 20 to2,400 °C 33
89. Specific heat of rhenium 3390. Linear thermal expansion of rhenium 3391. Spectral emissivity of rhenium 3492. Thermal emfs of W versus Re and Mo versus
Re thermocouples [106] 3493. Thermal emfs of W versus Re and Mo versus
Re thermocouples [122] 3494. Calibration data for tungsten versus rhenium-
alloy thermocouples and for thermocouplesof two tungsten-rhenium alloys 34
95. Chemical analyses of tungsten-rhenium alloys
and tungsten 3496. Thermal emf of the tungsten versus iridium
thermocouple 3597. Thermocouples using carbon and its modifica-
tions 3698. Dimensions and wire sizes of available ceramic-
packed stock 3899. Sheath materials for ceramic-packed thermo-
couple stock and some of their properties 38
Page
100. Quality of and some thermal data on insulatingmaterials used in ceramic-packed thermo-couple stock 38
101. Comparison of the average coefficients ofthermal expansion of refractory insulatingmaterials with those of three commonmetals 39
102. Electrical resistivities of ceramic insulatingmaterials 39
1-A. Condensed calibration for the platinum 70%-rhodium 30% versus platinum 94%-rho-dium 6% thermocouple 42
2-A. Condensed reference table for the iridium40%-rhodium 60% versus iridium thermo-couple 43
3-A. Thermal emf of iridium 40%-rhodium 60%versus copper and of copper versus iridium. 43
4-A. Condensed reference table for the platinum85%-iridium 15% versus palladium thermo-couple 43
5-A. Thermal emf of platinum 85%-iridium 15%versus copper and of copper versus pal-
ladium 436-A. Condensed calibration data for Geminol P
and N thermocouple 437-A. Calibration data for iridium 60%-rhodium
40% versus iridium thermocouple 43
iv
I
Thermocouple Materials
F. R. Caldwell
Thermocouple materials are considered that are used primarily as immersion tempera-ture sensors in the range from 0 °C up. Included are the conventional thermocouples thathave survived since the beginnings of the art of thermoelectric temperature measurement,newer noble metal thermocouples, and thermocouples of refractory metals for use in the-extreme range for immersed sensors. Thermocouples for thermoelectric generators are notconsidered, nor are the types commonly used chiefly in radiation receivers such as thosecontaining antimony, bismuth, and their alloys. Because of the wide use and increasingpopularity of ceramic-packed thermocouples in metal sheaths, they are included.
Limitations of the thermocouple wires are given as to range, stability, environmentincluding atmosphere, magnitude of thermoelectric emf , and accuracy of commercially avail-able materials of standard and extra quality. In addition, properties of the separateelements that are pertinent to the selection or use of thermocouples have been compiled.Among these are: chemical behavior, mechanical properties, specific heat, density, thermalconductivity, thermal coefficient of expansion, emissivity, electrical resistivity, and magneticand catalytic properties.
In the case of the ceramic-paclced thermocouples the following properties are presented:temperature range of the sheath, mechanical properties of the sheath, kinds of packed insula-
tion, resistance between thermocouple wires and between wires and sheath, minimum bendingradius of the packed stock, gas-tightness of the packed insulation, and types of measuringjunctions available, i.e., grounded, ungrounded, bare, totally enclosed, stagnation mounting,etc.
Not all of the above information is presented for all thermocouples, but all that is
readily available in the general literature, catalogs, and by private communication is included.Limitations on use of thermocouples normally are given in the text, and properties of thematerials generally are presented in tables.
1. Introduction
Of the infinite combinations of metals, alloys,
semiconductors, and nonmetals that can be com-bined to form thermocouples, only a few havefound use as temperature sensors. The thermo-couples that have been in common use for fifty
years and more are still predominant, althoughsome special-purpose thermocouples have appearedfrom time to time. Because of the needs of thejet-engine, reactor, and rocket technologies in thehigher temperature ranges, however, new thermo-couples are being developed to meet these recentrequirements.The purpose of this paper is to present informa-
tion on materials that are used from 0 °C up in
thermocouples intended primarily as immersedtemperature sensors, and to give so far as is
practical properties of these materials that mightaffect their use in temperature measurement.This information is provided with the hope thatthe advantages and limitations given for thevarious thermocouples and materials will be of
value to those selecting sensors for particularuses, and that the effort now required in findingneeded properties will be reduced. The materialincluded is from many sources including catalogs,
personal communications on work done at various
laboratories, and the general literature. Thermo-electric generators are not considered, nor are
thermocouples included of the types commonly
* This paper was presented at the Fourth Symposium on Temperature,Its Measurement and Control in Science and Industry; Columbus, Ohio;March 27-31, 1961; sponsored by the American Institute of Physics, theInstrument Society of America, and the National Bureau of Standards.The proceedings will be putiished in book form by the Beinhold PublishingCorporation, New "Sorl!, N, Y.
used in radiation receivers, such as those of
antimony, bismuth and their alloys.
Originally this paper was planned to cover onlybare, unmounted thermocouple elements, butbecause of the wide and increasing use of ceramic-
packed thermocouples, the latter have beenincluded. Because the same wires are used in
both kinds of thermocouples, emphasis on the
ceramic-packed type will be directed chiefly
toward properties of the sheath and insulation.
Justification for inclusion of these properties of
the ceramic-packed thermocouples and not of
insulators for the bare-wire thermocouples may bethought by some to be tenuous, but it arises fromconsideration of the packed stock along with barewires as thermocouple raw material.
Among factors to be considered in selection of athermocouple as an immersed temperature sensor
for a particular use may be for the thermocouplecombination:
Temperature-cmf relationship
Temperature range of useDiameters of wires available, and
For the separate thermocouple elements:
Melting pointEffects of environment on thermoelectric and
mechanical properties
Chemical properties and behaviorMechanical properties
Specific heatDensityThermal conductivityThermal coefficient of expansionEmissivity, spectral and total, of bright and
oxidized surfaces
1
Electrical resistivity
Temperature coefficient of resistance, andMagnetic properties.
Not all of the properties are available for all
thermocouples presented, but all that are readilyaccessible will be given.
In the case of the ceramic-packed stock theforegoing properties are just as important as for
bare thermocouples; and in addition, some otherfactors must be taken into account, such as:
Temperature range of the sheathMechanical properties of the sheathKinds of packed insulation
Resistance between wires, and between wiresand sheath
Minimum bending radius of the packed stockGas-tightness of the packed insulation, andTypes of measuring junctions available, i.e.
grounded, ungrounded, bare, totally en--
closed, stagnation mounting, etc.
References are made by numbers in the text to
corresponding numbers of entries in the Bibli-
ography Section. No attempt has been made to
provide complete coverage of the literature, andomission of a title from the list of references is
not intended as an implication of any inadequacyof the paper. References have been chosen in
some cases which give broader coverage and thusprovide, it is believed, greater consistency betweenresults than might be found in similar data on thesame subject from several sources. Some sacrifice
of accuracy might occur occasionally because of
such choices; but since many of the data are
found without much, if any, information on howthey were obtained, evaluation of experimentalresults is difficult in many cases.
The exhaustive work of Potts and McElroy
[77] ' unfortunately was received after this paperwas nearly completed, and time did not permitrevision to include or even properly refer to their
results. It is, however, an extremely fertile
source of information on base-metal thermo-couples, especially ISA type K, and is recom-mended as excellent reference material.
No history of the thermocouple art is presented.This is considered superfluous here, because suchinformation has been published many times in
recent years, and may be expected to continue to
appear in introductions of papers of the future.
It is assumed throughout this paper that thereader is familiar with the basic principles of
thermoelectric thermometry to the extent, at
least, that he can intelligently apply them to
practice.
Temperatures referred to throughout the dis-
cussions that follow are, unless otherwise indicated,
in degrees C of the International TemperatureScale of 1948. In all cases where equations
containing temperature are taken from a reference,
they are unchanged; no adjustments have beenmade in them to account for the difference betweenthe 1948 temperature scale and that used at the
time of the particular work cited. In some cases,
though, slight adjustments have been made ontabulated data to put them on the 1948 scale.
Generally the information is given in the sameunits as those used by the authors, althoughconversion to more familiar units has been madein some cases. This may lead to some confusion,
but this is thought to be only a minor disadvantageto those having interests that involve the datapresented. The electromotive forces (emfs) are
in terms of the absolute volt.
2. Bare Thermocouple Wires
The materials considered in this section are, for
convenience, classified as follows:
1. Noble Metals
2. Base Metals
3. Refractory Metals
4. Carbon and Carbides
The first two items represent the vast majority
of thermocouples now in use, and much informa-tion on them is available. Fewer data are avail-
able on the third item, but a considerable effort is
being exerted in the field of refractory metals to
meet the high-temperature needs of recent tech-
nological developments. Relatively little workhas been done on materials of the fourth item,
but some thermocouples employing graphite,
carbon and carbides are used. Sufficient promisehas been shown by these materials though, to
make them worthy of inclusion.
Discussions of various thermocouple materials
foUow.
2.1. Noble Metals
a. Platinum and Platinum-Rhodium Alloys
The oldest and most used noble-metal thermo-couple is the platinum-rhodium ^ versus platinumthermocouple. Both the 10 percent (ISA type S) [1]
and 13 percent (ISA type R) [1] rhodium-platinumpositive elements are used extensively, and the
platinum-rhodium 10 percent versus platinumthermocouple continues to serve as a means of
realization of and interpolation on the Inter-
national Temperature Scale of 1948. More spacewill be devoted to these thermocouples for tworeasons. First, they, in defining the temperaturescale, are of more basic importance than are others,
and secondly, more information is available onthem than on most others.
Thermocouples having both legs of alloys of
platinum and rhodium have been proposed, andsome of these combinations are tabulated below.
' Figures in brackets indicate the literature references on page 39.
' When mentioning a thermocouple, the positive element is given first.
This is in line with an apparent effort to standardize nomenclature amongusers of tliermocouples.
2
Positive wire Negative wire
Platinum-rhodium13 percent.
Platinum-rhodium20 percent.
Platinum-rhodium30 percent.
Platinum-rhodium40 percent.
Platinum-rhodium1 percent.
Platinum-rhodium5 percent.
Platinum-rhodium6 percent.
Platinum-rhodium20 percent.
Advantages of the all-alloy thermocouples are
said to be greater stability, a somewhat greater
temperature range of use, and increased stiffness
with greater resistance to mechanical deteriora-
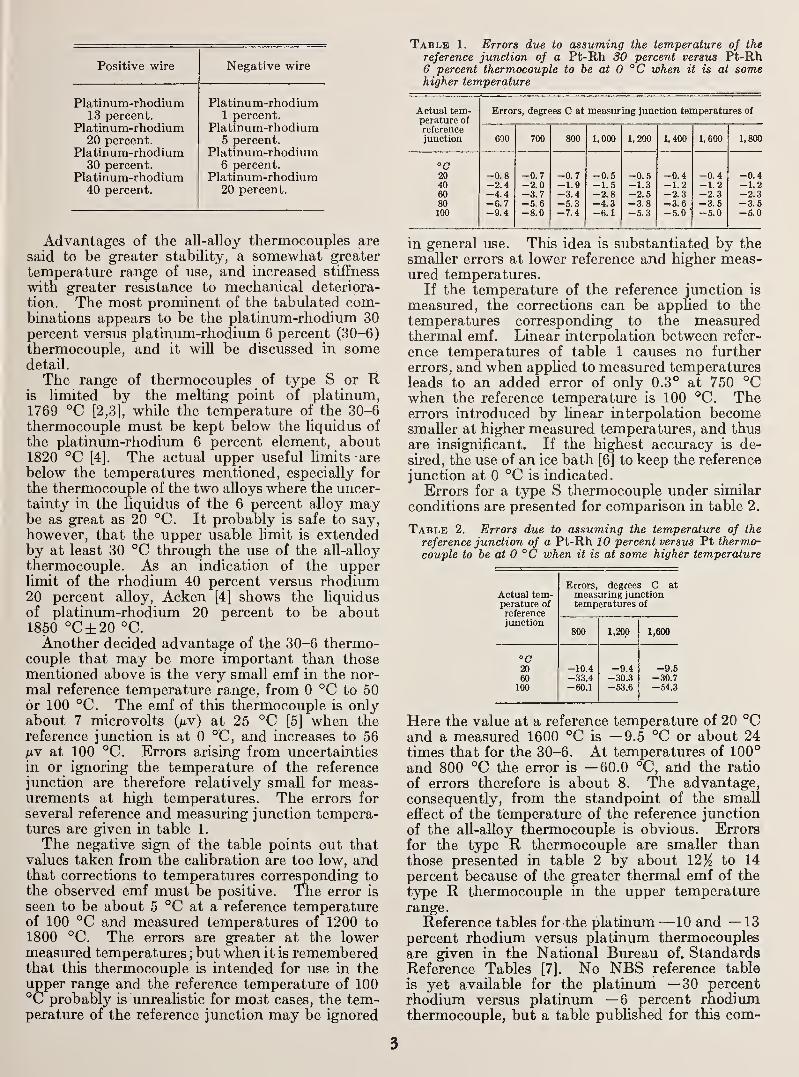
tion. The most prominent of the tabulated com-binations appears to be the platinum-rhodium 30percent versus platinum-rhodium 6 percent (30-6)
thermocouple, and it will be discussed in somedetail.
The range of thermocouples of type S or Ris limited by the melting point of platinum,1769 °C [2,3], while the temperature of the 30-6thermocouple must be kept below the liquidus of
the platinum-rhodium 6 percent element, about1820 °C [4]. The actual upper useful limits are
below the temperatures mentioned, especially for
the thermocouple of the two alloys where the uncer-tainty in the liquidus of the 6 percent alloy maybe as great as 20 °C. It probably is safe to say,
however, that the upper usable limit is extendedby at least 30 °C through the use of the all-alloy
thermocouple. As an indication of the upperlimit of the rhodium 40 percent versus rhodium20 percent alloy, Acken [4] shows the liquidus
of platinum-rhodium 20 percent to be about1850 °C±20 °C.Another decided advantage of the 30-6 thermo-
couple that may be more important than thosementioned above is the very small emf in the nor-mal reference temperature range, from 0 °C to 50or 100 °C. The emf of this thermocouple is onlyabout 7 microvolts (/xv) at 25 °C [5] when thereference junction is at 0 °C, and increases to 56^l^r at 100 °C. Errors arising from uncertaintiesin or ignoring the temperature of the reference
junction are therefore relatively small for meas-urements at high temperatures. The errors for
several reference and measuring junction tempera-tures are given in table 1.
The negative sign of the table points out thatvalues taken from the calibration are too low, andthat corrections to temperatures corresponding to
the observed emf must be positive. The error is
seen to be about 5 °C at a reference temperatureof 100 °C and measured temperatures of 1200 to
1800 °C. The errors are greater at the lowermeasured temperatures ; but when it is rememberedthat this thermocouple is intended for use in theupper range and the reference temperature of 100°C probably is unrealistic for most cases, the tem-peratiire of the reference junction may be ignored
Table 1. Errors due to assuming the temperature of the
reference junction of a Pt-Rh 30 percent versus Pt-Rh6 percent thermocouple to be at 0 °C when it is at somehigher temperature
Actual tein- Errors, degrees C at measuring junction temperatures of
referencejunction 600 700 800 1,000 1,200 1,400 1, 600 1,800
°C20 -0.8 -0.7 -0.7 -0.6 -0.5 -0.4 -0.4 -0.440 -2.4 -2.0 -1.9 -1.5 -1.3 -1.2 -1.2 -1.260 -4.4 -3.7 -3.4 -2.8 -2.5 -2.3 -2.3 -2.380 -6.7 -5.6 -5.3 -4.3 -3.8 -3.6 -3.5 -3.5100 -9.4 -8.0 -7.4 -6.
1
-5.3 -5.0'
-5.0 -5.0
in general use. This idea is substantiated by thesmaller errors at lower reference and higher meas-ured temperatures.
If the temperature of the reference junction is
measured, the corrections can be appUed to thetemperatures corresponding to the measuredthermal emf. Linear interpolation between refer-
ence temperatures of table 1 causes no further
errors, and when appHed to measured temperaturesleads to an added error of only 0.3° at 750 °Cwhen the reference temperature is 100 °C. Theerrors introduced by linear interpolation becomesmaller at higher measured temperatures, and thusare insignificant. If the highest accuracy is de-
sired, the use of an ice bath [6] to keep the reference
jimction at 0 °C is indicated.
Errors for a type S thermocouple imder similar
conditions are presented for comparison in table 2.
Table 2. Errors due to assuming the temperature of the
reference junction of a Pt-Rh 10 percent versus Pt thermo-
couple to be at 0 °C when it is at some higher temperature
Actual tem-perature of
Errors, degrees C atmeasuring junctiontemperatures of
junction800 1,200 1,600
°C20 -10.4 -9.4 -9.560 -33.4 -30.3 -30.7
100 -60.1 -53.6 -54.3
Here the value at a reference temperature of 20 °Cand a measured 1600 °C is —9.5 °C or about 24times that for the 30-6. At temperatures of 100"
and 800 °C the error is —60.0 °C, and the ratio
of errors therefore is about 8. The advantage,consequently, from the standpoint of the small
effect of the temperature of the reference junction
of the all-alloy thermocouple is obvious. Errorsfor the type R thermocouple are smaller thanthose presented in table 2 by about 12K to 14
percent because of the greater thermal emf of the
type R thermocouple in the upper temperaturerange.
Reference tables for the platinum—10 and — 13
percent rhodium versus platinum thermocouplesare given in the National Bureau of. StandardsReference Tables [7]. No NBS reference table
is yet available for the platinum —30 percent
rhodium versus platinimi —6 percent rhodiumthermocouple, but a table published for this com-
3
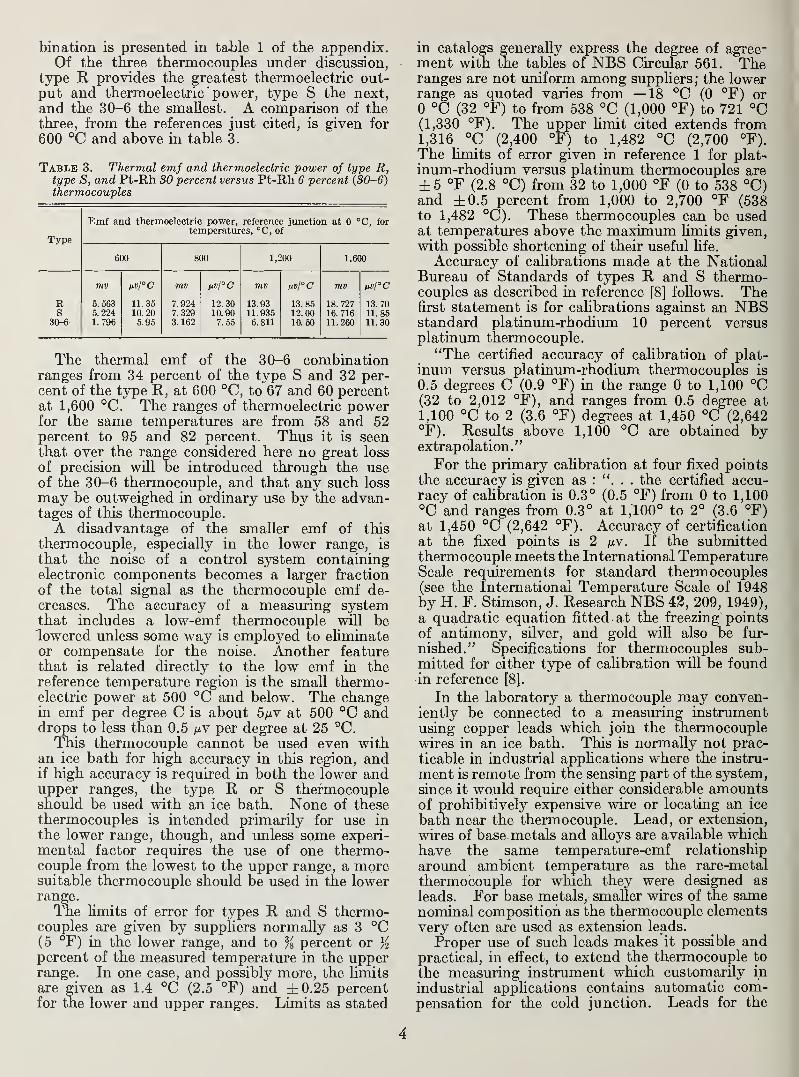
biBation is presented in table 1 of the appendix.Of the thiree thermocouples under discussion,
type R provides the greatest thermoelectric out-put and thermoelectric " power, type S the next,
and the 30-6 the smallest. A comparison of thethree, from the references just cited, is given for
600 °C and above in table 3.
Table 3. Thermal emf and thermoelectric power of type R,type S, and Pt-Rh SO percent versus Pt-Rh 6 percent {30-6)thermocouples
Emf and thermoelectric power, reference junction at 0 °C, fortemperatures, °C, of
600 800 1,200 1.600
mv mv mv mv
RS
30-6
5. 5635.2241.796
11.3510.205.95
7.9247. 3293.162
12.3010. 907. 55
13.9311.9356. 811
13.8512. 0010. 50
18. 72716. 71611.260
13.7011.8511.30
The thermal emf of the 30-6 combinationranges from 34 percent of the type S and 32 per-
cent of the type R, at 600 °C, to 67 and 60 percentat 1,600 °C. The ranges of thermoelectric powerfor the same temperatures are from 58 and 52percent to 95 and 82 percent. Thus it is seenthat over the range considered here no great loss
of precision will be introduced through the useof the 30-6 thermocouple, and that any such loss
may be outweighed in ordinary use by the advan-tages of this thermocouple.A disadvantage of the smaller emf of this
thermocouple, especially in the lower range, is
that the noise of a control system containingelectronic components becomes a larger fraction
of the total signal as the thermocouple emf de-creases. The accuracy of a measuring systemthat includes a low-emf thermocouple will belowered unless some way is employed to eliminateor compensate for the noise. Another featurethat is related directly to the low emf in thereference temperature region is the small thermo-electric power at 500 °C and below. The changein emf per degree C is about 5mv at 500 °C anddrops to less than 0.5 ixy per degree at 25 °C.
This thermocouple cannot be used even withan ice bath for high accuracy in this region, andif high accuracy is required in both the lower andupper ranges, the type R or S thermocoupleshould be used with an ice bath. None of thesethermocouples is intended primarily for use in
the lower range, though, and unless some experi-mental factor requires the use of one thermo-couple from the lowest to the upper range, a moresuitable thermocouple should be used in the lowerrange.
The limits of error for types R and S thermo-couples are given by suppliers normally as 3 °C(5 °F) in the lower range, and to % percent or Kpercent of the measured temperature in the upperrange. In one case, and possibly more, the limits
are given as 1.4 °C (2.5 °F) and ±0.25 percentfor the lower and upper ranges. Limits as stated
in catalogs generally express the degree of agree-ment with the tables of NBS Circular 561. Theranges are not imiform among supphers ; the lowerrange as quoted varies from —18 °C (0 °F) or0 °C (32 °F) to from 538 °C (1,000 °F) to 721 °C(1,330 °F). The upper limit cited extends from1,316 _°C (2,400 °F) to 1,482 °C (2,700 °F).
The limits of error given in reference 1 for plat-
inum-rhodium versus platinum thermocouples are
±5 °F (2.8 °C) from 32 to 1,000 °F (0 to 538 °C)and ±0.5 percent from 1,000 to 2,700 °F (538to 1,482 °C). These thermocouples can be usedat temperatures above the maximum limits given,with possible shortening of their useful hfe.
Accuracy of calibrations made at the NationalBureau of Standards of types R and S thermo-couples as described in reference [8] follows. Thefirst statement is for calibrations against an NBSstandard platinum-rhodium 10 percent versusplatinum thermocouple.
"The certified accuracy of cahbration of plat-
inum versus platinum-rhodium thermocouples is
0.5 degrees C (0.9 °F) in the range 0 to 1,100 °C(32 to 2,012 °F), and ranges from 0.5 degree at
1,100 °C to 2 (3.6 °F) degrees at 1,450 °C (2,642°F). Results above 1,100 °C are obtained byextrapolation."
For the primary cahbration at four fixed pointsthe accxu-acy is given as : . . the certified accu-racy of cahbration is 0.3° (0.5 °F) from 0 to 1,100°C and ranges from 0.3° at 1,100° to 2° (3.6 °F)at 1,450 °C (2,642 °F). Accuracy of certification
at the fixed points is 2 /iv. If the submittedthermocouple meets the International TemperatureScale requirements for standard thermocouples(see the International Temperature Scale of 1948by H. F. Stimson, J. Research NBS 43, 209, 1949),
a quadratic equation fitted, at the freezing points
of antimony, silver, and gold wiU also be fur-
nished." Specifications for thermocouples sub-mitted for either type of cahbration will be foundin reference [8].
In the laboratory a thermocouple may conven-iently be connected to a measuring instrumentusing copper leads which join the thermocouplewires in an ice bath. This is normally not prac-
ticable in industrial apphcations where the instru-
ment is remote from the sensing part of the system,
since it would require either considerable amountsof prohibitively expensive wire or locating an ice
bath near the thermocouple. Lead, or extension,
wires of base metals and alloys are available whichhave the same temperature-emf relationship
aroimd ambient temperature as the rare-metal
thermocouple for which they were designed as
leads. For base metals, smaller wires of the samenominal composition as the thermocouple elementsvery often are used as extension leads.
Proper use of such leads makes it possible andpractical, in effect, to extend the thermocouple to
the measuring instrument which customarily in
industrial applications contains automatic com-pensation for the cold junction. Leads for the
4
types R and S thermocouples have copper as the
positive element and a copper-nickel alloy as the
negative wire. Generally the range for these leads
is stated as 24 to 204 °C (75 to 400 °F) and the
limit of error resulting from the use of the leads
for regular-grade wires is given as ±7 °C (13 °F).
In one instance and possibly others, limits of error
for the regular-grade leads are given as ±6 percentor ± 5 °C (9 °F) for both types R and S, and the
limits for premium-grade extension wires are givenas ±2}i percent for type R and Iji percent for
type S. Limits given as percentages apply to the
difference between the temperature at the con-nection to the thermocouple and the temperatureat the measuring instrument. Where the error
derived from the percent value is smaller than that
given in degrees, it is considered to be the Umit,rather than the quantity given in degrees.
A word of caution may be worthwhile here onthe use of extension leads. Although the lead
wires have, within limits, the same temperature-emf relationships as the rare-metal thermocouples,the positive copper and platinum-rhodium are notthermoelectrically neutral, nor are the negativecopper-nickel alloy and platinum. These facts
lead to the requirement that the temperature of
the two leads be the same at any junction withany other material, as for example, at the connec-tion to the thermocouple or to switches. If this
condition is not fulfilled, large errors may result.
The possibility of large errors normally is notpresent in thermocouples mounted by suppliers ormanufacturers in tubes with heads in which con-nectors are mounted. The chief danger lies in theuse of unmounted wires where the junctions maybe separated and subjected to different conditionsof drafts, radiation^ etc.
Physical and chemical properties of thermo-couple elements of the platinum metals have beenassembled from several sources, one of the mostfertile of which is the excellent work of Vines [9].
Many of the references cited here have been taken•directly from his book, and are so credited. An-other excellent source of information on metals in
general is the Metals Handbook, American So-ciety for Metals, 1948 edition [10]. The proper-ties given for the platinum metals in this sectionand for platinum and other metals later are thosethat may influence the utility of a thermocoupleand the accuracy of results obtainable with it.
One of the more important properties of goodthermocouple wires is the uniformity of composi-tion and physical condition throughout. Errorswill arise when a region of chemical or physicalinhomogeneity of a thermocouple is in a tempera-ture gradient. This is so, not only for the rare-metal thermocouples discussed in this section, butalso for any thermocouple used for measurementof temperature. Among those who have presenteddiscussions on the subject of homogeneity are
Roeser and Lonberger [6], McElroy [11], andPotts and McElroy [77]. In addition, references
[11] and [77] give quantitative information on
effects of inhomogencities and equipment for
testing for homogeneity. These reports involvechiefly the nickel-base elements exclusive of thosewith copper, but the treatment is applicable to
any thermocouple wires. The chief point that
is made, however, is the real importance of
homogeneity.
Platinum and the alloys considered here are
available in a wide range of wire diameters from,within reasonable limits, as large as desired downto a fraction of a mil (0.001 in.). The mostpopular diameter, from the standpoint of economyand convenience of handling, seems to be about20 mils or 0.5 mm. The larger wires are usedwhere greater strength and rigidity are wanted,and where fast response to temperature changesand effects of conduction and radiation are rela-
tively unimportant. Smaller wires are used whereone or more of these items becomes important.
As are the other platinum metals, platinum is
resistant to corrosion by the common acids andchemicals. It is unaffected by any single acid,
but is dissolved b}^ aqua regia. The platinum-rhodium alloys are equally resistant and are said
to be unaffected by aqua regia when they containmore than about 20 percent rhodium. Thesethermocouples should be used under oxidizing or
neutral conditions. Platinum and its alloys withrhodium deteriorate under reducing conditions at
high temperatures by absorbing gases and metalsreduced from the oxides of insulating refractories
in contact with them. Commonly used refrac-
tories are sources of silicon contamination underadverse conditions. Among the more commonreducing atmospheres encountered in practice are
those containing carbon and sulfur. Exposure of
the platinum versus platinum-rhodium thermo-couples to these conditions at high temperaturemust therefore be avoided. The effect of silicon
in a reducing atmosphere was pointed out byMcQuillan [12], who found that platinum in the
presence of silicon failed in less than an hour.
No effect was observed though, in the presence of
alumina, berylha, or carbon in Qji hr.
A more complete statement on the resistance
of platinum to specific agents is found in reference
[10], page 1,122, the material of which is credited
to the Corrosion Handbook [13]. F. E. Carter
[10] gives the resistance to corrosion of the plati-
num-rhodium alloys as ".. . as good as or better
than that of pure platinum at ordinary tempera-
tures, and at high temperatures is usually better
than the resistance of pure platinum, except undersulfidizing conditions."
In unpublished work by Olsen at the National
Bureau of Standards, platinum has been foundto be an active catalyst in dilute mixtures of
hydrogen in air, and carbon monoxide in air, to
the extent that temperature measurements in such
mixtures are subject to large errors. Products of-
incomplete combustion in, for example, burners
618629—62 2 5
using hydrocarbon fuels thus may be responsible
for the same effects which appear at temperaturesas low as about 120 °C.. Although no quantita-
tive corrections can be given for thermocouplesexposed to residual combustibles and oxidant,
caution should be exercised in interpretation of
data obtained under such conditions with platinumversus platinum-rhodium thermocouples.Annealed platinum is so soft that is cannot be
used bare in high-velocity streams of hot gases or
as a long cantilever in quiescent hot gas or vacuumwithout bending. Some means of protection mustbe used in such cases, but this often imposesother disadvantages, such as slower response to
changes, increased losses due to conduction, etc.
The all-alloy thermocouple described earher hassome advantage in this respect because of theincreased stiffness of the alloy wires over that of
the platinum.Complete annealing of very pure platinum is
said by Vines [9] to occur at 400 °C (752 °F).
The time required for this treatment is not spec-
ified, but Wise and Vines [14] have stated the
temperatures required for complete anneahng of
99.9+ percent pure platinum after exposure for
15 min. Their statement is: "The temperaturesrequired to produce complete softening of this
platinum in a 15-minute anneal are approximately765, 700, 635, 600, 545, and 425 °C respectively
for reductions in thickness of 19, 39.5, 50.8, 66,
80.5, and 89.5%." Here it is seen that as the
percentage reduction of area, or cold working, is
increased, the temperature for complete softening
is decreased; and that after severe reduction bydrawing of extremely pure platinum of thermo-couple grade, anneahng at 500 °C (932 °F) for 15
min probably would be more than sufficient. Atthe National Bureau of Standards, however, the
regular procedure is to anneal electrically for onehour at 1,450 °C (2,642 °F). This does not pro-
duce appreciable adverse effects in the strength of
the wire, and may oxidize or otherwise minimizeeffects of impurities in the wires.
Although the user of thermocouples of platinumand its alloys with rhodium normally is not con-cerned with numerical data on their mechanicalproperties, certain properties are related to me-chanical behavior and wUl be given. The an-
nealed condition is the only one of interest for
thermocouples, but some information on the cold-
worked state is presented for comparison. Gradesof platinum discussed are according to the desig-
nations of table 1 of Vines [9], which follow in
table 4.
Table 4.
—
Grades of platinum
Grade Minimumplatinumcontent
Refiners' designations
%1 99. 99 Thermo-element, physically
pure or chemically pure.2 99.9 Chemically pure, special pure,
or specially refined.
These grades are equivalent to types A and B of
Carter [15].
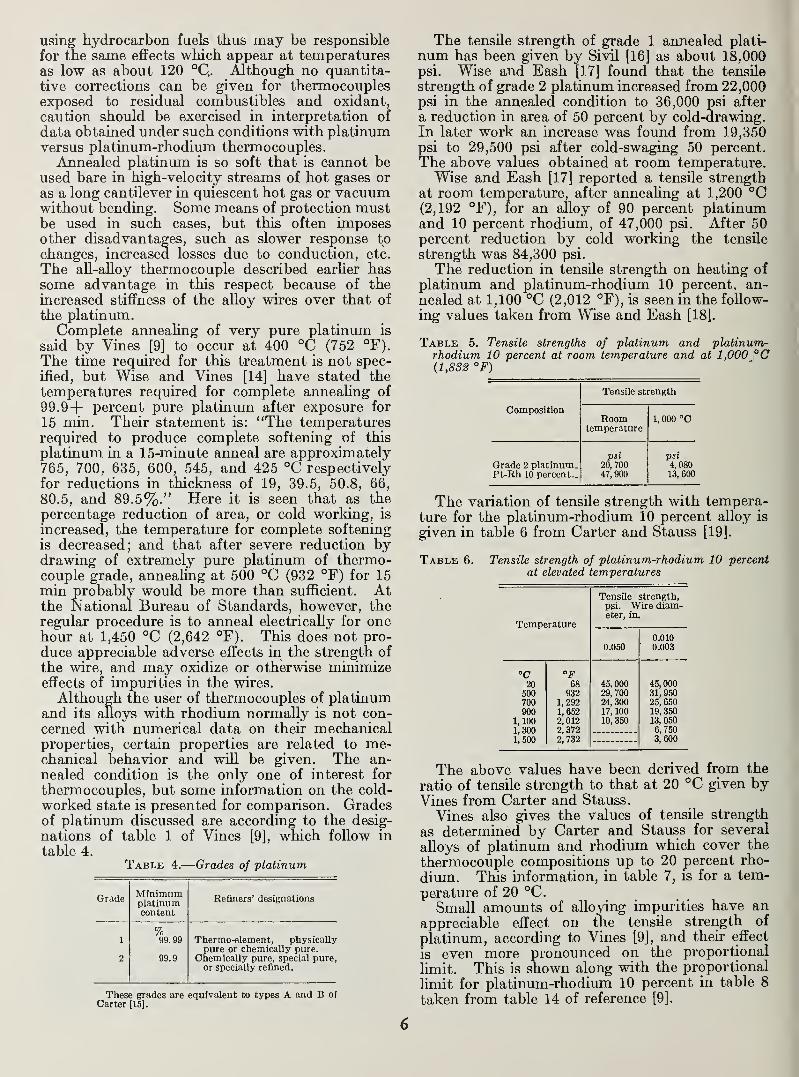
The tensile strength of grade 1 annealed plati-
num has been given by Sivil [16] as about 18,000psi. Wise and Eash [17] found that the tensile
strength of grade 2 platinum increased from 22,000psi in the annealed condition to 36,000 psi after
a reduction in area of 50 percent by cold-drawing.In later work an increase was found from 19,350psi to 29,500 psi after cold-swaging 50 percent.
The above values obtained at room temperature.Wise and Eash [17] reported a tensile strength
at room temperature, after annealing at 1,200 °C(2,192 °F), for an alloy of 90 percent platinumand 10 percent rhodium, of 47,000 psi. After 50percent reduction by cold working the tensile
strength was 84,300 psi.
The reduction in tensile strength on heating ofplatinum and platinum-rhodium 10 percent, an-
nealed at 1,100 °C (2,012 °F), is seen in the follow-
ing values taken from Wise and Eash [18].
Table 5. Tensile strengths of platinum and platinum-rhodium 10 percent at room temperature and at 1,000 °C{1,832 °F)
Composition
Tensile strength
Roomtemperature
1,000 °C
psi psiGrade 2 platinum. 20, 700 4, 080Pt-Rh 10 percent- 47,900 13, 600
The variation of tensile strength with tempera-ture for the platinum-rhodium 10 percent alloy is
given in table 6 from Carter and Stauss [19].
Table 6. Tensile strength of platinum-rhodium 10 percent
at elevated temperatures
Temperature
Tensile strength,psi. Wire diam-eter, in.
0.0500.0100.003
"C °F20 68 45, 000 45, 000
500 932 29,700 31,950700 1,292 24, 300 25, 650
900 1,652 17, 100 19, 350
1, 100 2,012 10, 350 13, 050
1,300 2,372 6, 750
1,500 2,732 3, 600
The above values have been derived from the
ratio of tensile strength to that at 20 °C given byVines from Carter and Stauss.
Vines also gives the values of tensile strength
as determined by Carter and Stauss for several
alloys of platinum and rhodium which cover the
thermocouple compositions up to 20 percent rho-
dium. This information, in table 7, is for a tem-
perature of 20 °C.
Small amounts of alloying impurities have an
appreciable effect on the tensile strength of
platinum, according to Vines [9J, and their effect
is even more pronounced on the proportional
limit. This is shown along with the proportional
limit for platinum-rhodium 10 percent in table 8
taken from table 14 of reference [9].
6
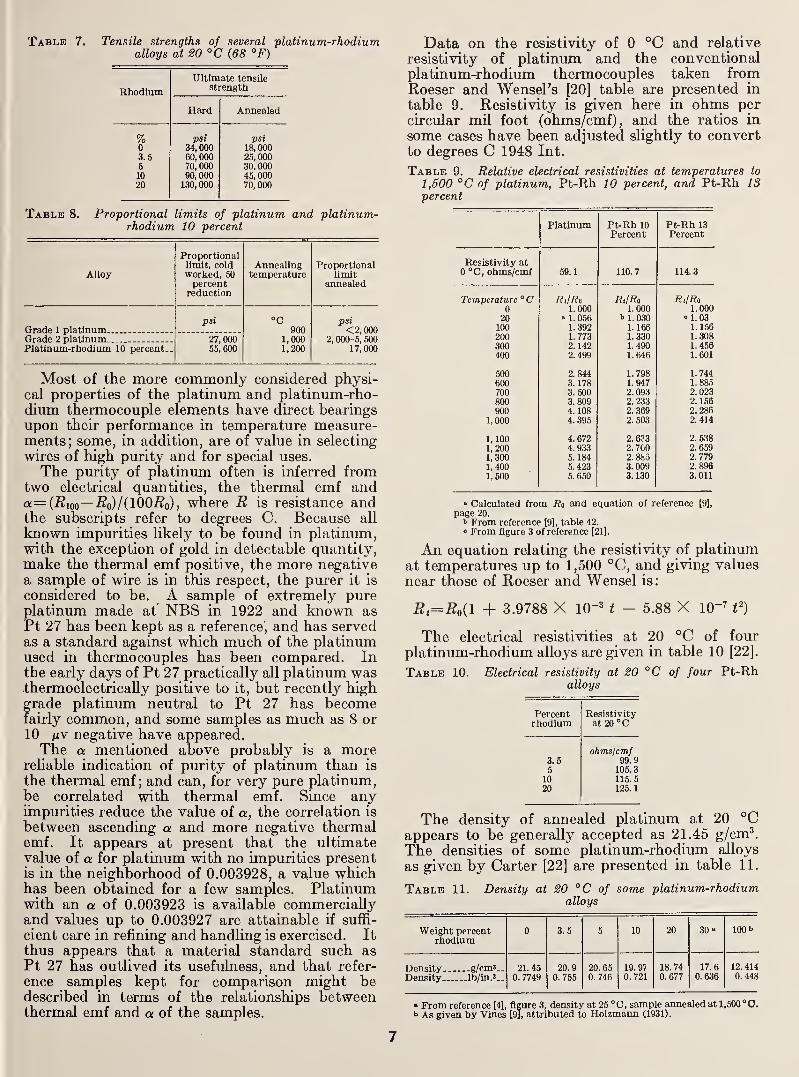
Table 7. Tensile strengths of several platinum-rhodiumalloys at20°C {68 °F)
Ultimate tensUe
Bhodium strength
Hard Annealed
% psi psi0 34, 000 18, 0003.5 60, 000 25, 0006 70,000 30. 00010 90,000 45, 00020 130, 000 70, 000
Table 8. Proportional limits of platinum and platinum-rhodium 10 percent
Alloy
Proportionallimit, coldworked, 50percent
reduction
Annealingtemperature
Proportionallimit
annealed
Grade 1 platinumpsi °C
9001,0001,200
psi<2,000
2, 000-5, 50017,000
Grade 2 platinumPlatinum-rtiodium 10 percent-
27,00055,600
Most of the more commonly considered physi-cal properties of the platinum and platinum-rho-dium thermocouple elements have direct bearingsupon their performance in temperature measure-ments; some, in addition, are of value in selecting
wires of high purity and for special uses.
The purity of platinum often is inferred fromtwo electrical quantities, the thermal emf anda= (i?ioo— i?o)/(100i?o), where B, is resistance andthe subscripts refer to degrees C. Because all
known impurities likely to be found in platinum,with the exception of gold in detectable quantity,make the thermal emf positive, the more negativea sample of wire is in this respect, the purer it is
considered to be. A sample of extremely pureplatinum made at NBS in 1922 and known asPt 27 has been kept as a reference, and has servedas a standard against which much of the platinumused in thermocouples has been compared. Inthe early days of Pt 27 practically all platinum was.thermoelectrically positive to it, but recently highgrade platinum neutral to Pt 27 has becomefairly common, and some samples as much as S or10 p.Y negative have appeared.The a mentioned above probably is a more
reliable indication of purity of platinum than is
the thermal emf; and can, for very pure platinum,be correlated with thermal emf. Since anyirnpurities reduce the value of a, the correlation is
between ascending a and more negative thermalemf. It appears at present that the ultimatevalue of a for platinum with no impurities presentis in the neighborhood of 0.003928, a value whichhas been obtained for a few samples. Platinumwith an a of 0.003923 is available commerciallyand values up to 0.003927 are attainable if suffi-
cient care in refining and handling is exercised. It
thus appears that a material standard such as
Pt 27 has outlived its usefulness, and that refer-
ence samples kept for comparison might bedescribed in terms of the relationships betweenthermal emf and a of the samples.
Data on the resistivity of 0 °C and relative
resistivity of platinum and the conventionalplatinum-rhodium thermocouples taken fromRoeser and Wensel's [20] table are presented in
table 9. Resistivity is given here in ohms percircular mil foot (ohms/cmf), and the ratios in
some cases have been adjusted slightly to convertto degrees C 1948 Int.
Table 9. Relative electrical resistivities at temperatures to
1,500 °C of platinum, Pt-Rh 10 percent, and Pt-Rh 13percent
Platinum Pt-Rh 10 Pt-Rh 13
0 °C, ohms/cmf 59.1 110.7 114.3
Temperature ° C RiIRo RtIRo RilRa0 LOOO 1.000 1.000
20 » 1. 056 b 1. 030 <>1.03
100 1.392 1. 166 1.156
200 1.773 1.330 1.308
300 2. 142 1.490 1. 456400 2. 499 1.646 L601
500 2.844 1.798 1.744600 3. 178 1.947 1.885700 3.500 2.093 2. 023800 3. 809 2. 233 2. 156
900 4. 108 2. 369 2.286
1,000 4. 395 2. 503 2. 414
1,100 4.672 2.633 2. 538
1,200 4.933 2. 760 2.659
1,300 5. 184 2. 8h3 2. 779
1,400 5.423 3. 009 2.896
1, 500 5. 650 3. 130 3.011
» Calculated from Rn and equation of reference [9],
page 20.i> From reference [9], table 42.
0 From figure 3 of reference [21].
An equation relating the resistivity of platinumat temperatures up to 1,500 °C, and giving values
near those of Roeser and Wensel is:
Rt=Ro{l + 3.9788 X 10-^ t - 5.88 X 10"^ t^)
The electrical resistivities at 20 °C of four
platinum-rhodium alloys are given in table 10 [22].
Table 10. Electrical resistivity at 20 °C of four Pt-Rhalloys
Percentrhodium
Resistivityat 20 °C
ohmslcmf3.5 99.95 105.3
10 115.520 125.1
The density of annealed platinum at 20 °Cappears to be generally accepted as 21.45 g/cm^.
The densities of some platinum-rhodium alloys
as given by Carter [22] are presented in table 11.
Table 11. Density at 20 °C of some platinum-rhodiumalloys
Weight percentrhodium
0 3.5 5 10 20 30 « 100 1>
Density... -.g/cms..
Density lb/in.
21.450. 7749
20.90. 755
20. 650. 746
19. 97
0. 72118.740.677
17.60.636
12. 4140.448
• From reference [4], figure 3, density at 25 "C, sample annealed at l,500°O.b As given by Vines [9], attributed to Holzmann (1931).
7
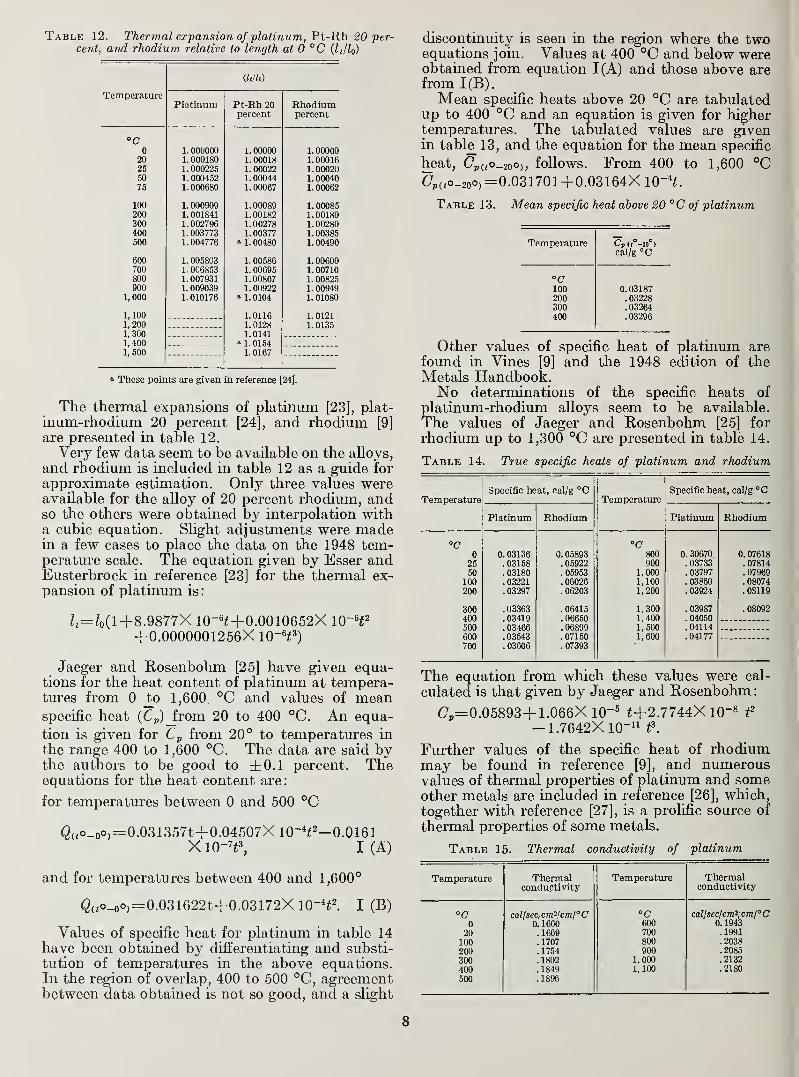
Table 12. Thermal expansion of platinum, Vt-Kh 20 per-cent, and rhodium relative to length at 0 °C (It/h)
1 emperature"Plif'intimX IdtlllLllii X L-xvJJ ZU
percent percent
'CU 1.000000 1.00000 1. 00000
20 J.. UUUJ.OU 1 nnni
s
i. UUUio 1 nnm fi1. UUUID25 1. 000225 1. 00022 1. 00020ou 1. 000452 1. 00044 1. 0004075 1. 000680 1. 00067 1. 00062
innJ.UU 1. 000909 1. 00089 1. 00085onn 1 001841 1 nm R9J.. UUi.Oi^nnouu 1. 002796 1. 00278 1. 00280400 1.003773 1. 00377 1. 00385500 1.004776 » 1. 00480 1. 00490
DUU 1. 005803 1. 00586 1. 00600vnn/uu 1.006853 1. 00695 1. 00710800 1. 007931 1. 00807 1. 00825900 1. 009039 1.00922 1. 00949
1, 000 1.010176 « 1. 0104 1. 01080
1,100 1.0116 1. 01211,200 1. 0128 1. 01351,300 1.01411,4001,500
a 1.01541.0167
» These points are given in reference [24].
The thermal expansions of platinum [23], plat-
inum-rhodium 20 percent [24], and rhodium [9]
are presented in table 12.
Very few data seem to be available on the alloys,
and rhodium is included in table 12 as a guide for
approximate estimation. Only three values wereavailable for the alloy of 20 percent rhodium, andso the others were obtained by interpolation witha cubic equation. Slight adjustments were madein a few cases to place the data on the 1948 tem-perature scale. The equation given by Esser andEusterbrock in reference [23] for the thermal ex-pansion of platinum is
:
Z,=/o(i+8.9877X 10-6^+ 0.0010652X 10~H^+ 0.0000001256X IQ-H^)
Jaeger and Rosenbohm [25] have given equa-tions for the heat content of platinum at tempera-tures from 0 _to 1,600. °C and values of meanspecific heat (Cp)_from 20 to 400 °C. An equa-
tion is given for Cp from 20° to temperatures in
the range 400 to 1,600 °C. The data are said bythe authors to be good to ±0.1 percent. Theequations for the heat content are:
for temperatures between 0 and 500 °C
Q(,o_oO)= 0.031357t-F0.04507XlO-*i2_o.0161X 10-^^^ I (A)
and for temperatures between 400 and 1,600°
Q(,o_oo,= 0.031622t-f0.03172XlO-''fl I (B)
Values of specific heat for platinum in table 14have been obtained by differentiating and substi-
tution of temperatures in the above equations.In the region of overlap, 400 to 500 °C, agreementbetween data obtained is not so good, and a slight
discontinuity is seen in the region where the twoequations join. Values at 400 °C and below wereobtained from equation 1(A) and those above arefrom 1(B).
Mean specific heats above 20 °C are tabulatedup to 400 °C and an equation is given for highertemperatures. The tabulated values are givenin table 13, and the equation for the mean specific
heat, (7p(<o_2oo,, follows. From 400 to 1,600 °C(7,,(,o_2oo,=0.031701-f0.03164XlO-*i.
Table 13. Mean specific heat above 20 °C of platinum
Temperature Cp ((°-20°)
cal/g °C
°C100 0. 03187200 . 03228300 . 03264400 . 03296
Other values of specific heat of platinum are
found in Vines [9] and the 1948 edition of theMetals Handbook.No determinations of the specific heats of
platinum-rhodium alloys seem to be available.
The values of Jaeger and Rosenbohm [25] for
rhodium up to 1,300 °C are presented in table 14.
Table 14. True specific heats of platinum and rhodium
TemperatureSpecific heat, cal/g °C
TemperatureSpecific heat, cal/g °C
Platinum Rhodium Platinum Rhodium
°C "C0 0. 03136 0. 05893 800 0. 30670 0. 07618
25 . 03158 . 05922 900 . 03733 . 0781450 . 03180 . 05953 1,000 . 03797 . 07969
100 . 03221 . 06026 1,100 . 03860 . 08074200 . 03297 . 06203 1,200 . 03924 . 08119
300 . 03363 .06415 1,300 . 03987 . 08092400 . 03419 . 06650 1,400 . 04050
600 . 03466 . 06899 1,500 .04114600 . 03543 . 07150 1,600 . 04177700 . 03606 . 07393
The equation from which these values were cal-
culated is that given by Jaeger and Rosenbohm
:
(7^=0.05893+ 1.066X 10-* i+2.7744X lO"* f-1.7642X10-" f.
Further values of the specific heat of rhodiummay be found in reference [9], and numerousvalues of thermal properties of platinum and someother metals are included in reference [26], which,
together with reference [27], is a prolific source of
thermal properties of some metals.
Table 15. Thermal conductivity of platinum
Temperature Thermalconduptivity
Temperature Thermalconductivity
"C callsec,cm''icmj°C °C callseclcm^iCmrC0 0.1660 600 0.1943
20 .1669 700 .1991
100 .1707 800 .2038
200 .1754 900 .2085
300 .1802 1,000 .2132
400 .1849 1,100 .2180
500 .1896
8
Almost all of the information on thermalconductivity of platinum is for the low range,
from room temperature to. 100 °C, and no dataseem to be available for the platinum-rhodiumalloys in the higher range. Values calculated
from the equation of Holm and Stormer [28] are
given in table 15, and their equation follows.
The equation used to calculate the values of
table 15 is
yt=0.699[l+ 2.83X 10-* (i-19.5)].
In this case the thermal conductivity, k, is in
watts/cm7cm/°C. Values obtained from theequation were multiplied by 0.2388 to convert to
the units given in the table.
Only one value of thermal conductivity for
platinum-rhodium alloys has been found. This,
for platinum-rhodium 10 percent (reference [3],
p. 138), is 0.072 cal/sec/cm7cm/°C at a tem-perature of 18 °C. Alpha (a) in the equationki=ko{l-\-oL{t—to)] is given as +0.0002, whereis the conductivity at 18 °C and i refers to someother temperature. No reference to the original
paper is given in reference [3], so that the limita-
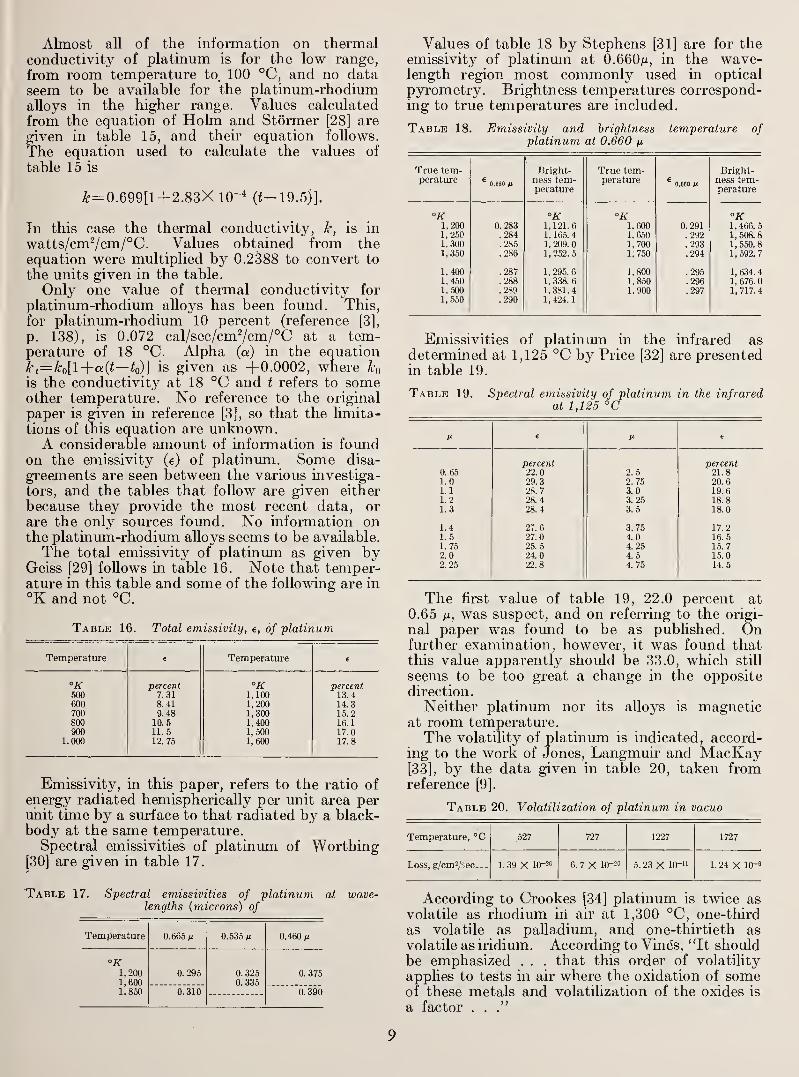
tions of this equation are unknown.A considerable amount of information is found
on the emissivity (e) of platinum. Some disa-
greements are seen between the various investiga-
tors, and the tables that follow are given either
because they provide the most recent data, or
are the only sources found. No information onthe platinum-rhodium alloys seems to be available.
The total emissivity of platinum as given byGeiss [29] follows in table 16. Note that temper-ature in this table and some of the following are in
°K and not °C.
Table 16. Total emissivity, e, of platinum
Temperature e Temperature e
"K percevt "K percent.500 7.31 1,100 13.4600 8. 41 1,200 14.3700 9. 48 1,300 15.2800 10.5 1,400 16.1900 11.5 1,500 17.0
1,000 12.75 1,600 17.8
Emissivity, in this paper, refers to the ratio ofenergy radiated hemispherically per unit area perunit time by a surface to that radiated by a black-body at the same temperature.
Spectral emissivities of platinvmi of Worthing[30] are given in table 17.
Table 17. Spectral emissivities of platinum at wave-lengths (microns) of
Temperature 0.665 n 0.535 M 0.460 iJi
1,2001,6001,850
0.295 0. 3250. 335
0. 375
0. 310 0. 390
Values of table 18 by Stephens [31] are for theemissivity of platinmn at 0.660m, in the wave-length region most commonly used in optical
pjrrometry. Brightness temperatures correspond-ing to true temperatures are included.
Table 18. Emissivity and brightness temperature ofplatinum at 0.660 n
True tem-perature ^ 0.660 JLi
Bright-ness tem-perature
True tem-perature * 0.660 M
Bright-ness tem-perature
"K "K °K °K1,200 0.283 1,121.6 1,600 0. 291 1, 466. 51,25C .284 1,165.4 1,650 .292 1,508.81,300 .285 1.209.0 1,700 .293 1,550.81,360 .286 1, 252. 5 1,750 .294 1, 592. 7
1,400 .287 1.295.6 1,800 .295 1, 634. 4
1,450 .288 1,338.6 1,850 .296 1,676.01,500 .289 1.381.4 1.900 .297 1,717.41,550 .290 1, 424.
1
Emissivities of platinum in the infrared as
determined at 1,125 °C by Price [32] are presentedin table 19.
Table 19. Spectral emissivity of platinum in the infraredat 1,125 °C
e
percent percent0.65 22.0 2.5 21.81.0 29.3 2.75 20.61.1 28.7 3.0 19.61.2 28.4 3. 25 18.81.3 28. 4 3.5 18.0
1.4 27.6 3. 75 17.21.5 27.0 4.0 16.51.75 25.5 4. 25 15.72.0 24.0 4.5 15.02.25 22.8 4. 75 14.5
The first value of table 19, 22.0 percent at
0.65 n, was suspect, and on referring to the origi-
nal paper was foimd to be as published. Onfurther examination, however, it was found thatthis value apparently should be 33.0, which still
seems to be too great a change in the oppositedirection.
Neither platinum nor its alloys is magneticat room temperature.The volatility of platinum is indicated, accord-
ing to the work of Jones, Langmuir and MacKay[33], by the data given in table 20, taken fromreference [9].
Table 20. Volatilization of platinum in vacuo
Temperature, °C 527 727 1227 1727
Loss, g/cmV-'jeo. -
-
1. 39 X 10-28 6. 7 X 10⁻²" 5.23 X 10⁻¹¹ 1. 24 X 10-9
According to Crookes [34] platinum is twice as
volatile as rhodium in air at 1,300 °C, one-third
as volatile as palladium, and one-thirtieth as
volatile as iridium. According to Vines, "It shouldbe emphasized . . . that this order of volatility
applies to tests in air where the oxidation of someof these metals and volatilization of the oxides is
a factor . .."
9

b. Iridium Versus Iridium-Rhodium Alloys
Feussner [35] proposed in 1933 the use of
thermocouples of iridium-rhodivun alloys versus
iridium "for very high temperatures." Several
alloys have been proposed for the positive wire of
the thermocouple, chief among these being aUoysof 40, 50, and 60 percent iridium with rhodium.Various reasons have been given for the choice of
a particular one of these compositions. Thethermal emfs of the 40 and 60 percent wires are
not widely different, and are not too far below the
maximum, which occurs at about the 50-50 con-
position. One point made by some is that loss
of iridiimi from the 60 percent wire will alter the
thermal emf toward its maximmn and not towardthe steeper slope in the other direction, and that
the temperature range of the alloy containing
more iridium will be somewhat greater. Thelatter point is well taken, and because of this the
60 percent alloy is enjoying greater popularity as
time passes. The aUoy of 40 percent iridium-
60 percent rhodium has been used in the past,
however, and probably wiU continue to be usedfor some time.
A considerable amount of work has been doneon the properties of iridium, but information onthe alloys of iridium and rhodium is very scarce,
almost to the point of nonexistence. The little
data that are available are given, however, andsome calculated data that should be used with
caution are added.The temperature hmit of use of the iridium-
rhodium versus iridium thermocouples is set bythe hquidus-sohdus temperature of the aUoywire, and not, as in the case of the platinum-rhod-ium versus platinum thermocouples, by the freez-
ing point of the pm-e wire. The freezing point of
iridium is given by Henning and Wensel [36] as
2,454 ±3 °C on the International TemperatureScale of 1927. This becomes 2,443° on the 1948
scale. No Uquidus-solidus temperatures are foundfor the iridium-rhodium system, but approximatevalues may be inferred from the freezing points
of iridium and rhodium [37]. If the assumptionis made that the Uquidus-solidus curve for the irid-
iiun-rhodium system is similar to Acken's [4
J
for the platiniun-rhodium system, then values
obtained by linear interpolation from iridium to
rhodium woiild be on the safe side. Justification
for this is tenuous, but some values are given in
table 21.
One approximate check has been made in Black-bum and CaldweU's work [38] on the vahdity of
a value for the 60 percent rhodium-40 percentiridium aUoy. On heating a thermocouple hav-ing this aUoy as one wire until it broke, the Hmit-ing temperature was found to be below 3,900 °F.
The calculated temperature from table 21,
2,157 °C, is 3,915 °F. The upper safe Umit for
cahbration of this thermocouple accordingly wasset at 3,800 °F (2,093 °C). Judging from this
case, it will be necessary, in order to provide a safe
margin, to keep the temperatures of the other two
Table 21. Calculated Uquidus-solidus temperatures forthree iridium-rhodium alloys
Liquidus-solidvis
Composition temperature
70 °C100 Rh • 196060 Bh 40 It 2,15350 Rh 50 It 2,20240 Rh 60 It 2,250100 It 2,443
< The value of the freezingpoint of rhodium has beenadjusted to put it on the 1948Temperature Scale.
alloys at least 60 °C (108 °F) below the values of
table 21. These limits were arrived at solely onthe basis of temperatures at which the wires
soften or melt; other properties that hmit the useor hfe of such thermocouples are discussed later.
Several determinations have been made of thetemperature-emf relationships of iridium 40 per-cent-rhodium 60 percent versus iridium thermo-couples. Among these are the work of Dromsand Dahl [39] of the General Engineering Labora-tories of the General Electric Company, and of
Blackburn and CaldweU at the National Bureauof Standards. A report on the latter work, con-taining reference tables, is included in this sym-posium [38]. From results of the investigation
of this alloy, and from prehminary observations
on aUoys containing 60 percent iridiiun and 50percent iridium, it appears that the 50-50 alloy
wiU be the optimum, even at the expense of ashght lowering of the upper range of use underthat of the alloy containing 60 percent iridiimi.
A condensed version of Blackhm-n's reference
table for the iridium 40 percent-rhodium 60 per-
cent versus iridium thermpcouple is given in table
2A of the appendix.Table 3A of the appendix gives the emfs of the
elements of this thermocouple against copper for
use in making corrections for temperatures of
reference jxmctions where connections to the twowires are not at the same temperature.
The thermoelectric power of the iridium-rho-
dium 40 percent versus iridium thermocouple is seen
to be a maximum of about 6 hy/°C (3 mv/°F) in
the upper part of the range. In the region of
room temperature and somewhat above, the
thermoelectric power is about one-half the maxi-mum. The emf is not so low in the lower range
though, that, as in the case of the 30-6 thermo-couple, the temperature of the reference junction
can be ignored without the danger of introducing
an appreciable error. Thus junctions of leads of
this thermocouple with copper should be in an ice
bath, or temperatures of the jimctions should bemeasured and corrected for. Normally the latter
coiu'se is taken because of the high cost of the alloy
and iridium wires.
An estimate of accm-acy of the reference table
for the thermocouple with the alloy of 40 percent
iridium is given by Blackbimi, This is for this
table only, and does not contemplate errors that
10
may be involved in the use of this thermocouple.Accuracy is given by one of the suppliers of theiridium 60 percent-rhodium 40 percent versusiridium thermocouple as ±40 °F [40] in the upperpart of the range. This is for a thermocouple in
packed ceramic insulation, but there seems to beno reason to beheve that this type of moimtitigshould affect the accuracy obtainable to anyappreciable extent. The accuracy of the thermo-couple imder discussion may be expected to beabout the same. A statement is made in refer-
ence [40] also that "Corrections for radiation andconduction cannot be given due to the multiplic-
ity of factors affecting these corrections." Thisshould be borne in mind for this and other thermo-couples; such corrections may amount to manytimes the accuracy stated above.
Cahbration data for the iridium 60 percent-rhodium 40 percent versus iridium from reference
[122] are included in table 7 of the appendix.
No extension leads are known to be available
for the iridium-rhodium versus iridium thermo-couples.
No detailed information is available on homo-geneity of wires of iridium-rhodium versus iridiumthermocouples, but from experience at the Na-tional Bureau of Standards it appears that thermalemfs of wires of the same size from the same lot donot vary appreciably. Some small differences are
seen though between wires of diameters of 0.035
in. and 0.020 in. that presumably are from the
same lot. No work has been done at NBS onwires smaller than 0.020 in. nor larger than 0.035 in.
These thermocouple wires are available in diam-eters from 0.002 in. up to any reasonable size.
The most popular diameter here also seems to be20 mil, but as in the case of the platinum-rhodiumversus platinum thermocouples, experimental con-ditions may dictate that other sizes be used.
Iridium, according to Vines [9] "is the mostcorrosion resistant element known ; it is unaffected
by common acids and is even resistant to aquaregia and fuming sulphuric acid. Small percent-
ages of iridium, up to about 20 percent, also
greatly increase the corrosion resistance of plati-
num and palladium."The iridium-rhodium versus iridium thermo-
couples have been used at the National Bureau of
Standards in exhausts of afterburners and ramjetburners up to about 50 hrs at temperatures of
3,000 °F. (1,649 °C) and above before failure.
The gases were somewhat oxidizing because of
incomplete combustion. The thermocouples weremounted for this use in water-cooled mountings,so that only a small portion of the thermocouplew^as exposed to the hot gases. Failure was causedby loss of the pure wire in the exposed part.
Apparently the iridium wire oxidized; and the
oxide having, according to Crookes [34], a highvapor pressure, volatihzed. No quantative meas-urements have been made on loss by volatilization
from the iridium wire, but on seeing the cloud of
black smoke from a length of wire heated electri-
cally above 3,000 °F it is not hard to believe the
statement of Crookes [34] that "the loss of iridiumin air at 1,300 °C is ... 30 times that of platinumand 60 times that of rhodium." The alloy wire,
from casual examination, did not appear to havelost metal.
A coating ranging from gray to black was seenon the wires on returning from high to room tem-peratures in the work at the National Biireau ofStandards. This coating was thought to be oxide,
and subsequent observations were made in anatmosphere of helium that had been passedthrough a Uquid nitrogen trap to remove watervapor and oU. The coating persisted, however,even in hehum, and no determination has beenmade as to the source. It has been established,
though, that formation of this coating has noappreciable effect on the thermal emf.
Thus these thermocouples should not be used in
strongly oxidizing atmospheres if long life is
wanted. They are, however, usable in neutralatmospheres and in vacuo. No statement has beenfound of effects of reducing atmospheres on thesewires or of effects of various refractories. Untilinformation does appear, it seems reasonable to
assume for the sake of accuracy and safety thatiridium and its alloys with rhodium are affected in
a manner similar to platinum.
Iridivmi is used as a catalyst in some processes,
but no definitive work seems to have been done oncatalytic effects under conditions of thermocoupleuse in burners. It seems reasonable to expect thatsuch effects will be present in cases of incompletecombustion, and so care should be taken in inter-
preting data obtained with iridium-containingthermocouples under such conditions, especially in
the lower temperature range.
No procedures for annealing iridium and its
rhodium alloys are stated in the literature, but onesuggested by Brenner [41] has been adopted at theNational Bureau of Standards. In this, a smallsample of wire is heated electrically imtil it melts;the apparent temperature of melting is observedwith an optical pyrometer, and the thermocouplewire is annealed for a few minutes at an apparenttemperature about 200 °C lower than that ob-served at melting. Care must be taken in this pro-
cedure, especially with the pure wire, because of
the effect on the reading of the optical pyrometerof the black smoke generated. Immersion of the
hot wires in an atmosphere of inert gas is helpful
in preventing oxidation. Helium has been used at
the National Bureau of Standards during calibra-
tions.
Care is needed in handling these wires. Theyare flexible in the annealed state, but cannot standmuch cold working such as the bending that occursin normal use. Wire of 0.035 in. diam hasbeen bent at the National Bureau of Standardsinto an eye of about 0.25 in. diam. without break-ing, but it cannot be straightened a^ain withoutheating. Several cases have occurred in which the
repeated mild bending incidental to changing the
reference junction ice bath has broken the wires.
11
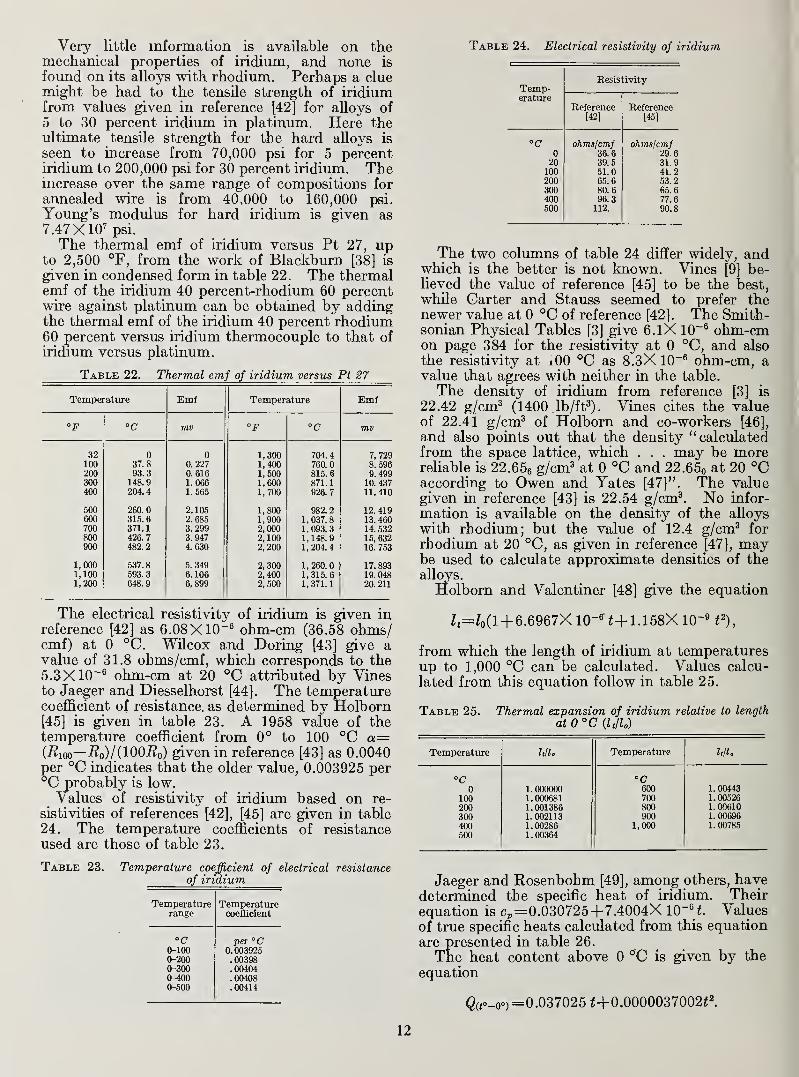
Very little information is available on themechanical properties of iridium, and none is
found on its alloys with rhodium. Perhaps a cluemight be had to the tensile strength of iridiumfrom values given in reference [42] for alloys of
5 to 30 percent iridium in platinum. Here theultimate tensile strength for the hard alloys is
seen to increase from 70,000 psi for 5 percentiridium to 200,000 psi for 30 percent iridium. Theincrease over the same range of compositions for
annealed wire is from 40.000 to 160,000 psi.
Young's modulus for hard iridium is given as
7.47X10^ psi.
The thermal emf of iridium versus Pt 27, upto 2,500 °F, from the work of Blackburn [38] is
given in condensed form in table 22. The thermalemf of the iridium 40 percent-rhodium 60 percentwire against platinum can be obtained by addingthe thermal emf of the iridium 40 percent rhodium60 percent versus iridium thermocouple to that of
iridium versus platinum.
Table 22. Thermal emf of iridium versus Pt 27
Temperature Emf Temperature Emf
°C mv op °C mv
32 0 0 1,300 704.4 7, 729100 37.8 0. 227 1,400 760.0 8.596200 93.3 0. 616 1,500 815.6 9.499300 148.9 1.066 1,600 871.1 10. 437400 204.4 1.565 1,700 926. 7 11.410
500 260.0 2.105 1,800 982.2 12. 419600 315.6 2. 685 1,900 1,037.8 13. 460700 371.1 3.299 2,000 1,093.3 14.532800 426.7 3.947 2,100 1,148.9 15, 632900 482.2 4.630 2,200 1, 204. 4 16. 753
1,000 537.8 5. 349 2, 300 1,260.0 17.8931,100 593.3 6. 106 2,400 1,315.6 19. 0481,200 648.9 6,899 2, 500 1,371.1 20. 211
The electrical resistivity of iridium is given inreference [42] as 6.08X10"^ ohm-cm (36.58 ohms/emf) at 0 °C. Wilcox and Doring [43] give avalue of 31.8 ohms/cmf, which corresponds to the
5.3X10"^ ohm-cm at 20 °C attributed by Vinesto Jaeger and Diesselhorst [44]. The temperat\u-ecoefficient of resistance, as determined by Holborn[45] is given in table 23. A 1958 value of thetemperature coefficient from 0° to 100 °C a=(i?ioo— i?o)/(100i?o) given in reference [43] as 0.0040per °C indicates that the older value, 0.003925 per°C probably is low.
Values of resistivity of iridium based on re-
sistivities of references [42], [45] are given in table
24. The temperature coefficients of resistance
used are those of table 23.
Table 23. Temperature coefficient of electrical resistance
of iridium
Temperature Temperaturerange coefficient
"C per °C0-100 0. 0039250-200 .003980-300 .00404o^m .004080-500 .00414
Table 24. Electrical resistivity of iridium
Temp-erature
Resistivity
Reference[42]
Reference[45]
°C ohmslcmf ohms/cmf0 36.6 29.6
on 39.5 31.9100 51.0 41.2200 65.6 53.2300 80.6 65.6400 96.3 77.6500 112. 90.8
The two columns of table 24 differ widely, andwhich is the better is not known. Vines [9] be-lieved the value of reference [45] to be the best,
while Garter and Stauss seemed to prefer thenewer value at 0 °C of reference [42]. The Smith-sonian Physical Tables [3] give 6.lX 10~* ohm-cmon page 384 for the resistivity at 0 °C, and also
the resistivity at lOO °C as 8.3X 10~® ohm-cm, avalue that agrees with neither in the table.
The density of iridium from reference [3] is
22.42 g/cm^ (1400 Ib/ft^). Vines cites the valueof 22.41 g/cm^ of Holborn and co-workers [46],
and also points out that the density "calculatedfrom the space lattice, which . . . may be morerehable is 22.656 g/cm^ at 0 °C and 22.65o at 20 °Caccording to Owen and Yates [47]". The valuegiven in reference [43] is 22.54 g/cm^. No infor-
mation is available on the density of the alloys
with rhodium; but the value of 12.4 g/cm^ for
rhodium at 20 °C, as given in reference [47], maybe used to calculate approximate densities of theaUoys.Holborn and Valentiner [48] give the equation
Z,=;o(l-f 6.6967X 10-«'^-f 1.158X lO"* t'),
from which the length of iridium at temperaturesup to 1,000 °C can be calculated. Values calcu-
lated from this equation follow in table 25.
Table 25. Thermal expansion of iridium relative to length
at 0 °C Htllo)
Temperature lilU Temperature
"C °C0 1.000000 600 1.00443
100 1.000681 700 1. 00526
200 1.001386 800 1. 00610
300 1.002113 900 1.00696400 1.00286 1,000 1.00785500 1.00364
Jaeger and Rosenbohm [49], among others, havedetermined the specific heat of iridium. Theirequation is Cp=0.030725+7.4004X 10"^ ^. Values
of true specific heats calculated fr-om this equation
are presented in table 26.
The heat content above 0 °C is given by the
equation
Q(^o_oo) =0.037025 «-H0.0000037002<2.
12
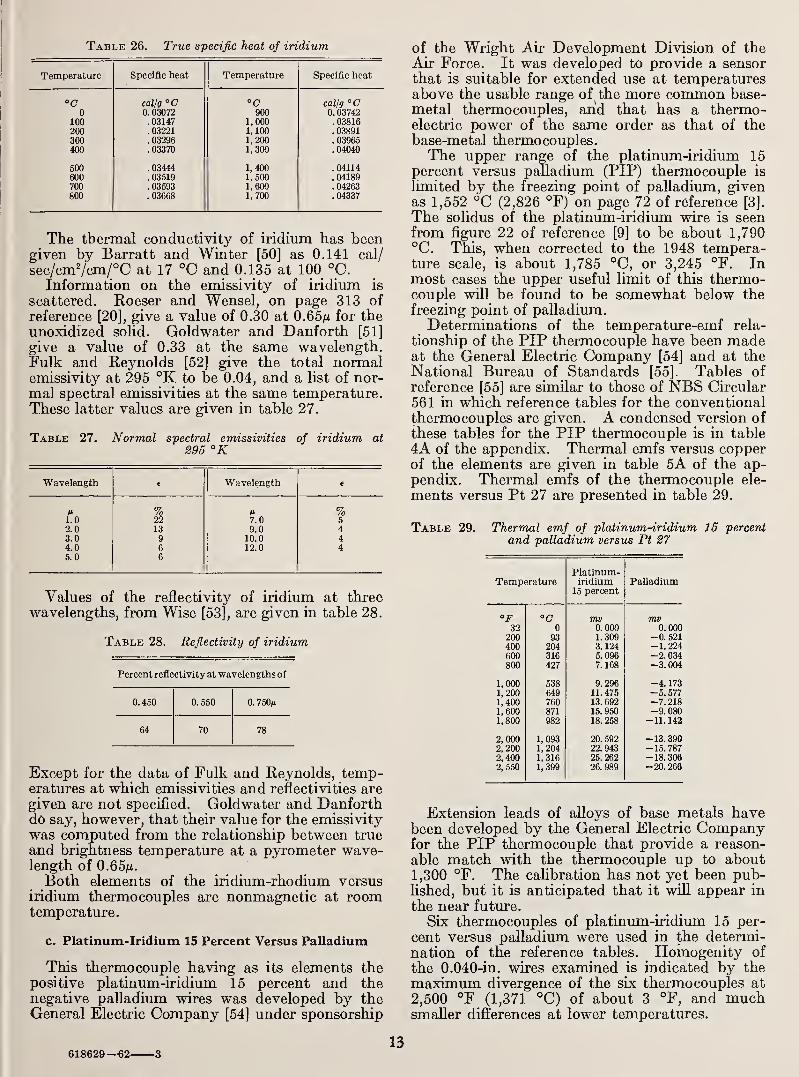
Table 26. True specific heat of iridium
Temperature Specific heat Temperature Specific heat
°C callg °C "C callg °C0 0. 03072 900 0. 03742
100 . 03147 1,000 .03816200 .03221 1, 100 .03891300 . 03296 1,200 .03965400 . 03370 1,300 . 04040
aoo .03444 1,400 .04114600 . 03519 1,500 . 04189700 . 03593 1,600 . 04263800 . 03668 1,700 .04337
The thermal conductivity of iridium has beengiven by Barratt and Winter [50] as 0.141 cal/
sec/cm7cm/°C at 17 °C and 0.135 at 100 °C.Information on the emissivity of iridium is
scattered. Roeser and Wensel, on page 313 of
reference [20], give a value of 0.30 at 0.65^ for theunoxidized solid. Goldwater and Danforth [51]
give a value of 0.33 at the same vp^avelength.
Fulk and Reynolds [52] give the total normalemissivity at 295 °K to be 0.04, and a list of nor-
mal spectral emissivities at the same temperature.These latter values are given in table 27.
Table 27. Normal spectral emissivities of iridium at
295 °K
Wavelength e Wavelength e
% %1.0 22 7.0 52.0 13 9.0 43.0 9 10.0 44.0 6 12.0 45.0 6
Values of the reflectivity of iridium at threewavelengths, from Wise [53], are given in table 28.
Table 28. Reflectivity of iridium
Percent reflectivity at wavelengths of
0. 450 0. 550 0. 750a»
64 70 78
Except for the data of Fulk and Reynolds, temp-eratures at which emissivities and reflectivities aregiven are not specified. Goldwater and Danforthdo say, however, that their value for the emissivitywas computed from the relationship between true
and brightness temperature at a pyrometer wave-length of 0.65m.Both elements of the iridium-rhodium versus
iridium thermocouples are nonmagnetic at roomtemperature.
c. Platinum-Iridium 15 Percent Versus Palladium
This thermocouple having as its elements thepositive platinum-iridium 15 percent and thenegative palladium wires was developed by theGeneral Electric Company [54] under sponsorship
of the Wright Air Development Division of theAir Force. It was developed to provide a sensorthat is suitable for extended use at temperaturesabove the usable range of the more common base-metal thermocouples, and that has a thermo-electric power of the same order as that of thebase-metal thermocouples.The upper range of the platinum-iridium 15
percent versus palladium (PIP) thermocouple is
limited by the freezing point of palladium, givenas 1,552 °C (2,826 °F) on page 72 of reference [3].
The solidus of the platinum-iridium vpire is seenfrom figure 22 of reference [9] to be about 1,790°C. This, when corrected to the 1948 tempera-ture scale, is about 1,785 °C, or 3,245 °F. Inmost cases the upper useful limit of this thermo-couple will be found to be somewhat below thefreezing point of palladium.
Determinations of the temperature-emf rela-
tionship of the PIP thermocouple have been madeat the General Electric Company [54] and at theNational Bureau of Standards [55]. Tables of
reference [55] are simUar to those of NBS Circular561 in which reference tables for the conventionalthermocouples are given. A condensed version of
these tables for the PIP thermocouple is in table
4A of the appendix. Thermal emfs versus copperof the elements are given in table 5A of the ap-pendix. Thermal emfs of the thermocouple ele-
ments versus Pt 27 are presented in table 29.
Table 29. Thermal emf of platinum-iridium 16 percent
and palladium versus Pt £7
TemperaturePlatinum-iridium
15 percentPalladium
op °C mv mv32 0 0.000 0.000
200 93 1.309 -0. 521
400 204 3. 124 -1.224600 316 5. 096 -2. 034800 427 7. 168 -3.004
1,000 538 9.296 -4. 1731,200 649 11. 475 -5. 5771,400 760 13.692 -7. 218
1, 600 871 15. 950 -9. 0801,800 982 18. 258 -11. 142
2,000 1,093 20. 592 -13. 3902, 200 1,204 22. 943 -15. 7872,400 1,316 25. 262 -18. 3062,550 1,399 26. 989 -20. 266
Extension leads of alloys of base metals havebeen developed by the General Electric Companyfor the PIP thermocouple that provide a reason-
able match with the thermocouple up to about1,300 °F. The cahbration has not yet been pub-hshed, but it is anticipated that it vnll appear in
the near future.
Six thermocouples of platinum-iridium 15 per-
cent versus palladium were used in the determi-nation of the reference tables. Homogenity of
the 0.040-ia. vnres examined is radicated by the
maximum divergence of the six thermocouples at
2,500 °F (1,371 °C) of about 3 °F, and muchsmaller differences at lower temperatures.
618629—62 -313
Some of the 0.040-in. wires have been drawndown to 0.010-in. diameter at NBS, and there is
no reason to beheve that they cannot be reducedto a diameter of a mil of so.
Resistance to corrosion of the platinum-iridium alloy is excellent, and apparently sur-
passes in this respect the platinum-rhodium alloys
discussed earUer. Some loss of iridimn is said to
occur in the region of 900 °C (1, 652 °F) and abovebecause of formation and volatihzation of theoxide. A gray to black fibn has been seen to formon this wire at about the same temperature whenthe wire is heated in air. This film may disappearon heating to a temperature two or three hundreddegrees higher. Although no detailed informationon the resistance of the platinum-iridium alloys to
the ordinary products of combustion and reducingconditions is found, as a matter of safety, pre-
cautions similar to those described for platinumshould be observed.
Palladium is not so resistant to attack by com-mon chemicals as are the other platinum metalsdiscussed previously. According to Vines [9]
"Palladium is resistant to corrosion at room tem-perature by hydrofluoric acid, perchloric acid,
phosphoric acid and acetic acid. It is sHghtlyattacked by sulphuric, hydrochloric and- hydro-bromic acids, especially in the presence of air,
and readily attacked by nitric acid, ferric chloride,
hypochlorites and moist chlorine, bromine andiodine. In ordinary atmospheres palladium is
resistant to tarnish, but some discoloration mayoccur on exposure to moist industrial atmospherescontaining sulphur dioxide." Ihnat [54] points
out the following characteristics of palladium:
"1. Palladium is superficially oxidized if heated to atemperature of 700 °C (1,292 °F). The oxide (PdO)formed decomposes above 875 °C (1,607 °F) and a brightmetal remains.
2. "Palladium will absorb as much as 800 to 900times its own volume of hydrogen over a range of tem-perature.
"3. Subjected to alternate oxidizing and reducingatmospheres surface blistering is apt to result."
The first and third of these have been confirmedapproximately in the work on this thermocoupleat the National Bureau of Standards.
Both the platinum-iridium and palladium wires
are catalytic, and accordingly care should be takenin interpretation of data obtained with them.Both elements of this thermocouple are readily
handled in the annealed state without danger of
breaking. Vines' comments on annealing of the
wires follow:
"Alloys containing more than 10% iridium requirerather high annealing temperatures, in the neighborhoodof 1,400 °C to completely soften them in a short time,
although in practice, anneals at about 1,100 to 1,200 °Cfor 30 to 45 minutes are sometimes employed.
"Palladium is very ductile and can be worked hot or
cold. As with platinum, it is usual to begin working ingots
at about 800 °C to secure more rapid reduction and thenfinish by cold working. Palladium withstands drastic cold
working and, like gold, can be beaten into leaf as thin as
1/250,000 of an inch.
"It is possible that pure palladium can be annealed ata lower temperature than pure platinum but reliable infor-mation is not available. Although marked softeningoccurs at 700 °C, commercial palladium requires an anneal-ing temperature of 800 or 900 °C to obtain maximumductility with a short anneal. At temperatures outsidethis range, selective grain growth resulting in loweredductility may occur in some lots of commercial palladium.
"Palladium is preferably annealed in nitrogen orcarbon monoxide as it oxidizes in air if the temperature is
below about 800 °C . .."
The following annealing procedures, adopted atthe National Bureau of Standards, are those sug-gested by Mr. L. J. Stiles of the General ElectricCompany. The elements were separated, andthe platinum-iridium wire was heated electrically
to 1,300 °C (2,372 °F) in air for one minute.Appropriate corrections to observations, madewith an optical pyrometer, took account of theemissivity, about 30 percent of the wire. Thepalladium wire was heated electrically at 750 °C(1,382 °F) for 25 min. Emissivity of the pal-ladium was assumed to be about 35 percent.The ultimate tensile strength of platinum
iridium alloys as given Dy Carter and Stauss in
reference [19] is presented in table 30.
Table '30. Ultimate tensile strength of platinum-iridiumalloys, psi
Percent Ir Hard Annealed
5 70,000 40,00010 90, 000 55,00015 120, 000 75,00020 145, 000 100, 00025 170, 000 125, 00030 200, 000 160, 000
The tensile strength at temperatures up to
1,100 °C of commercial palladium annealed at
1,100 °C, according to reference [18], is given in
table 31. The tensile strength of pure paUadimnthat had been annealed at 800 or 900 °C for aboutfive min, according to reference [17], increased
from 30,000 psi to 47,000 psi when reduced 50percent in area by cold drawing.
Table 31. Tensile strength of commercial palladium at
temperatures up to 1,100 °C
Tensilestrength,
Temperature commericalpalladium
°C psiRoom 28, 000200 24, 600400 18, 100600 12,700800 8,300
1,000 3,8201,100 2,920
Wise, CroweU, and Eash [17] found the propor-
tional limit of commercial palladium to be about
5,000 psi after anneahng at 800 °C and 30,000 psi
after a 50 percent reduction in area by cold
drawing.
14
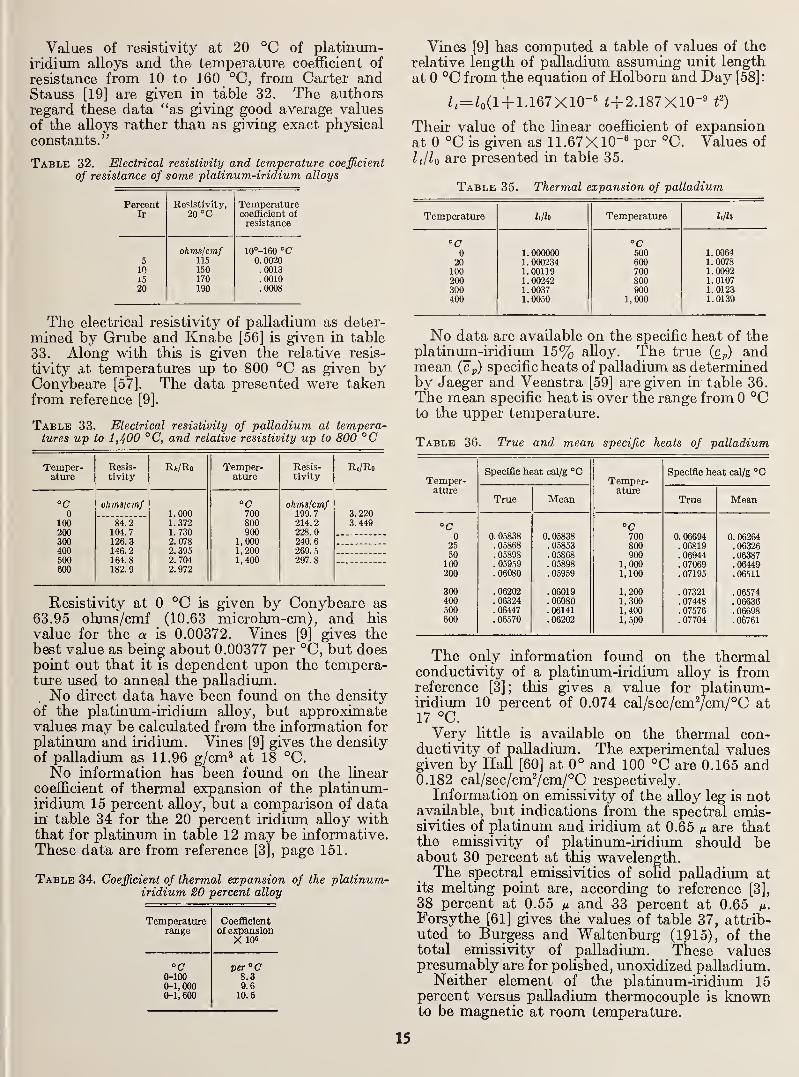
Values of resistivity at 20 °C of platinum-iridium alloys and the temperature coefficient of
resistance from 10 to 160 °C, from Carter andStauss [19] are given in table 32. The authorsregard these data "as giving good average values
of the alloys rather than as giving exact physical
constants."
Table 32. Electrical resistivity and temperature coefficient
of resistance of some platinum-iridium alloys
PercentIt
Resistivity,
20 °CTemperaturecoeflficient ofresistance
ohms/cmf 10°-160 °C5 115 0.002010 150 .0013I5 170 .001020 190 .0008
The electrical resistivity of palladium as deter-
mined by Grube and Knabe [56] is given in table
33. Along with this is given the relative resis-
tivity at temperatures up to 800 °C as given byConybeare [57]. The data presented were takenfrom reference [9].
Table 33. Electrical resistivity of palladium at tempera-tures up to 1,400 °C, and relative resistivity up to 800 °C
Temper- Resis- Ri/Ro Temper- Resis- R</Roature tivity ature tivity
"C ohms/cmf °C ohmslcmf0 1.000 700 199.7 3. 220
100 84.2 1.372 800 214.2 3.449200 104.7 1.730 900 228.0300 126.3 2. 078 1,000 240.6400 146.2 2.395 1,200 269.5500 164.8 2.704 1,400 297.8600 182.9 2. 972
Resistivity at 0 °C is given by Conybeare as
63.95 ohms/cmf (10.63 microhm-cm), and his
value for the a is 0.00372. Vines [9] gives thebest value as being about 0.00377 per °C, but doespoint out that it is dependent upon the tempera-ture used to anneal the palladium.No direct data have been found on the density
of the platinum-iridium alloy, but approximatevalues may be calculated from the information for
platinum and iridiimi. Vines [9] gives the densityof palladium as 11.96 g/cm^ at 18 °C.No information has been found on the linear
coefficient of thermal expansion of the platinum-iridium 15 percent alloy, but a comparison of datain table 34 for the 20 percent iridium alloy withthat for platiaum in table 12 may be informative.These data are from reference [3], page 151.
Table 34. Coefficient of thermal expansion of the platinum-iridium 20 percent alloy
Temperature Coefficientrange of ejcpansion
X 10«
"C per °C0-100 8.30-1,000 9.60-1,600 10.5
Vines [9] has computed a table of values of therelative length of palladium assxmiing unit length
at 0 °C from the equation of Holborn and Day [58]:
^,-^o(l+ 1.167X10-^ ^+2.187X10-^ f)
Their value of the linear coefficient of expansionat 0 °C is given as 1 1.67X 10"" per °C. Values of
Itjlo are presented in table 35.
Table 35. Thermal expansion of palladium
Temperature hlh Temperature UlU
°C °C0 1.000000 500 1.0064
20 1. 000234 600 1.0078100 1.00119 700 1.0092200 1.00242 800 1. 0107300 1.0037 900 1.0123400 1. 0050 1,000 1.0139
No data are available on the specific heat of theplatinum-iridium 15% aUoy. The true (Cp) andmean (Cp) specific heats of palladium as determinedby Jaeger and Veenstra [59] are given in table 36.
The mean specific heat is over the range from 0 °Cto the upper temperature.
Table 36. True and mean specific heats of palladium
Temper-ature
Specific heat cal/g °CTemper-ature
Speoiiic heat cal/g °0
True Mean True Mean
"C °C0 0. 05838 0. 05838 700 0. 06694 0. 06264
25 . 05868 .05853 800 . 06819 . 0632650 . 05898 .05868 900 .06944 .06387
100 . 05959 . 05898 1,000 . 07069 .06449200 . 06080 . 05959 1,100 . 07195 . 065H
300 . 06202 . 06019 1,200 . 07321 . 06574400 .06324 .06080 1,300 .07448 .0663(5500 . 06447 . 06141 1,400 . 07576 . 06698600 . 06570 . 06202 1,500 . 07704 . 06761
The only information found on the thermalconductivity of a platinum-iridium alloy is fromreference [3]; this gives a value for platinum-iridium 10 percent of 0.074 cal/sec/cm7cm/°C at17 °C.Very little is available on the thermal con-
ductivity of palladium. The experimental valuesgiven by Hall [60] at 0° and 100 °C are 0.165 and0.182 cal/sec/cm^/cm/°C respectively.
Information on emissivity of the aUoy leg is notavailable, but indications from the spectral emis-sivities of platinum and iridium at 0.65 n are thatthe emissivity of platinum-iridium should beabout 30 percent at this wavelength.The spectral emissivities of solid palladium at
its melting point are, according to reference [3],
38 percent at 0.55 ^ and 33 percent at 0.65 n.
Forsythe [61] gives the values of table 37, attrib-uted to Burgess and Waltenburg (1915), of thetotal emissivity of palladium. Tkese valuespresumably are for polished, unoxidized palladium.
Neither element of the platinum-iridium 15percent versus palladium thermocouple is knownto be magnetic at room temperature.
15
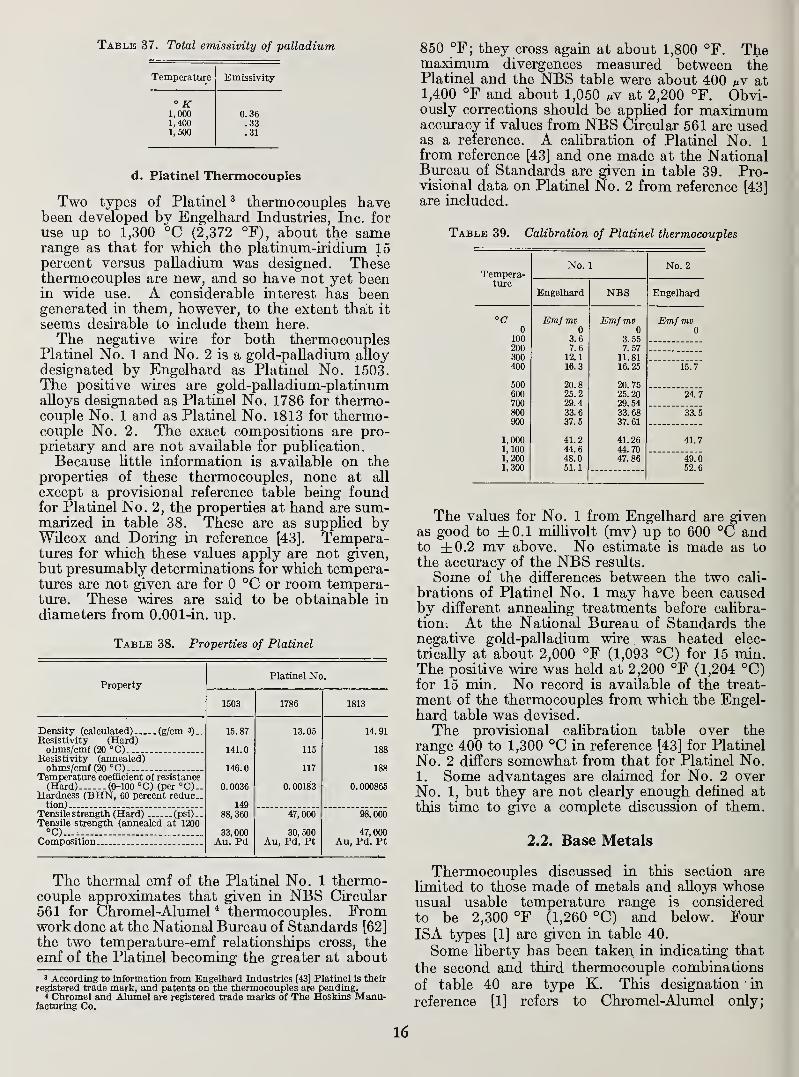
Table 37. Total emissivity of palladium
Temperature Emissivity
" K1,000 0. 361,400 .331,500 .31
d. Platinel Thermocouples
Two types of Platinel ^ thermocouples havebeen developed by Engelhard Industries, Inc. for
use up to 1,300 °C (2,372 °F), about the samerange as that for which the platinum-iridium 15percent versus palladium was designed. Thesethermocouples are new, and so have not yet beenin wide use. A considerable interest has beengenerated in them, however, to the extent that it
seems desirable to include them here.
The negative wire for both thermocouplesPlatinel No. 1 and No. 2 is a gold-palladium aUoydesignated by Engelhard as Platinel No. 1503.The positive wires are gold-palladium-platinumalloys designated as Platinel No. 1786 for thermo-couple No. 1 and as Platinel No. 1813 for thermo-couple No. 2. The exact compositions are pro-prietary and are not available for publication.
Because httle information is available on theproperties of these thermocouples, none at all
except a provisional reference table being foundfor Platinel No. 2, the properties at hand are sum-marized in table 38. These are as supphed byWilcox and Doring in reference [43]. Tempera-tures for which these values apply are not given,
but presumably determinations for which tempera-tures are not given are for 0 °C or room tempera-ture. These wires are said to be obtainable in
diameters from 0.001-in. up.
Table 38. Properties of Platinel
PropertyPlatinel No.
1503 1786 1813
Density (calculated) (g/cm 3)_ 15.87 13. 05 14. 91Eesistivity (Hard)ohms/cmf (20 °C) 141.0 115 188
Resistivity (annealed)ohms/cmf (20 "O 146.0 117 188
Temperature coefficient of resistance(Hard) (O-lOO °C) (per °C).. 0. 0036 0. 00183 0. 000865
Hardness (BHN, 60 percent reduc-tion) 149
Tensile strength (Hard) (psi)_. 88, 360 47, 000 98, 000Tensile strength (annealed at 1200°C)„- 33,000 30, 500 47,000
Composition Au, Pd Au, Pd, Pt Au, Pd, Pt
The thermal emf of the Platinel No. 1 thermo-couple approximates that given in NBS Circular
561 for Chromel-Alumel * thermocouples. Fromwork done at the National Bureau of Standards [62]
the two temperature-emf relationships cross, theemf of the Platinel becoming the greater at about
' According to Information from Engelhard Industries [43] Platinel Is theirregistered trade mark, and patents on the thermocouples are pending.
* Chromel and Alumel are registered trade marks of The Hoskins Manu-facturiag Co.
850 °F; they cross again at about 1,800 °F. Themaximum divergences measured between thePlatinel and the NBS table were about 400 at1,400 °F and about 1,050 mV at 2,200 °F. Obvi-ously corrections should be appHed for maximumaccuracy if values from NBS Circular 561 are usedas a reference. A calibration of Platinel No. 1
from reference [43] and one made at the NationalBureau of Standards are given in table 39. Pro-visional data on Platinel No. 2 from reference [43]are included.
Table 39. Calibration of Platinel thermocouples
Tempera-ture
No. 1 No. 2
Engelhard NBS Engelhard
°C Emf mv EmJ mv Emf mv0 0 0 0
100 3.6 3. 55200 7.6 7.57300 12.1 11.81400 16.3 16.25 15.7
500 20.8 20.75600 25.2 25.20 24.7700 29.4 29.54800 33.6 33. 68 33.5900 37.5 37. 61
1,000 41.2 41.26 41.71,100 44.6 44.701,200 48.0 47.86 49.01,300 51.1 62.6
The values for No. 1 from Engelhard are givenas good to ±0.1 milhvolt (mv) up to 600 °C andto ±0.2 mv above. No estimate is made as to
the accuracy of the NBS results.
Some of the differences between the two cali-
brations of Platinel No. 1 may have been causedby different annealing treatments before calibra-
tion. At the National Bureau of Standards thenegative gold-palladium wire was heated elec-
trically at about 2,000 °F (1,093 °C) for 15 min.The positive wire was held at 2,200 °F (1,204 °C)for 15 min. No record is available of the treat-
ment of the thermocouples from which the Engel-hard table was devised.
The provisional cahbration table over therange 400 to 1,300 °C in reference [43] for Platinel
No. 2 differs somewhat from that for Platinel No.1. Some advantages are claimed for No. 2 overNo. 1, but they are not clearly enough defined at
this time to give a complete discussion of them.
2.2. Base Metals
Thermocouples discussed in this section are
limited to those made of metals and alloys whoseusual usable tempeiature range is considered
to be 2,300 °F (1,260 °C) and below. FourISA types [1] are given in table 40.
Some hberty has been taken, in indicating that
the second and third thermocouple combinations
of table 40 are type K. This designation in
reference [1] refers to Chromel-Alumel only;
16
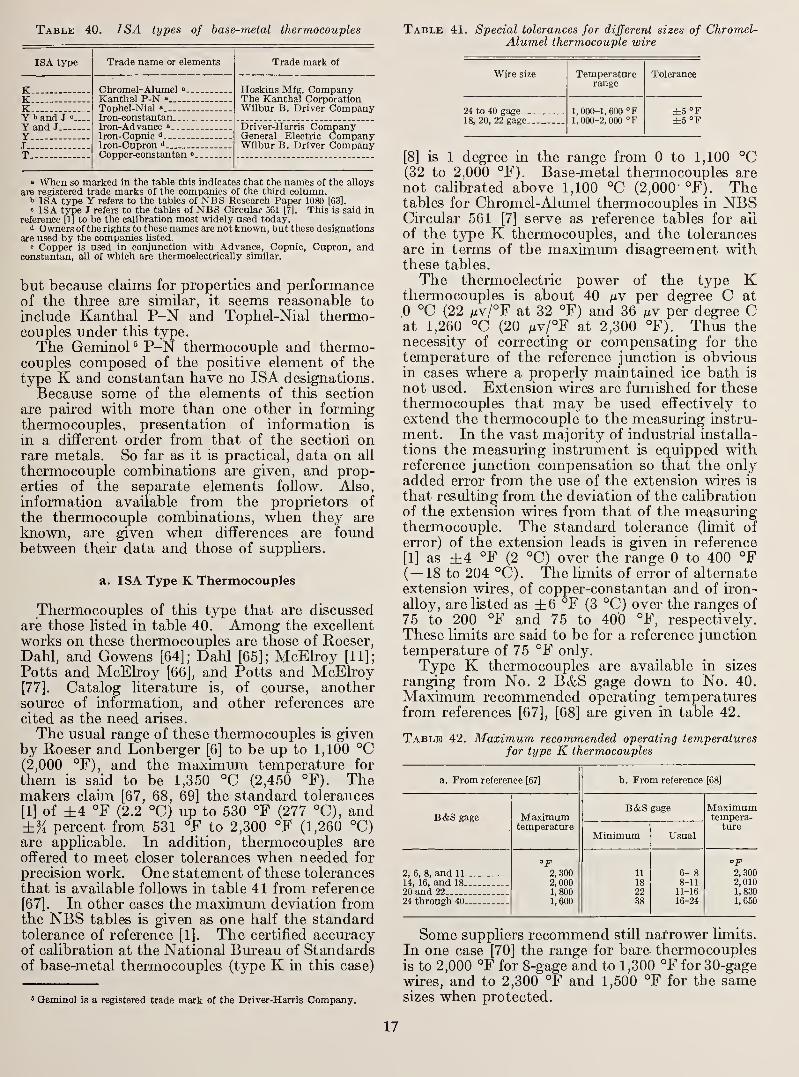
Table 40. ISA types of base-metal thermocouples
ISA type
KKK.._ -.Y b and J ».
Y and JYJT
Trade name or elements
Chromel-Alumel »- - -
Kanthal P-N »
Tophel-Nial «
Iron-constantanIron-Advance »
Iron-Copnio <•
Iron-Cupron <•
Copper-constantan =.
Table 41. Special tolerances for different sizes of Chromel-Alumel thermocouple wire
Trade mark of
Hoskins Mfg. CompanyThe Kanthal CorporationWilbur B. Driver Company
Driver-Harris CompanyGeneral Electric CompanyWilbur B. Driver Company
» When so marked in the table this indicates that the namfes of the alloys
are registered trade marks of the companies of the third column.>> ISA type Y refers to the tables of NBS Research Paper 1080 [63].
= ISA type J refers to the tables of NBS Circular 561 [7]. This is said mreference [1] to be the calibration most widely used today.
<i Owners of the rights to these names are not known, but these designationsare used by the companies listed.
e Copper is used in conjunction vrith Advance, Copnic, Cupron, andconstantan, aU of which are thermoelectricaUy similar.
but because claims for properties and. performanceof the three are similar, it seems reasonable to
include Kanthal P-N and Tophel-Nial thermo-couples under this type.
The Geminol ^ P-N thermocouple and thermo-couples composed of the positive element of the
type K and constantan have no ISA designations.
Because some of the elements of this section
are paired with more than one other in formingthermocouples, presentation of information is
in a different order from that of the section, onrare metals. So far as it is practical, data on all
thermocouple combinations are given, and prop-erties of the separate elements follow. Also,
information available from the proprietors of
the thermocouple combinations, when they are
known, are given when differences are foundbetween their data and those of suppliers.
a. ISA Type K Thermocouples
Thermocouples of this type that are discussed
are those listed in table 40. Among the excellent
works on these thermocouples are those of Roeser,Dahl, and Gowens [64]; Dahl [65]; McElroy [11];
Potts and McElroy [66], and Potts and McElroy[77]. Catalog literature is, of course, anothersource of information, and other references are
cited as the need arises.
The usual range of these thermocouples is givenby Roeser and Lonberger [6] to be up to 1,100 °C(2,000 °F), and the maximum temperature for
them is said to be 1,350 °C (2,450 °F). Themakers clahn [67, 68, 69] the standard tolerances
[1] of ±4 °F (2.2 °C) up to 530 °F (277 °C), and±% percent from 531 °F to 2,300 °F (1,260 °C)are applicable. In addition, thermocouples areoffered to meet closer tolerances when needed for
precision work. One statement of these tolerances
that is available follows in table 41 from reference
[67]. In other cases the maximum deviation fromthe NBS tables is given as one half the standardtolerance of reference [1]. The certified accuracyof calibration at the National Bureau of Standardsof base-metal thermocouples (type K in this case)
Wire size Temperature Tolerancerange
24 to 40 gage 1, 000-1,600 "F ±5 °F18, 20, 22 gage 1,000-2,000 °F ±5 °F
[8] is 1 degree in the range from 0 to 1,100 °C(32 to 2,000 °F). Base-metal thermocouples arenot calibrated above 1,100 °C (2,000 °F). Thetables for Chromel-Alumel thermocouples in NBSCircular 561 [7] serve as reference tables for ail
of the type K thermocouples, and the tolerancesare in terms of the maximum disagreement withthese tables.
The thermoelectric power of the type Kthermocouples is about 40 iiY per degree C at0 °C (22 Mv/°F at 32 °F) and 36 fiv per degree Cat 1,260 °C (20 Mv/°F at 2,300 °F). Thus thenecessity of correcting or compensating for thetemperature of the reference junction is obviousin cases where a properly maintained ice bath is
not used. Extension wires are furnished for thesethermocouples that may be used effectively to
extend the thermocouple to the measuring instru-
ment. In the vast majority of industrial installa-
tions the measuring instrument is equipped withreference junction compensation so that the onlyadded error from the use of the extension wires is
that resulting from the deviation of the calibration
of the extension wires from that of the measuringthermocouple. The standard tolerance (limit of
error) of the extension leads is given in reference
[1] as ±4 °F (2 °C) over the range 0 to 400 °F(— 18 to 204 °C). The limits of error of alternate
extension wires, of copper-constantan and of iron-
alloy, are listed as ±6 °F (3 °C) over the ranges of
75 to 200 °F and 75 to 400 °F, respectively.
These limits are said to be for a reference junctiontemperature of 75 °F only.
Type K thermocouples are available in sizes
ranging from No. 2 B&S gage down to No. 40.
Maximum recommended operating temperaturesfrom references [67], [68] are given in table 42.
Table 42. Maximum recommended operating temperaturesfor type K thermocouples
a. From reference [67] b. From reference [68]
B&S gage MaximumB&S gage Maximum tempera-
temperature tureMinimum Usual
2, 6, 8, and 11
14, 16, and 1820 and 2224 through 40
"F2,3002, 0001,8001,600
11
182238
6- 88-1111-1616-24
°F2,3002,0101, 8301,650
' Geminol is a registered trade mark of the Driver-Harris Company.
Some suppliers recommend still narrower limits.
In one case [70] the range for bare thermocouplesis to 2,000 °F for 8-gage and to 1,300 °F for 30-gagewires, and to 2,300 °F and 1,500 °F for the samesizes when protected.
17
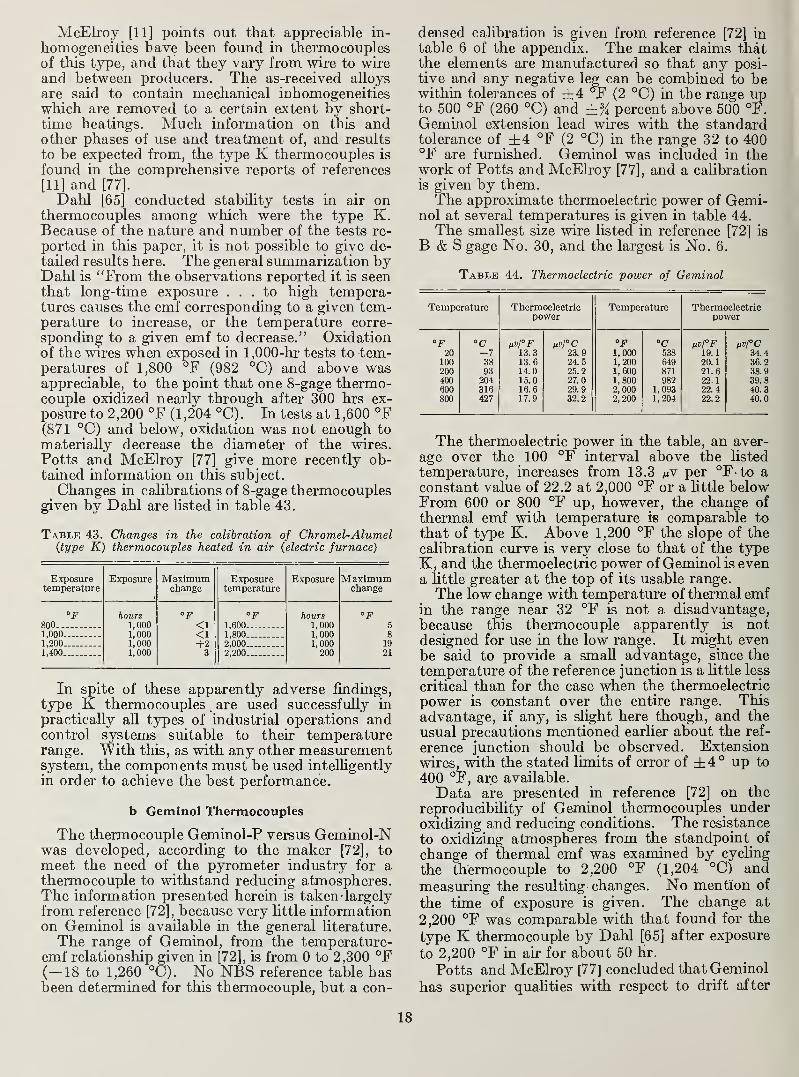
McElroy [11] points out that appreciable in-
homogeneities have been found in thermocouplesof this type, and that they vary from wire to wireand between producers. The as-received alloys
are said to contain mechanical inhomogeneitieswhich are removed to a certain extent by short-
time heatings. Much information on this andother phases of use and treatment of, and results
to be expected from, the type K thermocouples is
found in the comprehensive reports of references
[11] and [77].
Dahl [65] conducted stability tests in air onthermocouples among which were the type K.Because of the nature and number of the tests re-
ported in this paper, it is not possible to give de-tailed results here. The general svunmarization byDahl is "From the observations reported it is seenthat long-time exposure ... to high tempera-tures causes the emf corresponding to a given tem-perature to increase, or the temperature corre-
sponding to a given emf to decrease." Oxidationof the wires when exposed in 1,000-hr tests to tem-peratures of 1,800 °F (982 °C) and above wasappreciable, to the point that one 8-gage thermo-couple oxidized nearly through after 300 hrs ex-
posure to 2,200 °F (1,204 °C). In tests at 1,600 °F(871 °C) and below, oxidation was not enough to
materially decrease the diameter of the wires.
Potts and McElroy [77] give more recently ob-tained information on this subject.
Changes in calibrations of 8-gage thermocouplesgiven by Dahl are listed in table 43.
Table 43. Changes in the calibration of ChromeUAlumel{type K) thermocouples healed in air {electric furnace)
Exposuretemperature
Exposure Maximumchange
Exposuretemperature
Exposure Maximumchange
"F800
hours1,0001,0001,0001,000
"F<1<1+23
1,600hours
1, 0001,0001,000
200
°F5
81921
1,000 1,8001,200 2,0001,400 2,200
In spite of these apparently adverse findings,
type K thermocouples are used successfully in
practically aU types of industrial operations andcontrol systems suitable to their temperaturerange. With this, as with any other measurementsystem, the components must be used intelligently
in order to achieve the best performance.
b Geminol Thermocouples
The thermocouple Geminol-P versus Geminol-Nwas developed, according to the maker [72], to
meet the need of the pyrometer industry for athermocouple to withstand reducing atmospheres.The information presented herein is taken largely
from reference [72], because very little informationon Geminol is available in the general literature.
The range of Geminol, from the temperature-emf relationship given in [72], is from 0 to 2,300 °F(—18 to 1,260 °C). No NBS reference table hasbeen determined for this thermocouple, but a con-
densed calibration is given from reference [72] in
table 6 of the appendix. The maker claims thatthe elements are manufactured so that any posi-
tive and any negative leg can be combined to bewithin tolerances of ±4 °F (2 °C) in the range upto 500 °F (260 °C) and ±% percent above 500 °F.Geminol extension lead wires with the standardtolerance of ±4 °F (2 °C) in the range 32 to 400°F are furnished. Geminol was included in thework of Potts and McElroy [77], and a calibration
is given by them.The approximate thermoelectric power of Gemi-
nol at several temperatures is given in table 44.
The smallest size wire listed in reference [72] is
B & S gage No. 30, and the largest is No. 6.
Table 44. Thermoelectric power of Geminol
Temperature Thermoelectric Temperature Thermoelectricpower power
op °C plvI°F "F °C20 -7 13.3 23.9 1,000 538 19.1 34.4
100 38 13.6 24. 5 1,200 649 20.1 36.2200 93 14.0 25.2 1,600 871 21.6 38.9400 204 15.0 27.0 1,800 982 22.1 39.8600 316 16.6 29.9 2, 000 1,093 22.4 40.3800 427 17.9 32.2 2, 200 1,204 22.2 40.0
The thermoelectric power in the table, an aver-
age over the 100 °F interval above the listed
temperature, increases from 13.3 /uv per °F- to aconstant value of 22.2 at 2,000 °F or a little belowFrom 600 or 800 °F up, however, the change of
thermal emf with temperature is comparable to
that of type K. Above 1,200 °F the slope of thecalibration curve is very close to that of the typeK, and the thermoelectric power of Geminol is evena little greater at the top of its usable range.
The low change with temperature of thermal emfin the range near 32 °F is not a disadvantage,because this thermocouple apparently is notdesigned for use in the low range. It might evenbe said to provide a smaU advantage, since the
temperature of the reference junction is a little less
critical than for the case when the thermoelectric
power is constant over the entire range. Thisadvantage, if any, is slight here though, and the
usual precautions mentioned earlier about the ref-
erence junction should be observed. Extensionwires, with the stated limits of error of ± 4 ° up to
400 °F, are available.
Data are presented in reference [72] on the
reproducibility of Geminol thermocouples underoxidizing and reducing conditions. The resistance
to oxidizing atmospheres from the standpoint of
change of thermal emf was examined by cycling
the thermocouple to 2,200 °F (1,204 °C) and
measuring the resulting changes. No mention of
the time of exposure is given. The change at
2,200 °F was comparable with that found for the
type K thermocouple by Dahl [65] after exposure
to 2,200 °F in air for about 50 hr.
Potts and McElroy [77] concluded that Geminol
has superior qualities with respect to drift after
18
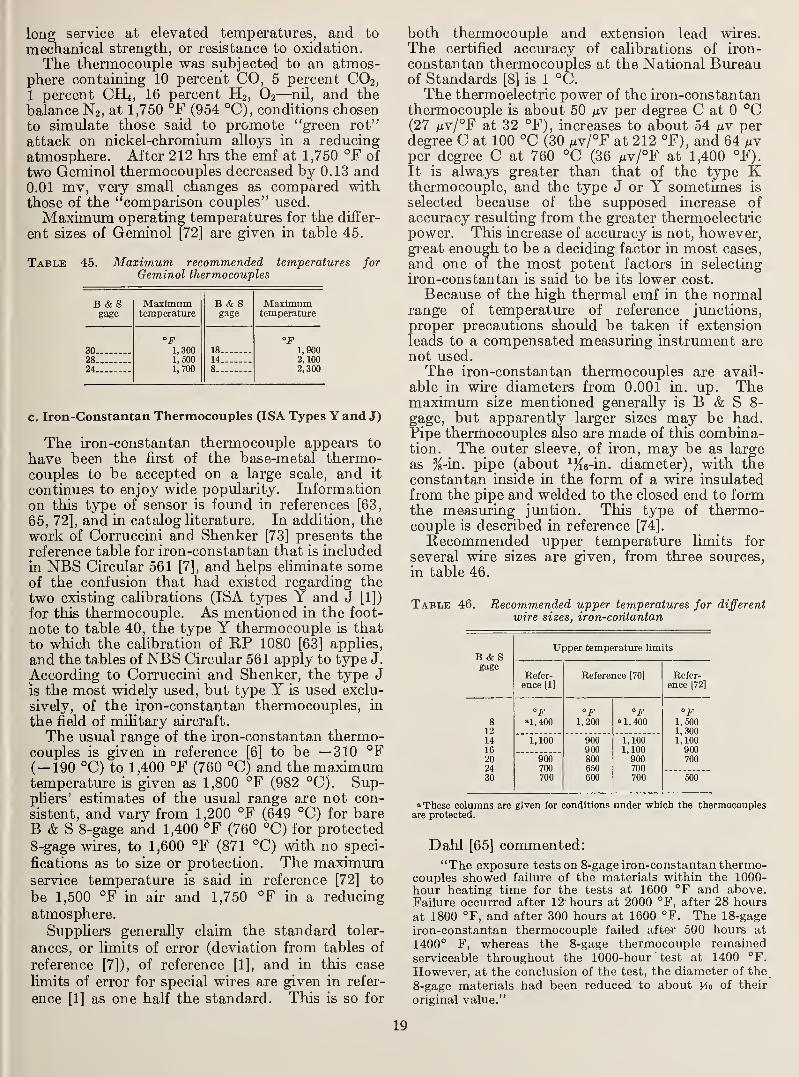
long service at elevated temperatures, and to
mechanical strength, or resistance to oxidation.
The thermocouple was subjected to an atmos-phere containing 10 percent CO, 5 percent CO2,1 percent CH4, 16 percent H2, O2—nil, and thebalance N2, at 1,750 °F (954 °C), conditions chosen
to simulate those said to promote "green rot"
attack on nickel-chromium alloys in a reducingatmosphere. After 212 hrs the emf at 1,750 °F of
two Geminol thermocouples decreased by 0.13 and0.01 mv, very small changes as compared withthose of the "comparison couples" used.
Maximum operating temperatm-es for the differ-
ent sizes of Geminol [72] are given in table 45.
Table 45. Maximum recommended temperatures forGeminol thermocouples
B & Sgage
Maximumtemperature
B & Sgage
Maximumtemperature
30
0p1, 3001,5001,700
18
op
1,9002, 1002, 300
28 14
24 8
c. Iron-Constantan Thermocouples (ISA Types Y and J)
The iron-constantan thermocouple appears to
have been the first of the base-metal thermo-couples to be accepted on a large scale, and it
continues to enjoy wide popularity. Informationon this type of sensor is found in references [63,
65, 72], and in catalog literature. In addition, thework of Corruccini and Shenker [73] presents thereference table for iron-constantan that is included
in NBS Circular 561 [7], and helps eliminate someof the confusion that had existed regarding the
two existing calibrations (ISA types Y and J [1])
for this thermocouple. As mentioned in the foot-
note to table 40, the type Y thermocouple is that
to which the calibration of RP 1080 [63] applies,
and the tables of NBS Circular 561 apply to type J.,
According to Corruccini and Shenker, the type Jis the most widely used, but type Y is used exclu-
sively, of the iron-constautan thermocouples, in
the field of military aircraft.
The usual range of the iron-constantan thermo-couples is given in reference [6] to be —310 °F(-190 °C) to 1,400 °F (760 °C) and the maximumtemperature is given as 1,800 °F (982 °C). Sup-pliers' estimates of the usual range are not con-sistent, and vary from 1,200 °F (649 °C) for bareB & S 8-gage and 1,400 °F (760 °C) for protected
8-gage wu-es, to 1,600 °F (871 °C) with no speci-
fications as to size or protection. The maximumservice temperature is said in reference [72] to
be 1,500 °F in air and 1,750 °F in a reducing
atmosphere.
Suppliers generally claim the standard toler-
ances, or limits of error (deviation from tables of
reference [7]), of reference [1], and in this case
limits of error for special wires are given in refer-
ence [1] as one half the standard. This is so for
both thermocouple and extension lead wires.
The certified accuracy of calibrations of iron-
constantan thermocouples at the National Bureauof Standards [8] is 1 °C.The thermoelectric power of the iron-constantan
thermocouple is about 50 nv per degree C at 0 °C(27 iiy/°F at 32 °F), increases to about 54 nv perdegree C at 100 °C (30 at 212 and 64 hyper degree C at 760 °C (36 mv/°F at 1,400 °F).
It is always greater than that of the type Kthermocouple, and the type J or Y sometimes is
selected because of the supposed increase of
accuracy resulting from the greater thermoelectricpower. This increase of accuracy is not, however,great enough to be a deciding factor in most cases,
and one of the most potent factors in selecting
iron-constantan is said to be its lower cost.
Because of the high thermal emf in the normalrange of temperature of reference junctions,
proper precautions should be taken if extensionleads to a compensated measuring instrimient arenot used.
The iron-constantan thermocouples are avail-
able in wire diameters from 0.001 in. up. Themaximum size mentioned generally is B & S 8-
gage, but apparently larger sizes may be had.Pipe therniocouples also are made of this combina-tion. The outer sleeve, of iron, may be as large
as %-in. pipe (about ^Ke-in. diameter), vpith theconstantan inside in the form of a wire insulatedfrom the pipe and welded to the closed end to formthe measuring juntion. This type of thermo-couple is described in reference [74].
Recommended upper temperature limits for
several wire sizes are given, from three sources,
in table 46.
Table 46. Recommended upper temperatures for different
wire sizes, iron-coritantan
Upper temperature limits
gageRefer-ence [1]
Reference [70] Refer-ence [72]
°F 0p "F °F8 »1,400 1,200 "1,400 1,50012 1,30014 1,100 900 1,100 1,10016 900 1,100 90020 900 800 900 70024 700 650 70030 700 600 700 500
» Tbese columns are given for conditions under which the thermocouplesare protected.
Dahl [65] commented:
"The exposure tests on 8-gage iron-constantan thermo-couples showed failure of the materials within the 1000-hour heating time for the tests at 1600 °F and above.Failure occurred after 12- hours at 2000 °F, after 28 hours
at 1800 °F, and after 300 hours at 1600 °F. The 18-gage
iron-constantan thermocouple failed after 500 hours at
1400° F, whereas the 8-gage thermocouple remainedserviceable throughout the 1000-hour test at 1400 °F.
However, at the conclusion of the test, the diameter of the
8-gage materials had been reduced to about Ho of their
original value."
19
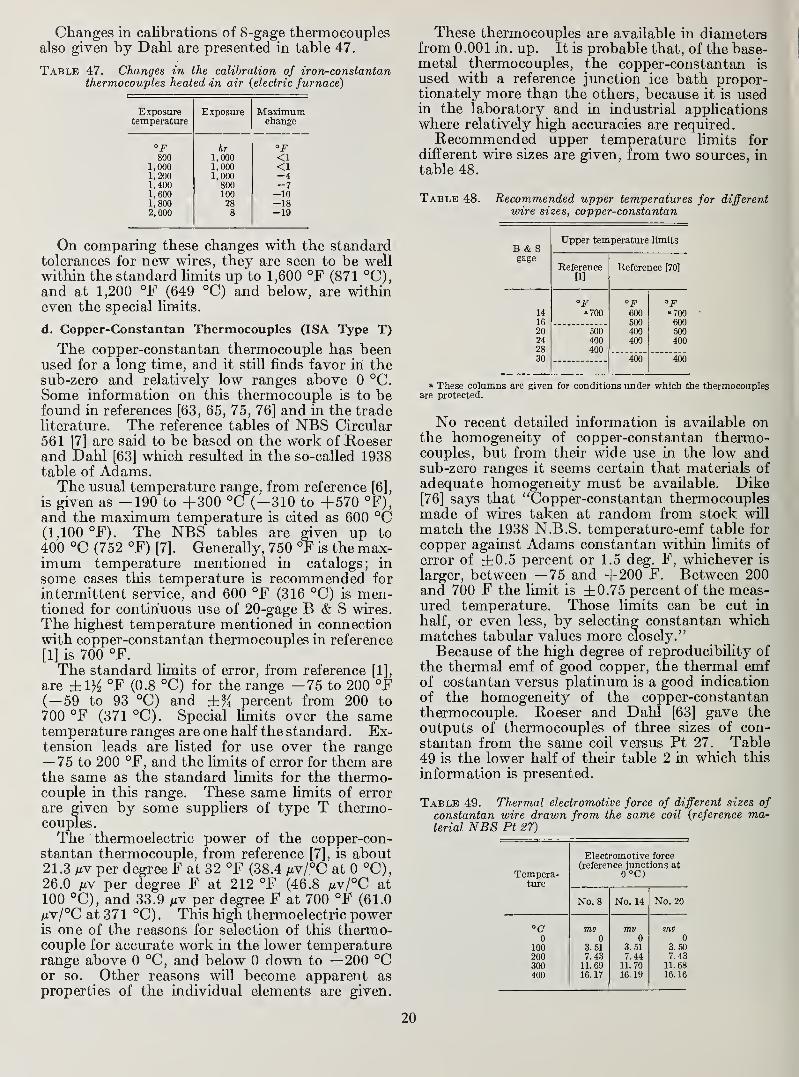
Changes in calibrations of 8-gage thermocouplesalso given by Dahl are presented in table 47.
Table 47. Changes in the calibration of iron-constantanthermocouples heated dn air (electric furnace)
Exposure Exposure A'Ta.Yimnmtemperature change
°F ftrop
800 1,000 <11,000 1,000 <11,200 1,000 -41,400 800 -71,600 100 -101,800 28 -182,000 8 -19
On comparing these changes with the standardtolerances for new wires, they are seen to be wellwithin the standard limits up to 1,600 °F (871 °C),and at 1,200 °F (649 °C) and below, are withineven the special limits.
d. Copper-Constantan Thermocouples (ISA Type T)
The copper-constantan thermocouple has beenused for a long time, and it still finds favor in thesub-zero and relatively low ranges above 0 °C.Some information on this thermocouple is to befound in references [63, 65, 75, 76] and in the tradeliterature. The reference tables of NBS Circular561 [7] are said to be based on the work of .Roeser
and Dahl [63] which resulted in the so-called 1938table of Adams.The usual temperature range, from reference [6],
is given as -190 to +300 °C (-310 to +570 °F),
and the maximum temperature is cited as 600 °C(1,100 °F). The NBS tables are given up to
400 °C (752 °F) [7]. Generally, 750 °F is the max-imum temperature mentioned in catalogs; in
some cases this temperature is recommended for
intermittent service, and 600 °F (316 °C) is men-tioned for continuous use of 20-gage B & S wires.
The highest temperature mentioned in connectionwith copper-constantan thermocouples in reference
[1] is 700 °F.
The standard limits of error, from reference [1],
are ±1^ °F (0.8 °C) for the range -75 to 200 °F(— 59 to 93 °C) and ±% percent from 200 to
700 °F (371 °C). Special limits over the sametemperature ranges are one half the standard. Ex-tension leads are listed for use over the range— 75 to 200 °F, and the limits of error for them arethe same as the standard limits for the thermo-couple in this range. These same limits of error
are given by some suppliers of type T thermo-couples.
The thermoelectric power of the copper-con-stantan thermocouple, from reference [7], is about21.3 per degree F at 32 °F (38.4 mv/°C at 0 °C),26.0 MV per degree F at 212 °F (46.8 mv/°C at
100 °C), and 33.9 juv per degree F at 700 °F (61.0
Mv/°Cat371 °C). This high thermoelectric poweris one of the reasons for selection of this thermo-couple for accurate work in the lower temperaturerange above 0 °C, and below 0 down to —200 °Cor so. Other reasons will become apparent as
properties of the individual elements are given.
These thermocouples are available in diametersfrom 0.001 in. up. It is probable that, of the base-metal thermocouples, the copper-constantan is
used with a reference junction ice bath propor-tionately more than the others, because it is usedin the laboratory and in industrial applicationswhere relatively high accuracies are required.Recommended upper temperature limits for
different wire sizes are given, from two sources, in
table 48.
Table 48. Recommended upper temperatures for differentwire sizes, copper-constantan
B & Sgage
Upper temperature limits
Reference[1]
Reference [70]
0p "F14 »700 600 "70016 500 60020 500 400 50024 400 400 40028 40030 400 400
a These columns are given for conditions under which the thermocouplesare protected.
No recent detailed information is available onthe homogeneity of copper-constantan thermo-couples, but from their wide use in the low andsub-zero ranges it seems certain that materials of
adequate homogeneity must be available. Dike[76] says that "Copper-constantan thermocouplesmade of wires taken at random from stock will
match the 1938 N.B.S. temperature-emf table for
copper against Adams constantan within limits of
error of ±0.5 percent or 1.5 deg. F, whichever is
larger, between —75 and +200 F. Between 200and 700 F the limit is ±0.75 percent of the meas-ured temperature. Those limits can be cut in
half, or even less, by selecting constantan whichmatches tabular values more closely."
Because of the high degree of reproducibility of
the thermal emf of good copper, the thermal emfof costantan versus platinimi is a good indication
of the homogeneity of the copper-constantanthermocouple. Roeser and Dahl [63] gave theoutputs of thermocouples of three sizes of con-
stantan from the same coil versus Pt 27. Table49 is the lower half of their table 2 in which this
information is presented.
Table 49. Thermal electromotive force of different sizes ofconstantan wire drawn from the same coil [reference ma-terial NBS Pt 27)
Tempera-ture
Electromotive force(reference junctions at
0 °C)
No. 8 No. 14 No. 20
"C mv mv mv0 0 0 0
100 3. 51 3. 51 3.50
200 7. 43 7. 44 7. 43
300 11.69 11.70 11.68
400 16.17 16. 19 16.16
20
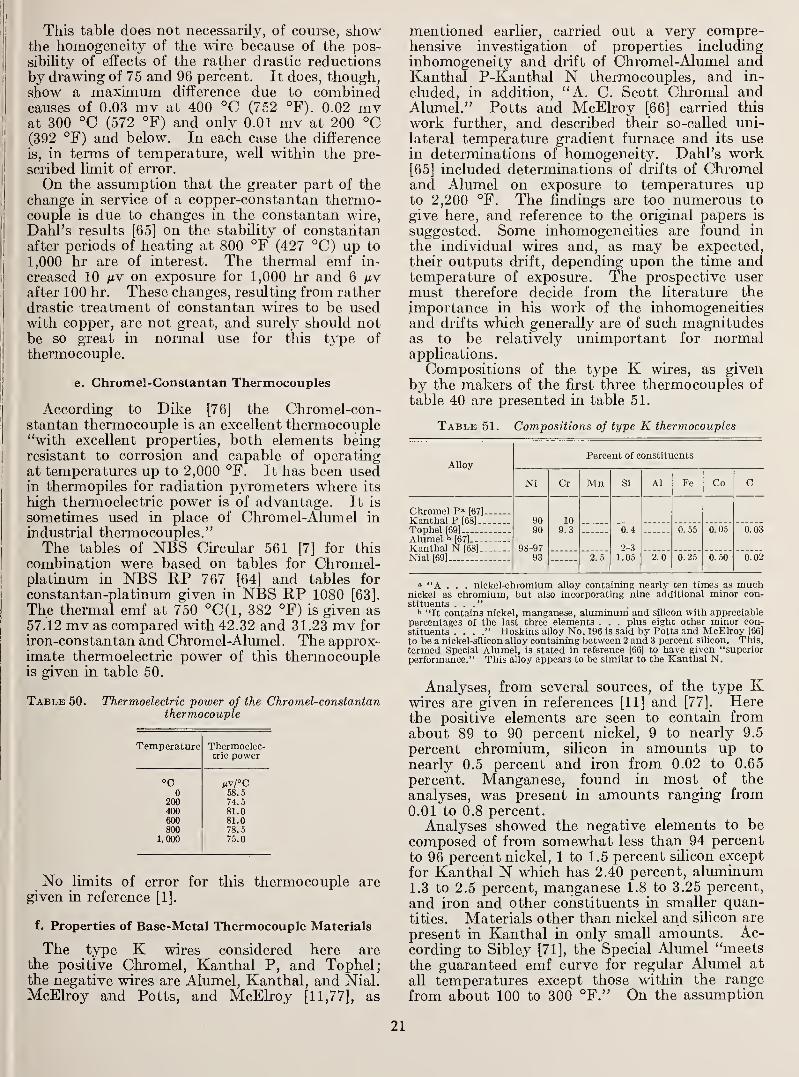
I This table does not necessarily, of course, showthe homogeneity of the wire because of the pos-
sibility of effects of the rather drastic reductions
I by drawing of 75 and 96 percent. It does, though,I show a maximum difference due to combinedI causes of 0.03 mv at 400 °C (752 °F). 0.02 mv[
at 300 °C (572 °F) and only 0.01 mv at 200 °C(392 °F) and below. In each case the difference
is, in terms of temperature, well within the pre-
I
scribed limit of error.
I On the assumption that the greater part of the
I
change in service of a copper-constantan thermo-
1
couple is due to changes in the constantan wire,
Dahl's results [65] on the stability of constantanI after periods of heating at 800 °F (427 °C) up to
! 1,000 hr are of interest. The thermal emf in-
I
creased 10 on exposure for 1,000 hr and 6 hyafter 100 hr. These changes, resulting from ratherdrastic treatment of constantan wires to be usedwith copper, are not great, and surely should not
I be so great in normal use for this type of
i
thermocouple.
e. Chromel-Constantan Thermocouples
' According to Dike [76] the Chromel-con-stantan thermocouple is an excellent thermocouple"with excellent properties, both elements beingresistant to corrosion and capable of operating
j at temperatures up to 2,000 °F. It has been usedin thermopiles for radiation pyrometers where its
high thermoelectric power is of advantage. It is
sometimes used in place of Chromel-Alumel in
industrial thermocouples."The tables of NBS Circular 561 [7] for this
combination were based on tables for Chromel-
j
platinum in NBS RP 767 [64] and tables for
constantan-platinum given in NBS IIP 1080 [63].
The thermal emf at 750 °C(1, 382 °F) is given as
57.12 mv as compared with 42.32 and 31.23 mv for
iron-constantan and Chromel-Alumel. The approx-imate thermoelectric power of this thermocoupleis given iti table 60.
Table 50. Thermoelectric power of the Chromel-constantanthermocouple
Temperature Thermoelec-tric power
°C MV/^C0 58.5
200 74.5400 81.0600 81.0800 78.5
1,000 75.0
No limits of error for this thermocouple are
given in reference [1].
f. Properties of Base-Metal Thermocouple Materials
The type K wires considered here arethe positive Chromel, Kanthai P, and Tophel;the negative wires are Alumel, Kanthal, and Nial.
McElroy and Potts, and McElroy [11,77], as
mentioned earlier, carried out a very compre-hensive investigation of properties includinginhomogeneity and drift of Chromel-Alumel andKanthal P-Kanthal N thermocouples, and in-
cluded, in addition, "A. C. Scott Chromal andAlumel." Potts and McElroy [66] carried this
work further, and described their so-called uni-
lateral temperature gradient furnace and its usein determinations of homogeneity. Dahl's work[65] included determinations of drifts of Chromeland Alumel on exposure to temperatures upto 2,200 °F. The findings are too numerous to
give here, and reference to the original papers is
suggested. Some inhomogeneities are found in
the individual wires and, as may be expected,their outputs drift, depending upon the time andtemperature of exposure. The prospective usermust therefore decide from the literature the
importance in his work of the inhomogeneitiesand drifts which generally are of such magnitudesas to be relatively unimportant for normalapplications.
Compositions of the type K wires, as givenby the makers of the first three thermocouples of
table 40 are presented in table 51.
Table 51. Compositions of type K thermocouples
AUoyPercent of constituents
Ni Cr Mn Si Al Fe Co C
Chromel P" [67]
Kanthal P [68] 9090
98-9793
10
9.3Tophel [69] 0.4
2-3
1.05
0. 55 0. 05 0.03Alumel [67]
Kanthal N [68]
Nial [69] 2. 5 2.0 0. 25 0.50 0.02
» "A . . . nickel-chromium alloy containing nearly ten times as muchnickel as chromium, but also incorporating nine additional minor con-stituents ..."
^ "It contains nickel, manganese, aluminum and silicon with appreciablepercentages of the last three elements . . . plus eight other minor con-stituents . . .
." Hoskins alloy No. 196 is said by Potts and McElroy [66]
to be a nickel-silicon alloy containing between 2 and 3 percent silicon. This,
termed Special Alumel, is stated in reference [66] to have given "superiorperformance." This alloy appears to be similar to the Kanthal N.
Analyses, from several sources, of the type Kwires are given in references [11] and [77]. Herethe positive elements are seen to contain fromabout 89 to 90 percent nickel, 9 to nearly 9.5
percent chromium, silicon in amounts up to
nearly 0.5 percent and iron from 0.02 to 0.65
percent. Manganese, found in most of the
analyses, was present in amounts ranging from0.01 to 0.8 percent.
Analyses showed the negative elements to becomposed of from somewhat less than 94 percent
to 96 percent nickel, 1 to 1.5 percent sUicon except
for Kanthal N which has 2.40 percent, aluminum1.3 to 2.5 percent, manganese 1.8 to 3.25 percent,
and iron and other constituents in smaller quan-tities. Materials other than nickel and silicon are
present in Kanthal in only small amounts. Ac-cording to Sibley [71], the Special Alimiel "meetsthe guaranteed emf curve for regular Alumel at
all temperatures except those within the range
from about 100 to 300 °F." On the assumption
21
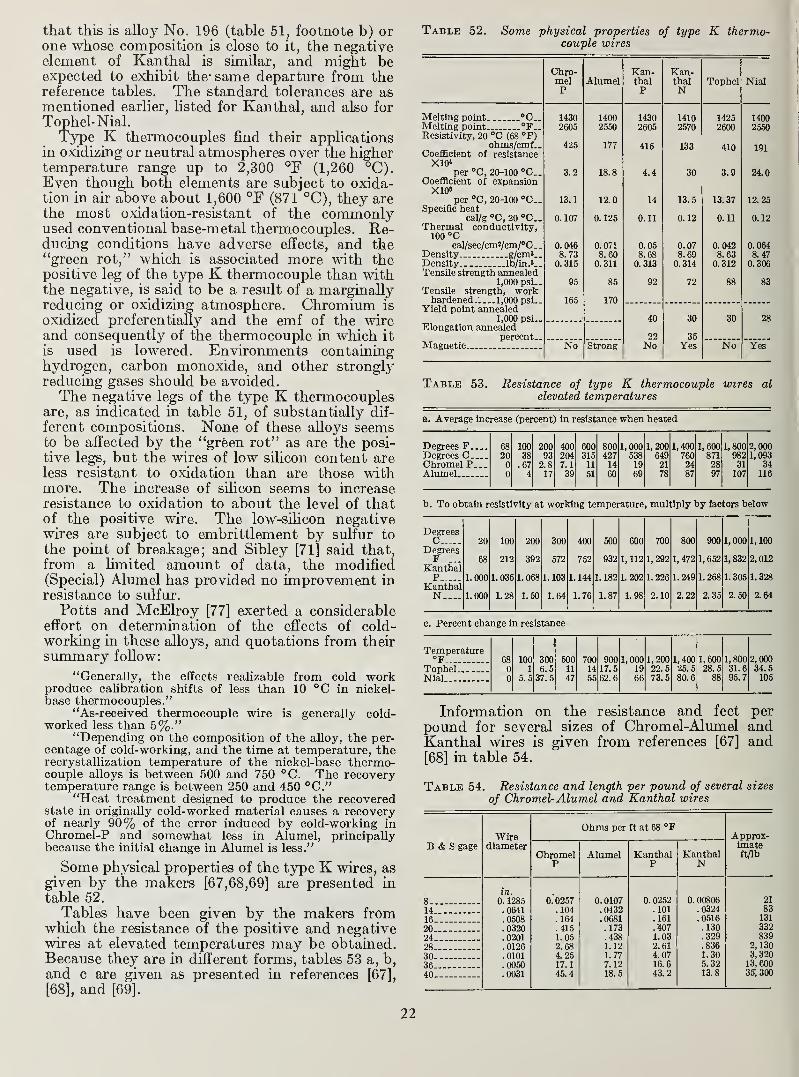
that this is alloy No. 196 (table 51, footnote b) orone whose composition is close to it, the negativeelement of Kanthal is similar, and might beexpected to exhibit the- same departure from thereference tables. The standard tolerances are asmentioned earlier, listed for Kanthal, and also for
Tophel-Nial.Type K thermocouples find their applications
in oxidizing or neutral atmospheres over the highertemperature range up to 2,300 °F (1,260 °C).Even though both elements are subject to oxida-tion in air above about 1,600 °F (871 °C), they arethe most oxidation-resistant of the commonlyused conventional base-metal thermocouples. Re-ducing conditions have adverse effects, and the"green rot," which is associated more with thepositive leg of the type K thermocouple than withthe negative, is said to be a result of a marginallyreducing or oxidizing atmosphere. Chromiimi is
oxidized preferentially and the emf of the wireand consequently of the thermocouple in which it
is used is lowered. Environments containinghydrogen, carbon monoxide, and other stronglyreducing gases should be avoided.The negative legs of the type K thermocouples
are, as indicated in table 51, of substantially dif-
ferent compositions. None of these alloys seemsto be affected by the "green rot" as are the posi-
tive legs, but the wires of low silicon content areless resistant to oxidation than are those withmore. The increase of silicon seems to increaseresistance to oxidation to about the level of thatof the positive wire. The low-silicon negativewires are subject to embrittlement by sulfur to
the point of breakage; and Sibley [71] said that,
from a limited amount of data, the modified(Special) Alumel has provided no improvement in
resistance to sulfur.
Potts and McElroy [77] exerted a considerableeffort on determination of the effects of cold-working in these alloys, and quotations from their
summary follow:
"Generally, the effects realizable from cold workproduce calibration shifts of less than 10 °C in nickel-base thermocouples."
"As-received thermocouple wire is generally cold-worked less than 5%."
"Depending on the composition of the alloy, the per-centage of cold-working, and the time at temperature, therecrystallization temperature of the nickel-base thermo-couple alloys is between 500 and 750 °C. The recoverytemperature range is between 250 and 450 °C."
"Heat treatment designed to produce the recoveredstate in originally cold-worked material causes a recoveryof nearly 90% of the error induced by cold-working inChromel-P and somewhat less in Alumel, principallybecause the initial change in Alumel is less."
Some physical properties of the type K wires, asgiven by the makers [67,68,69] are presented in
table 52.
Tables have been given by the makers fromwhich the resistance of the positive and negativewires at elevated temperatures may be obtained.Because they are in different forms, tables 53 a, b,
and c are given as presented in references [67],
[68], and [69].
Table 52. Some physical properties of type K thermo-couple wires
Chro-melP
AlumelKan-thalP
Kan-thalN
Tophel Nial
Melting point °0.. 1430 1400 1430 1410 1425 1400Melting point °F_. 2605 2550 2605 2570 2600 2550Resistivity, 20 "C (68 °F)
ohms/cmf.. 425 177 415 133 410 191Coefficient of resistanceX10<
per °C, 20-100 °C.. 3.2 18.8 4.4 30 3.9 24.0Coefficient of expansionXIO'
per °C, 20-100 "C. 13.1 12.0 14 13.5 13.37 12.25Specific heat
eal/g °C, 20 °C.. 0. 107 0. 125 0.11 0. 12 0. 11 0. 12Thermal conductivity,
100 "CcaI/seo/cmVem/°C._ 0. 046 0. 071 0.05 0. 07 0. 042 0. 064
Density— g/cm'.. 8.73 8. 60 8.68 8.69 8. 63 8.47Density ..lb/in.'.. 0. 315 0. 311 0. 313 0. 314 0.312 0.306TensUe strength annealed
1,000 psi— 95 85 92 72 88 83Tensile strength, workhardened 1,000 psi— 165 170
Yield point annealed1,000 psi 40
22No
30
35Yes
30 28Elongation aimealed
percentMagnetic No Strong No Yes
Table 53. Resistance of type K thermocouple wires at
elevated temperatures
a. Average increase (percent) in resistance when heated
Degrees F 68 100 200 400 600 800 1,000 1,200 1,400 1,600 1,800 2,000Degrees C 20 38 93 204 315 427 538 649 760 871 982 1,093Chromel P.-- 0 .67 2.8 7.1 11 14 19 21 24 28 31 34Alumel 0 4 17 39 51 60 69 78 87 97 107 116
b. To obtain resistivity at working temperature, multiply by factors below
DegreesC 20 100 200 300 400 500 600 700 800 900 1, 000 1, 100
DegreesF 68 212 392 572 752 932 1, 112 1,292 1,472 1,652 1,832 2.012
KanthalP 1.000 1.035 1.068 1. 103 \. 144 1. 182 L202 1.226 1.249 1. 268 L305 L328
KanthalN 1.000 1.28 L50 1.64 1.76 1.87 1.98 2. 10 2.22 2.35 2.50 2.64
c. Percent change In resistance
Temperature68 100 300 500 700 900 1,000 1,200 1,400 1,600 1,800 2, 000
Tophel 0 1 6.5 11 14 17.5 19 22.5 25.5 28.6 31.6 34.5
Nial- 0 5.5 37.5 47 55 62.6 66 73.5 80.6 88 95.7 105
Information on the resistance and feet perpound for several sizes of Chromel-Alumel andKanthal wires is given from references [67] and[68] in table 54.
Table 54. Resistance and length per pound of several sizes
of Chromel-Alumel and Kanthal wires
B & S gageWire
diameter
Ohms per ft at 68 °FApprox-imateftAbChromel
PAlumel Kanthal
PKanthalN
in.
8 0. 1285 0.0257 0.0107 0. 0252 0. 00806 21
14 .0641 .104 .0432 .101 .0324 83
16 .0508 . 164 .0681 .161 .0516 131
20.-- .0320 .415 .173 ."407 .130 332
24 .0201 1.05 .438 1.03 .329 839
28 .0126 2.68 1.12 2.61 .836 2, 130
30 .0101 4. 25 1.77 4. 07 1.30 3,320
36 .0050 17.1 7. 12 16.6 6.32 13, 600
40 .0031 45.4 18.5 43.2 13.8 35, 300
22
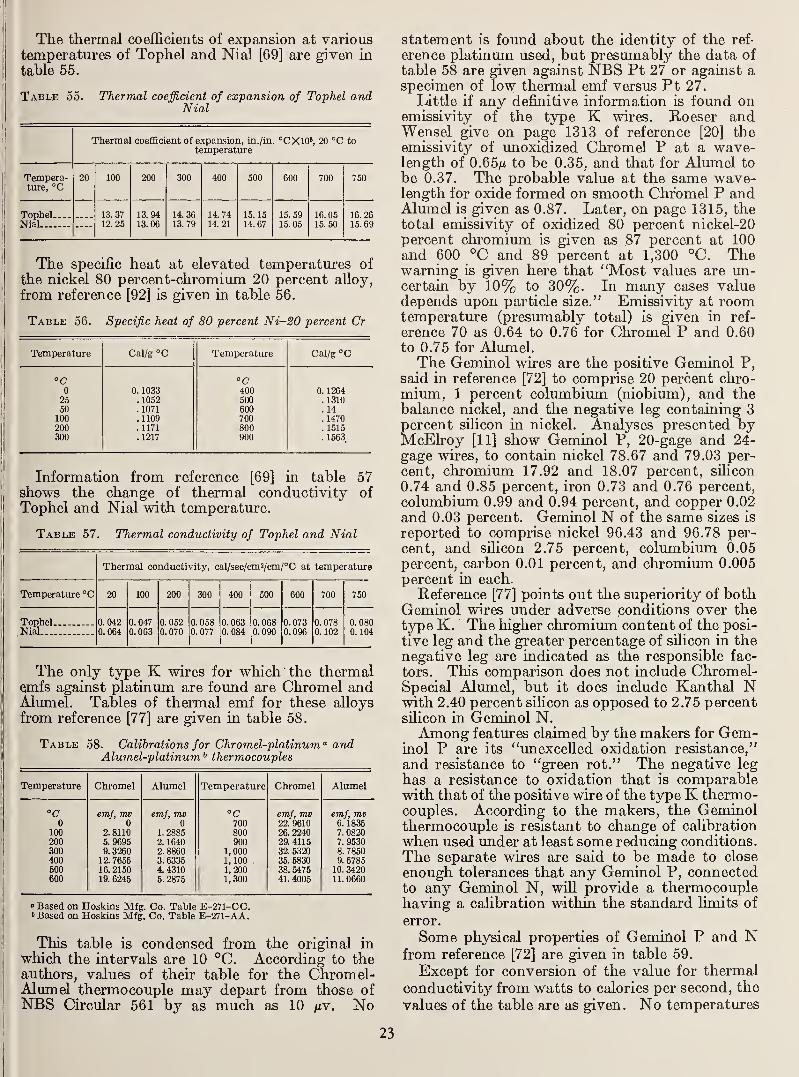
The thermal coefficients of expansion at varioustemperatures of Tophel and Nial [69] are given in
table 55.
Table 55. Thermal coefficient of expansion of Tophel andNial
Thermal coeflBcient of expansion, in./in. °CX10», 20 °C totemperature
Tempera-ture, °C
20 100 200 300 400 500 600 700 750
TophelNial
13. 3712. 25
13.9413.06
14. 3613. 79
14.7414. 21
15, 1514.67
15. 5915. 05
16. 0515.50
16.2615.69
The specific heat at elevated temperatures of
the nickel 80 percent-chromium 20 percent alloy,
from reference [92] is given in table 56.
Table 66. Specific heat of 80 percent Ni-20 percent Cr
Temperature Cal/g °C Temperature Cal/g °C
"C "C0 0. 1033 400 0. 126425 .1052 500 .131050 .1071 600 .14
100 .1109 700 .1470200 . 1171 800 . 1515300 . 1217 900 .1563
Information from reference [69] in table 57shows the change of thermal conductivity ofTophel and Nial with temperature.
Table 57. Thermal conductivity of Tophel and Nial
Thermal conductivity, cal/sec/cmVcm/°C at temperature
Temperature °C 20 100 200 300 400 500 600 700 750
Tophel 0.042 0.047 0. 052 0.058 0. 063 0.068 0.073 0. 078 0. 080Nial 0. 064 0. 003 0.070 0.077 0. 084 0. 090 0. 096 0. 102 0. 104
The only type K wires for which the thermalemfs against platinum are foxmd are Chromel andAlumel. Tables of thermal emf for these alloys
from reference [77] are given in table 58.
Table 58. Calibrations for ChromeUplatinum" andAlumel-platinum^ thermocouples
Temperature Chromel Alumel Temperature Chromel Alumel
°C emf, mv emf, mv °C emf, mv emf, mv0 0 0 700 22. 9610 6. 1835
ICQ 2. 8110 1. 2885 800 26. 2240 7.0820200 5. 9695 2. 1640 900 29. 4115 7. 9530300 9. 3260 2. 8860 1,000 32. 5320 8. 7850400 12. 7655 3. 6335 1,100 35. 5830 9. 5785500 16. 2150 4. 4310 1,200 38. 5475 10. 3420600 19. 6245 5. 2875 1,300 41. 4005 11.0660
» Based on Hoskins Mfg. Co. Table E-271-CC.' Based on Hoskins Mfg. Co. Table E-271-AA.
This table is condensed from the original in
which the intervals are 10 °C. According to theauthors, values of their table for the Chromel-Alumel thermocouple may depart from those ofNBS Circular 561 by as much as 10 /xv. No
statement is found about the identity of the ref-
erence platinmn used, but presmnably the data of
table 58 are given against NBS Pt 27 or against aspecimen of low thermal emf versus Pt 27.
Little if any definitive information is found onemissivity of the type K wires. Koeser andWensel give on page 1313 of reference [20] theemissivity of unoxidized Chromel P at a wave-length of 0.65m to be 0.35, and that for Alumel to
be 0.37. The probable value at the same wave-length for oxide formed on smooth Chromel P andAlumel is given as 0.87. Later, on page 1315, thetotal emissivity of oxidized 80 percent nickel-20percent chromium is given as 87 percent at 100and 600 °C and 89 percent at 1,300 °C. Thewarning is given here that "Most values are un-certain by 10% to 30%. In many cases valuedepends upon particle size." Emissivity at roomtemperature (presumably total) is given in ref-
erence 70 as 0.64 to 0.76 for Chromel P and 0.60
to 0.75 for Alumel.The Geminol wires are the positive Geminol P,
said in reference [72] to comprise 20 percent chro-mium, 1 percent colimabium (niobium), and thebalance nickel, and the negative leg containing 3percent silicon in nickel. Analyses presented byMcElroy [11] show Geminol P, 20-gage and 24-
gage wires, to contain nickel 78.67 and 79.03 per-
cent, chromium 17.92 and 18.07 percent, silicon
0.74 and 0.85 percent, iron 0.73 and 0.76 percent,
columbium 0.99 and 0.94 percent, and copper 0.02
and 0.03 percent. Geminol N of the same sizes is
reported to comprise nickel 96.43 and 96.78 per-
cent, and silicon 2.75 percent, columbivun 0.05
percent, carbon 0.01 percent, and chromium 0.005
percent in each.
Reference [77] points out the superiority of bothGeminol wires imder adverse conditions over thetype K. The higher chromiima content of the posi-
tive leg and the greater percentage of silicon in thenegative leg are indicated as the responsible fac-
tors. This comparison does not include Chromel-Special Alumel, but it does include Kanthal Nwith 2.40 percent silicon as opposed to 2.75 percentsUicon in Geminol N.Among features claimed by the makers for Gem-
inol P are its "unexcelled oxidation resistance,"
and resistance to "green rot." The negative leg
has a resistance to oxidation that is comparablewith that of the positive wire of the typeK thermo-couples. According to the makers, the Geminolthermocouple is resistant to change of calibration
when used under at least some reducing conditions.
The separate wires are said to be made to close
enough tolerances that any Geminol P, connectedto any Geminol N, will provide a thermocouplehaving a calibration within the standard Hmits of
error.
Some physical properties of Gemiflol P and Nfrom reference [72] are given in table 59.
Except for conversion of the value for thermal
conductivity from watts to calories per second, the
values of the table are as given. No temperatures
23
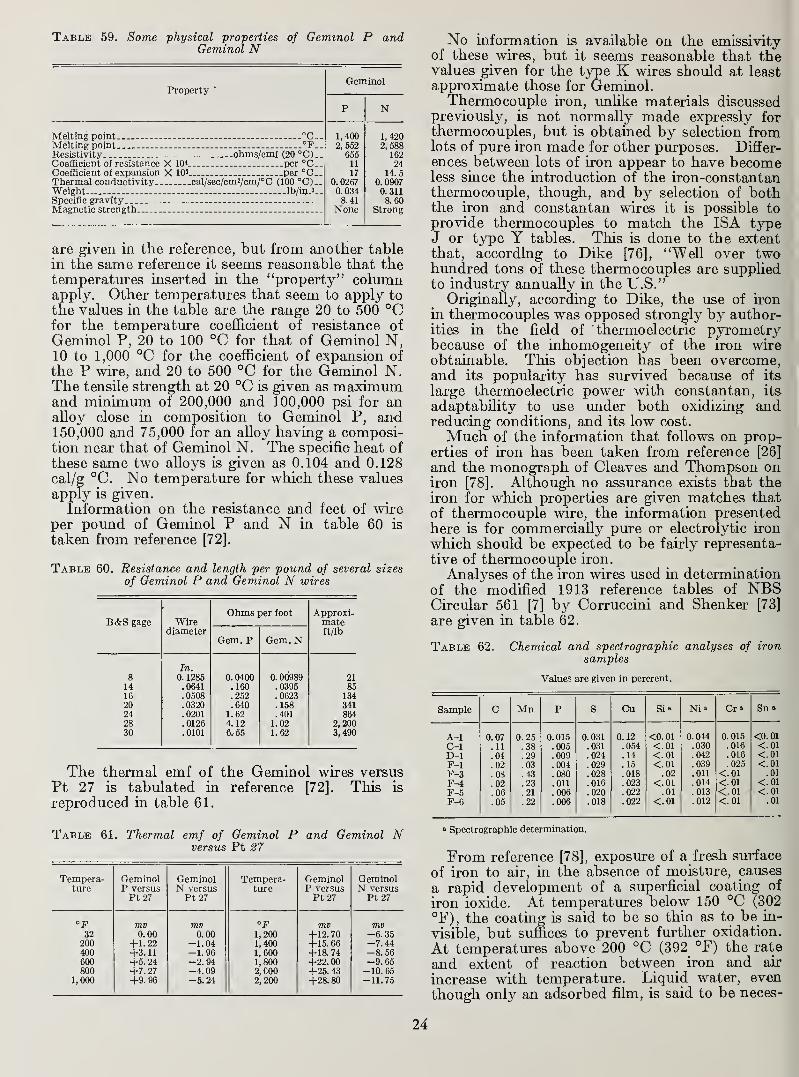
Table 59. Some physical properties of Gemmol P andGeminol N
Property'
Melting point °C__Melting point °F..Resistivity ohms/cmt (20 °C)--Coefflcient of resistance X 10< per °C--Coefflcient of expansion X 10' per °C..Thermal conductivity cal/sec/cm2/cm/°C (100 "C)..Weight lb/in.3—Specific gravity ---
Magnetic strength
Geminol
1,4002,562
65511
170. 02670. 0348. 41
None
N
1,4202,588
16224
14.50. 09070.3118. 60
Strong
are given in the reference, but from another tablein the same reference it seems reasonable that thetemperatures inserted in the "property" columnapply. Other temperatures that seem to apply tothe values in the table are the range 20 to 500 °Cfor the temperature coefl&cient of resistance of
Geminol P, 20 to 100 °C for that of Geminol N,10 to 1,000 °C for the coefficient of expansion of
the P wire, and 20 to 500 °C for the Geminol N.The tensile strength at 20 °C is given as maximumand minimum of 200,000 and 100,000 psi for analloy close in composition to Geminol P, an-d
150,000 and 75,000 for an alloy having a composi-tion near that of Geminol N. The specific heat of
these same two alloys is given as 0.104 and 0.128cal/g °C. No temperature for which these valuesapply is given.
Information on the resistance and feet of wireper pound of Geminol P and N in table 60 is
taken from reference [72].
Table 60. Resistance and length per pound of several sizes
of Geminol P and Geminol N wires
B&S gage Wirediameter
Ohms per foot Approxi-mateftAb
Gem. P Gem. N
In.0. 009898 0. 1285 0. 0400 21
14 .0641 .160 .0395 8516 .0508 .252 .0623 13420 .0320 .e-io .158 34124 .0201 1. 62 .401 86428 .0126 4. 12 1.02 2,20030 .0101 6.55 1.62 3,490
The thermal emf of the Geminol wires versusPt 27 is tabulated in reference [72]. Thisreproduced in table 61.
IS
Table 61. Thermal emf of Geminol P and Geminol Nversus Pt S7
Tempera- Geminol Geminol Tempera- Geminol Geminolture P versus N versus ture P versus N versus
Pt 27 Pt 27 Pt 27 Pt 27
°F mv mv "F mv mv32 0. 00 0. 00 1,200 +12. 70 -6. 35
200 + 1.22 -1.04 1,400 -f15. 66 -7. 44400 +3. 11 -1.96 1,600 4-18. 74 -8. 56600 -f5. 24 -2.94 1,800 +22. 00 -9.65800 -1-7. 27 -4.09 2,000 +25. 43 -10. 65
1,000 +9. 96 -5.24 2,200 +28. 80 -11.75
No information is available on the emissivityof these wires, but it seems reasonable that thevalues given for the type K wires should at leastapproximate those for Geminol.Thermocouple iron, unlike materials discussed
previously, is not normally made expressly forthermocouples, but is obtained by selection fromlots of pure iron made for other purposes. Differ-
ences between lots of iron appear to have becomeless since the introduction of the iron-constantanthermocouple, though, and by selection of boththe iron and constantan wires it is possible toprovide thermocouples to match the ISA typeJ or type Y tables. This is done to the extentthat, according to Dike [76], "Well over twohimdred tons of these thermocouples are suppliedto industry annually in the U.S."
Originally, according to Dike, the use of iron
in thermocouples was opposed strongly by author-ities in the field of thermoelectric pyrometrybecause of the inhomogeneity of the iron wireobtainable. This objection has been overcome,and its popularity has survived because of its
large thermoelectric power with constantan, its
adaptability to use under both oxidizing andreducing conditions, and its low cost.
Much of the information that follows on prop-erties of iron has been taken from reference [26]
and the monograph of Cleaves and Thompson oniron [78]. Although no assurance exists that theiron for which properties are given matches that
of thermocouple wire, the information presentedhere is for commercially pure or electrolytic iron
which should be expected to be fairly representa-
tive of thermocouple iron.
Analyses of the iron wires used in determinationof the modified 1913 reference tables of NBSCircular 561 [7] by Corruccini and Shenker [73]
are given in table 62.
Table 62. Chemical and spectrographic analyses of ironsamples
Values are given in percrent.
Sample C Mn P S Cu Si» Ni» Cr» Sn »
A-1 0. 07 0. 25 0. 015 0. 031 0. 12 <0.01 0.044 0.015 <0. 01
C-1 .11 .38 .005 .031 .054 <.01 .030 .016 <.01D-1 .04 .29 .009 .024 . 14 <.01 .042 .016 <.01F-1 .02 .03 .004 .029 .15 <.01 .039 .025 <.01F-3 .08 .43 .080 .028 .018 .02 .011 <.01 .01
F-4 .02 .23 .011 .016 .023 <.01 .014 <.01 <.01F-5 .06 .21 .006 .020 .022 .01 .013 <.01 <.01F-6 .05 .22 .006 .018 .022 <.01 .012 <.01 .01
» Spectrographic determination.
From reference [78], exposure of a fresh surface
of iron to air, in the absence of moisture, causes
a rapid development of a superficial coating of
iron ioxide. At temperatures below 150 °C (302
°F), the coating is said to be so thin as to be in-
visible, but suffices to prevent further oxidation.
At temperatures above 200 °C (392 °F) the rate
and extent of reaction between iron and air
increase with temperature. Liquid water, even
though only an adsorbed film, is said to be neces-
24
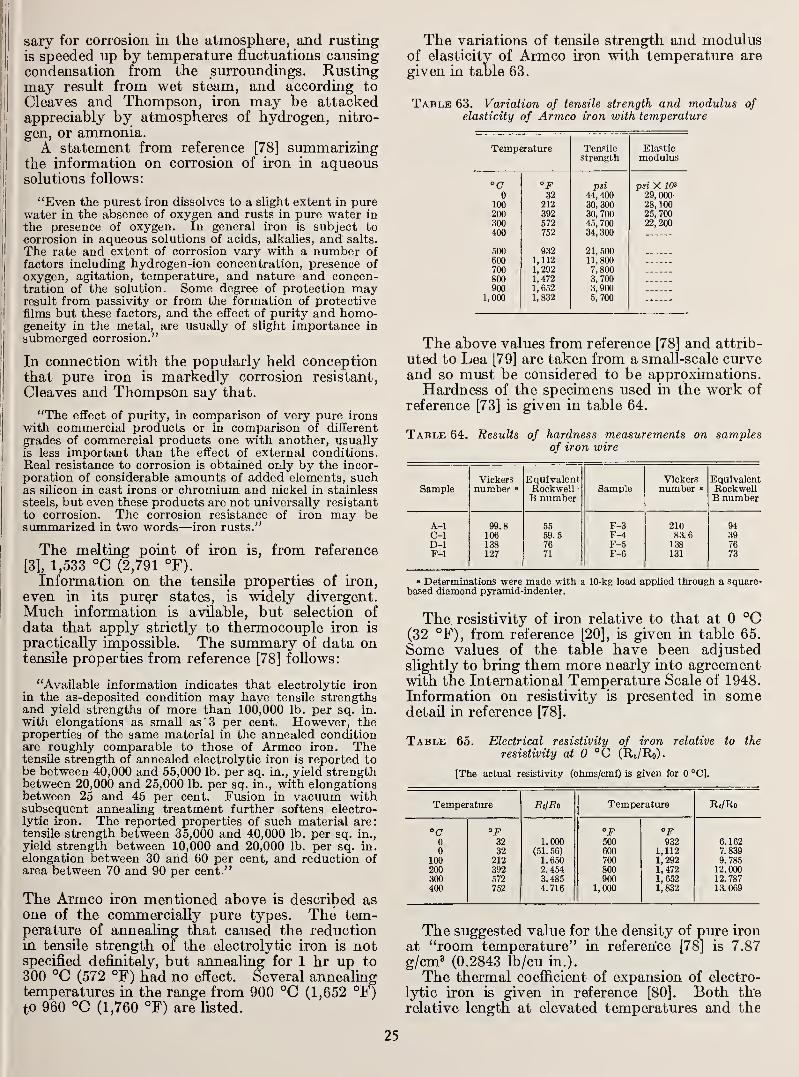
sary for corrosion in the atmosphere, and rusting
is speeded up by temperature fluctuations causingcondensation from the surroimdings. Rustingmay result from wet steam, and according to
Cleaves and Thompson, iron ma}' be attackedappreciably by atmospheres of hydrogen, nitro-
gen, or ammonia.A statement from reference [78] summarizing
the information on corrosion of iron in aqueoussolutions follows:
"Even the purest iron dissolves to a slight extent in purewater in the absence of oxygen and rusts in pure water in
the presence of oxygen. In general iron is subject tocorrosion in aqueous solutions of acids, alkalies, and salts.
The rate and extent of corrosion vary with a number of
factors including hydrogen-ion concentration, presence of
oxygen, agitation, temperature, and nature and concen-tration of the solution. Some degree of protection mayresult from passivity or from the formation of protectivefilms but these factors, and the effect of purity and homo-geneity in the metal, are usually of slight importance in
submerged corrosion."
In connection with the popularly held conceptionthat pure iron is markedly corrosion resistant,
Cleaves and Thompson say that.
"The effect of purity, in comparison of very pure ironswith commercial products or in comparison of different
grades of commercial products one with another, usuallyis less important than the effect of external conditions.Real resistance to corrosion is obtained only by the incor-poration of considerable amounts of added elements, suchas silicon in cast irons or chromium and nickel in stainless
steels, but even these products are not universally resistantto corrosion. The corrosion resistance of iron may besummarized in two words—iron rusts."
The melting point of iron is, from reference
[3], 1,533 °C (2,791 °F).
Information on the tensile properties of iron,
even in its pur^r states, is widely divergent.Much information is avilable, but selection of
data that apply strictly to thermocouple iron is
practically impossible. The summary of data ontensUe properties from reference [78] foUows:
"Available information indicates that electrolytic ironin the as-deposited condition may have tensile strengthsand yield strengths of more than 100,000 lb. per sq. in.
with elongations as small as '3 per cent. However, theproperties of the same material in the annealed conditionare roughly comparable to those of Armco iron. Thetensile strength of annealed electrolytic iron is reported tobe between 40,000 and 55,000 lb. per sq. in., yield strengthbetween 20,000 and 25,000 lb. per sq. in., with elongationsbetween 25 and 45 per cent. Fusion in vacuum withsubsequent annealing treatment further softens electro-lytic iron. The reported properties of such material are:tensile strength between 35,000 and 40,000 lb. per sq. in.,
yield strength between 10,000 and 20,000 lb. per sq. in.
elongation between 30 and 60 per cent, and reduction ofarea between 70 and 90 per cent."
The Armco iron mentioned above is described asone of the commercially pure types. The tem-perature of annealing that caused the reductionin tensile strength of the electrolytic iron is notspecified definitely, but annealing for 1 hr up to
300 °C (572 °F) had no effect. Several annealingtemperatures in the range from 900 °C (1,652 °F)to 960 °C (1,760 °F) are listed.
The variations of tensile strength and modulusof elasticity of Armco iron with temperatiire aregiven in table 63.
Table 63. Variation of tensile strength and modulus ofelasticity of Armco iron with temperature
Temperature JL Cliolie RlastinJ-^ IdrO 1/1^
oti cii^i'ii TTinflnlns
°C "F psi psi X /03
0 32 44, 400 29, 000-
100 212 30, 300 28, 100200 392 30, 700 25,700300 572 45, 700 22, 200400 752 34, 300
500 932 21, 500600 1,112 11,800700 1,292 7,800800 1,472 3, 700900 1,652 3, 900
1,000 1,832 5,700
The above values from reference [78] and attrib-
uted to Lea [79] are taken from a small-scale curveand so must be considered to be approximations.Hardness of the specimens used in the work of
reference [73] is given in table 64.
Table 64> Results of hardness measurements on samplesof iron wire
SatQpleViekersnumber "
EquivalentRockwellB number
SampleViekersnumber »
EquivalentRockwellB number
A-1 99.8 55 F-3 210 94C-1 106 59.5 F-4 83.6 39D-1 138 76 F-5 138 76F-1 127 71 F-6 131 73
a Determinations were made with a 10-kg load applied through a square-based diamond pyramid-indenter.
The resistivity of iron relative to that at 0 °C(32 °F), from reference [20], is given in table 65.
Some values of the table have been adjustedslightly to bring them more nearly into agreementwith the International Temperature Scale of 1948.
Information on resistivity is presented in somedetail in reference [78].
Table 65. Electrical resistivity of iron relative to the
resistivity at 0 °C (Rt/Ro).
[The actual resistivity (ohms/cmf) is given for 0 °C].
Temperature Temperature Ri/Ro
"C op °F "F0 32 1.000 500 932 6.1620 32 (51. 56) 600 1,112 7.839
100 212 1.650 700 1,292 9.785200 392 2. 454 800 1,472 12.000300 572 3. 485 900 1,652 12. 787400 752 4. 716 1,000 1,832 13. 069
The suggested value for the density of pure iron
at "room temperature" in reference [78] is 7.87
g/cm^ (0.2843 Ib/cu in.).
The thermal coefficient of expansion of electro-
lytic iron is given in reference [80]. Both therelative length at elevated temperatures and the
25
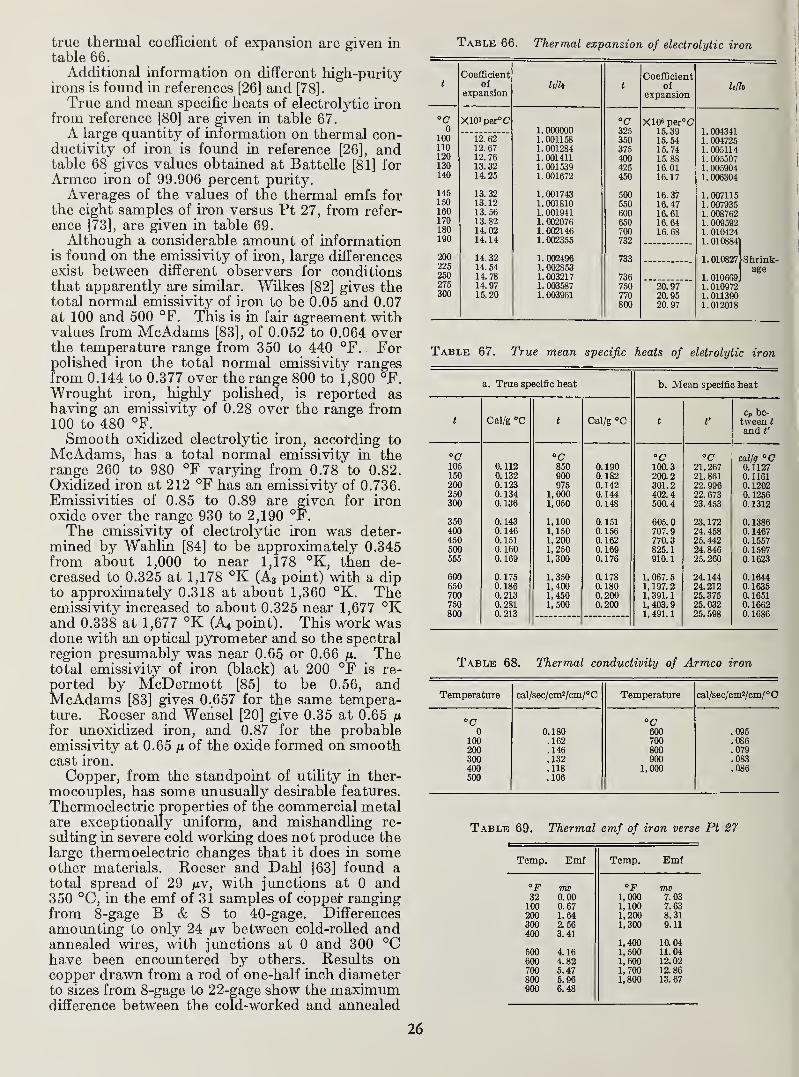
true thermal coefficient of expansion are given intable 66.
Additional information on different high-purityirons is found in references [26] and [78].
True and mean specific beats of electrolytic ironfrom reference [80] are given in table 67.
A large quantity of information on thermal con-ductivity of iron is found in reference [26], andtable 68 gives values obtained at BatteUe [81] forArmco iron of 99.906 percent purity.
Averages of the values of the thermal emfs forthe eight samples of iron versus Pt 27, from refer-
ence [73], are given in table 69.
Although a considerable amount of informationis found on the emissivity of iron, large differences
exist between different observers for conditionsthat apparently are similar. Wilkes [82] gives thetotal normal emissivity of iron to be 0.05 and 0.07at 100 and 500 °F. This is in fair agreement withvalues from McAdams [83], of 0.052 to 0.064 overthe temperature range from 350 to 440 °F. Forpolished iron the total normal emissivity rangesfrom 0.144 to 0.377 over the range 800 to 1,800 °F."Wrought iron, highly polished, is reported ashaving an emissivity of 0.28 over the range from100 to 480 °F.
Smooth oxidized electrolytic iron, according to
McAdams, has a total normal emissivity in therange 260 to 980 °F varying from 0.78 to 0.82.
Oxidized iron at 212 °F has an emissivity of 0.736.
Emissivities of 0.85 to 0.89 are given for ironoxide over the range 930 to 2,190 °F.
The emissivity of electrolytic iron was deter-
mined by Wahlin [84] to be approximately 0.345from about 1,000 to near 1,178 °K, then de-creased to 0.325 at 1,178 °K (A3 point) with a dipto approximately 0.318 at about 1,360 °K. Theemissivity increased to about 0.325 near 1,677 °Kand 0.338 at 1,677 °K (A4 point). This work wasdone with an optical pyrometer and so the spectral
region presumably was near 0.65 or 0.66 fj.. Thetotal emissivity of iron (black) at 200 °F is re-
ported by McDermott [85] to be 0.56, andMcAdams [83] gives 0.657 for the same tempera-ture. Roeser and Wensel [20] give 0.35 at 0.65 nfor imoxidized iron, and 0.87 for the probableemissivity at 0.65 of the oxide formed on smoothcast iron.
Copper, from the standpoint of utility in ther-
mocouples, has some unusually desirable featm-es.
Thermoelectric properties of the commercial metalare exceptionally uniform, and mishandling re-
sulting in severe cold working does not produce thelarge thermoelectric changes that it does in someother materials. Roeser and Dahl [63] found atotal spread of 29 iiv, with junctions at 0 and350 °C, in the emf of 31 samples of copper rangingfrom 8-gage B & S to 40-gage. Differences
amounting to only 24 juv between cold-roUed andannealed wires, with junctions at 0 and 300 °Chave been encountered by others. Results oncopper drawn from a rod of one-half inch diameterto sizes from 8-gage to 22-gage show the maximumdifference between the cold-worked and annealed
Table 66. Thermal expansion of electrolytic iron
t
Coefficient Coefficientof Ulh t of Ulh
expansion expansion
°c X10«per°C "C X10« per°Cnu 1. 000000 325 15.39 1.004341
100 12.62 1.001158 350 15. 54 1. 004725110 12.67 1.001284 375 15.74 1.005114120 12.76 1.001411 400 15.88 1. 005507130 13.32 1. 001539 425 16.01 1.005904140 14. 25 1.001672 450 16.17 1. 006304
13. 32 1. 001743 500 16. 37 1.007115150 13. 12 1.001810 550 16.47 1.007935160 13. 56 1. 001941 600 16. 61 1.008762170 13. 82 1.002076 650 16.64 1.009592180 14.02 1.002146 700 16.68 1.010424190 14.14 1.002355 732 1. 010884
200 14.32 1. 002496 733 1. 010827 •Shrink-225 14. 54 1. 002853 age250 14.78 1. 003217 736 1. 010669275 14. 97 1. 003587 750 20. 97 1. 010972300 15.20 1. 003961 770 20.95 1. 011390
800 20. 97 1. 012018
Table 67. True mean specific heats of eletrolytic iron
a. True specific heat b. Mean specific heat
Cp be-t Cal/g °C t Cal/g "C t t' tween t
and t'
°C °C °C "C cal/g °C105 0. 112 850 0.190 100.3 21. 267 0. 1127150 0. 132 900 0. 182 200.2 21.861 0. 1161200 0.123 975 0. 142 301.2 22. 996 0. 1202250 0. 134 1, 000 0. 144 402.4 22. 673 0. 1266300 0.136 1,050 0.148 500.4 23. 453 0. 1312
350 0.143 1,100 0.151 605.0 23. 172 0. 1386400 0.146 1,150 0.156 707.9 24. 458 0. 1467450 0. 151 1,200 0.162 770.3 25.442 0. 1557500 0.160 1,250 0.169 825.1 24. 846 0. 1597555 0.169 1,300 0.176 910.1 25. 260 0.1623
600 0.175 1, 350 0.178 1, 067.
5
24. 144 0.1644650 0. 186 1,400 0.180 1,197.2 24. 212 0. 1635700 0.213 1,450 0.200 1,391.1 25. 375 0. 1651750 0.281 1,500 0. 200 1, 403.
9
25. 032 0. 1662800 0.213 1,491.1 25. 598 0. 1686
Table 68. Thermal conductivity of Armco iron
Temperature cal/seo/cm2/cm/°C Temperature cal/sec/cmVcm/°0
"C °C0 0.180 600 .095
100 .162 700 .086200 .146 800 .079300 .132 900 .083400 .118 1,000 .086
600 .106
Table 69. Thermal emf of iron verse Pt 27
Temp. Emf Temp. Emf
op mv °F mv32 0.00 1,000 7.03100 0.67 1,100 7.63200 1.64 1,200 8.31300 2. 56 1,300 9. 11
400 3. 411,400 10.04
600 4.16 1,500 11.04600 4.82 1,600 12.02700 6. 47 1,700 12.86800 6. 96 1,800 13. 67
900 6. 48
26

copper, with the junctions at 0 and 350 °C, to be
9 nv. According to Dike [76], copper need notbe specially selected for thermocouple use if it
conforms to ASTM Spec. B3-45 for soft or annealedbare copper wire.
A disadvantage which restricts the use of copperin thermocouples generally to temperatures of
400 °C (752 °F) and below is its oxidation at
relatively low temperatures. Its high thermalconductivity may be advantageous in some in-
stances, but additional care is required when using
copper to insure that both the measuring andreference junctions assmne the desired tempera-tures. Copper wire is available in diameters from0.001 in. up, and because of its higher thermalconductivity (about 20 times that of Chromel P)and electrical conductivity (about 40 times that
of Chromel P) often is used in smaller sizes thanare other wires.
Copper is extremely resistant to corrosion undernormal atmospheric conditions; and according to
Gilbert, page 380 of reference [86], its good be-
havior depends to a considerable extent on the
maintenance of an inhibitive film of oxide or other
insoluble corrosion product. Corrosion resistance
of copper, imlike that of some other metals, is notinfluenced by the grade or impurities present.
Copper is said to be "usually virtually unattackedin most non-oxidizing solutions", and under fairly
mild conditions copper is successfully used for han-dling solutions of hydrofluoric, hydrochloric, sul-
fmic, phosphoric, and acetic and other fatty acids.
Increased concentration, temperature, and flow
rate cause increased corrosion. Copper is said to
be attacked to some extent by aerated alkaline
solutions, and its use should be avoided whereammonia is present. It is unsuitable for use in
hydrogen peroxide' and in molten sulfur, andcorrosion is accelerated by hydrogen sulfide. Sul-
fur dioxide is corrosive at high relative hmnidity(about 65 percent), and becomes more so with anincrease of concentration.
The mechanical properties of copper are affected
by a wide variety of conditions, and so it is notpossible to give a complete picture of them here.
Some of these properties presented by Smart in
reference [86], page 374, are listed in table 70.
Table 70. Some comparative stress-strain relations oftough-pitch and oxygen-free copper
Tough-pitch Cu Oxygen-free CuProperty
Hard Annealed Hard Annealed
Modiilus of elasticity psiXlO-S- 16.95 15. 82 17.54 16.20
Yield strength (0.5 percent strain)psi__ 46, 000 5, 500 47,000 5, 000
Tensile strength psi - 46, 900 31, 500 47, 500 '30, 900
Elongation in 2 in %- 14.8 53.0 20.5 60.0
Reduction of area - -%- 58.5 71.4 86.4 92.1
According to Smart, "High puritj^ copper is so
ductile that it is difficult to determine the existence
of a finite limit beyond which it cannot be cold
worked. No evidence of such a limit has beenobserved in wires drawn 99.4 percent . . .
."
According to Jennison and Smith [87], perfectlypure copper, under extended periods of annealing,will recrystaUize at about 212 °r. Smart, how-ever, gives on page 413 of reference [86] a table ofsoftening temperatures of pure copper with indi-vidual impurity additions. Some of his data arepresented in table 71.
Table 71. Softening temperature (degrees' C) of purecopper containing individual impurity additions
Samples annealed 14 hr at 600 °C (1,110 °F) prior to final cold reduction of75 percent.
Softening temperature of pure copper=140 °C (284 °F).
\\ Quan-\tity
Im-Xpurity \^
0.002 percent 0.005 percent
T.P." Oa-free T.P. Oj-free
O2 140 140 140 140Fe 140 146 140 153Sb^ 180 192 258 282As 168 168 189 189Ni 140 140 140 140
Pb« 146 250 146 270Bi^ 210 260 247 300Ag 148 148 172 172Sn 140 198 140 27/Si> 181 181 183 183Seb 222 222 234 234Teb 212 212 228 228P 140 258 140 284Si 161 181CoCrZnCd>
145152148183
152190151248
» Copper containing oxygen in the tough-pitch range.•> Tough-pitch values reflect partial oxide formation. Values equivalent
to those given for oxygen-free copper can be obtained by heat treatment attemperatures in excess of 700 °C (1,290 °F).
« Much higher values obtainable by heat treatment to increase solid solu-bility.
Some physical properties of copper are sum-marized in table 72, taken from a table by Smart,page 363, reference [86].
Table 72. Some physical properties of copper
Melting point, 1083°±0.1 °C1981.4° ±0.2 °F
CoefBcient of thermal expansion at 20 °C, 0.0000165 per°C; for0to300°C, L,= Lo[l-t-(16.23t+ 0.00483«2j XlO-s]
Specific heat at 20 °C, 0.092 cal/g °CSpecific heat, solid, 0 to t °C, 0.092+ 0.0000250t cal/g °GThermal conductivity at 20 °C, 0.934 cal/sec/cm2/cm/°C
(adjusted to electrical conductivity of 101 percentResistivity at 20 °C,» 1.7241 X10-« ohm cm, 10.371ohms/cmf
Temperature coefficient of electrical resistivity at 20 °C,0.00394 per °C
Emissivity,At wave length fi.. 0.70 0.65 0.60 0.55 0.50Percent e at 1,000 °C (1,932 °F) . . 8. 7 11. 2 18. 5 31. 3 40.
4
Percent < at 1,125 °C (2,057 °F).. 11.8 14.8 20.5 29.3 38.7
• lACS copper, 100 percent, 0.15328 ohm at 20 "C (meter gram).
A table of factors to reduce the resistivity of
96 to 100 percent conductivity and at tempera-tures from 0 to 75 °C is given on page 407 of
reference [3].
27

Table 73. Electrical resistivity of copper relative to the
resistivity at 0 °C (Ri/Ro)The actual resistivity (ohms/cmf) is given for 0 °C.
Temperature RilRn Temperature
°C °F °C "F0 32 1.000 500 932 3. 2100 32 (9. 38^ 600 1, 112 3.695
100 212 1.431 700 1,292 4. 208200 392 1.862 800 1,472 4. 752300 572 2. 299 900 1,652 5. 334400 752 2. 747 1, 000 1,832 5. 960
Table 74. True and mean thermal coefficients of expansionof copper
Temper-ature
Expansion coefficient
X108Temper-ature
Expansion coefficient
X106
Trueat t°
Average,0° to t°
Trueat t"
Average,0° to t°
"C "C0 16. 73 600 20. 63 18.63
100 17.27 17. 00 700 21.46 19. 01200 17.83 17.29 800 22. 33 19. 41300 18. 45 17. 60 900 23. 25 19.83400 19. 13 17.92 1, 000 24. 16 20.26500 19. 85 18. 27
The resistivity of copper relative to that at 0 °C(32 °F) from reference [20] is given in table 73.
A standard density at 20 °C of 8.89 g/cm^(0.321 Ib/cu in.) was adopted for copper of 100percent conductivity. Smith [88], however, ac-
cepts 8.94 g/cm* (0.323 Ib/cu in.) as the densityof annealed pure copper.The true and average thermal expansion of
copper, from reference 23, follow in table 74. Thelength of a heated piece of copper, Z<, is given as:
Z,=Zo(l+ 16,733X10-«i+0.002626X10-¥+ 0.00000091 X10-¥).
True and mean specific heats of electrolytic
copper as given by Jaeger, Rosenbohm, and
Table 75. True and mean specific heats of copper
TemperatureSpecific heat, cal/g °C
True, at t° Mean, 0° to t°
°C300 0. 0988 0. 0957400 .1009 .0968600 .1030 .0978600 .1051 .0988700 .1072 .0999800 .1092 .1009900 .1113 .1020
Bottema are presented in table 75. The equationfor the total heat content Qo at temperature t° Cis
Qo=0.092597i+0.10416X10-*i^
for the true specific heat Cp,
Cp=0.092597+0.20832X10-%
and for the mean specific heat above 0 °C, c'p is
Cp=0.092597+ 0.10416X10-^t
The thermal conductivity of copper, from Smith[88], is given in table 76.
Table 76. Thermal conductivity of copper
Tempera- Thermal con-ture ductivity
"C cal/sec/cm^/cml''C0 0.912
20 .910100 .901200 .890300 .879400 .867500 .856600 .845
The thermal emf of copper relative to platinum,from Roeser and Wensel [20], is given in table 77.
Table 77. Thermal emf of copper relative to platinum
Temperature Emf Temperature Emf
°C op mv °C op ma0 32 0 600 1,112 8. 34
100 212 0.76 700 1,292 10. 49200 392 1.83 800 1,472 12.84300 572 3.15 900 1,652 15. 41400 752 4. 68 1,000 1,832 18. 20500 932 6. 41
Constantan is a name applied to a family ofcopper-nickel alloys most of which were designedoriginally to provide wires having a low tempera-ture coefficient of resistance. According to Dike[76] the composition ranges from copper 50 percent-nickel 50 percent to copper 65 percent-nickel 35percent, with small percentages of manganeseand iron as well as some trace impurities, such as
carbon, magnesium, silicon, cobalt, etc. Theprecise composition is not specified ; but it dependsupon the use to which the &,lloy is to be put, suchas to match thermoelectrically a particular iron
for an iron-constantan thermocouple, or to beused with copper or a positive type K element to
match particular thermocouple tables. Accord-ing to Roeser and Dahl [63] "Constantan . . .
includes the alloys made in this country undersuch trade names as Advance (Ideal), Copel,Copnic, Cupron, etc., most of which containapproximately 55 percent of copper and 45 percentof nickel."
The approximate melting point of constantan,although not a limiting factor in its use in thermo-couples, is given as 1,210 °C for Advance [72], analloy of copper 57 percent-nickel 43 percent.
The stability of constantan was pointed outby Dahl [65]. After 1000 hrs of heating in air at
800 °F (427 °C), which is above the recommendedtemperature for the copper-constantan thermo-couple, the change in 8-gage constantan at
800 °F corresponded to only about 0.5 °F. Thisis well within the tolerances for the copper-constantan thermocouple, and since copper is
highly reproducible, this is the drift that mightbe expected from prolonged use of this thermo-couple in its extreme range.
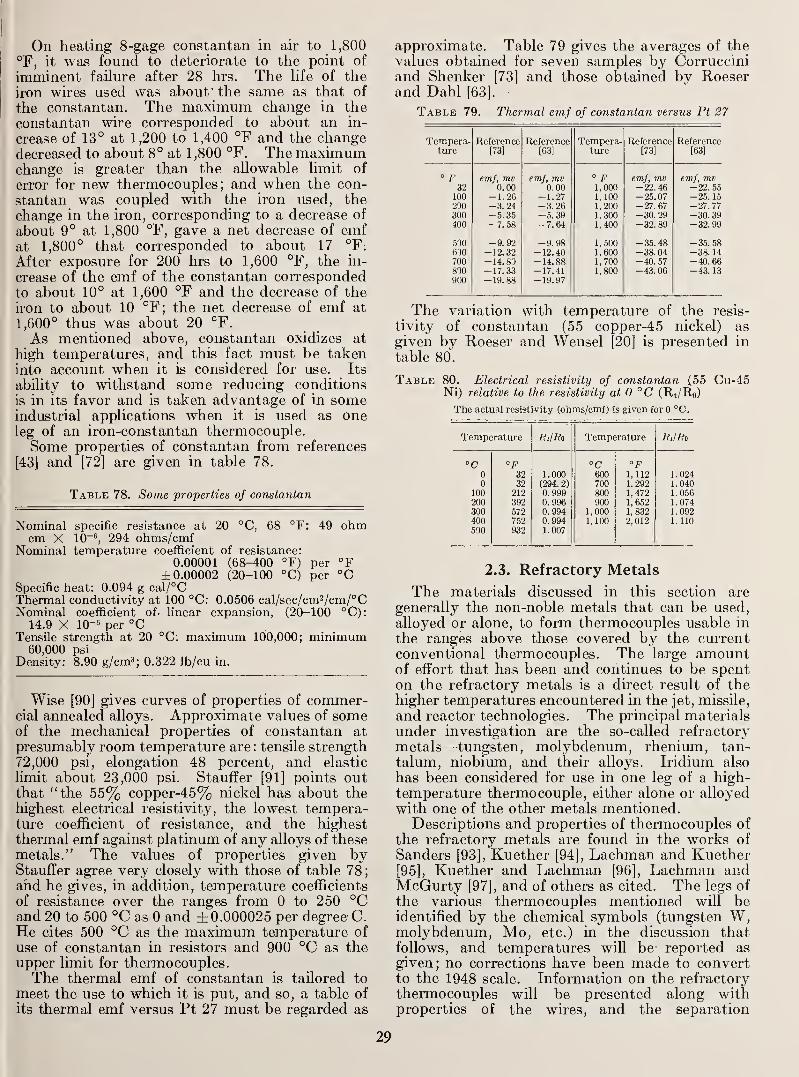
On heating 8-gage constantan in air to 1,800
°F, it was found to deteriorate to the point of
imminent failure after 28 hrs. The Ufe of the
iron wires used was about" the same as that of
the constantan. The maximum change in the
constantan wire corresponded to about an in-
crease of 13° at 1,200 to 1,400 °F and the changedecreased to about 8° at 1,800 °F. The maximumchange is greater than the allowable limit of
error for new thermocouples; and when the con-
stantan was coupled with the iron used, the
change in the iron, corresponding to a decrease of
about 9° at 1,800 °F, gave a net decrease of emfat 1,800° that corresponded to about 17 °F:
After exposure for 200 hrs to 1,600 °F, the in-
crease of the emf of the constantan correspondedto about 10° at 1,600 °F and the decrease of theiron to about 10 "^F; the net decrease of emf at
1,600° thus was about 20 °F.
As mentioned above, constantan oxidizes at
high temperatures, and this fact must be takeninto account when it is considered for use. Its
ability to withstand some reducing conditions
is in its favor and is taken advantage of in someindustrial applications when it is used as oneleg of an iron-constantan thermocouple.Some properties of constantan from references
[43] and [72] are given in table 78.
Table 78. Some properties of constantan
Nominal specific resistance at 20 °C, 68 °F: 49 ohmcm X 10-«, 294 ohms/cmf
Nominal temperature coefficient of resistance:
0.00001 (68-400 °F) per °F±0.00002 (20-100 °C) per °C
Specific heat: 0.094 g cal/°CThermal conductivity at 100 °C: 0.0506 cal/sec/cm2/cm/°CNominal coefficient of. linear expansion, (20-100 °C):
14.9 X 10-e per °CTensile strength at 20 °C: maximum 100,000; minimum
60,000 psi
Density: 8.90 glare?; 0.322 Ib/cu in.
Wise [90] gives curves of properties of commer-cial annealed alloys. Approximate values of someof the mechanical properties of constantan at
presumably room temperature are : tensile strength
72,000 psi, elongation 48 percent, and elastic
limit about 23,000 psi. Stauffer [91] points outthat "the 55% copper-45% nickel has about thehighest electrical resistivity, the lowest tempera-ture coefficient of resistance, and the highestthermal emf against platinum of any alloys of thesemetals." The values of properties given byStauffer agree very closely with those of table 78;and he gives, in addition, temperature coefficients
of resistance over the ranges from 0 to 250 °Cand 20 to 500 °C as 0 and ±0.000025 per degree- C.He cites 500 °C as the maximum temperature of
use of constantan in resistors and 900 °C as the
upper limit for thermocouples.The thermal emf of constantan is tailored to
meet the use to which it is put, and so, a table of
its thermal emf versus Ft 27 must be regarded as
approximate. Table 79 gives the averages of thevalues obtained for seven samples by Corrucciniand Shenker [73] and those obtained by Roeserand Dahl [63].
Table 79. Thermal emf of constantan versus Pt 27
JL U 'li ptrl a,- T? ofd"i3n OilXvclcl cllLc xVclcI cULc R o Tdro Ti Oct
I' IDOJ ture f7^1 LDoJ
° F emf, mv emf, mv o p emf, mv emf, mv32 0. 00 n. 00 1,000 -22. 46 -22. 55
100 -1.26 -1.27 1,100 -25.07 -25. 15200 -3. 24 -3.26 1,200 -27. 67 -27. 77300 -5. 35 -5.39 1,300 -30. 29 -30. 39400 -7.58 -7. 64 1,400 -32. 89 -32. 99
500 -9.92 -9.98 1,500 -35. 48 -35. 58-12. 32 -12. 40 1,600 -38. 04 -38. 14
700 -14. 80 -14. 88 1,700 -40. 57 -40. 66800 -17. 33 -17. 41 1,800 -43. 06 -43. 13
900 -19.88 -19.97
The variation with temperature of the resis-
tivity of constantan (55 copper-45 nickel) as
given by Roeser and Wensel [20] is presented in
table 80.
Table 80. Electrical resistivity of constantan (55 Cu-45Ni) relative to the resistivity at 0 °C (Rt/Ro)
The actual resistivity (ohms/cmf) is given for 0 °C.
Temperature Rt/Ro Temperature
°C °F "C "F0 32 1.000 600 1, 112 1.0240 32 (294. 2) 700 1.292 1.040
100 212 0. 999 800 1,472 1.056200 392 0. 996 900 1,652 1.074300 572 0.994 1,000 1, 832 1.092400 752 0.994 1,100 2,012 1.110500 932 1.007
2.3. Refractory Metals
The materials discussed in this section are
generally the non-noble metals that can be used,
alloyed or alone, to form thermocouples usable in
the ranges above those covered by the currentconventional thermocouples. The large amountof effort that has been and continues to be spenton the refractory metals is a direct result of the
higher temperatures encountered in the jet, missile,
and reactor technologies. The principal materialsunder investigation are the so-called refractory
metals—^tungsten, molybdenum, rhenium, tan-
talum, niobium, and their alloys. Iridium also
has been considered for use in one leg of a high-temperature thermocouple, either alone or alloyed
with one of the other metals mentioned.Descriptions and properties of thermocouples of
the refractory metals are found in the works of
Sanders [93], Kuether [94], Lachman and Kuether[95], Kuether and Lachman [96], Lachman andMcGurty [97], and of others as cited. The legs of
the various thermocouples mentioned will beidentified by the chemical symbols (tungsten W,molybdenum, Mo, etc.) in the discussion thatfollows, and temperatures will be reported as
given; no corrections have been made to convertto the 1948 scale. Information on the refractorythermocouples will be presented along withproperties of the wires, and the separation
29
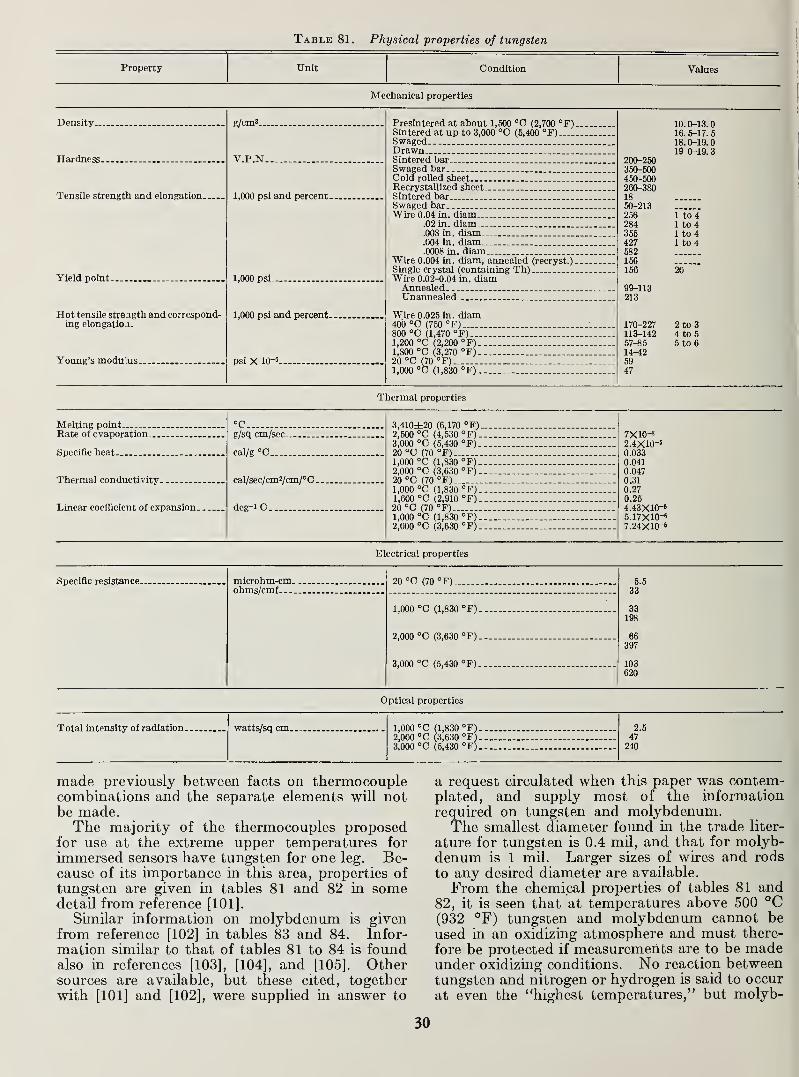
Table 81. Physical properties of tungsten
Property Unit Condition Values
Mechanical properties
Density-
Hardness.
Tensile strength and elongation.
Yield point
-
Hot tensUe strength and correspond-ing elongatlo J.
Young's modu'us-
g/cm'..
V.P.N.
1,000 psl and percent.
1,000 psi.
1,000 psi and percent-
psi X 10-5.
Presintered at about 1,500 °C (2,700 °F)_Sintered at up to 3,000 °C (5,400 °F)SwagedDrawnSintered bar _-_Swaged barCold rolled sheet.Recrystallized sheetSintered barSwaged barWire 0.04 in. diam
.02 in. diam__
.008 in. diam
.004 in. diam.._-
.0008 in. diamWire 0.004 in. diam, annealed (recryst.).Single crystal (containing Th)Wire 0.02-0.04 in. diamAnnealedUnannealed
Wire 0.025 in. diam400 °C (750 °F)800 "C (1,470 °F)_...1,200 °C (2,200 °F)..1,800 °C (3,270 °F)..20 °C (70 °F)1,000 °C (1,830 °F)..
10. 0-13.
0
16. 5-17. 518. 0-19.
0
19 0-19.
3
200-25035(1-500
450-500260-3801850-213256 1 to 4284 1 to 4355 1 to 4427 1 to 4582156166 20
99-113213
170-227 2 to 3113-142 4 to 557-85 5 to 614-425947
Thermal properties
Melting pointRate of evaporation.
Specific heat
Thermal conductivity
Linear coefficient of expansion .
°C... .,
g/sq cm/sec-
cal/g °C
cal/sec/cm2/cm/°C .
deg-i C
3,410±20 (6,170 °F3 _
2,500 °C (4,530 "F).3,000 °C (5,430 °F)
.
20 °C (70 °F)1,000 °C (1,830 °F)_2,000 °C (3,630 °F)
.
20 °C (70 °F)1,000 °C (1,830 °F).1,600 °C (2,910 °F)_20 "O (70 °F)1,000 °C (1,830 °F).2,000 °C (3,630 °F).
7X10-S2.4X10-50.0330.0410.0470.31
0.270.25
4.43X10-'5.17X10-87.24X10-6
Electrical properties
Specific resistance microhm-cm.,ohms/cmf
20 °C (70 °F)
1,000 °C (1,830 °F).
2,000 °C (3,630 °F).
3,000 °C (5,430 °F).
5.5
33
33198
66397
103620
Optical properties
Total intensity of radiation watts/sq cm 1,000 °C (1,830 °F). 2.5
2,000 °C (3,630 °F) 473,000 °C (5,430 °F).. 240
made previously between facts on thermocouplecombinations and the separate elements will notbe made.The majority of the thermocouples proposed
for use at the extreme upper temperatures for
immersed sensors have tungsten for one leg. Be-cause of its importance in this area, properties of
tungsten are given in tables 81 and 82 in somedetail from reference [101].
Similar information on molybdenum is givenfrom reference [102] in tables 83 and 84. Infor-
mation similar to that of tables 81 to 84 is foundalso in references [103], [104], and [105]. Othersources are available, but these cited, togetherwith [101] and [102], were supplied in answer to
a request circulated when this paper was contem-plated, and supply most of the information
required on tungsten and molybdenum.The smallest diameter found in the trade liter-
ature for tungsten is 0.4 mil, and that for molyb-denum is 1 mil. Larger sizes of wires and rods
to any desired diameter are available.
From the chemical properties of tables 81 and82, it is seen that at temperatures above 500 °C(932 °F) tungsten and molybdenum cannot beused in an oxidizing atmosphere and must there-
fore be protected if measurements are to be madeunder oxidizing conditions. No reaction betweentungsten and nitrogen or hydrogen is said to occur
at even the "highest temperatures," but molyb-
30
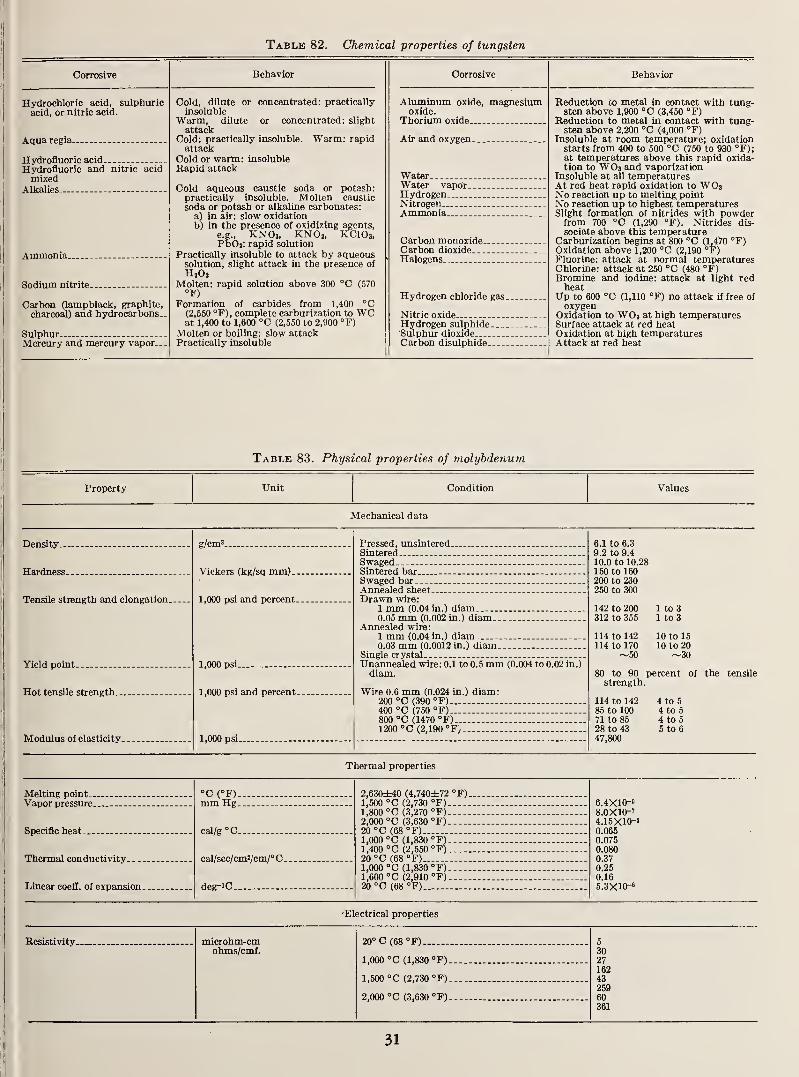
Table 82. Chemical properties of tungsten
Corrosive
Hydrochloric acid, sulphuricacid, or nitric acid.
Aquaregia
Hydrofluoric acid... _--
Hydrofluoric and nitric acid
mixedAlkalies—
Ammonia..
Sodium nitrite-
Carbon Oampblack, graphite,
charcoal) and hydrocarbons-
SulphurMercury and mercury vapor-
Behavior
or
Cold, diluteinsoluble
Warm, diluteattack
Cold: practically insoluble.attack
Cold or warm: insolubleRapid attack
or concentrated: practically
concentrated: slight
Warm: rapid
Cold aqueous caustic soda or potash:practically insoluble. Molten causticsoda or potash or alkaline carbonates:
a) in air: slow oxidationb) in the presence of oxidizing agents,
e.g., KNO3, KNO2, KCIO3,PbOj; rapid solution
Practically insoluble to attack by aqueoussolution, slight attack in the presence of
Molten: rapid solution above 300 °C (570
Formation of carbides from 1,400 °C(2,550 °F), complete carburization to WCat 1,400 to 1,600 "C (2,550 to 2,900 °F)
Molten or boiling: slow attackPractically insoluble
Corrosive
Aluminum oxide, magnesiumoxide.
Thorium oxide
Air and oxygen
WaterWater vaporHydrogen -
NitrogenAmmonia
Carbon monoxide --
Carbon dioxideHalogens
Hydrogen chloride gas
Nitric oxide ---
Hydrogen sulphideSulphur dioxideCarbon disulphide
Behavior
Reduction to metal in contact with tung-sten above 1,900 °C (3,450 °F)
Reduction to metal in contact with tung-sten above 2,200 °C (4,000 °F)
Insoluble at room temperature; oxidationstarts from 400 to 500 °C (750 to 930 °F);at temperatures above this rapid oxida-tion to WO3 and vaporization
Insoluble at all temperaturesAt red heat rapid oxidation to WO3No reaction up to melting pointNo reaction up to highest temperaturesSlight formation of nitrides with powderfrom 700 °C (1,290 °F). Nitrides dis-sociate above this temperattu'e
Carburization begins at 800 °C (1,470 °F)Oxidation above 1,200 °C (2,190 °F)Fluorine: attack at normal temperaturesChlorine: attack at 250 °C (480 °F)Bromine and iodine: attack at light redheat
Up to 600 °C (1,110 °F) no attack if free ofoxygen
Oxidation to WO3 at high temperaturesSurface attack at red heatOxidation at high temperaturesAttack at red heat
Table 83. Physical properties of molybdenum
Property Unit Condition Values
]Mechanical data
Density
Hardness - ---
Tensile strength and elongation
Yield point--.
Hot tensile strength
Modulus of elasticity
g/cm^
Vickers (kg/sq mm).-
1,000 psi and percent .
1,000 psi
1,000 psi and percent-
1,000 psi.
Pressed, unsinteredSinteredSwaged .
Sintered barSwaged barAnnealed sheetDrawn wire:
1 mm (0.04 in.) diam0.05 mm (0.002 in.) diam
Annealed wire:1 mm (0.04 in.) diam0.03 mm (0.0012 in.) diam..- - --.
Single crystalUnannealed wire: 0.1 to 0.5 mm (0.004 to 0.02 in.)
diam.
Wire 0.6 mm (0.024 in.) diam:200 °C (390 °F)400 °G (750 °F)800 °C (1470 °F)1200 °C (2,190 °F/
6.1 to 6.3
9.2 to 9.4
10.0 to 10.28150 to 160200 to 230250 to 300
142 to 200 1 to 3312 to 355 1 to 3
114 to 142 10 to 15114 to 170 10 to 20
~50 ~30
80 to 90 percent of the tensilestrength.
114 to 14285 to 10071 to 8528 to 43
47,800
4 to 5
4 to 5
4 to 55 to 6
Thermal properties
Melting pointVapor pressure
Specific heat
Thermal conductivity
Linear coefl. of expansion
°C (°F)mm Hg
cal/g "C
cal/sec/cmVcm/°C
deg-'C -
2,630±40 (4,740±72 °F)1,500 °C (2,730 °F)1,800 °C (3,270 °F)2,000 °C (3,630 °F)20 °C (68 °F)1,000 °C (1,830 °F)1,400 °C (2,550 °F)20 °C (68 °F)1,000 °C (1,830 °F)1,600 °C (2,910 °F)20 °C (68 °F)
6.4X10-«8.0X10-'4.15X10-50.0650.075
0.0800.370.250.16
5.3X10-'
Electrical properties
Resistivity microhm-cm 20°C(68°F) 5
ohms/cmf. 301,000 °C (1,830 °F) 27
1621,500 °C (2,730 °F) 43
2592,000 °C (3,630 °F) 60
361
31
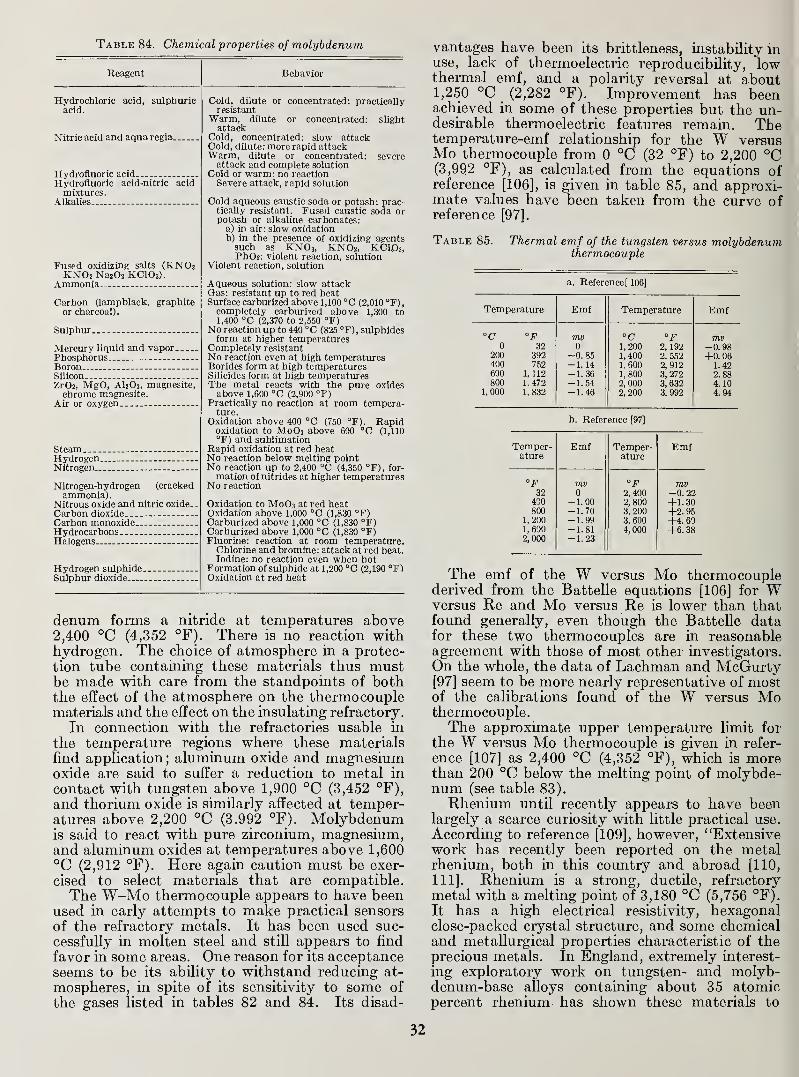
Table 84. Chemical properties of molybdenur
Reagent
Hydrochloric acid, sulphuricacid.
Nitric acid and aqua regia
Hydrofluoric acidHydrofluoric acid-nitric acidmixtures.
Alkalies
Fused oxidizing salts (KNO3KNO2 NajOa KCIO3).
Ammonia__
Carbon (lampblack, graphiteor charcoal).
Sulphur. - ,
Mercury liquid and vaporPhosphorusBoronSilicon
ZrOz, MgO, AI2O3, magnesite,chrome magnesite.
Air or oxygen
SteamHydrogenNitrogen
Nitrogen-hydrogen (crackedammonia).
Nitrous oxide and nitric oxide..Carbon dioxideCarbon monoxideHydrocarbonsHalogens
Hydrogen sulphide ..-Sulphur dioxide- --.
Behavior
Cold, dilute or concentrated: practicallyresistant
Warm, dilute or concentrated: slightattack
Cold, concentrated: slow attackCold, dilute: more rapid attackWarm, dilute or concentrated: severeattack and complete solution
Cold or warm: no reactionSevere attack, rapid solution
Cold aqueous caustic soda or potash: prac-tically resistant. Fused caustic soda orpotash or alkaline carbonates:
a) in air: slow oxidationb) in the presence of oxidizing agentssuch as KNO3, KNO2, KCIO3,Pb02: violent reaction, solution
Violent reaction, solution
Aqueous solution: slow attackGas: resistant up to red heatSurface carburized above 1,100 °C (2,010 °F),completely carburi7ed above 1,300 to1,400 °C (2,370 to 2,550 °F)
No reaction up to 440 °C (825 °F), sulphidesform at higher temperatures
Completely resistantNo reaction even at high temperaturesBorides form at high temperaturesSilicides form at high temperaturesThe metal reacts with the pure oxidesabove 1,600 °C (2,900 °P)
Practically no reaction at room tempera-ture.
Oxidation above 400 °C (750 °F). Rapidoxidation to M0O3 above 600 °C (1,110°F) and sublimation
Rapid oxidation at red heatNo reaction below melting pointNo reaction up to 2,400 °C (4,350 °F), for-
mation of nitrides at higher temperaturesNo reaction
Oxidation to M0O3 at red heatOxidation above 1,000 °C (1,830 °F)Carburized above 1,000 °C (1,830 °F)Carburized above 1,000 °C (1,830 °F)Fluorine: reaction at room temperature.Chlorine and bromine: attack at red heat.Iodine: no reaction even when hot
Formation of sulphide at 1,200 °C (2,190 "FlOxidation at red heat
denum forms a nitride at temperatures above2,400 °C (4,352 °F). There is no reaction withhydrogen. The choice of atmosphere in a protec-
tion tube containing these materials thus mustbe made with care from the standpoints of boththe effect of the atmosphere on the thermocouplematerials and the effect on the insulating refractory.
In connection with the refractories usable in
the temperature regions where these materialsfind application; aluminum oxide and magnesiumoxide are said to suffer a reduction to metal in
contact with tungsten above 1,900 °C (3,452 °F),
and thorium oxide is similarly affected at temper-atures above 2,200 °C (3.992 °F). Molybdenumis said to react with pure zirconium, magnesium,and aluminum oxides at temperatures above 1,600
°C (2,912 °F). Here again caution must be exer-
cised to select materials that are compatible.The W-Mo thermocouple appears to have been
used in early attempts to make practical sensors
of the refractory metals. It has been used suc-
cessfully in molten steel and still appears to find
favor in some areas. One reason for its acceptanceseems to be its ability to withstand reducing at-
mospheres, in spite of its sensitivity to some of
the gases listed in tables 82 and 84. Its disad-
vantages have been its brittleness, instability inuse, lack of thermoelectric reproducibility, lowthermal emf, and a polarity reversal at about1,250 °C
_(2,282 °F). Improvement has been
achieved in some of these properties but the un-desirable thermoelectric features remain. Thetemperature-emf relationship for the W versusMo thermocouple from 0 °C (32 °F) to 2,200 °C(3,992 °F), as calculated from the equations ofreference [106], is given in table 85, and approxi-mate values have been taken from the curve ofreference [97].
Table 85. Thermal emf of the tungsten versus molybdenumthermocouple
a. Reference! 106]
Temperature Emf Temperature Emf
OQ op mv "C °F mv0 32 0 1, 200 2, 192 -0.98
200 392 -0. 85 1, 400 2, 552 +0.06400 752 -1. 14 1, 600 2, 912 1.42600 1,112 -1.36 1,800 3,272 2.88800 1.472 -1.54 2, 000 3,632 4. 10
1, 000 1, 832 -1.46 2,200 3,992 4.94
b. Reference [97]
Temper- Emf Temper- Emfature ature
"F mv °F mv32 0 2,400 -0. 22
400 -1.00 2,800 +1.30800 -1.70 3, 200 +2.95
1,200 -1.99 3, 600 +4. 601,600 -1.81 4, 000 +6.382, 000 -1.23
The emf of the W versus Mo thermocouplederived from the Battelle equations [106] for Wversus Re and Mo versus Re is lower than thatfound generally, even though the Battelle datafor these two thermocouples are in reasonableagreement with those of most other investigators.
On the whole, the data of Lachman and McGurty[97] seem to be more nearly representative of mostof the calibrations found of the W versus Mothermocouple.The approximate upper temperature limit for
the W versus Mo thermocouple is given in refer-
ence [107] as 2,400 °C (4,352 °F), which is morethan 200 °C below the melting point of molybde-num (see table 83).
Rhenium until recently appears to have beenlargely a scarce curiosity with little practical use.
According to reference [109], however, "Extensivework has recently been reported on the metalrhenium, both in this country and abroad [110,
111]. Rhenium is a strong, ductile, refractorymetal with a melting point of 3,180 °C (5,756 °F).
It has a high electrical resistivity, hexagonalclose-packed crystal structure, and some chemicaland metallurgical properties characteristic of theprecious metals. In England, extremely interest-
ing exploratory work on tungsten- and molyb-denum-base alloys containing about 35 atomicpercent rhenium has shown these materials to
32
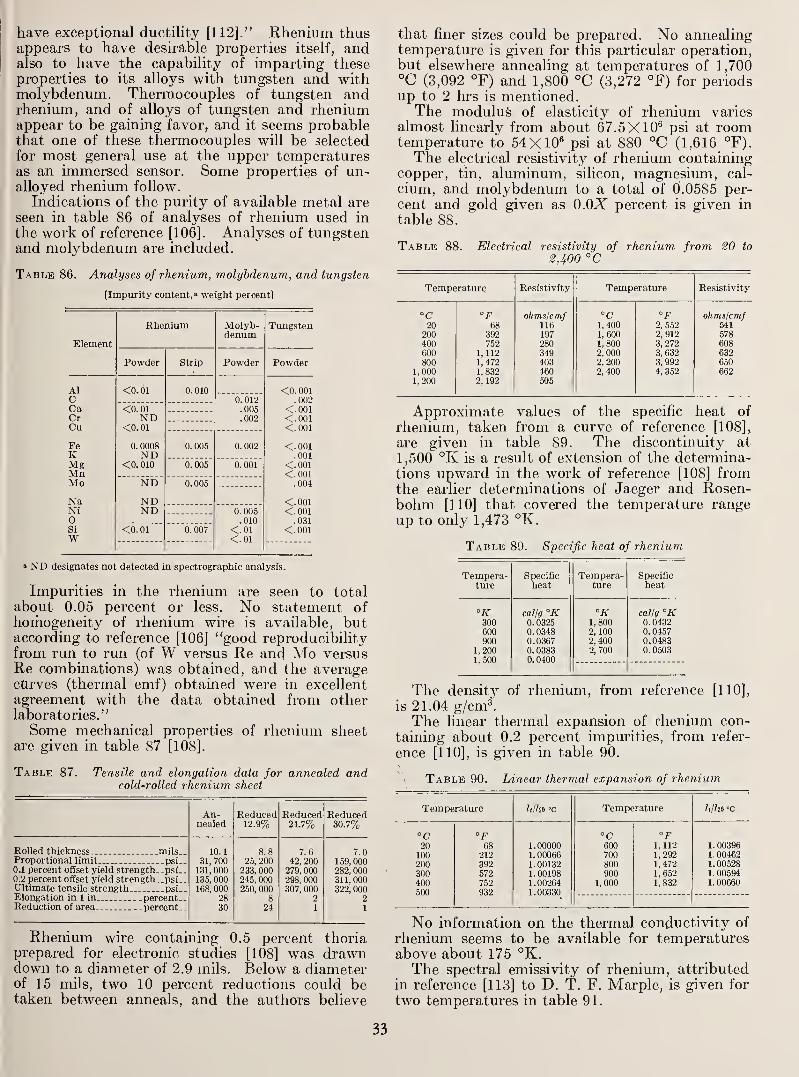
have exceptional ductility [112]." Rhenium thusappears to have desirable properties itself, andalso to have the capability of imparting theseproperties to its alloys with tungsten and withmolybdenum. Thermocouples of tungsten andrhenium, and of alloys of tungsten and rheniumappear to be gaining favor, and it seems probablethat one of these thermocouples will be selected
for most general use at the upper temperaturesas an immersed sensor. Some properties of un-alloyed rhenium follow.
Indications of the purity of available metal areseen in table 86 of analyses of rhenium used in
the work of reference [106]. Analyses of tungstenand molybdenum are included.
Table 86. Analyses of rhenium, molybdenum, and tungsten
[Impurity content,' weight percent]
Element
AlCCaCrCu
FeKMgMnMo
NaNiOSiW
Rhenium
Powder Strip
<0.01
<0. 01ND
<0.01
0. 0008ND
<0. 010
NDNDND
<0.01
0. 010
0. 005
"o.'ooB"
0.005
0. 007
Molyb-denum
Powder
0. 012.005.002
0. 002
'o.'ooi"
0. 005.010
<.01<.01
Tungsten
Powder
<0. 001.002
<.001<.001<.001
<.001.001
<.001<.001.004
<.001<.001
.031
<.001
» ND designates not detected in spectrographio analysis.
Impurities in the rhenium are seen to total
about 0.05 percent or less. No statement ofhomogeneity of rhenium wire is available, butaccording to reference [106] "good reproducibilityfrom run to run (of W versus Re and Mo versusRe combinations) was obtained, and the averagecurves (thermal emf) obtained were in excellentagreement with the data obtained from otherlaboratories."
Some mechanical properties of rhenium sheetare given in table 87 [108].
Table 87. Tensile and elongation data for annealed andcold-rolled rhenium sheet
An-nealed
Reduced12.9%
Reduced24.7%
Reduced30.7%
Rolled thickness _--mils-_Proportional limit psi-.0.1 percent offset yield strength__psi..0.2 percent oflset yield strength- .psi,
.
Ultimate tensile strength psi..Elongation in 1 in percentReduction of area ... percent
10.1
31, 700131,000135,000168, 000
2830
8.825, 200
233, 000245, 0002.50, 000
824
7.642, 200
279, 000298. 000307, 000
2
1
7.0159, 000282, 000311,000322, 000
2
1
Rhenium wire containing 0.5 percent thoriaprepared for electronic studies [108] was drawndown to a diameter of 2.9 mils. Below a diameterof 15 mils, two 10 percent reductions could betaken between anneals, and the authors believe
that finer sizes could be prepared. No annealingtemperature is given for this particular operation,but elsewhere annealing at temperatures of 1,700°C (3,092 °F) and 1,800 °C (3,272 °F) for periodsup to 2 hrs is mentioned.The modulus of elasticity of rhenium varies
almost linearly from about 67.5X10^ psi at roomtemperature to 54X10« psi at 880 °C (1,616 °F).
The electrical resistivitj^ of rhenium containingcopper, tin, aluminum, silicon, magnesium, cal-
cium, and molybdenum to a total of 0.0585 per-
cent and gold given as O.OX percent is given in
table 88.
Table 88. Electrical resistivity of rhenium from 20 to
2,400 °C
Temperature Resistivity Temperature Resistivity
°C "F ohmslcmf °C °F ohmslcmf20 68 116 1,400 2, 552 541
200 392 197 1,600 2, 912 578400 752 280 1,800 3, 272 608600 1, 112 349 2, 000 3,632 632800 1, 472 403 2, 200 3, 992 650
1.000 1,832 460 2,400 4, 352 6621,200 2, 192 505
Approximate values of the specific heat of
rhenium, taken from a curve of reference [108]>
are given in table 89. The discontinuity at
1,500 °K is a result of extension of the determina-tions upward in the work of reference [108] fromthe earlier determinations of Jaeger and Rosen-bohm [110] that covered the temperature rangeup to only 1,473 °K.
Table 89. Specific heat of rhenium
Tempera-ture
Specificheat
Tempera-ture
Specific
heat
°K300600900
1, 2001, 500
callg "K0. 03250. 03480. 03670. 03830. 0400
°K1, 8002, 1002,4002,700
callg °K0. 04320. 04570. 04830. 0503
The density of rhenium, from reference [110],
is 21.04 g/cm^The linear thermal expansion of rhenium con-
taining about 0.2 percent impurities, from refer-
ence [110], is given in table 90.
Table 90. Linear thermal expansion of rhenium
Temperature liiha 'c Temperature Itllm °c
°C "F °C °F20 68 1. 00000 600 1, 112 1.00396
100 212 1. 00066 700 1,292 1.00462200 392 1. 00132 800 1,472 1.00528300 572 1. 00198 900 1,652 1. 00594'
400 752 1. 00264 1,000 1,832 1. 00660500 932 1. 00330
No information on the thermal conductivity of
rhenium seems to be available for temperatiu-es
above about 175 °K.The spectral emissivity of rhenium, attributed
in reference [113] to D. T. F. Marple, is given for
two temperatures in table 91.
33

Table 91. Spectral emissivity of rhenium
Tem-pera-ture
Emissivity, percent at wavelength (microns) of
0.3 0.4 0.6 0.8 1.2 1.6 2.0 2.4 2.8
"R3,560.__
5,480.._
42.542.5
42.542.5
41.041.0
39.039.0
32.534.0
27.530.5
25.028.5
22.527.0
22.025.5
Table 93. Thermal emfs of W versus Re and Mo versusRe thermocouples [122]
Table 92. Thermal emfs of W versus Tie. and Mo versusRe thermocouples [106]
TemperatureEmf
TemperatureEmf
W-Re Mo-Re W-Re Mo-Re
"C °F mv mv "C opmi) mv
0 32 0 0 1, 200 2, 192 18. 94 19. 92100 212 0. 55 1. 10 1,300 2, 372 20. 65 21.15200 392 1.59 2. 44 1,400 2, 552 22.22 22. 16300 572 2. 96 3. 98 1,500 2,732 23. 66 22. 95400 752 4. 55 5. 69 1,600 2, 912 24. 96 23. 54
500 932 6. 27 7. 52 1,700 3,092 26. 09 23.93600 1, 112 8. 06 9. 43 1,800 3, 272 27. 05 24.18700 1,292 9.90 11.37 1,900 3, 452 27.86 24. 33800 1,472 11.75 13. 29 2, 000 3, 632 28.56 24. 46900 1,652 13. 60 15. 14 2, 100 3, 812 29. 15 24. 66
1,000 1,832 15. 43 16. 89 2,200 3,992 30. 00 25. 051, 100 2,012 17.23 18.49
Ttie variation of emissivity at 0.665/n withtemperature, credited in reference [113] to Sims,Craighead, Jaffe, et al., shows in one case that theemissivity is constant at 40 percent over the rangefrom 500 to 5,500 °K,. In another set of deter-minations the emissivity is about 43.5 percent at500 °R, remains practically constant up to about1,700°, and drops off to about 42 percent at 3,000°R. From here it decreases almost linearly toabout 37 percent at 5,000 °R and somewhat moreslowly to a little' over 36 percent at 5,500 °R.The temperature-emf relationships for the W
versus Re and Mo versus Re thermocouples, as
calculated from the equations of reference [106],
are given in table 92. Data for the same thermo-couples, from reference [122], are given in table 93.
The thermoelectric powers of both thermo-couples are seen to decrease in the upper part of
the range. (The apparent increase between 2,100and 2,200 °C in the table is as calculated, but is
not confirmed experimentally.) Various combi-nations of timgsten and tungsten-rhenium alloys
have been investigated in attempts to find sensorsthat do not exhibit the flattening of the thermal
Tem-perature
EmfTem-
perature
Emf
W-Re Mo-Re W-Re
"if" mv mv "F mv mv32 0 0 2,200 18. 99 18. 59
200 0.70 1. 00 2, 400 20. 72 19! 70400 1. 91 2.60 2,600 22.38 20.67600 3. 47 4. 45 2,800 23. 96 21.89800 5.24 6.44 3,000 25.41 22.23
1, 000 7.15 8. 42 3 200 26.641, 200 9. 19 10. 41 3! 400 27. 581, 400 11.22 12. 31 3,600 28. 321, 6C0 13.26 14. 12 3,800 28.921,800 15. 24 15. 76 4,000 29. 212, 000 17. 17 17.26
Table 94. Calibration data for tungsten versus rhenium-alloy thermocouples, and for thermocouples of two tungsten-rhenium alloys
W/W-20% W/W-26% W-3% W-5%Temperature Ke Re Ke/ W -2Uyo Ke/ vV-26%
Re Re
"C °F emf, mv emf, mv emf, mv emf, mv93 200 0.143 0.310 0.763 1.139
204 400 0. 634 1. 110 2. 040 2.864316 600 1.460 2. 152 3.546 4.596427 800 2.625 3.660 5. 215 6.682538 1,000 3.989 5. 482 6.830 8. 760
649 1,200 5. 530 7. 450 8.565 10. 888760 1,400 7. 248 9.395 10. 255 12. 988871 1,600 9. 009 11.601 11.980 14.992982 1,800 10. 875 14. 030 13. 710 16. 939
1,093 2, 000 12. 690 16. 535 15. 420 18. 860
1.204 2, 200 14. .155 19. 052 17. 075 20. 7161, 316 2, 400 16. 260 21. 395 18. 660 22. 4841,427 2,610 18. 010 23. 705 20. 290 24. 2351, 538 2,800 19. 795 25. 675 21.810 25. 8981,649 3, 000 21.50 27. 87 23. 29 27.63
1,760 3, 200 23.23 30. 14 24.68 29. 13
1,871 3, 400 24.97 32. 28 26. 16 30. 581,982 3, 690 26.60 34.20 27. 28 32. 13
2,093 3,800 28. 12 36.12 28. 58 33. 21
2,204 4,000 29. 75 37. 83 29. 71 34.40
2,316 4, 200 31.05 39.64 30. 77 35.492,427 4,400 32. 20 41.25 31.69 36.42
2,538 4, 600 33. 45 42. 56 32. 61 37. 31
2,649 4, 800 34. 65 43. 99 33. 55 38. 00
2,760 5,000 35. 60 44. 79 34.38 38. 45
2,871 5,200 36.50 35. 15
emf versus temperature relationship that limits
the usefulness of the W versus Re and Mo versus
Re thermocouples. Results of work on these
materials, taken directly from reference [97], are
presented in table 94.
Compositions of the thermocouple materials
used in the work of Lachman and McGurty,taken from reference [97], are given in table 95.
Table 95. Chemical analyses of tungsten-rhenium alloys and tungsten, from reference [97]
Composition
wt%W-1% ReW-3% ReW-5% ReW-10% Re....W-20% Re....W-26% Re....Tungsten
Chemical analysis
W
wt%98.1296.2693.9889.6882. 2275.32
Re
wt%1.223.245. 359.9817.2123. 85
Mo
wt7o0. 005.005.004.005.005.04
<.001
Fe
wt%0.003.002.004.005.005.01.001
Cu
wt %0. 001.001.002.001.002
<. 001
Al
wt%0. 01
.006
.001
.002
.004
.001
Si
wt%
0. 001
.003<.001
Mg
wt%
0.001
"<r6o5"
Ni
wt%
0.004.005
wt%0.123.048.079
.044
.133
.010
ppm-186
138211
17339075
ppm<10<10<10
<10<10
34
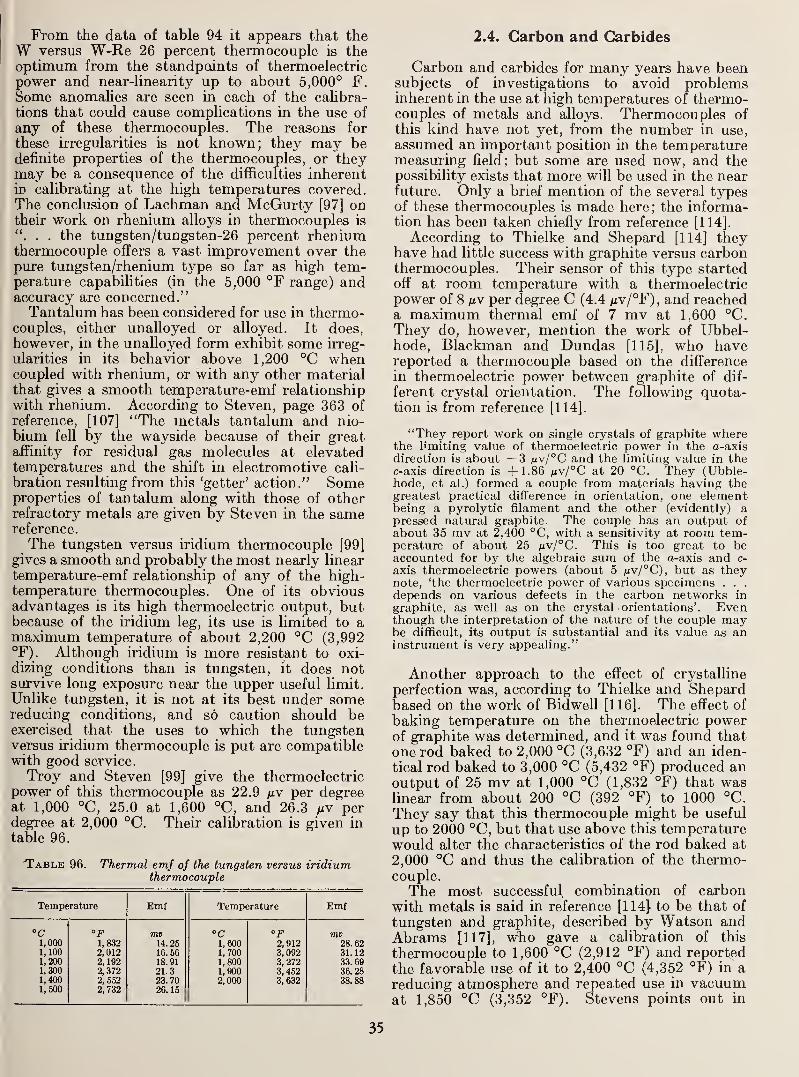
From the data of table 94 it appears that theW versus W-Re 26 percent thermocouple is theoptimum from the standpoints of thermoelectricpower and near-linearity up to about 5,000° F.Some anomalies are seen in each of the calibra-
tions that could cause complications in the use of
any of these thermocouples. The reasons for
these irregularities is not known; they may bedefinite properties of the thermocouples, or theymay be a consequence of the difficulties inherentin calibrating at the high temperatiu-es covered.The conclusion of Lachman and McGurty [97] ontheir work on rhenium alloys in thermocouples is
. . the tungsten/tungsten-26 percent rheniumthermocouple offers a vast improvement over thepure tungsten/rhenium type so far as high tem-peratme capabilities (in the 5,000 °F range) andaccuracy are concerned."Tantalum has been considered for use in thermo-
couples, either unalloyed or alloyed. It does,
however, in the unalloyed form exhibit some irreg-
ularities in its behavior above 1,200 °C whencoupled with rhenium, or with any other materialthat gives a smooth temperature-emf relationshipwith rhenium. According to Steven, page 363 of
reference, [107] "The metals tantalum and nio-
bium fell by the wayside because of their greataffinity for residual gas molecules at elevatedtemperatures and the shift in electromotive cali-
bration resulting from this 'getter' action." Someproperties of tantalum along with those of otherrefractory metals are given by Steven in the samereference.
The tungsten versus iridium thermocouple [99]
gives a smooth and probably the most nearly linear
temperature-emf relationship of any of the high-temperature thermocouples. One of its obviousadvantages is its high thermoelectric output, butbecause of the iridium leg, its use is limited to amaximum temperature of about 2,200 °C (3,992°F). Although iridium is more resistant to oxi-
dizing conditions than is tungsten, it does notsurvive long exposure near the upper useful limit.
Unlike tungsten, it is not at its best under somereducing conditions, and so caution should beexercised that the uses to which the tungstenversus iridium thermocouple is put are compatiblewith good service.
Troy and Steven [99] give the thermoelectricpower of this thermocouple as 22.9 fiv per degreeat 1,000 °C, 25.0 at 1,600 °C, and 26.3 nv perdegree at 2,000 °C. Their calibration is given in
table 96.
•Table 96. Thermal emf of the tungsten versus iridiumthermocouple
Temperature Emf Temperature Emf
"C op mv °C mv1,000 1,832 14. 25 1,600 2,912 28.621, 100 2,012 16.56 1, 700 3, 092 31.121,200 2,192 18. 91 1, 800 3,272 33.691,300 2,372 21.3 1,900 3, 452 36.281,400 2, 552 23.70 2,000 3,632 38.881,500 2,732 26.15
2.4. Carbon and Carbides
Carbon and carbides for many years have beensubjects of investigations to avoid problemsinherent in the use at high temperatures of thermo-couples of metals and alloys. Thermocouples ofthis kind have not yet, from the number in use,
assumed an important position in the temperaturemeasuring field; but some are used now, and thepossibility exists that more will be used in the nearfuture. Only a brief mention of the several typesof these thermocouples is made here ; the informa-tion has been taken chiefly from reference [114].
According to Thielke and Shepard [114] theyhave had little success with graphite versus carbonthermocouples. Their sensor of this type startedoff at room temperatiu-e with a thermoelectricpower of 8 nv per degree C (4.4 nv/°F) , and reacheda maximum thermal emf of 7 mv at 1,600 °C.They do, however, mention the work of Ubbel-hode, Blackman and Dundas [115], who havereported a thermocouple based on the difference
in thermoelectric power between graphite of dif-
ferent crystal orientation. The following quota-tion is from reference [114].
"They report work on single crystals of graphite wherethe limiting value of thermoelectric power in the a-axisdirection is about —3 a'v/°C and the limiting value in thec-axis direction is +1.86 mv/°C at 20 °C. They (Ubble-hode, et al.) formed a couple from materials having thegreatest practical difference in orientation, one elementbeing a pyrolytic filament and the other (evidently) apressed natural graphite. The couple has an output ofabout 35 mv at 2,400 °C, with a sensitivity at room tem-perature of about 25 /tv/°C. This is too great to beaccounted for by the algebraic sum of the a-axis and c-
axis thermoelectric powers (about 5 /iv/°C), but as theynote, 'the thermoelectric power of various specimens . . .
depends on various defects in the carbon networks in
graphite, as well as on the crystal orientations'. Eventhough the interpretation of the nature of the couple maybe difficult, its output is substantial and its value as aninstrument is very appealing."
Another approach to the effect of crystalline
perfection was, according to Thielke and Shepardbased on the work of Bidwell [116]. The effect of
baking temperature on the thermoelectric powerof graphite was determined, and it was found that
one rod baked to 2,000 °C (3,632 °F) and an iden-
tical rod baked to 3,000 °C (5,432 °F) produced anoutput of 25 mv at 1,000 °C (1,832 °F) that waslinear from about 200 °C (392 °F) to 1000 °C.
They say that this thermocouple might be useful
up to 2000 °C, but that use above this temperaturewould alter the characteristics of the rod baked at
2,000 °C and thus the calibration of the thermo-couple.
The most successful combination of carbonwith metals is said in reference [114} to be that of
tungsten and graphite, described by Watson andAbrams [117], who gave a calibration of this
thermocouple to 1,600 °C (2,912 °F) and reported
the favorable use of it to 2,400 °C (4,352 °F) in a
reducing atmosphere and repeated use in vacuumat 1,850 °C (3,352 °F). Stevens points out in
35
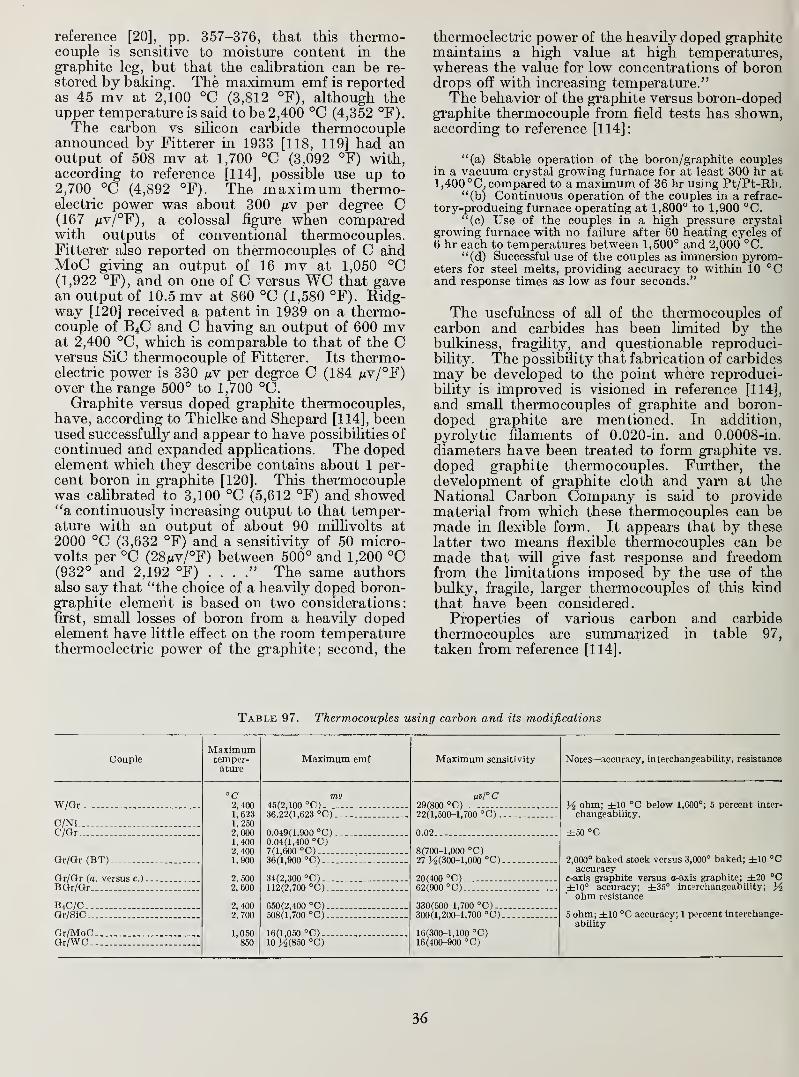
reference [20], pp. 357-376, that this thermo-couple is sensitive to moisture content in thegraphite leg, but that the calibration can be re-
stored by baking. The maximvmi emf is reportedas 45 mv at 2,100 °C (3,812 °F), although theupper temperature is said to be 2,400 °C (4,352 °F).
The carbon vs silicon carbide thermocoupleannounced by Fitterer in 1933 [118, 119] had anoutput of 508 mv at 1,700 °C (3,092 °F) with,according to reference [114], possible use up to
2,700_ °C (4,892 °F). The maximum thermo-electric power was about 300 nv per degree C(167 /iv/°F), a colossal figure when comparedwith outputs of conventional thermocouples.Fitterer also reported on thermocouples of C andMoC giving an output of 16 mv at 1,050 °C(1,922 °F), and on one of C versus WC that gavean output of 10.5 mv at 860 °C (1,580 °F). Ridg-way [120] received a patent in 1939 on a thermo-couple of B4C and C having an output of 600 mvat 2,400 °C, which is comparable to that of the Cversus SiC thermocouple of Fitterer. Its thermo-electric power is 330 hy per degree C (184 )uv/°F)
over the range 500° to 1,700 °C.Graphite versus doped graphite thermocouples,
have, according to Thielke and Shepard [114], beenused successfully and appear to have possibilities of
continued and expanded applications. The dopedelement which they describe contains about 1 per-cent boron in graphite [120]. This thermocouplewas calibrated to 3,100 °C (5,612 °F) and showed"a continuously increasing output to that temper-ature with an output of about 90 millivolts at
2000 °C (3,632 °F) and a sensitivity of 50 micro-volts per °C (28mv/°F) between 500° and 1,200 °C(932° and 2,192 °F) . . . The same authorsalso say that "the choice of a heavily doped boron-graphite element is based on two considerations:first, small losses of boron from a heavily dopedelement have little effect on the room temperaturethermoelectric power of the graphite; second, the
thermoelectric power of the heavily doped graphitemaintains a high value at high temperatures,whereas the value for low concentrations of borondrops off with increasing temperature."The behavior of the graphite versus boron-doped
graphite thermocouple from field tests has shown,according to reference [114]:
"(a) Stable operation of the boron/graphite couplesin a vacuum crystal growing furnace for at least 300 hr at
1,400 °C, compared to a maximum of 36 hr using Pt/Pt-Rh."(b) Continuous operation of the couples in a refrac-
tory-producing furnace operating at 1,800° to 1,900 °C."(c) Use of the couples in a high pressure crystal
growing furnace with no failure after 60 heating cycles of
6 hr each to temperatures between 1,500° and 2,000 °C."(d) Successful use of the couples as immersion pyrom-
eters for steel melts, providing accuracy to within 10 °Cand response times as low as four seconds."
The usefulness of all of the thermocouples of
carbon and carbides has been limited by thebulkiness, fragility, and questionable reproduci-bility. The possibility that fabrication of carbides
may be developed to the point where reproduci-bility is improved is visioned in reference [114],
and small thermocouples of graphite and boron-doped graphite are mentioned. In addition,
pyrolytic filaments of 0.020-in. and 0.0008-in.
diameters have been treated to form graphite vs.
doped graphite thermocouples. Further, thedevelopment of graphite cloth and yarn at the
National Carbon Company is said to providematerial from which these thermocouples can bemade in flexible form. It appears that by these
latter two means flexible thermocouples can bemade that will give fast response and freedomfrom the limitations imposed by the use of the
bulky, fragile, larger thermocouples of this kindthat have been considered.
Properties of various carbon and carbide
thermocouples are summarized in table 97,
taken from reference [114].
Table 97. Thermocouples using carbon and its modifications
CoupleMaximumtemper-atui-e
Maximum emf Maximum sensitivity Notes—accuracy, interchangeability, resistance
W/Qr
C/NiC/Qr
Gr/Or (BT)
Gr/Gr (a. versus c.)
BGr/Gr
B4C/CGr/SiC
Gr/MoCGr/WC
2, 4001, 6231,2502,0001.4002, 4001,900
2.5002.600
2, 4002, 700
1,050850
mv45(2,100 °C)36.22(1,623 "C)-.
0.049(1,900 "C)--0.04(1,400 °C)7(1,600 "C)36(1,900 "C)
34(2,300 °C)112(2,700 °C)
650(2,400 °C)508(1,700 °C).._.
16(1,050 °C)10 J^(850 °C)
29(800 "C)22(1,500-1,700 °C)_
0.02
8(700-1,000 °C)27 3^(300-1,000 °C)
20(400 °C)62(900 °C)
330(500-1,700 °C)_.300(1,200-1,700 °C)
16(300-1,100 °C)16(400-900 "C)
'A ohm; ±10 °C below 1,600°; 5 percent inter-
changeability.
±50 °C
2,000° baked stock versus 3,000° baked; ±10 °Caccuracy
c-axis graphite versus a-axis graphite; ±20 °C±10° accuracy; ±35° int?rchangeability; Hohm resistaiice
5 ohm; ±10 °C accuracy; 1 percent interchange-ability
36
3. Ceramic-Packed Thermocouple Stock ^
The ceramic-packed thermocouples discussed
here comprise thermocouple wires packed tightly
in ceramic insulating material enclosed in a
j
metal tube. This means of insulation for use at
I high temperatures has been used for a long timein resistance heating elements, but it is only
' since the arrival on the scene of jet engines andgas turbines that it has been applied so widelyto thermocouples. Although initial applications
were in the turbine-type engines, the versatility
and other desirable properties of the thermocouplesare so attractive that they now are acceptedthroughout industry and technology. The pur-pose here is, because of the widespread interest in
this type of thermocouple stock, to point outbriefly some of its properties that are of interest
in applications.
The general versatility of the ceramic-packedwire is described in catalogs of some suppliers
of this material. When quotations are givenhere from such sources the phrase "ceramic-packed" is substituted for brand or companynames. One statement [121] on the versatility of
this material follows.
"The characteristics of ceramic-packed wire make it
ideal for a wide variety of applications. Flexibility is oneof these highly desirable qualities; ceramic-packed wirecan be formed to a radius equal to the sheath diameterwithout loss of insulation. It will fit any contour, yetremain rigid after bending; it can be cut to short lengthsand connectors attached. It may be imbedded in concrete,plaster, or similar materials or buried underground."
No mention is made in this statement about therigorous conditions under which the packedstock must and does perform when it is subjectedto the temperatures,' vibrations, and atmospheresencountered in aircraft engine use.
3.1. Thermocouple Wires
All of the conventional thermocouple wiresare available in the ceramic-packed stock, andsome makers indicate that they will supply anysuitable wires in such material. The mostpopular thermocouples so mounted today are,
however, the type K and iron versus constantan.The range of wire sizes found in catalogs is. froma diameter of about 0.001 in. to B & S 12-gage(0.081 in.). Stock containing one or two wiresis generally available, and some with multiplewires are in the catalogs.
Several types of measuring junctions are
available. The most common types of baremeasuring junctions are the V, the U, the loop,
and variations of these to meet special require-ments. Totally enclosed junctions that protectthe wires from physical or chemical damage fall
' Most of the information available on the ceramic-packed stock is fromcatalog or advertising literature, and consequently practically all given hereis from such sources. No implication is intended that materials from indus-trial organizations whose literature is cited are superior to those of others, andno endorsement of any product over any other is implied herein.
generally into two styles, one in which thethermocouple is grounded to the closed end of
the sheath, and the other in which it is notgrounded. Another enclosed-j unction type [123,
124] that uses single-wire stock provides a butt-welded measuring junction in a continuousunwelded sheath. This type assembly can beused as a straight-through probe or can be formedinto a loop.
Another type of junction that is used more in
special applications is one in which a thin metallic
film is used to form a surface junction across
the square-cut end of coaxial stock. [125] Thesheath serves in this t5'pe as one leg of the ther-
mocouple, and the single, coaxial wire serves as
the other. The metallic film is vacuum depositedto a thickness of about one micron. One of theadvantages claimed for this type of junction is
fast response to a temperature change.
Additional types, mentioned in reference, [124]
are the differential and the pencil or tapered in
which the closed end at the measuring junction
•is tapered like a pencil point to give less massand consequent faster response to a temperaturechange.
Various types of connections and connectingheads are available, but these are outside of thescope of this paper and are not discussed here.
Makers of the sheathed stock normally claimthat the limits of error for the thermocoupletypes listed in reference [1] are within the ISAtolerances, and in most cases give their ownestimates of limits of error for thermocouples notlisted in reference [1]. The types listed by ISAare often said to be carried in stock, and theless common thermocouples are made up on order.
The ceramic-packed stock is available in outerdiameters ranging from 0.010 in. to about in.
The recommended minimum radius of bendingdifl^ers among the suppliers, but the range foundis from one to four diameters. Some makerssuggest that the stock be heated to make thesharper bends.
Information from three suppliers [124,126,121]on dimensions and wire sizes of available stock is
given in table 98. The first two tables are pre-
sumably for two-wire stock and the third is for
stock with up to four wires.
Inconel and stainless steels seem to be the mostpopular sheath materials, but a large assortmentis offered by the various makers. A compositelist of the various materials said to be available
from several makers is given in table 99 togetherwith some properties. Some of the informationis from reference [126], and advantage has beentaken of the thorough survey by Anderson andIVIacKenzie [127] for the most of the remainderof the data given. Values from tlie latter workare chiefly scaled from charts, and so must beconsidered approximate.
37

Table 98. Dimensions and wire sizes of available ceramic-packed stock
(a)
Sheath Standard Maximum Maxlumdiameter wire wire length
,
in. B & S gage B & b gage ft0. 010 50 46 25.020 38 38 150. 025 36 34 150. 032 35 34 150. 040 34 32 200
.062 29 28 200
. 091 26 26 100
.114 25 25 100
.125 24 22 100
.187 20 18 60
.250 18 16 60
.312 16 14 60
.375 14 14 40
.437 14 12 40
.500 12 12 25
(b)
Sheath outsidediameter
Outsidediametertolerance
Nominalwall thick-
ness
Approximatewire
Maximumlength
in. ±in. in. B & S gage ft0.020 0.001 0.003 38 250.032 .001 .005 36 250.040 .001 .007 34 250.062 .002 .010 29 150.090 .002 .014 26 125.125 .002 .018 24 100
.188 .003 .025 18 60
.2.50 .003 .032 17 40
.313 .003 .040 16 40
.375 .003 .049 14 30
.430 .003 .065 13 30
.500 .003 .065 12 30
(c)
Sheathdiameter
Sheathwall
thickness
Nominal conductor diameters
l-wire 2-wire 3-wire 4-wire
in. in. in. in. in. in.0.313 0.064 0.051 0. 040 0. 040.250 .051 .040 .032 .032.188 .040 .032 .022 .022.125 o'oii .032 .022 .011 .011.062 .010 .022 .011 .006 .006.040 .007 .011 .006.025 .005 .006 .004
Of the refractories available for use in theceramic-packed thermocouples magnesium oxideappears to have been and to continue to be themost popular. Aluminum oxide is, however,gaining favor; and beiyllium, zirconium, andthorium oxides may be had on special order.The quality of and some thermal information onthese refractory insulating materials is given intable 100, taken from reference [121].
The average coefficient of thermal expansionfrom room temperature to 700 °C of the refractoryinsulating materials, scaled from a chart ofreference, [127] is given in table 101. Values ofcopper, stainless steel, and aluminum are includedfor comparison.
Resistivities of some ceramic insulating ma-terials, taken from Anderson and MacKenzie'schart, are given in table 102. These data as well as
Table 99. Sheath materials for ceramic-packed thermo-couple stock and some of their properties
MaterialMelt-ing
point
Rec-om-
maxi-miunin air
Recommended Tensile strength ^
Operatingatmos-phere «
Contin-uousmaxi-mumtem-pera-ture
at 200op
at 1,600
Stainless steel304 _
°F2, 560
"F1,920 ORNV
ORNVORNVORNV
ORNVORNVORNVORNVORNVONVoONV«
"F'1,6502,0002, 1001,700
1,6001,6001, 6501,2002,000
2, 1002,200
psi68,000
psi
2, 5602,280
2,5802,600
1,9601, 760
1,5001,680
87,00075,000
70,00075,000
23,00023,000
17,000
316
OZi
An'i
446
2, 5502, 6202,5002,6502, 440
2,4202,4002, 2402, 4602,200
1,9801,8501,2202, 4502, 550
2, 5502,6472,7913,0903, 216
2,0001,5001,6402, 4001,820
1,8201,6201,4001,640
93,000150,00077, 000106,000136, 000
147, 00097, 000125,000
6,00011,0003,0007,00064,000
13,00054, 00051,000
Hastelloy C
Haynes 25xiasteiioy rriasceiioy a
Nionel ...
600700800400
2,000
2, 4001,5001,0001,9003, 000
ObRNV 600BrassAluminum ORNV 700Beryllium _„ _ _ __
Nichrome
AlumeL- —NickelIron-,Zircalloy,. _ _
Platinum ON^^ 3,000
Niobium 4, 3794, 750
4, 750
4, 750
5,4403, 3006, 850
1,6001, 000
3,680
3, 400
750600
1,000
VNVNR
3,800 no 000
137, 000Molybdenum 30,000Molybdenum
,
disilicized 4,400Molybdenum,chromalized .
Tantalum,.- VVN
5,0002 000
96,000 22,000Titanium.Graphite,
» This column is from reference [126]; symbols describing atmospheres are:0—Oxidizing; R—Reducing; N—Neutral; V—Vacuum,
b Scales readily in oxidizing atmosphere,° Very sensitive to sulfur corrosion."i After exposure to temperature of 100 hrs except for stainless steels, Haynes
25, W, Mo, Ta, and Nb.
Table 100. Quality of and some thermal data on insulating
materials used in ceramic-packed thermocouple stock
Mini- Melting Usable Maximum equiva-Insulator mum point tempera- lent boron
purity ture content
percent °F 'F ppmMagnesia (MgO) 99.1 5,050 4,000 39
Alumina (AI2O3) 99.5 3, 650 2, 300 30
Zirconia (Zr02),._ , , 99.4 4,500 1,200 200 ppm of HFjBeryllia (BeO) 99.8 4, 550 4,000 10
Thoria (Th02) 99.5 5,950 5,000 10
all data on thermal properties of such refractories
are affected by the physical and chemical com-position and history of the samples of materials
studied; and so the approximate nature of suchinformation must be kept in mind.When used in packed stock, the resistance be-
tween wires and sheath of magnesia is said in
reference 128 to be "upwards of 2000 megohms
38
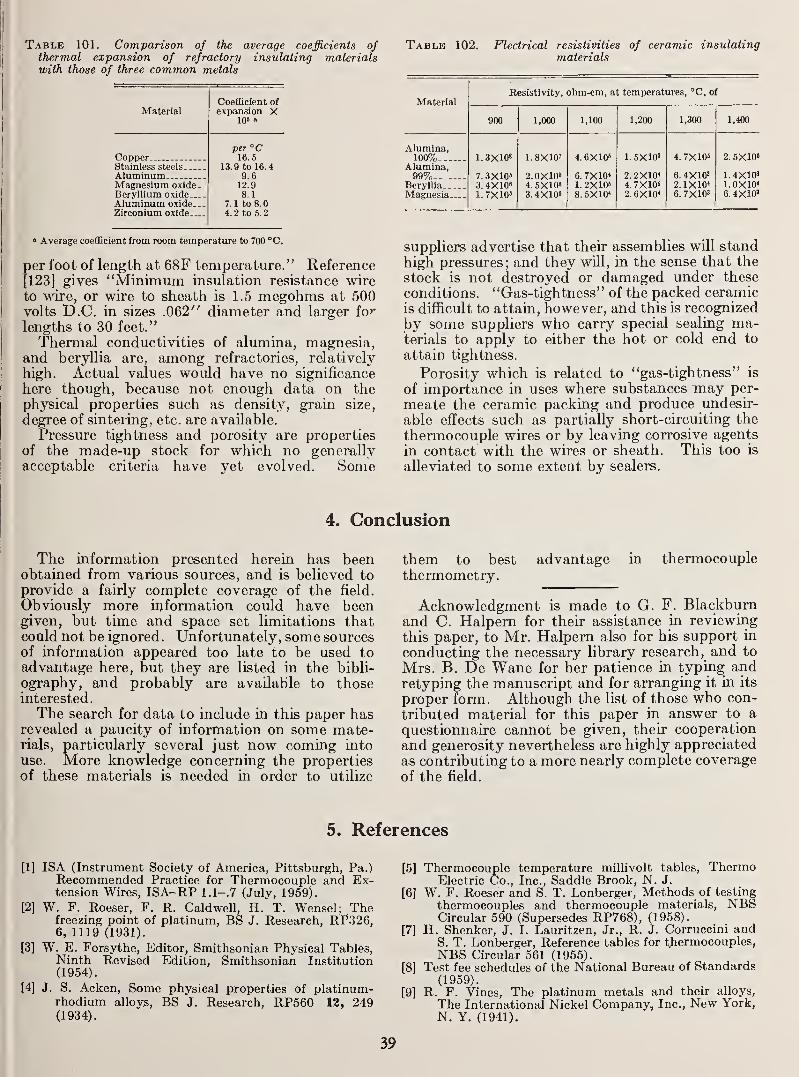
Table 101. Comparison of the average coefficients ofthermal expansion of refractory insulating materialswith those of three common metals
Coefficient ofMaterial expansion X
106 a
per °CCopper- 16.5Stainless steels 13.9 to 16.4Aluminum 9.6Magnesium oxide. . 12.9Beryllium oxide 8.1
Aluminum oxide. 7. 1 to 8. 0
Zirconium oxide 4. 2 to 5. 2
• Average coefficient from room temperature to 700 °C.
Iper foot of length at 68F temperature." Reference
I [123] gives "Minimum insulation resistance wireto wire, or wire to sheath is 1.5 megohms at 500volts D.C. in sizes .062" diameter and larger for
lengths to 30 feet."
Thermal conductivities of alumina, magnesia,and beryllia are, among refractories, relatively
high. Actual values would have no significance
here though, because not enough data on thephysical properties such as density, grain size,
degree of sintering, etc. are available.
Pressure tightness and porosity are propertiesof the made-up stock for which no generallyacceptable criteria have yet evolved. Some
Table 102. Flectrical resistivities of ceramic insulatingmaterials
MaterialResistivity, ohm-cm, at temperatures, °C, of
900 1,000 1,100 1,200 1,300 1,400
Alumina,100%
Alumina,99%
BerylliaMagnesia
1.3X10⁸
7. 3X10»3. 4X10«1.7X10'
1.8X10'
2. 0X10«4. 5X10»3. 4X10'
4.6X10'
6. 7X10*1.2X10'8.5X10*
1.5X10'
2.2X10*4.7X10*2. 6X10*
4. 7X10'
6.4X1032.1X10'6.7X10³
2.5X10'
1.4X1031.0X10*6.4X10^
suppliers advertise that their assemblies will standhigh pressures; and they will, in the sense that the
stock is not destroyed or damaged under these
conditions. "Gas-tightness" of the packed ceramicis difficult to attain, however, and this is recognized
by some suppliers who carry special sealing ma-terials to apply to either the hot or cold end to
attain tightness.
Porosity which is related to "gas-tightness" is
of importance in uses where substances may per-
meate the ceramic packing and produce undesir-
able effects such as partially short-circuiting the
thermocouple wires or by leaving corrosive agents
in contact with the wires or sheath. This too is
alleviated to some extent by sealers.
4. Conclusion
The information presented herein has beenobtained from various sources, and is believed to
provide a fairly complete coverage of the field.
Obviously more iijiformation could have beengiven, but time and space set limitations thatconld not be ignored. Unfortunately, some sourcesof information appeared too late to be used toadvantage here, but they are listed in the bibli-
ography, and probably are available to thoseinterested.
The search for data to include in this paper hasrevealed a paucity of information on some mate-rials, particularly several just now coming into
use. More knowledge concerning the propertiesof these materials is needed in order to utilize
them to best advantage in thermocouplethermometry.
Acknowledgment is made to G. F. Blackburnand C. Halpern for their assistance in reviewing
this paper, to Mr. Halpern also for his support in
conducting the necessary library research, and to
Mrs. B. De Wane for her patience in typing andretyping the manuscript and for arranging it in its
proper form. Although the list of those who con-
tributed material for this paper in answer to a
questionnaire cannot be given, their cooperation
and generosity nevertheless are highly appreciated
as contributing to a more nearly complete coverage
of the field.
5. References
[1] ISA (Instrument Society of America, Pittsburgh, Pa.)Recommended Practice for Thermocouple and Ex-tension Wires, ISA-RP 1.1-.7 (July, 1959).
[2] W. F. Roeser, F. R. Caldwell, H. T. Wensel; Thefreezing point of platinum, BS J. Research, RP.326,6, 1119 (1931).
[3] W. E. Forsythe, Editor, Smithsonian Physical Tables,Ninth Revised Edition, Smithsonian Institution(1954).
[4] J. S. Acken, Some physical properties of platinum-rhodium alloys, BS J. Research, RP560 12, 249(1934).
[5] Thermocouple temperature millivolt tables, ThermoElectric Co., Inc., Saddle Brook, N. J.
[6] W. F. Roeser and S. T. Lonberger, Methods of testing
thermocouples and thermocouple materials, NBSCircular 590 (Supersedes RP768), (1958).
[7] H. Shenker, J. I. Lauritzen, Jr., R. J. Corruccini andS. T. Lonberger, Reference tables for thermocouples,NBS Circular 561 (1955).
[8] Test fee schedules of the National Bureau of Standards(1959).
[9] R. F. Vines, The platinum metals and their alloys,
The International Nickel Company, Inc., New York,N. Y. (1941).
39

[10] T. Lyman, Editor, Metals Handbook, 1948 ed., TheAmerican Society for Metals, Cleveland, Ohio.
[11] D. L. McElroy, Progress report 1, Thermocoupleresearch report for the period November 1, 1956 toOctober 31, 1957, ORNL-2467, Oak Ridge NationalLaboratory.
[1 2] M. K. McQuillan, Some observations on the behaviourof platinum/platinum-rhodium thermocouples athigh temperatures, J. Sci. Instr. 26, 329 (1949).
[13] H. H. Uhlig, The Corrosion Handbook (John Wiley& Sons, New York, N.Y., 1948), Sponsored by theElectrochemical Society, Inc.
[14] E. M. Wise and R. F. Vines, Effect of (3old-work uponhardness and recrystallizing behavior of pureplatinum. Trans. Am. Inst. Mining, Met. Engrs.137, 464 (1940).
[15] F. E. Carter, Commercial types of platinum, MetalsHandbook, 1948 ed.
[16] C. S. Sivil, Private communication, reference 26 ofrcfCFGnc© 9.
[17] E. M. Wise, W. S. Crowell, J. T. Eash, Properties ofplatinum metals, I-Strength and annealing charac-teristics of platinum, palladium, and several oftheir commercial alloys. Trans. Am. Inst. Mining,Met. Engrs. 117, 313 (1935).
[18] E. M. Wise and J. T. Eash, Properties of platinummetals, II-Tensile strengths of platinum, palladiumand several of their commercial alloys at elevatedtemperatures, with a few notes on high-temperaturecorrosion resistance of platinum. Trans. Am. Inst.Mining, Met. Engrs. 128, 282 (1938).
[19] F. E. Carter and H. E. Stauss, Properties of platinumand platinum group metals and their alloys, MetalsHandbook, American Society for Metals, 1939 ed.,
1691.
[20] W. F. Roeser and H. T. Wensel, Temperature, ItsMeasurement and Control in Science and Industry(Reinhold Publishing Corporation, New York,1941), Appendix.
[21] E. M. Wise, Platinum and platinum alloys, MetalsHandbook, American Society for Metals, 1948 ed.,
1124.
[22] F. E. Carter, Platinum alloys containing from 3.5 to20% rhodium, Metals Handbook, American Societyfor Metals, 1948 ed., 1124.
[23] H. Esser and H. Eusterbrock, Untersuchung derWarmeausdehnung von einigen Metallen undLegierungen mit einem verbesserten Dilatometer,Archiv Eisenhiittenwesen 14, 341 (1941).
[24] Reference 3, page 151, attributed to Day and Sosman(1910).
[25] F. M. Jaeger and E. Rosenbohm, The exact formulaefor the true and mean specific heats of platinumbetween 0° and 1600°C, Physica 6, 1123 (1939).
[26] T. C. Goodwin, Jr. and M. W. Ayton, Library ofCongress, Thermal properties of certain metals,Part II—Iron, beryllium, iridium, palladium, plati-num, and tungsten, WADC Tech. Rept. 56-423,Part II, ASTIA Document No. AD 157169 (Sept.1958).
[27] T. C. Goodwin, Jr. and M. W. Ayton, Library ofCongress, Thermal properties of certain metals,Molybdenum, chromium, tantalum, graphite, cop-per, WADC Tech. Rept. 56-423, ASTIA DocumentNo. 111846, (August 1956).
[28] R. Holm and R. Stormer, Measurement of the thermalconductivity of a platinum specimen in the temper-ature range 19-1020°C, Wissenschaftliche Veroffent-lichungen aus dem Siemens-Konzern 9, part II,
312 (1930).
[29] W. Geiss, The total radiation of platinum, Physica5, 203 (1925).
[30] A. G. Worthing, Spectral emissivities of tantalum,platinum, nickel and gold as a function of tempera-ture, and the melting point of tantalum, Phys.Rev. 28, 174 (1926).
[31] R. E. Stephens, The spectral emissivity and therelation of true temperatures and brightnesstemperatures of platinum, J. Opt. Soc. Am. 29,158 (1939).
[32] D. J. Price, The emissivity of hot metals in the infra-
red, Proc. Phys. Soc. (London) 59, 118 (Jan. 1,
1947).
[33] H. A. Jones, I. Langmuir, and G. M. J. MacKay,The rates of evaporation and the vapor pressuresof tungsten, molybdenum, platinum, nickel, iron,
copper, and silver, Phys. Rev. 30, 201 (1927).
[34] W. Crookes, The volatility of metals of the platinumgroup, Proc. Roy. Soc. (London), A86, 461 (1912).
[35] O. Feussner, New noble metal thermoelements for
very high temperatures, Elektrotech. Z. 54, 135(1933).
[36] F. Henning and H. T. Wensel, The freezing point of
iridium, BS J. Research 10, RP 568, 809 (1933).
[37] W. F. Roeser and H. T. Wensel, Freezing point of
rhodium, BS J. Research 12, RP 676, 519 (1934).
[38] G. F. Blackburn and F. R. Caldwell, Referencetables for 40 percent iridium-60 percent rhodiumvs iridium thermocouples, Symposium on Temper-ature, Its Measurement and Control in Science andIndustry, American Institute of Physics, Instru-ment Society of America, National Bureau ofStandards, Columbus, Ohio, March 27-31, 1961.
[39] C. R. Droms and A. I. Dahl, Iridium versus iridium-rhodium thermocouples for gas temperature meas-urements up to 3500°F, Proceedings of the JointConference on Combustion, Boston, London,330 (1955).
[40] Product information report No. 8.1, Aero ResearchInstrument Company, Chicago, p. 7.
[41] B. Brenner, Sigmund Cohn Corporation, Mt. Vernon,N.Y., Private communication.
[42] F. E. Carter and H. E. Stauss, Properties of platinumand platinum group metals and their alloys,
Metals Handbook, 1939 ed.. The American Societyfor Metals, Cleveland, Ohio.
[43] J. C. Wilcox and W. F. Doring, Baker PlatinumDivision, Engelhard Industries, Inc., Newark,N.J., Private communication (Oct. I960).
[44] W. Jaeger and H. Diesselhorst, WarmeleitungElektricitatsleitung Warmecapacitat und Thermo-kraft einiger Metalle, Wiss. Abh. Phys. Tech.Reichanst. 3, 269 (1900).
[45] L. Holborn, Uber die Abhangigheit der Wieder-standes reiner Metalle von der Temperatur, Ann.Physik 59, 145 (1919).
[46] L. Holborn, F. Henning, and L. Austin, Die Zerstaub-ung und Rekristallisation elektrisch gegliihter
Platinmetalle, Wiss. Abh. Phys. Tech. Reichanst.
4, 85 (1903).
[47] E. A. Owen and E. L. Yates, Precision measurementsof crystal parameters, Phil. Mag. 15, 472 (1933).
[48] L. Holborn and S. Valentiner, Eine Vergleichung der
optischen Temperaturskale mit dem Stickstoff-
thermometer bis 1600°, Ann. Physik 22, 1 (1907).
[49] F. M. Jaeger and E. Rosenbohm, The exact measure-ment of the specific heats of iridium and rutheniumbetween 0° and 1,604° C and a comparison of the
calorimetrical results obtained with the elementsof the eighth group of the periodical system, Proc.
Acad. Sci. Amsterdam 34, 808 (1931).
[50] T. Barratt and R. M. Winter, The thermal con-
ductivity of wires and rods, Ann. Phys. 77, 1 (1925).
[51] D. L. Goldwater and W. E. Danforth, Thermionicemission constants of iridium, Phys. Rev. 103, 871
(1956).
[52] M. M. Fulk and M. M. Reynolds, Radiometry,(American Institute of Physics Handbook, D. E.
Gray, editor, McGraw-Hill Co., Inc., New York,
1957), section 6, p. 68.
[53] E. M. Wise, The platinum metals: A review of their
properties and uses, J. Electrochemical Soc. 97,
57c (1950).
40
[541 M. E. Ihnat, The General Electric Company, A jet
engine thermocouple, system for measuring temper-atures up to 2300° F, WADC Tech. Rept. 57-744(Dec. 1957).
[55] P. D. Freeze, F. R. Caldwell, and E. R. Davis,
Reference tables for the palladium vs platinum
—
15% iridium thermocouple, WADD Tech. Rept.(number not yet assigned).
[56] G. Grube and R. Knabe, Elektrische Leitfahigkeit
und Zustanddiagramm bei binaren Legierungen,
Z. Elektrochem. 42, 793 (1936).
[57] J. G. G. Conybeare, The resistance of palladium andpalladium-gold alloys, Proc. Phys. Soc. 49, 29
(1937).
[58] L. Holborn and A. L. Day, Uber den Schmelzpunktdes Goldes, Ann. Physik 4, 104 (1901).
[59] F. M. Jaeger and W. A. Veenstra, The exact measure-ments of the specific heats of solid materials at
high temperatures, XV. A redetermination of the
specific heats of palladium, Proc. Acad. Sci. Amster-dam 37, 280 (1934).
[60] E. H. Hall, Thermo-electric action and thermal con-
duction in metals, Proc. Natl. Acad. Sci. U.S. 7,
98 (1921).
[61] W. E. Forsythe, 1919 report of Standards Committeeon Pyrometry, J. Opt. Soc. Am. 4, 305 (1920).
[62] P. D. Freeze, F. R. Caldwell, E. R. Davis, Thermo-electric stability of Platinel thermocouples in anoxidizing atmosphere. Unpublished report to the
Wright Air Development Division, U.S. Air Force,
(June 1960).
[63] W. F. Roeser and A. I. Dahl, Reference tables for
iron-constantan and copper-constantan thermo-couples, J. Research NBS 20, RP1080, 337 (1938).
[64] W. F. Roeser, A. I. Dahl, and G. J. Gowens, Standardtables for Chromel-Alumel thermocouples, J. Re-search NBS 14, RP767, 239 (1935).
[65] A. I. Dahl, The stability of base-metal thermocouplesin air from 800 to 2200° F, Temperature, Its
Measurement and Control in Science and Industry(Reinhold Publishing Corporation, New York,
1941), 1238.
[66] J. F. Potts and D. L. McElroy, Some results of
base-metal thermocouple research at Oak RidgeNational Laboratory, High Temperature Ther-mometry Seminar, Oak Ridge National Laboratory,
October 1-2, 1959, TID-7586 (Pt. 1).
[67] Hoskins Chromel-Alumel thermocouple alloys, Hos-kins Manufacturing Company, Detroit, Michigan,Catalog M-56C-A-2500.
[68] Thermo-Kanthal alloys. The Kanthal Corporation,Stamford, Connecticut, (Jan. 15, 1959).
[69] C. Dean Starr, Wilbur B. Driver Co., Newark, N.J.,
Private communication, (August 1960).
[70] D. M. Steelman, Leeds and Northrup Company,Philadelphia, Pa., Private communication, (Au-gust 1960).
[71] F. S. Sibley, Effect of environment on the stability
of Chromel-Alumel thermocouples, High-Temper-ature Thermometry Seminar, Oak Ridge NationalLaboratory, October 1-2, 1959, TID 7586 (Pt. 1)
16.
[72] Thermoelectric properties and design data for tem-perature measurements. Technical Bulletin No.159, The Driver-Harris Company, Harrison, N.J.
(1959).
[73] R. J. Corruccini and H. Shenker, Modified 1913reference tables for iron constantan thermocouples,J. Research NBS 50, RP2415, 229 (1953).
[74] Thermocouples and accessories. Bulletin 19-10, TheFoxboro Company, Foxboro, Mass.
[75] L. H. Adams, Pyrometry (Symposium published byAm. Inst. Mining Met Engrs 1920), 165.
[76] P. H. Dike, Thermoelectric thermometry, Leeds andNorthrup Company, Philadelphia, Pa., 15 (1954)
[77] J. F. Potts, Jr., and D. L. McElroy, Thermocoupleresearch to 1000°C—Final report, Nov. 1, 1957through June 30, 1959, ORNL-2773, UC-37-Instruments, TID-4500 (15th ed.) Oak RidgeNational Laboratory.
[78] H. E. Cleaves and J. G. Thompson, The metal-iron,Published for the Engineering Foundation byMcGraw-Hill Book Co., Inc., New York (1935).
[79] F. C. Lea, The eff'ect of temperature on some of theproperties of metals, Proc. Inst. Mech. Engrs.885 (1922).
[80] F. M. Jaeger, E. Rosenbohm and A. J. Zuithoff, Theexact measurement of the specific heat and otherphysical properties of solid substances at hightemperatures. XI. The specific heat, electrical
resistance, thermoelectric behavior and thermalexpansion of electrolytic iron, Recueil Trav. Chim.57, 1313 (1938).
[81] C. F. Lucks and H. W. Deem, Thermal conductivities,heat capacities, and linear thermal expansion offive materials, Battelle Memorial Institute, WADCTech. Rept. 55-496, AD 97185, 19 (August 1956).
[82] G. B. Wilkes, Heat Insulation (John Wiley & Sons,New York, 1950), 183.
[83] W. H. McAdams, Heat Transmission (3d ed.,
McGraw-Hill Co., Inc., New York, 1954).
[84] H. B. Wahlin and H. W. Knop, Jr., The spectralemissivity of iron and cobalt, Phys. Rev. 74, 687(1948).
[85] P. F. McDermott, An apparatus for the measurementof the total normal thermal emissivity of sheetmaterials in the temperature range 140 to 500° F,Rev. Sci. Instr. 8, 185 (1937).
[86] A. Butts, Copper the metal its alloys and compounds(Reinhold Publishing Corp., New York, 1954).
[87] H. C. Jennison and C. S. Smith, Properties of com-mercially pure copper, Metals Handbook, 1939 ed..
The American Society for Metals, Cleveland, Ohio,1389.
[88] C. S. Smith, The physical constants of copper, MetalsHandbook, 1939 ed., The American Society forMetals, Cleveland, Ohio, 1380.
[89] F. M. Jaeger, E. Rosenbohm, and J. A. Bottema,The exact measurement of the specific heats ofsolid substances at high temperatures. VII-Metalsin stabilized and non-stablized condition: Copperand gold, Proc. Acad. Sci. Amsterdam, 35, 772(1932).
[90] E. M. Wise, Copper-nickel alloys, Metals Handbook,1939 ed.. The American Society for Metals, Cleve-land, Ohio, 1413.
[91] G. C. Stauffer, Properties of the alloy 55% copper-45% nickel (constantan), Metals Handbook, 1939ed.. The American Society for Metals, Cleveland,Ohio, 1417.
[92] T. B. Douglas and J. L. Dever, Enthalpy and speci-
fic heat of four corrosion-resistant alloys at hightemperatures, J. Research NBS 54, RP 2560, 15(1955).
[93] V. D. Sanders, Review of high temperature immersionthermal sensing devices for in-flight engine control,
Rev. Sci. Instr. 29, 917 (1958).
[94] F. W. Kuether, Uniqueness of thermal emfs measuredin molybdenum, rhenium, tungsten, iron and cop-per, High-Temperature Thermometry Seminar, OakRidge National Laboratory, October 1-2, 1959,TID 7586 (Pt. 1), 23.
[95] J. C. Lachman and F. W. Kuether, Stability ofrhenium/tungsten thermocouples in hydrogen at-
mospheres, ISA Journal 7, 67 (1960).
[96] F. W. Kuether and J. C. LachmaUj How reliable
are the two new high-temperature thermocouplesin vacuum?, ISA Journal 7, 66 (1960).
[97] J. C. Lachman and J. A. McGurty, Thermocouplesfor 5000° F using rhenium alloys. Presented at theElectrochemical Society Symposium on Rhenium,Chicago, May 4, 1960.
41
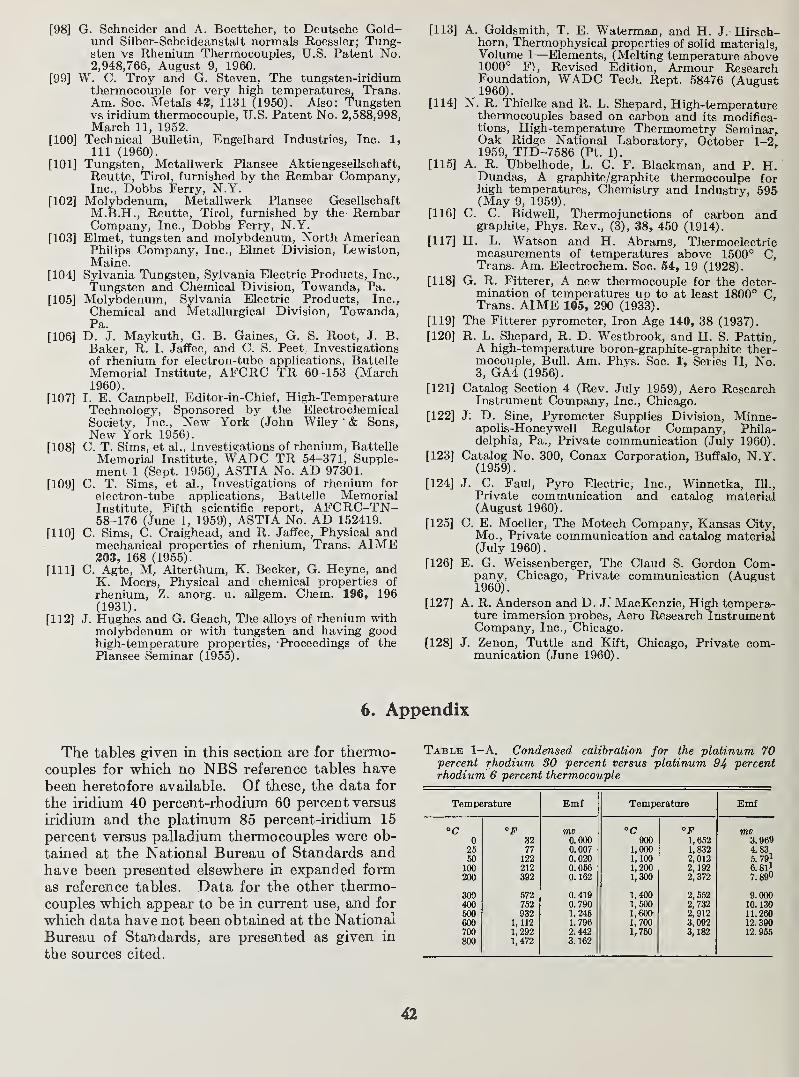
[98] G. Schneider and A. Boettcher, to Deutsche Gold-und Silber-Scheideanstalt normals Roessler; Tung-sten vs Rhenium Thermocouples, U.S. Patent No.2,948,766, August 9, 1960.
[99] W. C. Troy and G. Steven, The tungsten-iridiumthermocouple for very high temperatures. Trans.Am. Soc. Metals 42, 1131 (1950). Also: Tungstenvs iridium thermocouple, U.S. Patent No. 2,588,998,March 11, 1952.
[100] Technical Bulletin, Engelhard Industries, Inc. 1,
111 (1960).
[101] Tungsten, Metallwerk Plansee Aktiengesellschaft,Reutte, Tirol, furnished by the Rembar Company,Inc., Dobbs Ferry, N.Y.
[102] Molybdenum, Metallwerk Plansee GesellschaftM.B.H., Reutte, Tirol, furnished by the- RembarCompany, Inc., Dobbs Ferry, N.Y.
[103] Elmet, tungsten and molybdenum. North AmericanPhilips Company, Inc., Elmet Division, Lewiston,Maine.
[104] Sylvania Tungsten, Sylvania Electric Products, Inc.,
Tungsten and Chemical Division, Towanda, Pa.
[105] Molybdenum, Sylvania Electric Products, Inc.,
Chemical and Metallurgical Division, Towanda,Pa.
[106] D. j. Maykuth, G. B. Gaines, G. S. Root, J. B.Baker, R. I. Jaffee, and C. S. Peet, Investigationsof rhenium for electron-tube applications, Battelle
Memorial Institute, AFCRC TR 60-153 (March1960).
[107] I. E. Campbell, Editor-in-Chief, High-TemperatureTechnology, Sponsored by the ElectrochemicalSociety, Inc., New York (John Wiley ' & Sons,New York 1956).
[108] C. T. Sims, et al., Investigations of rhenium, Battelle
Memorial Institute, WADC TR 54-371, Supple-ment 1 (Sept. 1956), ASTIA No. AD 97301.
[109] C. T. Sims, et al., Investigations of rhenium for
electron-tube applications, Battelle MemorialInstitute, Fifth scientific report, AFCRC-TN-58-176 (June 1, 1959), ASTIA No. AD 152419.
[110] C. Sims, C. Craighead, and R. Jaffee, Physical andmechanical properties of rhenium. Trans. AIME203, 168 (1955).
[Ill] C. Agte, M, Alterthum, K. Becker, G. Heyne, andK. Moers, Physical and chemical properties of
rhenium, Z. anorg. u. aUgem. Chem. 196, 196(1931).
[112] J. Hughes and G. Geach, The alloys of rhenium withmolybdenum or with tungsten and having goodhigh-temperature properties. Proceedings of thePlansee Seminar (1955).
[113] A. Goldsmith, T. E. Waterman, and H. J. Hirsch-horn, Thermophysical properties of solid materials,Volume 1—Elements, (Melting temperature abov&1000° F), Revised Edition, Armour ResearchFoundation, WADC Tech. Rept. 58476 (August1960).
[114] N. R. Thielke and R. L. Shepard, High-temperaturethermocouples based on carbon and its modifica-tions. High-temperature Thermometry Seminar,Oak Ridge National Laboratory, October 1-2,.
1959, TID-7586 (Pt. 1).
[115] A. R. Ubbelhode, L. C. F. Blackman, and P. H.Dundas, A graphite/graphite thermocoulpe forhigh temperatures. Chemistry and Industry, 595(May 9, 1959).
[116] C. C. Bidwell, Thermojunctions of carbon andgraphite, Phys. Rev., (3), 38, 450 (1914).
[117] H. L. Watson and H. Abrams, Thermoelectricmeasurements of temperatures above 1500° C,Trans. Am. Electrochem. Soc. 54, 19 (1928).
[118] G. R. Fitterer, A new thermocouple for the deter-mination of temperatures up to at least 1800° C,Trans. AIME 105, 290 (1933).
[119] The Fitterer pyrometer. Iron Age 140, 38 (1937).
[120] R. L. Shepard, R. D. Westbrook, and H. S. Pattin,A high-temperature boron-graphite-graphite ther-mocouple. Bull. Am. Phys. Soc. 1, Series II, No.3, GA4 (1956).
[121] Catalog Section 4 (Rev. July 1959), Aero ResearchInstrument Company, Inc., Chicago.
[122] J: D. Sine, Pyrometer Supplies Division, Minne-apolis-Honeywell Regulator Company, Phila-delphia, Pa., Private communication (July 1960).
[123] Catalog No. 300, Conax Corporation, Buffalo, N.Y.(1959).
[124] J. C. Faul, Pyro Electric, Inc., Winnetka, 111.,
Private communication and catalog material(August 1960).
[125] C. E. Moeller, The Motech Company, Kansas City,Mo., Private communication and catalog material(July 1960).
[126] E. G. Weissenberger, The Claud S. Gordon Com-pany, Chicago, Private communication (August1960).
[127] A. R. Anderson and D. J.' MacKenzie, High tempera-ture immersion probes. Aero Research InstrumentCompany, Inc., Chicago.
[128] J. Zenon, Tuttle and Kift, Chicago, Private com-munication (June 1960).
6. Appendix
The tables given in tliis section are for thermo-
couples for which no NBS reference tables havebeen heretofore available. Of these, the data for
the iridium 40 percent-rhodium 60 percent versus
iridium and the platinum 85 percent-iridium 15
percent versus palladium thermocouples were ob-
tained at the National Bureau of Standards andhave been presented elsewhere in expanded formas reference tables. Data for the other thermo-
couples which appear to be in current use, and for
which data have not been obtained at the National
Bureau of Standards, are presented as given in
the sources cited.
Table 1-A. Condensed calibration for the platinum 70percent rhodium 30 percent versus platinum 94 percentrhodium 6 percent thermocouple
Temperature Emf Temperature Emf
"C "F mv °C "F mv0 32 0.000 900 1,652 3.96926 77 0.007 1,000 1,832 4.83,50 122 0.020 1,100 2, 012 5.79J
100 212 0. 056 1,200 2,192 6.81I
200 392 0. 162 1,300 2,372 7.89"
300 672 0. 419 1,400 2,552 9.000400 752 0.790 1,500 2,732 10. 130600 932 1.245 1,600 2, 912 11.260600 1,112 1.796 1,700 3, 092 12.390700 1,292 2.442 1,760 3, 182 12. 966800 1,472 3. 162
42
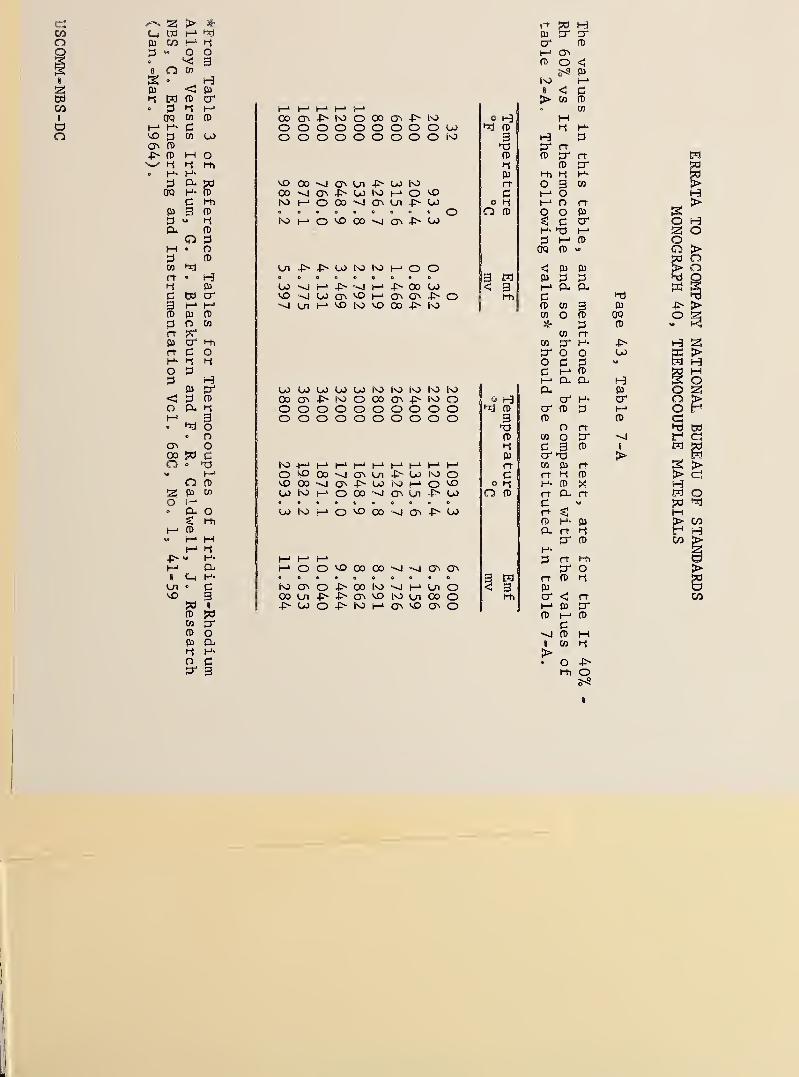
> %C( 1—
'
fu !—
>
b O3
o o 03
Hfu <i-i w (t)
o 3 t—
'
I-* I—" h-"
OP CO CD CO C^ •P- N3 O C» ONh-' H- d o O o O o O o o o COV£) 3 CO CO o O o o o O o o o (NO
0^ fD
fD M Oi-i l-h
H-3 vO 00 Cn •P- COOQ fD CO >^ C3^ 4^ CO I—" o VO
c l-h hO I-* O 00 o> •f> COg m O
3 i-f hO h-* O VO 00 C3N p> CO
o en
M • o3 n>
CO Ol CO N3 I—- o o* H o e e e >
U3 h-" »j I-" -P- C» COC cr VO U) VO 1—
'
C3N P- O3 (-> Ul h-" VO K5 VO 00 -P- ls5
(C (D
3 o CO
rt!-h
rt d OI-i
O 33 H
pj (jO UO CO U) ISi IsJ lo |nJ
< 3 fD C» -f> O CO c^ 4^- oO a ^-! O o O o O O o O O o1—
'
1^*
3 O o O o o O o O o o"
OC
o00 do e TJ -t-' I-' I-" 1—
'
h-' I—" 1—
'
o h-" o VO 00 ON Ul -P- CO l-o ofD 00 CO iNJ t-* o VO
1^03 U3 O 00 >^ C3N Cn p~ CO
o « 0 o
dw of(jO K) h-' O VO 00 -P~ CO
rt)
I—"Ir
-P> I—" h-
'
h-'
I-' I-* O O VO 00 00 ON ON1 ° • • • °
Ol d o CO Cn ovO
!Ul 4> ON VO Ul 00 oUi o N3 I—" ON VO <3N o
CO 3^
O(13
o d3' 3
^ fD
3
fD
I-i
fU
rt
dO I-iO fD
3 M< 3
l-h
S^fl fD
3
fD
I-i
rt
d
jo fD
3 Ml< 3
l-h
rt
crI-"
fD
Is3
fO HI3- 3^
HfD
HiO
ONo
<
MI-i
rt3^fD
I-i
<
I—
'
dfD
03
M-3
rt3"H-03
OOod
3 I-"
OQ fD
O
03 31-^ CLdfD 03
03 O>{
03
03
3^ oo dd I-"
I-* P-a-
crcr fD
fD
o03 Od 3cr03 !H
rt I-i
H- <D
rtdrtfD
Q-
03
cr
fD
03
3
3fD
3rt
O3(D
a
rt3'fD
3 rt l-h
3^ Ort fD i-{
P3cr < rt
fD H-' fD
d^ fD MI 0) i-{
>• O -P-
Ml O5-3
03
OPfD
co
H03
cr
fD
pa *^

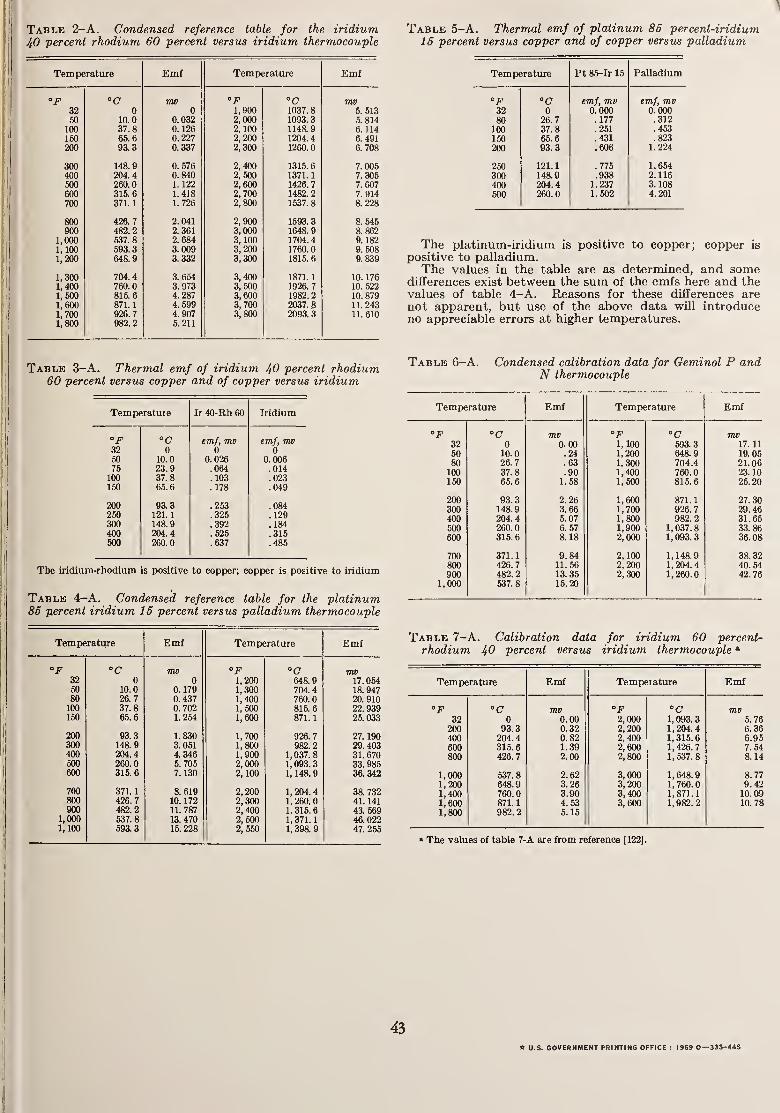
Table 2-A. Condensed reference table for the iridium
40 percent rhodium 60 -percent versus iridium thermocouple
Temperature Emf Temperature Emf
°c °F °C32 Q
7710
^ 1 900 1037. 8 ""5. 51350 10.0 0.032 2! 000 1093! 3 5. 814100 37.8 0.126 2, 100 1148.9 6. 114150 65. 6 0.227 2 200 1204. 4 6. 491200 93.
3
0.337 2' 300 1260. 0 6. 708
300 148. 9 0. 576 2 400 1315. 6 7.005400 204! 4 0.840 2^500 137L 1 7.305500 260.0 1.122 2,600 1426.7 7. 607600 315.
6
1.418 2 700 1482. 2 7. 914700 371.
1
1.726 2' 800 1537.
8
8.228
800 426. 7 2.041 2 900 1593.
3
8. 545900 482.
2
2. 361 si 000 1648 9 8.8621,000 537^8 2.684 3, 100 1704! 4 9. 182
1,100 593.3 3.009 3,200 1760.0 9.5081,200 648.9 3. 332 3,300 1815.6 9.839
1,300 704.4 3. 654 3,400 1871.
1
10. 1761,400 760.0 3. 973 3,500 1926. 7 10. 5221,500 815.6 4.287 3,600 1982.
2
10. 8791,600 871.
1
4. 599 3,700 2037.8 11.243
1,700 926.7 4. 907 3,800 2093.3 11.6101,800 982.2 5. 211
Table 3-A. Thermal emf of iridium 40 percent rhodium60 percent versus copper and of copper versus iridium
Temperature Ir 40-Rh 60 Iridium
"F °C emf, mv emf, mv32 0 0 050 10.0 0. 026 0.00675 23.9 .064 .014100 37.8 . 103 .023ISO 65.6 .178 .049
200 93.3 .253 .084250 121.
1
.325 .129300 148.9 .392 .184400 204.4 .525 .315500 260.0 .637 .485
The iridium-rhodium is positive to copper; copper is positive to iridium
Table 4-A. Condensed reference table for the platinum86 percent iridium 15 percent versus palladium thermocouple
Temperature Emf Temperature Emf
op °C 77MJ "F °C TTW32 0 0 1,200 648.9 17. 05450 10.0 0. 179 1,300 704.4 18. 94780 26.7 0.437 1,400 760.0 20. 910100 37.8 0.702 1,500 815.6 22.939150 65.6 1.254 1,600 871.1 25.033
200 93.3 1.830 1,700 926.7 27. 190300 148.9 3. 051 1,800 982.2 29.403400 204.4 4.346 1,900 1, 037.
8
31. 670600 260.0 5.705 2,000 1,093.3 33. 985600 315.6 7. 130 2, 100 1, 148. 9 36. 342
700 371.
1
8.619 2,200 1, 204.
4
38. 732800 426.7 10. 172 2, 300 1,260.0 41. 141900 482.2 11. 787 2,400 1.315.6 43.569
1,000 537.8 13. 470 2,500 1,371.
1
46.0221, 100 693.3 15. 228 2, 550 1, 398.
9
47. 265
\
Table 5-A. Thermal emf of platinum 85 percent-iridium16 percent versus copper and of copper versus palladium
Temperature Pt 85-Ir 15 Palladium
°F °C emf, mv emf, mv32 0 0.000 0.00080 26.7 .177 .312
100 37.8 .251 .453
150 65.6 .431 .823
200 93.3 .606 1.224
250 121.1 .775 1.654300 148.9 .938 2.116400 204.4 1.237 3. 108500 260.0 1.502 4.201
The platinum-iridium is positive to copper; copper is
positive to palladium.The values in the table are as determined, and some
differences exist between the sum of the emfs here and thevalues of table 4-A. Reasons for these differences arenot apparent, but use of the above data will introduceno appreciable errors at higher temperatures.
Table 6-A. Condensed calibration data for Geminol P andN thermocouple
Temperature Emf Temperature Emf
"F °C mv "F "C mv32 0 0.00 1,100 593.3 17. 11
50 10.0 .24 1,200 648.9 19.0680 26.7 .63 1, 300 704.4 21.06100 37.8 .90 1,400 760.0 23. 10150 66.6 1.58 1,600 815.6 25.20
200 93.3 2.26 1,600 871.1 27. 30300 148.9 3.66 1,700 926.7 29.46400 204.4 5. 07 1,800 982.2 31.65500 260.0 6. 57 1,900 1,037.8 33.86600 315.6 8.18 2,000 1,093.3 36.08
700 371.1 9.84 2,100 1,148.9 38.32800 426.7 11.56 2,200 1,204.4 40.54900 482.2 13. 35 2,300 1,260.0 42.76
1,000 537.8 15.20
Table 7-A. Calibration data for iridium 60 percent-
rhodium 40 percent versus iridium thermocouple
Temperature Emf Temperature Emf
"F "C 77!!! °C 7715
32 0 0.00 2,000 1,093.3 5.76200 93.3 0. 32 2,200 1,204.4 6.36400 204.4 0.82 2,400 1,315.6 6.95600 315.6 1.39 2,600 1,426.7 7.64800 426.7 2.00 2,800 1,537.8 8. 14
1,000 637,8 2.62 3,000 1,648.9 8.771,200 648.9 3.26 3,200 1,760.0 9.421,400 760.0 3.90 3,400 1,871.1 10.091,600 871.1 4.53 3, 600 1,982.2 10.781,800 982.2 5.15
• The values of table 7-A are from reference [122].
43ft U.S. GOVERNMENT PRINTING OFFICE : 1969 0—333-445

I
I