The XTRA Option at the NEUTRA Facility More Than 10 Years ...
16
applied sciences Review The XTRA Option at the NEUTRA Facility—More Than 10 Years of Bi-Modal Neutron and X-ray Imaging at PSI Eberhard H. Lehmann * , David Mannes, Anders P. Kaestner , Jan Hovind, Pavel Trtik and Markus Strobl Citation: Lehmann, E.H.; Mannes, D.; Kaestner, A.P.; Hovind, J.; Trtik, P.; Strobl, M. The XTRA Option at the NEUTRA Facility—More Than 10 Years of Bi-Modal Neutron and X-ray Imaging at PSI. Appl. Sci. 2021, 11, 3825. https://doi.org/10.3390/ app11093825 Academic Editor: Richard Kouzes Received: 25 March 2021 Accepted: 16 April 2021 Published: 23 April 2021 Publisher’s Note: MDPI stays neutral with regard to jurisdictional claims in published maps and institutional affil- iations. Copyright: © 2021 by the authors. Licensee MDPI, Basel, Switzerland. This article is an open access article distributed under the terms and conditions of the Creative Commons Attribution (CC BY) license (https:// creativecommons.org/licenses/by/ 4.0/). Laboratory for Neutron Scattering and Imaging, Paul Scherrer Institut, CH-5232 Villigen, Switzerland; [email protected] (D.M.); [email protected] (A.P.K.); [email protected] (J.H.); [email protected] (P.T.); [email protected] (M.S.) * Correspondence: [email protected] Abstract: Just after the start into the new millennium the concept for combined neutron and X-ray imaging was introduced by extending the standard configuration of the thermal neutron imaging NEUTRA instrument with a complementary 320 kV X-ray tube setup. Using essentially the same detector configuration for both neutron and X-ray imaging enables a pixel-wise (in radiography) and a voxel-wise (in tomography) correlation and combination of attenuation data. The optimal use and analyses of such complementary data sets depend on the specific investigation and research question and range from a combinatory interpretation of separately analyzed images to full data fusion approaches. Here, several examples from more than a decade of bimodal neutron and X-ray imaging at NEUTRA at PSI shall be reviewed. Keywords: thermal neutrons; X-ray; radiography; tomography; data fusion; attenuation coefficients 1. Introduction-Method and Instrumentation X-ray and neutron-transmission imaging are used for non-destructive measurements of samples originating from a broad range of application areas. Whereas X-ray imaging is well known from its medical applications, neutron imaging is more suitable for trans- mission through materials like metals or minerals. This is due to the different types of radiation–matter interactions, which for X-rays is proportional to the electron density of a material, i.e., it scales with the number of electrons in the atom, whereas the neutron interacts with the atomic nuclei. Combining both neutron and X-ray measurements of a specific sample allows for the use of the different contrast mechanisms provided by these two imaging modalities to enable enhancements of the information obtained for a sample. By implementing an X-ray source in the neutron imaging instrument NEUTRA [1], we enabled both X-ray and neutron imaging capabilities within a single facility, available for external users at the spallation neutron source SINQ of the Paul Scherrer Institute. This ar- ticle provides an overview of the facility, but in particular a retrospective of this pioneering installation and its results as a forerunner of bi-modal neutron and X-ray imaging, which is now available or planned for at many leading neutron imaging instruments worldwide, including ICON at PSI, Switzerland; NEXT at ILL Grenoble, France; nEXT at NIST, USA; ODIN at ESS, Sweden; and VENUS at ORNL, USA. Compared to the XTRA setup with its sequential approach, the before mentioned facilities prefer a simultaneous scanning with the source/detectors perpendicular to each other, viewing the sample at the same time. In these cases, the beam geometry cannot be identical, and the comparison can only be done after reconstruction of the data on the voxel level. 1.1. Neutron vs. X-ray Imaging: Physics and Cross-Section Data Both X-rays and neutrons can transmit through many objects and be recorded subse- quently by position-sensitive area detectors, providing corresponding radiographic images. This allows for non-destructive examinations of the interior of samples. Such imaging Appl. Sci. 2021, 11, 3825. https://doi.org/10.3390/app11093825 https://www.mdpi.com/journal/applsci
Transcript of The XTRA Option at the NEUTRA Facility More Than 10 Years ...

applied sciences
Review
The XTRA Option at the NEUTRA Facility—More Than10 Years of Bi-Modal Neutron and X-ray Imaging at PSI
Eberhard H. Lehmann * , David Mannes, Anders P. Kaestner , Jan Hovind, Pavel Trtik and Markus Strobl
�����������������
Citation: Lehmann, E.H.; Mannes,
D.; Kaestner, A.P.; Hovind, J.; Trtik, P.;
Strobl, M. The XTRA Option at the
NEUTRA Facility—More Than 10
Years of Bi-Modal Neutron and X-ray
Imaging at PSI. Appl. Sci. 2021, 11,
3825. https://doi.org/10.3390/
app11093825
Academic Editor: Richard Kouzes
Received: 25 March 2021
Accepted: 16 April 2021
Published: 23 April 2021
Publisher’s Note: MDPI stays neutral
with regard to jurisdictional claims in
published maps and institutional affil-
iations.
Copyright: © 2021 by the authors.
Licensee MDPI, Basel, Switzerland.
This article is an open access article
distributed under the terms and
conditions of the Creative Commons
Attribution (CC BY) license (https://
creativecommons.org/licenses/by/
4.0/).
Laboratory for Neutron Scattering and Imaging, Paul Scherrer Institut, CH-5232 Villigen, Switzerland;[email protected] (D.M.); [email protected] (A.P.K.); [email protected] (J.H.); [email protected] (P.T.);[email protected] (M.S.)* Correspondence: [email protected]
Abstract: Just after the start into the new millennium the concept for combined neutron and X-rayimaging was introduced by extending the standard configuration of the thermal neutron imagingNEUTRA instrument with a complementary 320 kV X-ray tube setup. Using essentially the samedetector configuration for both neutron and X-ray imaging enables a pixel-wise (in radiography)and a voxel-wise (in tomography) correlation and combination of attenuation data. The optimal useand analyses of such complementary data sets depend on the specific investigation and researchquestion and range from a combinatory interpretation of separately analyzed images to full datafusion approaches. Here, several examples from more than a decade of bimodal neutron and X-rayimaging at NEUTRA at PSI shall be reviewed.
Keywords: thermal neutrons; X-ray; radiography; tomography; data fusion; attenuation coefficients
1. Introduction-Method and Instrumentation
X-ray and neutron-transmission imaging are used for non-destructive measurementsof samples originating from a broad range of application areas. Whereas X-ray imagingis well known from its medical applications, neutron imaging is more suitable for trans-mission through materials like metals or minerals. This is due to the different types ofradiation–matter interactions, which for X-rays is proportional to the electron density ofa material, i.e., it scales with the number of electrons in the atom, whereas the neutroninteracts with the atomic nuclei. Combining both neutron and X-ray measurements of aspecific sample allows for the use of the different contrast mechanisms provided by thesetwo imaging modalities to enable enhancements of the information obtained for a sample.By implementing an X-ray source in the neutron imaging instrument NEUTRA [1], weenabled both X-ray and neutron imaging capabilities within a single facility, available forexternal users at the spallation neutron source SINQ of the Paul Scherrer Institute. This ar-ticle provides an overview of the facility, but in particular a retrospective of this pioneeringinstallation and its results as a forerunner of bi-modal neutron and X-ray imaging, which isnow available or planned for at many leading neutron imaging instruments worldwide,including ICON at PSI, Switzerland; NEXT at ILL Grenoble, France; nEXT at NIST, USA;ODIN at ESS, Sweden; and VENUS at ORNL, USA. Compared to the XTRA setup with itssequential approach, the before mentioned facilities prefer a simultaneous scanning withthe source/detectors perpendicular to each other, viewing the sample at the same time. Inthese cases, the beam geometry cannot be identical, and the comparison can only be doneafter reconstruction of the data on the voxel level.
1.1. Neutron vs. X-ray Imaging: Physics and Cross-Section Data
Both X-rays and neutrons can transmit through many objects and be recorded subse-quently by position-sensitive area detectors, providing corresponding radiographic images.This allows for non-destructive examinations of the interior of samples. Such imaging
Appl. Sci. 2021, 11, 3825. https://doi.org/10.3390/app11093825 https://www.mdpi.com/journal/applsci

Appl. Sci. 2021, 11, 3825 2 of 16
facilities are quite easy: the beam from the source is sent to the sample via a collimatorand the transmitted part of the beam is registered by the radiation imaging detector. To-day, most image data are obtained in a digital format, i.e., a discrete pixel data set of thespatial intensity distribution can be generated (see below). The image formation of bothtypes of radiation follows the Beer Lambert law, however, the attenuation characteristicsof both radiations are significantly different and often complementary. The energy andwavelength-dependent attenuation coefficients of neutrons and X-rays can be calculatedfrom tabulated cross sections [2,3]. Most laboratory X-ray sources are of the tube type andprovide a continuous spectrum of X-ray photons depending on the tube voltage. However,X-ray imaging is also performed at synchrotron light sources [4].
X-rays are electromagnetic radiation that mainly interacts with the electrons in theatomic shell. This leads to a distinct dependence on the atomic number Z. The moreelectrons there are in a chemical element, the stronger it interacts with the X-ray radia-tion. Therefore, X-rays do not easily penetrate metals while biological materials, mainlyconsisting of hydrogen and carbon, are quite transparent.
Neutrons, on the other hand, are charge-free particles existing in the atomic nucleitogether with the protons. Free neutrons result from nuclear reactions, e.g., fission of heavynuclei like uranium or plutonium or from bombarding of heavy nuclei, e.g., lead, with ahighly energetic proton beam, inducing spallation. Neutron imaging needs quite powerfulneutron sources, i.e., a fission research reactor like FRM-2 in Munich [5], a spallationneutron source like SINQ [6], or the European Spallation Source, to reach the neutronflux required for acquiring single images within a few seconds and with sufficiently highspatial resolution, comparable to that of an X-ray tube. The energy range most useful forneutron imaging and scattering investigations is in the range of thermal (25 meV) and coldneutrons (<25 meV). At these energies, neutrons have favorable properties to interact withcondensed matter, e.g., due to wavelengths (according to de Broglie‘s relation) of a fewÅngstrom-matching interatomic distances.
In addition, at such energies they have a high probability to be captured by relevantisotopes such as 3He, 10B, 6Li, and 157Gd, which thereby produce charged particles inducing,for example, light emissions in scintillator materials. Thus, the detection efficiency isparticularly high in this spectral range.
In contrast to X-rays, neutrons, which carry no charge, interact with the atomicnuclei and thus there is no systematic dependence of cross sections on the atomic number.There are even strong variations in neutron–matter interactions depending on the isotopeconsidered, e.g., 1H and 2D, 6Li and 7Li, or 10B and 11B. Even high Z materials like leador uranium are transmitted relatively well, whereas hydrogen has a high scattering crosssection for thermal and cold neutrons. Therefore, combining X-ray and neutron imaging ina dual modality setup allows for the use of their complementary contrast mechanisms for abetter understanding of the hidden structures of samples subject to radiographic inspection.
This is underlined by the example in Figure 1 with the same image quality and spatialresolution but very different contrasts for the involved components and structures. Howfar the involved attenuation properties can deviate for X-rays and neutrons is exemplifiedby the data in Table 1.

Appl. Sci. 2021, 11, 3825 3 of 16Appl. Sci. 2021, 11, x FOR PEER REVIEW 3 of 16
(a) (b)
Figure 1. Demonstration of the different attenuation behavior of thermal neutrons (a) and X-rays at 150 keV (b) for the
case of a hard-disk drive (data taken at PSI`s facilities).
Table 1. Linear radiation attenuation coefficients of selected materials for X-rays (at 150 kV) and
thermal neutrons (averaged Maxwellian spectrum around 25 meV) [2,3].
Material 150 keV X-ray (cm−1) Thermal Neutrons (cm−1)
Wood 0.1 1.1
Iron 1.5 1.2
Tin 4.8 0.21
Lead 22.81 0.38 Boron 0.28 102
1.2. Standard Configuration of the NEUTRA Facility
NEUTRA [1] is the thermal neutron imaging instrument at the spallation neutron
source SINQ [6] of the Paul Scherrer Institute (PSI) in Switzerland. It provides neutron
radiography and tomography options of medium to large size objects (a few mm up to
35 cm) using a thermal neutron spectrum. The instrument has been operational since the
late 1990s and was the first dedicated neutron imaging instrument at PSI, established to-
gether with the spallation source (Figure 2a). It has seen more than 20 years of interna-
tional scientific and industrial user service. For nearly 15 years, the special feature of a
320 kV X-ray tube has been available at NEUTRA, allowing bi-modal imaging with iden-
tical imaging geometry, enabling straight forward registration of X-ray and neutron da-
tasets.
NEUTRA consists of evacuated neutron flight-tubes downstream of a 20 mm diame-
ter pinhole and is viewed in SINQ’s D2O moderator tank. NEUTRA features three meas-
urement positions to trade flux versus resolution. These positions are at distances of 3.8 m
(position 1), 7.3 m (position 2), and 10.5 m (position 3) from the collimating pinhole. They
provide collimation ratios from 200 to 550, with about an order of magnitude difference
in available flux and maximum beam cross sections from 10 × 10 to 35 × 35 cm2. Position 1
is tightly enclosed by shielding walls and can be assessed only from the top. In this posi-
tion (position 1) the optional 320 kV X-ray source has been installed and can be moved
remotely into the operating position in the neutron beam axis (Figure 2b). The standard
detectors utilized at NEUTRA consist of a scintillator screen, light optics, and a digital
camera system [7]. Scintillator screens and cameras, as well as the detector systems are
easily exchangeable and enable straightforward adaptations to each individual use case.
Figure 1. Demonstration of the different attenuation behavior of thermal neutrons (a) and X-rays at 150 keV (b) for the caseof a hard-disk drive (data taken at PSI‘s facilities).
Table 1. Linear radiation attenuation coefficients of selected materials for X-rays (at 150 kV) andthermal neutrons (averaged Maxwellian spectrum around 25 meV) [2,3].
Material 150 keV X-ray (cm−1) Thermal Neutrons (cm−1)
Wood 0.1 1.1Iron 1.5 1.2Tin 4.8 0.21
Lead 22.81 0.38Boron 0.28 102
1.2. Standard Configuration of the NEUTRA Facility
NEUTRA [1] is the thermal neutron imaging instrument at the spallation neutronsource SINQ [6] of the Paul Scherrer Institute (PSI) in Switzerland. It provides neutronradiography and tomography options of medium to large size objects (a few mm up to35 cm) using a thermal neutron spectrum. The instrument has been operational since thelate 1990s and was the first dedicated neutron imaging instrument at PSI, established to-gether with the spallation source (Figure 2a). It has seen more than 20 years of internationalscientific and industrial user service. For nearly 15 years, the special feature of a 320 kVX-ray tube has been available at NEUTRA, allowing bi-modal imaging with identicalimaging geometry, enabling straight forward registration of X-ray and neutron datasets.
NEUTRA consists of evacuated neutron flight-tubes downstream of a 20 mm diameterpinhole and is viewed in SINQ’s D2O moderator tank. NEUTRA features three measure-ment positions to trade flux versus resolution. These positions are at distances of 3.8 m(position 1), 7.3 m (position 2), and 10.5 m (position 3) from the collimating pinhole. Theyprovide collimation ratios from 200 to 550, with about an order of magnitude difference inavailable flux and maximum beam cross sections from 10 × 10 to 35 × 35 cm2. Position1 is tightly enclosed by shielding walls and can be assessed only from the top. In thisposition (position 1) the optional 320 kV X-ray source has been installed and can be movedremotely into the operating position in the neutron beam axis (Figure 2b). The standarddetectors utilized at NEUTRA consist of a scintillator screen, light optics, and a digitalcamera system [7]. Scintillator screens and cameras, as well as the detector systems areeasily exchangeable and enable straightforward adaptations to each individual use case.

Appl. Sci. 2021, 11, 3825 4 of 16Appl. Sci. 2021, 11, x FOR PEER REVIEW 4 of 16
(a)
(b)
Figure 2. (a) Original standard configuration of NEUTRA using the thermal beam from the SINQ
D2O moderator; (b) NEUTRA layout with X-ray tube at Position 1 in operating position; (shielding
removed in images to enable visibility); the beams come from the right-hand side in this drawing.
The length of the shown outer collimator is on the order of 10 m.
1.3. Properties of the X-ray Setup XTRA
An X-ray tube, GE ISOVOLT-Titan 320, can be positioned in the beam path of NEU-
TRA at position 1 close to the SINQ target block wall, thereby providing an almost iden-
tical imaging geometry for neutrons and X-rays. The tube features a tungsten target with
two focus spot sizes of either 3 mm or 5.5 mm diameter.
The X-ray tube is mounted on a linear stage, which allows remote controlled posi-
tioning of the X-ray source spot in the center of the beam path. For this purpose, one has
to remove the first section of the evacuated collimator pipe. A special scintillator-changing
box that allows switching between a neutron and X-ray scintillator screen has been built
for the detector at position 2 (Figure 3). The corresponding beam collimations for neutrons
and X-rays are provided in Table 2 alongside the corresponding geometrical parameters.
The initial beam aperture for the neutrons D is about a factor 4 to 7 times larger than the
X-ray source spot size P. The collimation length L differs in favor of the neutrons because
the neutron aperture is inside the target block close to the moderator tank while the X-ray
tube has to be positioned in the flight path downstream of the source shielding (see Figure
2b). Thus, the maximum discrepancy in collimation is about 4, the minimum <2, in all
cases in favor of the X-ray collimation due to the small spot size as compared to D. How-
ever, in general, the resolution is not limited by the beam divergence but only by the in-
herent properties of the detector systems used. Therefore, the resulting spatial resolutions
of the neutron and X-ray imaging systems in NEUTRA are on par with each other.
Table 2. Beam formation conditions for the neutron and X-ray setups.
Neutron Setup X-ray Setup
Aperture D (mm) 20
Focal spot (mm) P 3 5.5
Position 2 distance L (m) 7.29 3.29 3.29
Figure 2. (a) Original standard configuration of NEUTRA using the thermal beam from the SINQD2O moderator; (b) NEUTRA layout with X-ray tube at Position 1 in operating position; (shieldingremoved in images to enable visibility); the beams come from the right-hand side in this drawing.The length of the shown outer collimator is on the order of 10 m.
1.3. Properties of the X-ray Setup XTRA
An X-ray tube, GE ISOVOLT-Titan 320, can be positioned in the beam path of NEUTRAat position 1 close to the SINQ target block wall, thereby providing an almost identicalimaging geometry for neutrons and X-rays. The tube features a tungsten target with twofocus spot sizes of either 3 mm or 5.5 mm diameter.
The X-ray tube is mounted on a linear stage, which allows remote controlled position-ing of the X-ray source spot in the center of the beam path. For this purpose, one has toremove the first section of the evacuated collimator pipe. A special scintillator-changingbox that allows switching between a neutron and X-ray scintillator screen has been built forthe detector at position 2 (Figure 3). The corresponding beam collimations for neutrons andX-rays are provided in Table 2 alongside the corresponding geometrical parameters. Theinitial beam aperture for the neutrons D is about a factor 4 to 7 times larger than the X-raysource spot size P. The collimation length L differs in favor of the neutrons because theneutron aperture is inside the target block close to the moderator tank while the X-ray tubehas to be positioned in the flight path downstream of the source shielding (see Figure 2b).Thus, the maximum discrepancy in collimation is about 4, the minimum <2, in all casesin favor of the X-ray collimation due to the small spot size as compared to D. However,in general, the resolution is not limited by the beam divergence but only by the inherentproperties of the detector systems used. Therefore, the resulting spatial resolutions of theneutron and X-ray imaging systems in NEUTRA are on par with each other.

Appl. Sci. 2021, 11, 3825 5 of 16
Appl. Sci. 2021, 11, x FOR PEER REVIEW 5 of 16
L/D 350 1096 598
Position 3 distance L (m) 10.55 6.90 6.90
L/D 550 2301 1255
1.4. Detector Features at NEUTRA and Modifications for the XTRA Option
The most sensitive scintillator screen for thermal neutrons with respect to the light
emission is based on 6Li in conjunction with ZnS. This combination has been in use since
the early application of digital detectors [7], but it has been optimized continuously. Lay-
ers between 0.05 and 0.3 mm can be produced where light output and spatial resolution
are in competition [8]. For X-ray detection, calcium tungstate CaWO4 or gadolinium oxy-
sulfide Gd2O2S screens are commonly in use. The layer thickness is about 0.1 mm. In
principle, gadolinium oxysulfide is sensitive to neutrons too due to the high capture prob-
ability by Gd. However, its light emission is much less than that provided by 6Li/ZnS
screens. The neutron and X-ray interaction with the scintillator screen generates charged
particles that induce light emission in the phosphors to be registered by camera-based
detection systems. Cameras are currently the most common type of acquisition systems
due to the high sensitivity, linearity, dynamic range, and signal-to-noise ratio. In addition
to a detector setup at position 2 for medium sample sizes, another detector system is op-
erational at position 3 for the larger field of view (35 cm), in this case, however, without a
remotely controlled scintillator exchanger.
Front view Back view
Figure 3. Pneumatic scintillator exchange setup at position 2.
2. Data Interpretation and Data Fusion
The transmission image obtained by neutrons and by X-rays can be described by the
Beer–Lambert law
𝐼(𝑦, 𝑧) = 𝐼0(𝑦, 𝑧) ∙ 𝑒− ∫ 𝐴∙𝑑𝑥𝑑
0 (1)
For a homogenous material of the thickness d in beam direction x this is
𝐼(𝑦, 𝑧) = 𝐼0 (𝑦, 𝑧) ∙ 𝑒−𝐴 ∙𝑑 (2)
where I0 is the incident intensity, which can be measured without a sample in the beam,
while I is the transmitted intensity. The incident beam is attenuated exponentially de-
pending on the linear attenuation coefficient A of the material in the beam and the thick-
ness d of the material layer, which enters the equation through the integral along the flight
path in the x-direction.
Figure 3. Pneumatic scintillator exchange setup at position 2.
Table 2. Beam formation conditions for the neutron and X-ray setups.
Neutron Setup X-ray Setup
Aperture D (mm) 20Focal spot (mm) P 3 5.5
Position 2 distance L (m) 7.29 3.29 3.29L/D 350 1096 598
Position 3 distance L (m) 10.55 6.90 6.90L/D 550 2301 1255
1.4. Detector Features at NEUTRA and Modifications for the XTRA Option
The most sensitive scintillator screen for thermal neutrons with respect to the lightemission is based on 6Li in conjunction with ZnS. This combination has been in use sincethe early application of digital detectors [7], but it has been optimized continuously. Layersbetween 0.05 and 0.3 mm can be produced where light output and spatial resolution are incompetition [8]. For X-ray detection, calcium tungstate CaWO4 or gadolinium oxysulfideGd2O2S screens are commonly in use. The layer thickness is about 0.1 mm. In principle,gadolinium oxysulfide is sensitive to neutrons too due to the high capture probabilityby Gd. However, its light emission is much less than that provided by 6Li/ZnS screens.The neutron and X-ray interaction with the scintillator screen generates charged particlesthat induce light emission in the phosphors to be registered by camera-based detectionsystems. Cameras are currently the most common type of acquisition systems due to thehigh sensitivity, linearity, dynamic range, and signal-to-noise ratio. In addition to a detectorsetup at position 2 for medium sample sizes, another detector system is operational atposition 3 for the larger field of view (35 cm), in this case, however, without a remotelycontrolled scintillator exchanger.
2. Data Interpretation and Data Fusion
The transmission image obtained by neutrons and by X-rays can be described by theBeer–Lambert law
I(y, z) = I0(y, z)·e−∫ d
0 A·dx (1)
For a homogenous material of the thickness d in beam direction x this is
I(y, z) = I0 (y, z)· e−A ·d (2)
where I0 is the incident intensity, which can be measured without a sample in the beam,while I is the transmitted intensity. The incident beam is attenuated exponentially depend-ing on the linear attenuation coefficient A of the material in the beam and the thickness d of

Appl. Sci. 2021, 11, 3825 6 of 16
the material layer, which enters the equation through the integral along the flight path inthe x-direction.
The difference between neutron and X-ray attenuation is solely reflected by the spe-cific linear attenuation coefficients, which we here denote as ∑ and µ, respectively. Asoutlined earlier, both the neutron and X-ray linear attenuation coefficients are highly energydependent. The linear attenuation coefficient ∑ is related to the tabulated total microscopiccross sections σ (absorption and scattering) [2,3] through the number density N of atomsper cm3 by ∑ = N*σ and, thus, has the unit of a reciprocal length (cm−1). For compositematerials (with i as the index of the specific material) it is
Σ = ∑i
Ni·σi (3)
In the case of X-rays, there are no tabulated microscopic cross sections available.The database is directly in the unit cm−1 or even as “mass-attenuation coefficient µ/ρ”in cm2/g, with the density ρ [3].
The transmission T refers to the exponential term of the Beer–Lambert law (Equation (2)) as
T =II0
= e−A·d (4)
From this it becomes obvious that for a single transmission image, only the∫ d
0 A·dxcan be retrieved without a priori knowledge about material phases and thickness of thesample. Through tomography, which requires a number of projection images to be takenon, e.g., a range of 180◦, the local attenuation coefficient A(x,y,z) can be retrieved with thecorresponding spatial resolution of a specific measurement and the reconstructed discretevoxels according to Ai,j,k [9].
Using the XTRA setup, two individual data sets, Tθ,i,j, where θ refers to the projectionangle, and tomographic reconstructions of ∑i,j,k and µi,j,k can be obtained. Both data sets (Tnand Tx) and tomograms (∑i,j,k and µi,j,k) can be correlated in the best case pixel, voxel-wise.Different strategies to combine the data, depending on the aim of a specific investigation,can be applied.
A. Combination of final analyses results
In many cases, neutrons and X-rays will provide different images of the very sameobject due to the different contrast behaviors. Thus, different material phases will be betterresolved in one or the other reconstructed volume. Therefore, the structure and specificfeatures of these material phases are analyzed in the respective reconstructed volume whereit is best resolved. For example, the porosity found in one material by one modality togetherwith the cracks found with the other modality in another phase provide a more completepicture of the specimen than any single modality would have been able to provide. Theadded value of the combined instrumentation in NEUTRA is that the found features canbe directly correlated spatially and, to stay in the given example, a correlation of porosityin one material and cracking in another might be identified and constitute synergeticadded value and information content. Today, this approach is extensively applied toinvestigations of liquid, in particular water, uptake in materials, which are better resolvedby X-rays [10]. Another prominent example is battery research, where X-rays resolve thestructural components and only neutrons are sensitive to the Li exchange process [11].
B. Combined analyses of separate data-sets
Another approach to the data analyses, which was developed subsequently, involvescorrelated analyses of both data sets, as represented in bivariate histograms, and corre-sponding combined segmentation. Often, this colocation analysis requires a registrationoperation to align the two data sets. At NEUTRA, this is less important due to the use ofthe same beam geometry and thus the projections are already aligned through the setup.There are cases when the sample has been displaced between the acquisitions. In these

Appl. Sci. 2021, 11, 3825 7 of 16
cases, the registration is mostly done using commercial software such as VG Studio MAX.This enables, in many cases, the identification of specific material phases due to their com-plementary contrast behavior and specific combinations of neutron and X-ray attenuation(Figure 4) [12,13]. Specifically, in [12] the registration was done using a combination ofcommercially available and custom-developed Monte Carlo-based algorithms.
Appl. Sci. 2021, 11, x FOR PEER REVIEW 7 of 16
cases, the registration is mostly done using commercial software such as VG Studio MAX.
This enables, in many cases, the identification of specific material phases due to their com-
plementary contrast behavior and specific combinations of neutron and X-ray attenuation
(Figure 4) [12,13]. Specifically, in [12] the registration was done using a combination of
commercially available and custom-developed Monte Carlo-based algorithms.
C. Analyses of combined data sets
The most advanced approach consists in the attempt to correlate data before or dur-
ing reconstruction. One example is to use X-ray data with a high signal-to-noise ratio and
higher resolution to improve the quality of the reconstructed neutron data. The concept
of using structural priors provided by reconstructed X-ray data to improve the quality of
the reconstructed neutron data was demonstrated by [14]
Figure 4. Bivariate histogram of corroded nails identifying different phases present (a); photo-
graph (b); neutron (c), X-ray (d), and bivariate image (e); (image reprinted from ref. [12]).
Visualization of bi-modal tomographic data is another challenge not only for data
presentation but also for inspection and understanding. For efficient visualization, differ-
ent strategies are known and applied. These include but are not limited to the following:
(i) Visualization based on color coding using the measured intensity of the modalities
directly based on different color models and opacity:
a. Let each contrast modality control a color channel in an RGB image [13] (Figure
4).The remaining color channel is usually the average of the two modalities;
b. Let one contrast modality index a color map while the brightness is controlled by
the other modality;
c. Interpret the images as orthogonal vectors, and the computed length of the vector
sum and angle between the sum and an image will indicate which is more intense com-
pared to the HSV color model.
(ii) Visualization based on segmentation:
a. Attribute defined colors to regions segmented using the bivariate histogram of the
two modalities (Figure 4e) [12];
b. Utilize one modality to segment a region, while the content of it is visualized by
the second modality (examples: Zuger sword, battery).
3. Examples of Applications
The neutron investigations at NEUTRA that were combined with X-ray imaging in-
vestigations of the same objects elsewhere were reported rather early [15] and provided
justification for the installation of the XTRA X-ray source at the NEUTRA beamline.
Over the years, a wealth of studies has been performed bi-modally at NEUTRA, of
which a few seminal examples of different research areas shall be discussed retrospec-
tively, highlighting the pioneering character of this installation.
Figure 4. Bivariate histogram of corroded nails identifying different phases present (a); photograph (b); neutron (c), X-ray(d), and bivariate image (e); (image reprinted from ref. [12]).
C. Analyses of combined data sets
The most advanced approach consists in the attempt to correlate data before or duringreconstruction. One example is to use X-ray data with a high signal-to-noise ratio andhigher resolution to improve the quality of the reconstructed neutron data. The concept ofusing structural priors provided by reconstructed X-ray data to improve the quality of thereconstructed neutron data was demonstrated by [14].
Visualization of bi-modal tomographic data is another challenge not only for datapresentation but also for inspection and understanding. For efficient visualization, differentstrategies are known and applied. These include but are not limited to the following:
(i) Visualization based on color coding using the measured intensity of the modalitiesdirectly based on different color models and opacity:
a. Let each contrast modality control a color channel in an RGB image [13] (Figure 4).The remaining color channel is usually the average of the two modalities;
b. Let one contrast modality index a color map while the brightness is controlledby the other modality;
c. Interpret the images as orthogonal vectors, and the computed length of thevector sum and angle between the sum and an image will indicate which ismore intense compared to the HSV color model.
(ii) Visualization based on segmentation:
a. Attribute defined colors to regions segmented using the bivariate histogram ofthe two modalities (Figure 4e) [12];
b. Utilize one modality to segment a region, while the content of it is visualizedby the second modality (examples: Zuger sword, battery).
3. Examples of Applications
The neutron investigations at NEUTRA that were combined with X-ray imaginginvestigations of the same objects elsewhere were reported rather early [15] and providedjustification for the installation of the XTRA X-ray source at the NEUTRA beamline.

Appl. Sci. 2021, 11, 3825 8 of 16
Over the years, a wealth of studies has been performed bi-modally at NEUTRA, ofwhich a few seminal examples of different research areas shall be discussed retrospectively,highlighting the pioneering character of this installation.
3.1. The Sword from Oberwil
In September 2010 a sword was retrieved near the village of Oberwil from the groundof the lake of Zug.
Presumably it has been lying there for more than 450 years. The highly ornamentedhilt with detailed wood carvings and a multitude of decorative metal inlays indicates thatthis weapon was already very exclusive at the time it was made and was mainly intendedas a showpiece. Nevertheless, signs of wear on the hilt and marks on the blade indicatethat it had been in regular use. More detailed information on the history and conservationtreatment of the sword can be found in [16,17].
The aim of the combined neutron/X-ray tomography investigation [18] was to learnmore about its making and the condition after the conservation treatment. The X-ray/neutrontomography combination proved especially beneficial due to its complementarity with regardsto the metal and organic parts. While X-rays showed high transmission through the woodenparts of the sword hilt, the multitude of small decorative inlays and nails yielded very highcontrast. Neutron tomography allowed good penetration of the iron-based blade and showedhigh contrast for the wooden parts (Figure 5). Information on the wood structure cannot beretrieved from the X-ray data. This is due to the low attenuation of wood and thus the lowcontrast and the concurrent high attenuation of the very large number of small decorativemetal nails and inlays covering the entire hilt. From XRF (X-ray fluorescence) analyses, whichare reported in [17], it is known that the small metallic inlays consist of tin amalgam. Thepresence of tin and mercury results in very high X-ray attenuation coefficients for thesesmall decorations, yielding strong artefacts in the reconstructed tomography data set. Whileit is still possible to obtain information on the distribution of the metallic decorations, itis practically impossible to retrieve details from the wood structure as the reconstructionartefacts from the tin amalgam superimpose this information. The metal of the blade itself,which consists to the greatest part of iron, does not show these difficulties. The result of theneutron tomography proves complementary to these X-ray data. The metallic decorationson the grips are practically invisible, while the wood shows a very high contrast. While it isnot possible to obtain much information on the decorations, the structure in the wood canbe analyzed. It shows that different wood species were used for the construction. Whilethe visible parts of the grip and the guard are made of box wood (Buxus sempervirens), thesmall plate used in the pommel as an interlock appears to consist of softwood (cf. Figure 6b).The neutron data also reveals information on the actual mounting of the different parts ofthe grip; between the tang and grip, thin plates of softwood have been inserted preventingthe grip from moving (cf. Figure 6c). It furthermore appears that part of the knots, whichare used as decorative elements, are not natural but seem to have been added artificially.This can be seen in the characteristics of the wood structure, i.e., the tree ring borders, whichnaturally converge towards knots containing a nail as a decorative element (cf. Figure 6d).This behavior is not visible for all apparent knots, which implies that some are not naturallygrown, but artificially added for symmetry reasons.
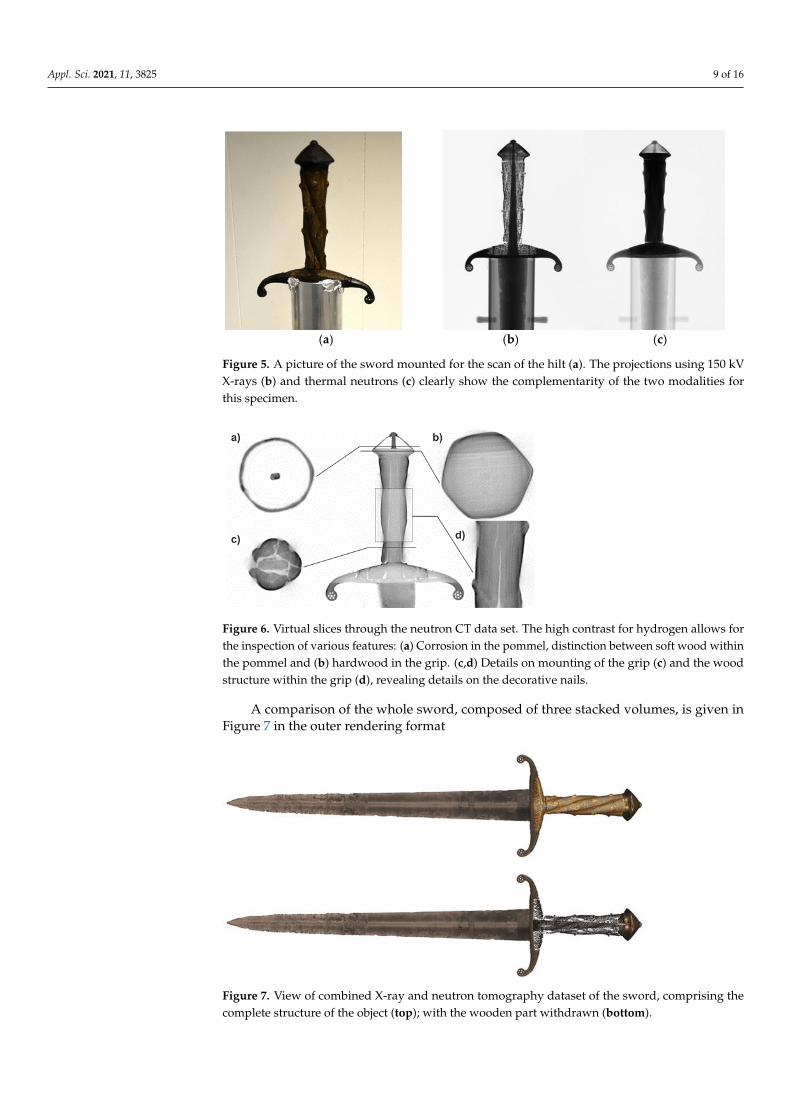
Appl. Sci. 2021, 11, 3825 9 of 16Appl. Sci. 2021, 11, x FOR PEER REVIEW 9 of 16
(a) (b) (c)
Figure 5. A picture of the sword mounted for the scan of the hilt (a). The projections using 150 kV X-rays (b) and thermal
neutrons (c) clearly show the complementarity of the two modalities for this specimen.
Figure 6. Virtual slices through the neutron CT data set. The high contrast for hydrogen allows for
the inspection of various features: (a) Corrosion in the pommel, distinction between soft wood
within the pommel and (b) hardwood in the grip. (c,d) Details on mounting of the grip (c) and the
wood structure within the grip (d), revealing details on the decorative nails.
Figure 7. View of combined X-ray and neutron tomography dataset of the sword, comprising the
complete structure of the object (top); with the wooden part withdrawn (bottom).
3.2. Crucible Fragments from Augusta Raurica
Augusta Raurica was a Roman settlement in Northern Switzerland on the south bank
of the Rhine river. The settlement played an important role as an administrative, cultural,
Figure 5. A picture of the sword mounted for the scan of the hilt (a). The projections using 150 kVX-rays (b) and thermal neutrons (c) clearly show the complementarity of the two modalities forthis specimen.
Appl. Sci. 2021, 11, x FOR PEER REVIEW 9 of 16
(a) (b) (c)
Figure 5. A picture of the sword mounted for the scan of the hilt (a). The projections using 150 kV X-rays (b) and thermal
neutrons (c) clearly show the complementarity of the two modalities for this specimen.
Figure 6. Virtual slices through the neutron CT data set. The high contrast for hydrogen allows for
the inspection of various features: (a) Corrosion in the pommel, distinction between soft wood
within the pommel and (b) hardwood in the grip. (c,d) Details on mounting of the grip (c) and the
wood structure within the grip (d), revealing details on the decorative nails.
Figure 7. View of combined X-ray and neutron tomography dataset of the sword, comprising the
complete structure of the object (top); with the wooden part withdrawn (bottom).
3.2. Crucible Fragments from Augusta Raurica
Augusta Raurica was a Roman settlement in Northern Switzerland on the south bank
of the Rhine river. The settlement played an important role as an administrative, cultural,
Figure 6. Virtual slices through the neutron CT data set. The high contrast for hydrogen allows forthe inspection of various features: (a) Corrosion in the pommel, distinction between soft wood withinthe pommel and (b) hardwood in the grip. (c,d) Details on mounting of the grip (c) and the woodstructure within the grip (d), revealing details on the decorative nails.
A comparison of the whole sword, composed of three stacked volumes, is given inFigure 7 in the outer rendering format
Appl. Sci. 2021, 11, x FOR PEER REVIEW 9 of 16
(a) (b) (c)
Figure 5. A picture of the sword mounted for the scan of the hilt (a). The projections using 150 kV X-rays (b) and thermal
neutrons (c) clearly show the complementarity of the two modalities for this specimen.
Figure 6. Virtual slices through the neutron CT data set. The high contrast for hydrogen allows for
the inspection of various features: (a) Corrosion in the pommel, distinction between soft wood
within the pommel and (b) hardwood in the grip. (c,d) Details on mounting of the grip (c) and the
wood structure within the grip (d), revealing details on the decorative nails.
Figure 7. View of combined X-ray and neutron tomography dataset of the sword, comprising the
complete structure of the object (top); with the wooden part withdrawn (bottom).
3.2. Crucible Fragments from Augusta Raurica
Augusta Raurica was a Roman settlement in Northern Switzerland on the south bank
of the Rhine river. The settlement played an important role as an administrative, cultural,
Figure 7. View of combined X-ray and neutron tomography dataset of the sword, comprising thecomplete structure of the object (top); with the wooden part withdrawn (bottom).

Appl. Sci. 2021, 11, 3825 10 of 16
3.2. Crucible Fragments from Augusta Raurica
Augusta Raurica was a Roman settlement in Northern Switzerland on the south bankof the Rhine river. The settlement played an important role as an administrative, cultural,commercial, and industrial center in the region. Due to the relatively intact nature of thesite, many important finds have been made, such as the silver treasure of Augusta Raurica.In addition to such spectacular finds, the houses and workshops of the common peopleplay a very important role for the understanding of the daily life in such Roman settlements.Metal working and especially bronze casting is of particular interest for the archaeologistsas a couple of workshops have been found in good condition. The researchers hope togather more information on the technologies used for the production of metal objectsduring this period. One aspect of the whole process is the melting of the metal in meltingpots or crucibles. The Roman craftsmen used different types of crucibles, with severallayers of differing materials.
The goal of the presented investigation was to evaluate the structure and build-up ofseveral crucible fragments, all found during excavations in Augusta Raurica [19].
By means of the XTRA setup at NEUTRA we performed sequential tomography runswith thermal neutrons and 150 kV X-rays. The results are shown in Figure 8 as verticalslices through the stack of ceramic shards. The grey levels are scaled to provide matchingdistributions within the bulk ceramic zones. This scaling allows a comparison between thetwo data sets and the respective deviations from the grey level of the ceramic zones. BothX-ray CT and neutron CT reveal regions that show a bright contrast, but the origin mightbe different: for neutrons these bright regions originate from organic components withtheir high hydrogen content, while for X-rays these bright regions are related to enclosureswith higher density, such as metals.
Appl. Sci. 2021, 11, x FOR PEER REVIEW 10 of 16
commercial, and industrial center in the region. Due to the relatively intact nature of the
site, many important finds have been made, such as the silver treasure of Augusta Rau-
rica. In addition to such spectacular finds, the houses and workshops of the common peo-
ple play a very important role for the understanding of the daily life in such Roman set-
tlements. Metal working and especially bronze casting is of particular interest for the ar-
chaeologists as a couple of workshops have been found in good condition. The researchers
hope to gather more information on the technologies used for the production of metal
objects during this period. One aspect of the whole process is the melting of the metal in
melting pots or crucibles. The Roman craftsmen used different types of crucibles, with
several layers of differing materials.
The goal of the presented investigation was to evaluate the structure and build-up of
several crucible fragments, all found during excavations in Augusta Raurica [19].
By means of the XTRA setup at NEUTRA we performed sequential tomography runs
with thermal neutrons and 150 kV X-rays. The results are shown in Figure 8 as vertical
slices through the stack of ceramic shards. The grey levels are scaled to provide matching
distributions within the bulk ceramic zones. This scaling allows a comparison between
the two data sets and the respective deviations from the grey level of the ceramic zones.
Both X-ray CT and neutron CT reveal regions that show a bright contrast, but the origin
might be different: for neutrons these bright regions originate from organic components
with their high hydrogen content, while for X-rays these bright regions are related to en-
closures with higher density, such as metals.
The neutron and X-ray data are combined using color channel coding, Figure 8
(right), providing a qualitative overview of the material composition in the shards, indi-
cating organic materials as intense green and metals as red/orange on a background of
green/brown, representing the mineral phases of the clay in the ceramic structures.
Figure 8. Cont.

Appl. Sci. 2021, 11, 3825 11 of 16Appl. Sci. 2021, 11, x FOR PEER REVIEW 11 of 16
Figure 8. Results of tomography studies with neutrons and X-rays of the ceramic samples from Augusta Raurica contain-
ing both metallic and organic remains at different positions of the samples: above—virtual slices; below—3D view on the
material distribution.
3.3. Investigations of Construction Materials
The investigations of water uptake/transport in concrete and cement-based materials
are one of the oldest and still also the most frequent [20] applications of transmission neu-
tron imaging. The addition of the X-ray imaging modality allows for a significant exten-
sion of such investigations. One of our first applications of bi-modal N/X imaging focused
on the investigation of the inner structure of fiber-reinforced concrete [21], which allowed
for the segmentation of aggregates and air voids from the neutron tomographic dataset,
while the distribution of fiber reinforcement (0.1 mm stainless steel fibers) was based on
the corresponding X-ray tomography (see Figure 9).
Note that the spatial resolution of the neutron images in [21] was more than an order
of magnitude worse than it is today, and thus X-ray tomography provided better resolu-
tion of the steel fiber network.
Figure 9. Tomography data of a steel reinforced concrete sample (left) (3 cm × 3 cm × 15 cm) ob-
tained with X-rays (middle) and thermal neutrons (right).
Figure 8. Results of tomography studies with neutrons and X-rays of the ceramic samples from Augusta Raurica containingboth metallic and organic remains at different positions of the samples: above—virtual slices; below—3D view on thematerial distribution.
The neutron and X-ray data are combined using color channel coding, Figure 8 (right),providing a qualitative overview of the material composition in the shards, indicating or-ganic materials as intense green and metals as red/orange on a background of green/brown,representing the mineral phases of the clay in the ceramic structures.
3.3. Investigations of Construction Materials
The investigations of water uptake/transport in concrete and cement-based materialsare one of the oldest and still also the most frequent [20] applications of transmissionneutron imaging. The addition of the X-ray imaging modality allows for a significantextension of such investigations. One of our first applications of bi-modal N/X imagingfocused on the investigation of the inner structure of fiber-reinforced concrete [21], whichallowed for the segmentation of aggregates and air voids from the neutron tomographicdataset, while the distribution of fiber reinforcement (0.1 mm stainless steel fibers) wasbased on the corresponding X-ray tomography (see Figure 9).
Appl. Sci. 2021, 11, x FOR PEER REVIEW 11 of 16
Figure 8. Results of tomography studies with neutrons and X-rays of the ceramic samples from Augusta Raurica contain-
ing both metallic and organic remains at different positions of the samples: above—virtual slices; below—3D view on the
material distribution.
3.3. Investigations of Construction Materials
The investigations of water uptake/transport in concrete and cement-based materials
are one of the oldest and still also the most frequent [20] applications of transmission neu-
tron imaging. The addition of the X-ray imaging modality allows for a significant exten-
sion of such investigations. One of our first applications of bi-modal N/X imaging focused
on the investigation of the inner structure of fiber-reinforced concrete [21], which allowed
for the segmentation of aggregates and air voids from the neutron tomographic dataset,
while the distribution of fiber reinforcement (0.1 mm stainless steel fibers) was based on
the corresponding X-ray tomography (see Figure 9).
Note that the spatial resolution of the neutron images in [21] was more than an order
of magnitude worse than it is today, and thus X-ray tomography provided better resolu-
tion of the steel fiber network.
Figure 9. Tomography data of a steel reinforced concrete sample (left) (3 cm × 3 cm × 15 cm) ob-
tained with X-rays (middle) and thermal neutrons (right).
Figure 9. Tomography data of a steel reinforced concrete sample (left) (3 cm × 3 cm × 15 cm)obtained with X-rays (middle) and thermal neutrons (right).
Appl. Sci. 2021, 11, 3825 12 of 16
Note that the spatial resolution of the neutron images in [21] was more than an orderof magnitude worse than it is today, and thus X-ray tomography provided better resolutionof the steel fiber network.
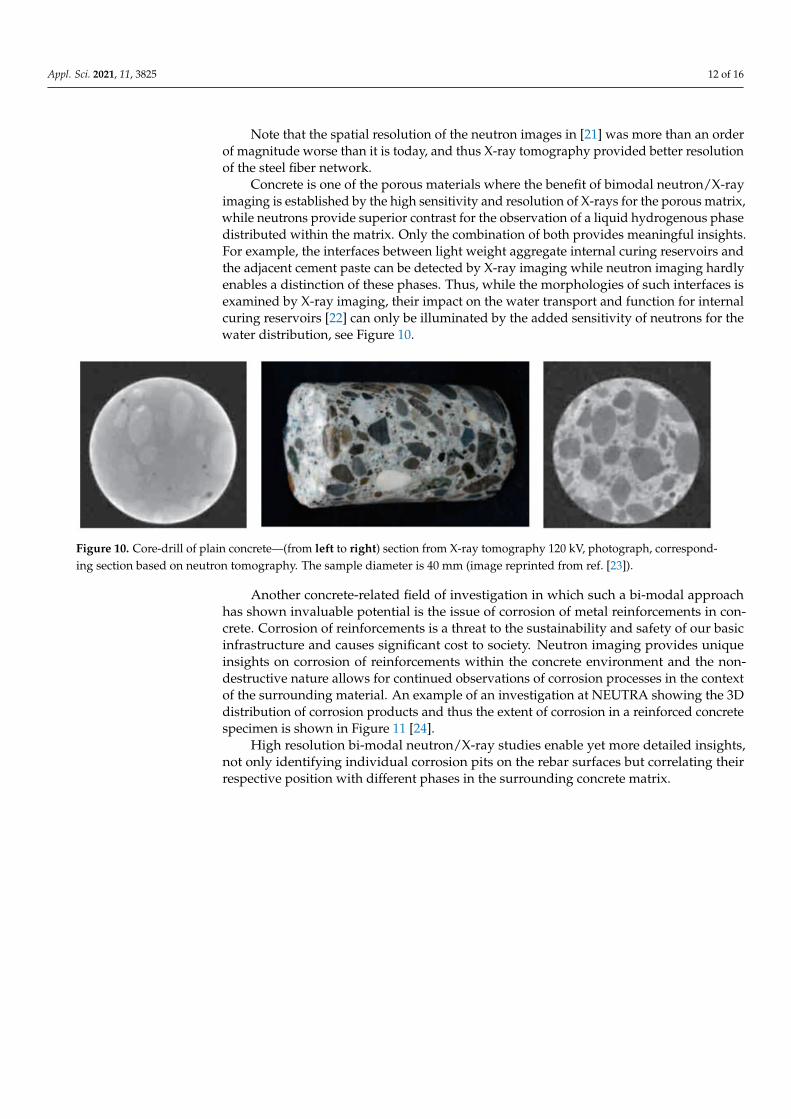
Concrete is one of the porous materials where the benefit of bimodal neutron/X-rayimaging is established by the high sensitivity and resolution of X-rays for the porous matrix,while neutrons provide superior contrast for the observation of a liquid hydrogenous phasedistributed within the matrix. Only the combination of both provides meaningful insights.For example, the interfaces between light weight aggregate internal curing reservoirs andthe adjacent cement paste can be detected by X-ray imaging while neutron imaging hardlyenables a distinction of these phases. Thus, while the morphologies of such interfaces isexamined by X-ray imaging, their impact on the water transport and function for internalcuring reservoirs [22] can only be illuminated by the added sensitivity of neutrons for thewater distribution, see Figure 10.
Appl. Sci. 2021, 11, x FOR PEER REVIEW 12 of 16
Concrete is one of the porous materials where the benefit of bimodal neutron/X-ray
imaging is established by the high sensitivity and resolution of X-rays for the porous ma-
trix, while neutrons provide superior contrast for the observation of a liquid hydrogenous
phase distributed within the matrix. Only the combination of both provides meaningful
insights. For example, the interfaces between light weight aggregate internal curing res-
ervoirs and the adjacent cement paste can be detected by X-ray imaging while neutron
imaging hardly enables a distinction of these phases. Thus, while the morphologies of
such interfaces is examined by X-ray imaging, their impact on the water transport and
function for internal curing reservoirs [22] can only be illuminated by the added sensitiv-
ity of neutrons for the water distribution, see Figure 10.
Figure 10. Core-drill of plain concrete—(from left to right) section from X-ray tomography 120 kV, photograph, corre-
sponding section based on neutron tomography. The sample diameter is 40 mm (image reprinted from ref. [23]).
Another concrete-related field of investigation in which such a bi-modal approach
has shown invaluable potential is the issue of corrosion of metal reinforcements in con-
crete. Corrosion of reinforcements is a threat to the sustainability and safety of our basic
infrastructure and causes significant cost to society. Neutron imaging provides unique
insights on corrosion of reinforcements within the concrete environment and the non-de-
structive nature allows for continued observations of corrosion processes in the context of
the surrounding material. An example of an investigation at NEUTRA showing the 3D
distribution of corrosion products and thus the extent of corrosion in a reinforced concrete
specimen is shown in Figure 11 [24].
Figure 11. 3D visualization of corrosion products around rebar in reinforced concrete (image from
a test run at PSI, partly published in [24]). The diameter of the steel rebar in the core of the speci-
men is 8 mm.
Figure 10. Core-drill of plain concrete—(from left to right) section from X-ray tomography 120 kV, photograph, correspond-ing section based on neutron tomography. The sample diameter is 40 mm (image reprinted from ref. [23]).
Another concrete-related field of investigation in which such a bi-modal approachhas shown invaluable potential is the issue of corrosion of metal reinforcements in con-crete. Corrosion of reinforcements is a threat to the sustainability and safety of our basicinfrastructure and causes significant cost to society. Neutron imaging provides uniqueinsights on corrosion of reinforcements within the concrete environment and the non-destructive nature allows for continued observations of corrosion processes in the contextof the surrounding material. An example of an investigation at NEUTRA showing the 3Ddistribution of corrosion products and thus the extent of corrosion in a reinforced concretespecimen is shown in Figure 11 [24].
High resolution bi-modal neutron/X-ray studies enable yet more detailed insights,not only identifying individual corrosion pits on the rebar surfaces but correlating theirrespective position with different phases in the surrounding concrete matrix.

Appl. Sci. 2021, 11, 3825 13 of 16
Appl. Sci. 2021, 11, x FOR PEER REVIEW 12 of 16
Concrete is one of the porous materials where the benefit of bimodal neutron/X-ray
imaging is established by the high sensitivity and resolution of X-rays for the porous ma-
trix, while neutrons provide superior contrast for the observation of a liquid hydrogenous
phase distributed within the matrix. Only the combination of both provides meaningful
insights. For example, the interfaces between light weight aggregate internal curing res-
ervoirs and the adjacent cement paste can be detected by X-ray imaging while neutron
imaging hardly enables a distinction of these phases. Thus, while the morphologies of
such interfaces is examined by X-ray imaging, their impact on the water transport and
function for internal curing reservoirs [22] can only be illuminated by the added sensitiv-
ity of neutrons for the water distribution, see Figure 10.
Figure 10. Core-drill of plain concrete—(from left to right) section from X-ray tomography 120 kV, photograph, corre-
sponding section based on neutron tomography. The sample diameter is 40 mm (image reprinted from ref. [23]).
Another concrete-related field of investigation in which such a bi-modal approach
has shown invaluable potential is the issue of corrosion of metal reinforcements in con-
crete. Corrosion of reinforcements is a threat to the sustainability and safety of our basic
infrastructure and causes significant cost to society. Neutron imaging provides unique
insights on corrosion of reinforcements within the concrete environment and the non-de-
structive nature allows for continued observations of corrosion processes in the context of
the surrounding material. An example of an investigation at NEUTRA showing the 3D
distribution of corrosion products and thus the extent of corrosion in a reinforced concrete
specimen is shown in Figure 11 [24].
Figure 11. 3D visualization of corrosion products around rebar in reinforced concrete (image from
a test run at PSI, partly published in [24]). The diameter of the steel rebar in the core of the speci-
men is 8 mm.
Figure 11. 3D visualization of corrosion products around rebar in reinforced concrete (image from a testrun at PSI, partly published in [24]). The diameter of the steel rebar in the core of the specimen is 8 mm.
3.4. Study of Minerals
Apart from concrete and cement-based materials, the combination of neutrons andX-rays in imaging at NEUTRA has also been applied to visualize the inner structure ofminerals. The combined information from the bimodal tomographies allowed for superioridentification of the different phases contained in, for example, bog ore (see Figure 12) andpyrite (see Figure 13) [25].
Appl. Sci. 2021, 11, x FOR PEER REVIEW 13 of 16
High resolution bi-modal neutron/X-ray studies enable yet more detailed insights,
not only identifying individual corrosion pits on the rebar surfaces but correlating their
respective position with different phases in the surrounding concrete matrix.
3.4. Study of Minerals
Apart from concrete and cement-based materials, the combination of neutrons and
X-rays in imaging at NEUTRA has also been applied to visualize the inner structure of
minerals. The combined information from the bimodal tomographies allowed for superior
identification of the different phases contained in, for example, bog ore (see Figure 12) and
pyrite (see Figure 13) [25].
Figure 12. Sample of bog ore (from left to right): photograph, section from neutron tomography, corresponding section
from X-ray tomography (Adapted with permission from ref. [25], Copyright John Wiley and Sons, 2010). The sample
dimensions are approximately 30 mm × 50 mm × 100 mm.
Figure 13. Sample of pyrite (from left to right): photograph, section from neutron tomography, corresponding section
from X-ray tomography (Adapted with permission from ref. [25], Copyright John Wiley and Sons, 2010). The dimension
of the sample is approximately 40 mm.
3.5. Multi-Modal Observations of Water Transport in Soils
Finally, bi-modal X-ray and neutron imaging has been established as a prominent
tool for investigations of water transport in geological materials, in particular in soils [26].
Here, a specific example shall be presented, where a third modality, namely magnetic
resonance imaging (MRI), complemented NEUTRA’s bi-modal N/X capability.
Snehota et al. [26] and Jelinkova et al. [27] realized this tri-modal non-destructive
imaging approach to study quasi-steady state flow instabilities in structured soil as well
as flow dynamics during recurrent ponded infiltration on undisturbed soil samples, re-
spectively. Figure 14 shows corresponding tomographic slices of a soil sample observed
by all three modalities at two different states of wetting. The provision of X-ray images
allowed for the distinction between air voids and sand grains that are difficult to be iden-
tified correctly by the other modalities (N, MRI). The tri-modal imaging approach proved
to be a well-suited tool for understanding the effects of entrapped residual air bubbles on
water transport in soil.
Figure 12. Sample of bog ore (from left to right): photograph, section from neutron tomography, corresponding sectionfrom X-ray tomography (Adapted with permission from ref. [25], Copyright John Wiley and Sons, 2010). The sampledimensions are approximately 30 mm × 50 mm × 100 mm.
Appl. Sci. 2021, 11, x FOR PEER REVIEW 13 of 16
High resolution bi-modal neutron/X-ray studies enable yet more detailed insights,
not only identifying individual corrosion pits on the rebar surfaces but correlating their
respective position with different phases in the surrounding concrete matrix.
3.4. Study of Minerals
Apart from concrete and cement-based materials, the combination of neutrons and
X-rays in imaging at NEUTRA has also been applied to visualize the inner structure of
minerals. The combined information from the bimodal tomographies allowed for superior
identification of the different phases contained in, for example, bog ore (see Figure 12) and
pyrite (see Figure 13) [25].
Figure 12. Sample of bog ore (from left to right): photograph, section from neutron tomography, corresponding section
from X-ray tomography (Adapted with permission from ref. [25], Copyright John Wiley and Sons, 2010). The sample
dimensions are approximately 30 mm × 50 mm × 100 mm.
Figure 13. Sample of pyrite (from left to right): photograph, section from neutron tomography, corresponding section
from X-ray tomography (Adapted with permission from ref. [25], Copyright John Wiley and Sons, 2010). The dimension
of the sample is approximately 40 mm.
3.5. Multi-Modal Observations of Water Transport in Soils
Finally, bi-modal X-ray and neutron imaging has been established as a prominent
tool for investigations of water transport in geological materials, in particular in soils [26].
Here, a specific example shall be presented, where a third modality, namely magnetic
resonance imaging (MRI), complemented NEUTRA’s bi-modal N/X capability.
Snehota et al. [26] and Jelinkova et al. [27] realized this tri-modal non-destructive
imaging approach to study quasi-steady state flow instabilities in structured soil as well
as flow dynamics during recurrent ponded infiltration on undisturbed soil samples, re-
spectively. Figure 14 shows corresponding tomographic slices of a soil sample observed
by all three modalities at two different states of wetting. The provision of X-ray images
allowed for the distinction between air voids and sand grains that are difficult to be iden-
tified correctly by the other modalities (N, MRI). The tri-modal imaging approach proved
to be a well-suited tool for understanding the effects of entrapped residual air bubbles on
water transport in soil.
Figure 13. Sample of pyrite (from left to right): photograph, section from neutron tomography, corresponding section fromX-ray tomography (Adapted with permission from ref. [25], Copyright John Wiley and Sons, 2010). The dimension of thesample is approximately 40 mm.
3.5. Multi-Modal Observations of Water Transport in Soils
Finally, bi-modal X-ray and neutron imaging has been established as a prominent toolfor investigations of water transport in geological materials, in particular in soils [26].

Appl. Sci. 2021, 11, 3825 14 of 16
Here, a specific example shall be presented, where a third modality, namely magneticresonance imaging (MRI), complemented NEUTRA’s bi-modal N/X capability.
Snehota et al. [26] and Jelinkova et al. [27] realized this tri-modal non-destructiveimaging approach to study quasi-steady state flow instabilities in structured soil as well asflow dynamics during recurrent ponded infiltration on undisturbed soil samples, respec-tively. Figure 14 shows corresponding tomographic slices of a soil sample observed by allthree modalities at two different states of wetting. The provision of X-ray images allowedfor the distinction between air voids and sand grains that are difficult to be identifiedcorrectly by the other modalities (N, MRI). The tri-modal imaging approach proved to be awell-suited tool for understanding the effects of entrapped residual air bubbles on watertransport in soil.
Appl. Sci. 2021, 11, x FOR PEER REVIEW 14 of 16
Figure 14. Soil sample investigated by tri-modal N/X/MRI imaging. (image courtesy of V. Jelinkova, [27]). The sample
inner diameter equals 34 mm.
4. Conclusions and Outlook
We introduced the details of the pioneering implementation of the bi-modal neu-
tron/X-ray-imaging option of the NEUTRA instrument at SINQ at PSI and described how
the installation enables corresponding imaging with X-rays and neutrons with close to
matching geometries and resolutions, enabling good correlation. We provided the basic
considerations that motivate such instrumental options as well as the developments and
trends that originated from this approach. We presented a retrospective of examples and
seminal studies enabled by this development and paved the way for establishing corre-
sponding instrumentation at a large number of state-of-the-art neutron imaging beam-
lines today. Examples in the fields of porous media and fluid transport as well as in cul-
tural heritage were showcased, and the potential applications are continuously increasing,
such as in contemporary battery research. Our research has been the basis for many new
developments and significant progress in data processing and analyses to maximize the
benefits from multi-modal imaging. Today, after the outlined successful history of the
XTRA option at NEUTRA, there are plans to upgrade this option towards an implemen-
tation that enables simultaneous bi-modal X-ray and neutron imaging at NEUTRA, simi-
lar to the state-of-the-art implementation at the cold neutron imaging instrument ICON
at PSI [28]. Other areas for improvement are the consideration of beam hardening and its
corrections in the case of X-ray measurements and the effect of multiple scattering in the
case of neutron imaging. However, these effects are very case dependent and different for
the involved materials. Dedicated pre-studies are needed, which extend the frame of this
report.
Author Contributions: Conceptualization, E.H.L.; methodology, A.P.K.; software, A.P.K. and D.M.;
investigation, A.P.K., P.T., J. H. and D.M.; resources, M.S.; writing—original draft preparation,
E.H.L.; writing—review and editing, E.H.L., M.S. and P.T.; visualization, D.M. and P.T.; supervi-
sion, M.S.; funding acquisition, M.S. All authors have read and agreed to the published version of
the manuscript
Funding: This research received no external funding.
Institutional Review Board Statement: Not applicable.
Informed Consent Statement: Informed consent was obtained from all subjects involved in the
study.
Data Availability Statement: There are no data published.
Acknowledgments: The authors sincerely thank V. Jelinkova and M. Snehota (CTU in Prague,
Czech Republic) for the permission to use the image data in Figure 12. In addition, the authors ex-
press their sincere thanks to F. Schmid (Paul Scherrer Institut) for his invaluable contributions to the
data analysis and visualizations presented in Figure 10. The valuable contribution by P. Vontobel
Figure 14. Soil sample investigated by tri-modal N/X/MRI imaging. (image courtesy of V. Jelinkova, [27]). The sampleinner diameter equals 34 mm.
4. Conclusions and Outlook
We introduced the details of the pioneering implementation of the bi-modal neutron/X-ray-imaging option of the NEUTRA instrument at SINQ at PSI and described how the in-stallation enables corresponding imaging with X-rays and neutrons with close to matchinggeometries and resolutions, enabling good correlation. We provided the basic consider-ations that motivate such instrumental options as well as the developments and trendsthat originated from this approach. We presented a retrospective of examples and seminalstudies enabled by this development and paved the way for establishing correspondinginstrumentation at a large number of state-of-the-art neutron imaging beamlines today.Examples in the fields of porous media and fluid transport as well as in cultural heritagewere showcased, and the potential applications are continuously increasing, such as in con-temporary battery research. Our research has been the basis for many new developmentsand significant progress in data processing and analyses to maximize the benefits frommulti-modal imaging. Today, after the outlined successful history of the XTRA option atNEUTRA, there are plans to upgrade this option towards an implementation that enablessimultaneous bi-modal X-ray and neutron imaging at NEUTRA, similar to the state-of-the-art implementation at the cold neutron imaging instrument ICON at PSI [28]. Other areasfor improvement are the consideration of beam hardening and its corrections in the case ofX-ray measurements and the effect of multiple scattering in the case of neutron imaging.However, these effects are very case dependent and different for the involved materials.Dedicated pre-studies are needed, which extend the frame of this report.
Author Contributions: Conceptualization, E.H.L.; methodology, A.P.K.; software, A.P.K. and D.M.;investigation, A.P.K., P.T., J.H. and D.M.; resources, M.S.; writing—original draft preparation,E.H.L.; writing—review and editing, E.H.L., M.S. and P.T.; visualization, D.M. and P.T.; super-vision, M.S.; funding acquisition, M.S. All authors have read and agreed to the published version ofthe manuscript.
Funding: This research received no external funding.
Institutional Review Board Statement: Not applicable.

Appl. Sci. 2021, 11, 3825 15 of 16
Informed Consent Statement: Informed consent was obtained from all subjects involved in the study.
Data Availability Statement: There are no data published.
Acknowledgments: The authors sincerely thank V. Jelinkova and M. Snehota (CTU in Prague, CzechRepublic) for the permission to use the image data in Figure 12. In addition, the authors expresstheir sincere thanks to F. Schmid (Paul Scherrer Institut) for his invaluable contributions to the dataanalysis and visualizations presented in Figure 10. The valuable contribution by P. Vontobel and G.Frei during the installation and the utilization of the XTRA-option is herewith highly acknowledged.
Conflicts of Interest: The authors declare no conflict of interest.
References1. Lehmann, E.H.; Vontobel, P.; Wiezel, L.H. Properties of the Radiography Facility NEUTRA at SINQ and its Potential for Use as
European Reference Facility. Nondestruct. Test. Eval. 2001, 16, 191–202. [CrossRef]2. Sears, V.F. Neutron scattering lengths and cross sections. Neutron News 1992, 3, 26–37. [CrossRef]3. Berger, M.J.; Hubbell, J.H.; Seltzer, S.M.; Chang, J.; Coursey, J.S.; Sukumar, R.; Zucker, D.S.; Olsen, K. Xcom: Photon cross sections
database, NIST Standard Reference Database 8 (XGAM). Available online: http://www.nist.gov/pml/data/xcom/ (accessed on19 April 2021).
4. Marone, F.; Hintermueller, C.; McDonald, S.; Abela, R.; Mikuljan, G.; Isenegger, A.; Stampanoni, M. X-ray tomographic microscopyat tomcat. Proc. SPIE 2008, 7078, 707822. [CrossRef]
5. Axmann, A.; Boning, K.; Rottmann, M. FRM-II: The new German research reactor. Nucl. Eng. Des. 1997, 178, 127–133. [CrossRef]6. Blau, B.; Clausen, K.N.; Gvasaliya, S.; Janoschek, M.; Janssen, S.; Keller, L.; Roessli, B.; Schefer, J.; Tregenna-Piggott, P.;
Wagner, W.; et al. The Swiss Spallation Neutron Source SINQ at Paul Scherrer Institut. Neutron News 2009, 20, 5–8. [CrossRef]7. Lehmann, E.; Vontobel, P.; Frei, G.; Bronnimann, C. Neutron imaging-detector options and practical results. Nucl. Instrum.
Methods Phys. Res. Sect. A Accel. Spectrometers Detect. Assoc. Equip. 2004, 531, 228–237. [CrossRef]8. Available online: https://www.rctritec.com/de/szintillatoren/produkte.html (accessed on 19 April 2021).9. Buzug, T.M. Computed Tomography: From Photon Statistics to Modern Cone-Beam CT; Springer: Berlin, Germany, 2008.10. Moradi, A.B.; Conesa, H.M.; Robinson, B.; Lehmann, E.; Kuehne, G.; Kaestner, A.; Oswald, S.; Schulin, R. Neutron radiography as
a tool for revealing root development in soil: Capabilities and limitations. Plant Soil 2009, 318, 243–255. [CrossRef]11. Ziesche, R.F.; Arlt, T.; Finegan, D.P.; Heenan, T.M.M.; Tengattini, A.; Baum, D.; Kardjilov, N.; Markötter, H.; Manke, I.;
Kockelmann, W.; et al. 4D imaging of lithium-batteries using correlative neutron and X-ray tomography with a virtual un-rolling technique. Nat. Commun. 2020, 11, 777. [CrossRef]
12. Jacot-Guillarmod, M.; Schmidt-Ott, K.; Mannes, D.; Kaestner, A.; Lehmann, E.; Gervais, C. Multi-modal tomography to assessdechlorination treatments of iron-based archaeological artifacts. Herit. Sci. 2019, 7, 29. [CrossRef]
13. Fedrigo, A.; Marstal, K.; Bender Koch, C.; Andersen Dahl, V.; Bjorholm Dahl, A.; Lyksborg, M.; Gundlach, C.; Ott, F.; Strobl, M.Investigation of a Monturaqui Impactite by Means of Bi-Modal X-ray and Neutron Tomography. J. Imaging 2018, 4, 72. [CrossRef]
14. Kazantsev, D.; Ourselin, S.; Hutton, B.F.; Dobson, K.J.; Kaestner, A.P.; Lionheart, W.R.B.; Withers, P.J.; Lee, P.D.; Arridge, S.R. A noveltechnique to incorporate structural prior information into multi-modal tomographic reconstruction. Inverse Probl. 2014, 30, 065004.[CrossRef]
15. Vontobel, P.; Lehmann, E.; Carlson, W.D. Comparison of X-ray and neutron tomography investigations of geological materials.IEEE Trans. Nucl. Sci. 2005, 52, 338–341. [CrossRef]
16. Frey, J. Der Oberwiler Degen, Herkunft, Gebrauch und sein Weg in den Zugersee. Z. Schweiz. Archaol. Kunstgesch. 2014, 71, 101–128.17. Schmidt-Ott, K.; Hunger, K.; Mannes, D. Die Konservierung des Degens von Oberwil unter Einbeziehung aktueller analysever-
fahren. Z. 192 Schweiz. Archaol. Kunstgesch. 2014, 71, 129–140.18. Mannes, D.; Schmid, F.; Frey, J.; Schmidt-Ott, K.K.; Lehmann, E. Combined Neutron and X-ray imaging for non-invasive
investigations of 194 cultural heritage objects. Phys. Procedia 2015, 69, 653–660. [CrossRef]19. Mannes, D.; Lehmann, E.; Furger, A. Study of ancient metallic artifacts by using neutron imaging techniques. Bull. Assoc. Pro
Aventico 2016, 57, 171–180.20. Zhang, P.; Wittmann, F.H.; Zhao, T.; Lehmann, E.H.; Vontobel, P. Neutron radiography, a powerful method to determine
time-dependent moisture distributions in concrete. Nucl. Eng. Des. 2011, 241, 4758–4766. [CrossRef]21. Kuehne, G.; Vontobel, P.; Frei, G.; Lehmann, E.; Bühlmann, M.; Heiniger, K.; Zweifel, B. Neutron Imaging Facilities at the Paul
Scherrer Institut and their Application for Non-destructive Testing of Abrasive Water Jet Nozzle’ s. In Proceedings of the 9thEuropean Conference on NDT, Berlin, Germany, 25–29 September 2006.
22. Trtik, P.; Münch, B.; Weiss, W.J.; Kaestner, A.; Jerjen, I.; Josic, L.; Lehmann, E.; Lura, P. Release of internal curing water fromlightweight aggregates in cement paste investigated by neutron and X-ray tomography. Nucl. Instrum. Methods Phys. Res. Sect. AAccel. Spectrometers Detect. Assoc. Equip. 2011, 651. [CrossRef]
23. Lehmann, E.H.; Kaestner, A.; Vontobel, P.; Grünzweig, C.; Mannes, D.; Peetermans, S. Neutron Imaging—Status and prospects ofa modern research tool flexible non-invasive studies from plant-soil-interaction to magnetic material investigations. Not. NeutroniLuce Sincrotrone 2012, 18, 3.

Appl. Sci. 2021, 11, 3825 16 of 16
24. Zhang, P.; Liu, Z.; Wang, Y.; Yang, J.; Han, S.; Zhao, T. 3D neutron tomography of steel reinforcement corrosion in cement-basedcomposites. Constr. Build. Mater. 2018, 162, 561–565. [CrossRef]
25. Kaestner, A.; Vontobel, P.; Lehmann, E. Neutron Imaging Methods in Geoscience. In Advances in Computed Tomography forGeomaterials; Wiley: Hoboken, NJ, USA, 2010. [CrossRef]
26. Snehota, M.; Sobotkova, M.; Cislerova, M.; Hovind, J.; Vontobel, P. Investigating the quasi-steady state flow instabilities instructured soil by neutron tomography. In Proceedings of the AGU Fall Meeting, San Francisco, CA, USA, 5–9 December 2011.
27. Jelinkova, V.; Snehota, M.; Sobotkova, M.; Cislerova, M. Flow dynamics during recurrent ponded infiltration on undisturbed soilsamples studied by magnetic resonance imaging and neutron imaging. In Proceedings of the NIUS Workshop 2012, Bad Zurzach,Switzerland, 1 March 2012. poster presentation.
28. Kaestner, A.P.; Hartmann, S.; Kuehne, G.; Frei, G.; Gruenzweig, C.; Josic, L.; Schmid, F.; Lehmann, E.H. The ICON beamline—Afacility for cold neutron imaging at SINQ. Nucl. Instrum. Methods Phys. Res. Sect. A Accel. Spectrometers Detect. Assoc. Equip. 2011,659, 387–393. [CrossRef]