The World Economic Outlook
63
Copyright © 2003 Global Insight, Inc. The World Economic Outlook: What Have We Learned in the Last 40 Years and Where Do We Go From Here? Nariman Behravesh Chief Global Economist World Economic Outlook Conference October 21-23, 2003
Transcript of The World Economic Outlook

Copyright © 2003 Global Insight, Inc.
The World Economic Outlook:What Have We Learned in the Last 40 Years
andWhere Do We Go From Here?
Nariman BehraveshChief Global Economist
World Economic Outlook Conference
October 21-23, 2003

Copyright © 2003 Global Insight, Inc.
Welcome!World Economic Outlook Conference 2003

Copyright © 2003 Global Insight, Inc. 310/2003
Outline of Presentation
Global Insight’s short- and medium-term outlook
Four event-filled decades
What have we learned?
Where do we go from here?Looking beyond the horizonA few (of many) plausible scenarios

Copyright © 2003 Global Insight, Inc.
Short- and Medium-TermOutlook

Copyright © 2003 Global Insight, Inc. 510/2003
Overview
The world economy's performance during its current cycle has been a huge disappointment
This year's global growth will enter record books as by far the weakest second-year performance of all post-WWII cyclical recoveries
Key Characteristics of the recovery since the end of the 90s boomSub-par, stop-and-go growth Excessive dependence on the U.S. economyAbsence of pent-up consumer demandPersistent output gap and deflationary pressuresA faltering from the middle of last year that badly scared global capital markets
Nevertheless, all evidence point to a strong U.S. economic rebound being already underway – also in non-Japan Asia
The U.S. rebound should lift the rest of the world, but growth will remain lopsided for some time

Copyright © 2003 Global Insight, Inc. 610/2003
A Global Cyclical Rebound Is Under Way
OECD Leading Indicators(Annualized 6-month rate of change)
-8
-4
0
4
8
12
2000 2001 2002 2003
OECD Total Eurozone Nafta Japan
Copyright © 2003 Global Insight, Inc. 710/2003
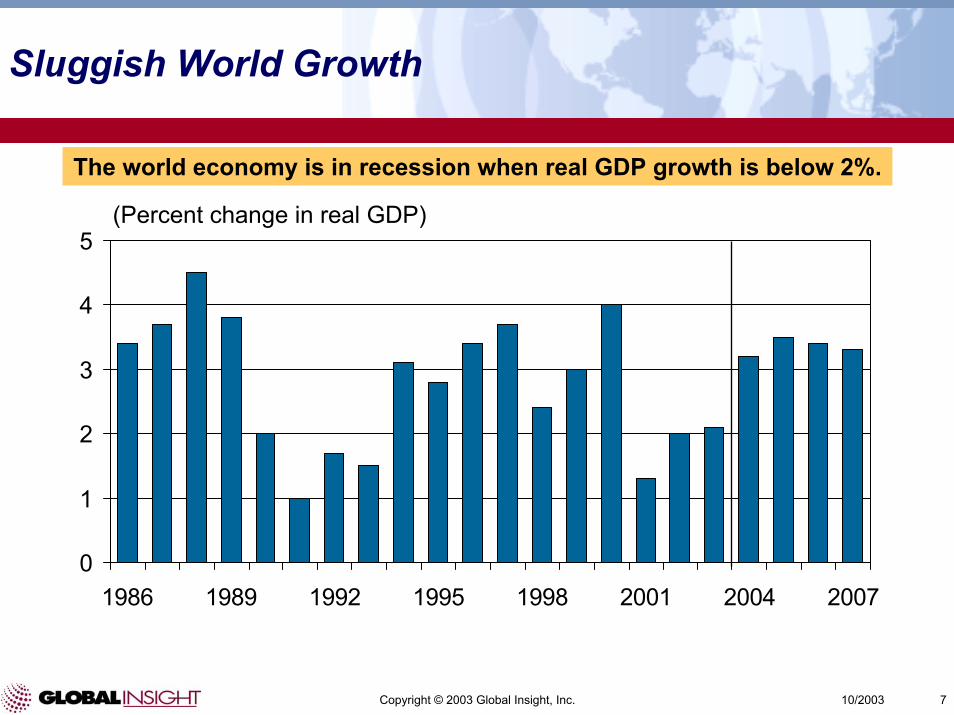
Sluggish World Growth
The world economy is in recession when real GDP growth is below 2%.
0
1
2
3
4
5
1986 1989 1992 1995 1998 2001 2004 2007
(Percent change in real GDP)

Copyright © 2003 Global Insight, Inc. 810/2003
Emerging Markets Achieve the Fastest Growth
-2-10123456
NAFTA OtherAmericas
WesternEurope
EmergingEurope
Japan Other Asia
2001 2002 2003 2004 2005
(Percent change, real GDP)

Copyright © 2003 Global Insight, Inc. 910/2003
Fiscal and Monetary Policy Will Boost Growth Later this Year
Fiscal Balance
(Percentage of GDP, 2003)
Net Cumulative Cut in Policy Rates Since January 2001
(Basis points)
Australia -1.0 150
United Kingdom -2.7 250
Canada 0.5 275
Japan -6.8 25
Sweden 1.3 125
Switzerland -2.2 325
United States -4.0 550
Eurozone -2.5 275

Copyright © 2003 Global Insight, Inc. 1010/2003
Crude Oil Prices Will Retreat
(WTI price, dollars per barrel)
10
15
20
25
30
35
1997 1998 1999 2000 2001 2002 2003 2004 2005 2006 2007

Copyright © 2003 Global Insight, Inc. 1110/2003
U.S. – Poised to Rebound
Positive Trends
Fiscal and monetary policy still very simulativeInterest rates at 41-year lowUnemployment rate not high relative to past recessionsAfter-tax income growth is strongThe housing sector is holding upCorporate cash flow and balance sheets have strengthenedInventories are lowProductivity growth is strongThe U.S. dollar has fallen
Negative Trends
Job losses continueU.S. corporations are still risk averseCapacity utilization is lowDebt levels are highState and local government are retrenchingNo help from the rest of the world

Copyright © 2003 Global Insight, Inc. 1210/2003
The U.S. Expansion Will Strengthen
-2
0
2
4
6
8
1998 1999 2000 2001 2002 2003 2004 2005 20062
3
4
5
6
7
Real GDP Growth Unemployment Rate
(Percent change, annual rate) (Percent)

Copyright © 2003 Global Insight, Inc. 1310/2003
Price and Wage Inflation Will Stay Mild
(Year-over-year percent change)
-3-2-1012345
1998 1999 2000 2001 2002 2003 2004 2005 2006
CPI Producer Prices Employment Cost Index

Copyright © 2003 Global Insight, Inc. 1410/2003
Federal Reserve Policy Will Be Accommodating: Key Interest Rates
0
2
4
6
8
10
1998 1999 2000 2001 2002 2003 2004 2005 2006 2007 2008
Federal Funds 10-Year Treasury Yield Mortgage Rate
(Percent)

Copyright © 2003 Global Insight, Inc. 1510/2003
Household Debt Service Burdens Are Manageable
4
5
6
7
8
9
1980 1983 1986 1989 1992 1995 1998 2001 2004 2007
Mortgage Debt Service Other Debt Service
(Percent of disposable income)

Copyright © 2003 Global Insight, Inc. 1610/2003
Ratio of Household Debt to Disposable Income
708090
100110120130140
1990 1991 1992 1993 1994 1995 1996 1997 1998 1999 2000 2001
U.S. Japan Germany UK
(Ratio)
Source: OECD

Copyright © 2003 Global Insight, Inc. 1710/2003
House Price Inflation, 1995-2002
Source: National Statistics
Nominal Real Ireland 219 152 Britain 125 89 Netherlands 121 83 Spain 95 58 Sweden 68 56 Australia 83 53 Belgium 57 39 France 45 31 U.S. 51 27 Eurozone 35 19 Italy 29 8 Canada 18 2 Germany -5 -13 Japan -20 -19

Copyright © 2003 Global Insight, Inc. 1810/2003
Employment Will Begin to Recover This Fall
The U.S. lost 2.8 million jobs from February 2001 to August 2003.
-3
-2
-1
0
1
2
3
1998 1999 2000 2001 2002 2003 2004 2005 2006
(Percent change, annual rate)

Copyright © 2003 Global Insight, Inc. 1910/2003
Corporate Profits Are Rebounding
-8-4048
121620
1990 1992 1994 1996 1998 2000 2002 2004 2006 2008
Before-tax Profits with IVA & CCA GDP
(Percent change, NIPA basis)

Copyright © 2003 Global Insight, Inc. 2010/2003
An Uneven Recovery in Business Investment
-20-10
010203040
Structures Computers Software Communic.Equipment
OtherEquipment
2000 2001 2002 2003 2004
(Percent change, 1996 dollars)

Copyright © 2003 Global Insight, Inc. 2110/2003
U.S. Federal Budget Deficit and Debt
-6.0
-4.5
-3.0
-1.5
0.0
1.5
3.0
1980 1983 1986 1989 1992 1995 1998 2001 2004 2007 2010 201320
26
32
38
44
50
56
U.S. Federal Deficit to GDP (LS) U.S. Federal Debt to GDP (RS)
(Ratio) (Ratio)

Copyright © 2003 Global Insight, Inc. 2210/2003
Europe – Still a Drag on Global Growth
Positive Trends
Oil prices and inflation are lowerExpected global recovery will help exportsStock markets have reboundedConfidence is recovering
Negative Trends
Double-dip in GermanyFiscal and monetary policies are still too tightThe euro has appreciatedUnemployment rates are high and risingLittle progress has been made on structural reforms

Copyright © 2003 Global Insight, Inc. 2310/2003
Forecasts for Europe
0.0
0.5
1.0
1.5
2.0
2.5
3.0
France Germany Italy Spain U.K.
2001 2002 2003 2004 2005
(Percent change in real GDP)

Copyright © 2003 Global Insight, Inc. 2410/2003
The Dollar-Euro Exchange Rate
0.70
0.80
0.90
1.00
1.10
1.20
1.30
1.40
1997 1998 1999 2000 2001 2002 2003 2004 2005 2006
(Dollars per euro)
Copyright © 2003 Global Insight, Inc. 2510/2003
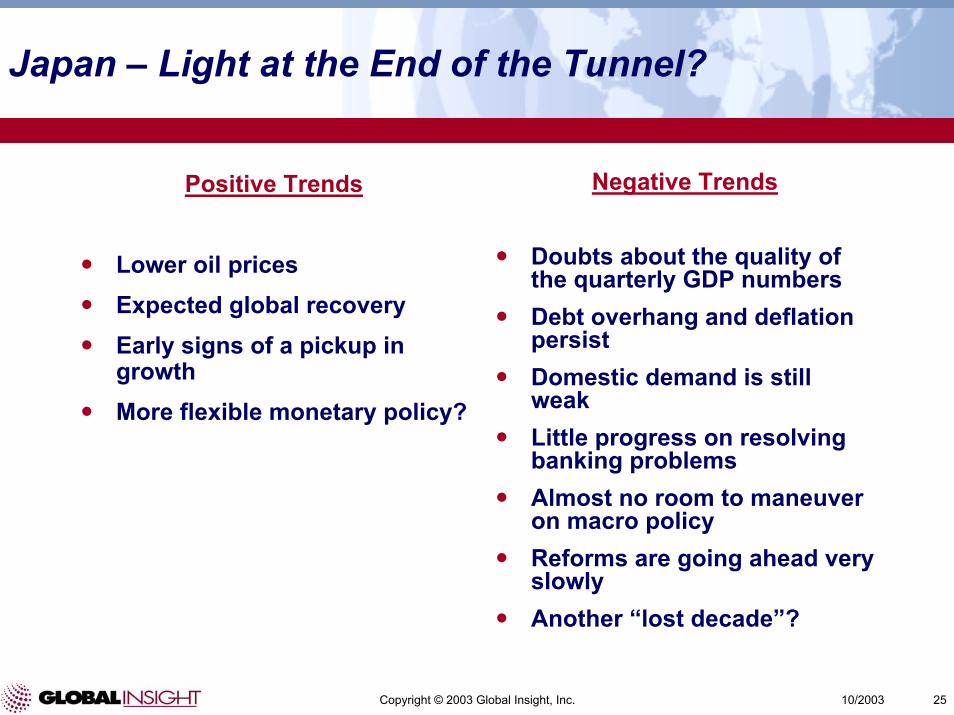
Japan – Light at the End of the Tunnel?
Positive Trends
Lower oil pricesExpected global recoveryEarly signs of a pickup in growthMore flexible monetary policy?
Negative Trends
Doubts about the quality of the quarterly GDP numbersDebt overhang and deflation persistDomestic demand is still weakLittle progress on resolving banking problemsAlmost no room to maneuver on macro policyReforms are going ahead very slowlyAnother “lost decade”?

Copyright © 2003 Global Insight, Inc. 2610/2003
Japan – Another Lost Decade?
-2-101234567
1986 1988 1990 1992 1994 1996 1998 2000 2002 2004 2006
(Percent change in real GDP)

Copyright © 2003 Global Insight, Inc. 2710/2003
The Dollar-Yen Exchange Rate
85
95
105
115
125
135
145
1997 1998 1999 2000 2001 2002 2003 2004 2005 2006
(Yen per U.S. dollar)

Copyright © 2003 Global Insight, Inc. 2810/2003
Asia: A Bright Spot
Negative Trends
Liquidity explosion could lead to overheating – repeat of 1997?
Attempts to keep exchange rates from appreciating could backfire
Positive Trends
SARS risk has diminished
Exports are booming
High-tech growth is strong
Macro policies have been very accommodative
Chinese deflation is ending
Excess capacity is less of an issue

Copyright © 2003 Global Insight, Inc. 2910/2003
Real GDP Growth in Asian Economies
-4
-2
0
2
4
6
8
China S. Korea India Australia Taiwan
2001 2002 2003 2004 2005
(Percent change)

Copyright © 2003 Global Insight, Inc. 3010/2003
Real GDP Growth in Asian Economies
-4
-2
0
2
4
6
Hong Kong Indonesia Singapore Malaysia Philippines
2001 2002 2003 2004 2005
(Percent change)
Copyright © 2003 Global Insight, Inc. 3110/2003
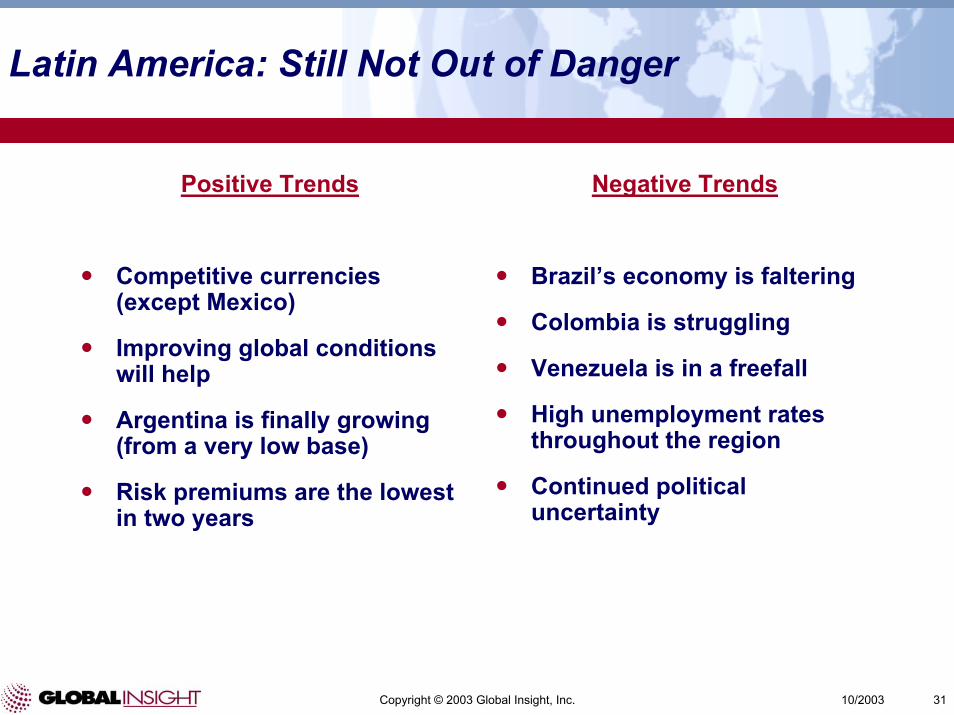
Latin America: Still Not Out of Danger
Positive Trends
Competitive currencies (except Mexico)
Improving global conditions will help
Argentina is finally growing (from a very low base)
Risk premiums are the lowest in two years
Negative Trends
Brazil’s economy is faltering
Colombia is struggling
Venezuela is in a freefall
High unemployment rates throughout the region
Continued political uncertainty

Copyright © 2003 Global Insight, Inc. 3210/2003
Latin America at a Glance
-12-9-6-3036
LatinAmerica
Argentina Brazil Mexico Venezuela
2001 2002 2003 2004 2005
(Percent change in real GDP)

Copyright © 2003 Global Insight, Inc. 3310/2003
Emerging Europe Is Attracting Investment
Despite weak export markets, economic growth is picking up in Central Europe, Russia, and the Ukraine.
Eastern European countries are attracting foreign investment in anticipation of accession to the European Union.
Falling trade barriers, low costs, and privatization will spark industrial development in Romania, Bulgaria, and Croatia.
Azerbaijan, Kazakhstan, and Turkmenistan will achieve high growth rates as a result of oil and gas development.
Russia, the Ukraine, and Kazakhstan are introducing market reforms, but corruption and weak financial systems will impede non-energy investment.

Copyright © 2003 Global Insight, Inc. 3410/2003
Middle East and Africa Face Several Obstacles
The Iraq war, the Israeli-Palestinian conflict, and fears of terrorism have undermined tourism and investment.
Near-term strength in oil export revenues will support public spending in the Middle East and North Africa.
Iraq’s long-term economic outlook is bright but risky; the country is rich in natural resources.
Oil production—potential to reach 5 mmbd in 5 yearsAgriculture—fertile land, water from Tigris & EuphratesTourism—Shiite holy cities of Najaf and Karbala
Capital flight, the AIDS epidemic, and political instability hinder growth in Sub-Saharan Africa. Demand for Africa’s metals and agricultural exports remains weak.

Copyright © 2003 Global Insight, Inc. 3510/2003
Other Emerging Markets Are Growing
01234567
Eastern Europe Former SovietUnion
Middle East Africa
2001 2002 2003 2004 2005
(Percent change, real GDP)

Copyright © 2003 Global Insight, Inc. 3610/2003
The Biggest Economic Risk In the Next Few Years –A Rapidly Falling U.S. Dollar
Continued lopsided world growth means that, for the U.S. currentaccount deficit to be bought under control, the dollar has to fall further – a lot further
The U.S. CAD is currently twice as big as in the 1980s and dollar has fallen by half as much – and growth in Europe and Japan is much slower
As long as the Asian central banks keep their currencies from appreciating by much, the brunt of the adjustment will be on thefloating currencies, notably the euro
A euro at $1.40 or $1.50 in the next three years is not far-fetched
Without the appropriate policy response to such a shock, the Eurozone will be condemned to sluggish growth for many more years
Depending on how quickly the dollar falls, the impact on U.S. long-term interest rates could be problematic

Copyright © 2003 Global Insight, Inc. 3710/2003
World Growth Will Remain Lopsided
0123456
World NAFTA OtherAmericas
WesternEurope
Japan Other Asia
1992-2002 2002-2012 2012-2022
(Percent change)

Copyright © 2003 Global Insight, Inc. 3810/2003
A Gaping Imbalance
-800
-600
-400
-200
0
200
1980 1983 1986 1989 1992 1995 1998 2001 2004 2007 2010-8
-6
-4
-2
0
2
Current Account Deficit Deficit as % of GDP
(Billions of dollars) (Percent of GDP)

Copyright © 2003 Global Insight, Inc. 3910/2003
The Dollar is Overvalued
0.80.91.01.11.21.31.41.5
1976 1979 1982 1985 1988 1991 1994 1997 2000 2003 2006
Developing Countries Industrial Countries
(Real trade-weighted dollar index, 1996=1.0)

Copyright © 2003 Global Insight, Inc.
Four Event-Filled Decades

Copyright © 2003 Global Insight, Inc. 4110/2003
1960s
“Supply-side” tax cuts
Booming economy
Guns and butter
Rising inflation
Balance of payments crises
Japan rising
Brazil booms

Copyright © 2003 Global Insight, Inc. 4210/2003
1970s
Collapse of Bretton Woods System
Oil and other supply shocks
Stagflation
Wage and price controls
Petro-recycling
Volcker shock
Early attempts by Europe to limit currency movement (snake-in-the-tunnel and snake-in-the-lake)

Copyright © 2003 Global Insight, Inc. 4310/2003
1980s
Debt crisis – Latin America’s lost decade
Reagonomics and Thatchernomics
High real interest rates
Twin deficits but no hard landing of the dollar
Oil price collapse
Stock market crash
Dollar rise and fall
Japanese bubble
German locomotive
Rise of Asia
Fall of the Berlin Wall and the collapse of Communism
Banking crises (including S&L crisis in the U.S.)

Copyright © 2003 Global Insight, Inc. 4410/2003
1990s
German unification
Gulf-war recession
Job-less recovery
Japanese bubble bursts – Japanese policy mistakes and “lost decade”
ERM crises – Maastricht Treaty
Emerging markets crises – Asia loses some of its luster
Tech boom and productivity “miracle”
U.S. becomes only locomotive of growth
EMU
Most fixed exchange rate regimes are abandoned
Inflation drifts down

Copyright © 2003 Global Insight, Inc. 4510/2003
2000s
Tech bust
Mild downturn followed by lackluster recovery
Wealth destruction does not lead to depression
Synchronized global downturn – the macro consequences of globalization?
Deflation spreads
9/11 and wars in Afghanistan and Iraq
Corporate scandals
U.S. still the growth locomotive – CAD balloons
Double-dips in Europe due to tight policies and structural rigidities
Rise of China
Backlash against globalization

Copyright © 2003 Global Insight, Inc. 4610/2003
Forty-Year Trends
Government’s share of output rose
Growth volatility fell
Globalization accelerated (once again)
Cyclical synchronization increased
Inflation rose then fell
Role of capital markets increased
After steady gains from ’45 to ’95, vis-à-vis the U.S., Japan and Europe lost ground after ’95
Since 1970, manufacturing output in industrial economies doubledwhile employment fell 25%
Asia’s share of world GDP rose

Copyright © 2003 Global Insight, Inc. 4710/2003
Global Per Capital Real GDP Growth
The post-Bretton Woods era:
globalization gathers steam
Industrial countries' "Golden Age"
Two World Wars and the intervening
period: de-globalization
The gold standard triumphant
0.0
1.0
2.0
3.0
4.0
1900-13 1913-50 1950-73 1973-2000
(Average annual percentage change)
Source: Angus Maddison, Monitoring the World Economy 1820-1992.

Copyright © 2003 Global Insight, Inc. 4810/2003
World: Real GDP Growth
0
1
2
3
4
5
1980 1984 1988 1992 1996 2000 2004 2008 2012 2016 2020 2024World
(Percent change, annual rate)

Copyright © 2003 Global Insight, Inc. 4910/2003
Real GDP Growth in the U.S.
-4
-2
0
2
4
6
8
1974 1978 1982 1986 1990 1994 1998 2002 2006 2010
GDP
(Percent change)

Copyright © 2003 Global Insight, Inc. 5010/2003
Real Inflation in the U.S.
0
3
6
9
12
15
1974 1978 1982 1986 1990 1994 1998 2002 2006 2010
CPI
(Percent change)
Copyright © 2003 Global Insight, Inc. 5110/2003
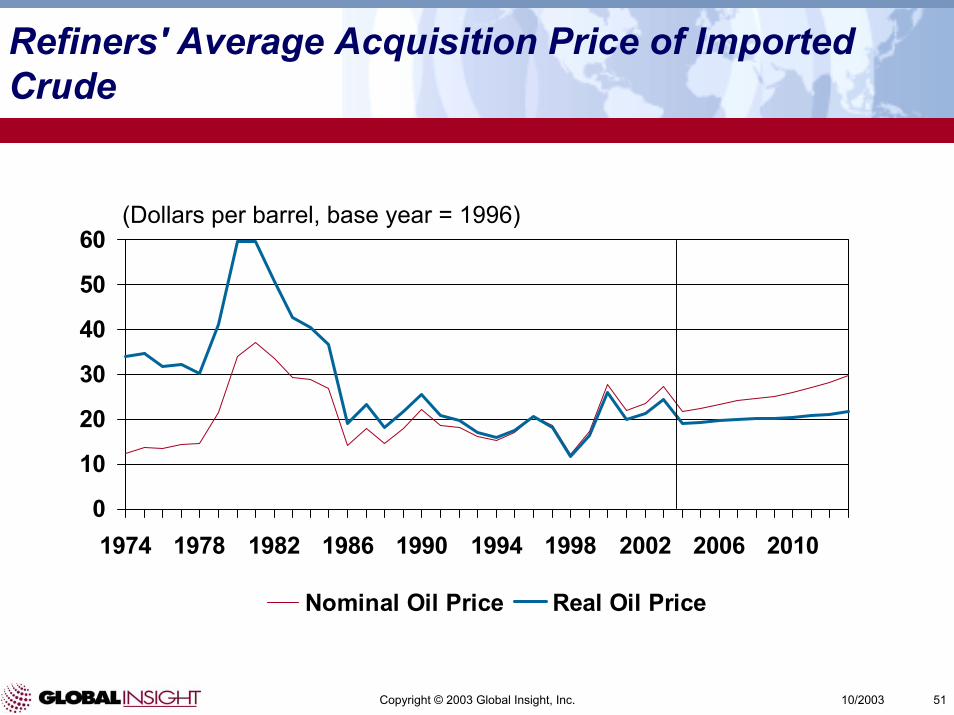
Refiners' Average Acquisition Price of Imported Crude
0
10
20
30
40
50
60
1974 1978 1982 1986 1990 1994 1998 2002 2006 2010
Nominal Oil Price Real Oil Price
(Dollars per barrel, base year = 1996)

Copyright © 2003 Global Insight, Inc. 5210/2003
Economic Volatility
0.75
1.00
1.25
1.50
1.75
2.00
2.25
1961-1970 1971-1980 1981-1990 1991-2000
Japan United Kingdom Euro area* United States
(Standard deviation of output gaps, percent)
* Simple average of Austria, France, Germany, Italy, and Spain.Source: OECD Working Paper no. 315

Copyright © 2003 Global Insight, Inc. 5310/2003
Ratio of Exports to GDP for the World
15
20
25
30
35
40
1979 1983 1987 1991 1995 1999 2003 2007 2011 2015 2019 2023
World Exports
(Percent of GDP)

Copyright © 2003 Global Insight, Inc. 5410/2003
Current Account Deficit
(Percent of GDP)
-6
-4
-2
0
2
4
6
1960 1970 1980 1990 2000 2010 2020
U.S. Europe Japan Asia

Copyright © 2003 Global Insight, Inc. 5510/2003
Comparing the 1980s and the 2000s
World imbalances are bigger
Capital markets are bigger
Inflation is lower
World growth is more fragile – Germany and Japan cannot help
More countries have to be involved in the adjustment process
Little appetite for coordination

Copyright © 2003 Global Insight, Inc. 5610/2003
Net Foreign Debt
Norway (1977)U.S.(1894) U.S. (2003)
Mexico (1980)
Argentina (1980)
Brazil (1980)
U.S. (2007)
New Zealand (1999)
Ireland (1983)Australia (1996)
Finland (1994)Sweden (1994)
Canada (1980)
0
20
40
60
80
100
1999 2004 2009 2014 2019 2024 2029 2034
(Percent of GDP)
Source: IMF; Obstfeld & Rogoff

Copyright © 2003 Global Insight, Inc.
What Have We Learned?

Copyright © 2003 Global Insight, Inc. 5810/2003
Economic Lessons: A Partial List
Markets work
While markets fail, governments fail even more spectacularly – or how governments have turned market dramas into crises
Globalization works (S. Korea, W. Germany, and Taiwan vs. N. Korea, E. Germany, and China)
The business cycle is not dead – but it may have become more benign (and more Austrian)
Boosting domestic demand is more urgent in a synchronized downturn
The combination of aging populations, structural rigidities and poor macro policies in the Eurozone and Japan is a serious threat to the global economy
The U.S. is not like Japan in the 1990s and Japan is not like the U.S. in the 1930s

Copyright © 2003 Global Insight, Inc. 5910/2003
Economic Lessons: A Partial List (Continued)
Deflation may not be a big threat if the banking system is soundand policy makers are vigilant
Bursting asset bubbles don’t necessarily lead to deep recessionsor depressions
No escaping from the trilemma Fixed exchange rates, independent monetary policy, and free flowing capital: a country can have any two but not all three
Fixed exchange rates lead to more pro-cyclical policies than flexible exchange rates – but neither is a substitute for sound macro policies
Labor market flexibility can play an important role in the ability of an economy to respond to positive and negative shocks

Copyright © 2003 Global Insight, Inc. 6010/2003
Forecasting Lessons
Economic forecasters are more like seismologists than weather forecasters
Don’t assume policy makers act rationally
The more frequent the pronouncements about the death of the business cycle, the closer we are to the next downturn
The more frequent the denials about a devaluation, the closer we are to a currency crisis
Avoid the trend line – 1980 headline: $85 a bbl in ’85!
Low probability events can no longer be ignored
Scenarios, scenarios, and more scenarios

Copyright © 2003 Global Insight, Inc.
Where Do We Go From Here?

Copyright © 2003 Global Insight, Inc. 6210/2003
Looking Beyond the Horizon
Will the U.S. dollar crash?
Are we seeing the birth of a new Bretton Woods system?
Are we headed for another emerging market debt crisis?
Is the European Union about to become more rigid or flexible?
Will looming pension “bombs” force Europe and Japan to “privatize” their pension system?
Is “offshore outsourcing” (especially in services and high-tech) the next wave of globalization?
How much (if at all) will the failure at Cancun and terrorism slow globalization?
Are we “one recession away from deflation?”

Copyright © 2003 Global Insight, Inc. 6310/2003
Looking Beyond the Horizon (Continued)
Asia: A million millionaires and a billion boomers?
Will Asia become home to the world’s deepest financial markets?
How sustainable is Chinese growth?
How will China shift the terms of trade?
Will India follow in China’s footsteps or leap-frog manufacturing-led development?