World Economic Outlook, April 2002 -- Chapter 1
60
T here are now increasing signs that the global slowdown, which began in the middle of 2000, has bottomed out. As had been suggested in the October 2001 World Economic Outlook, the events of September 11 had a short-run impact on activity, but—in contrast to the fears that some ex- pressed—have not prevented a recovery in the first half of 2002. 1 Leading indicators have turned up (Figure 1.2); consumer and business confidence have strengthened; and industrial production—including the information technol- ogy (IT) sector—is leveling off. This has been most apparent in the United States and, increas- ingly, the euro area; in Japan, while activity may now be bottoming out, the outlook remains very difficult with few signs of a sustained recovery in domestic demand. In emerging markets, there are signs of recovery in a number of Asian emerging markets—particularly Korea—aided by the nascent improvement in the IT sector, al- though not as yet in most Latin American countries. Growing expectations of recovery have been particularly apparent in financial markets, which recovered strongly after the events of September 11 (Figure 1.3). Equity markets have picked up sharply across the globe, although flattening off in the first quarter of 2002; yield curves have steepened; and risk aversion and spreads—in both mature and emerging markets—have de- clined. Partly reflecting market expectations of the relative pace of recovery, the U.S. dollar has strengthened further, accompanied by a moder- ate weakening of the euro, while the yen has fallen to three-year lows. In emerging markets, contagion from the crisis in Argentina has to date been limited, reflecting the fact that the cri- sis was well anticipated, and that gross interna- tional capital flows were already at low levels (Figure 1.4), as well as a number of technical factors, including the relatively low leverage in the system. 2 Spreads for most emerging market debt have declined sharply since early Novem- ber, and financing conditions for emerging mar- ket borrowers have improved more rapidly than 1 CHAPTER I ECONOMIC PROSPECTS AND POLICY ISSUES Over recent months, there have been increasing signs that the global slowdown has bottomed out, most clearly in the United States and to a lesser extent in Europe and some countries in Asia. While serious concerns remain in a number of countries, notably Japan and—for different reasons—Argentina, most indicators suggest recovery is now under way, broadly along the lines described in the Interim World Economic Outlook issued last December (Figure 1.1). With confidence stabilizing, uncertainties easing, and emerging market financing conditions improv- ing more quickly than was then anticipated, the risks to the outlook have become more balanced, although the recent volatility in the oil market is a significant concern. While the stance of poli- cies should remain relatively supportive for the time being, there is now—except in Japan—little case for additional easing, and in countries where the recovery is most advanced, attention will need to turn toward reversing earlier monetary policy easing. It will be important to take full ad- vantage of the recovery to reduce remaining economic vulnerabilities, and to pursue a collabora- tive approach designed to promote an orderly resolution of global imbalances—which remain a serious risk to economic stability—over the medium term. 1 See Box 1.1, World Economic Outlook, October 2001. 2 See “Contagion and Its Causes,” Chapter I, Appendix I, World Economic Outlook, December 2001.
Transcript of World Economic Outlook, April 2002 -- Chapter 1

There are now increasing signs that theglobal slowdown, which began in themiddle of 2000, has bottomed out. Ashad been suggested in the October
2001 World Economic Outlook, the events ofSeptember 11 had a short-run impact on activity,but—in contrast to the fears that some ex-pressed—have not prevented a recovery in thefirst half of 2002.1 Leading indicators haveturned up (Figure 1.2); consumer and businessconfidence have strengthened; and industrialproduction—including the information technol-ogy (IT) sector—is leveling off. This has beenmost apparent in the United States and, increas-ingly, the euro area; in Japan, while activity maynow be bottoming out, the outlook remains verydifficult with few signs of a sustained recovery indomestic demand. In emerging markets, thereare signs of recovery in a number of Asianemerging markets—particularly Korea—aided bythe nascent improvement in the IT sector, al-though not as yet in most Latin Americancountries.
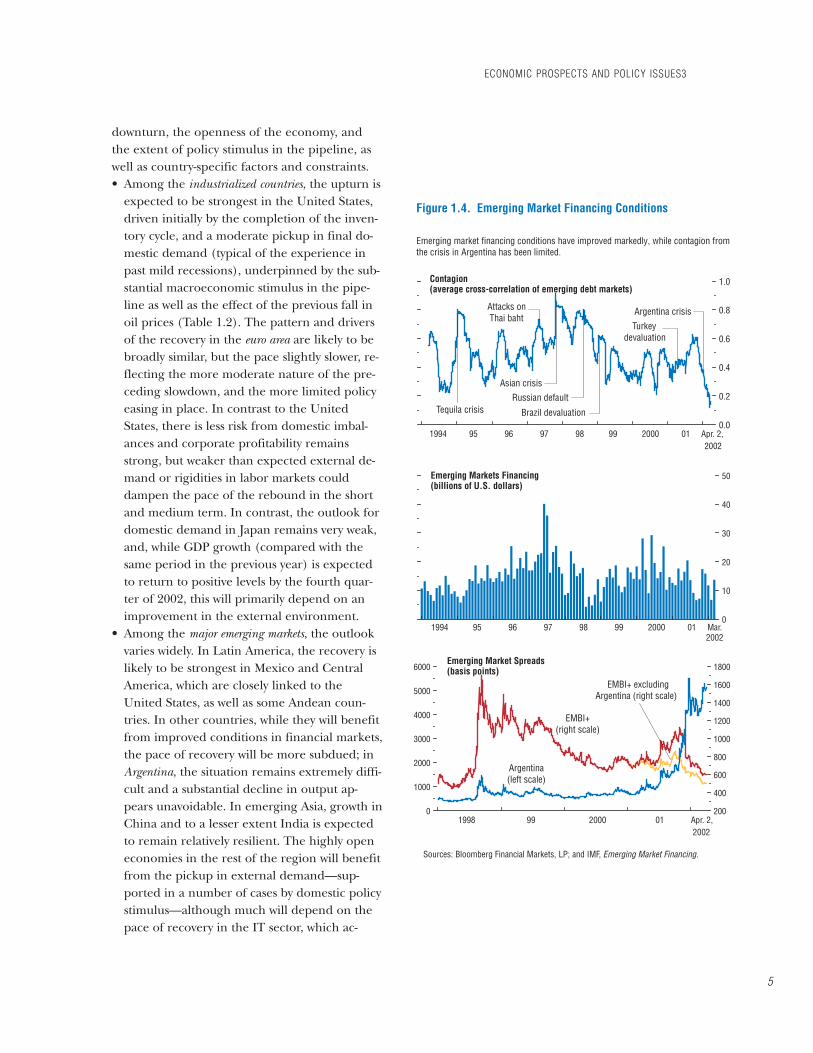
Growing expectations of recovery have beenparticularly apparent in financial markets, whichrecovered strongly after the events of September11 (Figure 1.3). Equity markets have picked upsharply across the globe, although flattening offin the first quarter of 2002; yield curves havesteepened; and risk aversion and spreads—inboth mature and emerging markets—have de-clined. Partly reflecting market expectations ofthe relative pace of recovery, the U.S. dollar hasstrengthened further, accompanied by a moder-ate weakening of the euro, while the yen hasfallen to three-year lows. In emerging markets,contagion from the crisis in Argentina has todate been limited, reflecting the fact that the cri-sis was well anticipated, and that gross interna-tional capital flows were already at low levels(Figure 1.4), as well as a number of technicalfactors, including the relatively low leverage inthe system.2 Spreads for most emerging marketdebt have declined sharply since early Novem-ber, and financing conditions for emerging mar-ket borrowers have improved more rapidly than
1
CHAPTER I ECONOMIC PROSPECTS AND POLICY ISSUES
Over recent months, there have been increasing signs that the global slowdown has bottomedout, most clearly in the United States and to a lesser extent in Europe and some countries inAsia. While serious concerns remain in a number of countries, notably Japan and—for differentreasons—Argentina, most indicators suggest recovery is now under way, broadly along the linesdescribed in the Interim World Economic Outlook issued last December (Figure 1.1). Withconfidence stabilizing, uncertainties easing, and emerging market financing conditions improv-ing more quickly than was then anticipated, the risks to the outlook have become more balanced,although the recent volatility in the oil market is a significant concern. While the stance of poli-cies should remain relatively supportive for the time being, there is now—except in Japan—littlecase for additional easing, and in countries where the recovery is most advanced, attention willneed to turn toward reversing earlier monetary policy easing. It will be important to take full ad-vantage of the recovery to reduce remaining economic vulnerabilities, and to pursue a collabora-tive approach designed to promote an orderly resolution of global imbalances—which remain aserious risk to economic stability—over the medium term.
1See Box 1.1, World Economic Outlook, October 2001.2See “Contagion and Its Causes,” Chapter I, Appendix I, World Economic Outlook, December 2001.

earlier anticipated, with high-quality borrowersreaccessing markets toward the end of 2001, fol-lowed increasingly thereafter by non-investment-grade issuers.
The recovery is being underpinned by a num-ber of factors. First, and most important, macro-economic policies in advanced countries havebeen substantially eased over the past year, no-tably in the United States, and—particularly sinceinterest rate cuts were anticipated by markets,and therefore built into asset prices in advance—should now be providing increasing support todemand. Policies in a number of emerging mar-ket countries, especially in Asia, have also beeneased, although in most others the scope hasbeen relatively limited. Second, the completionof ongoing inventory cycles, which appears mostadvanced in the United States but is also underway in Europe, will support economic activity.Finally, activity has also been supported by thedecline in oil prices since late 2000. Since lateFebruary, however, oil prices have risen signifi-cantly, reflecting concerns about possible militaryintervention in the Middle East, the deterioratingsecurity situation in Israel and the West Bank andGaza, as well as the strengthening global recov-ery. At the time the World Economic Outlook wentto press, oil prices had returned to broadly theirmid-2001 level, still well below their fall 2000peak, and prices in futures markets were onlymoderately higher than the oil price assumptionon which the forecasts in this World EconomicOutlook are based (Table 1.1). Nonetheless, thepast fall in oil prices will provide less support torecovery than earlier expected, while the poten-tial for further volatility has become a significantrisk to the outlook.
Inflationary pressures have continued to ease,reflecting weaker global activity. In advancedcountries, inflation is projected to fall to 1.3 per-cent in 2002, the lowest level on record, and—while important wage negotiations in the euroarea are still in train—wage increases have ingeneral been moderate. Indeed, if sustained, in-flation this low could be a concern, since itcould limit the ability of central banks to engi-neer negative real interest rates when neces-
CHAPTER I ECONOMIC PROSPECTS AND POLICY ISSUES
2
1970 75 80 85 90 95 2000 05-6
-3
0
3
6
9
1970 75 80 85 90 95 2000 050
5
10
15
20
World Real Long-Term Interest Rate (percent)
1970 75 80 85 90 95 2000 050
100
200
300
400
1970 75 80 85 90 95 2000 050
2
4
6
8
Figure 1.1. Global Indicators
Developing countries (consumer prices,
median)
World Real GDP
Trend,1970–2001
While global growth is expected to increase moderately in 2002, this disguises a sharper pickup in activity during the year (see text). Inflation remains subdued.
2
1
1
3
Inflation
Advanced economies
(consumer prices)
Real Commodity Prices(1990 = 100)
Non-oil commodity
prices
Oil prices
(Annual percent change unless otherwise noted)
2
3
Shaded areas indicate IMF staff projections. Aggregates are computed on the basis of purchasing-power-parity weights unless otherwise indicated. Average growth rates for individual countries, aggregated using purchasing- power-parity weights; these shift over time in favor of faster growing countries, giving the line an upward trend. GDP-weighted average of the 10-year (or nearest maturity) government bond yields less inflation rates for the United States, Japan, Germany, France, Italy, the United Kingdom, and Canada. Excluding Italy prior to 1972.
1970 75 80 85 90 95 2000 05-1
0
1
2
3
4
5
6 World Real Per Capita GDP
Trend,1970–20012
1970 75 80 85 90 95 2000 05-4
0
4
8
12
16
Trend,1970–20012
World Trade Volume (goods and services)

sary.3 Deflation remains a central issue in Japan,where prices appear set to fall for the fourth suc-cessive year. Elsewhere, however, the forces re-straining prices are likely to ease as recovery getsunder way, as excess capacity declines and com-modity prices—especially oil—pickup (seeAppendix 1.1). In emerging and developingcountries, inflation is also projected to fall, al-though it remains of concern in the Common-wealth of Independent States—especially the lessadvanced reformers—some European Union(EU) accession countries, and a few countries inLatin America and Africa.
Assuming that the recovery is sustained, thisglobal slowdown—while seriously affecting manycountries and regions—will have proved to bemore moderate than most previous downturns,and would probably not qualify as a full-fledgedglobal recession (Box 1.1). Global GDP growthand global per capita GDP growth (the bestmeasure of the impact on global welfare) wouldremain above the troughs experienced in thethree major global recessions of the past 30 years(although below the level experienced duringthe Asian crisis in 1997–98). This partly reflectslong-run structural trends, including the ten-dency toward milder recessions in industrialcountries (see Chapter III), and the growingrole of China and India, which—being relativelyclosed—are less affected by global downturns(although these factors are at least partly offsetby countervailing forces, including increasing fi-nancial and corporate sector linkages). However,it clearly also reflects the generally prompt andaggressive response of policymakers to the slow-down, and—linked to that—the progress thathas been made in reducing vulnerabilities andstrengthening economic fundamentals in ad-vanced and developing countries.4 As experi-ence during the past year has shown, managingthe downturn has been considerably easier incountries with the scope for policy flexibility,
ECONOMIC PROSPECTS AND POLICY ISSUES
3
Figure 1.2. Emerging Signs of Recovery
Sources: Haver Analytic. Business confidence for the United States, the National Association of Purchasing Managers; for the euro area, the European Commission; and for Japan, Bank of Japan. Consumer confidence for the United States, the Conference Board; for the euro area, the European Commission; and for Japan, the Economic Planning Agency. Leading indicator for the United States, the Economic Cycle Research Institute; for Japan, the Cabinet Office; for Canada, Statistics Canada; and for Germany, France, Italy, and United Kingdom, OECD Main Economic Indicators. Australia, Canada, Denmark, Euro area, Japan, New Zealand, Norway, Sweden, Switzerland, United Kingdom, and United States. Argentina, Brazil, Chile, China, Colombia, Czech Republic, Hong Kong SAR, Hungary, India, Indonesia, Israel, Korea, Malaysia, Mexico, Peru, Philippines, Poland, Russia, Singapore, South Africa, Taiwan Province of China, Thailand, Turkey, and Venezuela. Seasonally adjusted.
Signs of recovery are suggested by recent improvements in confidence and other leading indicators, particularly in the United States and Europe.
-20
-10
0
10
20
30
40
-10
-5
0
5
10
15 Industrial Production(percent change from a year earlier)
World
Global Trade(percent change from a year earlier)
World
Industrialcountries
Emerging markets
Industrialcountries
Emerging markets
1999 2000 01 Jan. 2002
20
40
60
80
100
120
140
160
-14
-12
-10
-8
-6
-4
-2
0
2
4
32
36
40
44
48
52
56
60
-50
-40
-30
-20
-10
0
10
20Business ConfidenceEuro area
(right scale)
Consumer Confidence
1999 2000 01 Mar. 2002
United States(left scale)
Japan(right scale)
1999 2000 01 Mar. 2002
United States(left scale)
Euro area(right scale)
Japan(left scale)
1999 2000 01 Jan. 2002
1
1
22
1
2
92
96
100
104
108
112
116
90
95
100
105
110
115
120
125 Leading Indicators(January 1999 = 100)
Japan
Leading Indicators(January 1999 = 100)
1999 2000 01 Feb. 2002
United States
Canada
Germany
1999 2000 01 Feb. 2002
FranceItaly
UnitedKingdom
3
3
3See Box 2.2, “Can Inflation Be Too Low?”4See “Statement of the Managing Director on the
Situation of the World Economy and the Fund Response,”IMF News Brief No. 01/98, October 5, 2001.

while others have been forced to follow moreprocyclical policies, deepening the downturnand likely also slowing the ensuing recovery.
The main elements of the IMF’s global fore-cast published in the Interim World EconomicOutlook last December—which projected an up-turn in the first half of 2002—have remainedbroadly unchanged. Global growth in 2002 isprojected at 2.8 percent, somewhat higher thanexpected in December (Table 1.1). Growth inthe United States—and countries with close eco-nomic links—has been revised significantly up-ward, as the pace of recovery has exceeded ex-pectations. Elsewhere, adjustments to the forecastare more modest—with the exception of theWestern Hemisphere, mainly due to the crisis inArgentina; the Middle East, due to lower than ex-pected growth in oil exporters; and theCommonwealth of Independent States, reflectingthe improved outlook for Russia. It is importantto recognize that, while global GDP growth for2002 is projected to be only slightly higher thanin 2001, this disguises a substantial pickup duringthe year. As can be seen from Figure 1.5, globalgrowth is projected to rise from 1!/2 percent inthe last quarter of 2001 to nearly 4 percent bythe end of 2002. As the full impact of this is felt,global growth is expected to rise to 4.0 percent in2003, significantly above the long-run trend.
The global downturn has been more synchro-nized than the one in the early 1990s (although,as discussed in Chapter III, the degree of syn-chronicity has been broadly typical from alonger-term historical perspective). This has pri-marily been due to the commonality of shocks—notably, the bursting of the IT bubble, the run-up in oil prices in 2000, and the tightening ofmonetary policy from mid-1999 to end-2000—but has also reflected the increasing linkagesacross countries, particularly in the corporateand financial sphere. This naturally gives rise tothe question whether the upturn in activity willbe as synchronized. The IMF staff’s projectionssuggest that the recovery in most regions will be-gin in the first half of 2002, with the UnitedStates in the lead, but the nature and pace willvary depending on the depth of the preceding
CHAPTER I ECONOMIC PROSPECTS AND POLICY ISSUES
4
60
80
100
120
140
160
180
200
220
240
80
100
120
140
160
180
Figure 1.3. Financial Market Optimism
As expectations of a recovery have increased, financial markets have strengthened in almost all countries, accompanied by steepening yield curves and declining risk premiums and spreads.
DJ Euro Stoxx
Wilshire5000
Mature Equity Markets(September 11, 2001 = 100; national currency)
Eastern Europe and Middle East
Asia
2000 2001 Apr. 3, 2002
LatinAmerica
Sources: Bloomberg Financial Markets, LP; State Street Bank; and IMF staff estimates.
Topix
Emerging Equity Markets(September 11, 2001 = 100; U.S. dollars)
0
2
4
6
8
0
2
4
6
8
Euroarea
United States
Short-Term Interest Rates(3-month LIBOR; percent)
2000 2001 Dec. 2002
Japan
Long-Term Interest Rates(10-year government bond; percent)
2000 2001 Apr. 2, 2002
United States
Euro area
Japan
Futures
Futures
2000 2001 Dec. 2002
0
200
400
600
800
1000
-1.0
-0.5
0.0
0.5
1.0 Monthly Risk Appetite Index(past 6 months)
High yield spread
AAA spread
2000 2001 Apr. 2, 2002
BAA spread
Interest Rate Spreads(basis points)
2000 2001 Apr. 2, 2002
downturn, the openness of the economy, andthe extent of policy stimulus in the pipeline, aswell as country-specific factors and constraints.• Among the industrialized countries, the upturn is
expected to be strongest in the United States,driven initially by the completion of the inven-tory cycle, and a moderate pickup in final do-mestic demand (typical of the experience inpast mild recessions), underpinned by the sub-stantial macroeconomic stimulus in the pipe-line as well as the effect of the previous fall inoil prices (Table 1.2). The pattern and driversof the recovery in the euro area are likely to bebroadly similar, but the pace slightly slower, re-flecting the more moderate nature of the pre-ceding slowdown, and the more limited policyeasing in place. In contrast to the UnitedStates, there is less risk from domestic imbal-ances and corporate profitability remainsstrong, but weaker than expected external de-mand or rigidities in labor markets coulddampen the pace of the rebound in the shortand medium term. In contrast, the outlook fordomestic demand in Japan remains very weak,and, while GDP growth (compared with thesame period in the previous year) is expectedto return to positive levels by the fourth quar-ter of 2002, this will primarily depend on animprovement in the external environment.
• Among the major emerging markets, the outlookvaries widely. In Latin America, the recovery islikely to be strongest in Mexico and CentralAmerica, which are closely linked to theUnited States, as well as some Andean coun-tries. In other countries, while they will benefitfrom improved conditions in financial markets,the pace of recovery will be more subdued; inArgentina, the situation remains extremely diffi-cult and a substantial decline in output ap-pears unavoidable. In emerging Asia, growth inChina and to a lesser extent India is expectedto remain relatively resilient. The highly openeconomies in the rest of the region will benefitfrom the pickup in external demand—sup-ported in a number of cases by domestic policystimulus—although much will depend on thepace of recovery in the IT sector, which ac-
ECONOMIC PROSPECTS AND POLICY ISSUES3
5
0
1000
2000
3000
4000
5000
6000
200
400
600
800
1000
1200
1400
1600
1800
0.0
0.2
0.4
0.6
0.8
1.0
1994 95 96 97 98 99 2000 01 Apr. 2, 2002
0
10
20
30
40
50
Emerging market financing conditions have improved markedly, while contagion from the crisis in Argentina has been limited.
Figure 1.4. Emerging Market Financing Conditions
Tequila crisis
Asian crisisRussian default
Turkeydevaluation
Emerging Markets Financing(billions of U.S. dollars)
Contagion(average cross-correlation of emerging debt markets)
1994 95 96 97 98 99 2000 01 Mar. 2002
1998 99 2000 01 Apr. 2, 2002
Emerging Market Spreads(basis points)
Brazil devaluation
Argentina crisis
Sources: Bloomberg Financial Markets, LP; and IMF, Emerging Market Financing.
EMBI+(right scale)
EMBI+ excludingArgentina (right scale)
Argentina(left scale)
Attacks onThai baht

CHAPTER I ECONOMIC PROSPECTS AND POLICY ISSUES
6
Table 1.1. Overview of the World Economic Outlook Projections(Annual percent change unless otherwise noted)
Difference from December
Current Projections 2001 Projections1_________________ ________________2000 2001 2002 2003 2001 2002
World output 4.7 2.5 2.8 4.0 0.1 0.4Advanced economies 3.9 1.2 1.7 3.0 0.1 0.8
Major advanced economies 3.5 1.1 1.5 2.8 0.1 0.9United States 4.1 1.2 2.3 3.4 0.2 1.6Japan 2.2 –0.4 –1.0 0.8 — —Germany 3.0 0.6 0.9 2.7 0.1 0.2France 3.6 2.0 1.4 3.0 –0.1 0.1Italy 2.9 1.8 1.4 2.9 — 0.2United Kingdom 3.0 2.2 2.0 2.8 –0.1 0.2Canada 4.4 1.5 2.5 3.6 0.1 1.7
Other advanced economies 5.3 1.6 2.5 3.7 0.1 0.6MemorandumEuropean Union 3.4 1.7 1.5 2.9 — 0.2
Euro area 3.4 1.5 1.4 2.9 — 0.2Newly industrialized Asian economies 8.5 0.8 3.6 5.1 0.4 1.6Developing countries 5.7 4.0 4.3 5.5 –0.1 –0.2
Africa 3.0 3.7 3.4 4.2 0.1 –0.2Developing Asia 6.7 5.6 5.9 6.4 — 0.2
China 8.0 7.3 7.0 7.4 — 0.2India 5.4 4.3 5.5 5.8 –0.1 0.3ASEAN-42 5.1 2.6 3.3 4.1 0.2 0.4
Middle East and Turkey3 5.8 2.1 3.3 4.5 –0.1 –0.7Western Hemisphere 4.0 0.7 0.7 3.7 –0.3 –1.0
Brazil 4.4 1.5 2.5 3.5 –0.3 0.5Countries in transition 6.6 5.0 3.9 4.4 — 0.2
Central and eastern Europe 3.8 3.1 3.0 4.0 0.1 –0.2Commonwealth of Independent
States and Mongolia 8.3 6.2 4.5 4.6 0.1 0.6Russia 9.0 5.0 4.4 4.9 –0.8 0.8Excluding Russia 7.0 8.8 4.7 4.1 1.9 —
MemorandumWorld growth based on market exchange rates 4.0 1.4 1.8 3.2 — 0.6World trade volume (goods and services) 12.4 –0.2 2.5 6.6 –1.2 0.3Imports
Advanced economies 11.6 –1.5 2.1 6.6 –1.2 0.7Developing countries 16.0 2.9 6.4 7.7 –2.0 –0.1Countries in transition 13.2 10.8 8.0 7.7 –0.5 0.2
ExportsAdvanced economies 11.7 –1.3 0.9 6.3 –1.0 0.3Developing countries 15.0 3.0 4.8 7.0 –0.5 0.2Countries in transition 14.6 6.3 5.2 6.1 –1.5 –1.4
Commodity prices (U.S. dollars)Oil4 57.0 –14.0 –5.3 –4.4 — 18.4Nonfuel (average based on world commodity export weights) 1.8 –5.5 –0.1 7.2 — –1.8Consumer pricesAdvanced economies 2.3 2.2 1.3 1.8 –0.1 —Developing countries 6.1 5.7 5.8 5.1 –0.3 0.5Countries in transition 20.2 15.9 10.8 8.7 –0.3 –0.3Six-month London interbank offered rate (LIBOR, percent)On U.S. dollar deposits 6.6 3.7 2.8 4.5 –0.1 0.1On Japanese yen deposits 0.3 0.2 0.1 0.1 — —On euro deposits 4.6 4.1 3.7 4.5 — 0.8
Note: Real effective exchange rates are assumed to remain constant at the levels prevailing during February 11–March 11, 2002.1Using updated purchasing-power-parity (PPP) weights, summarized in the Statistical Appendix, Table A.2Includes Indonesia, Malaysia, the Philippines, and Thailand.3Includes Malta.4Simple average of spot prices of U.K. Brent, Dubai, and West Texas Intermediate crude oil. The average price of oil in U.S. dollars a barrel
was $24.28 in 2001; the assumed price is $23.00 in 2002, and $22.00 in 2003.

counts for a substantial share of output and ex-ports. In the Middle East, growth has been ad-versely affected by lower oil prices—althoughthe recent rebound will help—as well as thedeterioration in the security situation. Turkeyis gradually recovering from the severe reces-sion of 2001, but the economy remains vulner-able to adverse shocks. In contrast, growth inthe Commonwealth of Independent States hasbeen relatively unaffected by the slowdown,buoyed by solid growth in Russia and Ukraine.Activity in central and eastern Europeaneconomies—except Poland—has also held upwell, aided by robust domestic demand andforeign direct investment.
• While the poorest countries have clearly beenadversely affected by the slowdown, primarilythrough lower commodity prices and fallingexternal demand, growth has in general beensurprisingly well sustained, especially in thosecountries with the strongest domestic policies.This has been aided by the ending of a num-ber of conflicts in Africa, as well as the re-sources released under the Heavily IndebtedPoor Countries Initiative (HIPC). Growth inthe HIPC countries is projected to pick up fur-ther in 2003 and beyond, although it is impor-tant to recognize that in the past the IMF’sforecasts for African countries have provedconsistently optimistic.5
As noted above, the risks to the forecast havebecome more balanced over the past months.There are good reasons to expect a pickup in ac-tivity in the period ahead; indeed it is possiblethat the pace of recovery could exceed expecta-tions, as has generally been the case in the past(Box 1.2). Nonetheless, there are also significantrisks to the sustainability and durability of theupturn, in the United States and elsewhere,which will pose important challenges for policy-makers in the period ahead.• First, the late 1990s saw the cumulative develop-
ment of a number of imbalances in the U.S. and the
ECONOMIC PROSPECTS AND POLICY ISSUES
7
-3
-2
-1
0
1
2
3
4
5
6
-1
0
1
2
3
4
5
6
7
Figure 1.5. Global Recovery(Percent change from four quarters earlier)
Real GDP in most regions is expected to have bottomed out in late 2001, with a recovery beginning in the first half of 2002.
WorldIndustrial
Emerging markets
Euroarea Japan
1996 98 2000 2002
1
United States
Sources: Haver Analytics; and IMF staff estimates. Australia, Canada, Denmark, euro area, Japan, New Zealand, Norway, Sweden, Switzerland, the United Kingdom, and the United States. Hong Kong SAR, Korea, Singapore, and Taiwan Province of China. Indonesia, Malaysia, Philippines, and Thailand. Czech Republic, Hungary, Israel, Poland, Russia, South Africa, and Turkey. Argentina, Brazil, Chile, Colombia, Mexico, Peru, and Venezuela.
1
2345
1996 98 2000 2002
-4
-2
0
2
4
6
8
-12
-8
-4
0
4
8
12 China and India
NIEs
Emerging Asia Other emerging markets
Latin America
1996 98 2000 2002
2
1996 98 2000 2002
ASEAN-43
4
5
5In part reflecting the impact of natural disasters andconflicts. See Box 3.1, Interim World Economic Outlook,December 2001.

global economy—notably, the large U.S. currentaccount deficit and surpluses elsewhere (Table1.3), the low U.S. personal savings rate, the ap-parent overvaluation of the U.S. dollar andundervaluation of the euro, and relativelyhigh levels of corporate and household in-debtedness in a number of countries. As hasbeen discussed extensively in previous issuesof the World Economic Outlook, these imbal-ances have been driven in large part by therelatively rapid growth in the United Statesrelative to other countries. This, in turn, partlyreflected cyclical factors, but also resultedfrom the improvement in U.S. productivity
growth relative to other countries. Partly be-cause the downturn has been so synchronizedand the recession in the United States hasbeen mild, there has been only a moderatecorrection in these imbalances during thedownturn, and the process by which this cor-rection eventually occurs will importantly affectthe outlook. For example, given the substantialstimulus in the pipeline, it is possible U.S.growth could rebound more quickly than ex-pected, which would lead to a further widen-ing of these imbalances. While this would likelybe manageable in the short term, especially ifunderlying U.S. productivity growth remained
CHAPTER I ECONOMIC PROSPECTS AND POLICY ISSUES
8
Table 1.2. Advanced Economies: Real GDP, Consumer Prices, and Unemployment(Annual percent change and percent of labor force)
Real GDP Consumer Prices Unemployment____________________________ ____________________________ ____________________________2000 2001 2002 2003 2000 2001 2002 2003 2000 2001 2002 2003
Advanced economies 3.9 1.2 1.7 3.0 2.3 2.2 1.3 1.8 5.9 6.0 6.4 6.2Major advanced economies 3.5 1.1 1.5 2.8 2.3 2.1 1.1 1.7 5.8 6.0 6.5 6.3
United States 4.1 1.2 2.3 3.4 3.4 2.8 1.4 2.4 4.0 4.8 5.5 5.3Japan 2.2 –0.4 –1.0 0.8 –0.8 –0.7 –1.1 –0.5 4.7 5.0 5.8 5.7Germany 3.0 0.6 0.9 2.7 2.1 2.4 1.5 1.2 7.9 7.9 8.2 8.1France 3.6 2.0 1.4 3.0 1.8 1.8 1.5 1.4 9.5 9.0 9.2 8.7Italy 2.9 1.8 1.4 2.9 2.6 2.7 2.2 1.6 10.6 9.5 9.3 8.9United Kingdom1 3.0 2.2 2.0 2.8 2.1 2.1 2.4 2.5 5.6 5.1 5.4 5.4Canada 4.4 1.5 2.5 3.6 2.7 2.5 0.9 1.8 6.8 7.2 7.1 6.7
Other advanced economies 5.3 1.6 2.5 3.7 2.4 2.9 2.0 2.1 6.2 6.1 6.3 5.8Spain 4.1 2.8 2.3 3.2 3.5 3.2 2.3 2.3 14.1 13.0 13.0 12.4Netherlands 3.5 1.1 1.4 2.7 2.3 5.1 3.4 2.3 2.6 2.0 2.5 2.7Belgium 4.0 1.1 0.9 3.2 2.7 2.4 1.1 1.2 6.9 6.6 7.3 7.0Sweden 3.6 1.2 1.6 2.7 1.0 2.6 2.3 2.2 4.7 4.0 4.4 4.3Austria 3.0 1.0 1.3 2.9 2.0 2.3 1.8 1.6 3.7 3.8 4.1 3.8Denmark 3.0 0.9 1.3 2.4 2.9 2.1 2.3 2.2 5.2 5.0 5.2 5.2Finland 5.7 0.7 1.4 3.1 3.0 2.6 1.5 1.6 9.8 9.2 9.8 9.7Greece 4.3 4.1 3.4 2.9 2.9 3.7 3.3 2.7 11.4 10.9 10.9 10.7Portugal 3.2 1.6 0.8 2.0 2.8 4.4 2.9 2.2 4.0 4.1 4.2 4.3Ireland 11.5 6.0 3.2 6.2 5.3 4.0 4.4 3.0 4.3 4.0 4.7 4.7Luxembourg 7.5 5.1 3.0 6.0 3.2 2.7 1.9 1.8 2.6 2.5 2.9 2.7
Switzerland 3.0 1.3 0.8 2.6 1.6 1.0 1.0 1.0 2.0 1.9 2.6 2.3Norway 2.3 1.4 2.3 2.2 3.1 3.0 1.5 2.5 3.4 3.6 3.8 3.7Israel 6.4 –0.6 1.3 3.8 1.1 1.1 3.1 2.1 8.8 9.3 10.5 9.4Iceland 5.0 2.1 –0.9 1.9 5.0 6.7 6.4 3.5 1.3 1.7 2.3 2.6Cyprus 5.1 4.0 3.0 4.2 4.1 2.0 1.8 2.2 3.4 3.6 3.8 4.0
Korea 9.3 3.0 5.0 5.5 2.3 4.1 2.7 2.6 4.1 3.7 3.5 3.5Australia2 3.2 2.4 3.9 4.0 4.5 4.4 2.3 2.3 6.3 6.7 6.7 6.5Taiwan Province of China 5.9 –1.9 2.3 4.8 1.3 — 0.4 1.6 3.0 5.1 5.0 4.9Hong Kong SAR 10.5 0.1 1.5 3.6 –3.7 –1.6 –2.5 — 4.9 5.0 5.6 5.4Singapore 10.3 –2.1 3.2 5.1 1.1 1.0 1.1 1.6 3.1 4.7 4.4 3.7New Zealand2 3.9 2.4 2.6 3.0 2.7 2.7 1.8 1.5 6.0 5.3 5.5 5.6
MemorandumEuropean Union 3.4 1.7 1.5 2.9 2.3 2.6 2.0 1.8 8.2 7.7 7.9 7.7
Euro area 3.4 1.5 1.4 2.9 2.4 2.6 1.9 1.6 8.8 8.3 8.5 8.2
1Consumer prices are based on the retail price index excluding mortgage interest.2Consumer prices excluding interest rate components; for Australia, also excluding other volatile items.

strong, it could adversely affect the sustainabil-ity of recovery later on, particularly if growthin other countries did not pick up, and in-crease the possibility of an eventual disorderlyadjustment.6 It is also possible, however, thatthe recovery in the United States could beweaker than expected, partly because of theimbalances—for instance, if private investmentis held back by weak profitability or excess ca-pacity proves more widespread than presentlybelieved, or if U.S. households and businesses
seek to strengthen savings and balance sheetsearlier. In that case, the imbalances wouldlikely correct sooner, but at the cost of a moresubdued recovery in both the United Statesand the rest of the world.
• Second, as also stressed in the IMF’s GlobalFinancial Stability Report, financial markets maystill embody relatively optimistic expectations for cor-porate profitability and the pace of recovery. Werethese expectations to be disappointed, therewould likely be a downward adjustment in as-set prices, which could adversely affect bothconsumer and business confidence and de-mand more generally. These risks may beheightened by the weaknesses in the account-ing and auditing framework highlighted fol-lowing the recent collapse of Enron, whichhas raised concerns that the financial posi-tions of other firms could also prove weakerthan expected. Beyond this, while the interna-tional financial infrastructure has generallyheld up well in the face of the shocks experi-enced in 2001, a decline in asset prices or de-layed recovery could put pressure on financialinstitutions in countries where the pace ofconsolidation and restructuring has lagged, aswell as the performance of certain financialmarkets, notably for credit derivatives.
• Third, the situation in Japan, which is presently un-dergoing its worst recession in the postwar period, re-mains a source of serious concern. Given the lim-ited macroeconomic policy options, weakactivity in Japan is proving increasingly diffi-cult to offset through policy actions—withnegative consequences, particularly for therest of the region. The financial position ofthe banking system has become increasinglystrained as loan-loss announcements have in-creased, and this is undermining confidence.Further, growing concerns about debt sustain-ability and additional downgrades by ratingagencies make the government bond marketvulnerable to a sharp swing in investor senti-ment and a spike in yields.
ECONOMIC PROSPECTS AND POLICY ISSUES
9
Table 1.3. Selected Economies: Current Account Positions(Percent of GDP)
2000 2001 2002 2003
Advanced economies –1.0 –0.8 –0.8 –0.7 Major advanced economies –1.6 –1.4 –1.4 –1.4
United States –4.5 –4.1 –4.1 –4.0Japan 2.5 2.1 2.9 3.4Germany –1.0 0.5 0.5 0.6France 1.8 2.5 2.5 2.2Italy –0.5 0.4 0.7 1.0United Kingdom –1.8 –1.8 –2.1 –2.3Canada 2.5 2.7 1.8 1.6
Other advanced economies 1.8 2.5 2.4 2.3Spain –3.1 –2.0 –1.7 –1.6Netherlands 3.0 3.1 3.7 3.3Belgium-Luxembourg 4.8 4.9 4.9 4.7Sweden 2.6 3.3 3.0 3.0Austria –2.8 –2.4 –1.6 –1.4Denmark 1.6 2.9 2.5 3.2Finland 7.4 5.4 4.8 4.9Greece –6.8 –6.2 –6.1 –6.0Portugal –10.4 –9.7 –9.3 –8.9Ireland –0.6 –0.6 –1.4 –1.6
Switzerland 12.9 10.2 10.8 11.3Norway 14.3 14.8 13.9 13.1Israel –1.2 –1.5 –1.7 –2.1Iceland –10.3 –6.9 –5.2 –3.9Cyprus –5.2 –4.3 –3.9 –3.7
Korea 2.7 2.0 1.5 0.6Australia –4.0 –2.6 –3.2 –2.7Taiwan Province of China 2.9 6.7 6.6 6.6Hong Kong SAR 5.5 7.4 7.7 7.7Singapore 17.0 23.3 21.4 21.4New Zealand –5.6 –3.2 –4.5 –4.2
MemorandumEuropean Union –0.4 0.4 0.4 0.4
Euro area1 –0.2 0.7 0.8 0.8
1Calculated as the sum of the balances of individual euro areacountries.
6See also “Alternative Scenarios: How Might Medium-Term Productivity Growth Affect the Short-Term Outlook?”Chapter I, Appendix II, World Economic Outlook, October 2001, for a detailed discussion.

CHAPTER I ECONOMIC PROSPECTS AND POLICY ISSUES
10
Perhaps the most conventional rule of thumbfor defining a national recession is two straightquarters of negative GDP growth (see ChapterIII on recessions). Unfortunately, this simple ruledoes not translate well to the global context.First, quarterly real GDP data are weak; for anumber of major emerging market countries,quarterly output data do not exist before themid-1990s, and there are still many countriesthat do not report GDP on a quarterly basis.Even among those that do, national methods forseasonally adjusting output data differ to such anextent that meaningful aggregation is difficult.Second, while we cannot measure it exactly, it islikely that quarterly global growth does not turnnegative nearly as often as does GDP within thetypical country. Indeed, annual global growthhas never been negative for any year in recenthistory (see the first figure, which shows globalGDP growth using the IMF’s purchasing-power-parity (PPP) weights to aggregate countryincome.)
The principal reason that global growth israrely negative is that world output is more di-versified than national output. For example, theUnited States, Europe, and Japan do not alwaysexperience downturns at the same time. Data onannual real GDP indicate that this slowdown hasa similar level of synchronization as earlierepisodes in the mid-1970s and early 1980s, eventhough growth in China (in particular) has re-mained relatively robust over this slowdown.The lower level of synchronization in the early1990s was an exception—largely reflecting spe-cific regional events, including the asset pricebubble in Japan and the consequences ofGerman unification activity in continentalEurope. It is also the case that trend growth forthe world is higher than for most advancedeconomies because developing countries growfaster on average, so it takes a steeper dip to hitnegative territory.
While global output may rarely decline, it isuseful to have a simple benchmark for identify-
Box 1.1. Was It a Global Recession?
The main authors are Kenneth Rogoff, DavidRobinson, and Tamim Bayoumi, in consultation withother members of a committee that included CarmenReinhart, Manmohan Kumar, and Aasim Husain.
1970 75 80 85 90 95 20000
2
4
6
8
-15
-10
-5
0
5
10
15
20
25Monthly Indices of Global Activity
Trade1
Industrial production2
Sources: IMF, International Financial Statistics; OECD, Main Economic Indicators; and WEFA-DRI. Weighted average of imports and exports trade volumes, using 1993 trade weights. PPP-weighted average.
1
2
1970 75 80 85 90 95 2000-2
0
2
4
6
Market exchange rate weights
PPP weights
Market exchange rate weights
PPP weights
Measures of Global Activity(Percent change from a year earlier; three-month centered moving average unless otherwise indicated)
1970 75 80 85 90 95 Jan. 2002
Annual Real GDP(percent change)
Annual Real GDP per Capita(percent)

ECONOMIC PROSPECTS AND POLICY ISSUES
11
ing slowdowns that could be labeled as globalrecessions. One reasonable solution to this co-nundrum is to adjust world output growth forgrowth in world population, and declare that asufficient (although not necessary) conditionfor a global recession is any year in which worldper capita growth (on a PPP basis) is negative.In the second figure, the first bars show unad-justed world GDP growth during the major re-cent slowdowns, 1975, 1982, 1991, and 2001.In no case did world growth dip below 1 per-cent, much less turn negative. In 1975, GDPgrowth of 1.9 percent was almost exactly offsetby world population growth, so that per capitaGDP growth was about zero. However, per capitaGDP growth actually turned negative in 1982and, to a lesser extent, in 1991. By contrast, percapita GDP growth in 2001 was over 1 percent,well above zero. Compared with the earlierepisodes, unadjusted growth was stronger at 2.5percent, instead of dipping below 2 percent asin the previous episodes. Also, world populationgrowth is lower today (1.3 percent) than it was a
decade earlier. Thus, the current slowdown hasnot come close to meeting the hurdle of nega-tive per capita annual GDP growth, which wouldautomatically qualify it as a recession. This partlyreflects the relatively high weight of China,which has continued to grow strongly, in theIMF PPP weights. Nonetheless, even going tothe extreme of using market exchange rate-based weights (which substantially reduceChina’s weight), per capita GDP growth wouldstill remain slightly positive in 2001.
Can we declare that the world is not in reces-sion simply because annual global per capitagrowth is positive? No, not necessarily. Whilenegative per capita GDP growth (using IMF PPPweights) is a sufficient condition to identify aglobal recession, by itself it would probably beunduly conservative. As in the case of individualrecessions, one can not rely absolutely on anymechanical rule, but instead some element ofjudgment is required. That is how recessions areidentified in the United States by the NationalBureau of Economic Research (NBER), forexample. The NBER defines a recession as a sig-nificant decline in activity spread across theeconomy and lasting more than a few months,and focuses on economy-wide monthly series(especially nonfarm employment and real per-sonal income less transfers). It also looks atdata from manufacturing (real manufacturingand trade sales and industrial production),although—as the NBER notes—this is a rela-tively small part of the U.S. economy whosemovements often differ from those of other sec-tors. The rule of thumb of two quarters of nega-tive growth often referred to by commentators issimply a useful way of approximating this sys-tem. Indeed, in the recent downturn, the NBERcommittee chose to identify the U.S. slowdownas a recession even though, based on currentinformation, GDP growth was only negative inthe third quarter.
How might one apply these principles to iden-tifying global recessions even when per capitaGDP growth is positive? Given the data inadequa-cies, there is no simple extension of the NBER’smethodology to the global economy. We have al-
Comparison of Global Slowdowns(Percent)
1975 1982 1991 2001-1.0
-0.5
0.0
0.5
1.0
1.5
2.0
2.5
3.0
GDP growth Per capita GDP growth

• Finally, there are a number of specific risks to theoutlook. Most recently, the volatility in the oilmarket has become a significant potential riskto the recovery, especially if the security situa-tion in the Middle East were to deterioratefurther.7 Were oil prices to rise substantiallyfurther, there could be a significant impact onthe global recovery (see Table 1.12 inAppendix 1.1, which shows the impact ofhigher oil prices on global growth). While oil
exporting countries would clearly benefit,there would be adverse effects on most indus-trial and many emerging market economies,notably in Asia, and many of the heavily in-debted poor countries and several CIS coun-tries could be quite seriously affected. Beyondthis, the war against terrorism has so far gonebetter than expected but setbacks could ad-versely affect confidence; and, although conta-gion from developments in Argentina has so
CHAPTER I ECONOMIC PROSPECTS AND POLICY ISSUES
12
ready noted the difficulties in getting satisfactoryquarterly global GDP, and certainly global ver-sions of the main monthly indicators used by theNBER for the United States will not be availablefor the foreseeable future. However, there aremonthly data on global industrial productionand merchandise trade volumes, although—as inthe United States—these focus on the manufac-turing sector, which comprises less than onequarter of global GDP.1 The first figure showsthe change in industrial production and tradevolumes at a global level since 1970. Both seriesclearly identify the global slowdowns after thetwo oil crises that are also clear in the real GDPdata. Subsequently, however, the correspondenceis less close. For example, growth in bothmonthly series remained positive in the recessionof the early 1990s. Moreover, for the Asian crisis,both series suggest a more severe slowdown thandoes real GDP (partly reflecting the large manu-facturing sectors in many Asian economies). Themost recent data show a sharp fall in productionand trade—corresponding to the synchronizedand disruptive decline in manufacturing produc-tion, partly related to the information technol-ogy (IT) sector—but again the picture fromthese series appears more severe than that from
data on real GDP. Cyclical movements in manu-facturing and trade tend to be larger than inoverall activity. In addition, the manufacturingand trade series have been disproportionatelyimpacted by the rapid fall in global IT.
Aside from the global aggregates, it is impor-tant to also look at the extent to which the slow-down is spread across the globe and the speed ofthe decline. If, for example, the United States ex-perienced a sufficiently severe recession, globalaverage numbers could be quite poor even ifthere were positive GDP growth elsewhere. Thisscenario would not, in our definition, qualify as aglobal recession. On the other hand, a particu-larly rapid and generalized fall from a high levelto a much lower level should be an element ofone’s assessment. To ascertain the global natureof the slowdown, we considered, among otherfactors, quarterly GDP where available. Thesedata indicate negative growth for the third quar-ter in some regions of the world, including theUnited States, Germany, Japan, and severalemerging markets. While weakness remained inGermany and Japan in the fourth quarter, theUnited States rebounded. Growth in China andIndia has remained robust throughout.
Overall, therefore, our reading of the dataindicates that the recent slowdown falls some-what short of a global recession, certainly incomparison with earlier episodes that we wouldhave labeled as global recessions. That said, itwas a close call.
Box 1.1 (concluded)
1Manufacturing currently makes up slightly under20 percent of GDP in industrial countries (down fromalmost 30 percent in 1970), and a relatively stable 23percent in developing countries.
7See IMF (2000) for a detailed discussion of the impact of oil price changes on the global economy.

ECONOMIC PROSPECTS AND POLICY ISSUES
13
The consensus among economic forecasters isthat the U.S. recession that started in March2001 will be over during the course of this year.For example, the mean forecast for U.S. growthin 2002 reported by the March survey of Consen-sus Forecasts is 2.1 percent, which would imply arobust recovery in the second half of the year.Given economic forecasters’ poor performancein predicting recessions,1 it is natural to askwhether they are any better at predicting recov-eries. It is difficult to answer this question usingdata for a single country as the number of recov-eries for which consistent growth forecasts arereadily available would be too small to make reli-able inferences. Therefore, this box reviews theexperience from a large sample of industrialcountries to assess how well forecasters havedone.
Cross-Country Evidence on Predicting Recoveries
The publication Consensus Forecasts has pro-vided macroeconomic forecasts for 26 industrial-ized countries on a monthly basis since October1989. Each issue of the publication surveys anumber of prominent financial and economicanalysts, and reports their individual forecasts aswell as the mean forecast (the consensus). Everymonth, Consensus Forecasts contains a new fore-cast of average annual GDP growth in the cur-rent and forthcoming year. Thus, for example,between January 1990 and December 1991 thereare 24 separate forecasts of real GDP growth in1991.2
The behavior of forecasts during the U.S.recession and recovery of 1991–92 provides agood example of the behavior of forecastsaround turning points (see the figure). InJanuary 1990, the forecast for U.S. growth dur-ing 1991 was about 2.5 percent. Following Iraq’s
invasion of Kuwait in August 1990, forecasts forU.S. growth started to be marked down substan-tially. By the start of 1991, the forecast was for amodest recession that year (figure, top panel).
How did the recognition of the recession in1991 affect the forecasts for 1992? Initially, notvery much. The year-ahead forecasts for 1992(the ones made during 1991) remained virtuallyunchanged at about 2.5 percent. The current-year forecasts for 1992 showed somewhat greatervariation but clearly never came close to fore-casting a continuation of the recession of theprevious year (figure, bottom panel). The econ-
Box 1.2. On the Accuracy of Forecasts of Recovery
Consensus Forecasts of U.S. Growth for 1991–92 Recession and Recovery(Percent)
-1.0
-0.5
0
0.5
1.0
1.5
2.0
2.5
3.0
Jan. Apr. Jul. Oct. Jan. Apr. Jul. Oct. 1990 1991
Forecasts for 1991
0
0.5
1.0
1.5
2.0
2.5
3.0
3.5
4.0
Jan. Apr. Jul. Oct. Jan. Apr. Jul. Oct. 1991 1992
Forecasts for 1992
Month and year in which forecast was made
Month and year in which forecast was made
Source: Consensus Economics, Inc.
The main author is Prakash Loungani.1See Box 1.1, World Economic Outlook, May 2001, and
Loungani (2001).2The first 12 forecasts—the ones made during
1990—are referred to as year-ahead forecasts; the 12forecasts made during 1991 are called current-yearforecasts.

far been contained, risks remain, particularlyfor the other countries in the region.In setting the stance of policies, policymakers
will need to consider not just the baseline projec-tions, but also the balance of these various risksand the costs associated with each. In making thisassessment, a number of considerations are rele-
vant. First, given the past fall in commodity pricesand substantial excess capacity in most industrialcountries, and increasing evidence that the im-provement in central bank credibility in recentyears is helping to anchor inflationary expecta-tions (Chapter II), long-term inflationary risks re-main limited at this stage. Second, if growth in
CHAPTER I ECONOMIC PROSPECTS AND POLICY ISSUES
14
omy did indeed recover and the forecast errorwas small.
The pattern displayed in the figure is quitetypical of forecasts around turning points forthe 25 other episodes of recessions and poten-tial recoveries (in the subsequent year) sinceOctober 1989.3 Recessions typically arrive beforethey are forecast. The recognition that the coun-try is in a recession does not generally lead todrastic markdowns of the forecast for the post-recession year. That is, forecasters act as thoughthe recession is not going to lead to a secondyear of negative growth.
How well does this strategy work in deliveringaccurate forecasts? The simple answer is:“Reasonably well.” In three-fourths of cases overthe 1990s, the recession did not result in a sec-ond year of negative growth.4 Hence, eventhough large forecast errors are made in thecase of multiyear recessions, forecasting a recov-ery in the year following a recession turns out tobe a reasonably good bet on average. Using theApril survey of Consensus Forecasts, the mean ab-solute error of current-year forecasts for the 26episodes of potential recoveries is 1.29 percent-age points. This is only about half as large as themean absolute error from a naive forecastingstrategy of predicting a continuation of the re-cession. While the accuracy of the forecasts isquite good, there is a tendency for forecastsmade at the start of the year of the recovery tounderpredict it. This property was noted in the
case of forecasts of U.S. recoveries over the pe-riod 1972 to 1984 by Zarnowitz (1986). The U.S.recovery of 1992 and recoveries in the cross-country sample studied in this box also tendedto be underpredicted—by about !/2 to #/4 of apercentage point—in forecasts made near thestart of the year.
Comparison with WEO
On average, there is a high degree of similar-ity between forecasts made by the AprilConsensus survey and those reported in the IMF’sMay World Economic Outlook during the years ofpotential recoveries: the mean absolute error ofthe May WEO forecasts is 1.24 percentagepoints, virtually identical to that of ConsensusForecasts. The forecast errors are also highly cor-related at other forecasting horizons as well,such as comparing the October Consensus withthe fall WEO current-year forecasts or compar-ing year-ahead forecasts; hence, the mean ab-solute errors for the two sources of forecasts arevirtually the same at every forecasting horizon.
Conclusion
Conventional wisdom among forecasters isthat the U.S. economy will start to grow againthis year. What these forecasts have going forthem is the fact that multiyear recessions aresomewhat rarer than those that end in about ayear. Over the 1990s, for the set of industrializedcountries studied here, forecasting a recovery inthe year following a recession has thereforeturned out to be a reasonably good bet. So eventhough forecasters are caught flat-footed whenrecessions turn out to be multiyear, the message,broadly speaking, is, most recessions catch fore-casters by surprise; most recoveries do not.
Box 1.2 (concluded)
3See Loungani (2002) for evidence from other in-dustrialized countries.
4Over a longer period, as noted in Chapter III, 60percent of recessions in industrial countries since 1973lasted just one year.

some industrial countries were to disappoint,there could be a significant impact on the rest ofthe world, particularly in emerging market anddeveloping countries. Third, while wider globalimbalances would clearly be of concern, theseshould be addressed primarily through appropri-ate medium-term policies in the United Statesand better growth policies elsewhere. Overall,there appear to be three main policy priorities.• Macroeconomic policies in most industrial countries
should remain broadly supportive of activity, al-though in countries where the recovery is most ad-vanced, attention will need to turn toward reversingearlier monetary policy easing; in Japan, aggressiveaction to address deflation is required. The FederalReserve appropriately left U.S. interest rateson hold in March, while noting that the risksto price stability and growth had becomebroadly balanced. As the recovery progresses,some withdrawal of stimulus is likely to be re-quired, while the focus of fiscal policy shouldshift to medium-term consolidation. In theeuro area, with growing signs of recovery, thepresent stance of monetary policy is broadlyappropriate, while the automatic stabilizersshould be allowed to operate to support activ-ity within the constraints of the Stability andGrowth Pact. In Japan, macroeconomic poli-cies should be as supportive as possible, in-cluding through more aggressive monetaryeasing to address deflation, even if this resultsin some further depreciation of the yen, andthrough an additional supplementary budgetto maintain a broadly neutral fiscal stance in2002 and 2003 (Table 1.4).
• The medium-term policy framework needs to be gearedtoward supporting sustainable growth and an orderlyreduction in the global imbalances. As has been ar-gued in many previous issues of the WorldEconomic Outlook, the global imbalances reflectnot just not the past strong growth in theUnited States—and the excesses that were asso-ciated with it—but also relatively weak growthin other parts of the world. Consequently, deci-sive action to reinvigorate activity in Japan, con-tinued structural reforms to encourage growthin the euro area, building on the progress
made at the Barcelona summit, and continuedcorporate and financial sector reform in someAsian emerging markets with large current ac-count surpluses, are a priority from both na-tional and international perspectives. In theUnited States, in turn, it will be important toavoid exacerbating external imbalances by en-suring that fiscal balance (excluding social se-curity) is restored over the medium term (seeAppendix 1.2 for a detailed discussion).
• As experience during the downturn has shown, it re-mains essential to press ahead with efforts to reducevulnerabilities and maximize the scope for policyflexibility in response to external shocks. In indus-trial countries, this requires accelerated effortsto address the looming problems resultingfrom aging populations, where progress inmany countries falls short of what is required;a sustained effort to use the recovery toachieve broadly balanced budgets in the euroarea within a reasonable time frame, as calledfor under the Stability and Growth Pact; andthe design and publication of a crediblemedium-term fiscal consolidation plan inJapan. In emerging markets, corporate and fi-nancial reforms remain a central priority, par-ticularly in Asia; in Latin America—and insome Asian countries, including India andChina—medium-term efforts to strengthen fis-cal positions are also critical (Chapter II).For many developing countries, an overarch-
ing priority over the longer run remains an en-during reduction in poverty, which in turn willrequire a sustained improvement in growth.From this perspective, it is encouraging that GDPgrowth in China, India, and sub-Saharan Africa,where the bulk of the poorest live, has been rela-tively well sustained during the downturn, and isexpected to pick up in 2002–03. In both Chinaand India, poverty has been on a steady down-ward trend, although in India GDP growth maystill fall short of the level consistent with furthersustained progress, underscoring the need for fis-cal and structural reforms (see below). The mostentrenched problems remain in sub-SaharanAfrica, where GDP growth is well below the levelneeded to make substantial inroads in poverty.
ECONOMIC PROSPECTS AND POLICY ISSUES
15

CHAPTER I ECONOMIC PROSPECTS AND POLICY ISSUES
16
Table 1.4. Major Advanced Economies: General Government Fiscal Balances and Debt1(Percent of GDP)
1986–95 1996 1997 1998 1999 2000 2001 2002 2003 2007
Major advanced economies Actual balance –3.9 –3.6 –2.0 –1.6 –1.2 –0.3 –1.7 –2.6 –2.1 –0.6Output gap2 –0.6 –1.9 –1.3 –1.1 –0.7 0.3 –1.0 –1.7 –1.4 —Structural balance –3.5 –2.7 –1.4 –1.0 –0.9 –1.0 –1.5 –2.0 –1.7 –0.6
United StatesActual balance –4.5 –2.4 –1.3 –0.1 0.6 1.5 0.1 –1.4 –1.2 –0.5Output gap2 –1.4 –2.8 –1.6 –0.5 0.4 1.4 –0.4 –0.8 –0.5 —Structural balance –4.0 –1.5 –0.7 0.1 0.5 1.0 0.1 –1.2 –1.0 –0.5Net debt 53.2 59.2 57.0 53.4 48.9 43.7 42.2 42.0 40.9 34.6Gross debt 67.3 72.8 70.3 66.6 63.4 57.4 55.4 54.7 53.0 44.3JapanActual balance –0.4 –4.9 –3.7 –5.6 –7.6 –8.5 –8.5 –8.7 –7.6 –2.3
Excluding social security –3.2 –7.0 –5.8 –7.2 –9.0 –9.2 –8.8 –8.7 –7.4 –2.9Output gap2 0.7 0.8 1.0 –1.6 –2.2 –1.3 –2.7 –4.6 –4.8 —Structural balance –0.6 –5.2 –4.1 –5.0 –6.9 –8.3 –7.8 –7.3 –6.1 –2.1
Excluding social security –3.5 –7.2 –6.0 –6.8 –8.6 –9.2 –8.6 –8.1 –6.8 –2.8Net debt 13.8 21.6 27.9 38.0 44.4 52.7 62.2 72.4 80.2 85.3Gross debt 71.8 91.7 97.4 108.4 120.6 130.8 143.4 157.0 166.4 166.5Euro areaActual balance –4.5 –4.2 –2.5 –2.2 –1.3 0.2 –1.4 –1.6 –1.1 0.2Output gap2 –0.2 –2.1 –2.0 –1.4 –1.1 –0.1 –0.9 –1.9 –1.4 –0.2Structural balance . . . –3.0 –1.4 –1.4 –0.8 –1.1 –1.1 –0.8 –0.5 0.2Net debt 46.2 62.6 62.9 61.4 60.5 58.3 57.6 57.4 56.4 51.4Gross debt 61.0 76.1 75.4 73.7 72.6 70.2 69.1 68.9 67.5 58.4
Germany3
Actual balance4 –2.2 –3.4 –2.7 –2.2 –1.6 1.2 –2.7 –2.7 –2.0 0.2Output gap2 0.1 –0.7 –1.2 –1.1 –1.1 — –1.2 –2.1 –1.4 —Structural balance –1.8 –2.7 –1.6 –1.3 –0.8 –1.3 –2.0 –1.4 –1.1 0.2Net debt 27.6 51.1 52.3 52.2 52.6 51.6 51.1 52.5 52.7 47.9Gross debt 45.1 59.8 61.0 60.9 61.3 60.3 59.8 61.2 61.4 56.6FranceActual balance4 –3.5 –4.1 –3.0 –2.7 –1.8 –1.4 –1.4 –2.1 –1.9 —Output gap2 –0.5 –3.3 –3.1 –1.8 –1.2 –0.2 –0.5 –1.5 –0.9 —Structural balance –3.0 –1.9 –1.0 –1.6 –1.0 –1.2 –1.3 –1.4 –1.3 —Net debt 30.6 48.1 49.6 49.8 48.9 47.8 48.8 48.3 48.0 51.6Gross debt 39.3 57.1 59.3 59.5 58.5 57.5 57.1 58.0 57.7 51.6ItalyActual balance4,5 –10.4 –7.1 –2.7 –2.8 –1.8 –0.5 –1.4 –1.2 –0.2 –0.3Output gap2 –0.1 –2.0 –2.3 –2.4 –2.7 –1.9 –2.0 –2.5 –1.6 —Structural balance –10.4 –6.2 –1.7 –1.7 –0.6 –2.1 –1.2 –0.7 –0.1 –0.3Net debt 97.8 116.1 113.8 110.1 108.4 104.6 103.5 101.9 99.2 86.2Gross debt 103.7 122.7 120.2 116.4 114.5 110.6 109.4 107.7 104.8 91.1
United KingdomActual balance4 –3.4 –4.1 –1.5 0.3 1.5 4.4 0.4 –0.9 –1.2 –1.0Output gap2 0.5 –1.3 –0.5 0.2 –0.5 0.1 –0.1 –0.8 –0.7 —Structural balance –3.0 –3.3 –0.9 0.5 1.6 2.1 0.3 –0.7 –0.8 –1.0Net debt 25.7 46.2 44.6 41.9 39.0 34.5 30.9 28.9 28.6 28.6Gross debt 43.4 51.8 49.6 46.5 43.9 40.9 37.9 35.7 34.6 33.9CanadaActual balance –6.5 –2.8 0.2 0.5 1.6 3.2 2.4 1.7 1.7 1.5Output gap2 –2.5 –6.5 –5.1 –3.7 –1.4 0.3 –0.9 –1.0 –0.2 —Structural balance –5.1 — 2.1 2.4 2.4 3.1 2.9 2.3 1.9 1.5Net debt 69.9 87.8 84.1 81.2 74.9 66.3 61.8 58.7 53.9 38.8Gross debt 101.6 120.3 117.6 115.7 112.3 102.6 97.8 93.9 87.3 66.6
Note: The methodology and specific assumptions for each country are discussed in Box A1.1Debt data refer to end of year; for the United Kingdom they refer to end of March.2Percent of potential.3Data before 1990 refer to west Germany. For net debt, the first column refers to 1988–94. Beginning in 1995, the debt and debt-service obli-
gations of the Treuhandanstalt (and of various other agencies) were taken over by general government. This debt is equivalent to 8 percent ofGDP, and the associated debt service to !/2 to 1 percent of GDP.
4Includes one-off receipts from the sale of mobile telephone licenses equivalent to 2.5 percent of GDP in 2000 for Germany, 0.1 percent ofGDP in 2001 and 2002 for France, 1.2 percent of GDP in 2000 for Italy, and 2.4 percent of GDP in 2000 for the United Kingdom.
5Includes asset sales equivalent to 0.6 percent of GDP in 2001 and 2002, 0.5 percent in 2003, and 0.1 percent in 2004.

The main responsibility, of course, continues tolie with national governments, which must createconditions favorable to domestic savings mobi-lization and private sector investment and ensurethe effective use of both domestic and externalpublic resources—for which good governance isclearly key. The New Partnership for Africa’sDevelopment embodies a concerted and wel-come approach to these issues. However, as theManaging Director has stressed,8 these effortsmust be matched by “stronger, faster, and morecomprehensive” support from the internationalcommunity. Substantial assistance has now beenprovided under the Heavily Indebted PoorCountries Initiative (HIPC), and the progressmade at the Monterrey Conference—includingthe pledges of higher aid by the European Unionand the United States—is encouraging, butmuch more needs to be done to increase aidflows, which are less than one-third of the U.N.target of 0.7 percent of GNP.
The most important issue, however, remainsto further open up industrial country marketsand phase out trade-distorting subsidies—partic-ularly in agriculture—which seriously limit theability of poorer countries to compete in areaswhere they would otherwise have a comparativeadvantage. This would directly support growthand reform efforts in the poorest countries, andwould ultimately also be to the benefit of thericher countries themselves. More generally, therecent decision by the United States to raise tar-iffs on steel products is regrettable, and has al-ready led to the prospect of retaliation fromother countries. It will be essential for all coun-tries to make renewed efforts to resist protec-tionist pressures, and to ensure that substantiveprogress is made with multilateral trade negotia-tions under the Doha round.
North America: A Strengthening RecoveryIn the United States, activity remained weak dur-
ing the second half of 2001, but there are in-
creasingly strong indications that recovery isunder way, as the negative effects of the Septem-ber 11 events have proved more moderate thanearlier feared. Manufacturing output has begunto turn up, including in the high-tech sector; thehousing market has remained strong; retail saleshave remained surprisingly robust, althoughaided by auto incentives; and initial jobless claimshave fallen back, while the unemployment rate,which would generally still be increasing at thisstage of the cycle, remains below its December2001 peak. Forward-looking indicators, includingbusiness and consumer confidence, have pickedup significantly, equity markets have reboundedafter September 11, and the yield curve hassteepened. At the same time, aided by the earlierdecline in oil prices and substantial excess capac-ity, inflationary pressures remain moderate.
With activity expected to accelerate signifi-cantly in the first half of 2002, the recent reces-sion is likely to be the mildest on record. Whilethe decline in fixed investment and inventorieshas been similar to previous downturns (Figure1.6), private consumption has remained surpris-ingly strong. This has been supported by thesubstantial reductions in interest rates, and taxcuts over the past year; strong wage growth;widespread auto incentives, which—after nettingoff the inventory draw down—boosted GDPgrowth by an estimated #/4 percentage point (an-nualized) in the fourth quarter; the strength ofhouse prices (which appears to have offset a sig-nificant portion of the impact on consumptionfrom lower equity prices—see Chapter II); andlower oil prices.
Given signs of a sharp turnaround in inven-tory adjustment in early 2002, as well as the sub-stantial stimulus that is already in the pipeline,the staff’s projections envisage a strong recoveryin activity in the first half of the year, falling backsomewhat thereafter as the effects of these twofactors begin to dissipate. The risks to the pro-jection appear broadly balanced, and are impor-tantly linked to the process by which the various
NORTH AMERICA: A STRENGTHENING RECOVERY
17
8See “Working for a Better Globalization,” address by the Managing Director to the Conference on Humanizing theGlobal Economy, January 28, 2002 (www.imf.org/external/np/speeches/2002/012802.htm).

imbalances in the economy—notably the highcurrent account deficit, low personal savings rate,and relatively large financing requirement in thecorporate sector (Figure 1.6)—are resolved. Onthe one hand, it is certainly possible—given thesize of the stimulus in the pipeline—that activitywill recover more strongly than projected. Whilethis would be welcome in a number of respects,it could—as discussed above—exacerbate theseimbalances, especially if growth in other coun-tries disappoints. On the other hand, there re-main questions about the sustainability of apickup in final domestic demand. In particular,private sector investment could be constrainedby excess capacity and weak profitability (al-though the improvement in the fourth quarterof 2001 is welcome); and private consumptiongrowth could be dampened if consumers seek toincrease savings and rebuild balance sheets,Both of these could be exacerbated by a correc-tion in equity markets, which still appear richlyvalued. This would likely result in an earlier cor-rection in imbalances, but at the cost of a moresubdued U.S. and global recovery. Finally, muchcontinues to depend on external developments,including the speed of recovery in the rest of theworld, oil prices, and geopolitical developments.
In assessing the appropriate stance of policies,policymakers need to take account of the risksand costs related to the uncertainties on bothsides of the forecast, within a longer-term policyframework that is consistent with a gradual re-duction in the imbalances in the economy overtime. With clear evidence that recovery is underway, the Federal Reserve noted in March that therisks to economic growth and price stability hadbecome more evenly balanced. Provided signs ofeconomic strength continue, attention will soonneed to shift to withdrawing the substantial stim-ulus provided last year. On the fiscal side, thecombination of the June 2001 tax cuts and theemergency spending measures passed in the af-termath of the terrorist attacks, along with theoperation of the automatic stabilizers, has pro-vided substantial support to the economy. Thishas come, however, at the cost of a significantdeterioration in the fiscal position; the adminis-
CHAPTER I ECONOMIC PROSPECTS AND POLICY ISSUES
18
400
450
500
550
600
650
84
86
88
90
92
94
96
98
50
60
70
80
90
100
10
12
14
16
18
-2
-1
0
1
2
3
4
5
6
-4
-3
-2
-1
0
1
2
3
4
Sources: Haver Analytics; and IMF staff estimates. Shading indicates business cycle from peak to trough. All data for nonfinancial corporate business sector.
Shape of Past Recessions (contribution to GDP growth, peak to trough)
Current recession
Past recession
Shape of Past Recoveries (contribution to GDP growth, year from trough)
1970 75 80 85 90 95 2001: Q4
Corporate Financing(percent of GDP)
The U.S. recession has been remarkably mild compared with previous experience, and the pace of recovery is correspondingly projected to be somewhat moremoderate. The low level of private saving and the high corporate financing requirement remain potential brakes on activity.
Internally generated funds (right scale)
Net exp
orts
Consu
mption
Fixed
inves
tmen
t
Inven
tories
Govern
ment
GDP grow
th
Net exp
orts
Consu
mption
Fixed
inves
tmen
t
Inven
tories
Govern
ment
GDP grow
th
Gross fixedinvestment(right scale)
1970 75 80 85 90 95 2001: Q4
12
Consumption and Wealth(ratio to personal disposable income)
Net worth(left scale)
Personal consumption(right scale)
Corporate debt(left scale)
1
1,2
Past recoveries
Projectedrecovery
Figure 1.6. United States: Recessions and Recoveries(Percent unless otherwise indicated)

tration’s recent budget—adjusted to take ac-count of the latest stimulus package as well asthe faster than expected recovery—provides ad-ditional stimulus in 2002 and would result inbudget deficits (excluding the social security sur-plus) persisting into the medium term.Moreover, with the budget based on relativelyoptimistic assumptions with regard to the con-tainment of non-defense expenditures, even thismay prove difficult to achieve. With economicactivity improving, efforts will now need to focuson returning the budget to broad balance (ex-cluding social security) over the medium term,and to address the longer-term financial prob-lems in the social security system. This wouldhelp manage the pressures associated with theaging population, as well as being supportive ofadjustment in the current account deficit.
Given the strong trade and financial linkages,Canada was strongly affected by the faster thanexpected slowdown in the United States, and ex-perienced a mild downturn in the second half of2001. As activity slowed, and with core inflationat the lower end of the 1–3 percent target band,the authorities eased monetary policy substan-tially during 2001; at the same time, the ex-change rate depreciated to near historically lowlevels in real effective terms, which is helping tocushion the impact of the external slowdownand weak commodity prices. Fiscal policy hasalso provided support through the operation ofthe automatic stabilizers, previous expenditureand tax measures, and a moderate discretionarystimulus in the 2001/02 budget. Aided by thepickup in the United States, growth reboundedin the fourth quarter of 2001, and economic in-dicators suggest that a strong recovery is now un-der way. With the economy expected to reach itspotential output sometime during the next year,the process of withdrawing monetary stimulusalso will likely need to begin in the near term.
Japan: Significant Challenges RemainJapan is experiencing its third—and most se-
vere—recession of the past decade. While theproximate causes of the current downturn in ac-
tivity include a variety of domestic and externalfactors, including falling consumer confidenceand the global slowdown, the inability to achievesustained growth over the past decade reflectsthe failure to deal decisively with deep structuralimpediments (a pattern also seen in other coun-tries, as discussed in Chapter III). This is mosturgent in the case of the banking system, whosedifficulties go back to the bursting of the assetprice bubble in the early 1990s.
Short-term prospects are a source of consider-able concern. Output is expected to fall by 1percent in 2002 after a decline of !/2 percent in2001, as the pronounced weakness in private de-mand seen in 2001 continues through the firsthalf of 2002 even as external demand revives, apath consistent with the results of the MarchTankan survey and the depressed levels of equityprices even after a recent rebound. To date, thefall in activity has been driven by both externaland domestic developments. Exports declined inthe face of the global slowdown and rapid fall indemand for IT goods. Consumption slumpedsince early 2001 as the unemployment rate hasset new records, overtime hours have fallen, andreal earnings have stagnated. Business invest-ment showed some resilience over much of2001, but weakened dramatically late in the year.The government announced a package to com-bat deflation late in February, including a re-statement of its intention to proceed with thedisposal of nonperforming loans (NPLs) and anexplicit commitment to take any necessary meas-ures to ensure the stability of the financial sys-tem. The package also sets out new measuressuch as strengthened regulation of short sellingof equities. While growth in 2002 could be morerapid than projected—most notably if recoverycomes more speedily in the rest of the world andthe IT cycle rebounds more rapidly than cur-rently anticipated—downside risks predominategiven the difficult domestic environment.
Weak growth over the 1990s reflects a failureto deal decisively with structural weaknesses, es-pecially in the banking system. Since the mid-1990s, bank equity prices have been falling rela-tive to the rest of the market (which has also
JAPAN: SIGNIFICANT CHALLENGES REMAIN
19

been on a downward trend, eroding bank capitalheld in the form of equities), and loans to theprivate sector have been declining (Figure 1.7,top panels). Despite past deregulation of the fi-nancial system—most notably the “big bang”completed in 2000—and its accomplishments sofar, the level of direct financing from capitalmarkets remains limited (Bank of Japan, 2001).These bleak trends have in many respects wors-ened since mid-2001, with NPLs remaining athigh levels despite large write-offs, the relativeequity prices of banks falling further (partly as aresult of recent regulatory actions imposinggreater market discipline on banks), increasingreal interest rates on bank loans, and, more re-cently, a significant increase in bank borrowingcosts for debentures and certificates of deposit,especially for weaker banks.
The banking sector will be a significant imped-iment to sustained recovery unless decisive actionis taken. Progress has been made in tacklingbanking sector reform and the allied issue of cor-porate restructuring. In particular, the FinancialServices Agency (FSA) has tightened NPL classifi-cations for banks and strengthened the role ofmarket forces through initiatives such as mark-to-market accounting. However, the FSA should fur-ther its efforts to encourage banking sector re-structuring through more accurate classificationof problem loans (where the FSA’s special auditswill be critical), rapid disposal of a wide range ofsuch loans (which will also help with corporaterestructuring), encouraging banks to raise fur-ther private capital, and, if appropriate, targetedinjections of public money. The basis for effectivecorporate restructuring has been laid through anumber of welcome initiatives, including the in-troduction of consolidated corporate taxationand reform of the commercial code, but rapiddisposal of problem loans and a more aggressiveindustrial deregulation policy are needed to pushthis process forward.
On the macroeconomic front, policymakerscurrently face the difficult task of supporting theimplementation of structural reforms in the faceof very limited room for monetary and fiscal ma-neuver. Monetary policy should be used aggres-
CHAPTER I ECONOMIC PROSPECTS AND POLICY ISSUES
20
30
50
70
90
110
130
150
Figure 1.7. Japanese Policy Dilemmas
Equity Price of Banking Sectorto Entire Market(January 1995 = 100; log scale)
Japan's financial problems are reflected in the falling relative equity price of the banking sector and in the decline in bank lending. Meanwhile, deflation is intensifying and real interest rates are rising. Current fiscal plans involve a significant withdrawal of stimulus later this year, while debt ratios continue to climb.
Sources: CEIC Data Company Limited; Nikkei Telecom; Nomura Security; and IMF staff estimates. Adjusted for changes in indirect taxes in 1997.
0
2
4
6
8
10Funding of the Private Sector (trillions of yen)
1993 95 97 99 Mar. 2002
-1
0
1
2
3
4
1993 95 97 99 Mar. 2002
1993 95 97 99 Dec. 2001
Realshort rate
Nominalshort rate
4
5
6
7
8
9
10
-30
-20
-10
0
10
20
30
40
50
60
1993 95 97 99 2001 03: Q1
Growth of public investment(right scale)
Structural deficit(left scale)
2
4
6
8
10
30
40
50
60
70
80
90
100General government deficit excluding social security
(left scale)
General government net debt excluding
social security(right scale)
Capital markets
Government financial
institutions
Banks
Banking System
Monetary Policy
Fiscal Policy(ratio to potential GDP unless otherwise indicated)
1993 95 97 99 2001 03: Q1
-2
-1
0
1
2
3
4
5
6
1993 95 97 99 Feb. 2002
Core inflation
M2+CDs
(percent)(change from a year earlier)
1
1
1
Real rate onnew bank loans1

sively to address deflation, thereby lowering realinterest rates and supporting activity, while thefiscal stance should remain broadly unchangedand be flexible to changing economic condi-tions. This policy advice partly reflects the fol-lowing assessment of two key policy questions.• How effectively can monetary policy support activity?
Despite zero nominal short-term interest rates,deflation means that short-term real rates arepositive and, if anything, rising (Figure 1.7,middle panel). Monetary policy should beclearly focused on reviving activity by endingdeflation; evidence from the U.S. Great Depres-sion indicates that aggressive quantitative eas-ing can be effective in this regard, especially iffinancial sector issues are also tackled. To thisend, the Bank of Japan has recently raised itstarget for excess bank reserves from over ¥6trillion to ¥10–15 trillion, as well as raising itspurchases of government bonds somewhat.Reserves will need to be kept at or above the¥15 trillion upper range to engineer a contin-ued rapid expansion of the monetary base.Quantitative easing and official pronounce-ments have recently been associated with aweakening of the yen, which will help reviveexternal demand. However, further easing willbe required if deflationary forces do not abatesoon, including a commitment to end defla-tion within a relatively short time period.
• Is high and rising government debt reducing the ef-fectiveness of fiscal policy? The initial budget forFY2002/03 implies a !/2 percentage point ofGDP withdrawal of stimulus, concentrated inthe second half of 2002 when spending in-creases earlier in the year associated with thesecond supplementary budget of 2001/02 areexpected to be rapidly reversed (Figure 1.7,lower panels). A timely supplementary budgetshould be considered to mitigate fiscal contrac-tion in the latter part of 2002 to avoid the out-come in 1997, when aggressive consolidationplans helped to propel the economy into a re-cession. At the same time, it should be recog-nized that experience in a number ofEuropean countries suggests that policies tocurb high and rising debt levels can have confi-
dence effects that reduce the impact of fiscalcontraction on activity. The evidence to dateon Japan is more ambiguous, although poten-tial further downgrades of Japanese govern-ment debt by credit rating agencies appear toreflect concerns over debt sustainability. Thisunderlines the need to set any further provi-sion of stimulus within a concrete medium-term plan for fiscal consolidation to boost con-fidence and make current policy commitmentsmore credible, including ending the earmark-ing of tax revenues, and reform of public en-terprises and of the health care system.The Japanese recession, and the possibility
that an easing of monetary policy would result ina further weakening of the yen, has raised con-cerns about the consequences for the rest of theregion. The Japanese economy and exchangerate have significant regional impacts (see Box1.4 of the October 2001 World Economic Outlook).Even so, given the increased exchange rate flexi-bility and strengthened macroeconomic cushionsin the region since the Asian crisis, a deprecia-tion of the yen would appear generally manage-able (although the impact could be greater inthose countries with fixed exchange rate sys-tems). This could be particularly the case if yenweakness was a byproduct of a comprehensivepackage of structural and macroeconomic meas-ures to restore sustained growth in Japan, whichwould clearly provide significant medium-termbenefits to the region and the rest of the world.
How Will the Recovery in EuropeCompare with That in the United States?
In Europe, GDP growth began to slow frommid-2000, and—after a temporary rebound inlate 2000 and early 2001—continued to weakenin the remainder of the year. The speed and ex-tent of the slowdown, as well as the degree ofsynchronization with the United States, hastaken most forecasters and policymakers by sur-prise. To a considerable extent, it has been dueto the commonality of shocks, including the risein oil prices during 2000, the bursting of thetechnology bubble, and the repricing of global
HOW WILL THE RECOVERY IN EUROPE COMPARE WITH THAT IN THE UNITED STATES?
21

equity markets, but also increased corporate andfinancial linkages with the rest of the world.Europe-specific factors—notably animal dis-eases—have also played a role, as has thestrength of cross-country linkages, particularlyamong the euro area countries.
Partly as a result, the nature of the slowdownhas become increasingly similar to—althoughless steep than—that in the United States. Sincemid-2000, the major countries have all experi-enced a weakening in fixed investment and in-ventories (Figure 1.8), and falling export growth(although this has been offset by lower importgrowth, resulting in some strengthening in netexports). The extent of the slowdown has dif-fered considerably across countries, being partic-ularly marked in Germany—which has experi-enced a technical recession (i.e., two quarters ofnegative growth)—Belgium, the Netherlands, and,particularly since the second quarter of 2001,Italy. In contrast, growth in France and theUnited Kingdom has in general been better sus-tained; and growth in Spain, while slowing, hasalso remained above the euro area average.The differences in the depth of the slowdownappear to reflect domestic, rather than external,factors. In particular, consumption behaviorhas differed markedly across countries, weaken-ing significantly in Germany and Italy, but re-maining surprisingly strong in the UnitedKingdom and France, buoyed by relativelystrong real wage growth, stronger labor marketconditions, and, in the United Kingdom, risinghouse prices.
In the euro area, although activity and de-mand remain weak, signs of recovery have be-gun to emerge. Business confidence—and to alesser degree consumer confidence—have im-proved: the German IFO business climate indexhas risen for five successive months; indices ofpurchasing managers’ sentiment have strength-ened; and industrial production has begun torise. Overall, GDP growth is expected to turn upin the first half of 2002, slightly behind thepickup in the United States, spurred by a turn-around in the inventory cycle, recent monetarypolicy easing, the strengthening external envi-
CHAPTER I ECONOMIC PROSPECTS AND POLICY ISSUES
22
-5
-4
-3
-2
-1
0
1
-5
-4
-3
-2
-1
0
1
Figure 1.8. European Slowdown(Percent)
Sources: Haver Analytics; and IMF staff estimates. Defined as the difference between average annualized GDP growth rate during 2000:Q2 to 2001:Q4, and the year to 2000:Q2. The remaining variables show the contributions of consumption, fixed investment, inventories, and net exports to the change in GDP growth.
German Slowdown(contribution to change in GDP growth)
Euro areaaverage
French Slowdown(contribution to change in GDP growth)
The slowdown in Europe has been more moderate than that in the United States. However, there are substantial differences across countries, which mainly reflect consumer behavior.
Consu
mption
Fixed
inves
tmen
t
Inven
tories
Net exp
orts
GDP grow
th
Consu
mption
Fixed
inves
tmen
t
Inven
tories
Net exp
orts
GDP grow
th
Euro areaaverage
-4
-3
-2
-1
0
1
2
-4
-3
-2
-1
0
1
2 Italian Slowdown(contribution to change inGDP growth)
Euro areaaverage
U.K. Slowdown(contribution to change inGDP growth)
Consu
mption
Fixed
inves
tmen
t
Inven
tories
Net exp
orts
GDP grow
th
Consu
mption
Fixed
inves
tmen
t
Inven
tories
Net exp
orts
GDP grow
th
Euro areaaverage
-1
0
1
2
3
4
5
6
-1
0
1
2
3
4
5
6 GDP Growth(year on year)
UnitedStates
GDP Growth(year on year)
Germany
1999 2000 01 02
UnitedKingdom
France
Italy
Other euro area
1999 2000 01 02
1 1
1 1
1
Euro area

ronment, and the past decline in oil prices.While there is relatively little policy stimulus inthe pipeline compared with the United States,there are also fewer macroeconomic imbalancesto constrain recovery (although equity marketsin some countries appear highly valued); andcorporate profitability remains strong, whichshould help support a rebound in fixed invest-ment. The main risks to the outlook include aweaker-than-expected upturn in Germany, givenits size and close links with other euro areacountries; structural weaknesses, particularly inlabor markets; and a further increase in oilprices. Among individual countries, the Argen-tine crisis has adversely affected some banks andcorporations in Spain, although there do notappear to be systemic risks; the high current ac-count deficit in Portugal—projected at 9 percentof GDP in 2002—and the rising debt burdenassociated with it, are also of concern.
As growth has slowed, inflationary pressureshave eased. After a temporary pickup early inthe year due largely to temporary factors, includ-ing a modest impact from the changeover to theeuro, area-wide CPI inflation has since moder-ated. Headline inflation is expected to fall below2 percent in the coming months, underlying in-flation remains moderate, and wage growth isreasonably subdued (although much will de-pend on ongoing wage negotiations, especiallyin Germany, as well as oil price developments).Since mid-2001, the European Central Bank(ECB) has reduced interest rates by 125 basispoints; with growing signs of recovery, the mone-tary policy stance appears broadly appropriate.On the fiscal side, most countries have appropri-ately allowed the automatic stabilizers to oper-ate, resulting in a widening of the area-widedeficit in 2001 and 2002. In Germany, the fiscaldeficit in 2002 is projected to be close to the3 percent deficit limit specified in the Stabilityand Growth Pact (SGP). While measures to meetSGP commitments may need to be taken inGermany if further budgetary shortfalls emerge,at present the risks do not appear to warrant im-mediate action—action that would seem, how-ever, to be called for in the case of Portugal, par-
ticularly if the authorities’ planned deficit reviewindicated that the deficit would breach the3 percent limit. Once the recovery takes hold, itwill be important for those countries with signifi-cant structural deficits to achieve an enduringstrengthening in fiscal positions, an opportunitythat was missed in the late 1990s; this in turn willrequire, inter alia, that countries stick to the ex-penditure targets set out in their Stability Planseven if revenues exceed expectations. This willensure that fiscal policy is able to play an ade-quately supportive role during subsequent down-turns, as well as help address increasing fiscalpressures from aging populations.
The introduction of euro notes and coins isan historic step, and has been accomplished re-markably smoothly (Box 1.3). By increasingprice transparency and reducing transactionscosts, it will be a powerful force promotinggreater economic integration. To maximize thebenefits from the introduction of the euro, itwill be important to move forward with struc-tural reforms, both in the financial sector andin other areas. Despite important initiatives in anumber of countries, the pace of reform hasnot in general accelerated since the LisbonEuropean Council in mid-2000, which set out anambitious agenda for economic and social re-newal. At the Barcelona Summit in March, fur-ther progress was made in liberalization of en-ergy markets, and EU leaders reaffirmed theirintention to accelerate the reform process, in-cluding through swift implementation of theFinancial Services Action Plan. Reforms in allareas are clearly closely interlinked, but two—la-bor markets and pension reform—appear to beof particular importance. While progress hasbeen made in reducing taxation of labor and inencouraging part-time work, notably in Franceand some of the smaller European economies,labor markets remain relatively inflexible andthere remains a need to increase wage differen-tiation (Germany and Italy) and to strengthenincentives for the unemployed to find work(Germany and France). On pensions, the adop-tion of a privately funded pension pillar inGermany is an important step forward, but
HOW WILL THE RECOVERY IN EUROPE COMPARE WITH THAT IN THE UNITED STATES?
23

CHAPTER I ECONOMIC PROSPECTS AND POLICY ISSUES
24
On January 1, 2002, nearly 10 years after thesigning of the Treaty on European Union and 3years after the launch of EMU, cash euros en-tered circulation in 12 European countries withmore than 300 million inhabitants.1 Despite theunprecedented scale of the operation, thechangeover went remarkably smoothly. In shortorder, the euro—which had been available as anelectronic means of payment and was used in fi-nancial markets since 1999—had replaced theformer national currencies in virtually all cashtransactions.
The immediate macro implications of thechangeover appear to have been modest, yet theshift to euro pricing is expected to producelong-term benefits in the form of increasedprice transparency, competition, and integrationacross the area. While the lack of historicalprecedent makes it difficult to judge the associ-ated gains in economic efficiency and livingstandards, many proponents believe that theymay be substantial. However, wide-ranging sup-porting measures are still needed to maximizethe gains from market integration.
One-Off Effects
The changeover appears to have had onlymodest short-term macroeconomic effects.Competitive forces and a relatively weak cyclicalposition helped to ensure that cases in which re-tailers took advantage of the redenomination toraise prices (including a bias toward roundingup when setting new “attractive prices”) werebroadly offset by price-cutting elsewhere, partic-ularly among large retailers seeking to win mar-ket share by promising to round prices down.The small changeover-induced increase in theCPI (estimated to be at most 0.2 percent inJanuary, although some increase may have oc-curred already in 2001) plausibly reflects a ten-dency to bring forward planned price changesrather than a sustained increase in margins.
Beyond the short term, increased cross-borderprice transparency and arbitrage are expectedto act as a force for lower prices (see below).
The total circulation of banknotes in thelegacy currencies declined by one-fourth during2001 (corresponding to about 1!/2 percent ofGDP) as cash held for store-of-value purposeswas either deposited with banks, spent (andthen deposited by the receiver), or exchangedfor foreign currency. Some of this cash hadbeen held in the informal economy, and someabroad. Most of the currency held abroad(roughly !/2 percent of euro area GDP in 2000)was returned before January 1, 2002, after beingdeposited or exchanged at foreign banks.
Anecdotal evidence of a pickup in sales of lux-ury items and cars in late 2001 may have beenrelated to spending of hoarded cash—althoughthe increase in retail sales in November also rep-resented a bounce-back from very weak condi-tions after September 11 and should be seen inthe context of a budding revival in confidence.2
Spending of hoarded cash may further affectthe timing of purchases in early 2002. In addi-tion, shifts in the relative holdings of cash anddeposits (affecting the money supply via themoney multiplier) have rendered the interpreta-tion of money aggregates for policy purposesmore delicate than usual. Finally, despite fluctu-ations in the euro exchange rate around thetime of the changeover, the transition does notappear to have had lasting consequences for thecurrency.
Longer-Term Benefits of Cash Euro: PriceTransparency and Increased Integration
The more durable and important implicationsof the changeover stem from the facilitation ofprice comparisons across the area when allcountries use the same unit of account.Regulatory obstacles to market integration willalso seem more glaring and pressure to removethem is likely to intensify.
Box 1.3. The Introduction of Euro Notes and Coins
The main author is Mads Kieler.1The euro area comprises Austria, Belgium, Finland,
France, Germany, Greece, Ireland, Italy, Luxembourg,the Netherlands, Portugal, and Spain.
2There have also been reports of greater demandfor property in parts of the euro area.

more adjustments in the parameters of the sys-tem are likely to be needed; in Italy, it will beimportant to move forward rapidly with the con-sultative approach to pension reform that the
authorities propose. In France, reforms have re-mained on hold and should be a high priorityfor the new government following the upcom-ing elections.
HOW WILL THE RECOVERY IN EUROPE COMPARE WITH THAT IN THE UNITED STATES?
25
Currency unions, price convergence, and tradeintegration
Although price levels will continue to varyacross the euro area as they do across other cur-rency areas—owing among other things to dif-ferences in indirect taxes and nontradablesprices—the transparency induced by the euro islikely to strengthen price convergence. In con-junction with enabling factors such as bettercommunications, convergence pressures will in-tensify at both the wholesale and retail levels aswell as for nontradables (at least in border re-gions). Parsley and Wei (2001) show that institu-tional currency stabilization—in the form of cur-rency boards or currency unions—promotesprice convergence far beyond an incrementalstabilization of the exchange rate. Betweenthem, currency unions are more effective thancurrency boards.
By the same token, the institutional commit-ment to far-reaching integration that is part andparcel of adopting a common currency may pro-mote trade integration far beyond exchange ratestabilization. Although hotly contested, severalrecent studies suggest that countries trade muchmore when they share a common currency thanwhen they do not, and that euro-area countriesstand to reap substantial welfare gains from thesingle currency (e.g., Rose, 2000, and Rose andvan Wincoop, 2001; for a critique, see Persson,2001). Perhaps the most important channelthrough which currency union can have largetrade effects is by acting as a catalyst for the re-moval of a wide range of administrative, legal,and regulatory impediments to integration.
Financial market integration
In financial markets, the euro has alreadyacted as a compelling force for integration—al-though by doing so it has exposed a web of re-maining barriers to cross-border operations
stemming from both private and public policypractices. The arrival of cash euros may onlyhave a small direct effect on retail financial serv-ices, but it could well strengthen the con-stituency for removing such obstacles. Recently,political agreement was reached on a directiveto bring the costs of cross-border retail pay-ments in line with national payments, and EUinstitutions are working on a Financial ServicesAction Plan (consisting of more than 40 individ-ual measures) that aims to integrate financialmarkets by 2005.
Reaping the Gains from Integration
The example of financial markets illustratesthe need for accompanying measures to allowEuropean Monetary Union (EMU) countries toreap the full benefits of the common currency.The single market still needs to be completed—for example, through the liberalization of en-ergy, gas, and other network industries, and bymaking progress on common standards. TheEuropean Commission’s proposal to end exclu-sive car dealerships (which led to blatant pricediscrimination across markets) is a good exam-ple that the euro cannot achieve price conver-gence on its own but may be a catalyst for re-moving other hindrances to integration.
If the euro is successful in furthering the inte-gration of product, capital, and labor markets,the adjustment to a more optimal allocation ofresources may accelerate structural change andincrease regional specialization. In the absenceof sufficiently flexible product and labor mar-kets, the potential of EMU would not be real-ized to the full, and countries could even findthemselves worse off in the new regime.Consequently, the need for structural reformsthat facilitate EMU members’ ability to adjust toshocks and cope with secular change is morepertinent than ever.

In the United Kingdom, growth in 2001 wasthe strongest among the G-7 economies. Under-lying this strong performance, however, were sig-nificant disparities in the various sectors of theeconomy. While private consumption remainedstrong, external demand weakened, which—along with the continued strength of sterlingand weakening confidence in the aftermath ofSeptember 11—contributed to a sharp declinein manufacturing output, although this now ap-pears to be stabilizing. During 2002, outputgrowth is expected to remain relatively resilient,underpinned by the substantial interest rate cutslast year, the projected fiscal stimulus in the2002/03 budget, and the global recovery.Against this background, the Bank of Englandhas appropriately left interest rates on hold forthe time being, although if consumption re-mains strong and the external recovery unfoldsas expected, a policy tightening may have to beconsidered soon—especially given the potentialimbalances in the economy, notably the high lev-els of household and corporate debt. The cycli-cally adjusted fiscal deficit should not rise abovethe path projected in the November pre-budgetreport, and—given the already sharp increase inpublic spending—caution will need to be exer-cised on introducing new expendituremeasures.
In the countries of Northern Europe, the paceof recovery is expected to be somewhat fasterthan elsewhere on the continent, as domestic de-mand remains relatively solid and—given theiropen economies—they benefit commensuratelymore from the global recovery. In late March,Sweden (along with New Zealand) became thefirst major country to raise interest rates follow-ing the recent downturn. Among individualcountries, activity is expected to be supported bytax cuts (Norway and Sweden), an improvementin the IT sector, a highly competitive currency(Sweden), and by generally strong labor marketconditions. In Switzerland, GDP growth is ex-pected to be more moderate, and—in part re-flecting the continued strength of the franc—interest rates were recently lowered by 25 basispoints.
Latin America: Resisting Spillovers fromthe Crisis in Argentina
Recent economic attention on Latin Americahas been focused on the crisis in Argentina and itsimplications for the rest of the region. The out-look for Argentina and the extremely difficult ad-justment this country now faces are discussed inmore detail below. With the possible exception ofUruguay, economic and financial spillovers fromthe Argentine crisis appear to have been gener-ally limited to date—as indicated, for example, bythe muted reactions of bond spreads in mostother regional economies and their declining cor-relation with those of Argentina, together withother favorable trends in financial market accessand the general stability of exchange rates overrecent months (Figure 1.9). Substantial risks anduncertainties remain, however. For example,more severe spillover effects from the Argentinecrisis may still lie ahead, especially if there is norapid turnaround in policies, if confidence deteri-orates further, and if the magnitude of losses forinvestors and bondholders ends up being greaterthan estimated so far. Regional economies mayalso adjust less smoothly than assumed in the cur-rent outlook to a sharp improvement in interna-tional competitiveness in Argentina. Beyond theseconcerns, conditions and prospects for individualcountries will continue to be shaped by their ex-ternal trade and financial links—especially withthe advanced economies; by developments incommodity markets and other key sectors; by con-ditions in the world oil market; and by the stanceof domestic macroeconomic policies and a rangeof country-specific factors.
Argentina’s short-term economic prospects re-main highly uncertain, but a significant contrac-tion in output and acceleration of inflation dur-ing 2002 appear unavoidable. Domestic demandis likely to fall substantially this year, given theimpact of rising unemployment, lower confi-dence, the freeze on bank deposits, and otherdownward pressures on incomes and spending.Exports are likely to pick up in response to thedepreciation of the exchange rate and projectedstrengthening in regional and global economicconditions, although in the short run much will
CHAPTER I ECONOMIC PROSPECTS AND POLICY ISSUES
26

depend on a strengthening of trade financing.Correspondingly, with imports slumping and ex-ternal financing largely cut off, the trade surplusis expected to strengthen further and the cur-rent account to move into surplus this year. Thedepth and duration of the downturn inArgentina will hinge primarily on the new gov-ernment’s economic program and on how effec-tively it is implemented. While many details ofthis program have yet to be announced, thebroad outline of what is required to restore eco-nomic stability and growth is reasonably well de-fined. Of key importance will be reining in thefiscal deficit—despite a sharp fall in tax rev-enues—to a level that can be covered with avail-able, noninflationary sources of finance; avoid-ing, in this regard, reliance on the printing ofmoney to fund public spending; ensuring a func-tioning, solvent banking system; and promotingan open external trade regime.
Prospects for Latin America as a whole will bestrongly influenced by economic developmentsin the advanced economies—both through tradelinks, which vary quite widely across the regionin strength and direction (Figure 1.10), andthrough the financial flows that are needed tomeet the region’s high external funding require-ments (Table 1.5). Such flows appear closely re-lated to investor sentiment in the major financialcenters and, as they become dominated byequity-based flows, may well be procyclical.9
Mexico and other countries in Central Americawere hit hard in 2001 by the U.S. slowdown, andthe Caribbean nations suffered from a downturnin tourism after September 11. With both ofthese influences turning around in 2002, growthamong these countries should pick up strengthduring the year and return to robust rates in2003 (Table 1.6). In addition to the recent risein oil prices, strong policy credibility should helpMexico’s prospects for a sound recovery: firmmonetary and fiscal policies have been main-tained during the economic downturn, includ-ing through a range of revenue-enhancing meas-
LATIN AMERICA: RESISTING SPILLOVERS FROM THE CRISIS IN ARGENTINA
27
50
100
150
200
250
300
350
400
Figure 1.9. Western Hemisphere: EMBI Plus Spreads and Exchange Rate
Most Latin American financial markets have strengthened since the September 11 shock and shown little reaction to the crisis in Argentina.
EMBI+ Spreads
Brazil
Argentina
Sep. Oct. Nov. Dec. Jan. Feb. Mar. Apr. 2, 2001 2002
Sources: Bloomberg Financial Markets, LP; Haver Analytics; and IMF staff estimates.
(September 11, 2001 = 100, unless otherwise indicated)
Mexico
Peru
Venezuela
50
100
150
200
250
300
350
85
90
95
100
105
110Exchange Rate vis-à-vis U.S. Dollar
Brazil
Argentina(left scale)
Sep. Oct. Nov. Dec. Jan. Feb. Mar. Apr. 3, 2001 2002
Mexico
Peru
Venezuela(left scale)
-1.5
-1.0
-0.5
0
0.5
1.0
1.5Emerging Market Spread Correlation with Argentina(80-day rolling correlations)
Chile
Brazil
Jan. Mar. May Jul. Sep. Nov. Jan. Apr. 2, 2001 2002
MexicoUruguay
Venezuela
September 11
Chile
9See Chapter II of the October 2001 World EconomicOutlook.

ures approved in the 2002 budget (although notthe more comprehensive tax reforms originallyenvisaged). Reflecting this, financial market sen-timent has remained favorable, with the peso ap-preciating against the dollar since September, in-flation below its target level, and furtherupgrades to investment-grade status for foreigncurrency–denominated sovereign bonds. A con-tinuation of these trends should provide somescope for a further lowering of borrowing costs,thus helping Mexico’s public finances.
With recent indicators suggesting that tradeperformance is improving and domestic demandrecovering, growth in Brazil is also expected togain strength this year and next—helped by re-coveries in the United States and Europe, furthereasing of the power crisis that hurt activity in2001, and improving domestic confidence.Vulnerabilities remain, especially in view ofBrazil’s large (though declining) external financ-ing requirement, although recent developmentsin this regard appear promising: improvements inmarket access are indicated by the successfulplacement in the first quarter of three govern-ment bond issues, more than covering the gov-ernment’s 2002 external amortization burden,and by strong foreign direct investment inflows.Monetary policy has eased modestly in recentmonths, but needs to remain vigilant so as to en-sure the achievement of the inflation target, whilefiscal policy remains on track. Uruguay’s recentdifficulties—including a widening bond spread,exchange rate pressures, and a downgrade of sov-ereign bonds from investment-grade status—havebeen exacerbated by its relatively high trade ex-posure to Argentina. But a core problem isUruguay’s vulnerability to exchange rate move-ments, given that public and private debt ismainly denominated in U.S. dollars—highlight-ing the need for measures to strengthen the fiscalposition, ensure debt sustainability, and supportthe new more flexible exchange rate regime.
Countries in the Andean region have been af-fected both by the overall slowdown in globaltrade and, more specifically, by the weakening incertain commodity markets in 2001—notablythose for oil (of particular importance for
CHAPTER I ECONOMIC PROSPECTS AND POLICY ISSUES
28
Other advanced economies
Exports account for a relatively low share of GDP in most Latin American countries and are diversified across advanced and emerging economies—apart from Mexico, which has close trade links with the United States.
Argentina
Brazil
Chile
Colombia
Mexico
Peru
Uruguay
Venezuela
0 5 10 15 20 25 30
Figure 1.10. Selected Latin American Countries: Export Shares, 2001(Percent of GDP)
Source: IMF, Direction of Trade Statistics.
United StatesEuro area Latin America
Others

Venezuela and to a lesser extent Colombia andEcuador), copper and other metals (Chile, Peru),and coffee (Colombia). In particular, Venezuelais facing severe political and economic pressures,which have affected domestic and foreign in-vestor confidence. Notwithstanding the recentrally in oil prices, a substantial increase in gov-ernment spending last year combined with loweroil output (under production cuts agreed withOPEC) has led to fiscal pressures, a weakeningof the external current account, and a sizableloss of international reserves in the periodthrough mid-February 2002. Subsequently, the
authorities replaced the exchange band systemby a floating exchange rate regime and an-nounced a significant reduction in governmentexpenditure relative to the 2002 budget level.Although these measures constitute a step in theright direction, the overall economic situationremains worrisome, particularly because the de-gree of fiscal restraint is not yet clear. Firmerpolicies are needed to strengthen the fiscal posi-tion and help reduce interest rates, improve themanagement of oil revenue, reduce the role ofthe state in the economy, and foster businessconfidence to stimulate private investment.
LATIN AMERICA: RESISTING SPILLOVERS FROM THE CRISIS IN ARGENTINA
29
Table 1.5. Emerging Market Economies: Net Capital Flows1
(Billions of U.S. dollars)
1994 1995 1996 1997 1998 1999 2000 2001 2002 2003
Total2Private capital flows, net3 150.9 212.0 234.2 111.9 65.4 69.4 7.7 31.3 58.0 76.8
Private direct investment, net 80.8 100.1 117.0 142.7 154.7 163.8 153.4 175.5 157.1 165.7Private portfolio investment, net 113.0 41.2 86.9 46.3 –4.6 33.9 –4.3 –30.2 14.6 15.8Other private capital flows, net –42.9 70.7 30.3 –77.2 –84.7 –128.2 –141.4 –114.0 –113.7 –104.7
Official flows, net 3.5 26.9 –1.5 64.9 60.5 13.7 5.7 37.2 32.7 15.2Change in reserves4 –69.1 –116.7 –108.8 –59.8 –45.0 –85.8 –114.3 –134.3 –87.6 –60.6MemorandumCurrent account5 –72.2 –92.4 –96.8 –69.0 –52.6 32.9 128.3 89.4 16.9 –16.7
AfricaPrivate capital flows, net3 13.4 11.9 16.8 8.2 11.9 10.6 3.9 7.9 7.3 8.4
Private direct investment, net 3.2 2.1 3.8 8.0 6.5 8.9 7.3 22.2 10.8 11.8Private portfolio investment, net 3.6 3.1 2.8 7.0 3.7 8.7 –2.4 –8.8 3.4 3.5Other private capital flows, net 6.6 6.8 10.1 –6.8 1.6 –7.0 –1.0 –5.5 –6.9 –6.9
Official flows, net 3.3 4.1 –1.9 1.9 3.1 1.9 1.4 1.1 1.0 1.1Change in reserves4 –5.5 –1.4 –8.9 –11.0 1.5 –3.4 –13.7 –10.5 –0.5 –5.5MemorandumCurrent account5 –11.6 –17.3 –6.0 –7.2 –20.0 –15.3 3.1 –2.1 –10.8 –9.9Developing Asia6
Crisis countries7
Private capital flows, net3 35.4 56.8 74.3 –5.6 –31.6 –13.9 –15.7 –16.2 –6.4 –3.9Private direct investment, net 6.5 10.3 11.7 10.2 11.5 14.6 14.3 8.3 10.3 10.6Private portfolio investment, net 13.3 18.6 26.9 8.9 –9.0 11.8 7.0 3.2 5.1 1.5Other private capital flows, net 15.6 27.9 35.7 –24.7 –34.1 –40.4 –36.9 –27.7 –21.9 –16.0
Official flows, net 0.7 8.8 –4.7 13.7 17.0 –2.2 6.6 0.6 1.4 3.3Change in reserves4 –6.5 –17.5 –4.8 40.6 –46.9 –38.2 –22.4 –11.7 –11.3 –12.1MemorandumCurrent account5 –23.2 –39.8 –53.1 –25.5 69.7 62.7 47.1 32.6 23.1 17.9Other Asian emerging marketsPrivate capital flows, net3 34.9 40.7 46.0 19.6 –15.4 15.2 0.2 35.4 15.9 9.5
Private direct investment, net 38.2 44.1 43.9 47.3 48.3 47.3 40.1 45.2 49.2 50.1Private portfolio investment, net 7.5 2.1 3.3 –2.1 –9.2 2.4 –2.6 –17.6 –4.3 –5.9Other private capital flows, net –10.8 –5.4 –1.2 –25.6 –54.4 –34.6 –37.3 7.8 –29.1 –34.7
Official flows, net 2.5 –3.3 –7.3 –6.6 3.1 3.8 –2.1 –2.0 4.0 4.8Change in reserves4 –51.4 –25.4 –41.7 –46.8 –16.6 –38.6 –26.2 –80.7 –42.8 –34.4MemorandumCurrent account5 18.3 8.5 14.7 51.4 41.0 32.7 35.8 54.7 42.1 36.9
MemorandumHong Kong SARPrivate capital flows, net3 –7.3 –7.2 –9.4 11.7 –8.5 1.0 4.2 –5.1 –9.9 –10.4

Among other Andean nations, activity mayremain subdued in most cases at least throughthe first half of 2002; but then, with non-oilcommodity prices—including those for metalsand coffee—expected to pick up as globaldemand firms (see Appendix 1.1), growth isgenerally projected to strengthen later in theyear and in 2003. A strong recovery is expectedin Chile, for example, helped by sound institu-tions. Low inflation has enabled the centralbank to lower interest rates in early 2002, and
other financial market indicators have alsobeen positive. The pickup in Colombia may bemore subdued, with the outlook clouded byuncertainties stemming from the breakdownof peace negotiations, forthcoming elections,and possible spillovers from economic difficul-ties in Venezuela. Progress with disinflationand fiscal consolidation, including pension re-form, remains important in order to strengthenmarket sentiment and the base for sustainedgrowth.
CHAPTER I ECONOMIC PROSPECTS AND POLICY ISSUES
30
Middle East and Turkey8
Private capital flows, net3 15.7 9.9 7.2 15.1 9.5 0.6 –24.0 –27.1 –10.2 –0.7Private direct investment, net 4.8 6.4 4.7 5.2 6.3 5.4 7.3 8.5 8.5 9.7Private portfolio investment, net 7.6 2.0 1.8 –0.9 –13.2 –3.2 –13.7 –10.2 –7.1 –4.6Other private capital flows, net 3.4 1.4 0.7 10.8 16.3 –1.7 –17.6 –25.5 –11.6 –5.9
Official flows, net 3.5 4.5 6.6 9.3 2.9 2.4 –0.1 7.1 11.0 3.5Change in reserves4 –4.7 –11.6 –22.2 –19.4 9.7 –6.5 –27.6 –14.3 –7.5 4.0MemorandumCurrent account5 –5.7 –4.9 5.0 3.3 –23.3 11.7 63.1 42.9 10.5 –5.8
Western HemispherePrivate capital flows, net3 47.1 44.0 66.4 70.6 71.3 43.2 42.5 27.1 37.7 45.4
Private direct investment, net 22.8 24.2 40.3 56.2 60.6 64.1 61.6 67.2 46.3 53.1Private portfolio investment, net 65.0 0.8 38.8 25.9 18.7 11.1 4.6 0.9 13.6 17.0Other private capital flows, net –40.7 19.0 –12.7 –11.5 –8.0 –32.0 –23.8 –41.0 –22.2 –24.7
Official flows, net 4.7 18.6 3.4 13.7 16.1 7.4 –0.5 29.1 11.8 2.2Change in reserves4 4.0 –23.3 –29.0 –13.8 8.7 7.8 –2.8 1.7 –5.5 0.2MemorandumCurrent account5 –52.2 –36.5 –40.5 –67.1 –90.7 –56.7 –47.9 –54.3 –50.2 –49.6
Countries in transitionPrivate capital flows, net3 4.4 48.6 23.5 3.9 19.8 13.9 0.8 4.2 13.8 18.1
Private direct investment, net 5.3 13.1 12.5 15.8 21.4 23.4 22.8 24.0 31.9 30.3Private portfolio investment, net 16.1 14.6 13.3 7.5 4.5 3.1 2.8 2.4 3.8 4.3Other private capital flows, net –17.0 20.9 –2.4 –19.4 –6.1 –12.6 –24.8 –22.2 –22.0 –16.5
Official flows, net –11.2 –5.8 2.3 32.9 18.2 0.4 0.4 1.4 3.5 0.3Change in reserves4 –5.1 –37.5 –2.3 –9.4 –1.4 –7.0 –21.5 –18.8 –19.9 –12.8MemorandumCurrent account5 2.2 –2.4 –16.9 –24.0 –29.4 –2.2 27.1 15.6 2.2 –6.1
MemorandumFuel exportersPrivate capital flows, net3 18.6 23.4 0.6 –16.6 –1.4 –24.2 –58.3 –38.8 –38.0 –23.2
Nonfuel exportersPrivate capital flows, net3 132.4 188.6 233.7 128.5 66.8 93.6 66.0 70.1 97.8 100.4
1Net capital flows comprise net direct investment, net portfolio investment, and other long- and short-term net investment flows, includingofficial and private borrowing. Emerging markets include developing countries, countries in transition, Korea, Singapore, Taiwan Province ofChina, and Israel.
2Excludes Hong Kong SAR.3Because of data limitations, “other private capital flows, net” may include some official flows.4A minus sign indicates an increase.5The sum of the current account balance, net private capital flows, net official flows, and the change in reserves equals, with the opposite
sign, the sum of the capital account and errors and omissions.6Includes Korea, Singapore, and Taiwan Province of China. 7Includes Indonesia, Korea, Malaysia, the Philippines, and Thailand.8Includes Israel and Malta.
Table 1.5 (concluded)
1994 1995 1996 1997 1998 1999 2000 2001 2002 2003

The Asia-Pacific Region: Turningthe Corner
Most economies in the Asia-Pacific region haveexperienced a sharp fall-off in growth since 2000,but are now showing signs of a turnaround. Thepath has been largely driven by the external envi-ronment including the global electronics cycle, asector that also contributed significantly to rapidrecoveries following the financial crises of1997–98 (see Figure 1.11). With most countriesbeing oil importers, the oil price cycle has also af-fected activity, with high oil prices in late 2000contributing to the subsequent weakening of in-comes and demand in many countries, weakeroil prices in 2001 providing support for recovery,and recent increases in oil prices reducing thisimpetus. The opposite pattern is of course truefor the region’s oil producers. While Japan’s pro-longed economic difficulties have not preventedstrong growth in other Asian economies over thepast decade, Japan remains an important tradingpartner and source of capital for many of thesecountries.10 These links, together with increased
concerns about the implications of the recentdepreciation of the yen for other regional cur-rencies (see below), suggest that the currentcontraction in Japan may be adding to weak-nesses in the region more generally. Poorer ex-ternal conditions during last year also spreadinto domestically exposed sectors, further lower-ing demand, confidence, and employment, withother economic and political uncertainties insome countries putting downward pressures ongrowth. Activity has remained relatively buoyantin China and to a lesser extent India, which areless dependent on external trade than othereconomies in the region, although they toohave experienced a marked decline in exports,lower confidence, and some slowing in growthsince 2000.
Recent economic indicators have generallyprovided encouraging signs about the prospectsfor recovery. Increases in semiconductor prices,orders, and shipments over recent months, to-gether with the broader strengthening of activitynow appearing in the United States and other
THE ASIA-PACIFIC REGION: TURNING THE CORNER
31
Table 1.6. Selected Western Hemisphere Countries: Real GDP, Consumer Prices, and Current Account Balance (Annual percent change unless otherwise noted)
Real GDP Consumer Prices1 Current Account Balance2___________________________ ___________________________ _________________________2000 2001 2002 2003 2000 2001 2002 2003 2000 2001 2002 2003
Western Hemisphere 4.0 0.7 0.7 3.7 8.1 6.4 8.2 7.4 –2.4 –2.9 –2.4 –2.5Mercosur3 2.9 0.2 –0.9 3.0 5.0 4.9 10.5 9.7 –3.8 –3.7 –2.0 –2.1Argentina4 –0.8 –3.7 –10– –15 0–3 –0.9 –1.1 25–30 30–35 –3.1 –2.1 4.2 5.5Brazil 4.4 1.5 2.5 3.5 7.0 6.8 6.1 3.9 –4.1 –4.6 –3.7 –4.1Uruguay –1.3 –3.1 –1.7 3.0 4.8 4.4 7.1 9.4 –2.7 –2.6 –1.7 –1.9Andean region 3.3 2.2 2.1 4.0 13.0 8.8 8.7 7.6 3.3 –0.1 –1.1 –1.3Chile 4.4 2.8 3.0 6.0 3.8 3.6 2.3 3.0 –1.3 –1.4 –1.8 –2.4Colombia 2.8 1.5 2.5 3.3 9.2 8.0 7.1 5.3 0.4 –2.6 –3.2 –3.7Ecuador 2.3 5.2 3.1 6.0 96.2 37.0 15.5 8.0 5.3 –4.6 –6.1 –3.1Peru 3.1 0.2 3.7 5.0 3.8 2.0 1.8 2.3 –3.1 –2.0 –2.3 –2.7Venezuela 3.2 2.7 –0.8 1.3 16.2 12.5 20.8 20.2 10.8 3.6 2.6 2.3Central America and Caribbean 6.0 0.2 1.9 4.6 8.8 6.6 4.5 4.0 –3.5 –3.2 –3.4 –3.3Dominican Republic 7.8 3.0 3.5 5.2 7.7 8.9 3.7 3.9 –5.1 –3.9 –4.8 –4.1Guatemala 3.6 1.8 2.3 3.5 5.1 8.7 5.0 3.9 –5.5 –4.6 –4.5 –4.1Mexico 6.6 –0.3 1.7 4.9 9.5 6.4 4.3 3.8 –3.1 –2.8 –3.0 –3.01In accordance with standard practice in the World Economic Outlook, movements in consumer prices are indicated as annual averages rather
than as December/December changes during the year, as is the practice in some countries.2Percent of GDP.3Includes Argentina, Bolivia, Brazil, Paraguay, and Uruguay.4Because of the high level of uncertainty regarding the economic outlook, projections for output and inflation in Argentina are presented as
ranges. The regional aggregates are based on the midpoint of the range.
10See Box 1.4 of the October 2001 World Economic Outlook.

advanced economies, will support export per-formance and industrial production in Asia.Indeed, production has already picked up anumber of countries (including China, Korea,Malaysia, and Thailand), as has consumerand/or business confidence, although increasesin unemployment across the region may mutethe pickup in household spending.
Financial sector indicators have also been gen-erally positive. In particular, most equity marketshave recovered from the September 11 shockand continued to rise in 2002, and bond spreadshave declined to below their early Septemberlevels and shown little reaction to the turmoil inArgentina. Regional exchange rates have notmoved substantially over recent months, al-though the depreciation of the yen has height-ened concerns among policymakers in otherAsian economies about their competitive posi-tions, particularly China and Malaysia. While al-lowing more flexibility in the latter currencieswould at some point be desirable to provide anadditional buffer against external shocks, theseand most other exchange rates in the region arestill lower in real terms than before the Asian fi-nancial crisis of 1997 (Figure 1.11). Moreover,the external vulnerability of these countries hasbeen lowered as a result of the buildup of re-serves over recent years and reductions of short-term debt. These trends suggest that most Asianeconomies still have some capacity to absorb theeffects of the weaker yen without this jeopardiz-ing their international competitiveness or finan-cial sector confidence.
Strong economic fundamentals have also al-lowed many regional economies to use macro-economic policies in support of recovery. Withinflation generally subdued, most countries havebeen able to ease monetary policy. Sizable fiscalpackages have also boosted activity in severalcountries, although in some cases, notably India,Indonesia, and the Philippines, the scope for fiscaleasing is constrained by already high levels ofpublic deficits or debt.
Looking at the projections, activity in almostall countries is expected to pick up in 2002 andgain further strength in 2003 (Table 1.7).
CHAPTER I ECONOMIC PROSPECTS AND POLICY ISSUES
32
Figure 1.11. Asia: Slowdown In Electronics Exports
Sources: CEIC Data Company Limited; and IMF, Information Notice System.
Across Asia, electronics exports as a share of GDP have fallen since 2000. Real exchange rates for most countries remain more depreciated than in the lead up to the financial crises of 1997–98.
0
20
40
60
80
0
20
40
60
80
20
40
60
80
100
120
140
20
40
60
80
100
120
140
Real Effective Exchange Rate(1995 Q1 = 100)
Hong Kong SAR
Indonesia
1995 96 97 98 99 2000 01
Korea
Malaysia
ChinaSingapore
1995 96 97 98 99 2000 01
TaiwanProvince of
ChinaThailand
Philippines
Electronics Exports(percent of GDP)
Korea Singapore TaiwanProvinceof China
Malaysia Philippines Thailand
1999 2000 2001

Among the newly industrialized economies, therecovery in global activity and in the electronicssector should support modest growth in HongKong SAR, Singapore, and Taiwan Province of Chinain 2002 following sharp downturns in 2001, andfirmer growth is expected in Korea, where therecovery appears to be more advanced. While ac-tivity should gain momentum during the yearand into 2003, the rebound is not expected tobe as strong as that seen in the late 1990s—espe-cially as the rapid growth of investment and ex-ports associated with the information technologysector in that earlier period appears unlikely tobe repeated. Domestic sources of growth inthese countries may become more importantthan in the past, therefore, as will ongoing ef-forts to broaden their manufacturing and exportbase. Steady pickups are projected for the Asso-ciation of South East Asian Nations (ASEAN)over 2002 and 2003, also stemming in part fromthe stronger external environment. Especially in
Indonesia, the Philippines, and Thailand, how-ever, the structural problems that muted theirrecoveries following the 1997–98 downturns con-tinue to place a damper on current conditionsand the outlook. Hence, the strength and ro-bustness of growth in the period ahead will becontingent on progress with reforms needed tostrengthen financial and corporate sectors, im-prove fiscal positions, and boost internationaland domestic confidence.
Growth in China is expected to be about7 percent in 2002, supported by robust domesticdemand. External demand, however, will con-tinue to contribute negatively to growth, asChina’s recent entry to the World Trade Organi-zation (WTO)will boost imports, especially ofcapital goods, more rapidly than the global re-covery will increase exports. The recent easingof monetary policy is appropriate, especially asdeflationary pressures have reemerged and realinterest rates have been edging up. China’s vul-
THE ASIA-PACIFIC REGION: TURNING THE CORNER
33
Table 1.7. Selected Asian Countries: Real GDP, Consumer Prices, and Current Account Balance(Annual percent change unless otherwise noted)
Real GDP Consumer Prices1 Current Account Balance2___________________________ ___________________________ ___________________________2000 2001 2002 2003 2000 2001 2002 2003 2000 2001 2002 2003
Emerging Asia3 6.9 5.0 5.6 6.2 1.8 2.5 2.3 2.8 2.8 3.1 2.2 1.8
Newly industrialized Asian economies 8.5 0.8 3.6 5.1 1.1 1.9 1.3 1.9 4.5 6.3 5.8 5.3
Hong Kong SAR 10.5 0.1 1.5 3.6 –3.7 –1.6 –2.5 — 5.5 7.4 7.7 7.7Korea 9.3 3.0 5.0 5.5 2.3 4.1 2.7 2.6 2.7 2.0 1.5 0.6Singapore 10.3 –2.1 3.2 5.1 1.1 1.0 1.1 1.6 17.0 23.3 21.4 21.4Taiwan Province of China 5.9 –1.9 2.3 4.8 1.3 — 0.4 1.6 2.9 6.7 6.6 6.6
ASEAN-4 5.1 2.6 3.3 4.1 3.0 6.6 6.6 5.5 7.9 5.7 3.4 2.9Indonesia 4.8 3.3 3.5 4.0 3.8 11.5 12.4 8.2 5.3 4.5 1.8 1.4Malaysia 8.3 0.4 3.0 5.5 1.6 1.4 1.8 2.5 9.4 8.2 5.8 5.3Philippines 4.0 3.4 4.0 4.2 4.3 6.1 5.0 5.1 12.1 5.6 3.6 3.5Thailand 4.6 1.8 2.7 3.5 1.6 1.7 0.6 2.7 7.6 5.4 4.0 3.1
South Asia4 5.3 4.2 5.2 5.6 4.0 3.9 4.2 4.2 –1.2 –0.3 –0.7 –0.7Bangladesh 5.5 4.5 3.9 4.0 2.3 1.8 3.8 5.3 –1.6 –1.9 –1.8 –1.8India 5.4 4.3 5.5 5.8 4.0 3.8 4.1 4.0 –0.9 — –0.5 –0.5Pakistan 3.9 3.4 4.2 5.1 4.4 3.8 3.7 4.0 –1.9 –1.2 –1.0 –1.4
Formerly centrally planned economies5 7.9 7.2 6.9 7.4 0.4 0.7 0.4 1.6 1.9 1.7 1.0 0.4
China 8.0 7.3 7.0 7.4 0.4 0.7 0.3 1.5 1.9 1.7 1.1 0.5Vietnam 5.5 4.7 5.3 7.0 –1.7 0.1 4.9 3.7 2.1 1.7 –1.6 –2.9
1In accordance with standard practice in the World Economic Outlook, movements in consumer prices are indicated as annual averages ratherthan as December/December changes during the year, as is the practice in some countries.
2Percent of GDP.3Includes developing Asia, newly industrialized Asian economies, and Mongolia.4Includes Bangladesh, India, Maldives, Nepal, Pakistan, and Sri Lanka.5Includes Cambodia, China, Lao People’s Dem. Rep., Mongolia, and Vietnam.

nerability to weaknesses in external demand andconfidence appears to be limited, given its highreserves, favorable debt indicators, and risingFDI inflows; as noted above, a gradual move to amore flexible exchange rate regime would alsobe desirable. But ongoing progress with struc-tural reforms and meeting associated fiscal chal-lenges will be key in sustaining strong medium-term growth (Box 1.4). In this regard, thestronger competition that is likely to arise fromWTO membership will increase pressures for re-form in such sectors as agriculture, manufactur-ing, and banking. Reform priorities include theintertwined issues of restructuring the state-owned enterprises, reforming the banking sec-tor—especially addressing the substantial non-performing loans problem in the state-ownedcommercial banks—and redesigning the pen-sion system. The capacity of the new asset man-agement companies to dispose of assets effec-tively also needs to be enhanced.
In India, a modest pickup of growth to 5!/2 per-cent is expected in 2002, with robust servicesector activity and a projected record level ofagricultural output helping to offset lingeringweaknesses in external demand and industrialproduction. As in China, India faces a comfort-able external position, given its low current ac-count deficit—reflecting, in part, buoyant trans-fers from nonresident Indians—together withhigh reserves and strong capital inflows. Themain concerns surrounding the medium-termoutlook stem from the continued difficult fiscalposition—the public sector deficit is again ex-pected to be over 11 percent of GDP in2001/02—and inadequate progress with struc-tural reforms. These pressures need to be tackledby moving ahead with fiscal consolidation as en-visaged in the fiscal responsibility bill, addressingfiscal pressures at the state level, and implement-ing the ambitious set of reforms proposed by thePrime Minister’s Economic Advisory Council.
Growth in Pakistan weakened in 2001 underthe impact of the global slowdown, increased re-gional uncertainty arising from the conflict inAfghanistan and heightened tensions with India,and a fall in cotton production. External bal-
ances have improved, however, contributing toan appreciation of the exchange rate and henceto lower inflation and interest rates. Thesetrends, in the context of firmer global activityand improvements in the regional security situa-tion, should support stronger growth in the pe-riod ahead. Also needed to sustain this improvedoutlook will be ongoing commitments tostrengthen the fiscal position—particularly byensuring adequate revenue performance—andto push ahead with structural reform, wherethere has been encouraging recent progress withprivatization and financial sector reforms. Withthe conflict apparently winding down and politi-cal stability returning, Afghanistan should be ableto begin laying the groundwork for economicand social recovery (see Box 1.5). Key measures,which will need major financial and technicalbacking from the international community, areto restore the institutions and infrastructureneeded to underpin economic activity. Thesesteps would involve the enactment and imple-mentation of legal and regulatory reforms, theestablishment of effective monetary and fiscalarrangements, and a liberal exchange and tradesystem, to ensure reconstruction under a stablemacroeconomic environment.
Growth in Australia and New Zealand has heldup relatively well during the global slowdown.The housing sector has performed strongly inboth countries—supported by lower interest ratesand, in Australia, by incentives for first-timehome buyers and by a rebound followingchanges in the tax regime. Although exportsweakened in the second half of 2001, strong earn-ings growth in the first half, helped by lower ex-change rates, also underpinned robust domesticactivity during the year and contributed to a largereduction in each country’s current accountdeficit. Looking ahead, recent improvements inconfidence and in employment levels shouldbroaden the base of growth this year and next—with growth of about 4 percent expected inAustralia in 2002 and 2003 and 2!/2 to 3 percentin New Zealand. In New Zealand, given favorabledevelopments in the domestic economy and thestronger external environment, the Reserve Bank
CHAPTER I ECONOMIC PROSPECTS AND POLICY ISSUES
34

raised its official interest rate by !/4 percentagepoint in March. It is important that the fiscal po-sitions of both countries remain sound, despitesome recent easing and potential pressures thatmay arise in the year ahead—especially in NewZealand, which faces an election year and wherethe public sector’s role in the economy has ex-panded somewhat in the recent past.
European Union Candidates: Resistingthe Global Downturn
Economic performance among the EU acces-sion countries in central and eastern Europegenerally held up well compared with other re-gions during the global slowdown. Not surpris-ingly, exports—which are largely directed to theEuropean Union—have weakened significantlyover the past year as external demand slowed.But this has been largely offset by relatively ro-bust domestic demand, generally underpinnedby lower inflation and interest rates, strong in-vestment spending, and fiscal stimulus in severalcountries (Figure 1.12). There are two impor-tant exceptions to this pattern. In Poland—by farthe largest of the 10 transition countries cur-rently negotiating for EU accession—domesticactivity has been weak and growth has slippedsharply since 2000. And Turkey—also an EU can-didate, although formal negotiations have notyet begun—suffered a severe contraction in 2001under the impact of domestic and externalshocks, although a moderate recovery is ex-pected in 2002. Looking forward, the emergingrecovery in western Europe can be expected toprovide support to activity in all of these coun-tries in the period ahead, although the possibil-ity of further oil price volatility is for many—including Turkey—an important risk.
Most of the EU candidates in central and east-ern Europe continue to run high current ac-count deficits—a potential source of vulnerabil-ity should international investor sentimenttoward the region or toward individual countrieschange for the worse (Figure 1.12). So far,though, external financing flows have been wellsustained, even during recent periods of height-
EUROPEAN UNION CANDIDATES: RESISTING THE GLOBAL DOWNTURN
35
The strength of domestic demand has helped offset external trade weakness among many EU accession candidates, while robust direct investment inflows have contributed to the financing of current account deficits.
-6
-4
-2
0
2
4
6
8
10
Figure 1.12. Growth and External Balances in Central and Eastern Europe
Bulgari
a
Czech R
epub
lic
Hunga
ry
Poland
Roman
ia
Slovak
Repub
lic
Sloven
ia
ConsumptionFixed investment
InventoriesGovernment
Net exportsGDP growth
Eston
iaLa
tvia
Lithu
ania
-10
-5
0
5
10
Bulgari
a
Czech R
epub
lic
Hunga
ryPola
nd
Roman
ia
Slovak
Repub
lic
Sloven
ia
Eston
iaLa
tvia
Lithu
ania
Contribution to GDP Growth, 2001(percent)
Investment and Deficits, 2001(percent of GDP)
Net direct investment Current account balance

CHAPTER I ECONOMIC PROSPECTS AND POLICY ISSUES
36
Over the past two decades, China’s progressin reforming its economy has resulted in sus-tained large increases in incomes and deepreduction in poverty. Despite these impressiveachievements, a long reform agenda remains tobe accomplished. While reforming the financialsector, restructuring the state-owned enter-prises, and improving the social safety net are atthe top of this agenda, intrinsically linked tothese objectives is the need to assure themedium-term sustainability of China’s fiscalsituation.
At first glance, fiscal sustainability may notappear to be a pressing issue for China. Theofficial debt stock is low and the state budgetdeficit modest. Official data show that the statebudget deficit1 has hovered at relatively lowlevels over the last 20 years (see the figure).While the budget deficit widened somewhat inthe wake of the Asian crisis, it gradually nar-rowed over the past two years (to about 3!/3 per-cent of GDP in 2001, from its recent peak of4 percent of GDP in 1999).2 Reflecting the lowstate budget deficits, the stock of explicit gov-ernment debt stood at 23 percent of GDP atend-2000,3 of which 18 percent of GDP wasdomestic.
Fiscal activity in China, however, extends wellbeyond the official state budget. For example,following the formal separation of state-owned
enterprise finances from the budget, the govern-ment extensively used the banking system tosupport state-owned enterprises, and a signifi-cant share of these loans have become nonper-forming. The loan losses of the state-ownedbanks, although not legally a liability of the gov-ernment, are likely to require additional stateresources in the future.
If the government’s quasi-fiscal liabilitiesfrom the banking system were included, thebroader fiscal deficit and public debt-to-GDPratio would be significantly larger. Although aprecise estimation of these liabilities is con-strained by data limitations, it is likely that thefiscal deficit including new nonrecoverablebank loans is currently on the order of 5–6 per-cent of GDP. The stock of nonrecoverablebank loans at end-2000 was estimated at be-tween 50 to 75 percent of GDP (of which anamount equivalent to 15!/2 percent of GDP hasbeen transferred to asset management compa-
Box 1.4. China’s Medium-Term Fiscal Challenges
China: State Budget(Percent of GDP)
-5
0
5
10
15
20
25
30
35
1980 84 88 92 96 2000
Revenue Expenditure Balance
Sources: Ministry of Finance; and IMF staff estimates.
The main author is Raju Jan Singh.1Including funds borrowed by the central govern-
ment and on-lent to local governments and official ex-ternal lending to government agencies, but excludingquasi-fiscal activities.
2From the early 1980s till the mid-1990s, both rev-enue and expenditure declined steadily. This waslargely due to the separation of the financial accountsof state-owned enterprises from the budgetary ac-counts, which was undertaken to improve the state-owned enterprises’ managerial and financial auton-omy. The turnaround in revenue and spending sincethe mid-1990s reflects, in part, tax reforms that arestill ongoing, and the fiscal stimulus packages intro-duced in response to the Asian crisis.
3Including bonds issued to recapitalize the fourstate-owned commercial banks in 1998, and bondsused for on-lending to local governments.

ened uncertainty following the events ofSeptember 11 and the crisis in Argentina.Indeed, increasing optimism regarding thesecountries’ prospects for EU accession in a few
years’ time appears to be contributing to stronginflows of foreign direct investment (despite eco-nomic weakness in western Europe), which arealso reflected in the robustness of domestic de-
EUROPEAN UNION CANDIDATES: RESISTING THE GLOBAL DOWNTURN
37
nies).4 Hence, taking into account the stock ofthese loans would raise public debt to 75–100percent of GDP (as of end-2000).
Furthermore, substantial pressures exist foradditional public spending in the coming years.• Over the next decade, China will need to in-
crease its expenditure on health, education,poverty alleviation, infrastructure, and the en-vironment to meet its stated developmentgoals.
• Progress in state-owned enterprise reform willalso entail costs, as the remaining social re-sponsibilities (such as health, education, andpensions) carried out by these entities willhave to be taken up at least partly by thegovernment.
• The pension system will need to be reformedwith potentially large fiscal costs. The currentpay-as-you-go system (which covers mainly statesector employees) will require increasing gov-ernment support in the long run as the ratioof contributors to beneficiaries declines. In ad-dition, the government intends to move intime toward a new three-pillar nationwide pen-sion system, with one pillar being a publiclyfunded minimum pension for all workers.5
• The current system of fiscal federalism, whereeach province is more or less fiscally inde-pendent, will have to be reexamined with aview toward ensuring that all provincial gov-ernments have sufficient resources to providecertain minimum standards of basic govern-ment services.
The fairly high level of total (explicit and contin-gent) debt, combined with the additional pres-sures described above, suggests that strong eco-nomic growth alone will not provide sufficientfiscal resources to meet the country’s needs with-out an unsustainable buildup in public debt.Stabilizing the fiscal outlook will require• dealing forcefully with the flow of new bad
loans in the banking system, which is a key ob-jective of the ongoing state-owned enterpriseand banking reforms;
• reducing the state budget deficit further; giventhe expenditure needs foreseen, this will haveto involve a continued strengthening of therevenue effort through improvements in taxadministration and policy (sustaining thebuoyancy of revenues), as well as further reori-entation of spending to priority areas; and
• reforming the pension system through bothparameter changes in existing pensionarrangements (including raising the retire-ment age and increasing contributions)and careful design of new institutionalarrangements.Overall, China’s fiscal position, while not call-
ing for sharp and immediate corrective meas-ures, will require a gradual but sustained adjust-ment effort over the medium term. With suchan effort, including measures to reduce thebudget deficit and to effect continued state-owned enterprise, financial sector, and pensionreforms, the public sector debt burden could becontained and gradually reduced over themedium term.
4In 1999 and 2000, Y1.4 trillion of nonperformingloans from the state banks and one policy bank weretransferred to four newly created asset managementcompanies (AMCs). The AMCs have started disposingof these assets, including to foreigners, with the assis-tance of international investment banks. The losses ofthe AMCs will eventually have to be borne by thegovernment.
5As currently envisaged, a nationwide three-pillarpension system would consist of a public pension,mandatory individual pension accounts, and voluntarysupplementary individual accounts. A pilot provincialpension reform project was started in late 2001. Thegovernment also intends to use part of the proceedsfrom privatization (sales of state enterprise shares) tofinance reforms.

CHAPTER I ECONOMIC PROSPECTS AND POLICY ISSUES
38
Afghanistan is one of the poorest members ofthe Fund, following 20 years of conflict and aprolonged drought. The tasks ahead are daunt-ing: much infrastructure is destroyed, key gov-ernment institutions have been inoperative forthe last six years. Transactions are cash-based,several currencies are circulating, and no banksare operative. Large parts of the population aredisplaced, and key social indicators are grim.
The Afghan Interim Administration (AIA) wasestablished in December 2001 for six months, tobe followed by a two-year transitional administra-tion until a fully representational governmentcan be elected. In January 2002, the donor com-munity pledged over $4.5 billion for the next fiveyears to assist the reconstruction efforts and fi-nance current expenditure and reconstructionprojects in the budget. Currently, however, actualforeign aid inflow is limited to humanitarian aidand payment of civil servant wages in Kabul,through an emergency United Nations Develop-ment (UNDP) Trust Fund.
Role of the IMF
The Fund’s main task is to provide technicalassistance and policy advice in its areas of ex-pertise, to ensure a sound foundation for eco-nomic management, and to promote macro-economic stability during the reconstructionperiod. This involves assisting in• rehabilitation of basic institutions for the
economy and for the government to conductpolicy (such as Ministry of Finance andCentral Bank); and
• development of a macroeconomic frameworkto guide decision making for a sustainable,noninflationary recovery.Afghanistan may receive postconflict financial
assistance under the Fund’s Emergency Assis-tance Facility once there is sufficient capacity forplanning and policy implementation. Once amedium-term economic strategy has been elabo-rated, the Policy Reform and Growth Facility(PRGF) could support reforms.
Although the central bank and key ministriessurvived, capacity for essential functions is weak.The IMF is providing technical assistance (TA)to the central bank for currency reform, basicpayments system, and a minimum regulatoryframework. On fiscal issues, TA is being ex-tended to revive the treasury, prepare a budget,develop tax policy, strengthen revenue adminis-tration and expenditure management, and en-sure accountability and transparency (of keyconcern to donors). TA is furthermore providedto rebuild the statistical base (no data has beencollected in 6 years), while the IMF will also pro-vide training.
In two key issues the IMF has been offeringpolicy advice. First, currency reform: two domes-tic currencies now co-circulate (including onecounterfeit), along with several foreign curren-cies. The authorities will at some point intro-duce a new Afghan currency, once sound finan-cial policies and a well-developed institutionaland legal framework are fully in place. IMF staffare advising the authorities on how to ensure asmooth transition from the present situation ofco-circulating currencies to the introduction ofthe new currency. Second, the IMF and theWorld Bank assisted the authorities with thepreparation of a budget for recurrent expendi-tures for the new fiscal year that started March21, 2002. These expenditures are projected atabout US$460 million and cover the payment ofwages for about 220,000 civil servants and em-ployees of state-owned enterprises and for themilitary, as well as essential operations andmaintenance expenditures. Most of these expen-ditures will be financed by budget support fromdonors, although some $80 million is expectedto be collected in revenues.
Regional Impact
Reconstruction should bring substantial bene-fits to neighboring countries. In the near term,some of the 3.5 million refugees are expected toreturn to Afghanistan, easing the burden onPakistan and Iran. Imports for reconstructionare also expected to come largely from theneighbors; activity in Pakistan, such as the ce-
Box 1.5. Rebuilding Afghanistan
The main author is Ron van Rooden.

mand and import growth. More generally, theEU accession process continues to provide a keyanchor for the domestic policy agenda in thesecountries. This external discipline will be impor-tant, for example, in the context of current pres-sures for higher public spending that are beinggenerated by economic or political tensions inseveral countries, and in ensuring that the re-gion’s generally sound macroeconomic perform-ance can continue. Accession aspirations shouldalso help these countries maintain the momen-tum of progress that is needed with fiscal re-forms, privatization, other structural improve-ments, and environmental cleanups. Suchmacroeconomic and structural measures, inturn, will help ensure that the favorable climatefor investment and growth is sustained.
Looking at developments and prospects forcentral Europe, activity remains particularlyweak in Poland, reflected in falling employmentand record-high unemployment. Given improve-ments in the current account, appreciation pres-sures on the zloty, and lower inflation—whichended 2001 well below the target range—thecentral bank has been able to lower interestrates significantly over the past year (including areduction of 1!/2 percentage points in the inter-vention rate in late January). There should bescope for further monetary easing if weak eco-nomic conditions persist and inflation remainssubdued. The combination of somewhat easiermonetary conditions, improvements in domestic
confidence, and a stronger external environ-ment is expected to lead to a steady pickup ingrowth this year and next (Table 1.8). Growthhas been better sustained in the Czech Republic,Hungary, and the Slovak Republic, supported byrelatively strong confidence and domestic de-mand, lower inflation and interest rates, andvarying degrees of fiscal stimulus. A further in-crease in growth is expected in the periodahead—reaching about 4 percent in 2003—asexports pick up and domestic activity strength-ens further. In this context, a winding back of fis-cal support will be important—including inHungary, where a large stimulus is currently ex-pected in 2002—as such stimulus could make itmore difficult to reach the key policy objectivesof lower inflation, sustainable current accountdeficits, and medium-term fiscal consolidation.Strong domestic demand in the Slovak Republichas led to a particularly large increase in its cur-rent account deficit since 2000 and, while capitalinflows have also been strong, this external vul-nerability adds to pressures on the authorities tomaintain a firm fiscal stance and to push aheadwith privatization and other structural reforms.
Robust growth of about 4 to 5 percent is ex-pected to continue in Bulgaria and Romania, ac-companied by falling inflation and a gradual re-duction in current account deficits. In Bulgaria,it will be important for the authorities to main-tain a cautious fiscal stance to support the cur-rency board and help ensure continued external
EUROPEAN UNION CANDIDATES: RESISTING THE GLOBAL DOWNTURN
39
ment industry, has already been boosted. Overthe longer term, a calmer regional political situ-ation should improve plans for movement ofnatural resources, such as gas, across the region.Finally, establishing a strong customs and tax ad-ministration in Afghanistan should reducesmuggling across borders with neighbors.
Risks
Considerable risks remain. First, the securitysituation is still problematic. The AIA is in full
control of Kabul, but not in the provinces,which prevents forward movement with country-wide economic reforms. Second, the interimgovernment will be in office only until June2002, and then will be followed by another tran-sitional government; the possible lack of conti-nuity among policymakers mitigates against tak-ing difficult decisions. Third, while donors havepledged large amounts of financial assistance,delays in receiving actual cash resources maymake it difficult to execute the budget.

and domestic confidence. Macroeconomic poli-cies are broadly on track in Romania, with fiscalpolicy having been tightened in late 2001 andmonetary policy striking an appropriate balancebetween achieving further disinflation and pre-venting an excessive appreciation of the cur-rency. Further progress with structural reforms,including in the energy sector, remains impor-tant to help sustain the recent recovery ingrowth.
Turning to the Baltic countries, growth hasslowed somewhat from the rapid pace of2000–01. While domestic demand remains ro-bust, export growth in Estonia and Latvia has de-clined—particularly as a result of the EU slow-down and, for Estonia, the additional effects ofweaknesses in the information technology sectorin Finland and Sweden. In contrast, exportsfrom Lithuania have held up relatively well—pos-sibly because Lithuania has greater trade expo-sure to other emerging markets in Europe—andthis is expected to contribute to firm growth ofabout 4 percent this year. As in the other EU ac-cession countries, however, high current accountdeficits remain of concern in the Baltic region.
While readily financed through foreign direct in-vestment (FDI) and other inflows, such deficitsrequire that macroeconomic policies remainwell-disciplined—for example, in the face of fis-cal pressures arising from prospective EU andNATO accession—and that the momentum ofstructural reforms be maintained, including pri-vatization in Latvia and Lithuania. Sound fiscaland structural policies will also add support tothese countries’ hard currency pegs, which areat the center of their macroeconomic strategies;in this regard, Lithuania’s move from a dollar toa euro peg in February 2002 went smoothly,without disruptions to financial markets or confi-dence, and should promote prospects forgreater trade and financial integration withwestern Europe.
Turkey suffered its worst recession in over 50years in 2001, with the events of September 11—particularly through their impact on trade,tourism, and financial market confidence—setting back the tentative signs of recovery thathad been emerging following the economic andfinancial crisis at the start of the year. While re-cent real and financial have been mixed, GDP
CHAPTER I ECONOMIC PROSPECTS AND POLICY ISSUES
40
Table 1.8. European Union Candidates: Real GDP, Consumer Prices, and Current Account Balance(Annual percent change unless otherwise noted)
Real GDP Consumer Prices1 Current Account Balance2____________________________ ____________________________ ____________________________2000 2001 2002 2003 2000 2001 2002 2003 2000 2001 2002 2003
E.U. candidates 4.9 0.4 3.1 4.2 24.7 21.1 17.7 11.5 –5.2 –2.9 –3.6 –3.6Turkey 7.4 –6.2 3.6 4.7 54.9 54.4 49.1 26.9 –4.9 1.4 –1.2 –1.2Accession candidates 3.8 3.0 2.9 3.9 13.1 9.7 6.8 5.7 –5.3 –4.4 –4.5 –4.6
Baltics 5.4 5.4 4.1 5.3 2.2 2.7 3.0 3.1 –6.3 –6.4 –6.4 –6.0Estonia 6.9 5.0 3.7 5.5 4.0 5.8 3.5 3.5 –6.4 –6.8 –6.8 –6.5Latvia 6.6 7.0 4.5 6.0 2.6 2.5 3.0 3.0 –6.9 –7.1 –7.0 –6.4Lithuania 3.9 4.5 4.0 4.8 1.0 1.3 2.8 3.0 –6.0 –5.8 –5.8 –5.5
Central Europe 3.9 2.3 2.4 3.5 8.9 6.2 4.0 3.8 –5.3 –4.0 –4.1 –4.4Czech Republic 2.9 3.6 3.3 3.7 3.9 4.7 4.0 3.7 –5.6 –4.7 –4.8 –5.0Hungary 5.2 3.8 3.5 4.0 9.8 9.2 5.4 4.0 –2.9 –2.4 –2.9 –3.5Poland 4.1 1.1 1.4 3.2 10.1 5.4 3.2 3.2 –6.3 –4.0 –4.2 –4.5Slovak Republic 2.2 3.3 3.7 3.9 12.0 7.3 4.3 7.0 –3.7 –9.2 –8.8 –7.9Slovenia 4.6 3.0 2.6 3.6 8.9 8.4 6.5 5.5 –3.4 –0.4 –0.3 –0.4
Southern and south eastern Europe 3.0 4.9 4.3 5.0 32.9 25.0 18.2 12.9 –5.0 –5.8 –5.2 –5.0
Bulgaria 5.8 4.5 4.0 5.0 10.4 7.5 4.5 3.5 –5.8 –6.4 –5.9 –5.8Cyprus 5.1 4.0 3.0 4.2 4.1 2.0 1.8 2.2 –5.2 –4.3 –3.9 –3.7Malta 5.4 0.4 4.4 4.9 2.4 2.9 2.0 2.0 –14.8 –6.9 –5.7 –4.4Romania 1.8 5.3 4.5 5.0 45.7 34.5 25.2 17.5 –3.7 –5.9 –5.3 –5.1
1In accordance with standard practice in the World Economic Outlook, movements in consumer prices are indicated as annual averages ratherthan as December/December changes during the year as is the practice in some countries.
2Percent of GDP.

growth is expected to pick up to about 3!/2 per-cent in 2002, aided by low interest rates and ris-ing confidence. There are significant risks in theoutlook, however, in view of developments in theMiddle East, Turkey’s high public indebtedness,its record of persistent high inflation, and theneed for bank and corporate debt restructuring.The projected recovery will therefore need to beunderpinned by continued determined imple-mentation of sound macroeconomic and struc-tural adjustment policies. The IMF-supportedprogram approved in February this year aims tomaintain the reform momentum. On the macro-economic side, this includes maintaining a firmmonetary policy, which has already helped to re-duce monthly inflation significantly, and astrong primary surplus to achieve a marked de-cline in government debt ratios. Restructuringefforts are designed to strengthen the bankingsector, government operations, enterprise re-structuring and privatization, and to encourageprivate sector development.
Commonwealth of IndependentStates (CIS): Continued Resilience
Growth in the CIS countries remained re-markably resilient to the global slowdown in2001, falling only slightly to 6!/4 percent, thehighest growth rate among the major developingcountry regions. This was underpinned by con-tinued solid growth in Russia, driven by strongdomestic demand (Box 1.6, on pp. 46–47); activ-ity also rebounded strongly in the region’s sec-ond largest economy, Ukraine, aided by buoyantgrowth in the agricultural and industrial sectors.Given the strong trade and financial linkages, es-pecially with Russia, this contributed importantlyto the strength of activity in the rest of the re-gion, helped in many cases by improved macro-economic stability and policy implementation, aswell as country-specific factors (including a rap-idly emerging petroleum sector in Kazakhstan,strong revenues from the oil and gas sectors inTurkmenistan, and growth in cotton and alu-minum production in Tajikistan). In general, as-set markets (both stock markets and Eurobond
spreads) performed strongly in the CIS in 2001compared with other regions.
In 2002, regional GDP growth is expected toslow to 4.5 percent (Table 1.9). Within this, GDPgrowth in Russia is expected to slow modestly to4.4 percent, mainly due to lower oil exports andthe lagged effect of the real appreciation of theruble over the past year. Among the more ad-vanced reformers, GDP growth is generally ex-pected to fall back from the exceptional levels of2001, partly as a result of slowing demand inRussia, but still to remain relatively resilient. Incontrast, growth among the less advanced reformersis expected to fall to 2.0 percent, as the impactof the factors that boosted GDP growth inTajikistan in 2001 fades, while the absence ofstructural reforms in Belarus and Uzbekistancontinues to slow their growth.
Macroeconomic policy challenges vary signifi-cantly across the region. In Russia, the strength ofthe balance of payments—reflecting a combina-tion of oil exports, a competitive exchange rate,and declining capital outflows—has continued tocomplicate economic management. During 2001,the expansionary impact of foreign exchangepurchases by the central bank to prevent a nomi-nal appreciation of the ruble was partially offsetby a larger-than-expected fiscal surplus. None-theless, monetary aggregates grew rapidly and in-flation exceeded the authorities’ target. Evenwith the current account surplus expected to de-cline in 2002, the central bank will need to standready to sterilize excess liquidity as necessary toensure the inflation target is achieved. In Ukraineand Kazakhstan, where the balance of paymentshas also been strong, price pressures eased. Fiscaladjustment played a key role in Kazakhstan, whilefor both countries the process of remonetizationcontinued, allowing rapid monetary growth to beabsorbed without an increase in inflation.However, the sharp increase in domestic creditaccompanying this remonetization raises con-cerns with regard to both credit quality and risk,and needs to be carefully monitored.
Elsewhere in the region, inflation has fallensignificantly during 2001, but remains a seriousproblem among a number of the less advanced
COMMONWEALTH OF INDEPENDENT STATES: CONTINUED RESILIENCE
41

reformers—with the exception of Tajikistan,where a tightening of monetary policy led to asharp fall in inflation through 2001—mainly as aresult of excessive credit expansion to financestate-sponsored projects and to subsidize stateenterprises. Beyond this, there are two majormedium-term issues. First, the high level of ex-ternal debt—averaging close to 200 percent ofexports—among five of the poorest CIS coun-tries (Armenia, Georgia, Kyrgyz Republic, Moldova,and Tajikistan) remains a serious concern. Toaddress this, a number of these countries are im-plementing strengthened adjustment programs.Nonetheless, the outlook remains very difficult,particularly if external developments are worsethan anticipated or GDP growth falls short of ex-pectations, and additional external assistancemay also be required. Second, with oil exportingcountries accounting for about 80 percent of re-gional output, the region remains highly de-
pendent in developments in oil prices (Figure1.13). To date, however, diversification has beenlimited—in Russia, for example, investment hasbeen concentrated in the energy and transportsectors—in part reflecting the still difficult envi-ronment for private investment, including insome cases governance problems and the limitedintermediation provided by underdeveloped fi-nancial systems.
The central challenge facing the region con-tinues to be to accelerate progress in structuralreforms—notably, institution building and gover-nance, enterprise and financial sector restructur-ing, and transforming the role of the state—which with some exceptions has been relativelydisappointing in recent years. In Russia, struc-tural reforms have focused on strengthening theinvestment climate through a combination of taxreform, deregulation, strengthening propertyrights, and developing financial markets and in-
CHAPTER I ECONOMIC PROSPECTS AND POLICY ISSUES
42
Table 1.9. Commonwealth of Independent States: Real GDP, Consumer Prices, and Current Account Balance(Annual percent change unless otherwise noted)
Real GDP Consumer Prices1 Current Account Balance2___________________________ ___________________________ ___________________________2000 2001 2002 2003 2000 2001 2002 2003 2000 2001 2002 2003
Commonwealth of Independent States 8.3 6.2 4.5 4.6 25.0 19.8 13.4 10.5 13.3 8.4 4.9 3.3
Russia 9.0 5.0 4.4 4.9 20.8 20.7 14.1 10.8 17.4 11.3 7.2 5.3Excluding Russia 7.0 8.9 4.7 4.1 34.9 18.0 11.9 10.0 2.0 –0.6 –2.4 –3.0
More advanced reformers 6.8 9.5 5.6 4.7 19.7 9.4 6.5 7.1 2.6 –0.8 –2.8 –3.6Armenia 6.0 7.5 6.0 6.0 –0.8 3.4 3.0 3.0 –14.5 –10.5 –9.6 –9.0Azerbaijan 11.1 9.0 8.5 8.5 1.8 1.5 2.4 3.3 –2.4 –2.3 –23.4 –33.3Georgia 1.9 4.5 3.5 4.0 4.0 4.7 4.6 5.0 –5.3 –5.6 –5.5 –5.8Kazakhstan 9.8 13.2 7.0 5.1 13.3 8.3 6.4 5.1 5.0 –5.3 –3.9 –3.0Kyrgyz Republic 5.0 5.0 4.5 4.5 18.7 7.0 6.1 5.5 –7.9 –6.2 –6.3 –6.5Moldova 2.1 4.0 4.8 5.0 31.3 9.8 6.6 6.0 –8.4 –7.4 –8.1 –7.9Ukraine 5.9 9.1 5.0 4.0 28.2 12.0 7.6 9.4 4.7 3.5 1.5 0.9
Less advanced reformers3 5.1 4.6 2.0 2.7 89.4 45.1 27.6 17.8 –0.4 0.2 –1.0 –0.7Belarus 5.8 4.1 1.5 2.3 168.9 61.3 33.9 22.4 –1.8 1.7 –0.4 —Tajikistan 8.3 10.0 6.0 5.0 32.9 38.6 10.5 7.6 –6.5 –7.4 –6.0 –5.2Uzbekistan 3.8 4.5 2.2 3.0 25.0 27.2 22.2 13.5 1.3 –0.6 –1.0 –0.9
MemorandumNet energy exporters4 9.3 6.0 4.7 4.9 19.6 19.2 13.2 10.2 16.1 9.9 5.9 4.1Net energy importers5 5.3 6.9 3.8 3.6 45.2 22.1 14.0 11.7 1.1 1.1 –0.3 –0.5Highly indebted countries6 4.0 5.7 4.6 4.7 13.0 9.4 5.6 5.2 –8.4 –7.3 –7.0 –6.9
1In accordance with standard practice in the World Economic Outlook, movements in consumer prices are indicated as annual averages ratherthan as December/December changes during the year as is the practice in some countries.
2Percent of GDP.3Updated data for Turkmenistan not available.4Includes Azerbaijan, Kazakhstan, Russia, and Turkmenistan.5Includes Armenia, Belarus, Georgia, Kyrgyz Republic, Moldova, Tajikistan, Ukraine, and Uzbekistan.6Armenia, Georgia, Kyrgyz Republic, Moldova, and Tajikistan.

stitutions; and some progress is being made inother countries. In contrast, reforms in a num-ber of countries have remained on hold, in partbecause progress is being blocked by vested in-terests that benefit from a situation of partial re-forms. It is to be hoped that the acceleration ofreforms in Russia will, given its central role inthe region, also spur more rapid progress inother countries in the period ahead.
Africa: Solid Growth Despite a WeakExternal Environment
Despite the weak external environment,growth in Africa held up relatively well in 2001compared with other parts of the world and,while slowing slightly, is still expected to be re-spectable in 2002 (Table 1.10). Although condi-tions and prospects vary widely across individualcountries, the key influence on the outlook formuch of the region continues to be the interac-tion between commodity market developments,the conduct of economic policies, and the extentof armed conflict and other sources of civil ten-sion. Recent increases in oil prices are clearlysupporting the outlook for Africa’s oil producers,but are having a deleterious effect on the manyother commodity exporters in the region, whichinclude many of the poorest countries, despitesome pickup in non-oil commodity prices. Thatsaid, both strong and weak performers can befound within each of these groups, with the qual-ity of domestic policies and the extent of conflicthaving a key impact on whether countries havebeen able to resist the external downturn or not.
Growth among the oil exporting countries, in-cluding Nigeria, generally picked up in 2001 as awhole, supported by the carryover effects ofhigher oil prices in late 2000, and in the case ofAlgeria, an increase in public expenditures anda rebound in agriculture output following a se-vere drought in 2000. The pace of activity slowedamong oil exporters during 2001, reflecting thecombination of the subsequent decline in oilprices, lower OPEC production quotas, and thebroader slowdown in the advanced economies,and is expected to slow further in 2002 despite
AFRICA: SOLID GROWTH DESPITE WEAK EXTERNAL ENVIRONMENT
43
1997 98 99 2000 01 02 03-12
-8
-4
0
4
8
5
10
15
20
25
30
1997 98 99 2000 01 02 03-12
-8
-4
0
4
8
12
16
20
0
2
4
6
8
10
12
14
16
Other Net Energy Exporters
Azerbaijan, Kazakhstan, and Turkmenistan.
Figure 1.13. Commonwealth of Independent States: Managing Oil Price Volatility(Percent of GDP)
Oil earnings have been correlated with current account balances and fiscal balances.
1
Russia
1
Value of oil exports (right scale)
Current account balance (left scale)
Central government balance (left scale)

recent rises in oil prices. This weakness is likelyto be particularly severe in Nigeria, aggravatedby fiscal policy and other domestic uncertainties(see below).
Despite signs of recovery in global output,many countries in Africa continue to face lowprices for their non-oil commodities—includingthe very weak prices of coffee (a key export ofKenya, Ethiopia, and Uganda) and cotton (ex-ported by Benin, Burkina Faso, Cameroon, Chad,Côte d’Ivoire, and Mali), and cyclical falls in mostmetals prices (affecting South Africa, Ghana,Zambia, and others). Relatively favorable growingconditions—especially the absence of the severefloods or drought that affected some countriesin the late-1990s and 2000—are helping to sup-port agricultural output across much of the re-gion, although drought conditions continue insome parts of southern Africa, and severe foodshortages are occurring in some areas. Countrieswith sizable tourism sectors—including Morocco,Tunisia, and Kenya—were hit by the sharp dropin travel and tourism following September 11, al-though this downturn does not appear to havebeen as sharp or prolonged as earlier feared.
Overall, the oil importing countries of Africa areexpected to grow about 3!/2 percent on averagein 2002, as in 2001. Most non-oil commodityprices are expected to pick up as global activitystrengthens, supporting a further strengtheningin growth among these countries in the periodahead.
Sound economic policies have also enabled asizable number of African economies—includingBotswana, Cameroon, Senegal, Tanzania, andUganda—to offset the effects of export priceweaknesses and the global slowdown, and in-stead to reach and sustain strong rates of growthover recent years (Figure 1.14). Progress is mostapparent in the macroeconomic sphere, with atight fiscal stance being maintained in manycountries and inflation generally coming down(although remaining high in Ghana andNigeria). However, uneven policy implementa-tion has constrained growth in some countries(Kenya, Malawi, and Seychelles), while continuedinappropriate economic policies and politicalturmoil have led to a marked contraction in eco-nomic activity and a surge in inflation inZimbabwe. Structural reforms still lag behind in
CHAPTER I ECONOMIC PROSPECTS AND POLICY ISSUES
44
Table 1.10. Selected African Countries: Real GDP, Consumer Prices, and Current Account Balance (Annual percent change unless otherwise noted)
Real GDP Consumer Prices1 Current Account Balance2______________________________ _____________________________ ______________________________2000 2001 2002 2003 2000 2001 2002 2003 2000 2001 2002 2003
Africa 3.0 3.7 3.4 4.2 14.2 12.6 9.3 6.1 0.7 –0.5 –2.6 –2.3
Maghreb 2.8 4.7 3.1 4.2 1.3 2.5 3.8 3.3 7.1 5.8 1.8 1.8Algeria 2.4 3.5 2.3 3.4 0.3 4.1 5.6 4.4 16.8 11.3 4.9 4.6Morocco 2.4 6.3 4.0 4.1 1.9 0.5 1.4 1.8 –1.7 3.0 0.7 1.0Tunisia 4.7 5.0 3.8 6.4 3.0 1.9 3.4 3.0 –4.2 –4.2 –4.6 –3.8
Sub-Sahara3 3.0 3.9 4.0 4.8 24.7 20.6 12.4 7.7 –2.0 –3.8 –6.4 –5.6Cameroon 4.2 5.3 4.6 4.9 0.8 2.8 2.9 2.5 –1.7 –2.3 –5.0 –5.0Côte d’Ivoire –2.3 –0.9 3.0 4.5 2.5 4.4 3.6 3.4 –2.8 –2.4 –1.7 –1.1Ghana 3.7 4.0 4.5 5.0 25.2 33.0 15.9 10.2 –8.4 –4.0 –6.4 –5.1Kenya –0.2 1.1 1.4 2.4 6.2 0.8 3.2 3.9 –2.1 –2.5 –3.7 –4.3Nigeria 3.8 4.0 –1.1 3.4 6.9 18.9 14.7 11.2 4.9 –0.2 –10.9 –5.5Tanzania 5.1 5.1 5.5 6.0 6.2 5.2 4.4 3.9 –1.6 –1.6 –3.5 –3.4Uganda 4.0 4.9 5.8 6.3 6.3 4.6 0.2 5.5 –9.0 –8.4 –9.1 –8.8
South Africa 3.4 2.2 2.3 3.0 5.4 5.7 8.1 5.2 –0.3 –0.5 1.1 0.7
MemorandumOil importers 3.0 3.6 3.6 4.4 13.6 11.0 7.8 5.4 –2.8 –2.5 –3.3 –3.2Oil exporters 3.1 4.1 2.7 3.5 16.3 18.0 14.6 8.3 10.6 5.0 –0.9 0.2
1In accordance with standard practice in the World Economic Outlook, movements in consumer prices are indicated as annual averages ratherthan as December/December changes during the year, as is the practice in some countries.
2Percent of GDP.3Excludes South Africa.

much of the region, and prospects for economicgrowth and diversification would be improved bybetter governance and public service delivery, in-cluding education, poverty alleviation, improv-ing the security of property rights, and reducingcorruption. Adding to these difficulties are poorinfrastructure and insufficient liberalization.Conflict management also remains important,especially in sub-Saharan Africa; it is encourag-ing to note, however, that the number of coun-tries involved in armed conflict has recently di-minished, and this appears to be contributing tothe sharp improvement in growth forecast forthe group of countries affected by conflict overrecent years.
Policies and initiatives at a multilateral levelcan also help to provide the basis for strongergrowth in Africa. An important recent develop-ment within the region is the New Partnershipfor Africa’s Development, which emphasizesAfrican ownership, leadership, and accountabil-ity in improving the foundations for growth anderadicating poverty. In addition, 20 of the poor-est countries have now become eligible for debtrelief under the enhanced Initiative for HeavilyIndebted Poor Countries (HIPC) and a numberof others are expected to qualify in 2002. Withthis step, the countries concerned have beenable to free up budgetary funds for public ex-penditure and investment—focused particularlyon education, health, and other forms of humancapital development—in accordance with com-mitments undertaken in their poverty reductionstrategies. Further trade liberalization by the ad-vanced economies—particularly opening theirmarkets to agricultural goods and reducing theirown production subsidies in this sector—wouldprovide a major boost to the region’s export per-formance and hence to prospects for sustainedgrowth and poverty reduction. Ongoing interna-tional support is also needed to fight HIV/AIDS,which is taking a staggering toll on young andworking age people in many southern Africancountries. Priorities include building up themedical infrastructure, better education, andmaking available advanced drug therapies tocombat the pandemic.
AFRICA: SOLID GROWTH DESPITE WEAK EXTERNAL ENVIRONMENT
45
Excluding South Africa. Countries with generally strong macroeconomics and structural policies; comprises Benin, Botswana, Burkina Faso, Cameroon, Mali, Mauritius, Mozambique, Tanzania, Senegal, and Uganda (24 percent of sub-Saharan African GDP). Countries experiencing war or significant civil disturbances during 1998–2000; comprises Angola, Burundi, Comoros, Congo, Dem Republic of, Congo, Republic of, Côte d'Ivoire, Ethiopia, Guinea-Bissau, Lesotho, and Sierra Leone (18 percent of sub-Saharan African GDP). Countries experiencing adverse commodity price shocks exceeding 10 percent in 2000 compared with the 1995–97 average; comprises Benin, Burundi, Burkina Faso, Central African Republic, Chad, Côte d'Ivoire, Ethiopia, Ghana, Madagascar, Mali, Mauritius, Rwanda, São Tomé and Príncipe, Tanzania, Togo, Zambia, and Uganda (31 percent of sub-Saharan African GDP).
Figure 1.14. Sub-Saharan Africa: Solid Growth in 2002and 2003(Per capita real GDP growth, percent)
-2
-1
0
1
2
3
4
5
6
-2
-1
0
1
2
3
4
5
6
-4
-3
-2
-1
0
1
2
3
4
-2
-1
0
1
2
3
4
5
6
After a strong pickup in 1995–96, per capita GDP growth has slowed markedly, mainly due to war and civil disturbances and commodity shocks. However, growth in countries with strong policies has been better sustained.
Sub-Saharan Africa
Countries Affected by Waror Civil Disturbances
Countries Affected by Commodity Price Shocks
Strong Performers
1
12
2
3
3
4
4
1982–94 96 98 2000 02 1982–94 96 98 2000 02
1982–94 96 98 2000 02 1982–94 96 98 2000 02

CHAPTER I ECONOMIC PROSPECTS AND POLICY ISSUES
46
Russia’s economic performance since the 1998crisis has far surpassed most observers’ expecta-tions. Growth rates have averaged 6 percent a yearover the last three years, after almost a decade ofoutput declines, while inflation has been graduallyreduced to about 20 percent. Large precrisis fiscaldeficits have turned into overall surpluses exceed-ing 2 percent of GDP; current account deficits havegiven way to surpluses exceeding 11 percent ofGDP; and international reserves have risen torecord levels (see the figure). Similarly, the authori-ties have not only formulated a wide-ranging struc-tural reform program but, in marked contrast withearlier experience, have already secured approvalof some of the crucial underlying legislation.Reflecting this, the Russian stock market hassoared, yields spreads on sovereign debt have nar-rowed, and nonsovereign borrowers are regainingaccess to international capital markets, even asother emerging markets have faced sharp losses ofconfidence.
The sharp turnaround in Russia’s macro-economic performance stems from a combinationof a large real depreciation, a major terms-of-tradeimprovement, and significant fiscal retrenchment.After the crisis, the real effective exchange rate depreci-ated by 40 percent, dramatically improving competi-tiveness, and it still stands about 15 percent belowits precrisis level. In addition, Russia’s terms of tradeimproved by about 45 percent between 1998 and2000, as world prices for oil and gas, two key ex-ports, strengthened considerably. This positiveterms-of-trade shock (equivalent in magnitude toabout 13 percent of Russia’s GDP), combined withthe real depreciation, led to a significant increase inindustrial profitability and investment, and eventu-ally to higher economy-wide real wages and con-sumption. The energy price increase directly ac-counted for more than half of the turnaround onthe current account; it also strengthened fiscal bal-ances, largely because of increased crude-oil exporttariffs and gas excises.
Fiscal policy in general displayed considerableprudence after the crisis. Federal revenues rose as
major efforts were launched to raise tax compli-ance, reduce tax arrears, increase the share oftaxes paid in cash, and reverse the steady erosionof revenues in favor of the regions. Meanwhile, theauthorities restrained noninterest expenditures, sothat the federal government’s primary balancestrengthened by nearly 8 percent of GDP between1997 and 2000. This fiscal effort both helped sup-port a sustained reduction in inflation and con-tained the pressures for real appreciation and“Dutch disease,” which would otherwise havearisen in the face of massive current accountsurpluses.
So far, Russia has weathered the slowdown in theworld economy, reflecting the large share in its ex-ports of oil and gas. However, some weakening ofgrowth is expected in 2002. Further, the continueduncertainty about future developments in the ex-ternal environment poses significant risks for theeconomic outlook. Staff estimates indicate thateach $1 decline in Russian oil prices would lowerGDP growth by 0.5 percentage points, export rev-
Box 1.6. Russia’s Rebound
Output Dynamics and International Reserves
80
90
100
110
120
130
0
5
10
15
20
25
30
35
40
1996 97 98 99 2000 01
Industrial output(1997 = 100; left scale)
GDP(1997 = 100;
left scale)
Reserves(billions of US$;
right scale)
Sources: Goskomstat; and the Central Bank of the Russian Federation. Seasonally adjusted.
1
1
1
The main author is Nikola Spatafora.

AFRICA: SOLID GROWTH DESPITE WEAK EXTERNAL ENVIRONMENT
47
enues by 0.6 percent of GDP, and governmentrevenues by 0.4 percent of GDP. A significantworsening of the external environment and aneconomic slowdown could also undermine re-cently achieved gains in strengthening financialdiscipline, including the improved tax complianceand the reduced reliance on barter and non cashtransactions.
At a more fundamental level, prospects for sus-tained growth depend critically on success in pass-ing and, above all, implementing structural re-forms. In the past two years, impressive progresshas been made on a broad front. In particular, theinvestment climate has improved through a combi-nation of tax reform, deregulation, strengtheningproperty rights, and developing financial marketsand institutions. Tax reforms simplified the tax sys-tem, broadened the tax base, and reduced the taxburden. Key elements included simplifyingmineral-resource taxation, reducing turnover andpayroll taxes, introducing a flat personal incometax with a marginally reduced effective rate, andlowering the statutory profit-tax rate while elimi-nating most exemptions. These reforms will signifi-cantly reduce distortions and—with continuedimprovements in tax compliance—ensure fiscalsustainability. Deregulation and strengthening propertyrights involved a significant reduction in the num-ber of business activities requiring a license; a newLand Code, which allows ownership of urban landand significantly reduces the uncertainty associ-ated with fixed investment; and a new Labor Code,which liberalizes hiring and firing procedures.New reform strategies for railways and the electric-ity sector aim to restructure, liberalize, and priva-tize potentially competitive segments. Someprogress was also made with financial sector reform:the legal framework for banking supervision andrestructuring was strengthened, a pilot scheme foradopting international accounting standards wasinitiated, and new anti-money-laundering legisla-tion was enacted.
Nevertheless, after over a decade, much remainsto be done to complete the transition process. Forthe immediate future, the authorities’ agenda facesthree challenges. First, continuing the financial sec-tor reforms, and in particular strengthening finan-
cial regulation and supervision, as well as stimulat-ing competition within the banking sector, includ-ing by clarifying the future role of the currentlydominant state banks. Second, completing the ne-gotiations on WTO accession. This will requireagreement on tariff rates, passage of a new customscode, and measures aimed at broader businessderegulation. Third, completing and implementingother reforms, including allowing trade in agricul-tural land; restructuring the gas sector; strengthen-ing bankruptcy procedures to eliminate the currentscope for asset-stripping; simplifying small-businesstaxation; increasing cost-recovery in public hous-ing; and overhauling pensions and the judiciary.
Looking beyond Russia, its strong performancehas supported economic recovery throughout theCIS, where growth averaged over 8 percent in 2000and 6 percent in 2001. Russia’s influence reflectsboth the relatively large size of its economy, ac-counting for about three-fourths of the region’sGDP, and the generally close trade linkages withinthe region: the CIS forms a free-trade area, and typ-ical export-to-GDP ratios are about 40–50 percent.Overall, Russia is the main export market for al-most all CIS countries, absorbing on average over25 percent of their total exports. Cross-border fi-nancial linkages with Russia are also significant; inthe past, they mainly took the form of energytrade–related credits, but in recent years FDI flowshave increased, as investment climates have im-proved. Looking ahead, staff estimates suggest thata slowdown in Russian growth of 2 percentagepoints would reduce average growth in other CIScountries by 0.5 percentage point. The largest im-pact would be in those countries with the closesttrade links with Russia: growth in Belarus andMoldova could slow by 1 percentage point, with aneven larger decline in Turkmenistan.
In sum, the rebound in Russia has been truly im-pressive. Prudent policies, aided by a large and pos-itive terms-of-trade shock, have produced strongimprovements in key macroeconomic indicators.The acceleration in structural reform and the com-mitment to strengthening the investment climateraise hopes that the rebound can be sustained andthat Russia will continue to be an engine of growthfor the region.

Looking at the region’s largest economies,South Africa—which constitutes just under 40percent of sub-Saharan African GDP—has expe-rienced some slowing in growth as a result oflower commodity prices and the global slow-down. However, these influences are expected toturn around and contribute to a steady pickuplater this year and in 2003. The rand continuedto weaken in 2001, sharply so in the final quar-ter, but appears to have stabilized in early2002—supported by an appropriate increase ininterest rates by the central bank. The reasonsfor the sharp depreciation are not entirely un-derstood, but seem to follow a pattern of similarexchange rate weakness in other countries, suchas Australia, Canada, and New Zealand, wherecommodities comprise an important share of ex-ports. In part, though, it may reflect growing re-gional uncertainties, including the turmoil inZimbabwe, and delays in the implementation ofthe privatization program. Looking ahead, confi-dence in the currency should be supported bythe expected closing in 2002 of the central bank’snet open forward position, and by the mainte-nance of firm monetary policies to keep infla-tion under control and build credibility in theinflation-targeting regime. Also important—forthe currency and for prospects more generally—will be ongoing fiscal restraint, progress with pri-vatization, and structural reforms to improve thebusiness climate, boost investment, and hencemake inroads on extremely high levels of unem-ployment and poverty.
In Algeria, growth is expected to slip to under2!/2 percent in 2002, owing partly to cuts in oiloutput. Activity continues to be sustained by anexpansionary fiscal stance. Despite considerableeconomic and policy progress since the early1990s, the Algerian economy still suffers fromgrowth well below potential, high unemploy-ment, and vulnerability to developments in en-ergy markets.
The situation in Nigeria remains a source ofconcern despite recent increases in oil prices, asOPEC production cuts are taking their toll fol-lowing a period of above-quota production.Fiscal policy has been too expansionary, particu-
larly in the context of oil market volatility; butmonetary conditions have tightened consider-ably, with the central bank trying to offset the ef-fects of fiscal expansion and to slow inflation. Inaddition, some parts of the banking sector ap-pear to be in distress, and the system as a wholefaces poor governance and supervision; and dis-tortion in the foreign exchange market betweenofficial, interbank, and parallel market rates hasincreased. Domestic confidence has been fur-ther disrupted by recent disasters and incidentsof conflict.
Middle East: Oil Price Volatility andRegional Security
Growth in the Middle East is projected to slowsignificantly in 2002, continuing the pattern of2001, largely reflecting lower oil production andthe regional security situation. For the develop-ing countries in the region, growth is expectedto slow in 2002, while in Israel, after a fall in ac-tivity in 2001 partly reflecting weakness in the ITsector, growth is expected to resume (Table1.11). The curtailment of oil production associ-ated with OPEC agreements to limit global sup-ply has depressed activity in the oil exportingcountries although recent increases in oil prices,if sustained, will help support growth. The secu-rity situation has also had a significant negativeimpact on activity, including tourism, in particu-lar in the Mashreq countries and Israel.
For the oil exporting countries, growth is ex-pected to slow from 5.0 percent in 2001 to 3.4percent in 2002, largely reflecting lower oil pro-duction and the lagged impact of lower oilprices in late 2001. The slowdown in growth hasgenerally been limited by the use of more pru-dent macroeconomic policies. In particular, theboom and bust cycle of the past associated withsharp increases and decreases in governmentspending as oil revenues rose and fell has beenmuch more muted. As a result, current accountand fiscal balances have broadly followed oilprice developments (Figure 1.15). This patternis particularly evident in the smaller Gulf states(Kuwait, United Arab Emirates, Bahrain, Oman, and
CHAPTER I ECONOMIC PROSPECTS AND POLICY ISSUES
48

Qatar). In Saudi Arabia, however, the slowdownin activity has been more pronounced, andgrowth is expected to be negative in 2002, partlyreflecting the more difficult fiscal situation. Inorder to reduce inflation and avoid a sustainedappreciation of their real exchange rates, oil ex-porting countries should maintain prudentmacroeconomic policies.
The main policy priority, however, remains theneed to diversify production into other sectorsthan energy, to make these economies less de-pendent on oil revenues. The benefits of past re-forms can be seen in the increased availability ofimported capital and intermediate goods inmany countries. If these economies are to re-main attractive to both foreign and domestic in-vestors, however, a broadening and deepening ofstructural reform is required, including in theareas of trade and exchange rate reforms, priceliberalization, financial sector deregulation, pub-lic enterprise restructuring and privatization,and labor market and social safety net reforms.Recently, progress in some of these areas hasbeen made by the Islamic Republic of Iran, whereexpanding non-oil private sector activity is ex-pected to provide significant support to activity,as a result of which growth in 2002 is projectedat 5.3 percent, slightly higher than in 2001. The
Gulf Cooperation Council (GCC) countries,which already have liberal trade, exchange rate,price systems, and free movement of capital,have also taken some steps to promote privatesector activity, resulting in a more gradual ex-pansion in non-oil activity.
In the Mashreq, Egypt was adversely affectedby the events of September 11, especiallythrough lower tourism earnings. While there areindications that tourism is beginning to recover,the balance of payments is expected to show asizable overall deficit in 2002. Growth is pro-jected to slow to under 2 percent this year, downfrom 3.3 percent in 2001, before recovering in2003. The depreciation of the Egyptian poundover the past 18 months will help strengthenEgypt’s balance of payments performance, andcontinuing flexibility will also be important inthe period ahead. On fiscal policy, the deficit haswidened, partly reflecting the operation of auto-matic stabilizers, and a reduction in the deficitwill be important as activity recovers. Steps toreinvigorate structural reform will be required toachieve the sustained strong employment growthneeded to absorb Egypt’s rapidly rising laborforce and reduce unemployment. The situationin Lebanon remains extremely difficult, with alarge fiscal deficit and government debt of over
MIDDLE EAST: OIL PRICE VOLATILITY AND REGIONAL SECURITY
49
Table 1.11. Selected Middle Eastern Countries: Real GDP, Consumer Prices, and Current Account Balance(Annual percent change unless otherwise noted)
Real GDP Consumer Prices1 Current Account Balance2_____________________________ ____________________________ ____________________________2000 2001 2002 2003 2000 2001 2002 2003 2000 2001 2002 2003
Middle East3 5.3 4.5 3.1 4.4 9.8 8.0 9.5 8.3 12.1 6.9 2.5 –0.2
Oil exporters4 5.7 5.0 3.4 4.7 12.6 10.0 11.5 9.8 16.5 9.6 4.4 0.8Saudi Arabia 4.5 2.2 –0.5 3.2 –0.6 –1.4 — 1.1 9.0 4.9 –1.3 –6.5Iran, Islamic Rep. of 4.9 5.1 5.3 5.1 12.6 11.7 15.0 12.0 12.5 5.4 4.6 1.7Kuwait 1.7 2.7 –1.8 3.3 1.7 2.5 2.5 2.5 39.3 32.2 20.9 20.2
Mashreq5 4.2 3.2 2.4 3.6 1.9 1.9 3.2 3.9 –2.2 –2.3 –3.8 –3.6Egypt 5.1 3.3 1.7 3.5 2.8 2.4 3.2 4.4 –1.2 — –2.3 –1.5Jordan 4.0 4.2 5.1 6.0 0.7 1.8 3.5 2.4 0.7 0.4 –0.3 –0.4
MemorandumIsrael 6.4 –0.6 1.3 3.8 1.1 1.1 3.1 2.1 –1.2 –1.5 –1.7 –2.1
1In accordance with standard practice in the World Economic Outlook, movements in consumer prices are indicated as annual averages ratherthan as December/December changes during the year, as is the practice in some countries.
2Percent of GDP.3Includes Bahrain, Egypt, Islamic Rep. of Iran, Iraq, Jordan, Kuwait, Lebanon, Libya, Oman, Qatar, Saudi Arabia, Syrian Arab Republic, United
Arab Emirates, and Republic of Yemen.4Includes Bahrain, Islamic Rep. of Iran, Iraq, Kuwait, Libya, Oman, Qatar, Saudi Arabia, and United Arab Emirates.5Includes Egypt, Jordan, Lebanon, and Syrian Arab Republic.

170 percent of GDP. The fiscal situation and thedebt dynamics have led to a loss of internationalreserves of the central bank in the context of afixed exchange rate regime, and a comprehen-sive policy package will be needed to achieve asustainable macroeconomic framework. Owingto limited regional links, developments inLebanon would be unlikely to significantly affectneighboring countries. In Jordan, growth in 2002is projected to be 5.1 percent, boosted by strongperformance in exports and additional fiscalstimulus under the authorities’ Plan for Socialand Economic Transformation. The governmentcontinues to build on its structural reformprogram.
After a fall in activity in 2001, largely reflect-ing weakness in exports as demand for IT goodsdecelerated rapidly and growth in the UnitedStates slowed, growth in Israel is expected topick up modestly to 1.3 percent in 2002 as theseeffects reverse. This will depend, however, on anearly and substantial improvement in the ex-tremely difficult regional security situation, inthe absence of which the growth rate will beconsiderably lower. The design and execution offiscal policy have improved in recent years, butfurther progress with fiscal reform is needed asratios of general government expenditures andof public debt to GDP remain high relative tothose of many other advanced economies. TheBank of Israel’s decision to raise interest ratesby 0.6 percentage points in late February, partlyreversing the 2 percentage point cut inDecember 2001, was aimed at confirming theBank’s commitment to medium-term price sta-bility, against the background of potential infla-tion pressures stemming from the significant de-preciation of the sheqel since the Decembereasing. In the West Bank and Gaza, the securitysituation—in particular the border closure withIsrael and internal blockades—has severely af-fected economic activity, which is estimated tohave declined by over 30 percent in 2001.Economic conditions have worsened markedlyin 2002 with the escalation of hostilities, whichhave inflicted widespread damage on physicalinfrastructure.
CHAPTER I ECONOMIC PROSPECTS AND POLICY ISSUES
50
1997 98 99 2000 01 02 03-4
0
4
8
12
16
20
24
28
20
24
28
32
36
40
44
48
52
1997 98 99 2000 01 02 03-12
-8
-4
0
4
8
12
12
16
20
24
28
32
36
40
Gulf States
Iran, Islamic Republic of, Libya, and Saudi Arabia. Bahrain, Kuwait, Oman, Qatar, and United Arab Emirates.
Figure 1.15. Middle East: Responding to Oil Price Volatility(Percent of GDP)
In most countries, the recent windfall increases in oil prices have been prudently used, and the projected decline in 2002–03 will be manageable.
1
Large Oil Producers 1
2
2
Value of oil exports (right scale)
Current account balance (left scale)
Central government balance (left scale)

Appendix 1.1. Commodity Markets11
Recent Developments
Following the surge to $32 a barrel in the thirdquarter of 2000, crude oil prices weakened in re-action to the slowing world economy (Figure1.16).12 Despite a short-lived spike immediatelyfollowing the September 11 terrorist attacks,prices tumbled to less than $19 a barrel by end-2001. In conjunction with lower crude prices, re-fining margins were compressed by weak productdemand and mounting inventories. Heating oilconsumption fell in response to unseasonablywarm weather in North America, while jet fueldemand slumped amid cutbacks in travel activity.
The softening in world oil markets during2001 occurred despite efforts by OPEC to main-tain prices within the target range of $22–28.Production cuts of 3!/2 million barrels a day (4!/2
percent of global supply) were insufficient to off-set falling demand, and prices fell well below thelower edge of the range. In December 2001, af-ter negotiating commitments to cuts of close tohalf a million barrels a day with major non-OPEC producers, OPEC announced further cutsof 1!/2 million barrels a day to start in the begin-ning of 2002 for a period of six months. Againstthe background of these cuts, and with signs ofunexpected strength in U.S. activity, oil marketconditions firmed in early 2002 to close to $23 abarrel. These factors were reinforced in Marchand early April by fears of disruptions in supplydue to possible military intervention in theMiddle East and the deteriorating security situa-tion in Israel and the West Bank and Gaza. As aresult of these concerns, oil prices spiked up byearly April to about $27 a barrel before fallingsubsequently as fears of significant disruptions ofsupply eroded. That said, the situation remainshighly volatile, with oil prices depending asmuch on political as economic developments. Tohelp assess future developments, Table 1.12 pro-
APPENDIX 1.1. COMMODITY MARKETS
51
0
5
10
15
20
25
30
0
10
20
30
40
Figure 1.16. OPEC Target and Actual Production of Oil(Millions of barrels per day unless otherwise indicated)
OPEC production(left scale)
OPEC target(left scale)
Iraq production(left scale)
Oil price(right scale;
U.S. dollars per barrel)
1
1997 98 99 2000 01 Mar. 2002
Source: Bloomberg Financial Markets, LP. Circles denote increases in OPEC target production and squares denote decreases in OPEC target production. In 2001, Iran announced it would move its April cuts to May.
1
OPEC lower price band(right scale)
OPEC upper price band (right scale)
11The main author is Guy Meredith.12References to oil prices relate to the IMF’s un-
weighted average of West Texas Intermediate (WTI), U.K.Brent, and Dubai crude oil prices.

vides some indicators of the impact of changesin oil prices on output and trade balances.
As regards demand, International EnergyAgency projections show global oil demandgrowing by about 420,000 barrels a day in 2002,up about !/2 percent over 2001. This would besimilar to expectations of increased productionby non-OPEC producers, including those notcovered by production agreements. Hence, ifOPEC’s production cuts are maintained, but nofurther disruptions occur, this would result in arelatively stable balance between supply and de-mand in markets. The WEO baseline reflectssuch a scenario, with a weighted-average priceof $23 a barrel in 2002 and $22 in 2003. As dis-cussed above, the recent spike in oil prices ap-pears to reflect market concerns over possibleadditional reductions in supply.
In undertaking production cuts, OPEC facesthe issue of its declining share in global oil sup-ply (Figure 1.17).13 OPEC has traditionally pro-duced almost 40 percent of world oil, and holdsmore than 77 percent of proven reserves. Itsmembers include 11 of the top 20 world oil pro-ducers; OPEC also holds most of the world’s ex-cess capacity, as non-OPEC producers tend toproduce close to their maximum output. Thisposition has allowed OPEC to have a significanteffect on the market at times when there are nomajor imbalances. Its share of the world marketdeclined to about 36 percent in late 2001, how-ever, following last year’s production cuts, andcould drop further to close to 35 percent thisyear if recent cuts are maintained. This declinecould raise concerns in OPEC about a seculardecline in their ability to influence the market,and an erosion of revenue in favor of alternativeproducers. The equilibrium in oil markets isthus likely to remain rather fragile as OPEC navi-gates the trade-off between losing market shareand supporting prices.
Conditions in nonenergy commodity marketshave remained basically unchanged in early
2002, with global recovery prospects arrestingthe downward trend in prices through 2001. Thestaff’s nonfuel price index rose by 2.9 percent inFebruary over January, but remained 3.2 percentbelow the level a year ago. Metals prices, espe-cially for copper and aluminum, have shown theclearest signs of recovery from recent lows, asthey are perceived to be relatively sensitive tocyclical conditions. Gold prices also picked upearly in the year, in response to falling equityprices and aggressive Japanese buying. But thefundamentals in metals markets have notchanged significantly, and increasing stocksshould dampen near-term price increases.
Market conditions for agriculture commodi-ties have been mixed, as brighter global recoveryprospects have been offset by rising supply.Wheat and sugar prices have been relativelyweak in expectation of increasing exports fromArgentina and Brazil, respectively. Cotton prices,in contrast, have shown some signs of strength-ening from depressed levels; the outlook isclouded, however, by the risk that agriculturalpolicies in industrial countries could further ex-acerbate problems of global oversupply.
The global market for semiconductors col-lapsed in 2001, with a decline in the value of
CHAPTER I ECONOMIC PROSPECTS AND POLICY ISSUES
52
Table 1.12. Impact of a $5 a Barrel, PermanentIncrease in Oil Prices After One Year(Percentage points of GDP)
Real GDP Trade Balance
World GDP –0.3 —
Industrial countries –0.3 –0.2United States –0.4 –0.1Euro area –0.4 –0.1Japan –0.2 –0.2Other –0.2 0.2
Developing countries –0.2 0.2Of which:
Latin America –0.1 —Asia –0.4 –0.5Emerging Europe and Africa 0.1 0.2
Source: IMF staff estimates based on IMF (2000).
13OPEC’s members are Algeria, Indonesia, Iran, Iraq, Kuwait, Libya, Nigeria, Qatar, Saudi Arabia, United Arab Emirates,and Venezuela. Although it remains a member of OPEC, Iraq is outside the quota system, with exports instead being cur-rently governed by the U.N. food-for-oil agreement.

sales of about 30 percent, and in unit shipmentsof 20 percent. An important factor was a declinein global sales of personal computers—the firstsince 1986. The volatile market for memorychips was hit particularly hard, as prices plungedamid oversupply and rising inventories. Somesigns of a turnaround in the market were evi-dent toward the end of the year, however, asboth prices and volumes firmed in response to arecovery in final demand for electronics prod-ucts, and the closure of some production facili-ties as prices fell below production costs.
Assuming a general recovery in global activity,the semiconductor market is expected to regainmomentum in 2002. In particular, the market formemory chips is showing signs of rebounding,helped by innovations such as double-data rate(DDR) technology and the erosion of invento-ries. The last major replacement purchases forcomputers took place in 1999 in anticipation ofY2K. With historical replacement cycles being inthe range of 3–4 years, there will likely be signifi-cant demand for renewal of this equipment, al-though firms appear less willing to embrace newtechnology, as the operational boundaries of cur-rent hardware and software are not being pushed
Industrial reorganization is also affecting sup-ply. Some traditional producers have sufferedlarge losses during the recent slump, resulting infacilities’ closures. There have also been mergertalks among the largest producers of memorychips that would concentrate control of supplyin the hands of fewer decision makers. Finally,China is becoming an increasingly important lo-cation for production.
Cyclical Movements in Nonfuel Commodity Prices
Commodity price movements appear to haveclosely tracked changes in the outlook for growthin major industrial countries recently. It is inter-esting to compare this correspondence with thetypical historical relationship between commod-ity prices and activity. Looking ahead, most fore-casters anticipate a pickup in global activitythrough 2002 and 2003: should this be expectedto reverse the recent weakness in commodity
APPENDIX 1.1. COMMODITY MARKETS
53
1992 93 94 95 96 97 98 99 2000 01 0234
35
36
37
38
39
40
Figure 1.17. Share of World Oil Production of OPEC(Percent)
Sources: International Energy Agency; and IMF staff estimates. OPEC is defined here as not including Iraq, whose production amounts are affected by the Oil-for-Food program, and includes Natural Gas Liquids, which for our purposes are considered oil products.
1
1

prices, or do current prices already reflect expec-tations of a future recovery in activity?
Conceptually, the relationship between com-modity prices and activity in industrial countrieswill reflect both supply and demand factors. Onthe supply side, shocks in commodity marketsthat raise prices are likely to reduce output inimporting countries; as industrial countries are,in aggregate, net importers of commodities, thiswould imply a negative correlation betweenprices and activity. On the demand side, higheractivity in industrial countries will tend to raiseworld commodity consumption and thus prices.
Figure 1.18 shows the historical movements innonfuel commodity prices and real GDP in G-7countries from 1970 to 2001. A strong pattern ofpositive comovements between prices and activ-ity is apparent, suggesting that demand shockshave dominated during the historical period; forthe period as a whole, the correlation coefficientbetween the two series is 0.49. Commodity priceshave been considerably more volatile than out-put, though, with typical annual movementsabout six times as large.
Against this background, the sharp declines innonfuel commodity prices since the mid-1990sare somewhat anomalous, in that they have beenassociated with relative stability in G-7 GDPgrowth. Instead, they appear to have reflected, atleast in part, the impact of the Asian financial cri-sis and external financing constraints on emerg-ing market countries more generally, which putdownward pressure on exchange rates of somecommodity exporters and reduced demand out-side of the industrial countries. Other supply fac-tors, including improved technology and agricul-tural support policies in some developedeconomies, have also played a role. The furtherdrop in prices in 2001 was, more typically, associ-ated with the sharp slowdown in G-7 activity.
Looking ahead, an important question iswhether the projected upturn in global activityin the period ahead will generate a rebound innonfuel commodity prices. Taken at face value,the historical correlation suggests that it should,but the issue is potentially more complicated. Inparticular, one must address the question of
CHAPTER I ECONOMIC PROSPECTS AND POLICY ISSUES
54
1970 75 80 85 90 95 2000-30
-20
-10
0
10
20
30
40
50
60
-4
-2
0
2
4
6
8
Figure 1.18. Movements in Nonfuel Commodity Prices andG-7 Real GDP(Annual log change multiplied by 100)
Sources: OECD; and IMF staff estimates. Adjusted by subtracting the mean of the log change from 1970 to 2001.
Nonfuel commodity prices(left scale)
G-7 real GDP(right scale)
1
1

whether current commodity prices already re-flect expectations of global recovery. If they do,prices may not respond to the actual upturnwhen it occurs; if they do not, a rebound is moreplausible. The answer depends on two factors—the relationship between spot and futures pricesin commodity markets; and the extent to whichfutures prices already reflect recovery prospects.If futures prices are “efficient” in reflecting fu-ture growth prospects, and arbitrage is feasiblebetween spot and futures markets, then currentprices should embody future growth prospects.If these conditions fail, however, commodityprices could still pick up, even though the recov-ery in activity is generally expected.
The scope for arbitrage between spot and fu-tures markets can be assessed by comparing pricesin the two markets at a point in time. In general,in competitive markets, the futures price shouldexceed the spot price only by the financial andphysical costs of storing commodities—otherwise,risk-free profits could be made by buying com-modities in the spot market for future delivery.The financial storage cost is represented by thenominal interest rate, while the physical cost willvary from commodity to commodity. Figure 1.19shows the relationship as of early February be-tween the spot and futures prices for several non-fuel commodities. Gold is included as a referenceprice, because the low storage costs of gold andcompetitive markets make for efficient arbitrage.The pattern is mixed. For cotton and coffee, fu-tures prices are well above spot prices, suggestingthat storage opportunities are limited. The futurespremium for wheat and copper, in contrast, isonly moderately higher than that for gold. Finally,for sugar, the futures price is well below the spotprice. This varied pattern among commoditiesraises questions about the general tightness of thelink between spot and futures markets.
The second issue is whether futures prices ac-curately predict future spot prices. Futuresprices will be the best available predictor if mar-kets are efficient and investors are risk-neutral.Looking backward, these conditions could be as-sessed by comparing futures prices with those ac-tually realized in spot markets to see whether theerrors are systematic. A lack of long time-seriesdata on futures and spot prices for identicalcommodities, though, makes this approach diffi-cult to implement.
Rather than attempting to test separately forthe predictive ability of futures prices and thescope for arbitrage between spot and futures mar-kets for commodities, a more general approach istaken here to addressing the question of whetherexpected output movements are already reflectedin existing commodity prices. This involves sepa-rating actual output growth into its expected andunexpected components. If futures markets areefficient and physical storage is costless, only theunexpected component of output growth should af-fect prices, after controlling for the impact ofnominal interest rates on financial storage costs.If, in contrast, these conditions do not hold, ex-pected growth should also play a role.
To distinguish between expected and unex-pected output growth, the OECD’s forecast forgrowth in aggregate real GDP of the G-7 coun-tries was used as a proxy for expected growth(defined as the forecast published in Decemberfor the following year); the unexpected compo-nent was the difference between actual growthand this forecast. The 12-month change in com-modity prices from December to December ofthe following year was then regressed on thesetwo components of growth, as well as theDecember interest rate on 12-month U.S. treas-ury bills.14 The results are as follows (t-statisticsin parentheses):15
APPENDIX 1.1. COMMODITY MARKETS
55
14The growth forecast is based on annual average data, while the commodity price change is December-to-December.This difference in definition should bias the results against finding a significant lagged effect from expected growth, be-cause the December level of commodity prices would already embody part of the impact of the growth forecast. Hence, thelagged effect of expected growth is potentially stronger than the estimates indicate.
15The nominal change in the commodity price index was used as the dependent variable to be consistent with the use ofthe nominal interest rate as the financial cost of storing commodities. The slope parameters are very similar, and the over-all fit somewhat higher, if the commodity price index is expressed in real terms by deflating by the U.S. CPI.

∆lnPCOM = –0.10 + 6.1 growth_expected (1.0) (3.3)
+ 3.2 growth_unexpected – 0.7 tbill_rate(1.6) (0.6)
R2 = 0.36 Sample period = 1970–2001
Interestingly, the coefficient on expected GDPgrowth is positive, significant, and large: an in-crease in expected growth of 1 percentage pointis associated with a rise in the commodity priceindex of about 6 percentage points over the fol-lowing 12 months. The coefficient on unex-pected growth is only about one-half the size,and marginally significant at conventional levels.Finally, the (insignificant) negative coefficienton the interest rate is contrary to the value of +1that would be expected if it captured the finan-cial cost of storing commodities.
The strong role for expected growth is con-trary to what one might expect if arbitrage werecostless between futures and spot markets andmarkets were efficient. One implication, then, isthat these conditions have not held over the his-torical period—consistent with the evidence forlimited arbitrage provided above by the relation-ship between spot and futures prices. The rela-tively weak coefficient on unexpected growth is,at first sight, more difficult to explain. It can berationalized, however, by considering the natureof the shocks underlying the correlation be-tween commodity prices and unexpectedgrowth. If these reflect a larger component of(unexpected) supply shocks in commodity mar-kets, which in turn have a negative impact on ac-tivity in G-7 countries, the lack of a strong posi-tive relationship between unexpectedinnovations in activity and commodity prices be-comes more plausible.
Looking ahead, what would this relationshipimply for nonfuel commodity prices? To answerthis question, the expected component ofgrowth was set to the WEO forecast for G-7 activ-ity in 2002 and 2003, the U.S. interest rate wasset to its WEO baseline value, and the unex-pected component of growth was set to zero.Under these assumptions, the nonfuel price in-dex is predicted to stay relatively flat in 2002,
CHAPTER I ECONOMIC PROSPECTS AND POLICY ISSUES
56
80
90
100
110
120
130
140
150
160
170
Figure 1.19. Spot and Futures Commodity Prices(2002:Q1 = 100)
Source: Bloomberg Financial Markets, LP.
Wheat
SugarCotton
Coffee
Copper
Gold
Futures
2000 01 02 03
Spot

given the weak growth projection for G-7 output.Some recovery is then predicted in 2003 giventhe pickup in growth, but even then the rise ismoderate, as the projected growth rate of G-7output does not significantly exceed its averagehistorical value. The implications of the regres-sion, then, are that the strong historical relation-ship between expected output growth and com-modity prices would not translate into a markedrise in prices over the next two years—growthwould have to significantly exceed its historicalaverage for this to occur.
Appendix 1.2. Weakness in Japan,Global Imbalances, and the Outlook16
This appendix explores how two underlyingrisks to the forecast—further weakness in Japanand global imbalances—could affect the out-look. The baseline contains a scenario in whichrecovery in the three main currency areas is rela-tively synchronized, as was the slowdown in activ-ity in 2000 and 2001. In the United States andthe euro area, recovery starts in early 2002 andgains momentum in the second half of the year,while in Japan there is a similar profile, albeit atlower rates of growth. As always, however, thereis a high degree of uncertainty about the futurepath of output. This appendix explores some ofthe consequences coming from two of the moreimportant risks and uncertainties to the outlook:the difficult situation in Japan, including thelimited room for macroeconomic policy stimulusand continuing problems in the banking sector,which make the economy particularly vulnerableto unexpected negative shocks; and the limitedprogress made during the slowdown in reducingsignificant imbalances in the global economy,most notably the large current account deficitand low household saving rate in the United
States. This in turn reflects the synchronizationof the slowdown in activity across most of themajor regions of the global economy and, inparticular, the inability of the euro area to main-tain robust growth in the face of weakness in theUnited States. Combined with the mildness ofthe U.S. recession, this means there has beenmuch less adjustment of the external imbalancesacross the major currency areas and of the U.S.household saving rate than had been anticipatedin most “hard landing” scenarios (see, for exam-ple, Box 1.1 in the May 2000 World EconomicOutlook). Consequently, many of the medium-term concerns over the late 1990s associatedwith the sustainability of the U.S. current ac-count remain pertinent.
These observations are incorporated into analternative scenario using the Fund’s macroeco-nomic model, MULTIMOD, through the follow-ing assumptions:• In Japan, a continuation of the deterioration
in the financial system is assumed to increasethe risk premium on all assets by 1 percentagepoint compared to baseline for the next 10years. As a result, in early 2002 there is a 12percent depreciation in the real exchange rateagainst the U.S. dollar and a somewhat largerfall in the equity market.
• Investors in the euro area and parts of the otherindustrial countries become increasingly unwill-ing to further extend their exposure to theUnited States and other industrial countriesthat have structural current account deficits(such as the United Kingdom).17
In the simulation, monetary policy is assumedto follow a Taylor-type rule in which interestrates respond to core inflation and to the outputgap (unless constrained by the zero nominal in-terest rate bound, as happens in Japan). Fiscalpolicy is assumed to be passive, with the authori-
APPENDIX 1.2. WEAKNESS IN JAPAN, GLOBAL IMBALANCES, AND THE OUTLOOK
57
16The main author is Tamim Bayoumi.17This shift in portfolio preferences is modeled by assuming that each percentage point increase in ratio of U.S. net for-
eign assets to GDP above a fixed target level leads to a 10 basis point increase in the risk premium on the U.S. dollar. Tosimulate a loss of confidence, the target level of net foreign assets to GDP is set 2!/2 percentage points below its level in2001 (which is slightly over 20 percentage points of GDP). This causes the euro to appreciate by some 8 percent againstthe U.S. dollar while the other industrial countries as a group appreciate by some 4 percent—implying a reduction in capi-tal flows to the United States of some $20 billion.

ties initiating no active policy changes but allow-ing automatic stabilizers to operate.
The result is a scenario in which Japanese ac-tivity remains weak through the medium term,recovery in the euro area is delayed, while theUnited States is little affected (see Figure 1.20and Table 1.13). In Japan, the increase in therisk premium on assets leads to a significant fallin growth in 2002 because of falling asset pricesexacerbated by constraints on countercyclicalmacroeconomic policies. The loss of market con-fidence in growth prospects translates into signif-icant additional wealth destruction, resulting ina sharp fall in investment as equity prices diveand financial intermediation becomes less effi-cient. Consumption also falls significantly com-pared with the baseline, as wealth destructionand the loss of incomes reduce the desire andability to spend and—while net exports providesome support for activity as a result of the depre-ciation of the yen—the impact is limited by therelatively closed nature of the economy. Most im-portant, the macroeconomic policy responsecannot provide stimulus because of the lack ofpolicy maneuver. Monetary policy is unable tocushion activity because of the zero bound oninterest rates—indeed, real interest rates rise asdeflationary forces intensify—while fiscal policyis constrained by the high level of governmentdebt. As a consequence, a modest shock to fi-nancial markets translates into a significant re-duction in activity and increased deflationarypressures. Reflecting the depreciation in the yenand the weakness of activity, the current accountimproves some $25 billion by 2004.
Despite the fact that there are no direct effectson domestic activity, recovery in the euro area isdelayed by developments in Japan and the appre-ciation of the euro. The downward pressure ongrowth in the short term comes through tradeand wealth channels. Turning first to trade, theappreciation of the real multilateral exchangerate by 7 percent results in a fall in real net ex-ports compared to baseline, an effect that ac-counts for about half of the reduction in activityin 2002, again compared with the baseline. In ad-dition, significant wealth losses on holdings of
CHAPTER I ECONOMIC PROSPECTS AND POLICY ISSUES
58
2002 03 04 05 06-1.0
-0.8
-0.6
-0.4
-0.2
0
0.2
Figure 1.20. Alternative Scenario(Derivative from baseline)
A faster recovery in the United States and weaker activity in Japan could delay recovery in the euro area.
Output Gap(percent of potential output)
United States
Japan
Euro area Other advanced economies
2002 03 04 05 06-10
-5
0
5
10
15Real Exchange Rates Against the U.S. Dollar(percent)
Japan
Euro area
Other advanced economies
2002 03 04 05 06-60
-40
-20
0
20
40
60Current Account(billions of U.S. dollars) Japan
Euro areaOther advanced
economies
United States
Developing countries
Source: IMF MULTIMOD simulations.

foreign assets due to the appreciation in the ex-change rate and the wealth destruction in Japandampen real consumption and investment overthe short term. Monetary policy provides somesupport to activity, but the limited pass-throughof real exchange rate appreciation to core infla-tion—continuing a trend that has been seen inmany industrial and emerging market countriesover the last decade—constrains the vigor of theresponse. The current account deteriorates byover $15 billion by 2004 compared with the base-line. A similar set of considerations, although ina somewhat less virulent form, pertain to theother industrial countries as a group. Again, netexports tend to reduce activity while losses onoverseas holdings of financial assets constrain do-mestic demand, and the current account deterio-rates significantly.
In contrast, the impact on the United States isquite limited. Activity is barely affected as theloss of output from lower external demand islargely offset by stronger net exports. There is amodest improvement in the current account of$25 billion (0.2 percentage points of GDP) by2004. Turning to developing countries, weaknessin the industrial countries has a modest negativeimpact. Given the differences in behavior acrossthe major currency regions, however, the impactvaries significantly depending on where thecountry is located and its exchange rate regime.Continued weakness in Japan, including a depre-ciation of the yen, leads to generally weakergrowth in the rest of east Asia, particularly thosecountries with links to the dollar. For Africa andthe countries in transition, whose links are great-est with the euro area, the short-term impact ismixed, depending on whether the increase indemand created by euro depreciation outweighsthe loss in demand from slower activity. LatinAmerica is largely unaffected, reflecting its lim-ited trade with the rest of the world (see the firstessay in Chapter II) and links to the UnitedStates.
The results in this scenario underline some ofthe vulnerabilities attached to the baseline fore-cast. The first is how the recession and limitedroom for macroeconomic maneuver in Japan in-
creases vulnerability to unanticipated problems.The second is how exchange rate weakness ofthe yen and the U.S. dollar can hurt short-termprospects for the euro area (and some othercountries).
Looking to the medium term, the simulationalso illustrates some of the difficulties in resolv-
APPENDIX 1.2. WEAKNESS IN JAPAN, GLOBAL IMBALANCES, AND THE OUTLOOK
59
Table 1.13. Alternative Scenario: Japanese Weaknessand Exchange Rate Adjustment(Percent deviation from baseline unless otherwise specified)
2002 2003 2004 2005 2006
World real GDP growth –0.3 — 0.2 — 0.1
United StatesReal GDP growth –0.1 — — — —Output gap — –0.1 — — —Real domestic demand growth –0.1 –0.1 –0.1 — —Real effective exchange rate –1.1 –1.1 –1.2 –1.4 –1.5Current account ($billion) 14.2 20.4 25.9 27.6 30.1Core inflation (percentage
points) — –0.1 –0.1 — 0.1Short-term real interest rate
(percentage points) — –0.1 — — 0.1
Euro areaReal GDP growth –0.5 0.2 0.3 0.1 0.1Output gap –0.5 –0.3 –0.1 — 0.1Real domestic demand growth –0.2 0.2 0.3 0.1 0.2Real effective exchange rate 6.9 6.7 6.3 5.6 5.0Real U.S. dollar exchange rate 8.4 8.2 7.9 7.4 6.7Current account ($billion) –12.7 –14.2 –17.5 –21.7 –26.6Core inflation (percentage
points) –0.1 –0.1 –0.2 –0.2 –0.1Short-term real interest rate
(percentage points) –0.4 –0.4 –0.3 –0.2 –0.2
JapanReal GDP growth –1.0 –0.1 0.4 –0.1 0.1Output gap –0.8 –0.7 –0.2 –0.1 0.1Real domestic demand growth –1.7 –0.3 0.3 –0.1 0.1Real effective exchange rate –11.7 –11.1 –10.2 –8.8 –7.3Real U.S. dollar exchange rate –8.9 –8.3 –7.5 –6.2 –4.9Current account ($billion) 2.3 13.0 24.9 40.5 51.4Core inflation (percentage
points) –0.2 — –0.1 –0.2 –0.1Short-term real interest rate
(percentage points) — 0.1 –0.4 –0.5 –0.4
Other industrial economiesReal GDP growth –0.4 0.1 0.3 0.1 0.2Output gap –0.3 –0.3 –0.1 — 0.1Current account ($billion) –4.9 –15.7 –25.6 –34.7 –44.6
Industrial countriesReal GDP growth –0.4 — 0.2 0.1 0.1Output gap –0.4 –0.3 –0.1 — 0.1Current account ($billion) –1.1 3.5 7.6 11.7 10.3
Developing countriesReal GDP growth –0.1 — 0.1 — —Current account ($billion) 1.1 –3.5 –7.6 –11.7 –10.3

ing the large imbalances across the globe evenwith an appreciation of the euro against the U.S.dollar, particularly in the face of weak activity inJapan. The necessary slowdown of activity in theUnited States, which was showing increasing evi-dence of being above its potential, has not led toa significant reduction in global imbalances.This reflects the continued resilience of U.S.consumption and the inability of the other ma-jor currency areas and emerging market regionsto maintain robust growth in the face of weak-ness in the United States. It also implies thatsignificant exchange rate movements may beneeded to make notable progress on theimbalances.
How, under such circumstances, will an or-derly adjustment of the U.S. current accountdeficit be achieved? Ideally, the counterpart toany significant reduction in the U.S. current ac-count balance would be a more modest deterio-ration in the external position of a number ofother regions, rather than a large adjustment inone, although weakness in Japan would compli-cate such an adjustment. As emphasized in pre-vious World Economic Outlooks, adjustment in ex-ternal imbalances would be facilitated bygreater progress on structural reform in theeuro area, Japan, and emerging markets regionssuch as emerging Asia. Such reforms wouldmake these regions a more attractive locationfor investment, thereby reducing the flow ofworld saving to the United States, which reflects,at least in part, disappointing potential outputgrowth and unattractive climates for investmentelsewhere. For example, if productivity growthin the rest of the industrial countries were to in-crease relative to the United States by !/2 percenta year, this could reduce the U.S. current ac-count balance by almost $100 billion after 5years.18 In the United States, it will be important
to ensure that fiscal policy is conducted in amanner that does not reduce domestic savingover the medium term. In short, a generalizedfailure to make significant progress on struc-tural reforms across a range of countries wouldexacerbate global vulnerabilities.
ReferencesBank of Japan, 2001, “Japan’s Financial Structure in
View of the Flow of Funds Accounts,” Bank of JapanQuarterly Bulletin (February).
IMF, 2000, “The Impact of Higher Oil Prices on theGlobal Economy.” Available on the Interest atwww.imf.org/external/pubs/ft/oil/2000/index.htm.
Loungani, Prakash, 2001, “How Accurate Are PrivateSector Forecasts? Cross-Country Evidence fromConsensus Forecasts of Output Growth,” InternationalJournal of Forecasting, Vol. 17 (July–September),pp. 419–32.
———, 2002, “There Will Be Growth in the Spring:How Credible Are Forecasts of Recovery” WorldEconomics, Vol. 3 (January–March), pp. 1–6.
Parsley, David, and Shang-Jin Wei, 2001, “LimitingCurrency Volatility to Stimulate Goods MarketIntegration: A Price-Based Approach,” IMF WorkingPaper 01/197 (Washington: International MonetaryFund).
Persson, Torsten, 2001, “Currency Unions and Trade:How Large Is the Treatment Effect?” Economic Policy,Vol 16, Issue 33 (October), pp. 433–48.
Rose, Andrew K., 2000, “One Money, One Market:The Effect of Common Currencies on Trade,”Economic Policy, Vol. 15, Issue 30 (April), pp. 7–46.
———, and Eric van Wincoop, 2001, “National Moneyas a Barrier to International Trade: The Real Casefor Currency Union,” American Economic Review,Papers and Proceedings, Vol. 91 (May), pp. 386–90.
Zarnowitz, Victor, 1986, “The Record andImprovability of Economic Forecasting,” NBERWorking Paper No. 2099 (Cambridge, Massachus-setts: National Bureau of Economic Reserrch).
CHAPTER I ECONOMIC PROSPECTS AND POLICY ISSUES
60
18See Appendix II of the October 2001 World Economic Outlook. The actual simulation was of an increase in productivitygrowth in the United States, relative to other countries, rather than a fall in relative growth.