WORLD ECONOMIC OUTLOOK - RTP
208
2019 OCT WORLD ECONOMIC OUTLOOK INTERNATIONAL MONETARY FUND Global Manufacturing Downturn, Rising Trade Barriers
Transcript of WORLD ECONOMIC OUTLOOK - RTP

2019OCT
WORLD ECONOMIC OUTLOOK
INTERNATIONAL MONETARY FUND
Global Manufacturing Downturn Rising Trade Barriers
copy2019 International Monetary Fund
Cover and Design IMF CSF Creative Solutions DivisionComposition AGS An RR Donnelley Company
Cataloging-in-Publication Data
Joint Bank-Fund Library
Names International Monetary FundTitle World economic outlook (International Monetary Fund)Other titles WEO | Occasional paper (International Monetary Fund) | World economic and
financial surveysDescription Washington DC International Monetary Fund 1980- | Semiannual | Some
issues also have thematic titles | Began with issue for May 1980 | 1981-1984 Occasional paper International Monetary Fund 0251-6365 | 1986- World economic and financial surveys 0256-6877
Identifiers ISSN 0256-6877 (print) | ISSN 1564-5215 (online)Subjects LCSH Economic developmentmdashPeriodicals | International economic relationsmdash
Periodicals | Debts ExternalmdashPeriodicals | Balance of paymentsmdashPeriodicals | International financemdashPeriodicals | Economic forecastingmdashPeriodicals
Classification LCC HC10W79
HC1080
ISBN 978-1-51350-821-4 (English Paper) 978-1-51351-617-2 (English ePub) 978-1-51351-616-5 (English PDF)
The World Economic Outlook (WEO) is a survey by the IMF staff published twice a year in the spring and fall The WEO is prepared by the IMF staff and has benefited from comments and suggestions by Executive Directors following their discussion of the report on October 3 2019 The views expressed in this publication are those of the IMF staff and do not necessarily represent the views of the IMFrsquos Executive Directors or their national authorities
Recommended citation International Monetary Fund 2019 World Economic Outlook Global Manufacturing Downturn Rising Trade Barriers Washington DC October
Publication orders may be placed online by fax or through the mail International Monetary Fund Publication Services
PO Box 92780 Washington DC 20090 USATel (202) 623-7430 Fax (202) 623-7201
E-mail publicationsimforgwwwimfbookstoreorgwwwelibraryimforg
International Monetary Fund | October 2019 iii
CONTENTS
Assumptions and Conventions ix
Further Information xi
Data xii
Preface xiii
Foreword xiv
Executive Summary xvi
Chapter 1 Global Prospects and Policies 1
Subdued Momentum Weak Trade and Industrial Production 1Weakening Growth 2Muted Inflation 3Volatile Market Sentiment Monetary Policy Easing 5Global Growth Outlook Modest Pickup amid Difficult Headwinds 7Growth Forecast for Advanced Economies 12Growth Forecast for Emerging Market and Developing Economies 13Inflation Outlook 16External Sector Outlook 16Risks Skewed to the Downside 19Policy Priorities 22Scenario Box 11 Implications of Advanced Economies Reshoring Some Production 29Scenario Box 12 Trade Tensions Updated Scenario 31Box 11 The Global Automobile Industry Recent Developments and Implications for
the Global Outlook 34Box 12 The Decline in World Foreign Direct Investment in 2018 38Box 13 Global Growth Forecast Assumptions on Policies Financial Conditions and
Commodity Prices 41Box 14 The Plucking Theory of the Business Cycle 43Special Feature Commodity Market Developments and Forecasts 45Box 1SF1 Whatrsquos Happening with Global Carbon Emissions 56References 63
Online Annex
Special Feature Online Annex
Chapter 2 Closer Together or Further Apart Within-Country Regional Disparities and Adjustment in Advanced Economies 65
Introduction 65Regional Development and Adjustment A Primer 70Patterns of Regional Disparities in Advanced Economies 71Regional Labor Market Adjustment in Advanced Economies 73Regional Labor Mobility and Factor Allocation Individual and Firm-Level Evidence 76Summary and Policy Implications 78
W O R L D E C O N O M I C O U T L O O K G LO B A L M A N U FAC T U R I N G D OW N T U R N R IS I N G T R A D E B A R R I E R S
iv International Monetary Fund | October 2019
Box 21 Measuring Subnational Regional Economic Activity and Welfare 80Box 22 Climate Change and Subnational Regional Disparities 82Box 23 The Persistent Effects of Local Shocks The Case of Automotive Manufacturing
Plant Closures 84Box 24 Place-Based Policies Rethinking Fiscal Policies to Tackle Inequalities
within Countries 86References 88
Online Annexes
Annex 21 Variables Data Sources and Sample CoverageAnnex 22 Calculation and Decomposition of Income InequalityAnnex 23 Shift-Share Analysis of Regional Labor ProductivityAnnex 24 Counterfactual Exercise for Labor Productivity Changes in Lagging versus
Other RegionsAnnex 25 Regional Labor Market Effects of Local Labor Demand Shocks Trade and
Technology ShocksAnnex 26 Firm-Level Analysis of Capital Allocative Efficiency
Chapter 3 Reigniting Growth in Low-Income and Emerging Market Economies What Role Can Structural Reforms Play 93
Introduction 93Structural Policy and Reform Patterns in Emerging Market and Developing Economies 97The Macroeconomic Effects of Reforms in Emerging Market and Developing Economies 101Accounting for Differences across Countries 106Summary and Policy Implications 110Box 31 The Political Effects of Structural Reforms 113Box 32 The Impact of Crises on Structural Reforms 115References 117
Online Annexes
Annex 31 Data Sources and SampleAnnex 32 Empirical AnalysismdashMethodological Details and Robustness ChecksAnnex 33 Model Analysis
Statistical Appendix 121
Assumptions 121Whatrsquos New 122Data and Conventions 122Country Notes 123Classification of Countries 124General Features and Composition of Groups in the World Economic Outlook Classification 125Table A Classification by World Economic Outlook Groups and Their Shares in Aggregate
GDP Exports of Goods and Services and Population 2018 126Table B Advanced Economies by Subgroup 127Table C European Union 127Table D Emerging Market and Developing Economies by Region and Main Source of
Export Earnings 128Table E Emerging Market and Developing Economies by Region Net External Position
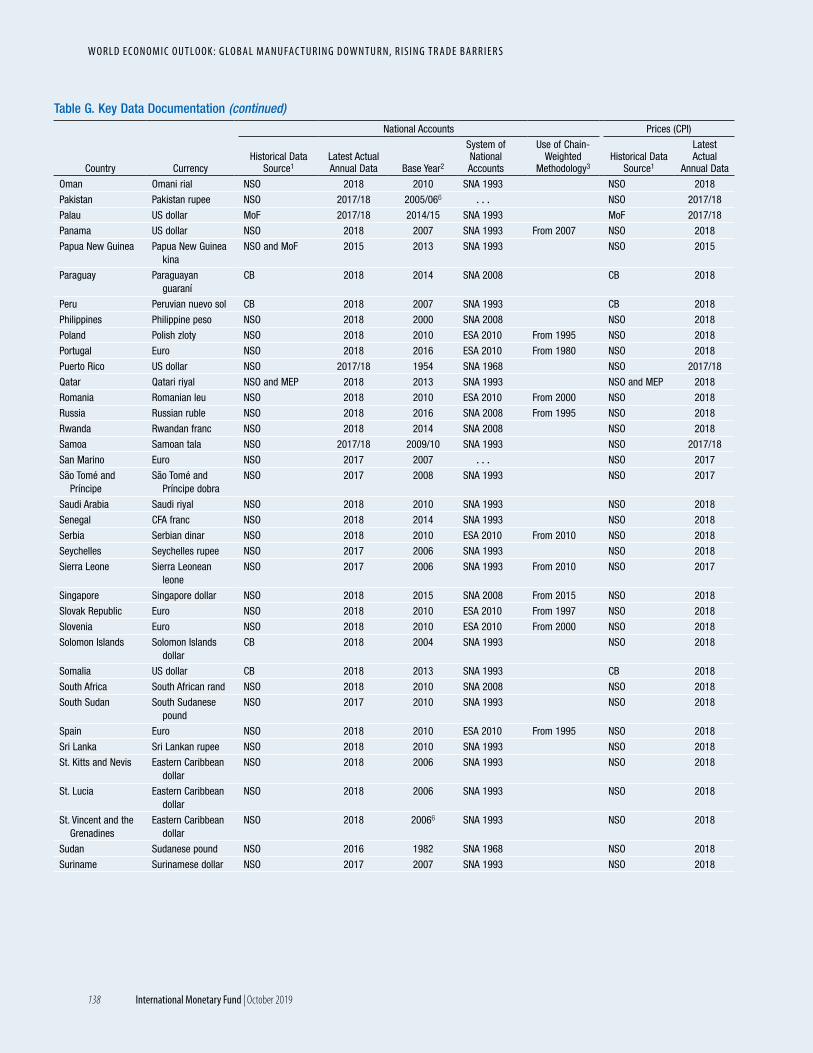
and Status as Heavily Indebted Poor Countries and Low-Income Developing Countries 129Table F Economies with Exceptional Reporting Periods 131Table G Key Data Documentation 132
co n t e n ts
International Monetary Fund | October 2019 v
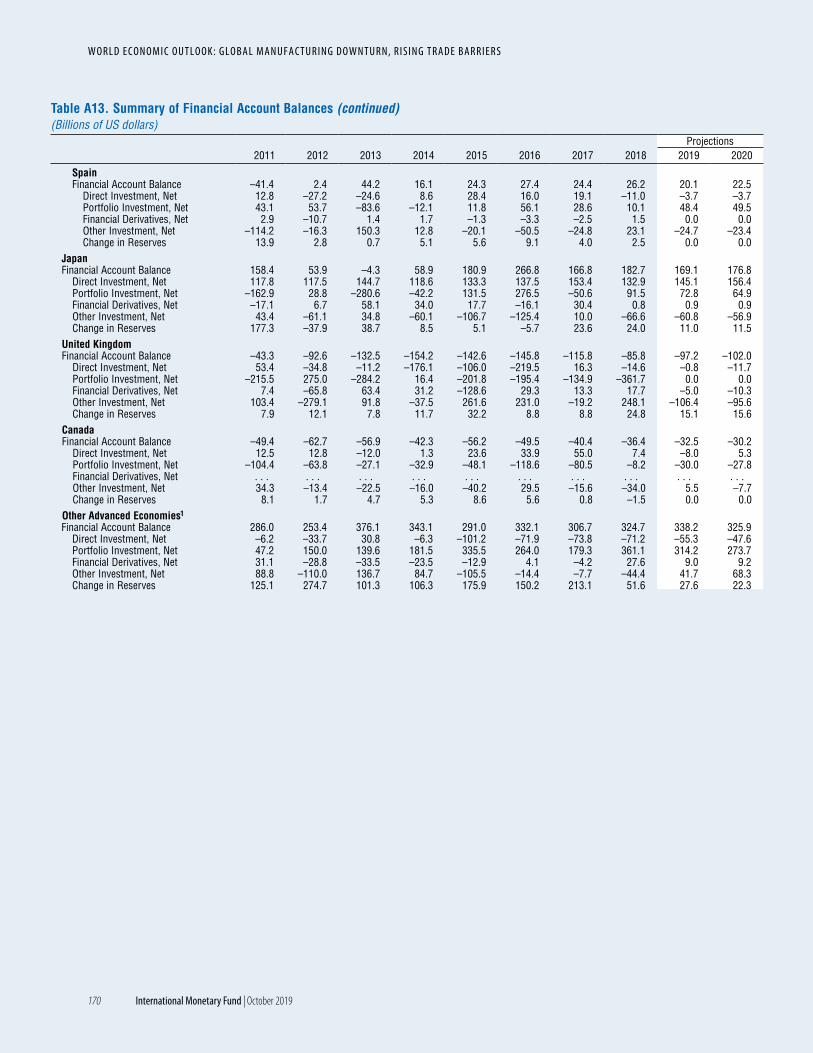
Box A1 Economic Policy Assumptions Underlying the Projections for Selected Economies 142List of Tables Output (Tables A1ndashA4) 147Inflation (Tables A5ndashA7) 154Financial Policies (Table A8) 159Foreign Trade (Table A9) 160Current Account Transactions (Tables A10ndashA12) 162Balance of Payments and External Financing (Table A13) 169Flow of Funds (Table A14) 173Medium-Term Baseline Scenario (Table A15) 176
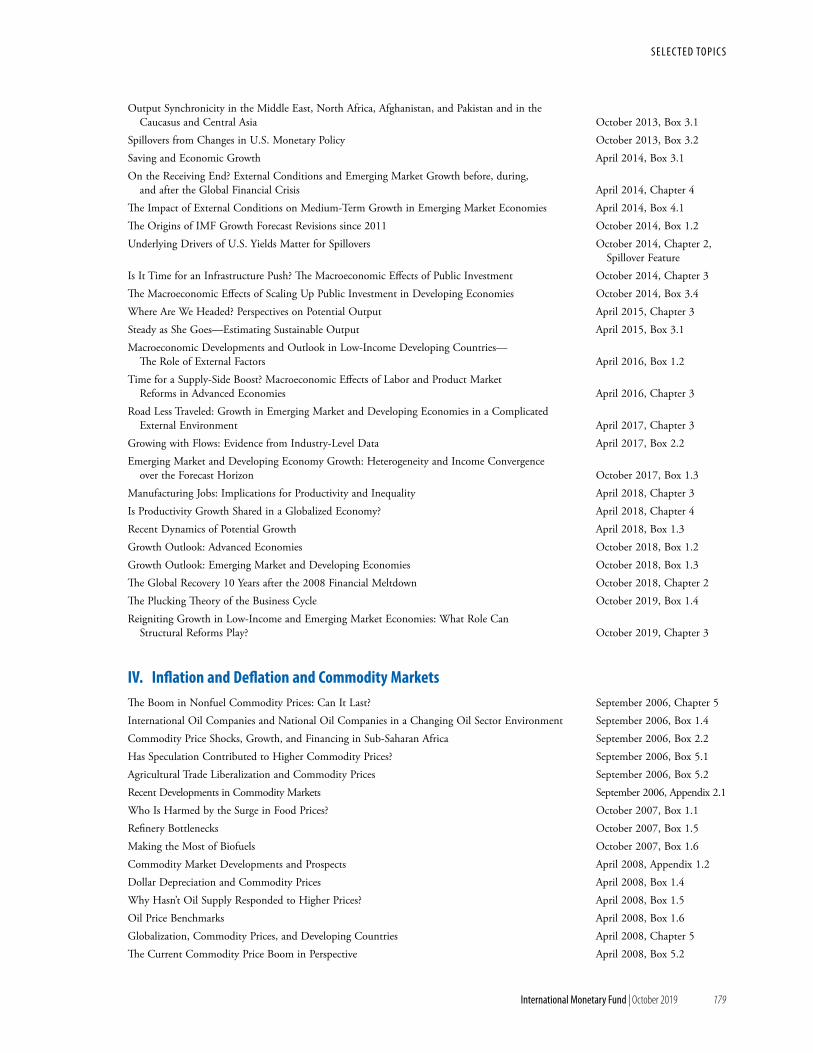
World Economic Outlook Selected Topics 177
IMF Executive Board Discussion of the Outlook October 2019 187
Tables
Table 11 Overview of the World Economic Outlook Projections 10Table 1SF1 Official Gold Reserves 50Table 1SF2 Precious Metals Production 2016ndash18 50Table 1SF3 Relative Rarity 52Table 1SF4 World Average Inflation Betas 54Table 1SF5 Determinants of One-Month Return on Precious Metals 54Table 1SF6 Asset Returns Associated with Largest Single-Day Changes in the SampP
500 Index 55Annex Table 111 European Economies Real GDP Consumer Prices Current Account
Balance and Unemployment 57Annex Table 112 Asian and Pacific Economies Real GDP Consumer Prices Current
Account Balance and Unemployment 58Annex Table 113 Western Hemisphere Economies Real GDP Consumer Prices
Current Account Balance and Unemployment 59Annex Table 114 Middle East and Central Asia Economies Real GDP Consumer Prices
Current Account Balance and Unemployment 60Annex Table 115 Sub-Saharan African Economies Real GDP Consumer Prices
Current Account Balance and Unemployment 61Annex Table 116 Summary of World Real per Capita Output 62Table 241 Examples of Place-Based Policies 86
Online TablesmdashStatistical Appendix
Table B1 Advanced Economies Unemployment Employment and Real GDP per CapitaTable B2 Emerging Market and Developing Economies Real GDPTable B3 Advanced Economies Hourly Earnings Productivity and Unit Labor Costs
in ManufacturingTable B4 Emerging Market and Developing Economies Consumer PricesTable B5 Summary of Fiscal and Financial IndicatorsTable B6 Advanced Economies General and Central Government Net
LendingBorrowing and General Government Net LendingBorrowing Excluding Social Security Schemes
Table B7 Advanced Economies General Government Structural BalancesTable B8 Emerging Market and Developing Economies General Government Net
LendingBorrowing and Overall Fiscal Balance
W O R L D E C O N O M I C O U T L O O K G LO B A L M A N U FAC T U R I N G D OW N T U R N R IS I N G T R A D E B A R R I E R S
vi International Monetary Fund | October 2019
Table B9 Emerging Market and Developing Economies General Government Net LendingBorrowing
Table B10 Selected Advanced Economies Exchange RatesTable B11 Emerging Market and Developing Economies Broad Money AggregatesTable B12 Advanced Economies Export Volumes Import Volumes and Terms of Trade
in Goods and ServicesTable B13 Emerging Market and Developing Economies by Region Total Trade in GoodsTable B14 Emerging Market and Developing Economies by Source of Export Earnings
Total Trade in GoodsTable B15 Summary of Current Account TransactionsTable B16 Emerging Market and Developing Economies Summary of External Debt
and Debt ServiceTable B17 Emerging Market and Developing Economies by Region External Debt
by MaturityTable B18 Emerging Market and Developing Economies by Analytical Criteria External
Debt by MaturityTable B19 Emerging Market and Developing Economies Ratio of External Debt to GDPTable B20 Emerging Market and Developing Economies Debt-Service RatiosTable B21 Emerging Market and Developing Economies Medium-Term Baseline
Scenario Selected Economic Indicators
Figures
Figure 1 GDP Growth World and Group of Four xviiFigure 11 Global Activity Indicators 2Figure 12 Contribution to Global Imports 2Figure 13 Global Investment and Trade 3Figure 14 Spending on Durable Goods 3Figure 15 Global Purchasing Managersrsquo Index and Consumer Confidence 4Figure 16 Global Inflation 4Figure 17 Wages Unit Labor Costs and Labor Shares 5Figure 18 Commodity Prices 5Figure 19 Advanced Economies Monetary and Financial Market Conditions 6Figure 110 Emerging Market Economies Interest Rates and Spreads 7Figure 111 Emerging Market Economies Equity Markets and Credit 8Figure 112 Emerging Market Economies Capital Flows 8Figure 113 Real Effective Exchange Rate Changes March 2019ndashSeptember 2019 9Figure 114 Global Growth 12Figure 115 Emerging Market and Developing Economies
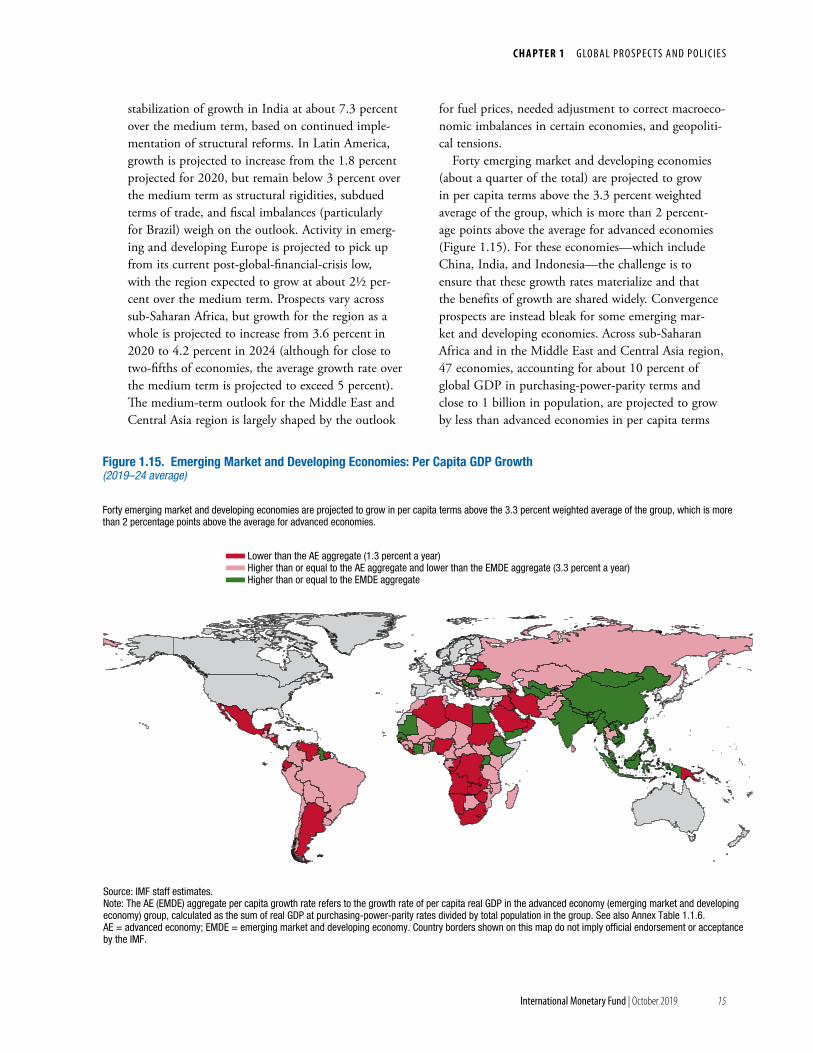
Per Capita Real GDP Growth 15Figure 116 Sub-Saharan Africa Population in 2018 and Projected Growth Rates in
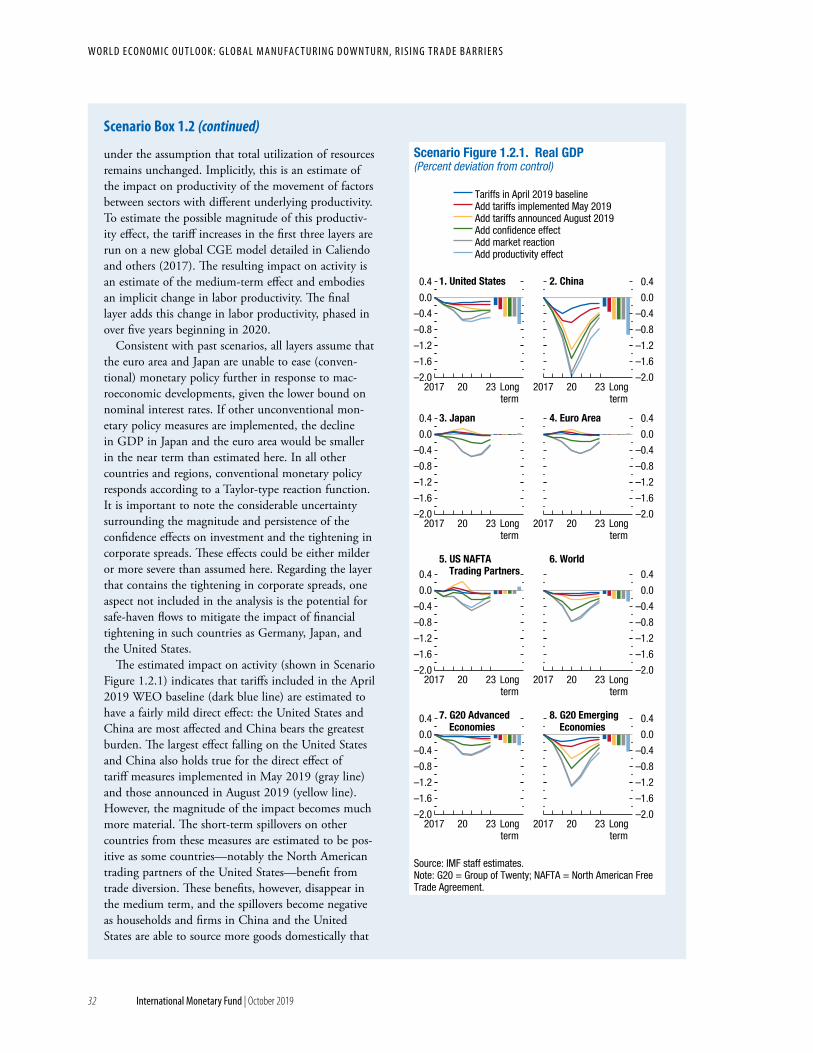
GDP per Capita 2019ndash24 16Figure 117 Global Current Account Balance 17Figure 118 Current Account Balances in Relation to Economic Fundamentals 18Figure 119 Net International Investment Position 18Figure 120 Tech Hardware Supply Chains 20Figure 121 Policy Uncertainty and Trade Tensions 21Figure 122 Geopolitical Risk Index 21Figure 123 Probability of One-Year-Ahead Global Growth of Less than 25 Percent 22Scenario Figure 111 Advanced Economies Reshoring 29Scenario Figure 121 Real GDP 32
co n t e n ts
International Monetary Fund | October 2019 vii
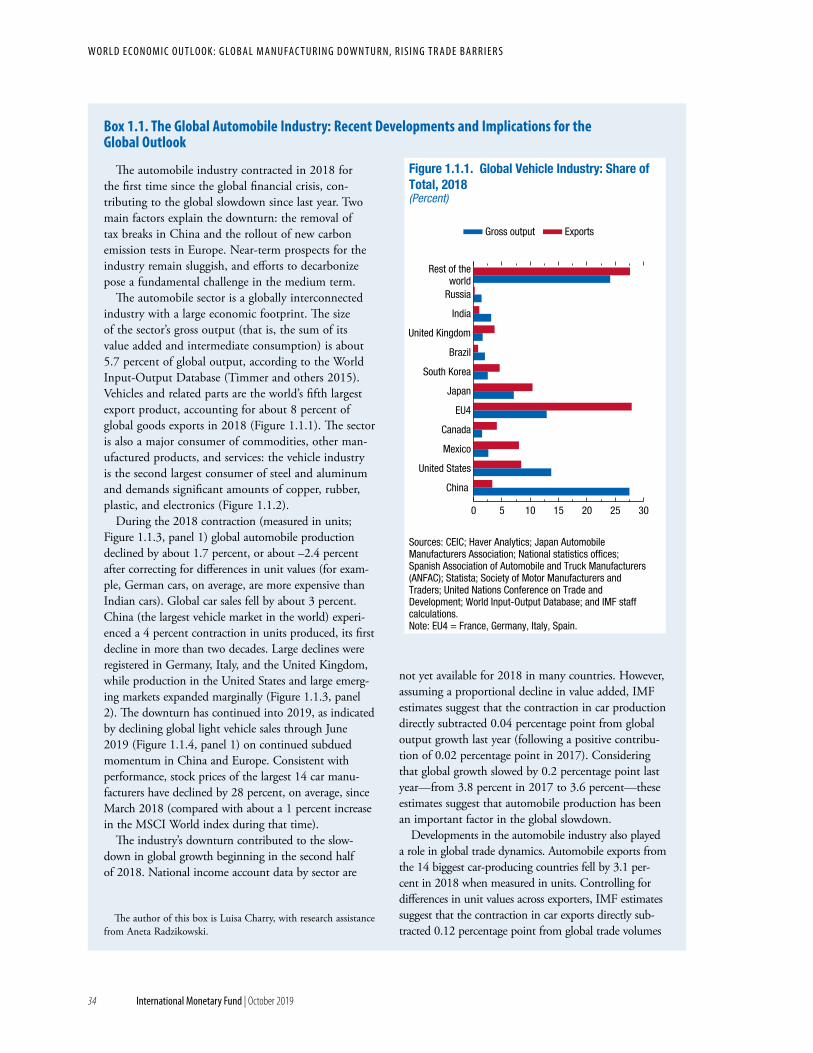
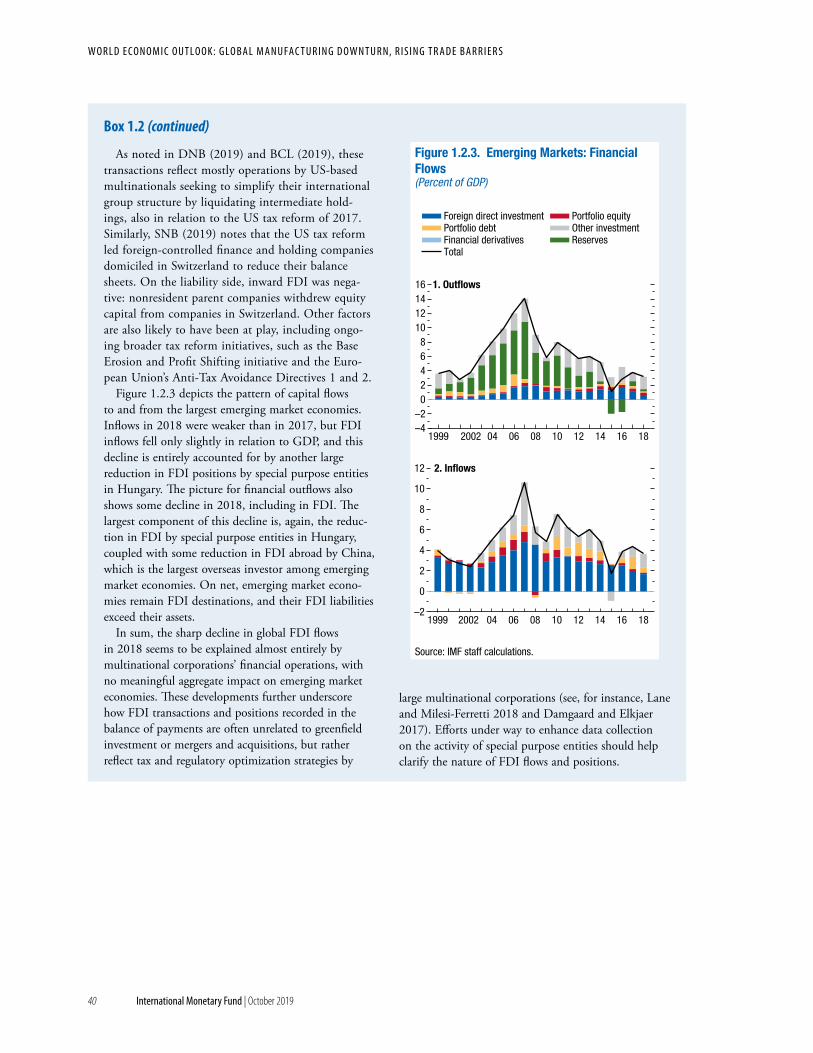
Figure 111 Global Vehicle Industry Share of Total 2018 34Figure 112 Global Vehicle Industry Structure of Production 2014 35Figure 113 Global Vehicle Production 36Figure 114 World Passenger Vehicle Sales and Usage 36Figure 121 Advanced Economies Financial Flows 38Figure 122 Foreign Direct Investment Flows 39Figure 123 Emerging Markets Financial Flows 40Figure 131 Forecast Assumptions Fiscal Indicators 42Figure 132 Commodity Price Assumptions and Terms-of-Trade Windfall Gains
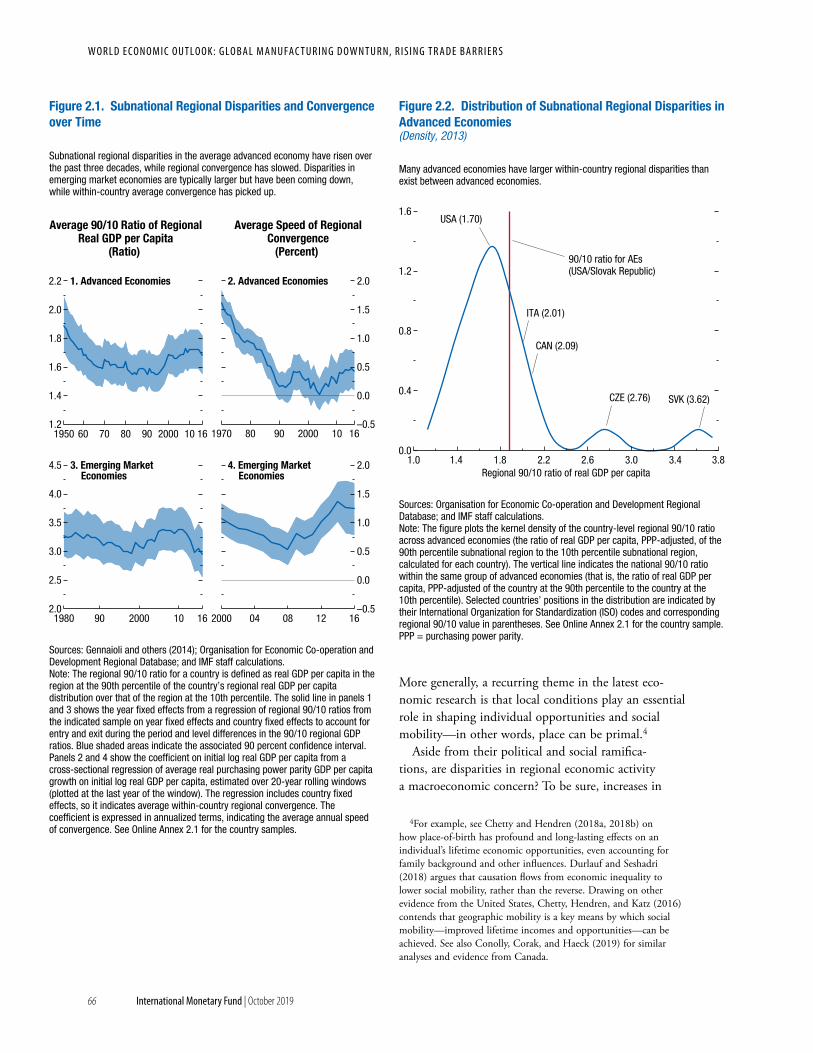
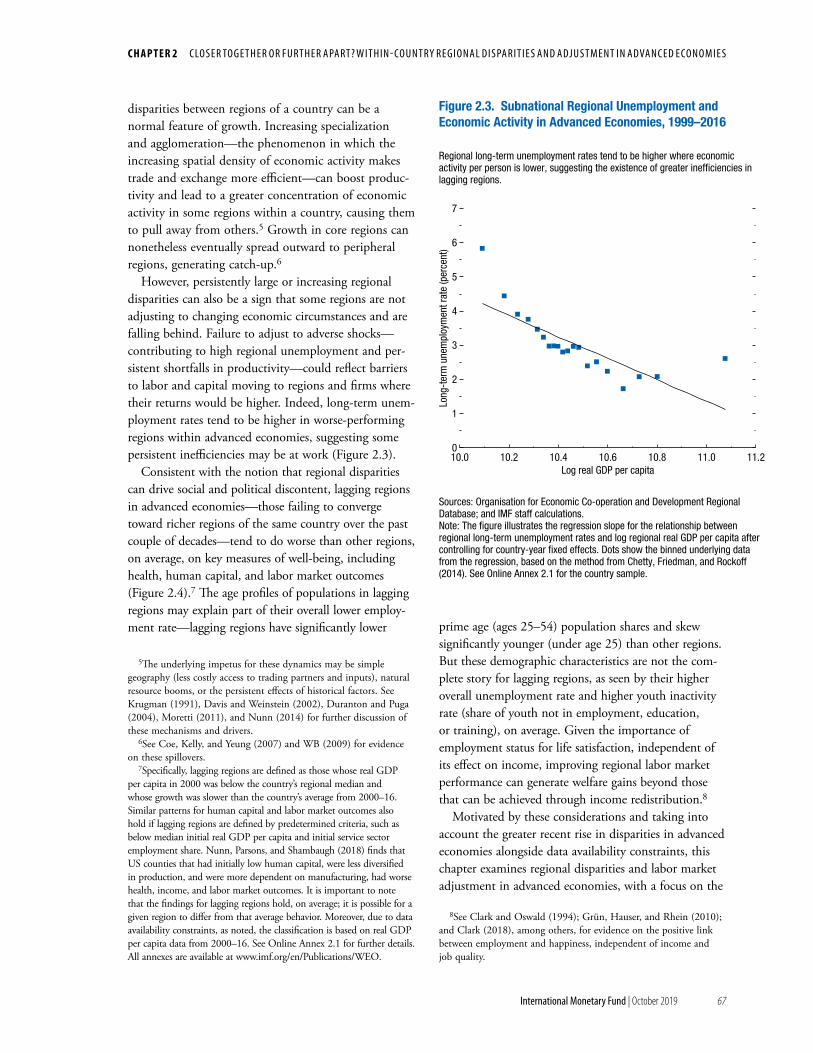
and Losses 42Figure 141 An Illustration of the Plucking Theory 43Figure 142 Unemployment Dynamics in Advanced Economies 44Figure 1SF1 Commodity Market Developments 46Figure 1SF2 Gold and Silver Prices 49Figure 1SF3 Macro Relevance of Precious Metals 51Figure 1SF4 Share of Total Demand 52Figure 1SF5 Correlation Precious Metals Copper and Oil 53Figure 1SF6 Precious Metals versus Consumer Price Index Inflation 53Figure 1SF11 Contribution to World Emissions by Location 56Figure 1SF12 Contribution to World Emissions by Source 56Figure 21 Subnational Regional Disparities and Convergence over Time 66Figure 22 Distribution of Subnational Regional Disparities in Advanced Economies 66Figure 23 Subnational Regional Unemployment and Economic Activity in Advanced
Economies 1999ndash2016 67Figure 24 Demographics Health Human Capital and Labor Market Outcomes in
Advanced Economies Lagging versus Other Regions 68Figure 25 Inequality in Household Disposable Income within
Advanced Economies 70Figure 26 Subnational Regional Disparities in Real GDP per Capita 71Figure 27 Shift-Share Variance Decomposition by Country 2003ndash14 72Figure 28 Sectoral Labor Productivity and Employment Shares Lagging versus
Other Regions 73Figure 29 Labor Productivity Lagging versus Other Regions 74Figure 210 Regional Effects of Import Competition Shocks 75Figure 211 Regional Effects of Automation Shocks 76Figure 212 Regional Effects of Trade and Technology Shocks Conditional on
National Policies 77Figure 213 Subnational Regional Migration and Labor Mobility 78Figure 214 Effects of National Structural Policies on Subnational Regional Dispersion
of Capital Allocative Efficiency 78Figure 211 Subnational Regional Disparities Before and after Regional Price Adjustment 80Figure 221 Marginal Effect of 1degC Increase in Temperature on Sectoral Labor Productivity 82Figure 222 Change in Labor Productivity of Lagging versus Other Regions Due to
Projected Temperature Increases between 2005 and 2100 83Figure 231 Associations between Automotive Manufacturing Plant Closures and
Unemployment Rates 84Figure 241 Effects of Fiscal Redistribution by Conventional versus Spatially Targeted
Means-Tested Transfers 87Figure 31 Speed of Income-per-Capita Convergence in Emerging Markets and
Low-Income Developing Countries 94
W O R L D E C O N O M I C O U T L O O K G LO B A L M A N U FAC T U R I N G D OW N T U R N R IS I N G T R A D E B A R R I E R S
viii International Monetary Fund | October 2019
Figure 32 Reform Intensity and Speed of Income-per-Capita Convergence in Selected Economies 94
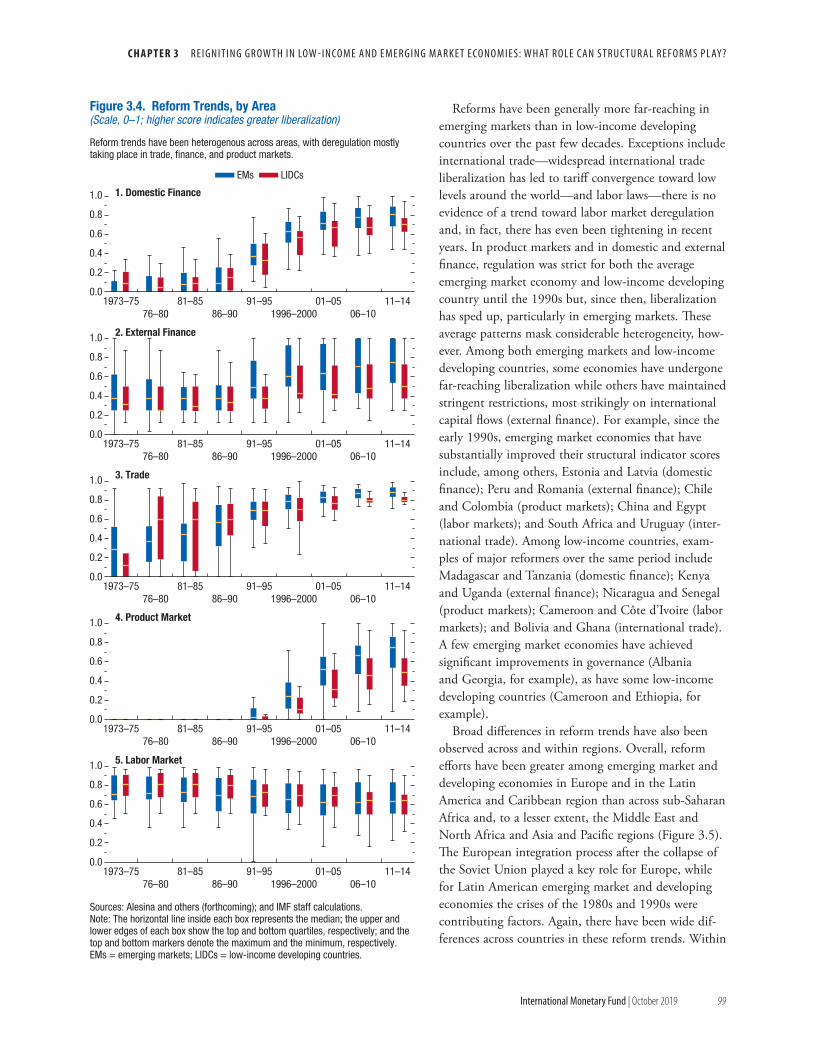
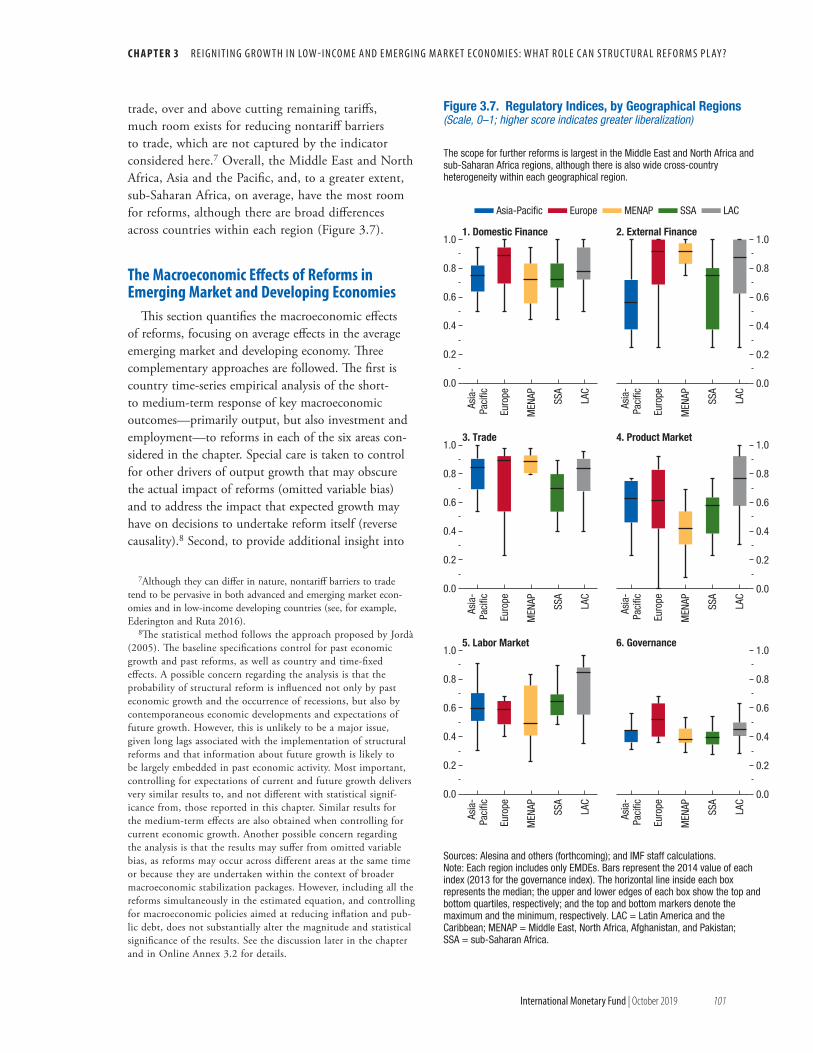
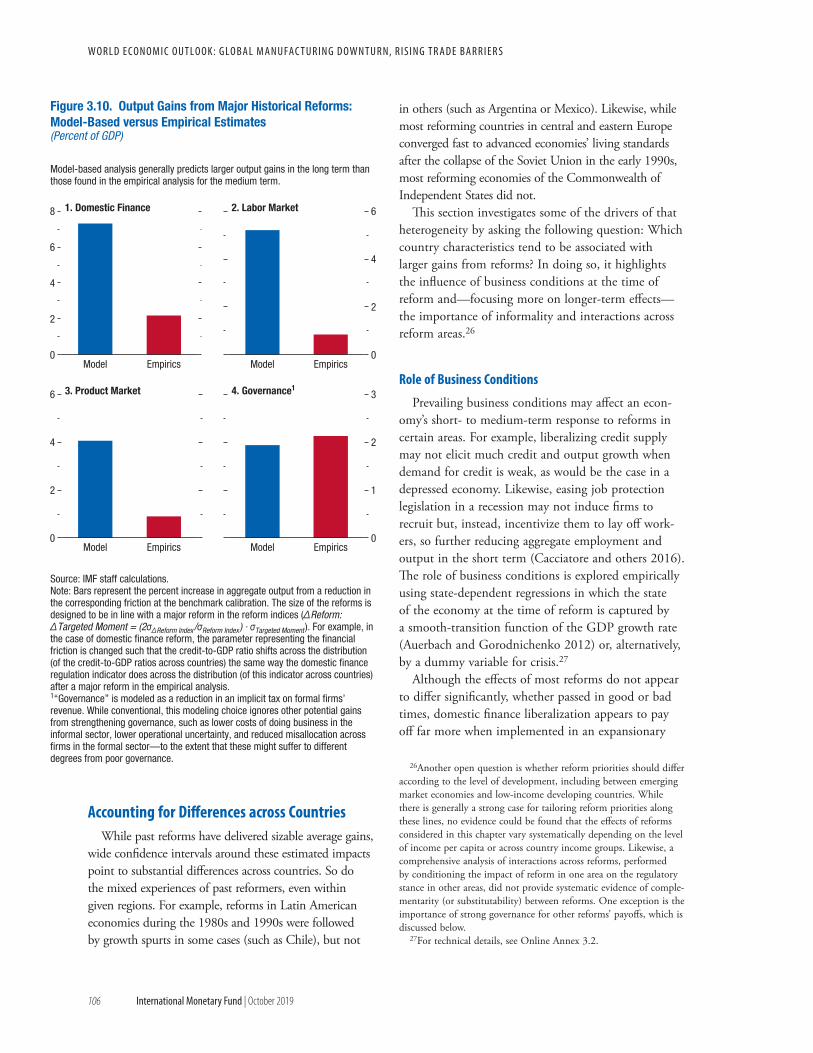
Figure 33 Overall Reform Trends 98Figure 34 Reform Trends by Area 99Figure 35 Overall Reform Trends across Different Geographical Regions 100Figure 36 Regulatory Indices by Country Income Groups 100Figure 37 Regulatory Indices by Geographical Regions 101Figure 38 Average Effects of Reforms 102Figure 39 Industry-Level Effect of Domestic and External Finance Reforms on Output 104Figure 310 Output Gains from Major Historical Reforms Model-Based versus
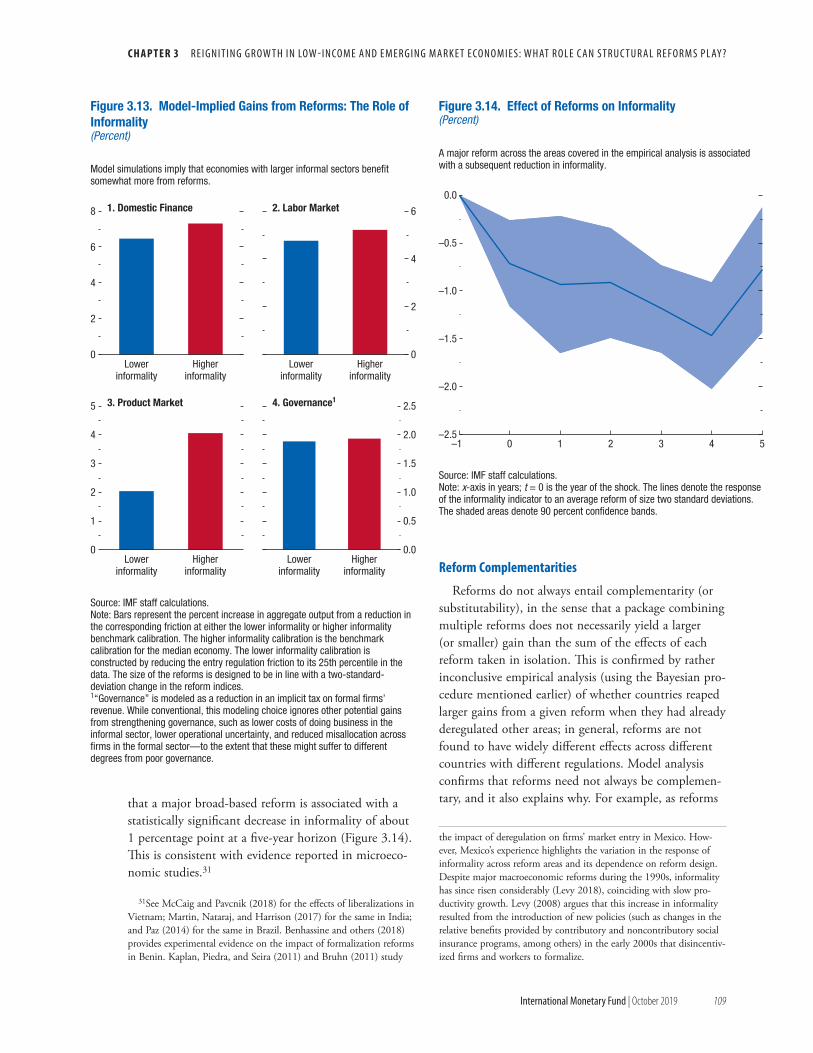
Empirical Estimates 106Figure 311 Effects of Reforms The Role of Macroeconomic Conditions 107Figure 312 Effects of Reforms on Output The Role of Informality 108Figure 313 Model-Implied Gains from Reforms The Role of Informality 109Figure 314 Effect of Reforms on Informality 109Figure 315 Effects of Reforms on Output The Role of Governance 110Figure 316 Gain from Packaging Domestic Finance and Labor Market Reforms 111Figure 311 The Effect of Reform on Electoral Outcomes 114Figure 312 The Effect of Reform on Vote Share The Role of Economic Conditions 114Figure 321 The Effect of Crises on Structural Reforms 116
International Monetary Fund | October 2019 ix
ASSUMPTIONS AND CONVENTIONS
A number of assumptions have been adopted for the projections presented in the World Economic Outlook (WEO) It has been assumed that real effective exchange rates remained constant at their average levels during July 26 to August 23 2019 except for those for the currencies participating in the European exchange rate mechanism II (ERM II) which are assumed to have remained constant in nominal terms relative to the euro that established policies of national authorities will be maintained (for specific assumptions about fiscal and monetary policies for selected economies see Box A1 in the Statistical Appendix) that the average price of oil will be $6178 a barrel in 2019 and $5794 a barrel in 2020 and will remain unchanged in real terms over the medium term that the six-month London interbank offered rate (LIBOR) on US dollar deposits will average 23 percent in 2019 and 20 percent in 2020 that the three-month euro deposit rate will average ndash04 percent in 2019 and ndash06 in 2020 and that the six-month Japanese yen deposit rate will yield on average 00 percent in 2019 and ndash01 percent in 2020 These are of course working hypotheses rather than forecasts and the uncertainties surrounding them add to the margin of error that would in any event be involved in the projections The estimates and projections are based on statistical information available through September 30 2019
The following conventions are used throughout the WEO to indicate that data are not available or not applicablendash between years or months (for example 2018ndash19 or JanuaryndashJune) to indicate the years or months
covered including the beginning and ending years or months and between years or months (for example 201819) to indicate a fiscal or financial year
ldquoBillionrdquo means a thousand million ldquotrillionrdquo means a thousand billionldquoBasis pointsrdquo refers to hundredths of 1 percentage point (for example 25 basis points are equivalent to frac14 of
1 percentage point)Data refer to calendar years except in the case of a few countries that use fiscal years Please refer to Table F in
the Statistical Appendix which lists the economies with exceptional reporting periods for national accounts and government finance data for each country
For some countries the figures for 2018 and earlier are based on estimates rather than actual outturns Please refer to Table G in the Statistical Appendix which lists the latest actual outturns for the indicators in the national accounts prices government finance and balance of payments indicators for each country
What is new in this publication
bull Mauritania redenominated its currency in January 2018 by replacing 10 old Mauritanian ouguiya (MRO) with 1 new Mauritanian ouguiya (MRU) Local currency data for Mauritania are expressed in the new currency beginning with the October 2019 WEO database
bull Satildeo Tomeacute and Priacutencipe redenominated its currency in January 2018 by replacing 1000 old Satildeo Tomeacute and Priacutencipe dobra (STD) with 1 new Satildeo Tomeacute and Priacutencipe dobra (STN) Local currency data for Satildeo Tomeacute and Priacutencipe are expressed in the new currency beginning with the October 2019 WEO database
bull Beginning with the October 2019 WEO the regional group Commonwealth of Independent States (CIS) is dis-continued Four of the CIS economies (Belarus Moldova Russia and Ukraine) are added to the regional group Emerging and Developing Europe The remaining eight economiesmdashArmenia Azerbaijan Georgia Kazakhstan Kyrgyz Republic Tajikistan Turkmenistan and Uzbekistan which comprise the regional subgroup Caucasus and Central Asia (CCA)mdashare combined with Middle East North Africa Afghanistan and Pakistan (MENAP) to form the new regional group Middle East and Central Asia (MECA)
In the tables and figures the following conventions applybull If no source is listed on tables and figures data are drawn from the WEO databasebull When countries are not listed alphabetically they are ordered on the basis of economic sizebull Minor discrepancies between sums of constituent figures and totals shown reflect rounding
W O R L D E C O N O M I C O U T L O O K G LO B A L M A N U FAC T U R I N G D OW N T U R N R IS I N G T R A D E B A R R I E R S
x International Monetary Fund | October 2019
As used in this report the terms ldquocountryrdquo and ldquoeconomyrdquo do not in all cases refer to a territorial entity that is a state as understood by international law and practice As used here the term also covers some territorial entities that are not states but for which statistical data are maintained on a separate and independent basis
Composite data are provided for various groups of countries organized according to economic characteristics or region Unless noted otherwise country group composites represent calculations based on 90 percent or more of the weighted group data
The boundaries colors denominations and any other information shown on the maps do not imply on the part of the IMF any judgment on the legal status of any territory or any endorsement or acceptance of such boundaries
International Monetary Fund | October 2019 xi
Corrections and Revisions The data and analysis appearing in the World Economic Outlook (WEO) are compiled by the IMF staff at the
time of publication Every effort is made to ensure their timeliness accuracy and completeness When errors are discovered corrections and revisions are incorporated into the digital editions available from the IMF website and on the IMF eLibrary (see below) All substantive changes are listed in the online table of contents
Print and Digital EditionsPrint
Print copies of this WEO can be ordered from the IMF bookstore at imfbkst28248
Digital
Multiple digital editions of the WEO including ePub enhanced PDF and HTML are available on the IMF eLibrary at wwwelibraryimforgOCT19WEO
Download a free PDF of the report and data sets for each of the charts therein from the IMF website at wwwimforgpublicationsweo or scan the QR code below to access the World Economic Outlook web page directly
Copyright and ReuseInformation on the terms and conditions for reusing the contents of this publication are at wwwimforgexternal
termshtm
FURTHER INFORMATION
xii International Monetary Fund | October 2019
WO R L D E CO N O M I C O U T LO O K T E N S I O N S F R O M T H E T WO - S P E E D R E COV E RY
DATA
This version of the World Economic Outlook (WEO) is available in full through the IMF eLibrary (wwwelibraryimforg) and the IMF website (wwwimforg) Accompanying the publication on the IMF website is a larger com-pilation of data from the WEO database than is included in the report itself including files containing the series most frequently requested by readers These files may be downloaded for use in a variety of software packages
The data appearing in the WEO are compiled by the IMF staff at the time of the WEO exercises The histori-cal data and projections are based on the information gathered by the IMF country desk officers in the context of their missions to IMF member countries and through their ongoing analysis of the evolving situation in each country Historical data are updated on a continual basis as more information becomes available and structural breaks in data are often adjusted to produce smooth series with the use of splicing and other techniques IMF staff estimates continue to serve as proxies for historical series when complete information is unavailable As a result WEO data can differ from those in other sources with official data including the IMFrsquos International Financial Statistics
The WEO data and metadata provided are ldquoas isrdquo and ldquoas availablerdquo and every effort is made to ensure their timeliness accuracy and completeness but these cannot be guaranteed When errors are discovered there is a concerted effort to correct them as appropriate and feasible Corrections and revisions made after publication are incorporated into the electronic editions available from the IMF eLibrary (wwwelibraryimforg) and on the IMF website (wwwimforg) All substantive changes are listed in detail in the online tables of contents
For details on the terms and conditions for usage of the WEO database please refer to the IMF Copyright and Usage website (wwwimforgexternaltermshtm)
Inquiries about the content of the WEO and the WEO database should be sent by mail fax or online forum (telephone inquiries cannot be accepted)
World Economic Studies DivisionResearch Department
International Monetary Fund700 19th Street NW
Washington DC 20431 USAFax (202) 623-6343
Online Forum wwwimforgweoforum
International Monetary Fund | October 2019 xiii
The analysis and projections contained in the World Economic Outlook are integral elements of the IMFrsquos surveillance of economic developments and policies in its member countries of developments in international financial markets and of the global economic system The survey of prospects and policies is the product of a comprehensive interdepartmental review of world economic developments which draws primarily on information the IMF staff gathers through its consultations with member countries These consultations are carried out in particular by the IMFrsquos area departmentsmdashnamely the African Department Asia and Pacific Department European Department Middle East and Central Asia Department and Western Hemisphere Departmentmdashtogether with the Strategy Policy and Review Department the Monetary and Capital Markets Department and the Fiscal Affairs Department
The analysis in this report was coordinated in the Research Department under the general direction of Gita Gopinath Economic Counsellor and Director of Research The project was directed by Gian Maria Milesi-Ferretti Deputy Director Research Department and Oya Celasun Division Chief Research Department
The primary contributors to this report were John Bluedorn Christian Bogmans Gabriele Ciminelli Romain Duval Davide Furceri Guzman Gonzales-Torres Fernandez Joao Jalles Zsoacuteka Koacuteczaacuten Toh Kuan Weicheng Lian Akito Matsumoto Giovanni Melina Malhar Nabar Natalija Novta Andrea Pescatori Cian Ruane and Yannick Timmer
Other contributors include Zidong An Hites Ahir Gavin Asdorian Srijoni Banerjee Carlos Caceres Luisa Calixto Benjamin Carton Diego Cerdeiro Luisa Charry Allan Dizioli Angela Espiritu William Gbohoui Jun Ge Mandy Hemmati Ava Yeabin Hong Youyou Huang Benjamin Hunt Sarma Jayanthi Yi Ji Christopher Johns Lama Kiyasseh W Raphael Lam Jungjin Lee Claire Mengyi Li Victor Lledo Rui Mano Susana Mursula Savannah Newman Cynthia Nyanchama Nyakeri Emory Oakes Rafael Portillo Evgenia Pugacheva Aneta Radzikowski Grey Ramos Adrian Robles Villamil Damiano Sandri Susie Xiaohui Sun Ariana Tayebi Nicholas Tong Julia Xueliang Wang Shan Wang Yarou Xu Yuan Zeng Qiaoqiao Zhang Huiyuan Zhao and Jillian Zirnhelt
Joseph Procopio from the Communications Department led the editorial team for the report with production and editorial support from Christine Ebrahimzadeh and editorial assistance from James Unwin Lucy Scott Morales and Vector Talent Resources
The analysis has benefited from comments and suggestions by staff members from other IMF departments as well as by Executive Directors following their discussion of the report on October 3 2019 However both projections and policy considerations are those of the IMF staff and should not be attributed to Executive Directors or to their national authorities
PREFACE
xiv International Monetary Fund | October 2019
WO R L D E CO N O M I C O U T LO O K T E N S I O N S F R O M T H E T WO - S P E E D R E COV E RY
The global economy is in a synchronized slowdown with growth for 2019 down-graded againmdashto 3 percentmdashits slowest pace since the global financial crisis This
is a serious climbdown from 38 percent in 2017 when the world was in a synchronized upswing This subdued growth is a consequence of rising trade barriers elevated uncertainty surrounding trade and geopolitics idiosyncratic factors causing macroeco-nomic strain in several emerging market economies and structural factors such as low productivity growth and aging demographics in advanced economies
Global growth in 2020 is projected to improve modestly to 34 percent a downward revision of 02 percent from our April projections However unlike the synchronized slowdown this recovery is not broad based and is precarious Growth for advanced economies is projected to slow to 17 percent in 2019 and 2020 while emerging market and developing economies are projected to experi-ence a growth pickup from 39 percent in 2019 to 46 percent in 2020 About half of this is driven by recoveries or shallower recessions in stressed emerging markets such as Turkey Argentina and Iran and the rest by recoveries in countries where growth slowed significantly in 2019 relative to 2018 such as Brazil Mexico India Russia and Saudi Arabia
A notable feature of the sluggish growth in 2019 is the sharp and geographically broad-based slowdown in manufacturing and global trade A few factors are driving this Higher tariffs and prolonged uncertainty surrounding trade policy have dented investment and demand for capital goods which are heavily traded The automobile industry is contracting owing also to idiosyncratic shocks such as disruptions from new emission standards in the euro area and China that have had durable effects Consequently trade volume growth in the first half of 2019 is at 1 percent the weakest level since 2012
In contrast to weak manufacturing and trade the services sector across much of the globe continues to hold up this has kept labor markets buoyant and wage growth healthy in advanced economies
The divergence between manufacturing and services has persisted for an atypically long duration which raises concerns of whether and when weakness in manufacturing may spill over into the services sector Some leading indicators such as new services orders have softened in the United States Germany and Japan while remaining robust in China
It is important to keep in mind that the subdued world growth of 3 percent is occurring at a time when monetary policy has significantly eased almost simul-taneously across advanced and emerging markets The absence of inflationary pressures has led major central banks to move preemptively to reduce downside risks to growth and to prevent de-anchoring of inflation expectations in turn supporting buoyant financial conditions In our assessment in the absence of such monetary stimulus global growth would be lower by 05 percentage points in both 2019 and 2020 This stimulus has therefore helped offset the negative impact of USndashChina trade tensions which is esti-mated to cumulatively reduce the level of global GDP in 2020 by 08 percent With central banks having to spend limited ammunition to offset policy mistakes they may have little left when the economy is in a tougher spot Fiscal stimulus in China and the United States have also helped counter the negative impact of the tariffs
Advanced economies continue to slow toward their long-term potential For the United States trade-related uncertainty has had negative effects on invest-ment but employment and consumption continue to be robust buoyed also by policy stimulus In the euro area growth has been downgraded due to weak exports while Brexit-related uncertainty continues to weaken growth in the United Kingdom Some of the biggest downward revisions for growth are for advanced economies in Asia including Hong Kong Special Administrative Region Korea and Singapore a common factor being their exposure to slowing growth in China and spillovers from USndashChina trade tensions
Growth in 2019 has been revised down across all large emerging market and developing economies
FOREWORD
F o R e Wo R D
linked in part to trade and domestic policy uncertain-ties In China the growth downgrade reflects not only escalating tariffs but also slowing domestic demand following needed measures to rein in debt In a few major economies including India Brazil Mexico Russia and South Africa growth in 2019 is sharply lower than in 2018 also for idiosyncratic reasons but is expected to recover in 2020
Growth in low-income developing countries remains robust though growth performance is more heterogenous within this group Robust growth is expected for noncommodity exporters such as Vietnam and Bangladesh while the performance of commodity exporters such as Nigeria is projected to remain lackluster
Downside risks to the outlook are elevated Trade barriers and heightened geopolitical tensions includ-ing Brexit-related risks could further disrupt sup-ply chains and hamper confidence investment and growth Such tensions as well as other domestic policy uncertainties could negatively affect the pro-jected growth pickup in emerging market economies and the euro area A realization of these risks could lead to an abrupt shift in risk sentiment and expose financial vulnerabilities built up over years of low interest rates Low inflation in advanced economies could become entrenched and constrain monetary policy space further into the future limiting its effec-tiveness The risks from climate change are playing out now and will dramatically escalate in the future if not urgently addressed
As policy priorities go undoing the trade barriers put in place with durable agreements and reining in geopolitical tensions top the list Such actions can significantly boost confidence rejuvenate investment halt the slide in trade and manufacturing and raise world growth In its absence and to fend off other risks to growth and raise potential output economic activity should be supported in a more balanced manner Monetary policy cannot be the only game in town and should be coupled with fiscal support where fiscal space is available and where policy is not already too expansionary A country like Germany should take advantage of negative borrowing rates to invest in social and infrastructure capital even from a pure cost-benefit perspective If growth were
to further deteriorate an internationally coordinated fiscal response tailored to country circumstances may be required
While monetary easing has supported growth it is important to ensure that financial risks do not build up As discussed in the October 2019 Global Financial Stability Report with interest rates expected to be ldquolow for longrdquo there is a significant risk of financial vulner-abilities growing which makes effective macropruden-tial regulation imperative
Countries should simultaneously undertake struc-tural reforms to raise productivity resilience and equity As Chapter 2 of this World Economic Outlook demonstrates reforms that raise human capital and improve labor and product market flexibility can help reverse a trend of growing divergence across regions within advanced economies that started in the late 1980s The evidence points to automationmdashnot trade shocksmdashas being behind the divergence in labor market performance across regions for the average advanced economy which requires prepar-ing the workforce for the future through appropriate skills training
Chapter 3 makes a strong case for a renewed struc-tural reform push in emerging market and develop-ing economies and low-income developing countries Structural reforms have slowed since the 2000s The chapter shows that the appropriate sequencing and timing of reforms matters as reforms deliver larger results during good times and when good governance is already in place
With a synchronized slowdown and uncertain recovery the global outlook remains precarious At 3 percent growth there is no room for policy mistakes and an urgent need for policymakers to cooperatively deescalate trade and geopolitical tensions Besides supporting growth such actions can also help catalyze needed cooperative solutions to improve the global trading system Moreover it is essential that countries continue to work together to address major issues such as climate change (the October 2019 Fiscal Monitor provides concrete solutions) international taxation corruption and cybersecurity
Gita GopinathEconomic Counsellor
International Monetary Fund | October 2019 xv
xvi International Monetary Fund | October 2019
WO R L D E CO N O M I C O U T LO O K T E N S I O N S F R O M T H E T WO - S P E E D R E COV E RY
EXECUTIVE SUMMARY
After slowing sharply in the last three quarters of 2018 the pace of global economic activity remains weak Momentum in manufacturing activity in particular has weakened substantially to levels not seen since the global financial crisis Rising trade and geopolitical ten-sions have increased uncertainty about the future of the global trading system and international cooperation more generally taking a toll on business confidence invest-ment decisions and global trade A notable shift toward increased monetary policy accommodationmdashthrough both action and communicationmdashhas cushioned the impact of these tensions on financial market sentiment and activity while a generally resilient service sector has supported employment growth That said the outlook remains precarious
Global growth is forecast at 30 percent for 2019 its lowest level since 2008ndash09 and a 03 percentage point downgrade from the April 2019 World Economic Outlook Growth is projected to pick up to 34 percent in 2020 (a 02 percentage point downward revision compared with April) reflecting primarily a projected improvement in economic performance in a number of emerging markets in Latin America the Middle East and emerging and developing Europe that are under macroeconomic strain Yet with uncertainty about pros-pects for several of these countries a projected slowdown in China and the United States and prominent down-side risks a much more subdued pace of global activity could well materialize To forestall such an outcome poli-cies should decisively aim at defusing trade tensions rein-vigorating multilateral cooperation and providing timely support to economic activity where needed To strengthen resilience policymakers should address financial vulner-abilities that pose risks to growth in the medium term Making growth more inclusive which is essential for securing better economic prospects for all should remain an overarching goal
After a sharp slowdown during the last three quarters of 2018 global growth stabilized at a weak pace in the first half of 2019 Trade tensions which had abated earlier in the year have risen again sharply resulting in significant tariff increases between the United States and China and hurting business
sentiment and confidence globally While financial market sentiment has been undermined by these developments a shift toward increased monetary policy accommodation in the United States and many other advanced and emerging market economies has been a counterbalancing force As a result financial conditions remain generally accommodative and in the case of advanced economies more so than in the spring
The world economy is projected to grow at 30 percent in 2019mdasha significant drop from 2017ndash18 for emerging market and developing econo-mies as well as advanced economiesmdashbefore recover-ing to 34 percent in 2020 A slightly higher growth rate is projected for 2021ndash24 This global growth pattern reflects a major downturn and projected recovery in a group of emerging market economies By contrast growth is expected to moderate into 2020 and beyond for a group of systemic economies comprising the United States euro area China and Japanmdashwhich together account for close to half of global GDP (Figure 1)
The groups of emerging market economies that have driven part of the projected decline in growth in 2019 and account for the bulk of the projected recovery in 2020 include those that have either been under severe strain or have underperformed relative to past averages In particular Argentina Iran Turkey Venezuela and smaller countries affected by conflict such as Libya and Yemen have been or continue to be experiencing very severe macroeconomic distress Other large emerging market economiesmdashBrazil Mexico Russia and Saudi Arabia among othersmdashare projected to grow in 2019 about 1 percent or less considerably below their historical averages In India growth softened in 2019 as corporate and environ-mental regulatory uncertainty together with concerns about the health of the nonbank financial sector weighed on demand The strengthening of growth in 2020 and beyond in India as well as for these two groups (which in some cases entails continued con-traction but at a less severe pace) is the driving factor behind the forecast of an eventual global pickup
e x e c u t I v e s uM Ma Ry
Growth has also weakened in China where the regulatory efforts needed to rein in debt and the mac-roeconomic consequences of increased trade tensions have taken a toll on aggregate demand Growth is pro-jected to continue to slow gradually in coming years reflecting a decline in the growth of the working-age population and gradual convergence in per capita incomes
Among advanced economies growth in 2019 is forecast to be considerably weaker than in 2017ndash18 in the euro area North America and smaller advanced Asian economies This lower growth reflects to an important extent a broad-based slowdown in industrial output resulting from weaker external demand (includ-ing from China) the widening global repercussions of trade tensions and increased uncertainty on confidence and investment and a notable slowdown in global car production which has been particularly significant for Germany Growth is forecast to remain broadly stable for the advanced economy group at 1frac34 percent in 2020 with a modest pickup in the euro area offsetting a gradual decline in US growth Over the medium term growth in advanced economies is projected
to remain subdued reflecting a moderate pace of productivity growth and slow labor force growth as populations age
The risks to this baseline outlook are significant As elaborated in the chapter should stress fail to dissipate in a few key emerging market and developing econo-mies that are currently underperforming or experi-encing severe strains global growth in 2020 would fall short of the baseline Further escalation of trade tensions and associated increases in policy uncertainty could weaken growth relative to the baseline projec-tion Financial market sentiment could deteriorate giving rise to a generalized risk-off episode that would imply tighter financial conditions especially for vulner-able economies Possible triggers for such an episode include worsening trade and geopolitical tensions a no-deal Brexit withdrawal of the United Kingdom from the European Union and persistently weak economic data pointing to a protracted slowdown in global growth Over the medium term increased trade barriers and higher trade and geopolitical tensions could take a toll on productivity growth includ-ing through the disruption of supply chains and the buildup in financial vulnerabilities could amplify the next downturn Finally unmitigated climate change could weaken prospects especially in vulnerable countries
At the multilateral level countries need to resolve trade disagreements cooperatively and roll back the recently imposed distortionary barriers Curbing greenhouse gas emissions and containing the associ-ated consequences of rising global temperatures and devastating climate events are urgent global impera-tives As Chapter 2 of the Fiscal Monitor argues higher carbon pricing should be the centerpiece of that effort complemented by efforts to foster the supply of low-carbon energy and the development and adoption of green technologies At the national level macroeconomic policies should seek to stabilize activity and strengthen the foundations for a recov-ery or continued growth Accommodative monetary policy remains appropriate to support demand and employment and guard against a downshift in infla-tion expectations As the resulting easier financial conditions could also contribute to a further buildup of financial vulnerabilities stronger macroprudential policies and a proactive supervisory approach will be critical to secure the strength of balance sheets and limit systemic risks
World Group of Four
Figure 1 GDP Growth World and Group of Four(Percent)
The global growth pattern reflects a major downturn and projected recovery in a group of emerging market economies By contrast growth is expected to moderate into 2020 and beyond for a group of systemic economies
Source IMF staff estimatesNote Group of Four = China euro area Japan United States
25
30
35
40
45
2011 12 13 14 15 16 17 18 19 20 21 22 23 24
International Monetary Fund | October 2019 xvii
W O R L D E C O N O M I C O U T L O O K G LO B A L M A N U FAC T U R I N G D OW N T U R N R IS I N G T R A D E B A R R I E R S
Considering the precarious outlook and large downside risks fiscal policy can play a more active role especially where the room to ease monetary policy is limited In countries where activity has weakened or could decelerate sharply fiscal stimulus can be provided if fiscal space exists and fiscal policy is not already overly expansionary In countries where fiscal consolidation is necessary its pace could be adjusted if market condi-tions permit to avoid prolonged economic weakness and disinflationary dynamics Low policy rates in many countries and the decline in long-term interest rates to historically very low or negative levels reduce the cost of debt service while these conditions persist Where debt
sustainability is not a problem the freed-up resources could be used to support activity as needed and to adopt measures to raise potential output such as infrastructure investment to address climate change
Across all economies the priority is to take actions that boost potential output growth improve inclusive-ness and strengthen resilience As the analysis pre-sented in Chapters 2 and 3 suggests structural policies for more open and flexible markets and improvements in governance can ease adjustment to shocks and boost output over the medium term helping to narrow within-country differences and encourage faster con-vergence across countries
xviii International Monetary Fund | October 2019
1International Monetary Fund | October 2019
Subdued Momentum Weak Trade and Industrial Production
Over the past year global growth has fallen sharply Among advanced economies the weakening has been broad based affecting major economies (the United States and especially the euro area) and smaller Asian advanced economies The slowdown in activity has been even more pronounced across emerging market and developing economies including Brazil China India Mexico and Russia as well as a few economies suffering macroeconomic and financial stress
One common feature of the weakening in growth momentum over the past 12 months has been a geo-graphically broad-based notable slowdown in indus-trial output driven by multiple and interrelated factors (Figure 11 panel 1) bull A sharp downturn in car production and sales which
saw global vehicle purchases decline by 3 percent in 2018 (Box 11) The automobile industry slump reflects both supply disruptions and demand influencesmdasha drop in demand after the expiration of tax incentives in China production lines adjusting to comply with new emission standards in the euro area (especially Germany) and China and possible prefer-ence shifts as consumers adopt a wait-and-see attitude with technology and emission standards changing rapidly in many countries as well as evolving car transportation and sharing options
bull Weak business confidence amid growing tensions between the United States and China on trade and technology As the reach of US tariffs and retaliation by trad-ing partners has steadily broadened since January 2018 the cost of some intermediate inputs has risen and uncertainty about future trade relation-ships has ratcheted up Manufacturing firms have become more cautious about long-range spending and have held back on equipment and machinery purchases This trend is most evident in the trade- and global-value-chain-exposed economies of east Asia In Germany and Japan industrial production was recently lower than one year ago while its growth slowed considerably in China and the United Kingdom and to some extent in the United States
(Figure 11 panel 2) The weakness appeared particu-larly pronounced in the production of capital goods1
bull A slowdown in demand in China driven by needed regulatory efforts to rein in debt and exacerbated by the macroeconomic consequences of increased trade tensions
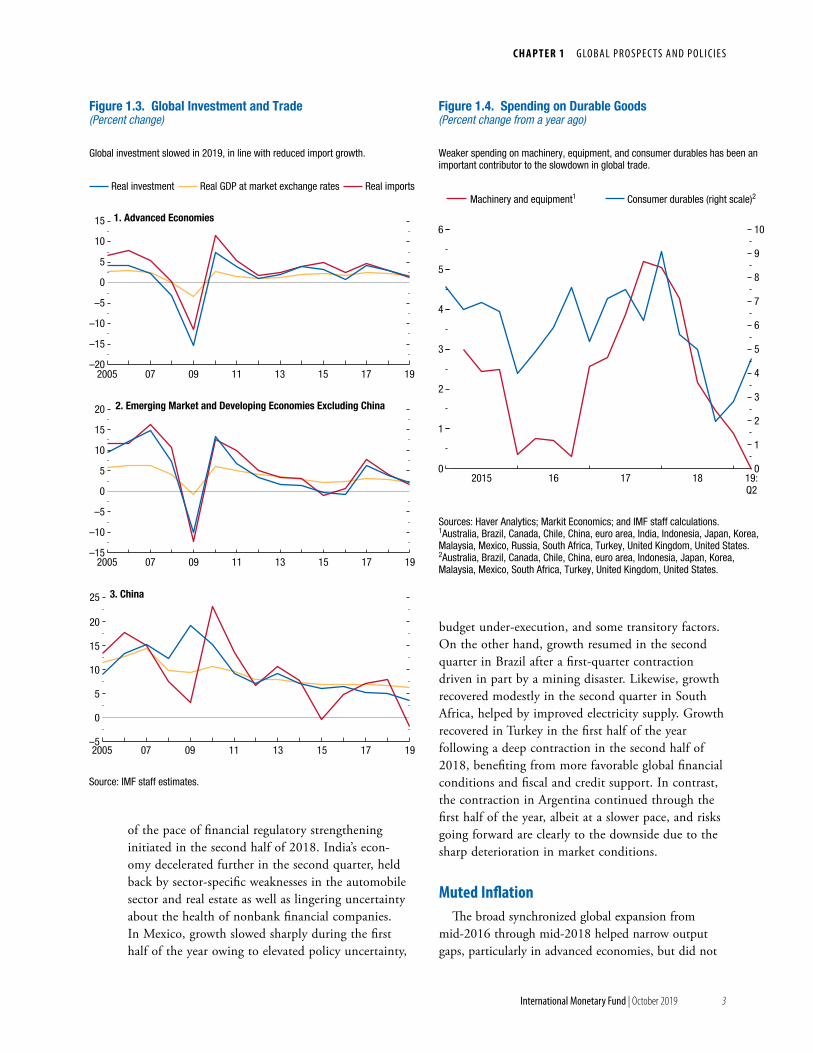
With the slowdown in industrial production trade growth has come to a near standstill In the first half of 2019 the volume of global trade stood just 1 percent above its value one year agomdashthe slowest pace of growth for any six-month period since 2012 From a geographical standpoint major contributors to the weakening in global imports were China and east Asia (both advanced and emerging) and emerging market economies under stress (Figure 12) Down-turns in global trade are related to reduced investment spendingmdashas was the case for instance in 2015ndash16 Investment is intensive in intermediate and capital goods that are heavily traded Global investment did indeed slow (Figure 13) in line with reduced import growth reflecting cyclical factors the steep downturn in investment in stressed economies and the impact of increased trade tensions on business sentiment in the manufacturing sector Another contributor to the slowdown in global trade has been the downturn in car production and sales which is reflected in a slowdown in purchases of consumer durables (Figure 14)
In Chinamdashthe country with the highest investment spending in the worldmdashthe slowdown in invest-ment in 2019 has been much more limited than the slowdown in imports similar to what happened in 2015ndash16 Factors contributing to import weakness (beyond domestic capital spending) include reduced export growth which is intensive in imports and a decline in demand for cars (Box 11) and technology products such as smartphones The front-loading of exports before tariffs were imposed in late 2018 likely also played a role by bringing forward demand for import components
1Global semiconductor sales declined in 2018 in part related to seeming market saturation in smartphones and fewer launches of new tech products more broadly (ECB 2019)
GLOBAL PROSPECTS AND POLICIES1CHAP
TER
2
W O R L D E C O N O M I C O U T L O O K G LO b a L M a N U FaC T U R I N G D OW N T U R N R Is I N G T R a D E b a R R I E R s
International Monetary Fund | October 2019
While manufacturing lost steam services (a larger share of the economy) broadly held firm (Figure 15 panel 1) Resilient services activity has meant steady aggregate employment creation which supported consumer confidence (Figure 15 panel 2) and in turn household spending on services This favorable feedback cycle between service sector output employment and consumer confi-dence has supported domestic demand in several advanced economies
Weakening GrowthGrowth in the advanced economy group stabilized
in the first half of 2019 after a sharp decline in the second half of 2018 The US economy shifted to a
somewhat slower pace of expansion (about 2 per-cent on an annualized basis) in the past few quarters as the boost from the tax cuts of early 2018 faded and the UK economy slowed with investment held back by Brexit-related uncertainty The euro area economy registered stronger growth in the first half of this year than in the second half of 2018 but the German economy contracted in the second quar-ter as industrial activity slumped In general weak exports have been a drag on activity in the euro area since early 2018 while domestic demand has so far stayed firm Japan posted strong growth in the first half of this year driven by robust private and public consumption
Preliminary data suggest a modest pickup in growth in the first half of 2019 for the emerging market and developing economy group but well below its pace in 2017 and early 2018 Chinarsquos growth was lifted by fiscal stimulus and some easing
Industrial productionWorld trade volumesManufacturing PMI New orders
United StatesUnited KingdomGermany
JapanChina (right scale)Euro area 41
Figure 11 Global Activity Indicators(Three-month moving average year-over-year percent change unlessnoted otherwise)
Over the past 12 months there has been a geographically broad-based notable slowdown in industrial output
Sources CPB Netherlands Bureau for Economic Policy Analysis Haver Analytics Markit Economics and IMF staff calculationsNote PMI = purchasing managersrsquo index1Euro area 4 comprises France Italy the Netherlands and Spain
ndash5
0
5
10
50
55
60
65
70
75
2015 16 17 18
ndash1
0
1
2
3
4
5
6
7
8
2015 16 17 18 Aug19
Aug19
1 World Trade Industrial Production and Manufacturing PMI(Deviations from 50 for manufacturing PMI)
2 Industrial Production(Three-month moving average year-over-year percent change)
USA and CAN China Euro areaOther EMDEs United Kingdom Rest of worldEast Asia excluding China
In the first half of 2019 the volume of global trade stood just 1 percent above its value one year agomdashthe slowest pace of growth for any six-month period since 2012
Source IMF staff calculationsNote CAN = Canada EMDEs = emerging market and developing economies USA = United States
Figure 12 Contribution to Global Imports(Percentage points three-month moving average)
ndash2
ndash1
0
1
2
3
4
5
6
7
Jan2018
Apr18
Jul18
Oct18
Jan19
Apr19
Jun19
3
C H A P T E R 1 G LO b a L P R O s P E C Ts a N D P O L I C I E s
International Monetary Fund | October 2019
of the pace of financial regulatory strengthening initiated in the second half of 2018 Indiarsquos econ-omy decelerated further in the second quarter held back by sector-specific weaknesses in the automobile sector and real estate as well as lingering uncertainty about the health of nonbank financial companies In Mexico growth slowed sharply during the first half of the year owing to elevated policy uncertainty
budget under-execution and some transitory factors On the other hand growth resumed in the second quarter in Brazil after a first-quarter contraction driven in part by a mining disaster Likewise growth recovered modestly in the second quarter in South Africa helped by improved electricity supply Growth recovered in Turkey in the first half of the year following a deep contraction in the second half of 2018 benefiting from more favorable global financial conditions and fiscal and credit support In contrast the contraction in Argentina continued through the first half of the year albeit at a slower pace and risks going forward are clearly to the downside due to the sharp deterioration in market conditions
Muted InflationThe broad synchronized global expansion from
mid-2016 through mid-2018 helped narrow output gaps particularly in advanced economies but did not
Real investment Real GDP at market exchange rates Real imports
0
5
ndash20
ndash15
ndash10
ndash5
10
15
2005 07 09 11 13 15 17 19
1 Advanced Economies
ndash5
0
5
10
15
20
25
2005 07 09 11 13 15 17 19
3 China
ndash15
ndash10
ndash5
0
5
10
15
20
2005 07 09 11 13 15 17 19
2 Emerging Market and Developing Economies Excluding China
Source IMF staff estimates
Global investment slowed in 2019 in line with reduced import growth
Figure 13 Global Investment and Trade(Percent change)
Machinery and equipment1 Consumer durables (right scale)2
Sources Haver Analytics Markit Economics and IMF staff calculations1Australia Brazil Canada Chile China euro area India Indonesia Japan Korea Malaysia Mexico Russia South Africa Turkey United Kingdom United States2Australia Brazil Canada Chile China euro area Indonesia Japan Korea Malaysia Mexico South Africa Turkey United Kingdom United States
Weaker spending on machinery equipment and consumer durables has been an important contributor to the slowdown in global trade
0
6
1
2
3
4
5
0
1
2
3
4
5
6
7
8
9
10
2015 16 17 18 19Q2
Figure 14 Spending on Durable Goods(Percent change from a year ago)
4
W O R L D E C O N O M I C O U T L O O K G LO b a L M a N U FaC T U R I N G D OW N T U R N R Is I N G T R a D E b a R R I E R s
International Monetary Fund | October 2019
generate sustained increases in core consumer price inflation Not surprisingly as the global expansion has weakened core inflation has slid further below target across advanced economies and below historical averages in many emerging market and developing economies (Figure 16) The few exceptions to this broad pattern of softening are economies where large currency depreciations have fed through to higher domestic price pressure (such as in Argentina) or where there are acute shortages of essential goods (Venezuela)
Despite higher import tariffs in some countries cost pressures have generally remained subdued Wage growth has inched up from modest levels as unem-ployment rates have dropped further (close to record lows for example in the United States and the United Kingdom) (Figure 17 panel 1) The labor share of
Advanced economies1
Emerging market economies2
World
Manufacturing Services
While manufacturing lost steam services broadly held firm
Sources Haver Analytics Markit Economics and IMF staff calculations1Australia Czech Republic Denmark euro area Hong Kong SAR Israel Japan Korea Norway Sweden Switzerland Taiwan Province of China United Kingdom United States2Argentina Brazil Chile China Colombia Hungary Indonesia Malaysia Mexico Philippines Poland Russia South Africa Thailand Turkey Ukraine
2 Consumer Confidence(Index 2015 = 100)
48
50
52
54
56
96
98
100
102
104
106
108
110
112
2015 16 17 18 Aug19
Jun2017
Sep17
Dec17
Mar18
Jun18
Sep18
Dec18
Mar19
Aug19
1 Global Manufacturing and Services PMI(Index greater than 50 = expansion)
Figure 15 Global Purchasing Managersrsquo Index and Consumer Confidence
Consumer price inflation Core consumer price inflation
AE core goods AE core services2002ndash08 average 2011ndash17 average
ndash1
0
1
2
3
4
2003 04 05 06 07 08 09 10 11 12 13 14 15 16 17 18 Aug19
ndash2
ndash1
0
1
2
3
2015 16 17 18 Jul19
1
2
3
4
5
6
2015 16 17 18 Jul19
Sources Consensus Economics Haver Analytics and IMF staff calculationsNote Country lists use International Organization for Standardization (ISO) country codes1Advanced economies are AUT BEL CAN CHE CZE DEU DNK ESP EST FIN FRA GBR GRC HKG IRL ISR ITA JPN KOR LTU LUX LVA NLD NOR PRT SGP SVK SVN SWE TWN USA2Emerging market and developing economies are BGR BRA CHL CHN COL HUN IDN IND MEX MYS PER PHL POL ROU RUS THA TUR ZAF3Sample comprises 16 advanced economies (AE) Australia Austria Canada Denmark Finland France Germany Italy Japan Netherlands Norway Portugal Spain Sweden United Kingdom and United States
2 Emerging Market and Developing Economies2
3 Advanced Economy Core Goods and Core Services Consumer PriceInflation3
(Year over year percent)
1 Advanced Economies1
Figure 16 Global Inflation(Three-month moving average annualized percent change unless noted otherwise)
Since mid-2018 core inflation has slid further below target across advanced economies and below historical averages in many emerging market and developing economies
5
C H A P T E R 1 G LO b a L P R O s P E C Ts a N D P O L I C I E s
International Monetary Fund | October 2019
income has been on a gentle upward trend since around 2014 in Japan the United Kingdom and the United States and has increased in the euro area since early 2018 (Figure 17 panel 2) These developments appear not to have passed through to core consumer price inflation suggesting some modest compression of firmsrsquo profit margins In the emerging and developing Europe region labor shortages have contributed to robust wage growth in many economies Nonetheless as discussed in Chapter 2 of the Regional Economic Outlook for Europe wage growth has not transmitted to rising final goods price inflation across the region (Turkeyrsquos relatively high inflation can be attributed to other drivers including past currency depreciation)
Energy prices declined by 13 percent between the reference periods for the April 2019 and current World Economic Outlook (WEO) as record-high US crude oil production together with soft demand outweighed the influence of supply shortfalls related to US sanctions on Iran producer cuts by the Organization for the Petro-leum Exporting Countries and strife in Venezuela and
Libya (Figure 18) The September 14 attack on key oil refining facilities in Saudi Arabia threatened severe supply disruptions causing crude oil prices to spike by more than 10 percent in the immediate aftermath Prices sub-sequently retreated somewhat on reports of less damage than initially feared Coal and natural gas prices also declined between the reference periods as a result of weak demand prospects Metal prices remained broadly flat with declines in copper and aluminum prices offsetting increases in those for nickel and iron ore between the two reference periods (see the Commodities Special Feature)
Overall low core inflation readings and sub-dued impulses from commodity prices to headline inflation have led to declines in market pricing of expected inflation especially in the United States and the euro area
Volatile Market Sentiment Monetary Policy Easing
Market sentiment has been volatile since April reflecting multiple influences that include additional US tariffs on Chinese imports and retaliation by
Unit labor costCompensation
United States JapanEuro areaUnited Kingdom
1 Unit Labor Cost and Compensation 2019H1(Percent change from one year ago)
2 Labor Share(2007 = 100)
Sources Haver Analytics and IMF staff calculations
United States Euro area Japan
2007 08 09 10 11 12 13 14 15 16 17 18 19Q2
0
106
104
102
100
98
96
1
2
3
4
5
Figure 17 Wages Unit Labor Costs and Labor Shares
Wage growth and the labor share of income have increased recently in some advanced economies
Average petroleum spot price Food Metals
Figure 18 Commodity Prices(Deflated using US consumer price index 2014 = 100)
Commodity price indices have generally softened since the spring
Sources IMF Primary Commodity Price System and IMF staff calculations
120
110
90
80
70
60
50
40
100
302014 15 16 17 18 Aug
19
6
W O R L D E C O N O M I C O U T L O O K G LO b a L M a N U FaC T U R I N G D OW N T U R N R Is I N G T R a D E b a R R I E R s
International Monetary Fund | October 2019
China fears of disruptions to technology supply chains prolonged uncertainty on Brexit geopolitical strains and policy rate cuts and dovish communication by several central banks The net effect of these forces is that financial conditions across advanced econo-mies are now generally easier than at the time of the April 2019 WEO but they are broadly unchanged across most emerging market and developing econo-mies (see the October 2019 Global Financial Stability Report (GFSR))
Among advanced economies major central banks have turned more accommodative with a dovish shift in communications earlier in the year followed by easing actions during the summer The US Fed-eral Reserve cut the Federal Funds rate in July and September and ended its balance sheet reduction In September the European Central Bank reduced its deposit rate and announced a resumption of quan-titative easing These policy shifts together with rising market concerns of slower growth momentum contributed to sizable declines in sovereign bond yieldsmdashin some cases deep into negative territory (Figure 19) Yields on 10-year US Treasury notes UK gilts German bunds and French securities for example dropped between 60 and 100 basis points from March to late September while yields on Italian 10-year bonds declined by 175 basis points on the formation of a new government Prices of riskier securities have been volatile Credit spreads on US and euro area high-yield corporate securities have widened marginally since April but remain below their levels in late 2018 Equity markets in the United States and Europe have lost some ground since April but are still well above the lows during the sell-off at the end of 2018
Currency movements for advanced economies have been notable in some cases In real effective terms the yen appreciated by more than 5 percent and the Swiss franc by 3 percent between March and late September as market volatility spiked In contrast the British pound has depreciated by 4 percent on increased concern about a no-deal Brexit The US dollar has strengthened by about 2frac12 percent whereas the euro has depreciated by about 1frac12 percent Financial flows to and from advanced economies have remained generally subdued especially since early 2018 One factor explaining these develop-ments is the notable decline in foreign direct investment flows which have been affected by financial operations of multinational corporations following tax reform in the United States (Box 12)
United States JapanGermany Italy
TOPIXEuro StoxxMSCI Emerging Market
SampP 500
JapanUnited StatesUnited KingdomGermanyItaly
Mar 21 2018Sep 17 2018Mar 22 2019Sep 30 2019
United StatesEuro areaUnited Kingdom
Sovereign bond yields have declined notably in recent months in some cases deep into negative territory
Figure 19 Advanced Economies Monetary and Financial Market Conditions(Percent unless noted otherwise)
Sources Bloomberg Finance LP Haver Analytics Thomson Reuters Datastream and IMF staff calculationsNote MSCI = Morgan Stanley Capital International SampP = Standard amp Poorrsquos TOPIX = Tokyo Stock Price Index WEO = World Economic Outlook1Expectations are based on the federal funds rate futures for the United States the sterling overnight interbank average rate for the United Kingdom and the euro interbank offered forward rate for the euro area updated September 30 20192Data are through September 27 2019
ndash1
0
1
2
3
4
5
6
7
8
2019 20 21
10
15
20
25
30
35
020406080
100120140160180200220
ndash1
0
1
2
3
4
5
6
00
05
10
15
20
25
30
35
2018 19 20 21 Sep22
Sep22
2015 16 17 18 Sep19
2015 16 17 18 Sep19
2015 16 17 18 Sep19
2015 16 17 18 Sep19
0
200
400
600
800
1000
6 Price-to-Earnings Ratios25 Equity Markets2
(Index 2007 = 100)
3 Ten-Year Government BondYields2
4 Credit Spreads2
(Basis points)
US high yield
Euro high yieldUS high grade
Euro high grade
2 Policy Rate Expectations1
(Dashed lines arefrom the April 2019WEO)
1 US Policy RateExpectations1
7
C H A P T E R 1 G LO b a L P R O s P E C Ts a N D P O L I C I E s
International Monetary Fund | October 2019
Among emerging market and developing economies central banks in several countries (for example Brazil Chile India Indonesia Mexico Peru Philippines Russia South Africa Thailand and Turkey) have cut policy rates since April Sovereign spreads have been broadly stable over this period with a few exceptions (Figure 110) Spreads narrowed in Brazil on growing optimism that the long-awaited pension reform would be enacted Mexicorsquos sovereign spreads widened temporarily following a credit rating downgrade in June Meanwhile in Argentina the primary elections in August triggered a sharp increase in government bond yields amid a wider sell-off in Argentine assets In Turkey spreads decom-pressed significantly following municipal elections in June and are still wider than in April Emerging market equity indices are broadly trading at April levels which reflects offsetting influences on earnings prospects from increased domestic and external monetary policy support and intensifying trade tensions (Figure 111)
Capital flows to emerging market economies have reflected the broader shifts in risk sentiment since April with investors lowering their exposure to equities and rotating toward hard currency bonds (Figure 112) Portfolio flows into the emerging market asset class remain stronger overall than during the retrenchment of late 2018 investors continue to differentiate across individual economies based on economic and political fundamentals Most currencies appreciated between March and July helped by the US Federal Reserversquos dovish communications and move toward a more accommodative stance But several currencies lost ground in August with the deterioration in risk sentiment particularly the Argentine peso The Chinese renminbi has depreciated by about 3frac12 percent since March (Figure 113)
Global Growth Outlook Modest Pickup amid Difficult Headwinds
Projected growth for 2019 at 30 percent is the weakest since 2009 Except in sub-Saharan Africa more than half of countries are expected to register per capita growth lower than their median rate during the past 25 years The marked deceleration reflects carryover from broad-based weakness in the second half of 2018 followed by a mild growth uptick in the first half of 2019 and supported in some cases by more accommodative policy stances (such as in China and to some extent the United States) With growth estimates for both the second half of 2018 and the
China Brazil TurkeyMexico Argentina (right scale)
April 2019 versus April 2018Latest versus April 2019
ndash100
0
100
200
300
400
500
600
ARGBRA
CHLCHN
COLEGY
HUNIDN
INDMAR
MYSMEX
PERPHL
POLROU
RUSTUR
TUNZAF
0
5
10
15
20
25
10
20
30
40
50
60
70
80
2015 16 17 18 Sep19
4 Current Account Balance and Change in EMBI Spreads
2
6
10
14
18
22
Sep19
2015 16 17 18
ndash100
0
100
200
300
400
ndash12 ndash10 ndash8 ndash6 ndash4 ndash2 0 2 4
TUN
HUN
MARPER
CHL
ROU
COL
ZAF
PHL
ARG(1771)
ARG(1357)
MYS
POL
EGY
TUR MEXBRAIDN
RUS
IND
CHN
Chan
ge in
EM
BI s
prea
d(b
asis
poi
nts
Apr
16
201
8ndashSe
p 2
7 2
019)
Current account 2017 (percent of GDP)
y = ndash4618x + 32862R2 = 01382
Sources Haver Analytics IMF International Financial Statistics Thomson ReutersDatastream and IMF staff calculationsNote EMBI = JP Morgan Emerging Markets Bond Index All financial market data are through September 27 2019 Data labels use International Organization for Standardization (ISO) country codes
1 Policy Rate(Percent)
3 Change in EMBI Spreads(Basis points)
2 Ten-Year Government Bond Yields(Percent)
Figure 110 Emerging Market Economies Interest Rates and Spreads
Barring a few cases emerging market sovereign spreads have been broadly stable since April
8
W O R L D E C O N O M I C O U T L O O K G LO b a L M a N U FaC T U R I N G D OW N T U R N R Is I N G T R a D E b a R R I E R s
International Monetary Fund | October 2019
ArgentinaBrazilMexicoRussia
ChinaEmerging Asiaexcluding China
South AfricaTurkey
CHNMYS
BRA CHNIND MEX
COL IDNMYS RUSTUR
BRA COLIDN INDMEX RUSTUR
1 2
Equity Markets(Index 2015 = 100)
Figure 111 Emerging Market Economies Equity Markets and Credit
Emerging market equity indices are broadly trading at April levels which reflects offsetting influences on earnings prospects from increased domestic and external monetary policy support and intensifying trade tensions
Sources Bloomberg Finance LP Haver Analytics IMF International Financial Statistics (IFS) Thomson Reuters Datastream and IMF staff calculationsNote Data labels use International Organization for Standardization (ISO) country codes1Credit is other depository corporationsrsquo claims on the private sector (from IFS) except in the case of Brazil for which private sector credit is from the Monetary Policy and Financial System Credit Operations published by Banco Central do Brasil and China for which credit is total social financing after adjusting for local government debt swaps
2015 16 17 18 Aug19
2015 16 17 18 Aug19
150
60
70
80
90
100
110
120
130
140
180
70
9080
100110120130140150160170
Real Credit Growth1
(Year-over-year percent change)
ndash15
ndash10
ndash5
0
5
10
15
20
25
ndash15
ndash10
ndash5
0
5
10
15
20
2015 16 17 18 Jul19
2015 16 17 18 Jul19
80
100
120
140
160
180
200
220
240
260
Credit-to-GDP Ratio1
(Percent)
4
15
25
35
45
55
65
75
85
2006 08 10 12 14 16 19Q2
2006 08 10 12 14 16 19Q2
5 6
3
Bond EM-VXYEquity
Emerging EuropeEmerging Asia excluding ChinaLatin America
Emerging EuropeEmerging Asia excluding ChinaLatin America
ChinaSaudi Arabia
Total
ChinaSaudi Arabia
Total
Emerging EuropeEmerging Asia excluding ChinaLatin America
ChinaSaudi Arabia
Total
Sep19
19Q2
19Q2
19Q2
Sources EPFR Global Haver Analytics IMF International Financial Statistics Thomson Reuters Datastream and IMF staff calculationsNote Capital inflows are net purchases of domestic assets by nonresidents Capital outflows are net purchases of foreign assets by domestic residents Emerging Asia excluding China comprises India Indonesia Malaysia the Philippines and Thailand emerging Europe comprises Poland Romania Russia and Turkey Latin America comprises Brazil Chile Colombia Mexico and Peru ECB = European Central Bank EM-VXY = JP Morgan Emerging Market Volatility Index LTROs = long-term refinancing operations
1 Net Flows in Emerging Market Funds(Billions of US dollars)
2 Capital Inflows(Percent of GDP)
4 Change in Reserves(Percent of GDP)
3 Capital Outflows Excluding Change in Reserves(Percent of GDP)
ndash6
ndash3
0
3
6
9
12
15
2007 08 09 10 11 12 13 14 15 16 17 18
ndash40ndash30ndash20ndash10
010203040
2010 11 12 13 14 15 16 17 18
Figure 112 Emerging Market Economies Capital Flows
Tapertantrum
Greekcrisis Irish
crisis
1st ECBLTROs
ndash6
ndash3
0
3
6
9
12
15
2007 08 09 10 11 12 13 14 15 16 17 18
ndash6
ndash3
0
3
6
9
12
15
2007 08 09 10 11 12 13 14 15 16 17 18
China equitymarket sell-off
US presidentialelection
Capital flows to emerging market economies have reflected the broader shifts in risk sentiment since April with investors lowering their exposure to equities and rotating toward hard currency bonds
9
C H A P T E R 1 G LO b a L P R O s P E C Ts a N D P O L I C I E s
International Monetary Fund | October 2019
first half of this year marked down the 2019 growth projection is 03 percentage point weaker than in the April 2019 WEO
The forces behind the slowdown in global growth during 2018ndash19mdashapart from the direct effect of very weak growth or contractions in stressed economiesmdashinclude a return to a more normal pace of expansion in the US economy softer external demand and disrup-tions associated with the rollout of new car emission standards in Europe especially Germany weaker mac-roeconomic conditions largely because of idiosyncratic factors in a group of key emerging market economies such as Brazil Mexico and Russia a softening in
Chinarsquos growth because of necessary financial regula-tory strengthening and drag from trade tensions with the United States slowing demand from China and broader global trade policy uncertainty weighing on east Asian economies a slowdown in domestic demand in India and the shadow cast by the possibility of a no-deal Brexit on the United Kingdom and the European Union more broadly
Continued macroeconomic policy support in major economies and projected stabilization in some stressed emerging market economies are expected to lift global growth modestly over the remainder of 2019 and into 2020 bringing projected global growth to 34 percent for 2020 (Table 11) The forecast markdown of 02 percentage point for 2020 relative to the April 2019 WEO largely reflects the fact that tariffs have risen and are costing the global economy following tariff announcements in May and August 2019 the average US tariff on imports from China will rise to just over 24 percent by December 2019 (compared with about 12frac14 percent assumed in the April 2019 WEO) while the average China tariff on imports from the United States will increase to about 26 percent (compared with about 16frac12 percent assumed in the April 2019 WEO) Scenario Box 12 provides simula-tions of the direct impact of the tariffs included in the baseline on global economic activity as well as their potential repercussions for financial market sentiment business confidence and productivity As Scenario Box 12 illustrates trade diversion spillovers for some economies while positive are temporary and are likely outweighed by business confidence and financial market sentiment effects Box 13 provides more details on the key policy and commodity price assumptions behind the global growth forecast
Figure 114 illustrates the countries and regions where growth fluctuations have affected changes in world growth since its peak in 2017 The dramatic worsening of macroeconomic conditions between 2017 and 2019 in a small number of economies under severe distress (in particular Argentina Iran Turkey and Venezuela) accounts for about half of the decline in world growth from 38 percent in 2017 to 30 percent in 2019 These same economiesmdashtogether with Brazil Mexico and Russia all three of which are expected to grow by about 1 percent or less in 2019mdashaccount for over 70 percent of the pickup in growth for 2020 Argentinarsquos economy is projected to contract again in 2020 but by less than this year and in Venezuela the multiyear collapse in output is projected to continue
Latest versus July 2019 July 2019 versus March 2019
ndash8
ndash6
ndash4
ndash2
0
2
4
6
USA EA JPN GBR SWE CHE KOR TWN SGP CAN NOR AUS NZL
ndash24
ndash20
ndash16
ndash12
ndash8
ndash4
0
4
8
12
ZAFCHN
INDIDN
MYSPHL
THAHUN
POLRUS
TURARG
BRACHL
COLMEX
PERPAK
2 Emerging Market Economies
1 Advanced Economies
Most emerging market currencies appreciated between March and July helped by the US Federal Reserversquos dovish communications and move toward a more accommodative stance But several currencies lost ground in August with the deterioration in risk sentiment
Source IMF staff calculationsNote EA = euro area Data labels use International Organization for Standardization (ISO) country codes Latest data available are for September 27 2019
Figure 113 Real Effective Exchange Rate Changes March 2019ndashSeptember 2019(Percent)
10
W O R L D E C O N O M I C O U T L O O K G LO b a L M a N U FaC T U R I N G D OW N T U R N R Is I N G T R a D E b a R R I E R s
International Monetary Fund | October 2019
Table 11 Overview of the World Economic Outlook Projections(Percent change unless noted otherwise)
2018Projections
Difference from July 2019 WEO Update1
Difference from April 2019 WEO1
2019 2020 2019 2020 2019 2020World Output 36 30 34 ndash02 ndash01 ndash03 ndash02
Advanced Economies 23 17 17 ndash02 00 ndash01 00United States 29 24 21 ndash02 02 01 02Euro Area 19 12 14 ndash01 ndash02 ndash01 ndash01
Germany2 15 05 12 ndash02 ndash05 ndash03 ndash02France 17 12 13 ndash01 ndash01 ndash01 ndash01Italy 09 00 05 ndash01 ndash03 ndash01 ndash04Spain 26 22 18 ndash01 ndash01 01 ndash01
Japan 08 09 05 00 01 ndash01 00United Kingdom 14 12 14 ndash01 00 00 00Canada 19 15 18 00 ndash01 00 ndash01Other Advanced Economies3 26 16 20 ndash05 ndash04 ndash06 ndash05
Emerging Market and Developing Economies 45 39 46 ndash02 ndash01 ndash05 ndash02Emerging and Developing Asia 64 59 60 ndash03 ndash02 ndash04 ndash03
China 66 61 58 ndash01 ndash02 ndash02 ndash03India4 68 61 70 ndash09 ndash02 ndash12 ndash05ASEAN-55 52 48 49 ndash02 ndash02 ndash03 ndash03
Emerging and Developing Europe 31 18 25 06 04 06 02Russia 23 11 19 ndash01 00 ndash05 02
Latin America and the Caribbean 10 02 18 ndash04 ndash05 ndash12 ndash06Brazil 11 09 20 01 ndash04 ndash12 ndash05Mexico 20 04 13 ndash05 ndash06 ndash12 ndash06
Middle East and Central Asia 19 09 29 ndash05 ndash03 ndash09 ndash04Saudi Arabia 24 02 22 ndash17 ndash08 ndash16 01
Sub-Saharan Africa 32 32 36 ndash02 00 ndash03 ndash01Nigeria 19 23 25 00 ndash01 02 00South Africa 08 07 11 00 00 ndash05 ndash04
MemorandumEuropean Union 22 15 16 ndash01 ndash02 ndash01 ndash01Low-Income Developing Countries 50 50 51 01 00 00 00Middle East and North Africa 11 01 27 ndash06 ndash04 ndash12 ndash05World Growth Based on Market Exchange Rates 31 25 27 ndash02 ndash02 ndash02 ndash02
World Trade Volume (goods and services) 36 11 32 ndash14 ndash05 ndash23 ndash07Imports
Advanced Economies 30 12 27 ndash10 ndash06 ndash18 ndash05Emerging Market and Developing Economies 51 07 43 ndash22 ndash08 ndash39 ndash10
ExportsAdvanced Economies 31 09 25 ndash13 ndash04 ndash18 ndash06Emerging Market and Developing Economies 39 19 41 ndash10 ndash05 ndash21 ndash07
Commodity Prices (US dollars)Oil6 294 ndash96 ndash62 ndash55 ndash37 38 ndash60Nonfuel (average based on world commodity import
weights) 16 09 17 15 12 11 06
Consumer PricesAdvanced Economies 20 15 18 ndash01 ndash02 ndash01 ndash03Emerging Market and Developing Economies7 48 47 48 ndash01 01 ndash02 01
London Interbank Offered Rate (percent) On US Dollar Deposits (six month) 25 23 20 ndash01 ndash03 ndash09 ndash18On Euro Deposits (three month) ndash03 ndash04 ndash06 ndash01 ndash03 ndash01 ndash04On Japanese Yen Deposits (six month) 00 00 ndash01 00 ndash01 00 ndash01Note Real effective exchange rates are assumed to remain constant at the levels prevailing during July 26ndashAugust 23 2019 Economies are listed on the basis of economic size The aggregated quarterly data are seasonally adjusted WEO = World Economic Outlook Beginning with the October 2019 WEO the regional group Commonwealth of Independent States (CIS) is discontinued Four of the CIS economies (Belarus Moldova Russia and Ukraine) are added to the regional group Emerging and Developing Europe The remaining eight economiesmdashArmenia Azerbaijan Georgia Kazakhstan Kyrgyz Republic Tajikistan Turkmenistan and Uzbekistan which comprise the regional subgroup Caucasus and Central Asia (CCA)mdashare combined with Middle East North Africa Afghanistan and Pakistan (MENAP) to form the new regional group Middle East and Central Asia (MECA)1Difference based on rounded figures for the current (July 2019) WEO Update and April 2019 WEO forecasts and on revised and new groups2For Germany the definition of GDP has been changed from a working-day-adjusted basis (through the April 2019 WEO) to an unadjusted basis from the July 2019 WEO Update onward The change in definition implies a higher level of GDP for 2020 which is a leap year3Excludes the Group of Seven (Canada France Germany Italy Japan United Kingdom United States) and euro area countries
11
C H A P T E R 1 G LO b a L P R O s P E C Ts a N D P O L I C I E s
International Monetary Fund | October 2019
Table 11 (continued)
Year over Year Q4 over Q48
Projections
Projections
2017 2018 2019 2020 2017 2018 2019 2020World Output 38 36 30 34 41 32 32 34
Advanced Economies 25 23 17 17 28 18 16 18United States 24 29 24 21 28 25 24 20Euro Area 25 19 12 14 30 12 10 18
Germany2 25 15 05 12 34 06 04 13France 23 17 12 13 30 12 10 13Italy 17 09 00 05 17 00 02 10Spain 30 26 22 18 31 23 20 18
Japan 19 08 09 05 24 03 03 12United Kingdom 18 14 12 14 16 14 10 16Canada 30 19 15 18 29 16 18 17Other Advanced Economies3 29 26 16 20 30 22 17 21
Emerging Market and Developing Economies 48 45 39 46 52 45 45 47Emerging and Developing Asia 66 64 59 60 68 60 60 59
China 68 66 61 58 67 64 60 57India4 72 68 61 70 81 58 67 72ASEAN-55 53 52 48 49 54 52 48 49
Emerging and Developing Europe 39 31 18 25 Russia 16 23 11 19 05 29 18 12
Latin America and the Caribbean 12 10 02 18 13 03 04 18Brazil 11 11 09 20 22 11 12 23Mexico 21 20 04 13 15 16 10 07
Middle East and Central Asia 23 19 09 29 Saudi Arabia ndash07 24 02 22 ndash13 43 ndash09 30
Sub-Saharan Africa 30 32 32 36 Nigeria 08 19 23 25 South Africa 14 08 07 11 22 02 08 06
MemorandumEuropean Union 28 22 15 16 30 17 13 18Low-Income Developing Countries 47 50 50 51 Middle East and North Africa 18 11 01 27 World Growth Based on Market Exchange Rates 32 31 25 27 35 26 25 28
World Trade Volume (goods and services) 57 36 11 32 Imports
Advanced Economies 47 30 12 27 Emerging Market and Developing Economies 75 51 07 43
ExportsAdvanced Economies 47 31 09 25 Emerging Market and Developing Economies 73 39 19 41
Commodity Prices (US dollars)Oil6 233 294 ndash96 ndash62 196 95 ndash38 ndash88Nonfuel (average based on world commodity export weights) 64 16 09 17 35 ndash18 49 ndash10
Consumer PricesAdvanced Economies 17 20 15 18 17 19 17 16Emerging Market and Developing Economies7 43 48 47 48 37 42 41 40
London Interbank Offered Rate (percent) On US Dollar Deposits (six month) 15 25 23 20 On Euro Deposits (three month) ndash03 ndash03 ndash04 ndash06 On Japanese Yen Deposits (six month) 00 00 00 ndash01 4For India data and forecasts are presented on a fiscal year basis and GDP from 2011 onward is based on GDP at market prices with fiscal year 201112 as a base year5Indonesia Malaysia Philippines Thailand Vietnam6Simple average of prices of UK Brent Dubai Fateh and West Texas Intermediate crude oil The average price of oil in US dollars a barrel was $6833 in 2018 the assumed price based on futures markets is $6178 in 2019 and $5794 in 20207Excludes Venezuela See country-specific note for Venezuela in the ldquoCountry Notesrdquo section of the Statistical Appendix8For World Output the quarterly estimates and projections account for approximately 90 percent of annual world output at purchasing-power-parity weights For Emerging Market and Developing Economies the quarterly estimates and projections account for approximately 80 percent of annual emerging market and developing economiesrsquo output at purchasing-power-parity weights
12
W O R L D E C O N O M I C O U T L O O K G LO b a L M a N U FaC T U R I N G D OW N T U R N R Is I N G T R a D E b a R R I E R s
International Monetary Fund | October 2019
albeit at a less dramatic pace than in 2019 In Iran modest growth is expected to resume after recession Activity should pick up in Brazil Mexico Russia Saudi Arabia and Turkey The projected uptick in global growth also relies importantly on financial mar-ket sentiment staying supportive and continued fading of temporary drags notably in the euro area where industrial output is expected to improve gradually after protracted weakness In turn these factors rely on a conducive global policy backdrop that ensures that the dovish tilt of central banks and the buildup of policy stimulus in China are not blunted by escalating trade tensions or a disorderly Brexit
The world economy faces difficult headwinds over the forecast horizon Despite the recent decline in
long-term interest rates creating more fiscal room the global environment is expected to be characterized by relatively limited macroeconomic policy space to combat downturns and weaker trade flows in part reflecting the increase in trade barriers and anticipated protracted trade policy uncertainty (global export and import volume projections have been cumulatively marked down by about 3frac12 percent over the forecast horizon relative to the April 2019 WEO) Weighed down by aging populations and tepid productivity growth advanced economies are expected to return to their modest potential rate of expansion Moreover China is projected to slow gradually to a more sustain-able rate of growth
Against this backdrop beyond 2020 global growth is projected at about 36 percent The forecast relies to a large extent on durable normalization in emerg-ing market and developing economies currently in macroeconomic distress and on continued healthy performance of relatively faster-growing emerging mar-ket and developing economies The resultant shifting weights in the global economy toward faster-growing emerging market and developing economies help sup-port the projected stable medium-term growth profile contributing frac14 percentage point to global growth by the end of the forecast horizon compared with a global growth projection with country weights held constant at their 2018 level
Growth Forecast for Advanced EconomiesFor advanced economies growth is projected to
soften to 17 percent in 2019 and 2020 The fore-cast is 01 percentage point lower for 2019 than in the April 2019 WEO bull In the United States the economy maintained
momentum in the first half of the year Although investment remained sluggish employment and consumption were buoyant Growth in 2019 is expected to be 24 percent moderating to 21 per-cent in 2020 The projected moderation reflects an assumed shift in the fiscal stance from expansionary in 2019 to broadly neutral in 2020 as stimulus from the recently adopted two-year budget deal offsets the fading effects of the 2017 Tax Cuts and Jobs Act Overall the growth forecast is revised up from the April 2019 WEO (01 percentage point higher for 2019 and 02 for 2020) Revisions to past GDP data imply weaker carryover into 2019 and trade-related policy uncertainty imparts further
2017ndash18 2018ndash19 2019ndash20
ndash03
ndash02
ndash01
00
01
02
03
Stressed Euroarea
UnitedStates
BRAMEXRUS
China NIEs India GCC Other
20
25
30
35
40
45
2017 18 19 20
Figure 114 Global Growth
Source IMF staff estimatesNote NIEs = newly industrialized Asian economies (Hong Kong SAR Korea Macao SAR Singapore Taiwan Province of China) stressed = Argentina Iran Libya Sudan Turkey Venezuela GCC = Gulf Cooperation Council (Bahrain Kuwait Oman Qatar Saudi Arabia United Arab Emirates) Data labels use International Organization for Standardization (ISO) country codes
2 Global Growth 2017ndash20(Percent)
1 Contributions to Changes in Global Growth 2017ndash20(Percentage points)
The slowdown in global growth since 2017 and the projected pick up in 2020 reflects a major downturn and projected recovery in a group of emerging market economies under severe distress
13
C H A P T E R 1 G LO b a L P R O s P E C Ts a N D P O L I C I E s
International Monetary Fund | October 2019
negative effects but the two-year budget deal and the Federal Reserversquos policy rate cuts yield net upward revisions
bull In the euro area weaker growth in foreign demand and a drawdown of inventories (reflecting weak industrial production) have kept a lid on growth since mid-2018 Activity is expected to pick up only modestly over the remainder of this year and into 2020 as external demand is projected to regain some momentum and temporary factors (including new emission standards that hit German car production) continue to fade Growth is pro-jected at 12 percent in 2019 (01 percentage point lower than in April) and 14 percent in 2020 The 2019 forecast is revised down slightly for France and Germany (due to weaker-than-expected external demand in the first half of the year) Both the 2019 and 2020 forecasts were marked down for Italy owing to softening private consumption a smaller fiscal impulse and a weaker external environment The outlook is also slightly weaker for Spain with growth projected to slow gradually from 26 percent in 2018 to 22 percent in 2019 and 18 percent in 2020 (01 percentage point lower than in April)
bull The United Kingdom is set to expand at 12 per-cent in 2019 and 14 percent in 2020 The unchanged projection for both years (relative to the April 2019 WEO) reflects the combination of a negative impact from weaker global growth and ongoing Brexit uncertainty and a positive impact from higher public spending announced in the recent Spending Review The economy contracted in the second quarter and recent indicators point to weak growth in the third quarter The forecast assumes an orderly exit from the European Union followed by a gradual transition to the new regime However as of early September the ultimate form of Brexit remains highly uncertain
bull Japanrsquos economy is projected to grow by 09 per-cent in 2019 (01 percentage point lower than anticipated in the April 2019 WEO) Strong pri-vate consumption and public spending in the first half of 2019 outweighed continued weakness in the external sector Growth is projected at 05 percent in 2020 (unchanged from the April 2019 WEO) with temporary fiscal measures expected to cushion part of the anticipated decline in private consump-tion following the October 2019 increase in the consumption tax rate
Beyond 2020 growth in the advanced economy group is projected to stabilize at about 16 percent similar to the April 2019 WEO forecast A modest uptick expected in productivity is projected to coun-teract the drag on potential output growth from slower labor force growth as populations continue to age
Growth Forecast for Emerging Market and Developing Economies
Growth in the emerging market and developing economy group is expected to bottom out at 39 per-cent in 2019 rising to 46 percent in 2020 The fore-casts for 2019 and 2020 are 05 percentage point and 02 percentage point lower respectively than in April reflecting downward revisions in all major regions except emerging and developing Europe2
bull Emerging and Developing Asia remains the main engine of the world economy but growth is softening gradually with the structural slowdown in China Output in the region is expected to grow at 59 per-cent this year and at 60 percent in 2020 (04 and 03 percentage point lower respectively than in the April 2019 WEO forecast) In China the effects of escalating tariffs and weakening external demand have exacerbated the slowdown associated with needed regulatory strengthening to rein in the accumulation of debt With policy stimulus expected to continue supporting activity in the face of the adverse exter-nal shock growth is forecast at 61 percent in 2019 and 58 percent in 2020mdash02 and 03 percentage point lower than in the April 2019 WEO projection Indiarsquos economy is set to grow at 61 percent in 2019 picking up to 7 percent in 2020 The downward revision relative to the April 2019 WEO of 12 per-centage points for 2019 and 05 percentage point for 2020 reflects a weaker-than-expected outlook for domestic demand Growth will be supported by the lagged effects of monetary policy easing a reduc-tion in corporate income tax rates recent measures to address corporate and environmental regulatory
2Beginning with the October 2019 WEO the regional group Commonwealth of Independent States (CIS) is discontinued Four of the CIS economies (Belarus Moldova Russia and Ukraine) are added to the regional group Emerging and Developing Europe The remaining eight economiesmdashArmenia Azerbaijan Georgia Kazakhstan Kyrgyz Republic Tajikistan Turkmenistan and Uzbekistan which comprise the regional subgroup Caucasus and Central Asia (CCA)mdashare combined with Middle East North Africa Afghanistan and Pakistan (MENAP) to form the new regional group Middle East and Central Asia (MECA)
14
W O R L D E C O N O M I C O U T L O O K G LO b a L M a N U FaC T U R I N G D OW N T U R N R Is I N G T R a D E b a R R I E R s
International Monetary Fund | October 2019
uncertainty and government programs to support rural consumption
bull Subdued growth in emerging and developing Europe in 2019 largely reflects a slowdown in Russia and flat activity in Turkey The region is expected to grow at 18 percent in 2019 and 25 percent in 2020 The upward revision to 2019 growth relative to the April 2019 forecast reflects a shallower-than-expected downturn in Turkey in the first half of the year as a result of fiscal support In Russia by contrast growth has been weaker this year than forecast in April but is projected to recover next year contributing to the upward revision to projected 2020 growth for the region Several countries in central and eastern Europe including Hungary and Poland are experi-encing solid growth on the back of resilient domestic demand and rising wages
bull In Latin America activity slowed notably at the start of the year across the larger economies mostly reflecting idiosyncratic factors Growth in the region is now expected at 02 percent this year (12 percentage point lower than in the April 2019 WEO) The sizable downward revision for 2019 reflects downgrades to Brazil (where mining supply disruptions have hurt activity) and Mexico (where investment remains weak and private consumption has slowed reflecting policy uncertainty weakening confidence and higher borrowing costs) Argentinarsquos economy is expected to contract further in 2019 on lower confidence and tighter external financ-ing conditions Chilersquos growth projection is revised down following weaker-than-expected performance at the start of the year The deep humanitarian crisis and economic implosion in Venezuela continue to have a devastating impact with the economy expected to shrink by about one-third in 2019 For the region as a whole growth is expected to firm up to 18 percent in 2020 (06 percentage point lower than in the April forecast) The projected strength-ening reflects expected recovery in Brazil (on the back of accommodative monetary policy) and in Mexico (as uncertainty gradually subsides) together with less severe contractions for 2020 compared to this year in Argentina and Venezuela
bull Growth in the Middle East and Central Asia region is expected to be 09 percent in 2019 rising to 29 percent in 2020 The forecast is 09 and 04 per-centage point lower respectively than in the April 2019 WEO largely due to the downward forecast
revision for Iran (owing to the effect of tighter US sanctions) and Saudi Arabia While non-oil growth is expected to strengthen in 2019 on higher government spending and confidence oil GDP in Saudi Arabia is projected to decline against the backdrop of the extension of the OPEC+ agreement and a generally weak global oil market The impact on growth of the recent attacks on Saudi Arabiarsquos oil facilities is difficult to gauge at this stage but adds uncertainty to the near-term outlook Growth is projected to pick up in 2020 as oil GDP stabilizes and solid momentum in the non-oil sector continues Civil strife in some other economies including Libya Syria and Yemen weigh on the regionrsquos outlook
bull In sub-Saharan Africa growth is expected at 32 per-cent in 2019 and 36 percent in 2020 slightly lower for both years than in the April 2019 WEO Higher albeit volatile oil prices earlier in the year have supported the subdued outlook for Nigeria and some other oil-exporting countries in the region but Angolarsquos economymdashbecause of a decline in oil productionmdashis expected to contract this year and recover only mildly next year In South Africa despite a moderate rebound in the second quarter growth is expected to be weaker in 2019 than projected in the April 2019 WEO following a very weak first quarter reflecting a larger-than-anticipated impact of labor strikes and energy supply issues in mining together with weak agricultural production While the three largest economies of the region are projected to continue their lackluster performance many other economiesmdashtypically more diversified onesmdashare experiencing solid growth About 20 economies in the region accounting for about 45 percent of the sub-Saharan African population and 34 percent of the regionrsquos GDP (1 percent of global GDP) are estimated to be growing faster than 5 percent this year while growth in a somewhat larger set of countries in per capita terms is faster than in advanced economies
Over the medium term growth for the emerging market and developing economies group is pro-jected to stabilize at about 48 percent but with important differences across regions In emerging and developing Asia it is expected to remain at about 6 percent through the forecast horizon This smooth growth profile rests on a gradual slowdown in China to 55 percent by 2024 and firming and
15
C H A P T E R 1 G LO b a L P R O s P E C Ts a N D P O L I C I E s
International Monetary Fund | October 2019
stabilization of growth in India at about 73 percent over the medium term based on continued imple-mentation of structural reforms In Latin America growth is projected to increase from the 18 percent projected for 2020 but remain below 3 percent over the medium term as structural rigidities subdued terms of trade and fiscal imbalances (particularly for Brazil) weigh on the outlook Activity in emerg-ing and developing Europe is projected to pick up from its current post-global-financial-crisis low with the region expected to grow at about 2frac12 per-cent over the medium term Prospects vary across sub-Saharan Africa but growth for the region as a whole is projected to increase from 36 percent in 2020 to 42 percent in 2024 (although for close to two-fifths of economies the average growth rate over the medium term is projected to exceed 5 percent) The medium-term outlook for the Middle East and Central Asia region is largely shaped by the outlook
for fuel prices needed adjustment to correct macroeco-nomic imbalances in certain economies and geopoliti-cal tensions
Forty emerging market and developing economies (about a quarter of the total) are projected to grow in per capita terms above the 33 percent weighted average of the group which is more than 2 percent-age points above the average for advanced economies (Figure 115) For these economiesmdashwhich include China India and Indonesiamdashthe challenge is to ensure that these growth rates materialize and that the benefits of growth are shared widely Convergence prospects are instead bleak for some emerging mar-ket and developing economies Across sub-Saharan Africa and in the Middle East and Central Asia region 47 economies accounting for about 10 percent of global GDP in purchasing-power-parity terms and close to 1 billion in population are projected to grow by less than advanced economies in per capita terms
Lower than the AE aggregate (13 percent a year)Higher than or equal to the AE aggregate and lower than the EMDE aggregate (33 percent a year)Higher than or equal to the EMDE aggregate
Source IMF staff estimatesNote The AE (EMDE) aggregate per capita growth rate refers to the growth rate of per capita real GDP in the advanced economy (emerging market and developing economy) group calculated as the sum of real GDP at purchasing-power-parity rates divided by total population in the group See also Annex Table 116 AE = advanced economy EMDE = emerging market and developing economy Country borders shown on this map do not imply official endorsement or acceptance by the IMF
Forty emerging market and developing economies are projected to grow in per capita terms above the 33 percent weighted average of the group which is more than 2 percentage points above the average for advanced economies
Figure 115 Emerging Market and Developing Economies Per Capita GDP Growth(2019ndash24 average)
16
W O R L D E C O N O M I C O U T L O O K G LO b a L M a N U FaC T U R I N G D OW N T U R N R Is I N G T R a D E b a R R I E R s
International Monetary Fund | October 2019
over the next five years implying that their income levels are set to fall further behind those economies Figure 116 documents the heterogeneity in per capita growth rates in sub-Saharan Africa where most countries are projected to grow at rates well above the weighted average for the region
Inflation OutlookConsistent with the softening of energy prices and
the moderation in growth consumer price inflation is expected to average 15 percent this year in advanced economies down from 20 percent in 2018 With the US economy operating above potential core consumer price inflation is projected at about 26 percent in 2020ndash21 above its medium-term value of 22 percent (the level consistent with the medium-term target of 20 percent for personal consumption expenditure inflation) Japanrsquos core inflation rate (excluding fresh food and energy) is projected to rise to about 1 percent in 2019ndash20 due to the October consumption tax rate increase inching up
further to 12 percent in the medium term Headline inflation is expected to rise gradually in the euro area from 12 percent in 2019 to 14 percent in 2020
Inflation in emerging market and developing economies excluding Venezuela is expected to inch down to 47 percent this year Exceptions include Argentina where inflation has increased on the back of the peso depreciation Russia where an increase in the value-added tax rate early in the year boosted inflation and to a lesser degree China in part due to rising pork prices As inflation expectations become better anchored around targets in some economies and the pass-through from previous depreciations wanes further inflation in the emerging market economy group is set to moderate to about 44 percent over the medium term
External Sector OutlookTrade Growth
After peaking in 2017 global trade growth slowed considerably in 2018 and the first half of 2019 and is projected at 1frac14 percent in 2019 The slowdown reflects a confluence of factors including a slowdown in investment the impact of increased trade tensions on spending on capital goods (which are heavily traded) a tech cycle and a sizable decline in trade in cars and car parts Global trade growth is projected to recover to 32 percent in 2020 and 375 percent in subsequent years The waning of some temporary fac-tors together with some recovery in global economic activity in 2020 buttressed by a gradual pickup in investment demand in emerging market and devel-oping economies should support the pickup in trade growth offsetting the slowdown in capital spending in advanced economies that is projected for 2020 and beyond However there is sizable uncertainty con-cerning the future structure of value chains and the repercussions of tensions related to technology and these could weigh on trade growth
Current Account Positions
After widening marginally in 2018 primarily reflecting higher oil prices global current account deficits and surpluses are projected to gradually narrow in 2019 and subsequent years (Figure 117) Among surplus countries current account balances are projected to gradually decline in oil exporters advanced European creditors and advanced Asian economies in 2019 and into the medium term
In sub-Saharan Africa most countries are projected to grow at rates well above the weighted average for the region
Sources National statistical agencies United Nations and IMF staff estimatesNote The dashed line shows the weighted average per capita growth rate in sub-Saharan Africa during 2019ndash24 Nigeria is not shown on the chart as its population estimated by the United Nations at about 196 million in 2018 is outside the x-axis range Its average projected per capita growth rate in 2019ndash24 is about zero Data labels use International Organization for Standardization (ISO) country codes
Figure 116 Sub-Saharan Africa Population in 2018 and Projected Growth Rates in GDP per Capita 2019ndash24
8
6
2
0
Aver
age
grow
th ra
te 2
019ndash
24
ndash2
ndash4
ndash6
4
ndash8ndash10 0 20
Population 2018 (millions)4010 30 50 60 70 80 90 100
UGA
TZA
ZAF
SENRWA
KEN
ETHCIV
COD
AGO
17
C H A P T E R 1 G LO b a L P R O s P E C Ts a N D P O L I C I E s
International Monetary Fund | October 2019
The modest widening of Chinarsquos current account surplus in 2019 is projected to be reversed in sub-sequent years as the rebalancing process continues Current account deficits are projected to shrink in central and eastern Europe in 2019 reflecting the balancing of the current account in Turkey following a sharp reduction in domestic demand After widen-ing in 2019ndash20 driven by expansionary fiscal policy and a strengthening dollar the US current account deficit is projected to shrink over the medium term as the growth rate of domestic demand declines3
3Balance of payments data show a notable positive world current account discrepancy in recent years This discrepancy is assumed to decline gradually during the forecast period with projected global current account surpluses compressing more than global current account deficits
The recently imposed trade measures by the United States and retaliatory actions by trading partners are expected to have a limited impact on overall exter-nal imbalances (see the IMFrsquos 2018 External Sector Report and Chapter 4 of the April 2019 WEO for a discussion of the relationship between trade costs and external imbalances)
As highlighted in the 2019 External Sector Report many countriesrsquo current account imbalances in 2018 were too large in relation to country-specific norms consistent with underlying fundamentals and desir-able policies As shown in panel 1 of Figure 118 excess current account balances in 2019 are projected to decline modestly with medium-term projections suggesting on average further movement in the same direction (Figure 118 panel 2)4 At the same time given that changes in macroeconomic fundamen-tals relative to 2018 affect not only current account balances but also their equilibrium values the path of future excess imbalances cannot be precisely inferred from this exercise5
International Investment Positions
Changes in international investment positions reflect both net financial flows and valuation changes arising from fluctuations in exchange rates and asset prices Given that WEO projections assume broadly stable real effective exchange rates and limited variation in asset prices changes in international investment positions are driven by projections for net external borrowing and lending (in line with the current account balance) with their ratios to domestic and world GDP affected by projected growth rates for individual countries and for the global economy as a whole67
4The change in the current account balance during 2019 is esti-mated to have offset on average about one-fifth of the 2018 current account gap the change between 2018 and 2024 would offset less than half of the 2018 gap
5For instance an improvement in the terms of trade is typically associated with a more appreciated equilibrium exchange rate
6WEO forecasts include projections of 10-year government bond yields which would affect bond prices but the impact of those changes in bond prices on the valuation of external assets and liabilities is typically not included in international investment position forecasts
7In addition to changes in exchange rates the decline in global equity prices in late 2018 (compared with levels at the end of 2017) implies deterioration of international investment positions at the end of 2018 in countries with significant net holdings of equity and foreign direct investment abroad and a corresponding improvement in positions for countries with net equity liabilities
Afr and ME Japan ChinaEur creditors Adv Asia Oil exporters
United States Other adv Em Asia DiscrepancyEuro debtors Lat Am CEE
Source IMF staff estimatesNote Adv Asia = advanced Asia (Hong Kong SAR Korea Singapore Taiwan Province of China) Afr and ME = Africa and the Middle East (Democratic Republic of the Congo Egypt Ethiopia Ghana Jordan Kenya Lebanon Morocco South Africa Sudan Tanzania Tunisia) CEE = central and eastern Europe (Belarus Bulgaria Croatia Czech Republic Hungary Poland Romania Slovak Republic Turkey Ukraine) Em Asia = emerging Asia (India Indonesia Pakistan Philippines Thailand Vietnam) Eur creditors = European creditors (Austria Belgium Denmark Finland Germany Luxembourg Netherlands Norway Sweden Switzerland) Euro debtors = euro area debtors (Cyprus Greece Ireland Italy Portugal Spain Slovenia) Lat Am = Latin America (Argentina Brazil Chile Colombia Mexico Peru Uruguay) Oil exporters = Algeria Azerbaijan Iran Kazakhstan Kuwait Nigeria Oman Qatar Russia Saudi Arabia United Arab Emirates Venezuela Other adv = other advanced economies (Australia Canada France Iceland New Zealand United Kingdom)
Global current account deficits and surpluses are projected to gradually narrow in 2019 and subsequent years
ndash4
ndash3
ndash2
ndash1
0
1
2
3
4
2002 04 06 08 10 12 14 16 18 20 22 24
Figure 117 Global Current Account Balance(Percent of world GDP)
18
W O R L D E C O N O M I C O U T L O O K G LO b a L M a N U FaC T U R I N G D OW N T U R N R Is I N G T R a D E b a R R I E R s
International Monetary Fund | October 2019
As panel 1 of Figure 119 shows creditor and debtor positions as a share of world GDP are projected to widen slightly this year and then to stabilize as a share of world GDP over the forecast horizon On the creditor side the growing creditor positions of a group of European advanced economies andmdashto a lesser extentmdashof advanced economies in Asia is partly offset by some reduction in the creditor position of China and oil exporters On the debtor side the net liability position of the United States increases initially and then stabilizes with the forecast reduction in its current account deficit as fiscal stimulus is withdrawn while the position of euro area debtor countries improves further
Similar trends are highlighted in panel 2 of Figure 119 which shows projected changes in net international investment positions as a percentage of domestic GDP across countries and regions between 2018 and 2024 the last year of the WEO projection horizon The net creditor position is projected to be more than 80 percent GDP for European advanced economies more than 65 percent for Japan and more than 140 percent of GDP for smaller advanced
Figure 118 Current Account Balances in Relation to Economic Fundamentals
Excess current account balances in 2019 are projected to decline modestly with medium-term projections suggesting on average further movement in the same direction
Source IMF staff calculationsNote Data labels use International Organization for Standardization (ISO) country codes
1 2018 Current Account Gaps and Change in CurrentAccount Balances 2018ndash19
2 2018 Current Account Gaps and Change in CurrentAccount Balances 2018ndash24
Chan
ge in
cur
rent
-acc
ount
-to-
GDP
ratio
201
8ndash19
Chan
ge in
cur
rent
-acc
ount
-to-
GDP
ratio
201
8ndash24
Current account gap 2018
Current account gap 2018
ndash10
ndash8
ndash6
ndash4
ndash2
0
2
4
ndash4 ndash2 0 2 4 6 8
ndash6
ndash4
ndash2
0
2
4
6
8
ndash4 ndash2 0 2 4 6 8
ESP NLDITA
DEUFRA
BELSGP
HKG
CHE
SWE
KOR
SAU
CAN
AUSTUR
THA
ZAF
POLRUS
MEX
MYSIDN
INDBRA
ARG
USAGBR
JPNCHN
ESP NLD
ITADEU
FRABELSGPHKG
CHE
SWE
KOR
SAU
CANAUS
TUR
THAZAF
POL
RUS
MEX
MYS
IND
BRA
ARG
USA
GBR
JPN
CHN
Afr and ME Japan ChinaEur creditors Adv Asia Oil exporters
United States Other adv Em AsiaEuro debtors Lat Am CEE
1 Global International Investment Position(Percent of world GDP)
2 Net IIP 2018 and Projected Changes 2019ndash24(Percent of GDP)
Source IMF staff estimatesNote Adv Asia = advanced Asia (Hong Kong SAR Korea Singapore Taiwan Province of China) Afr and ME = Africa and the Middle East (Democratic Republic of the Congo Egypt Ethiopia Ghana Jordan Kenya Lebanon Morocco South Africa Sudan Tanzania Tunisia) CEE = central and eastern Europe (Belarus Bulgaria Croatia Czech Republic Hungary Poland Romania Slovak Republic Turkey Ukraine) Em Asia = emerging Asia (India Indonesia Pakistan Philippines Thailand Vietnam) Eur creditors = European creditors (Austria Belgium Denmark Finland Germany Luxembourg Netherlands Norway Sweden Switzerland) Euro debtors = euro area debtors (Cyprus Greece Ireland Italy Portugal Spain Slovenia) IIP = international investment position Lat Am = Latin America (Argentina Brazil Chile Colombia Mexico Peru Uruguay) Oil exporters = Algeria Azerbaijan Iran Kazakhstan Kuwait Nigeria Oman Qatar Russia Saudi Arabia United Arab Emirates Venezuela Other adv = other advanced economies (Australia Canada France Iceland New Zealand United Kingdom)
Creditor and debtor positions as a share of world GDP are projected to widen slightly this year and then stabilize over the forecast horizon
ndash20
ndash10
0
10
20
30
40
ndash100 ndash75 ndash50 ndash25 0 25 50 75 100 125 150
Adv AsiaJapan
Eur creditors
Afr and ME
Em Asia
Other adv
United States
Oil exportersChina
CEELat Am
Euro debtors
Proj
ecte
d ch
ange
in II
P 2
018ndash
24
Net IIP 2018
ndash40
ndash30
ndash20
ndash10
0
10
20
30
40
2005 07 09 11 13 15 17 19 21 23 24
Figure 119 Net International Investment Position
19
C H A P T E R 1 G LO b a L P R O s P E C Ts a N D P O L I C I E s
International Monetary Fund | October 2019
economies in Asia while the net creditor position of China would decline to about 12 percent The debtor position of the United States is projected to rise to about 50 percent of GDP some 5 percentage points above the 2018 estimate while the net international investment position of a group of euro area debtor countries including Italy and Spain is expected to improve by more than 16 percentage points of their collective GDP
Implications of Imbalances
Sustained excess external imbalances in key econ-omies and policy actions that threaten to widen such imbalances pose risks to global stability Expansion-ary fiscal policy in the United States is projected to increase the current account deficit over 2019ndash20 which could further aggravate trade tensions Over the medium term widening debtor positions in key economies could constrain global growth and possibly result in sharp and disruptive currency and asset price adjustments (see also the 2019 External Sector Report)
As discussed in the ldquoPolicy Prioritiesrdquo section the US economymdashwhich is already operating beyond full employmentmdashshould implement a medium-term plan to reverse the rising ratio of public debt accompanied by fiscal measures to grad-ually boost domestic supply potential This would help ensure more sustainable growth dynamics and contain external imbalances Stronger reliance on demand growth in some creditor countries espe-cially those such as Germany with the policy space to support it and facing a weakening of demand would help facilitate domestic and global rebal-ancing while sustaining global growth over the medium term
Risks Skewed to the DownsideRisks around the baseline forecasts remain skewed
to the downside Though the recent easing of mon-etary policy in many countries could lift demand more than projected especially if trade tensions between the United States and China ease and a no-deal Brexit is averted downside risks seem to dominate the outlook As discussed in the section on the Global Growth Outlook about 70 percent of the projected 2020 pickup in global growth is accounted for by a small group of emerging mar-ket and developing economies in severe distress or
currently underperforming relative to past averages Moreover the global forecast is predicated on contin-ued steady growth in a number of emerging market economies that are expected to maintain relatively healthy performance even as growth is projected to moderate in the United States and China Global growth will fall short of the projected baseline if strains fail to dissipate in the stressed and underper-forming economies or if activity disappoints among the group of economies expected to maintain healthy rates of expansion
Further disruptions to trade and supply chains Tensions in trade and technology linkages have contin-ued to ratchet up in recent months Since the spring financial markets have been buffeted by the broaden-ing of US tariffs to all imports from China restric-tions placed by the United States on commerce with Chinese technology companies and a greater perceived risk of a no-deal Brexit (see Scenario Box 1 of the April 2019 WEO for a discussion of the macroeconomic implications of the United Kingdom withdrawing from the European Union without a free trade deal) These developments have followed a sequence of tariff hikes and threats since early 2018 between the United States and China that have contributed to the gener-alized retreat in business confidence and investment and the marked slowdown in global trade leading fiscal and monetary policymakers in some cases to deploy policy space to counter drags on confidence and demand If tensions in these areas were to intensify the harm to investment would deepen and could lead to dislocation of global supply chains as well as reduced technology spillovers harming productivity and output growth into the medium term (see Scenario Box 11 for an analysis of the impact of advanced economy firms reshoring production in response to growing uncertainty on trade policies) The latest data on input-output linkages point to ever-more-interrelated technology including the US technology sectorrsquos increasing dependence on imports of value added from Chinese producers (Figure 120) Trade policy uncertainty and barriers have risen more broadly including with Japan and Korea imposing strengthened procedures for exports to one another While these restrictions have had limited effects so far an escalation of tensions could affect both economies significantly with regional repercussions through technology sector supply chains
As discussed above still-resilient service sector activity is a relative bright spot in the global economy particularly
20
W O R L D E C O N O M I C O U T L O O K G LO b a L M a N U FaC T U R I N G D OW N T U R N R Is I N G T R a D E b a R R I E R s
International Monetary Fund | October 2019
among advanced economies With protracted weakness in global manufacturing business-facing services such as logistics finance legal and wholesale trading are vulner-able to a softening in demand Depending on the severity firms in these services categories could cut back on hiring and weaken the feedback cycle between employment growth consumer confidence and consumer spending Resultant lower demand for consumer-facing services such as retail and hospitality would dampen business sen-timent among these categories and amplify the feedback to the labor market
Abrupt declines in risk appetite Amid easy monetary policy and supportive financial conditions in many economies financial markets are susceptible to abrupt drops in sentiment In recent months rising tensions between the United States and China surrounding
trade and technology companies triggered rapid declines in global risk appetite and flight to safe assets Scenario Box 12mdashwhich updates the scenarios first presented in the October 2018 WEO to incorporate recent tariff measuresmdashhighlights the large effects of trade tensions on global growth via worsening finan-cial market sentiment as well as productivity Potential triggers for risk-off episodes remain plentiful These include further increases in trade tensions protracted fiscal policy uncertainty and worsening debt dynam-ics in some high-debt countries an intensification of stress in large emerging markets currently undergo-ing difficult macroeconomic adjustment processes a no-deal Brexit or a sharper-than-expected slowdown in China which is dealing with multiple drags on growth from trade tensions and needed domestic regulatory strengthening An abrupt risk-off episode could expose financial vulnerabilities accumulated during years of low interest rates and depress global growth as highly leveraged borrowers find it difficult to roll over debt and as capital flows retrench from emerging market and frontier economies (see the October 2019 GFSR for further discussion on financial vulnerabilities)
Continued buildup of financial vulnerabilities Muted inflation pressures have allowed central banks to ease policy in response to mounting downside risks to growth These actions together with shifts in market expectations regarding future policy moves have helped ease financial conditions (possibly more than warranted by central bank communications notably in the case of the market-implied path of the federal funds rate which remains well below the Federal Open Market Committeersquos ldquodot plotrdquo projection) While easier financial conditions have supported demand and employment they could also lead to an underpricing of risk in some financial market segments Insufficient regulatory and supervisory responses to risk underpricing in this context could allow for a further buildup of financial vulnerabili-ties potentially amplifying the next downturn
Threat of cyberattacks Cyberattacks on financial infrastructure pose a threat to the outlook because they can severely disrupt cross-border payment systems and the flow of goods and services
Disinflationary pressures Concerns about disinfla-tionary spirals eased during the cyclical upswing of mid-2016 to mid-2018 Slower global growth and a softening of core inflation across advanced and emerging market economies have revived this risk Lower inflation and entrenched lower inflation expectations can increase the real costs of debt service for borrowers and weigh
USA Germany JapanEuro area Korea Taiwan Province of China
Input-output linkages point to ever-more-interrelated technology including the US technology sectorrsquos increasing dependence on imports of value added from Chinese producers
Source Organisation for Economic Co-operation and Development Trade in Value Added database1Computers electronics and electrical equipment
1 Chinarsquos Value-Added Share Embedded in Trading Partner FinalDemand1
0
2
4
6
8
10
12
0
2
4
6
8
10
12
14
16
2005 06 07 08 09 10 11 12 13 14 15
2005 06 07 08 09 10 11 12 13 14 15
2 Trading Partnersrsquo Value-Added Share Embedded in Chinarsquos FinalDemand1
Figure 120 Tech Hardware Supply Chains(Percent)
21
C H A P T E R 1 G LO b a L P R O s P E C Ts a N D P O L I C I E s
International Monetary Fund | October 2019
on corporate investment spending By keeping nominal interest rates low softer inflation would also constrain the monetary policy space that central banks have to counter downturns meaning that growth could be persistently lower for any given adverse shock
Geopolitical tensions domestic political uncertainty and conflict Perceived changes in the direction of policies in some countries and elevated uncertainty regarding reforms have been weighing on investment and growth At the same time some geopolitical risk factors discussed in previous WEOs have become more salientmdashnotably rising tensions in the Persian Gulf following attacks on major oil refining facili-ties in Saudi Arabia which have added to broader conflict in the Middle Eastmdashand tensions in east Asia (Figures 121 and 122) These factors in isolation may not have a strong impact on growth beyond the countries directly affected but an accumulation
of such eventsmdashcombined with trade tensions and tighter global financial conditionsmdashcould have out-sized effects on sentiment that are felt on a broader scale At the same time ongoing civil strife in many countries raises the risks of horrific humanitarian costs migration strains in neighboring countries andmdashtogether with geopolitical tensionsmdashhigher volatility in commodity markets
Climate change Mitigating the serious threats posed by climate change to health and livelihoods in many countries requires a rapid transition to a low-carbon economy on an ambitious scale (Chapter 2 of the Fiscal Monitor) However domestic mitigation policy strategies are failing to muster wide societal support in some countries while international cooperation is diluted by large emitters declining to participate (see Commodities Special Feature Box 1SF1 for more discussion on emissions) The Intergovernmental Panel on Climate Change warned in October 2018 that at current rates of increase global warming could reach 15degC above preindustrial levels between 2030
Global economic policy uncertainty (PPP weight)US trade policy uncertainty (right scale)
Source Baker Bloom and Davis (2016)Note Baker Bloom Davis Index of Global Economic Policy Uncertainty (GEPU) is a GDP-weighted average of national EPU indices for 20 countries Australia Brazil Canada Chile China France Germany Greece India Ireland Italy Japan Korea Mexico the Netherlands Russia Spain Sweden the United Kingdom and the United States Mean of global economic policy uncertainty index from 1997 to 2015 = 100 mean of US trade policy uncertainty index from 1985 to 2010 = 100 PPP = purchasing power parity
Global economic policy uncertainty remains elevated
100
150
200
250
300
350
400
0
100
200
300
400
500
600
700
800
Jan2016
Apr16
Jul16
Oct16
Jan17
Apr17
Jul17
Oct17
Jan18
Apr18
Jul18
Oct18
Jan19
Apr19
Aug19
Figure 121 Policy Uncertainty and Trade Tensions(Index)
Source Caldara and Iacoviello (2018)Note The Caldara and Iacoviello Geopolitical Risk (GPR) index reflects automated text-search results of the electronic archives of 11 national and international newspapers The index is calculated by counting the number of articles related to geopolitical risk in each newspaper for each month (as a share of the total number of news articles) and normalized to average a value of 100 in the 2000ndash09 decade ISIS = Islamic State
High geopolitical tension raises the risk of severe humanitarian costs and intensifying economic strains in some regions
Figure 122 Geopolitical Risk Index(Index)
0
50
100
150
200
250
300
2010 11 12 13 14 15 16 17 18 Aug19
Arab SpringSyrian andLibyan wars
Russianactionsin Crimea
ISISescalation
Parisattacks
Syriancivil warescalation
22
W O R L D E C O N O M I C O U T L O O K G LO b a L M a N U FaC T U R I N G D OW N T U R N R Is I N G T R a D E b a R R I E R s
International Monetary Fund | October 2019
and 2052 accompanied by extremes of temperature precipitation and drought Given the uncertainties the climate could warm faster engendering more catastrophic outcomes which would have devastat-ing humanitarian effects and inflict severe persistent output losses across many economies Climate change may also exacerbate inequality within countries even in advanced economies which are expected to be more adaptable (see Chapter 2 Box 22)
Globally consistent risk assessment of the WEO forecast Confidence bands for the WEO forecast are obtained using the G20MOD module of the IMFrsquos Flexible System of Global Models8 The confidence bands for the WEO forecast for most regions are asymmetric skewed toward lower growth than in the baseline This reflects both the preponderance of neg-ative growth surprises in the past and limited mon-etary policy space available to offset negative growth shocks as interest rates in most advanced economies are at or close to their effective lower bounds9 The resulting risk assessment can also be used to calculate the probability of a global economic downturn The estimated probability of one-year-ahead global growth below 25 percentmdashthe 10th percentile of global growth outturns in the past 25 yearsmdashhas increased since the spring and now stands at close to 9 percent (Figure 123)
Policy PrioritiesThe global economy remains at a delicate juncture
Even if the threats discussed in the previous section are thwarted as assumed in the baseline per capita growth is projected to stay below past norms across most groups except in sub-Saharan Africa over the medium term Moreover conditions are very challenging for a
8G20MOD is a global structural model of the world economy capturing international spillovers and key economic relationships among the household corporate and government sectors including monetary policy
9Using the model to provide a risk assessment of the forecast is done in two steps First the model is used to solve for economic shocks that drove the world economy in the past Historically the key drivers of the cyclical dynamics of output inflation and interest rates were domestic demand and oil price shocks Second these estimated shocks are then used to generate a large number of counter-factual scenarios for the world economy by sampling five-year histories from their empirical joint distribution function The resulting joint predictive distribution for a rich set of economic variables is internally and globally consistent and is suitable for risk assessment both at the global and individual-country level
number of emerging market economies that need to adjust their macroeconomic policies sharply
As discussed in the section on the Global Growth Outlook the world economy is confronting a diverse set of headwinds These headwinds affect countries differently adding to idiosyncratic factors and varied cyclical positions meaning that policy objectives and priorities vary widely across countries A common thread and the foremost priority in many cases is to remove policy-induced uncertainty or threats to growth Policy missteps at this juncture such as a no-deal Brexit or a further deepening of trade disputes could severely undermine sentiment growth and job creation and may exhaust policy space for avoid-able reasons
Multilateral Policies
Multilateral cooperation is indispensable for tackling some of the short- and long-term issues that threaten the sustainability and inclusiveness of
Source IMF staff estimatesNote Probabilities are calculated using the G20MOD module of the IMFrsquos Flexible System of Global Models G20MOD is a global structural model of the world economy capturing international spillovers and key economic relationships among the household corporate and government sectors including monetary policy
Figure 123 Probability of One-Year-Ahead Global Growth of Less than 25 Percent(Percent)
The estimated probability of one-year-ahead global growth below 25 percentmdashthe 10th percentile of global growth outturns in the past 25 yearsmdashhas increased since the spring
65
70
75
80
85
90
Fall 2018 Spring 19 Fall 19
23
C H A P T E R 1 G LO b a L P R O s P E C Ts a N D P O L I C I E s
International Monetary Fund | October 2019
global growth The most pressing needs for greater cooperation are in the areas of trade and technology Likewise closer multilateral cooperation on interna-tional taxation global financial regulatory reform climate change and corruption would help address vulnerabilities and broaden the gains from economic integration
Trade and technology Policymakers should work together to reduce trade tensions which have weak-ened global activity and hurt confidence They should also expeditiously resolve uncertainty around changes to long-standing trade arrangements (including those between the United Kingdom and the European Union as well as between Canada Mexico and the United States) Countries should not use tariffs to target bilateral trade balances More fundamentally trade conflicts signal deeper frustrations with gaps in the rules-based multilateral trading system Policymak-ers should cooperatively address the roots of dissatis-faction with the system and improve the governance of trade This requires resolving the deadlock over the World Trade Organization (WTO) dispute settle-ment systemrsquos appellate body to ensure the continued enforcement of existing WTO rules modernizing WTO rules to encompass areas such as e-commerce subsidies and technology transfer and advancing negotiations in new areas such as digital trade The idea that all countries need to participate in all nego-tiations could be reconsidered potentially allowing countries that wish to move further and faster to do so while keeping new agreements inside the WTO and open to all its members At the least calling a truce on further escalation of trade barriers would avoid inject-ing more destabilizing forces into a slowing global economy Policymakers should also cooperate more closely to curb cross-border cyberattacks on national security and commercial entities as well as limit distortionary practices such as requiring companies to hand over their intellectual property in return for market access Without definite progress in these areas technology tensions are likely to intensify impeding the free flow of ideas across countries and potentially impairing long-term productivity growth
International taxation With the rise of multinational enterprises international tax competition has made it increasingly difficult for governments to tackle tax evasion and collect revenue needed to finance their budgets Efforts to minimize cross-border opportunities for tax evasion and avoidance such as the Organisation for Economic Co-operation and DevelopmentndashG20
Base Erosion and Profit Shifting initiative (see Box 13 of the April 2019 Fiscal Monitor) should be rein-forced As discussed in IMF (2019) this initiative has made significant progress in international tax cooperation but vulnerabilities remain Limitations of the armrsquos-length principlemdashunder which transactions between related parties are to be priced as if they were between independent entitiesmdashand reliance on notions of physical presence of the taxpayer to establish a legal basis to impose income tax have allowed apparently profitable firms to pay little tax Some improvements can be achieved unilaterally or regionally but more fundamental solutions require stronger institutions for global cooperation
Financial regulatory reforms and global financial safety net The reform agenda begun after the global financial crisis is still unfinished Some areas of progressmdashsuch as greater supervisory intensity for globally important financial institutions and more effective resolution regimesmdashare under pressure or being reversed Policy-makers should ensure the reform agenda is completed including through enhanced international resolution frameworks and further improvements to macropru-dential policy frameworks (which may entail simpli-fication of complex rules in some areas as discussed in Adrian and Obstfeld 2017) Emerging risks to cybersecurity in the financial system and combating money laundering and the financing of terrorism also require coordinated and collective action Comple-menting these moves policymakers should ensure that the global financial safety net is adequately resourced to help counteract disruptive portfolio adjustments in a world economy heavily laden with debt and reduce the need for countries to self-insure against external shocks
Climate change and migration Curbing greenhouse gas emissions and containing the associated conse-quences of rising global temperatures and devastating climate events are urgent global imperatives10 In that respect the ongoing political polarization and discord in many economies does not bode well for reaching agreement on domestic and international strategies in time to contain climate change to manageable levels A redoubling of efforts is urgently needed which will require a distribution of the costs and benefits in a
10See Chapter 3 of the October 2017 WEO on the macroeco-nomic impacts of weather shocks and IMF (2019) and Chapter 2 of the October 2019 Fiscal Monitor for a discussion of fiscal policy options for implementing climate change mitigation and adapta-tion strategies
24
W O R L D E C O N O M I C O U T L O O K G LO b a L M a N U FaC T U R I N G D OW N T U R N R Is I N G T R a D E b a R R I E R s
International Monetary Fund | October 2019
manner than can muster sufficient domestic and inter-national political support By adding to migrant flows climate-related events also compound an already- complex situation of refugee flight from conflict areas International migration will become increasingly important too as many advanced economies con-front issues related to aging populations Interna-tional cooperation would facilitate the integration of migrantsmdashand so help to maximize the labor supply and productivity benefits they bring to destination countriesmdashand to support remittance flows that lessen the burden on source countries
Corruption and governance A global effort is also needed to curb corruption which is undermining faith in government and institutions in many countries (see the April 2019 Fiscal Monitor) Left unchecked pervasive corruption can lead to distorted policies lower revenue declining quality of public services and deteriorating infrastructure
Country-Level Policies
In response to continued weakness and downside risks macroeconomic policiesmdashparticularly monetary policymdashhave already turned more supportive in many countries Looking ahead macroeconomic policies in most economies should seek to stabilize activity and strengthen the foundations for a recovery or continued growth Where fiscal space is available and growth has decelerated sharply more active fiscal policy supportmdashincluding through greater public investment in workforce skills and infrastructure to raise growth potentialmdashmay be warranted Making growth more inclusive and avoiding protracted downturns that disproportionately affect the most vulnerable segments of population are essential for securing better economic prospects for all Strengthening resilience to adverse shifts in financial market sentiment and alleviating structural constraints on potential output growth also remain overarching needs
Advanced Economies
For advanced economies where growth in final demand is generally subdued inflation pressure is muted and market-pricing-implied measures of inflation expectations have softened in recent months accommodative monetary policy remains appropriate to guard against a further deceleration in activity and a downshift in inflation expectations This is especially
important in economies with inflation persistently below target and output that already is or may fall below potential As discussed in Box 14 the sluggish-ness in inflation suggests that potential output could be higher and output gaps could be more negative than currently estimated However given that contin-ued monetary accommodation can foster a buildup of financial vulnerabilities stronger macroprudential policies and a proactive supervisory approach will be critical As discussed in the October 2019 GFSR financial sector policies should aim to secure the strength of balance sheets and limit systemic risks by deploying such tools as liquidity buffers countercycli-cal capital buffers or targeted sectoral capital buffers developing borrower-based tools to mitigate debt vulnerabilities where needed and enhancing macropru-dential oversight of nonbank financial institutions In some countries bank balance sheets need further repair to mitigate the risk of sovereign-bank feedback loops Avoiding a rollback of postcrisis regulatory reforms is of essence in the context of continued monetary policy accommodation and high debt levels
Considering the precarious outlook and large downside risks fiscal policy can play a more active role especially where room to ease monetary policy is limited The low level of policy rates in many coun-tries and the decline in long-term interest rates to historically very low or negative levels while reducing the likely impact of further monetary policy easing expands fiscal room as long as these conditions last In this context in countries where activity has weak-ened or could decelerate sharply fiscal stimulus can be provided if fiscal space exists and fiscal policy is not already overly expansionary In countries where demand is weak yet fiscal consolidation is neces-sary its pace could be slowed if market conditions permit to avoid prolonged economic weakness and disinflationary dynamics Policymakers would need to prepare for a contingent fiscal policy response in advance to be able to act quickly and plan ahead for the appropriate composition of fiscal easing Infrastruc-ture spending or investment incentives (including for clean energy sources) would be ideal as they would boost output not only in the near term but also in the medium term helping to improve debt sustainability More generally modest medium-term potential output in most advanced economies calls for the composition of fiscal spending and taxes to be calibrated carefully with a view to raising labor force participation rates and productivity growth through public investment in
25
C H A P T E R 1 G LO b a L P R O s P E C Ts a N D P O L I C I E s
International Monetary Fund | October 2019
workforce skills physical infrastructure and research and development
National structural policies that encourage more open and flexible markets in advanced economies would not only boost economic resilience and poten-tial output but could also help reduce within-country disparities in performance and improve the labor market adjustment to shocks by lagging regions within countries (see Chapter 2) There is also a pressing need to reduce carbon emissions to avert the severe economic and social risks associated with climate change Moving toward less-carbon-intensive produc-tion structuresmdashincluding through carbon taxation boosting low-carbon infrastructure and encouraging innovation in green technologies (see Chapter 2 of the October 2019 Fiscal Monitor)mdashare therefore necessary Beyond fiscal measures to boost potential output pro-tecting opportunities and dynamismmdashby ensuring that competition policies facilitate new-firm entry and curb incumbentsrsquo abuse of market powermdashremains vital when a minority of big firms are capturing increasingly larger market shares in advanced economies (Chapter 2 of the April 2019 WEO)
In the United States where the unemployment rate is historically low and inflation is close to tar-get a combination of accommodative monetary policy vigilant financial regulation and supervision and a gradual fiscal consolidation path would help maintain the expansion and limit downside risks The absence of strong wage and inflation pressures (inflation has averaged just below target over the past year and expectations have recently softened) has allowed the Federal Reserve to reduce the fed-eral funds rate to guard against downside risks from the global economy The path of the policy interest rate going forward should depend on the economic outlook and risks as informed by incoming data Supportive financial conditions require maintain-ing the current risk-based approach to regulation supervision and resolution (and strengthening it in the case of nonbank financial institutions) to limit vulnerabilities from rising corporate leverage and emerging cybersecurity threats Public debt remains on a clear upward trajectory calling for consolidation There is a need to raise the revenue-to-GDP ratio by putting in place a broad-based carbon tax a federal consumption tax and a higher federal gas tax Doing so would create the fiscal space to provide support to low- and middle-income families (including through help with childcare expenses and smoothing out the
existing ldquocliffsrdquo in social benefits) and to pursue policies that raise potential growthmdashinfrastructure investment (including to facilitate the supply of green energy alternatives) support for lifelong learning and work-force skills and steps to raise labor force participation Counteracting the anticipated rise in aging-related spending requires indexing social security benefits to chained inflation and raising the retirement age
In the United Kingdom desired policy settings in the near term will depend on the ultimate form of the countryrsquos departure from the European Union The extra public spending envisaged by the government should mitigate the cost of Brexit for the economy but continued efforts to bring down the debt ratio remain important to build buffers against future shocks In case of a disorderly Brexit accompanied by a sharp rise in barriers to goods and services trade with the European Union the policy response will need to take into account the extent of the adverse financial market reaction and its likely impact on macroeconomic stability Structural reforms should focus on improving infrastructure quality and boosting labor skills as well as ensuring smooth reallocation of workers to expand-ing sectors from those adversely affected by Brexit
In the euro area monetary policy has become appro-priately more accommodative in response to stubbornly weak core inflation and a significant loss of momentum since mid-2018 The fiscal stance though ideally more supportive than envisaged before the slowdown needs to vary across countries depending on the extent of fiscal space In Germany where there is room to ease fiscal policy and growth has been weak raising public investment in physical and human capital or reducing the labor tax wedge would boost demand help reduce the excess current account surplus and strengthen potential output In countries with high debt includ-ing France Italy and Spain fiscal buffers should be rebuilt gradually while protecting investment Credibly committing to a downward-sloping debt path over the medium term is particularly critical in Italy where debt and gross financing needs are large If growth were to weaken significantly countries with fiscal space would need to use it more actively to complement monetary easing to guard against disinflationary dynamics and a prolonged period of weak growth In parallel the path of fiscal consolidation could be adjusted tempo-rarily in countries where fiscal space is at risk provided their financing conditions remain amenable and debt sustainability is not jeopardized A synchronized fis-cal response albeit differentiated appropriately across
26
W O R L D E C O N O M I C O U T L O O K G LO b a L M a N U FaC T U R I N G D OW N T U R N R Is I N G T R a D E b a R R I E R s
International Monetary Fund | October 2019
member countries can amplify the area-wide impact Completing the banking union and continuing the cleanup of bank balance sheets remain vital for raising resilience and strengthening credit intermediation in some economies Amid prolonged monetary accommo-dation and disparate cyclical positions regulators need to calibrate macroprudential instruments to address any emergent financial stability risks Reforms are urgently needed in many economies to lift productiv-ity and competitiveness Further deepening the single market for services would boost efficiency across the European Union EU-level instruments can be used to foster reform efforts at the national level Raising labor market flexibility removing barriers to entry in product markets upgrading the functioning of corporate insol-vency regimes and cutting administrative burdens are cross-cutting needs
In Japan demand is expected to slow from its recent strong pace following the October consumption tax rate increase while government mitigating measures will moderate the decline Inflation remains well below the central bankrsquos target Sustained monetary accommodation will be necessary over a long period to durably lift inflation expectations Fiscal policy should be geared toward long-term fiscal sustainability amid a rapidly aging and shrinking population while protect-ing demand and the reflation effort Averting fiscal risks over the long term requires additional increases in the consumption tax rate and reforms to curb pension health and long-term-care spending Some progress has been made on structural reforms with the adop-tion of the Work Style Reform that aims at improving working conditions a new residency status for foreign workers with professional and technical skills and further trade integration with the European Union and the economies comprising the Comprehensive and Progressive Agreement for Trans-Pacific Partner-ship More effort is needed on labor market reformmdashincluding to improve workersrsquo skills and career opportunities for nonregular workers reduce duality and raise mobilitymdashand in product market and corpo-rate reforms to lift productivity and investment
Emerging Market and Developing Economies
The circumstances of emerging market and developing economies are diverse Some economies are experiencing extremely challenging conditions because of political discord or cross-border conflict others are experiencing tight external financing
conditions given their macroeconomic imbalances and needed policy adjustments Among countries facing more stable conditions the recent softening of inflation has given central banks the option of easing monetary policy to support activity Against a volatile external backdrop and possible adverse turns in mar-ket sentiment ensuring financial resilience is a key objective for many emerging market and developing economies Regulation and supervision should ensure adequate capital and liquidity buffers to guard against disruptive shifts in global portfolios and a possible deterioration in growth and credit quality Efforts to monitor and minimize currency and maturity mis-matches on balance sheets are also vital to preserve financial stability and will help exchange rates to cushion against shocks In the many economies with high public debt fiscal policy should generally aim for consolidation to contain borrowing costs and create space to counter future downturns as well as to address development needs while adjusting its pace and timing to avoid prolonged weakness Improving the targeting of subsidies rationalizing recurrent expenditure and broadening the revenue base can help preserve investments needed to boost potential growth and social spendingmdashon education health care and safety net policies Revenue mobilization is particularly important in low-income developing countries that need to advance toward the United Nations Sustainable Development Goals
Beyond getting the mix of macroeconomic and financial policies right many emerging market and developing economies can strengthen their institu-tions governance and policy frameworks through structural reforms to bolster their growth prospects and resilience Indeed the key findings of Chapter 3 make a strong case for a renewed structural reform push in emerging market and developing economies The chapter documents that much scope remains for further reforms in domestic and external finance trade labor and product market regulations and gov-ernance in these countries especially in low-income developing countries The chapter finds that for a typical economy major simultaneous reforms across these areas could add 1 percentage point to growth over 5ndash10 years roughly doubling the speed of convergence
In China the overarching policy objective is to raise the sustainability and quality of growth while navigating headwinds from trade tensions and weaker global demand Meeting this goal calls for short-term
27
C H A P T E R 1 G LO b a L P R O s P E C Ts a N D P O L I C I E s
International Monetary Fund | October 2019
action to support the economy while making progress with shifting the underlying sources of growth from credit-fueled investment toward private consumption and improving the allocation of resources and effi-ciency in the economy In addition to some monetary easing fiscal support (financed mainly on-budget) has prevented trade tensions from exerting a sharp drag on confidence and activity Any further stimulus should emphasize targeted transfers to low-income households rather than large-scale infrastructure spending In sup-port of the transition to sustainable growth regulatory efforts to restrain shadow banking have helped lessen reliance on debt but corporate leverage remains high and household debt is growing rapidly Further prog-ress with reining in debt requires continued scaling back of widespread implicit guarantees and enhancing the macroprudential toolkit Meanwhile continuing with reducing the role of state-owned enterprises and lowering barriers to entry in such sectors as telecom-munications and banking would help raise productivity while improving labor mobility Moving toward a more progressive tax code and higher spending on health care education and social transfers would help lower precautionary saving and support consumption
In India monetary policy and broad-based struc-tural reforms should be used to address cyclical weakness and strengthen confidence A credible fiscal consolidation path is needed to bring down Indiarsquos elevated public debt over the medium term This should be supported by subsidy-spending rationaliza-tion and tax-base enhancing measures Governance of public sector banks and the efficiency of their credit allocation needs strengthening and the public sec-torrsquos role in the financial system needs to be reduced Reforms to hiring and dismissal regulations would help incentivize job creation and absorb the countryrsquos large demographic dividend Land reforms should also be enhanced to encourage and expedite infrastructure development
In Brazil pension reform is an essential step toward ensuring the viability of the social security system and the sustainability of public debt Further gradual fiscal consolidation will be needed to comply with the constitutional expenditure ceiling over the next few years Monetary policy should remain accommodative to support economic growth provided that inflation expectations remain anchored To lift potential growth the government will need to pursue an ambitious reform agenda including tax reforms trade openness and infrastructure investment
In Mexico adherence to the governmentrsquos medium- term fiscal consolidation plan is essential to preserve market confidence and stabilize public debt More ambitious medium-term fiscal targets would create larger buffers to respond to negative shocks and better deal with long-term spending pressure from demo-graphic trends If inflation remains on a downward path toward the target and inflation expectations are anchored monetary policy could become more accommodative in the coming months The exchange rate should remain flexible with foreign-exchange intervention being used only if market conditions are disorderly
In Russia the authorities should move toward a more growth-friendly composition of taxes and public spending while refraining from using the National Welfare Fund for quasi-fiscal activities Monetary pol-icy can be eased toward a neutral stance if inflationary pressures continue to abate To enhance the efficiency of credit intermediation the authorities should con-tinue to consolidate the banking sector while reducing the statersquos footprint Further structural reforms are needed to boost potential growth including measures to enhance competition improve public procurement and reform the labor market
In Turkey a comprehensive and clearly communi-cated policy plan is needed to repair private balance sheets increase public balance sheet transparency and ultimately restore the credibility independence and rules-based functioning of economic institutions To achieve these goals the policy agenda should include (1) keeping monetary policy rates on hold until there is a durable downturn in inflation and inflation expec-tations which would also help underpin the lira and rebuild reserves (2) steps to bolster medium-term fiscal strength (3) restoring confidence in banks through thorough assessment (third-party asset quality reviews rigorous stress tests) credible bank recapitalization plans and reining in state bank credit (4) further improving the insolvency regime and the out-of-court restructuring framework to promote meaningful restructuring solutions and free up lending capacity to healthy and productive firms and (5) focusing structural reforms to support more sustainable total-factor-productivity-led growth
In South Africa gradual but meaningful and growth-friendly fiscal consolidation is needed to stabilize public debt Measures should include reducing the public wage bill downsizing and eliminating wasteful spending by public entities expanding the tax base
28
W O R L D E C O N O M I C O U T L O O K G LO b a L M a N U FaC T U R I N G D OW N T U R N R Is I N G T R a D E b a R R I E R s
International Monetary Fund | October 2019
and strengthening tax administration Monetary policy should continue to be data-dependent and carefully monitor inflation risks Structural reforms are needed to regain investorsrsquo trust lift growth potential and foster job creation Priorities include revamping the business models of state-owned enterprises improving compe-tition in the product market by reducing entry barriers and streamlining regulations and increasing labor market flexibility
Low-income countries share many of the policy prior-ities of the emerging market economy group especially in enhancing resilience to volatile external conditions Several ldquofrontierrdquo low-income countries have seen exter-nal financing conditions fluctuate sharply in the past year Strengthening monetary and macroprudential pol-icy frameworks while preserving exchange rate flexibility will help them withstand this environment During the recent period of low interest rates public debt stocks in this group have increased rapidly When financial conditions turn less accommodative rollover risks may rise and wider sovereign spreads may lead to higher borrowing costs for firms and households Fiscal policy should be geared toward ensuring debt sustainability while protecting measures that help the vulnerable and support progress toward the United Nations Sustain-able Development Goals This requires broadening the
revenue base improving tax administration eliminating wasteful subsidies and prioritizing spending on infra-structure health care education and poverty reduction Low-income countries also bear the brunt of natural disasters and increasing climate change Lowering the fallout from these events will require adaptation strate-gies that invest in disaster readiness and climate-smart infrastructure incorporate appropriate technologies and zoning regulations and deploy well-targeted social safety nets to help reduce vulnerability and improve countriesrsquo ability to respond
Commodity-exporting developing economies have similar policy priorities but face additional pressure on their public finances from the subdued outlook for commodity prices Beyond placing public finances on a sustainable footing economies in this group also need to diversify away from dependence on resource extraction and refining Although country circumstances differ policies to help achieve this broad goal include sound macroeconomic management lifting of education quality and worker skills to encourage more broad-based labor force participation investment to reduce infra-structure shortfalls boosting of financial development and inclusion strengthening of property rights contract enforcement and reduction of trade barriers to incentiv-ize the entry of firms and private investment
29
C H A P T E R 1 G LO b a L P R O s P E C Ts a N D P O L I C I E s
International Monetary Fund | October 2019
Activity would suffer in advanced and emerg-ing market economies if production were reshored to advanced economies that could not match the efficiency and lower labor costs of the abandoned foreign value chains If multinational firms absorb some of the implications by allowing margins to be squeezed it could soften the implications However a possibly more likely outcome is that a less open global economy could constrain technology diffusion causing activity to fall further
The IMFrsquos Global Integrated Monetary and Fiscal Model is used here to examine the implications of multinational firms reshoring production to advanced economies This reshoring could be motivated by a desire to keep some production closer to final con-sumers to avoid potential supply chain disruptions from developments in distant countries or by policy actions closer to home A very stylized experiment is considered designed to illustrate the implications and highlight the possible channels through which they could play out
The assumption is that over a three-year horizon multinational firms in the United States the euro area and Japan reshore enough production that their nominal imports decline by 10 percent (blue line in Scenario Figure 111) Given the relative costs of production reshoring leads to higher-priced consump-tion and investment goods in advanced economies Domestic demand declines as does output despite the decline in imports1 In emerging market economies lower production and exports reduce incomes house-holds and firms cut expenditure and output declines more modestly than in advanced economies However households in both advanced and emerging market economies suffer equally owing to the deterioration in emerging market economiesrsquo terms of trade Advanced economy exchange rates appreciate raising the real cost of emerging market economiesrsquo imports More emerging market production must be exported to pay for their import bundle leaving less for domestic consumption
1It is worth noting that in sectors where domestic production expands employment could increase here however the aggre-gate net impact is shown which is negative
ReshoringReshoring plus lower margins Reshoring plus weaker technological diffusion
Scenario Figure 111 Advanced Economies Reshoring(Percent deviation from control)
Source IMF staff estimatesNote AE = advanced economy EM = emerging market
ndash6ndash5ndash4ndash3ndash2ndash1
01
ndash6ndash5ndash4ndash3ndash2ndash1
01
2019 22 25
1 AE Real GDP
Longterm
2019 22 25 Longterm
2 AE Consumption
ndash6ndash5ndash4ndash3ndash2ndash1
01
ndash6ndash5ndash4ndash3ndash2ndash1
01
2019 22 25
3 AE Investment
Longterm
2019 22 25 Longterm
4 AE Imports
ndash6ndash5ndash4ndash3ndash2ndash1
01
ndash6ndash5ndash4ndash3ndash2ndash1
01
2019 22 25
5 EM Real GDP
Longterm
2019 22 25 Longterm
6 EM Consumption
ndash6ndash5ndash4ndash3ndash2ndash1
01
ndash6ndash5ndash4ndash3ndash2ndash1
01
2019 22 25
7 EM Investment
Longterm
2019 22 25 Longterm
8 EM Imports
Scenario Box 11 Implications of Advanced Economies Reshoring Some Production
30
W O R L D E C O N O M I C O U T L O O K G LO b a L M a N U FaC T U R I N G D OW N T U R N R Is I N G T R a D E b a R R I E R s
International Monetary Fund | October 2019
One possible response of multinational firms might be to not pass on the higher production costs fully and so allow their profit margins to be squeezed (yellow line) Moderating the resulting price increase helps maintain household consumption and supports investment as firms need more capital to produce the additional goods The extent to which firms would compress margins is highly uncertain and the modest reduction considered here is for illustrative purposes only The more margins are squeezed the less harmful is the impact of reshoring on advanced economies However lower margins do little to ameliorate the impact on emerging markets
Although reductions in profit margins could offset some of the negative implications of reshoring a less favorable implication of a more closed global economy could be less technologi-cal diffusion Empirical evidence points to trade openness as a key driver of technological diffusion2
2See ldquoIs Productivity Growth Shared in a Globalized Econ-omyrdquo in Chapter 4 of the April 2018 World Economic Outlook
If multinational firms shorten supply chains by producing more goods closer to final consumers in advanced economies emerging markets could have much less access to the latest technological developments This box considers modest tempo-rary reductions in productivity growth in tradable goods sectors (red line) that are a function of a countryrsquos or regionrsquos distance from the productivity frontier and relative openness (01 percentage point for advanced economies 025 percentage point for emerging markets)3 Weaker technological diffusion would notably amplify the negative implications for emerging markets and modestly exacerbate the impact on advanced economies
3A temporary decline in productivity growth is assumed However it is possible that a more closed global economy could lead to some lasting damage to productivity growth If that were the case the longer-term implications would be much worse than those estimated here
Scenario Box 11 (continued)
31
C H A P T E R 1 G LO b a L P R O s P E C Ts a N D P O L I C I E s
International Monetary Fund | October 2019
Updates of the estimated impact of ongoing global trade tensions on economies are generated here using the IMFrsquos Global Integrated Monetary and Fiscal Model (GIMF) Inputs to the modelrsquos simulations include explicit tariff measures and off-model analysis of the possible impact of con-fidence effects on investment financial conditions for firms and productivity developments that result when resources are reallocated across economies Given that all of the tariff measures considered in these simulations are incorporated in the baseline projections of this World Economic Outlook (WEO) their impact on global GDP should be interpreted as relative to a no-tariff baseline (such as the one in the October 2017 WEO)1
The first three layers (out of six) of the analysis estimate the direct trade impacts of tariff measures both implemented and announced All of the mea-sures are assumed to be permanent The first layer contains the impact of implemented tariff measures included in the April 2019 WEO baseline Among them are tariffs that the United States imposed on aluminum and steel 25 percentage points in tariffs on $50 billion in imports from China and 10 percentage points in tariffs on an additional $200 billion in imports from China All retaliatory measures by US trading partners are included in this layer The second layer adds the impact of the May 2019 US tariff increase of $200 billion on Chinese imports and Chinarsquos retaliation The third layer adds the US imposition of 15 percentage points in tariffs on all goods from China (roughly $300 billion) that had not yet incurred tariffs starting in September 2019 and a 5 percentage-point increase on the already-tariffed $250 billion in imports from China Chinarsquos retaliation is included in this layer
The remaining three layers are based on off-model analysis The fourth layer adds the potential impact on investment of declining confidence This is the same temporary effect that is included in the October 2018 WEO analysis of the impact of trade tensions on investment via confidence effects2 However the
1The analysis in the October 2018 WEO also includes a layer of US-imposed tariffs on all imported cars and car parts This layer is not included in this analysis
2The magnitude of this effect was calibrated based on the Baker Bloom and Davis (BBD) overall ldquoeconomic policy uncertaintyrdquo measure and its estimated impact on investment in the United States (For details on the BBD
timing has been altered to more closely match changes in timing of implementation of tariff measures from that assumed in 2018 The peak impact on activity is delayed given that the tariff measures were imposed later than had been assumed The fifth layer adds the impact on corporate spreads of the potential market reaction to the trade tensions The size of the impact is identical to that used in the October 2018 WEO but the timing is adjusted to match the delayed implemen-tation of the tariff measures The peak in the increase in corporate bond spreads now occurs in 2020 one year later than assumed in the October 2018 WEO analysis3 The final layer adds the potential impact on productivity resulting from the reallocation of resources across sectors within economies This layer is new and is not included in the analysis in the October 2018 WEO The impact of tariff measures in GIMF captures the macroeconomic distortions that tariffs induce in the utilization of productive factors capital and labor as well as income effects How-ever tariffs also lead to sectoral distortions from the reallocation of factors across sectors within econo-mies which highly aggregated models such as GIMF cannot capture Computable general equilibrium (CGE) trade models in contrast capture the impact on output of the shift of resources across sectors
Uncertainty Index see http www policyuncertainty com) A one-standard-deviation increase in the BBD uncertainty measure (which is roughly one-sixth of the change during the global financial crisis) leads to an estimated 1 percent drop in investment in the United States in one year Here this 1 per-cent decline in investment is spread over three years with the peak effect in 2020 The impact of the decline in investment in other countries is then scaled by their trade openness relative to the United Statesmdashcountries more dependent on trade than the United States experience greater declines in investment than does the United States Note that since fall 2018 some of this impact would already be factored into WEO forecasts given that the tariff measures were imposed
3The magnitude of this tightening is based on several financial market participantsrsquo estimates of the impact on US corporate earnings of a worst-case United StatesndashChina trade war (In the worst-case scenario the United States imposes tariffs of 25 percent on all Chinese imports and China does the same in response) Based on historical relationships this esti-mated 15 percent decline in earnings is then mapped into an increase in US corporate bond spreads The rise in US spreads is then mapped into corporate bond spreads in other countries based on their credit rating relative to US corporate debt This increase in spreads is assumed to start in 2019 and peak in 2020 with half of the peak increase remaining in corporate spreads in 2021
Scenario Box 12 Trade Tensions Updated Scenario
32
W O R L D E C O N O M I C O U T L O O K G LO b a L M a N U FaC T U R I N G D OW N T U R N R Is I N G T R a D E b a R R I E R s
International Monetary Fund | October 2019
under the assumption that total utilization of resources remains unchanged Implicitly this is an estimate of the impact on productivity of the movement of factors between sectors with different underlying productivity To estimate the possible magnitude of this productiv-ity effect the tariff increases in the first three layers are run on a new global CGE model detailed in Caliendo and others (2017) The resulting impact on activity is an estimate of the medium-term effect and embodies an implicit change in labor productivity The final layer adds this change in labor productivity phased in over five years beginning in 2020
Consistent with past scenarios all layers assume that the euro area and Japan are unable to ease (conven-tional) monetary policy further in response to mac-roeconomic developments given the lower bound on nominal interest rates If other unconventional mon-etary policy measures are implemented the decline in GDP in Japan and the euro area would be smaller in the near term than estimated here In all other countries and regions conventional monetary policy responds according to a Taylor-type reaction function It is important to note the considerable uncertainty surrounding the magnitude and persistence of the confidence effects on investment and the tightening in corporate spreads These effects could be either milder or more severe than assumed here Regarding the layer that contains the tightening in corporate spreads one aspect not included in the analysis is the potential for safe-haven flows to mitigate the impact of financial tightening in such countries as Germany Japan and the United States
The estimated impact on activity (shown in Scenario Figure 121) indicates that tariffs included in the April 2019 WEO baseline (dark blue line) are estimated to have a fairly mild direct effect the United States and China are most affected and China bears the greatest burden The largest effect falling on the United States and China also holds true for the direct effect of tariff measures implemented in May 2019 (gray line) and those announced in August 2019 (yellow line) However the magnitude of the impact becomes much more material The short-term spillovers on other countries from these measures are estimated to be pos-itive as some countriesmdashnotably the North American trading partners of the United Statesmdashbenefit from trade diversion These benefits however disappear in the medium term and the spillovers become negative as households and firms in China and the United States are able to source more goods domestically that
Tariffs in April 2019 baselineAdd tariffs implemented May 2019Add tariffs announced August 2019Add confidence effectAdd market reactionAdd productivity effect
Source IMF staff estimatesNote G20 = Group of Twenty NAFTA = North American Free Trade Agreement
ndash20
ndash16
ndash12
ndash08
ndash04
00
04
ndash20
ndash16
ndash12
ndash08
ndash04
00
04
2017 20 23 Longterm
2017 20 23 Longterm
ndash20
ndash16
ndash12
ndash08
ndash04
00
04
ndash20
ndash16
ndash12
ndash08
ndash04
00
04
2017 20 23 Longterm
2017 20 23 Longterm
ndash20
ndash16
ndash12
ndash08
ndash04
00
04
ndash20
ndash16
ndash12
ndash08
ndash04
00
04
2017 20 23
23
Longterm
2017 20 23 Longterm
ndash20
ndash16
ndash12
ndash08
ndash04
00
04
ndash20
ndash16
ndash12
ndash08
ndash04
00
04
2017 20 Longterm
2017 20 23 Longterm
1 United States 2 China
3 Japan 4 Euro Area
6 World5 US NAFTA Trading Partners
7 G20 AdvancedEconomies
8 G20 EmergingEconomies
Scenario Figure 121 Real GDP(Percent deviation from control)
Scenario Box 12 (continued)
33
C H A P T E R 1 G LO b a L P R O s P E C Ts a N D P O L I C I E s
International Monetary Fund | October 2019
were previously imported Adding the confidence effects on investment (green line) and the increase in corporate spreads (red line) results in a negative result for all countries For the United States and China adding the estimated productivity effects (light blue line) amplifies the economic damage but because they are phased in over five years that negative impact grows over time and is substantial in both the medium and the long term For some other countries the productivity impact is positive but small Changes in global demand reallocate resources in these countries from less to more productive sectors4
4As noted earlier the productivity effect arises from resources shifting between sectors with different productivity The countries with the closest trading ties to Canada Mexico and the United States benefit the most In the trade model analysis
Overall China suffers the most as output falls by 2 percent in the short term and 1 percent in the long term (light blue bar) The United States runs a close second with output falling by 06 percent in both time spans The trough in global activity is estimated to take place in 2020 with output about 08 percent below baseline The trough in activity across advanced econo-mies is very similar to the trough in the United States at roughly ndashfrac12 percent Unlike in the United States the long-term direct trade effects are small and negative in advanced economies although they are more than offset by positive productivity effects in some countries
resources shifting from agriculture and mining to manufactur-ing in these two countries drives the improvement in aggregate productivity
Scenario Box 12 (continued)
34
W O R L D E C O N O M I C O U T L O O K G LO b a L M a N U FaC T U R I N G D OW N T U R N R Is I N G T R a D E b a R R I E R s
International Monetary Fund | October 2019
The automobile industry contracted in 2018 for the first time since the global financial crisis con-tributing to the global slowdown since last year Two main factors explain the downturn the removal of tax breaks in China and the rollout of new carbon emission tests in Europe Near-term prospects for the industry remain sluggish and efforts to decarbonize pose a fundamental challenge in the medium term
The automobile sector is a globally interconnected industry with a large economic footprint The size of the sectorrsquos gross output (that is the sum of its value added and intermediate consumption) is about 57 percent of global output according to the World Input-Output Database (Timmer and others 2015) Vehicles and related parts are the worldrsquos fifth largest export product accounting for about 8 percent of global goods exports in 2018 (Figure 111) The sector is also a major consumer of commodities other man-ufactured products and services the vehicle industry is the second largest consumer of steel and aluminum and demands significant amounts of copper rubber plastic and electronics (Figure 112)
During the 2018 contraction (measured in units Figure 113 panel 1) global automobile production declined by about 17 percent or about ndash24 percent after correcting for differences in unit values (for exam-ple German cars on average are more expensive than Indian cars) Global car sales fell by about 3 percent China (the largest vehicle market in the world) experi-enced a 4 percent contraction in units produced its first decline in more than two decades Large declines were registered in Germany Italy and the United Kingdom while production in the United States and large emerg-ing markets expanded marginally (Figure 113 panel 2) The downturn has continued into 2019 as indicated by declining global light vehicle sales through June 2019 (Figure 114 panel 1) on continued subdued momentum in China and Europe Consistent with performance stock prices of the largest 14 car manu-facturers have declined by 28 percent on average since March 2018 (compared with about a 1 percent increase in the MSCI World index during that time)
The industryrsquos downturn contributed to the slow-down in global growth beginning in the second half of 2018 National income account data by sector are
The author of this box is Luisa Charry with research assistance from Aneta Radzikowski
not yet available for 2018 in many countries However assuming a proportional decline in value added IMF estimates suggest that the contraction in car production directly subtracted 004 percentage point from global output growth last year (following a positive contribu-tion of 002 percentage point in 2017) Considering that global growth slowed by 02 percentage point last yearmdashfrom 38 percent in 2017 to 36 percentmdashthese estimates suggest that automobile production has been an important factor in the global slowdown
Developments in the automobile industry also played a role in global trade dynamics Automobile exports from the 14 biggest car-producing countries fell by 31 per-cent in 2018 when measured in units Controlling for differences in unit values across exporters IMF estimates suggest that the contraction in car exports directly sub-tracted 012 percentage point from global trade volumes
Gross output Exports
Sources CEIC Haver Analytics Japan Automobile Manufacturers Association National statistics offices Spanish Association of Automobile and Truck Manufacturers (ANFAC) Statista Society of Motor Manufacturers and Traders United Nations Conference on Trade and Development World Input-Output Database and IMF staff calculationsNote EU4 = France Germany Italy Spain
Figure 111 Global Vehicle Industry Share of Total 2018(Percent)
China
United States
Mexico
Canada
EU4
Japan
South Korea
Brazil
United Kingdom
India
Russia
Rest of theworld
0 105 15 20 25 30
Box 11 The Global Automobile Industry Recent Developments and Implications for the Global Outlook
35
C H A P T E R 1 G LO b a L P R O s P E C Ts a N D P O L I C I E s
International Monetary Fund | October 2019
in 2018 (following a positive contribution of 003 percent in 2017) In addition the sectorrsquos extensive value-chain linkages imply that the overall effects may be larger once the impact on trade in car partsmdashfor which volume data are not yet available for a sufficiently large number of countriesmdashand other intermediate goods used in car pro-duction is considered A global input-output framework based on Bems Johnson and Yi (2011) suggests that the sector may have subtracted as much as 05 percentage point from global trade in 2018 once these spillover effects are factored in For reference the growth of all global exports of goods and services was 38 percent points in 2018 (down from 54 percent growth in 2017)
Several factors help explain the sectorrsquos performance bull Vehicle demand in China was weighed down
by higher taxes and tighter financial condi-tions Tax breaks have been used in China to encourage vehicle ownership In late 2015 the purchase tax on small and medium vehicles was lowered to 5 percent from 10 per-cent and subsequently increased to 75 percent in 2017 and to 10 percent in 2018 (Figure 114 panel 2) According to industry analysts the lower tax rates in 2016ndash17 brought sales forward by 2ndash7 million units (about 20 percent of total pro-duction) which then reduced sales in 2018ndash191
1Mian and Sufi (2012) document similar intertemporal reallocation in the United States during the ldquoCash for Clunkersrdquo program of 2009
Tighter regulations on peer-to-peer lending also weighed on demand while tariff increases on US car imports and decreases on car imports from other countries may have led consumers to take a precautionary stance
bull The rollout of new emission tests in Europe disrupted car production and trade In September 2018 a new euro-area-wide emission test (known as WLTP) went into effect The large number of models requiring certification led to bottle-necks at testing agencies and several automakers had to adjust production schedules to avoid unwanted inventory accumulation Other devel-opments weighing on activity included falling demand from emerging markets (most notably Turkey) and the United Kingdom and accelera-tion of the shift out of diesel into gasoline and alternative-fuel vehicles
bull Car demand in the United States held up in 2018 despite tighter financial conditions (and the higher steel and aluminum tariffs) Although higher interest rates on car financing throughout 2017ndash18 and tighter lending standards weighed on demand provisions for vehicle depreciation in the Tax Cuts and Jobs Act provided support In addition although higher tariffs on steel and aluminum added an estimated $240 to the production cost of an average car in the United States in 2018 (Schultz and others 2019) it is unclear how much of that was passed on to final consumers
Value added(22)
Own sectorintermediate consumption
(32)
Intermediateconsumption
(46)
Electronics(4)
Metals(10)
Rubber andplastics
(4)
Chemicals(1) Agriculture and mining
(0)
Services(17)
Utilities andconstruction
(2)
Other manufacturing(8)
Sources World Input-Output Database and IMF staff calculations
Figure 112 Global Vehicle Industry Structure of Production 2014
Box 11 (continued)
36
W O R L D E C O N O M I C O U T L O O K G LO b a L M a N U FaC T U R I N G D OW N T U R N R Is I N G T R a D E b a R R I E R s
International Monetary Fund | October 2019
The outlook for the industry remains conservative Some analysts (such as IHS Markit) anticipate a 4 per-cent contraction in light vehicle production in 2019 and flat growth in 2020 (01 percent) In China higher tariffs on light vehicle imports from the United States (set to take effect in December 2019) increasing market
Production (million units)Gross output (billions of USdollars right scale)
ChinaCanadaItalySouth KoreaIndia
United StatesGermanySpainBrazilRussia
MexicoFranceJapanUnited KingdomRest of the world
World
Figure 113 Global Vehicle Production
110 55
50
45
40
30
35
25
15
20
10
100
90
80
70
60
50
40
30
6543210
ndash1ndash2ndash3ndash4
2000
2013 14 15 16 17 18
02 04 06 08 10 12 14 16 18
1 Global Vehicle Production and Gross Output
2 Global Vehicle Industry Volumes(Contribution to percent change)
Sources International Organization of Motor Vehicle Manufacturers national statistics offices World Input-Output Database and IMF staff calculations
Tax rate (percent right scale)Sales (12-month percent change)
Year-over-year percent change (right scale)Units (past 12 months millions)
0
100
200
300
400
500
600
0 10 20 30 40 50 60 70
Global average
United States
United KingdomSpain
KoreaMexico
Japan
India
Germany
France
China Brazil
Pass
enge
r car
s pe
r 10
00 in
habi
tant
s
GDP per capita (thousand US dollars)
40
45
50
55
60
65
ndash10
ndash5
0
5
10
15
20
2011 12 13 14 15 16 17 18 Jun19
ndash20
ndash10
0
10
20
30
40
50
60
70
0
2
4
6
8
10
12
14
2008 10 12 14 16 18 19
Sources Economist Intelligence Unit Haver Analytics International Organization of Motor Vehicle Manufacturers and IMF staff calculations1Dashed line indicates logarithmic trend
Figure 114 World Passenger Vehicle Sales and Usage
3 Passenger Cars and GDP per Capita1
2 China Tax Purchase Rate and PassengerVehicle Sales
1 World Passenger Vehicle Sales andRegistrations
Box 11 (continued)Box 11 (continued)
37
C H A P T E R 1 G LO b a L P R O s P E C Ts a N D P O L I C I E s
International Monetary Fund | October 2019
saturation (Figure 114 panel 3) a young vehicle fleet and lower subsidies on purchases of electric vehicles are likely to continue to hold back demand the introduc-tion of a new emission standard in mid-2019 could also disrupt production The outlook for Europe is affected by falling demand for diesel-powered vehicles continued Brexit-related uncertainty and emission tests set for late 2019 Elsewhere easier financial conditions should provide support especially in the United States and large emerging markets but ongoing discussions around Section 232 tariffs on US imports from the European Union and Japan could weigh on activity in the near term
More fundamentally efforts to decarbonize are set to shape the medium-term outlook A significant ramp-up of investment in the production of electric and other alternative-fuel vehicles is expected in the medium term particularly in Europe However the supply chains for electric vehicles are several orders of magnitude shorter than those for fuel-powered vehicles Furthermore entry-level prices remain higher than for fuel-powered cars which could limit demand uptake Accordingly automakers are facing challenges that mean they will have to make changes to business models above and beyond those required by techno-logical reconfiguration
Box 11 (continued)
38
W O R L D E C O N O M I C O U T L O O K G LO b a L M a N U FaC T U R I N G D OW N T U R N R Is I N G T R a D E b a R R I E R s
International Monetary Fund | October 2019
Financial flows to and from advanced economies have been much weaker since the global financial crisis (Figure 121) In particular portfolio debt flows have weakened reflecting a combination of factors large government debt asset purchases by central banks increased fragmentation in euro area debt markets and much-reduced accumulation of reserves by emerging market and developing econo-mies Other investment flows have also fallen sharply as global banks reduced the size of their balance sheets after dramatic expansion of their cross-border activities during the precrisis boom But until the end of 2017 foreign direct investment (FDI) flows had actually increased slightly relative to the precrisis period averaging more than 3 percent of GDP annu-ally (more than $18 trillion)
The data for 2018 show a different picture FDI abroad by advanced economies as well as inward FDI came to a virtual standstill This box looks at the factors behind this large decline as well as the implica-tions for emerging market and developing economies Does this decline in FDI point to increased fragmen-tation This box argues that it does not and that most of the decline in FDI reflects purely financial opera-tions by large multinational corporations including in response to changes in US tax law
Specifically a significant policy development affecting FDI in 2018 was the 2017 US Tax Cuts and Jobs Act which generally eliminated taxes on repa-triated earnings by US multinationals1 In response to the law US multinational corporations repatriated accumulated prior earnings of their foreign affiliates During 2011ndash17 these multinationals on average reinvested in their overseas affiliates about $300 billion a year in earnings on FDI (about two-thirds of their total overseas earnings) but in 2018 they repatriated $230 billion In other words the dividends paid to parent companies by overseas affiliates exceeded these affiliatesrsquo earnings by $230 billion (Figure 122 panel 1 blue bars) This repatriated amount exceeded new FDI abroad and hence total FDI abroad by
The author of this box is Gian Maria Milesi-Ferretti1Earnings by foreign affiliates can be repatriated to the parent
company in the form of dividends or reinvested in the foreign affiliate Both types of earnings are reflected as primary income in the current account and reinvested earnings are counted as new FDI abroad (a financial outflow) Under the previous tax system US companies would typically retain most of their earnings abroad
US corporations was negative in 2018 (Figure 122 panel 1 black line)
Where did this repatriation of earnings origi-nate As documented by the US Bureau of Eco-nomic Analysis and as discussed in Setser (2019) it originated primarily in a few financial centers with dividends paid out of Bermuda the Netherlands and Ireland accounting for about $500 billionmdashalmost three times more than the income reported by US affiliates in these locations The evidence also suggests that the repatriated assets were invested primarily from overseas in US financial instruments (Smolyansky Suarez and Tabova 2019) Hence the repatriation of earnings would reduce FDI abroad and correspondingly reduce claims of nonresidents
Foreign direct investment Portfolio equityPortfolio debt Other investmentFinancial derivatives ReservesTotal
Figure 121 Advanced Economies Financial Flows(Percent of GDP)
ndash10
ndash5
0
5
10
15
20
25
30
1999 2002 04 06 08 10 12 14 16 18
1 Outflows
ndash10
ndash5
0
5
10
15
20
25
30
1999 2002 04 06 08 10 12 14 16 18
Source IMF staff calculations
2 Inflows
Box 12 The Decline in World Foreign Direct Investment in 2018
39
C H A P T E R 1 G LO b a L P R O s P E C Ts a N D P O L I C I E s
International Monetary Fund | October 2019
on the US economy (for instance in the form of portfolio investment in debt securities) given that overseas affiliates of US multinational corpora-tions are residents of the country where they are established
But the decline in US FDI abroad by itself explains only part of the $15 trillion reduction in advanced economiesrsquo FDI abroad between 2017 and 2018 The remainder comes mostly from the euro area in particular from Luxembourg and the Netherlands where FDI abroad fell from $340 bil-lion in 2017 to ndash$730 billion in 2018 In these countries the lionrsquos share of FDI reflects financial operations of special purpose entities These multina-tional corporation affiliates are pass-through entities with little or no employment or value added whose financial balance sheets are composed primarily of cross-border assets and liabilities They are estab-lished to (1) access capital markets or sophisticated financial services (2) isolate owner(s) from finan-cial risk (3) reduce regulatory and tax burdens or (4) safeguard the confidentiality of their transactions and owner(s)2
Statistics published by the Organisation for Eco-nomic Co-operation and Development suggest that FDI abroad by advanced economy special purpose entitiesmdashmostly domiciled in Luxembourg and the Netherlandsmdashdeclined from $240 billion in 2017 to ndash$740 billion in 2018 and hence accounts for more than 90 percent of the decline in FDI flows Panel 2 of Figure 122 shows the pattern of special purpose entitiesrsquo investment in advanced economies since 2005 highlighting the large decline in 2018 as well as the symmetry between the behavior of assets and liabilities3 The decline in FDI positions by special purpose entities is also the main factor explaining the sharp reduction in inward FDI for advanced economies highlighted in panel 2 of Figure 121 Panel 3 of Figure 122 highlights the contributions of the United States and of special purpose entities to the decline in advanced econo-miesrsquo FDI abroad
2See IMF (2018) for a discussion of the nature of special pur-pose entities and the recording of their activities in the balance of payments
3Not all countries report FDI transactions and holdings by special purpose entities separately hence the estimates in the figure understate to some extent their role
FDI abroadInward FDI
SPENon-SPE excluding United StatesUnited States
Reinvestment of earningsEquity other than reinvestment of earningsDebtTotal
ndash3
ndash2
ndash1
0
1
2
3
4
1999 2002 04 06 08 10 12 14 16 18
ndash2
ndash1
0
1
2
3
2005 08 10 12 14 16 18
ndash2
ndash1
0
1
2
3
4
5
2005 08 10 12 14 16 18
Sources Organisation for Economic Co-operation and Development US Bureau of Economic Analysis and IMF staff calculationsNote FDI = foreign direct investment SPE = special purpose entity
1 US FDI Abroad
3 FDI Abroad Advanced Economies 2005ndash18
2 FDI Flows by Special Purpose EntitiesAdvanced Economies
Figure 122 Foreign Direct Investment Flows(Percent of GDP)
Box 12 (continued)
40
W O R L D E C O N O M I C O U T L O O K G LO b a L M a N U FaC T U R I N G D OW N T U R N R Is I N G T R a D E b a R R I E R s
International Monetary Fund | October 2019
As noted in DNB (2019) and BCL (2019) these transactions reflect mostly operations by US-based multinationals seeking to simplify their international group structure by liquidating intermediate hold-ings also in relation to the US tax reform of 2017 Similarly SNB (2019) notes that the US tax reform led foreign-controlled finance and holding companies domiciled in Switzerland to reduce their balance sheets On the liability side inward FDI was nega-tive nonresident parent companies withdrew equity capital from companies in Switzerland Other factors are also likely to have been at play including ongo-ing broader tax reform initiatives such as the Base Erosion and Profit Shifting initiative and the Euro-pean Unionrsquos Anti-Tax Avoidance Directives 1 and 2
Figure 123 depicts the pattern of capital flows to and from the largest emerging market economies Inflows in 2018 were weaker than in 2017 but FDI inflows fell only slightly in relation to GDP and this decline is entirely accounted for by another large reduction in FDI positions by special purpose entities in Hungary The picture for financial outflows also shows some decline in 2018 including in FDI The largest component of this decline is again the reduc-tion in FDI by special purpose entities in Hungary coupled with some reduction in FDI abroad by China which is the largest overseas investor among emerging market economies On net emerging market econo-mies remain FDI destinations and their FDI liabilities exceed their assets
In sum the sharp decline in global FDI flows in 2018 seems to be explained almost entirely by multinational corporationsrsquo financial operations with no meaningful aggregate impact on emerging market economies These developments further underscore how FDI transactions and positions recorded in the balance of payments are often unrelated to greenfield investment or mergers and acquisitions but rather reflect tax and regulatory optimization strategies by
large multinational corporations (see for instance Lane and Milesi-Ferretti 2018 and Damgaard and Elkjaer 2017) Efforts under way to enhance data collection on the activity of special purpose entities should help clarify the nature of FDI flows and positions
Foreign direct investment Portfolio equityPortfolio debt Other investmentFinancial derivatives ReservesTotal
Figure 123 Emerging Markets Financial Flows(Percent of GDP)
1 Outflows
2 Inflows
ndash4ndash2
02468
10121416
1999 2002 04 06 08 10 12 14 16 18
Source IMF staff calculations
ndash2
0
2
4
6
8
10
12
1999 2002 04 06 08 10 12 14 16 18
Box 12 (continued)
41
C H A P T E R 1 G LO b a L P R O s P E C Ts a N D P O L I C I E s
International Monetary Fund | October 2019
The global forecast rests on the following key assumptions on policies financial conditions and commodity prices bull Tariffs The tariffs imposed and announced by the
United States as of August 2019 and retaliatory measures by trading partners are factored into the baseline forecast For US actions besides tariffs on solar panels washing machines aluminum and steel announced in the first half of 2018 these include a 25 percent tariff on $50 billion in imports from China (July and August 2018) rising to 30 percent in October 2019 tariffs on an additional $200 bil-lion in imports from China (September 2018 at 10 percent until May 2019 25 percent from May through September 2019 and 30 percent there-after) and the August 2019 announcement of a further 10 percent tariff on the remaining $325 bil-lion of imports from China (subsequently increased to 15 percent for a subset of the list beginning in September 2019 and the remainder beginning in December 2019) Chinarsquos retaliation included a 25 percent tariff on $50 billion of imports from the United States (July and August 2018) tariffs of 5ndash10 percent on $60 billion of imports from the United States (September 2018) and additional tariffs of 5ndash10 percent on $75 billion of imports from the United States (effective September and December 2019) Following the May and August 2019 announcements the average US tariff on imports from China will rise to just over 24 percent by December 2019 (compared with about 12frac14 percent assumed in the April 2019 World Economic Outlook (WEO)) while the average Chinese tariff on imports from the United States will increase to about 26 percent (compared with about 16frac12 per-cent assumed in the April 2019 WEO)
bull Fiscal policy Fiscal policy in 2019 is projected to be expansionary both in advanced economies
(Canada Germany Hong Kong SAR Korea Spain United States) and emerging market economies (China Turkey) It is assumed to be neutral across advanced economies in 2020mdashas opposed to contractionary as assumed in the April 2019 WEOmdashgiven that the unwinding of the US tax stimulus will be more than offset by spending increases in a new budget deal It is expected to be contractionary in emerging market economies given that stimulus in China is assumed to unwind to some extent (Figure 131)
bull Monetary policy Compared with the April 2019 WEO monetary policy of major central banks is assumed to be more accommodative over the fore-cast horizon The US federal funds rate is expected to be in the 175ndash2 percent range through 2023 rising to 2ndash225 percent in 2024 Policy rates are assumed to remain below zero in the euro area and Japan through 2024
bull Commodity prices Based on oil futures contracts average oil prices are projected at $618 in 2019 declining to $579 in 2020 (compared with $5916 and $5902 respectively in the April 2019 WEO) Oil prices are expected to decline to about $55 a barrel by 2023 (lower than in the April 2019 WEO forecast) consistent with subdued medium-term demand prospects (Figure 132) Metal prices are expected to increase by 43 percent year over year in 2019 before declining by 62 percent in 2020 (compared with a decrease of 6 percent and a further decline of 08 percent in the April 2019 WEO assumptions) Price forecasts of most major agricultural commodities have been revised down for 2019 Food prices are projected to decline by 34 percent year over year in 2019 before increas-ing by 28 percent in 2020 (compared with the projected decrease of 26 percent and increase of 17 percent in the April 2019 WEO)
Box 13 Global Growth Forecast Assumptions on Policies Financial Conditions and Commodity Prices
42
W O R L D E C O N O M I C O U T L O O K G LO b a L M a N U FaC T U R I N G D OW N T U R N R Is I N G T R a D E b a R R I E R s
International Monetary Fund | October 2019
2015ndash16 (cumulative)2017ndash18 (cumulative)
2015ndash16 (cumulative)2017ndash18 (cumulative)
2019ndash20 (average Sep2019 commodity prices)
2019ndash20 (average Sep2019 commodity prices)
110
105
100
95
90
85
80
75
DZA RUS MYS AUS BRA IDNSAU
USA TUR DEU POL ESP IND THAKORPAKJPNCHNITAFRAEGY
KAZ NGA COL CAN MEX ARG
0
30
20
10
ndash10
ndash20
ndash30
ndash40
10
5
0
ndash5
1 Commodity and Oil Prices(Index 2018 = 100)
2 Terms-of-Trade Windfall Gains and Losses forCommodity Exporters1
3 Terms-of-Trade Windfall Gains and Losses forCommodity Importers1
Sources IMF Primary Commodity Price System and IMF staff estimatesNote Data labels use International Organization for Standardization (ISO) country codes1Gains (losses) for 2019ndash20 are simple averages of annual incremental gains (losses) for 2019 and 2020 The windfall is an estimate of the change in disposable income arising from commodity price changes The windfall gain in year t for a country exporting x US dollars of commodity A and importing m US dollars of commodity B in year t ndash 1 is defined as (Δpt
Axt ndash 1 ndash ΔptBmt ndash 1) Yt ndash 1 in which Δpt
A and Δpt
B are the percentage changes in the prices of A and B between year t ndash 1 and year t and Y is GDP in year t ndash 1 in US dollars See also Gruss (2014)
2018 19 20 21 22 23 24
Food
Metals
Average petroleum spot price
Figure 132 Commodity Price Assumptions and Terms-of-Trade Windfall Gains and Losses(Percent of GDP unless noted otherwise)
2015 2016 20172018 2019 2020
April 2019 WEO
2015 2016 20172018 2019 2020
April 2019 WEO
Figure 131 Forecast Assumptions Fiscal Indicators(Percent of GDP)
1 Change in the Structural Primary Fiscal Balance
2 Change in the Structural Primary Fiscal Balance
Advancedeconomies
Emerging market anddeveloping economies
United States Japan1 FranceGermany
UnitedKingdom
GreeceIreland
ItalyPortugal
Spain
ndash15
ndash10
ndash05
00
05
ndash15
ndash10
ndash05
00
05
10
15
Source IMF staff estimatesNote WEO = World Economic Outlook1Japanrsquos latest figures reflect comprehensive methodological revisions adopted in December 2016
Box 13 (continued)
43
C H A P T E R 1 G LO b a L P R O s P E C Ts a N D P O L I C I E s
International Monetary Fund | October 2019
According to conventional business cycle theory the economy fluctuates symmetrically around a certain level of potential output Consistent with this view estimates of potential output are generally obtained by fitting a smooth trend through output removing busi-ness cycle fluctuations These techniques imply that several advanced economies are now operating close to or above potential facing inflation risks Nonetheless inflation has been remarkably subdued in recent years raising questions about the state of the business cycle and suggesting that potential output could be higher than currently estimated
The sluggish behavior of inflation has renewed inter-est in alternative interpretations of the business cycle One prominent hypothesis is that economic fluctua-tions may behave in line with the ldquoplucking theoryrdquo originally proposed by Friedman (1964 1993) According to this view the economy suffers occasional contractions that reduce the level of output below potential as illustrated in Figure 141 In Friedmanrsquos words ldquooutput is viewed as bumping along the ceiling of maximum feasible output except that every now and then it is plucked down by a cyclical contractionrdquo
Dupraz Nakamura and Steinsson (2019) shows that business cycle dynamics consistent with the pluck-ing theory can occur when wages are sticky downward but can freely adjust upward In this case negative shocks pluck the economy below potential while positive shocks are absorbed through higher prices Accordingly potential output should be estimated not by smoothing out economic fluctuations but by inter-polating historical peaks of the business cycle There-fore current estimation techniques may significantly underestimate potential output and provide premature alarms about the risk of overheating
Conventional estimates of potential output can be too conservative even if wages are also sticky upward provided downward nominal rigidities are more severe Building on this idea Abbritti and Fahr (2013) provides a model in which asymmetric wage rigidities generate economic contractions below poten-tial that are more severe than economic expansions above it Aiyar and Voigts (2019) points out that this leads on average to negative output gaps and that when conventional filtering techniques are applied to the model-generated data they underestimate potential output by generating output gaps centered around zero
The author of this box is Damiano Sandri
To test the validity of the plucking theory the busi-ness cycle can be analyzed for particular asymmetries As shown in Figure 141 if output is temporarily plucked down by occasional contractions the severity of an economic downturn should predict the strength of the subsequent economic expansion By contrast the amplitude of economic expansions should have no bearing on the depth of subsequent contractions
Dupraz Nakamura and Steinsson (2019) performs a similar test looking at the behavior of the unem-ployment rate in the United States1 Consistent with the plucking theory the study finds that increases in the unemployment rate during economic down-turns tend to be followed by reductions of a similar size (Figure 142 panel 1) Declines in unemploy-ment during economic expansions are however not
1The method requires identifying peaks and troughs in seasonally adjusted monthly unemployment rates A point in the unemployment series u t qualifies as a trough if it satis-fies the following criterion Take the first month in which the unemployment rate increases by 15 percent above u t If up to that month the unemployment rate never falls below u t then u t is an unemployment trough A symmetric procedure is used to identify unemployment peaks
Output Potential output
Source IMF staff
Figure 141 An Illustration of the PluckingTheory
Outp
ut
Time
Contraction
Expansion
Box 14 The Plucking Theory of the Business Cycle
44
W O R L D E C O N O M I C O U T L O O K G LO b a L M a N U FaC T U R I N G D OW N T U R N R Is I N G T R a D E b a R R I E R s
International Monetary Fund | October 2019
correlated with subsequent unemployment increases (Figure 142 panel 2)
How well does the plucking theory fit the data for other economies Unemployment dynamics in other Group of Twenty advanced economies reveal similar behavior Panel 3 of Figure 142 displays the pooled data2 It shows that increases in unemployment during economic contractions are followed by proportional unemployment declines during subsequent recoveries However the relationship is marginally weaker than in the United States and the regression coefficient equal to 052 indicates that increases in the unemployment rate are only partially reversed during subsequent economic expansions reflecting a trend increase in structural unemployment Consistent with the pluck-ing theory there is no significant relationship between unemployment declines and subsequent increases (Figure 142 panel 4)
In sum unemployment dynamics in major advanced economies display patterns that appear consistent with theories that generate asymmetric business cycle fluctua-tions while increases in unemployment are at least par-tially reversed declines in unemployment are not More research on the robustness of these asymmetric dynamics and the mechanisms behind them is warranted
The implications of the plucking theory for mac-roeconomic policy are not trivial For example the insight that conventional filtering techniques under-estimate potential output could be used to argue that countries have a stronger structurally adjusted fiscal position (and a smaller fiscal consolidation need) than generally assessed However the plucking theory also implies that economies operate below potential on average Therefore a proper assessment of fiscal sus-tainability should not be based on a measure of poten-tial output consistent with the plucking theory but on the lower expected output path Regarding monetary policy the plucking theory implies a non-linear Philips curve with prices being slow to decline in a downturn because of downward nominal rigidities Monetary policy may therefore want to rely more on measures of economic slack to calibrate the appropriate level of stimulus withdrawing accommodation only when inflationary pressures are clearly materializing
2Data is pooled across the other advanced economies given that they display much fewer observations for the analysis than in the case of the United States This is for two reasons First the unemployment rate series in the United States starts in the late 1940s while data for the other countries tend to be available beginning in the 1970s Second the US unemployment rate involves much more regular swings while it follows more slow-moving trends in other countries
Figure 142 Unemployment Dynamics inAdvanced Economies(Percentage points)
Sources Haver Analytics and IMF staff calculationsNote p lt 001 p lt 005
1 Unemployment Increases and SubsequentDeclines in the United States
2 Unemployment Declines and SubsequentIncreases in the United States
3 Unemployment Increases and SubsequentDeclines in Other Advanced Economies
4 Unemployment Declines and SubsequentIncreases in Other Advanced Economies
1
2
3
4
5
6
7
1 2 3 4 5 6 7
Unem
ploy
men
t dec
lines
dur
ing
subs
eque
nt e
cono
mic
exp
ansi
ons
Unem
ploy
men
t inc
reas
es d
urin
gsu
bseq
uent
eco
nom
ic c
ontra
ctio
ns
Unemployment increases during economic contractions
1
2
3
4
5
6
7
1 2 3 4 5 6 7
Unemployment declines during economic expansions
123456789
1 2 3 4 5 6 7 8 9
Unem
ploy
men
t dec
lines
dur
ing
subs
eque
nt e
cono
mic
exp
ansi
ons
Unemployment increases during economic contractions
123456789
1 2 3 4 5 6 7 8 9
Unem
ploy
men
t inc
reas
es d
urin
gsu
bseq
uent
eco
nom
ic c
ontra
ctio
ns
Unemployment declines during economic expansions
y = ndash04 + x 109
y = ndash17 + x 052
Box 14 (continued)
45International Monetary Fund | October 2019
S P E C I A L F E AT U R E CO M M O D I T y Ma R K E T D E v E LO P M E N Ts a N D F O R E C a s Ts
Energy pricesmdashespecially for coal and natural gasmdashhave seen a broad-based decline since the release of the April 2019 World Economic Outlook (WEO) After a temporary rebound in April led by positive market momentum and supply cuts oil prices have retrenched following record-high US production growth and weaker economic growth prospects especially in emerging mar-kets In response to declining oil prices Organization for the Petroleum Exporting Countries (OPEC) and non-OPEC oil exporters (including Russia) agreed to extend their production cuts until March 2020 While supply concerns caused iron ore and nickel prices to rally most base metal prices declined following continued trade tensions and fears of a global economic slowdown Agricultural prices decreased slightly as an increase in meat prices caused by disease outbreaks was more than offset by price declines of other foods This special feature includes an in-depth analysis of precious metals
The IMFrsquos primary commodity price index declined by 55 percent between February 2019 and August 2019 the reference periods for the April 2019 and current WEO respectively (Figure 1SF1 panel 1) Energy prices drove that decline falling by 131 per-cent food prices decreased by 12 percent and base metal prices decreased by 09 percent driven by con-tinued trade tensions and fears of a global economic slowdown only partially offset by the supply-driven price rally in the iron ore and nickel markets Oil prices rebounded sharply at the beginning of the year surpassing $71 a barrel in April1 driven by positive momentum in financial markets supply cuts and declining US crude oil stockpiles Since then how-ever oil prices have retrenched substantially due to record-high production growth in the United States and subdued global economic growth (especially in emerging markets) In response to the price decline OPEC and non-OPEC oil exporters (including Russia) in July agreed to extend their December 2018 production cuts to the end of the first quarter of 2020 Coal and natural gas prices decreased amid
The authors of this special feature are Christian Bogmans Lama Kiyasseh Akito Matsumoto Andrea Pescatori (team leader) and Julia Xueliang Wan with research assistance from Lama Kiyasseh Claire Mengyi Li and Julia Xueliang Wang
1Oil price in this document refers to the IMF average petroleum spot price which is based on UK Brent Dubai Fateh and West Texas Intermediate equally weighted unless specified otherwise
a decline in industrial activity and power generation across regions
Oil Prices in a Narrow Range amid Energy Pricesrsquo Decline and Heightened Uncertainty
Oil prices have been relatively stable trading within a narrow range this year despite heightened geopolitical uncertainty In April they surpassed $71 their highest for 2019 and hit their recent bottom of $55 in August before rebounding back above $60 in September Initially prices were pushed higher by the recovery of financial conditions as well as outages in Venezuela and US tensions with Iran But in late spring a weaker global economy raised concern about the strength of global oil demand which was amplified by a buildup of US crude oil stockpiles
Supply outages and geopolitical tensions however masked the oil demand weakness and so temporarily supported prices Venezuela suffered production loss after a power outage in March and Russian oil exports were partially halted in May because of pipeline con-tamination Although these outages were temporary they helped balance the market resulting in lower US inventories in early spring In addition in May pre-viously issued US waivers to eight major importers of Iranian crude oil were not extended Moreover geopo-litical tensions in the Middle East rose because of sev-eral attacks on Saudi oil infrastructures and oil tankers near the Strait of Hormuz given that about 20 percent of global crude oil trade passes through the Strait the fear of a conflict in that area drives up precautionary oil demand and insurance costs On September 14 an attack on two key oil facilities in Saudi Arabia knocked out 57 million barrels per day of production for a few days (that is about half of Saudi Arabiarsquos total pro-duction or 5 percent of global oil production) raising initially the fear of disruptions in the physical crude oil market and further escalating tensions Further support for oil prices came from OPEC and non-OPEC oil exporters (including Russia) which on July 1 2019 agreed to extend their crude oil production cuts beyond their initial six-month period for an additional nine months until March 2020 by 08 million barrels a day (mbd) and 04 mbd respectively
On the demand side weaker global economic fundamentals have contributed to lower prices
Special Feature Commodity Market Developments and Forecasts
46
W O R L D E C O N O M I C O U T L O O K G LO b a L M a N U FaC T U R I N G D OW N T U R N R Is I N G T R a D E b a R R I E R s
International Monetary Fund | October 2019
The IMFrsquos October downward revision of the global growth forecastmdashby 03 percent to 30 percent and by 02 percent to 34 percent for 2019 and 2020 respec-tively from its April forecastmdashillustrates a slowdown in global activity driven in particular by emerging markets and the euro area In line with this slowdown the International Energy Agency revised its oil demand growth forecast as of September for this year down to 11 mbd from 14 mbd in February
In the natural gas market spot prices have been declining in recent months amid increased produc-tion and higher stock levels due to lower global power demand Coal prices have decreased in tandem because of declining power generation Further downward pressure followed last yearrsquos record retirement of US coal-fired power capacity Its replacement by cheaper gas-fired power plants as part of a global trend has lowered the share of coal in US power generation Despite the ongoing decarbonization of the power sector in the United States and the rest of the world however global greenhouse gas emissions increased again in 2018 following strong global growth (see Box 1SF1)
As of late September 2019 oil futures contracts indicate that Brent prices will gradually decline to $55 over the next five years (Figure 1SF1 panel 2) Base-line assumptions also based on futures prices suggest average annual prices of $618 a barrel in 2019mdasha decrease of 96 percent from the 2018 averagemdashand $579 a barrel in 2020 for the IMFrsquos average petroleum spot prices Despite the weaker demand outlook risks are tilted to the upside in the near term but balanced in the medium term (Figure 1SF1 panel 3) Upside risks to prices in the short term include ongoing geopolitical events in the Middle East disrupting oil supply and contributing to rising insurance and ship-ping costs of oil cargoes Downside risks include higher US production and exports thanks to new Permian pipelines coming online noncompliance among OPEC and non-OPEC members and a downturn in petrochemical demand Further a rise in trade tensions and other risks to global growth could decelerate global activity and reduce oil demand in the medium term
Metal Prices MixedBase metal prices declined slightly by 09 percent
between February 2019 and August 2019 as continued trade policy uncertainty and fears of a global economic slowdownmdashespecially in Chinamdashwere only partially offset by supply-driven price increases in iron ore
Aluminum CopperIron ore Nickel
Futures68 percent confidence interval86 percent confidence interval95 percent confidence interval
April 2018 WEO April 2019 WEOOctober 2018 WEO October 2019 WEO
All commodities EnergyFood Metals
Sources Bloomberg Finance LP IMF Primary Commodity Price System Thomson Reuters Datastream and IMF staff estimatesNote WEO = World Economic Outlook1WEO futures prices are baseline assumptions for each WEO and are derived from futures prices October 2019 WEO prices are based on September 17 2019 closing2Derived from prices of futures options on September 17 2019
50
100
150
200
250
300
0Jan2016
Jan17
Jan18
Jan19
Jan20
Jan21
0
40
80
120
160
200
2013 14 15 16 17 18 19 20 21 22
50
100
150
200
250
300
350
2005 06 07 08 09 10 11 12 13 14 15 16 17 18
Figure 1SF1 Commodity Market Developments
1 Commodity Price Indices(2016 = 100)
30
40
50
60
70
80
90
Dec 2017 Dec 18 Dec 19 Dec 20 Dec 21 Dec 22 Dec 23
2 Brent Futures Curves1
(US dollars a barrel expiration dates on x-axis)
3 Brent Price Prospects2
(US dollars a barrel)
4 Metal Price Indices(Jan 1 2016 = 100)
47International Monetary Fund | October 2019
S P E C I A L F E AT U R E CO M M O D I T y Ma R K E T D E v E LO P M E N Ts a N D F O R E C a s Ts
and nickel Precious metal prices rose reflecting in part increased expectations of monetary easing in the United States and a flight to safety amid trade tensions
Iron ore prices increased 67 percent between February 2019 and August 2019 Widespread disruptionsmdashincluding the Vale dam collapse in Brazil and tropical cyclone Veronica in Australiamdashcoupled with record-high steel output in China pushed iron ore prices to five-year highs during the first half of 2019 However the normalization of previously disrupted operations and escalating trade tensions between the United States and China triggered a sharp correction in August partially offsetting the gains since the beginning of the year The price of nickel a key input for stainless steel and batteries in electric vehicles gained 241 percent between February 2019 and August 2019 on supply concerns as Indonesia the worldrsquos largest nickel pro-ducer introduced a complete ban on exports of raw nickel ore beginning in January 2020
Other base metal prices suffered from a weaker global economy however Copper prices declined 94 percent on global trade uncertainty despite recent production cuts in the Republic of Congo a labor dispute in Chuquicamata (Chile) and increasing extraction costs in Indonesiarsquos Grasberg mine The price of aluminum fell by 66 percent because of overcapacity in China and weakening demand from the vehicle market there The price of zinc which is used mainly to galvanize steel decreased 16 percent from February to August 2019 as steel demand prospects deteriorated The price of cobalt continued its downward trend and declined by 61 percent reflecting a supply glut after production was ramped up in the Democratic Republic of the Congo
The IMF annual base metals price index is projected to increase by 43 percent in 2019 (relative to its average in 2018) and decrease by 62 percent in 2020 Major downside risks to the outlook include prolonged trade negotiations and a further slowdown of industrial activity globally Upside risks are supply disruptions and more stringent environmental regulations in major metal producing countries
Meat Prices Higher Following Animal Disease Outbreaks
The IMFrsquos food and beverage price index has decreased slightly by 13 percent as price declines of cereals vegetables vegetable oils and sugar overwhelmed a large 132 percent increase in the meat index
Following the rapid spread of African swine fever across China (the worldrsquos largest producer and con-sumer of pork) and other parts of Southeast Asia prices of pork jumped by 428 percent News of disease outbreaks and animal culling have raised uncer-tainty regarding Chinese pork supplies in the near future The outbreak has also led to tighter supplies and higher prices in Europe and the United States as domestic producers increased exports to China In the wake of the crisis prices of some other animal proteins surged too with beef for example rising by 83 percent
Record rainfall in the Midwest of the United States delayed corn and soybean-planting in May and June introducing a high weather premium into grain mar-kets This premium then left the markets between late July and end of August however as US corn acreage and yields surpassed expectations Strong global pro-duction also weighed on corn prices which ultimately decreased by 36 percent between February and August Soybeans experienced a net loss of 59 percent as trade tensions and the African swine fever outbreak in China continued to depress animal feed demand
Cocoa prices decreased by 27 percent following favorable weather conditions in west Africa during July and August Palm oil prices declined by 26 percent given that inventories are expected to increase and global demand in 2019ndash20 may shrink for the first time in two decades following environmental concerns in some importing countries and rising competition from other vegetable oils
Food prices are projected to decrease by 34 percent a year in 2019 mainly because of higher prices in the first half of 2018 and then increase by 28 percent in 2020 Weather conditions have been unusual in recent months and additional weather disruptions remain an upside risk to the forecast On August 9 2019 the US National Oceanic and Atmospheric Administration announced that El Nintildeo climate conditions that started last September are now officially over A resolution of the trade conflict between the United Statesmdashthe worldrsquos largest food exportermdashand China remains the largest source of upside potential for prices
Precious MetalsWhat determines fluctuations in the prices of
precious metals What are they used for primarily Are gold and other precious metals the ultimate haven and hedging instruments against the loss of monetary
48
W O R L D E C O N O M I C O U T L O O K G LO b a L M a N U FaC T U R I N G D OW N T U R N R Is I N G T R a D E b a R R I E R s
International Monetary Fund | October 2019
discipline or is their role as a store of value overstated This section tries to answer these questions by offering a brief historical overview then investigating the basic characteristics of precious metals including the geo-graphical distribution of their production and finally through an econometric analysis to test some possible answers to these questions
Coinage Money and Precious Metals A Brief Historical Overview
Since ancient times luster ductility rarity and remarkable chemical stability have conferred high value on precious metals (that is gold and silver and later platinum and palladium which share similar physical properties)2 The first use of gold and silver for orna-ments rituals and to signal social status dates to pre-historic times and was widespread across cultures and civilizations (Green 2007) The combination of these unique characteristics made precious metals excellent stores of value and probably was crucial in fostering the introduction of coinsmdasha fundamental innovation in the history of money and a transition in the develop-ment of civilization itself (Mundell 2002) Coinage in turn inextricably connected precious metals to money and currencies for centuries3
Thanks also to their density gold and silver coins were strongly favored as medium of exchange relative to other metals (such as copper) especially for (sizable) international transactions As a result
2Gold and silver belong to the seven metals of antiquity (with copper tin lead iron and mercury) Today 86 metals are known The first European reference to platinum appears in 1557 in the writings of the Italian humanist Giulio Cesare della Scala Only at the end of 18th century however did platinum gain appreciation as a precious metal Palladium was discovered by William Hyde Wollaston in 1802 (curiously named after the asteroid 2 Pallas) and has been used as a precious metal in jewelry since 1939 as an alternative to platinum in alloys called ldquowhite goldrdquo (The naturally white color of palladium does not require rhodium plating) Other precious metals in addition to those analyzed include the platinum group metals ruthe-nium rhodium osmium and iridium which are however not widely traded
3The introduction of coinage is still shrouded in mystery but it seems likely that the first coin (the electrum a mix of gold and silver) was minted in Lydia around 600 BCE and it rapidly spread throughout the Mediterranean area The Lydian electrum coins were overvalued yielding profit or seigniorage to the issuer This overvaluation indicates that the issuing state must have been strong enough to enforce a monopoly of coinage inhibiting entry by means of drastic prohibitions (Mundell 2002)
some gold and silver coins minted by reliable entities gained wide international acceptance (for example gold florins and ducats in the Middle Ages and silver pesos in modern times)mdashfacilitating and stimulating trade across kingdoms and civilizations (Vilar 1976)4
Mixed metallic standards in which government or central bank notes are convertible into metal coins at a fixed price were a natural evolution to overcome some of the obvious limitations of pure coin stan-dards (Officer 2008) After centuries of widespread bimetallism in which the goldndashsilver ratio is given by the mint price in the third quarter of the 19th century following the lead of Britain monometallic gold standards prevailed across the major economic powers of that timemdashpossibly stimulating global trade5 As silver was demonetized across the world silver prices declined substantially especially after the 1873 Coinage Act (also known as the ldquoCrime of rsquo73rdquo Friedman 1990) Hence after thousands of years of relative stability the silverndashgold price ratio became volatile and shot up from 161 in the mid-1800s to almost 1001 in subsequent decades (Figure 1SF2 panel 2)6
The stability of gold purchasing power was quite remarkablemdashwith the exception of the world wars and the Great Depressionmdashuntil the suspension of dollar-gold convertibility in 1971 which two years
4By 500 BCE after Darius conquered Lydia Persia embraced coinage (opting for a bimetallic monetary standard) and struck massive quantities of Persian sigloi (a silver coin) which became the international currency of its time along with two other Anatolian coins (that is the gold coins of Lampsacus and the electrum coins of Cyzicus) (Mundell 2002) After the Roman aureum in the middle ages the gold Florentine florins and Venetian ducats became accepted across Europe while the silver peso (also known as the ldquopiece of eightrdquo) minted in the Spanish Empire was the interna-tional currency of modern times the antecedent of the US dollar and was legal tender in the United States until the Coinage Act of 1857 (Vilar 1976)
5Some studies have found that the rise of the classical gold standard between 1870 and 1913 could account for 20 percent of the increase in global trade between 1880 and 1910mdashstrongly supporting the idea that commodity money regime coordination and currency unions were an important catalyst for 19th century globalization (Lopez-Cordova and Meissner 2003)
6Silver was demonetized first in the United Kingdom in 1819 later during the 1870s in Germany France the Scandina-vian Union the Netherlands Austria Russia and in the Latin Monetary Union (Belgium Italy and Switzerland) and in the United States with the 1973 Coinage Act By the late 1870s China and India were the only major countries effectively on a silver standard
49International Monetary Fund | October 2019
S P E C I A L F E AT U R E CO M M O D I T y Ma R K E T D E v E LO P M E N Ts a N D F O R E C a s Ts
later led to the collapse of the system inaugurating a new era of fluctuating gold prices and indefinitely sev-ering the link between precious metals and currencies (Figure 1SF2)
Even today in a world of fiat currencies the legacy of gold-currency convertibility is visible as official holdings of goldmdashmostly held by central banks and international institutions such as the IMF and the Bank for International Settlementsmdashstill represent a large share of the total stock of the precious metals of official reserves and sometimes even of a countryrsquos public debt (Table 1SF1)
The next section investigates the current role of precious metals in the global economy looking at their production volumes and values (sizable for various countries) and their usage
Basic Facts about Precious Metals
The Production of Precious Metals and Its Geographical Distribution
The production of precious metals especially plat-inum and palladium is concentrated in a few places The global flow of production for gold was about 3260 metric tons in 2018 equivalent to about $134 billion The top five producers (China Australia Russia United States Canada) make up more than 40 percent of production The value of gold production is bigger than copper and dwarfs other precious metals Global pro-duction of silver palladium and platinum was $13 bil-lion $9 billion and $4 billion in 2018 respectively Their production however is much more concentrated for example the two largest silver producers (Mexico and Peru) represent almost 40 percent of global pro-duction Similarly Russia and South Africa account for three-quarters of global palladium production while South Africa alone accounts for more than two-thirds of global platinum production (Table 1SF2)
Taken as a group total production and reserves of precious metals represent a nonnegligible share of GDP (exports) for various countries (Figure 1SF3) especially for medium and small low-income countries (for exam-ple Burkina Faso Ghana Mali Suriname) Fluctuations in prices may thus induce significant income and wealth effects on a wide variety of countries
The mining of precious metals is relatively inelastic to prices as a price boom in the mid-2000s showed (Erb and Harvey 2013) Precious metal production ratios exhibit no clear trend over a long period and the goldndashsilver ratio was surprisingly barely affected by the American silver production boom of the 16th and 17th centuries (Table 1SF3)7 In addition silverndashgold production and price ratios have shown no obvious relationship in the past decade suggesting that the relative supply of precious metals has not been a significant source of price fluctuations
The Use of Precious Metals
Demand for precious metals can be classified as follows industrial jewelry and investment and net official purchases by central banks and
7Interestingly while the production volume of precious metals has increased about 500 times since 1500 global GDP and population have increased 50 and 15 times respectively (Malanima 2009) Over the same period the purchasing power of gold and silver has not declined (Erb and Harvey 2013)
World War IGold Reserve ActCoinage Act 1873Goldsilver
Great DepressionBretton WoodsGold sale moratoriumGold
Silver
000
001
002
003
004
005
006
007
008
009
1850 60 70 80 90 1900 10 20 30 40 50 60 70 80 90 2000 18
0
20
40
60
80
100
120
1850 60 70 80 90 1900 10 20 30 40 50 60 70 80 90 2000 18
Figure 1SF2 Gold and Silver Prices
Sources Measuringworthcom Minneapolis Federal Reserve and IMF staff calculationsNote USD = US dollars
2 UK GoldndashSilver Price(Ratio)
1 Historical Real Prices(USDounce)
50
W O R L D E C O N O M I C O U T L O O K G LO b a L M a N U FaC T U R I N G D OW N T U R N R Is I N G T R a D E b a R R I E R s
International Monetary Fund | October 2019
Table 1SF1 Official Gold Reserves
TonsValue
($ billions)Percent of Reserves
Percent of Public Debt
1970 1980 1990 2000 2010 2019 2019United States 9839 8221 8146 8137 8133 8133 332 75 2Germany 3537 2960 2960 3469 3407 3368 137 70 6International Monetary Fund 3856 3217 3217 3217 2934 2814 115 ndash NAItaly 2565 2074 2074 2452 2452 2452 100 66 4France 3139 2546 2546 3025 2435 2436 99 61 4Russian Federation ndash ndash ndash 343 710 2183 88 19 39China ndash 398 395 395 1054 1900 77 2 1Switzerland 2427 2590 2590 2538 1040 1040 42 5 15Japan 473 754 754 754 765 765 31 2 0India 216 267 333 358 558 613 25 65 5Netherlands 1588 1367 1367 912 612 612 25 6 1European Central Bank ndash ndash ndash 747 501 505 21 28 NATaiwan Province of China 73 98 421 421 424 424 17 4 8Portugal 802 689 492 607 383 383 16 60 5Kazakhstan ndash ndash ndash 56 67 367 15 56 40Uzbekistan ndash ndash ndash ndash ndash 355 14 53 136Saudi Arabia 106 142 143 143 323 323 13 3 9United Kingdom 1198 586 589 563 310 310 13 8 1Turkey 113 117 127 ndash ndash 296 12 14 5Lebanon 255 287 287 287 287 287 12 23 14Sources IMF International Financial Statistics World Gold Council and IMF staff calculationsNote 2019 values are as of March
Table 1SF2 Precious Metals Production 2016ndash18
Gold Value ($ billions)Cumulative World Share (Percent) Silver Value ($ billions)
Cumulative World Share (Percent)
China 131 11 Mexico 31 21Australia 93 18 Peru 23 37Russia 85 26 China 17 48Kazakhstan 84 32 Chile 07 53United States 74 39 Russia 07 58Ghana 74 45 Poland 07 63Peru 62 50 Australia 07 67Canada 62 55 Bolivia 07 72Brazil 56 59 Kazakhstan 06 76Papua New Guinea 47 63 Argentina 06 80South Africa 45 67 United States 05 84Mexico 42 71 Other Countries 24 100Other Countries 356 100 World 148World 1213
Palladium Value ($ billions)Cumulative World Share (Percent) Platinum Value ($ billions)
Cumulative World Share (Percent)
Russia 22 39 South Africa 39 70South Africa 21 75 Russia 07 82Canada 05 83 Zimbabwe 04 89United States 04 90 Canada 03 95Zimbabwe 03 95 United States 01 97Other Countries 03 100 Other Countries 02 100World 58 World 56Sources IMF Primary Commodity Price System United States Geological Survey and IMF staff calculationsNote Three-year average (2016ndash18) of both prices and production
51International Monetary Fund | October 2019
S P E C I A L F E AT U R E CO M M O D I T y Ma R K E T D E v E LO P M E N Ts a N D F O R E C a s Ts
international organizations More than half of newly mined gold is used in jewelry (Figure 1SF4) Silver instead has various industrial applications which account for half of silver consumption while only 25 percent of silver demand is for jewelry Investment demand for gold and silver (in the form of coins and bars or holdings in exchange-traded funds) varies significantly as it is more sensitive to prices8 Industrial use is more important for plati-num and especially palladiummdashwhich are used in catalytic converters by the car industry
Official sector gold holdings are large accounting for about 30 percent of the global stock of gold Their sale can disrupt the market and therefore has been limited to 400 metric tons a year9 The declining role of gold in the balance sheets of central banks in advanced economies however has been more than offset by a recent surge in emerging market gold reserves (Table 1SF1) The next section will take a financial investment perspective on precious metals by looking at them as an asset class analyzing their major price determinants and paying attention to their safe haven and hedging properties during market turmoil and against high inflation
Price Properties of Precious Metals
Precious metals can be considered an asset class of their own Their returns show a high correlation among themselves especially gold silver and platinum consistent with their respective ranking in industrial use (Figure 1SF5) At monthly frequencies gold and silver have the highest correlation 072 while palladium and gold have the lowest at 033 At lower frequencies pal-ladium prices are more related to industrial metals (such as copper) than to gold but the highest correlation for palladium is still with its close substitute platinum Movements in global industrial production have how-ever minor implications for precious metal prices even for palladium and platinum (Table 1SF5)
The relationship between precious metals and infla-tion throughout history has changed with the mone-tary system in place In historical metallic regimes in
8The exchange-traded fund GLD holds 20 percent of total stock scattered in warehouses across the world Scrap metal is another significant price-sensitive source of supply which for gold is almost half of mining production
9The central bank moratorium on gold sales in September 1999 led the price of gold to rise by 25 percent within a month There have since been three further agreements in 2004 2009 and 2014 limiting the amount of gold that signatories can sell in any one year
SUR
GUY
BFA
MLI
PNG
ZWE
GIN
MRT UZB
GHA
COD
ZAF
PER
TZA
TJK
BOL
NIC
CIV
DOM
LAO
ZAF
SUR
PNG
BFA
MRT
MNG MLI
ZWE
UZB
KGZ
ZAF
GHA
CAF
GUY
PER
GIN
GHA
TJK
LBR
SEN
05
1015202530354045
0
100
200
300
400
500
600
700
01020304050607080
SUR
MLI
BFA
GHA
KGZ
TZA
GUY
SDN
ZWE
BDI
BOL
PER
DOM
MRT
UGA
SEN
ZAF
MNG
NAM
EGY
Figure 1SF3 Macro Relevance of Precious Metals(Percent)
SUR
GUY
BFA
GHA
KGZ
MLI
MRT
MNG BO
L
ZWE
PER
NAM
ZAF
TZA
NIC
CIV
DOM
SEN
UGA
SDN
0
10
20
30
40
Sources IMF Primary Commodity Price System SampP Global Market Intelligence Thomson Reuters Datastream UN COMTRADE United States Geological Survey World Bank World Development Indicators and IMF staff calculationsNote Data labels use International Organization for Standardization (ISO) country codes
3 Production Share of GDP
2 Net Export Share of Total Exports
4 Reserves Share of GDP
1 Net Export Share of GDP
52
W O R L D E C O N O M I C O U T L O O K G LO b a L M a N U FaC T U R I N G D OW N T U R N R Is I N G T R a D E b a R R I E R s
International Monetary Fund | October 2019
which a currency was pegged to metals such as under the Bretton Woods system an increase in price was associated with a decline in the real price of metals (Figure 1SF6) This result is however reversed in contemporary fiat currency regimes
Bekaert and Wang (2010) proposes testing whether an asset is a good inflation hedge by simply regressing its nominal return on inflation arguing that if the regression slope (inflation beta) is 1 then the asset is
a good inflation hedge Averages of precious metalsrsquo inflation betas calculated across a broad set of countries during 1978ndash201910 are below 1 at monthly frequen-cies but get close to 1 as the horizon increases espe-cially for gold and silver (Table 1SF4) However the regression fit is usually modest and betas vary substan-tially across countries (see Online Annex Table 1SF1) suggesting that precious metals including gold and sil-ver are not a reliable and robust inflation hedge11 This result however is not that surprising given that the volatility of precious metal prices increased substan-tially after the end of the Bretton Woods agreements even for gold It does however suggest that gold prices peaked in 1980 and 2012 two periods during which there was fear justified or not of a globally widespread wave of high inflation12 This observation would call
10Executive Order 6102 issued in 1933 prohibited hoarding of gold coins gold bullion and gold certificates in the continental United States The limitation on gold private ownership in the United States was repealed in 1974 leading to a resumption of gold bullion trading in spot and futures markets in 1975
11A similar conclusion is obtained when testing for the presence of a unit root in the real price of precious metals over a long time span Most of the tests are inconclusive suggesting that metal prices are not an obvious inflation hedge In fact even though long-term real returns are close to zero fluctuations in the real price of precious metals can be very persistent especially in local currency
12In early 1980 US consumer price inflation peaked at almost 15 percent By 2012 many central banks around the world had embarked on quantitative easing the Federal Reserve balance sheet doubled in size while consumer price inflation in the United States had peaked at almost 4 percent in the previous year Bekaert and Wang (2010) argues that the ldquorecent crisis has made market observers and economists wonder whether inflation will rear its ugly head again in years to come Central banks across the world have injected substantial amounts of liquidity in the financial system and public debt has surged everywhere It is not hard to imagine that inflationary pressures may resurface with a vengeance once the econ-omy reboundsrdquo In both episodes however concerns were probably overplayed given that inflation declined in the subsequent years (in most advanced economies)
Table 1SF3 Relative Rarity(Production ratios of volume)
American Silver Production Boom
Early 1500s 1500s 1600s 1700s 1800s 1900ndash10 1995ndash99 2000ndash04 2005ndash09 2010ndash14 2015ndash18Silver (volume in
metric tons)47 233 373 570 2223 5655 16260 19280 21120 24920 26775
Silver to Platinum 104 102 100 132 144Silver to
Palladium119 105 104 126 124
Silver to Gold 81 327 408 300 119 102 70 76 88 91 85Silver to Copper 00014 00014 00014 00015 00013GoldndashSilver
Price Ratio110 113 135 150 192 357 648 642 579 569 754
Sources Broadberry and Gupta (2006) United States Geological Survey Vilar (1976) and IMF staff calculationsNote Historical production ratios are century averages
InvestmentIndustrial use
JewelryOfficial sector
Figure 1SF4 Share of Total Demand
ndash20
0
20
40
60
80
100
Gold Silver Platinum Palladium
Sources 2018 World Silver Survey PGM Market Report and World Gold CouncilNote Investment includes coins bars and exchange traded fundsrsquo inventory changes for silver jewelry includes silverware for platinum and palladium industrial use includes autocatalysts 2015ndash17 averages
104
ndash59
59234
297
1038
636
52476
21305
243
523
(Percent)
53International Monetary Fund | October 2019
S P E C I A L F E AT U R E CO M M O D I T y Ma R K E T D E v E LO P M E N Ts a N D F O R E C a s Ts
for testing precious metalsrsquo ability to hedge against tail events such as the collapse of major fiat currency systemsmdasha daunting task however given that that has never happened
A more viable alternative is to regress precious metal prices on a measure of inflation risk (such as past inflation volatility or inflation forecast dispersion) and a set of control variables (Table 1SF5) Results of the analysis support the view that precious metal prices react to inflation concerns The analysis uses monthly data starting in 1978 and controlling for the exchange rate (traditionally an important determinant) Treasury yields (a proxy for carrying costs) mean reversion and expected and surprise inflation An increase in inflation uncertainty by one standard deviation tends within a month to raise the price of gold by 08 percent and silver by 16 percent A decline in inflation uncertainty can explain half of the observed gold price decline of the 1990s and one-third of the price rise after 2008
The role of inflation uncertainty is instead posi-tive but not significant for platinum and palladium yet irrelevant for copper Interestingly because of dollar invoicing an appreciation of the US dollar has a simi-lar strong negative effect on all metals tested including copper What is more surprising is a coefficient above
Gold SilverPlatinum PalladiumCopper Oil
00
02
04
06
08
10
Gold Silver Platinum Palladium
00
02
04
06
08
10
Gold Silver Platinum Palladium
1 Correlations between Monthly Returns
2 Correlations between Annual Returns
Figure 1SF5 Correlation Precious Metals Copper and Oil
Sources IMF Primary Commodity Price System and IMF staff calculationsNote Sample period of gold silver copper and oil is from 1970M1 to 2019M5 Platinum starts in 1976 Palladium starts in 1987
Sources Measuringworthcom Minneapolis Federal Reserve and IMF staff calculationsNote A regression of annual real gold price change (silver) on US consumer price index inflation shows a negative coefficient before 1973 but positive thereafter
ndash04
ndash02
00
02
04
06
08
ndash04
ndash02
00
02
06
04
08
ndash010 ndash005 000 005 010 015 020 025 030ndash015
ndash010 ndash005 000 005 010 015 020 025 030ndash015
ndash010 ndash005 000 005 010 015 020 025 030ndash015
ndash04
ndash02
02
00
04
06
08
ndash010 ndash005 000 005 010 015 020 025 030ndash015
4 PostndashBretton Woods Silver
y = 17359x ndash 00588R 2 = 00372
1 PrendashBretton Woods Gold
y = ndash05x ndash 00002R 2 = 01917
3 PostndashBretton Woods Gold
2 PrendashBretton Woods Silver
y = 04843x ndash 00049R 2 = 00599
y = 18369x ndash 00392R 2 = 00762
ndash04
ndash02
00
02
06
04
08
Figure 1SF6 Precious Metals versus Consumer Price Index Inflation
54
W O R L D E C O N O M I C O U T L O O K G LO b a L M a N U FaC T U R I N G D OW N T U R N R Is I N G T R a D E b a R R I E R s
International Monetary Fund | October 2019
unity suggesting that metal prices are excessively sensi-tive to the US dollar13
In addition to tail events in the monetary sphere precious metals have been considered safe assets during sharp movements in economic and pol-icy uncertainty as proxied by stock price changes Table 1SF6 shows that gold and (to a lesser extent)
13Capie Mills and Wood (2005) and Sjaastad (2008) examine the hedge property of gold with respect to changes of the US dollar and show that dollar exchange rates and gold prices are inversely related This result has also been found for oil prices (Kilian and Zhou 2019)
silver returns do not correlate during days of high stock market swings the top 30 stock market booms are associated with a stable gold price on average while the top 30 stock market declines are associated with an average slight increase in gold prices (there is still-sizable uncertainty around the average reaction) This safe haven propertymdashwhich stands out for gold and to a lesser extent silver but is not present for platinum nor especially palladiummdashis shared by the US dollar and Treasury notes typical safe haven assets It is not shared by other base metals Finally cryptocurrencies which have some similarities to gold
Table 1SF4 World Average Inflation BetasHorizon Gold Silver Platinum Palladium1 Month 042 048 044 0406 Months 077 081 077 06612 Months 090 089 082 0615 Years 105 105 089 072
Sources IMF International Financial Statistics IMF Primary Commodity Price System Newey and West (1987) and IMF staff calculations Note The betas reported are weighted averages across all countries (weight = the inverse of the NeweyndashWest standard errors) For each country betas come from regressions between log difference of 1-month 6-month 12-month and 5-year nominal precious metal prices in local currency and inflation correspond-ing to the same horizon
Table 1SF5 Determinants of One-Month Return on Precious Metals(1)
Gold(2)
Silver(3)
Platinum(4)
Palladium(5)
CopperIndustrial Production 0095
(026)ndash0018
(ndash003)0487
(094)1049
(143)1993
(379)Inflation Surprise 2583
(224)2690
(132)3117
(241)0407
(022)1297
(106)Lag of Inflation Expectation 0406
(086)ndash0086
(ndash010)ndash0128
(ndash024)ndash2235
(ndash329)ndash0062
(ndash015)Oil Price ndash0001
(ndash074)0002
(114)0002
(159)000292
(201)000371
(398)US Treasury Bill ndash17210
(ndash187)5885
(031)0061
(001)6004(215)
ndash5640(ndash074)
Lag of US Treasury Bill 12330(134)
ndash10760(ndash059)
ndash2681(ndash032)
ndash53170(ndash186)
4101(052)
Lag of Precious Metal Real Price ndash00163(ndash331)
ndash00341(ndash343)
ndash00286(ndash306)
ndash0012(ndash124)
ndash0013(ndash169)
Exchange Rate ndash1219(ndash693)
ndash1437(ndash417)
ndash1456(ndash619)
ndash0561(ndash168)
ndash1365(ndash499)
Inflation Volatility 0909(234)
2373(28)
0821(155)
1327(162)
0254(057)
Constant 00293(262)
ndash00792(ndash328)
00654(322)
00456(202)
0049(185)
Sample Start Date 1980m1 1980m1 1980m1 1987m2 1980m1Sample End Date 2018m12 2018m12 2018m12 2018m12 2018m12R2 018 015 021 015 026
Sources Consensus Economics Forecast IMF Primary Commodity Price System Thomson Reuters Datastream University of Michigan Survey of Consumers and IMF staff calculations Note Variables are in logarithmic scale Industrial Production and Oil Price are in log difference Lag of Precious Metal Real Price = real price of dependent variable in US dollars Exchange Rate = exchange rate constructed to be orthogonal to other independent variables using nominal effective exchange rate Inflation Volatility = rolling standard deviation of inflation over 36-month window t statistics in parenthesesp lt 005 p lt 001 p lt 0001
55International Monetary Fund | October 2019
S P E C I A L F E AT U R E CO M M O D I T y Ma R K E T D E v E LO P M E N Ts a N D F O R E C a s Ts
and silver do not appear to be safe havens during stock market routs1415 Moreover unlike gold and silver they do not have intrinsic value
Conclusions
Precious metals are macrorelevant (more so for some low-income countries) and have relevant industrial use especially platinum and palladiummdasheven though their
14Cryptocurrency prices proxied by Bitcoin are calculated for 2011ndash19
15As is true of gold and silver the supply of some cryptocurren-cies is limited Cryptocurrencies also appeal to users and investors because of their decentralized nature and anonymity
price is only mildly affected by global activity Gold and silver can function as inflation hedges but this property should not be overstated especially when changes in inflation are modest Instead given their historical role in monetary systems and purchasing power stability gold and silver seem to have been buoyed at times by the (possibly irrational) fear of a collapse of major fiat currency systems The safe haven properties of precious metals have probably been more apparent during some (but not all) major economic and policy shocks proxied by stock market swings that triggered or reversed inves-tor flight to safetymdashwith gold standing out as a safe asset much like US Treasury notes Crypto assets do not seem to share this property so far
Table 1SF6 Asset Returns Associated with Largest Single-Day Changes in the SampP 500 Index(Percent change)
SampP 500 Gold Silver Platinum Palladium US dollar 10Y Yield Metals Bitcoin
Top 3053 00 ndash02 01 07 ndash03 49 05 12
(4355) (ndash111) (ndash2509) (ndash1216) (ndash1237) (ndash0803) (ndash29112) (ndash1723) (ndash1217)
Top 5047 ndash04 ndash06 02 03 ndash02 53 04 09
(3849) (ndash1307) (ndash2506) (ndash0917) (ndash1522) (ndash0605) (ndash25128) (ndash1421) (ndash0825)
Top 10039 ndash03 ndash04 03 03 ndash01 56 06 00
(3142) (ndash0705) (ndash1607) (ndash0715) (ndash0814) (ndash0605) (ndash09122) (ndash0418) (ndash3909)
Bottom 30ndash60 06 02 ndash05 ndash09 03 ndash92 ndash27 ndash03
(ndash69ndash48) (ndash0818) (ndash0407) (ndash1509) (ndash213) (ndash0208) (ndash177ndash3) (ndash4ndash18) (ndash2541)
Bottom 50ndash52 05 01 ndash04 ndash10 01 ndash91 ndash20 ndash26
(ndash6ndash39) (ndash0818) (ndash0606) (ndash1611) (ndash2209) (ndash0508) (ndash142ndash34) (ndash38ndash04) (ndash4342)
Bottom 100ndash42 03 00 ndash04 ndash09 01 ndash75 ndash15 ndash14
(ndash46ndash31) (ndash0612) (ndash111) (ndash1411) (ndash2108) (ndash0507) (ndash117ndash36) (ndash27ndash01) (ndash437)Sources Thomson Reuters Datastream and IMF staff calculationsNote Numbers represent asset returns (percent change) associated with large changes in the SampP 500 For example Top 30 and Bottom 30 refer to the average percent change of the 30 largest single-day increases and decreases respectively of the SampP 500 Data for all asset returns are sorted based on SampP 500 10Y Yield is the daily basis point difference on 10-year US bond yields For all other indicators data are daily growth rates For Bitcoin the time period is August 18 2011 to August 19 2019 Metals is the IMF base metals index For all other indicators the time interval is January 1 1998 to August 19 2019 Bitcoin numbers are adjusted by multiplying by the ratio of the SampP 500 movements over the aforementioned time intervals Data in the parenthesis are the interquartile range
56
W O R L D E C O N O M I C O U T L O O K G LO b a L M a N U FaC T U R I N G D OW N T U R N R Is I N G T R a D E b a R R I E R s
International Monetary Fund | October 2019
To slow the pace of climate change carbon emis-sions need to be reduced But how have emissions changed over the past decade And which countries are driving those changes Although global carbon emis-sions were flat between 2014 and 2016 they alarm-ingly rebounded in 2017 and 2018 (Figure 1SF11)
China has been a key driver of emission growth since the turn of the century but its impact has diminished in recent years as economic reforms have picked up pace India and other emerging markets instead are partially filling the gap In 2018 emissions decreased in all Group of Seven economies besides the United States whose emissions increased because of a resurgence of industrial production and bad weather (see BP 2019)
The authors of this box are Christian Bogmans Akito Matsu-moto and Andrea Pescatori
It is possible to decompose total emissions E as a product of carbon intensity c (carbon emissions per unit of energy) energy intensity e (energy per unit of GDP) GDP per capita y and human population P (Kaya and Yokobori 1997)
E = E _____ Energy Energy _____ GDP GDP ____ P P = c e y P
The contribution of income growth to the growth of carbon emissions is larger on average and more cyclical than that of population growth (Figure 1SF12) Declining energy intensity has consistently helped reduce emission growth but in 2018 its contribution was lower possibly because of a cyclical pickup in global industrial production In 2018 decar-bonization was the most important mitigation force as wind solar and natural gas slowly replaced coal as the energy source of choice in the power sectors of all major emitters
G7 excluding US Rest of the worldUnited States WorldChina World IP growthIndia
Sources British Petroleum International Energy Agency and IMF staff calculationsNote G7 = Group of Seven IP = industrial production
ndash10
ndash8
ndash6
ndash4
ndash2
0
2
4
6
8
10
12
14
16
2008 09 10 11 12 13 14 15 16 17 18
Figure 1SF11 Contribution to World Emissions by Location(Percent change)
Emissions Carbon intensityEnergy intensity GDP per capitaPopulation
Sources British Petroleum International Energy Agency World Bank World Development Indicators and IMF staff calculations
2008 09 10 11 12 13 14 15 16 17 18
Figure 1SF12 Contribution to World Emissions by Source(Percent change)
ndash4
ndash2
0
2
4
6
Box 1SF1 Whatrsquos Happening with Global Carbon Emissions
57
C H A P T E R 1 G LO b a L P R O s P E C Ts a N D P O L I C I E s
International Monetary Fund | October 2019
Annex Table 111 European Economies Real GDP Consumer Prices Current Account Balance and Unemployment(Annual percent change unless noted otherwise)
Real GDP Consumer Prices1 Current Account Balance2 Unemployment3
Projections Projections Projections Projections2018 2019 2020 2018 2019 2020 2018 2019 2020 2018 2019 2020
Europe 23 14 18 33 32 28 25 25 22
Advanced Europe 19 12 15 19 14 15 27 27 26 71 67 66Euro Area45 19 12 14 18 12 14 29 28 27 82 77 75
Germany 15 05 12 19 15 17 73 70 66 34 32 33France 17 12 13 21 12 13 ndash06 ndash05 ndash05 91 86 84Italy 09 00 05 12 07 10 25 29 29 106 103 103Spain 26 22 18 17 07 10 09 09 10 153 139 132
Netherlands 26 18 16 16 25 16 109 98 95 38 33 33Belgium 14 12 13 23 15 13 ndash13 ndash11 ndash08 60 55 55Austria 27 16 17 21 15 19 23 16 18 49 51 50Ireland 83 43 35 07 12 15 106 108 96 58 55 52Portugal 24 19 16 12 09 12 ndash06 ndash06 ndash07 70 61 56
Greece 19 20 22 08 06 09 ndash35 ndash30 ndash33 193 178 168Finland 17 12 15 12 12 13 ndash16 ndash07 ndash05 74 65 64Slovak Republic 41 26 27 25 26 21 ndash25 ndash25 ndash17 66 60 59Lithuania 35 34 27 25 23 22 16 11 11 61 61 60Slovenia 41 29 29 17 18 19 57 42 41 51 45 45
Luxembourg 26 26 28 20 17 17 47 45 45 50 52 52Latvia 48 28 28 26 30 26 ndash10 ndash18 ndash21 74 65 67Estonia 48 32 29 34 25 24 17 07 03 54 47 47Cyprus 39 31 29 08 07 16 ndash70 ndash78 ndash75 84 70 60Malta 68 51 43 17 17 18 98 76 62 37 38 40
United Kingdom 14 12 14 25 18 19 ndash39 ndash35 ndash37 41 38 38Switzerland 28 08 13 09 06 06 102 96 98 25 28 28Sweden 23 09 15 20 17 15 17 29 27 63 65 67Czech Republic 30 25 26 22 26 23 03 ndash01 ndash02 22 22 23Norway 13 19 24 28 23 19 81 69 72 39 36 35
Denmark 15 17 19 07 13 15 57 55 52 50 50 50Iceland 48 08 16 27 28 25 28 31 16 27 33 36San Marino 11 08 07 15 13 15 04 04 02 80 81 81
Emerging and Developing Europe6 31 18 25 62 68 56 17 16 06 Russia 23 11 19 29 47 35 68 57 39 48 46 48Turkey 28 02 30 163 157 126 ndash35 ndash06 ndash09 110 138 137Poland 51 40 31 16 24 35 ndash06 ndash09 ndash11 38 38 38Romania 41 40 35 46 42 33 ndash45 ndash55 ndash52 42 43 46Ukraine7 33 30 30 109 87 59 ndash34 ndash28 ndash35 90 87 82
Hungary 49 46 33 28 34 34 ndash05 ndash09 ndash06 37 35 34Belarus 30 15 03 49 54 48 ndash04 ndash09 ndash34 04 05 09Bulgaria5 31 37 32 26 25 23 46 32 25 53 49 48Serbia 43 35 40 20 22 19 ndash52 ndash58 ndash51 133 131 128Croatia 26 30 27 15 10 12 25 17 10 99 90 80
Note Data for some countries are based on fiscal years Please refer to Table F in the Statistical Appendix for a list of economies with exceptional reporting periods1Movements in consumer prices are shown as annual averages Year-end to year-end changes can be found in Tables A6 and A7 in the Statistical Appendix2Percent of GDP3Percent National definitions of unemployment may differ4Current account position corrected for reporting discrepancies in intra-area transactions5Based on Eurostatrsquos harmonized index of consumer prices except for Slovenia6Includes Albania Bosnia and Herzegovina Kosovo Moldova Montenegro and North Macedonia7See country-specific note for Ukraine in the ldquoCountry Notesrdquo section of the Statistical Appendix
58
W O R L D E C O N O M I C O U T L O O K G LO b a L M a N U FaC T U R I N G D OW N T U R N R Is I N G T R a D E b a R R I E R s
International Monetary Fund | October 2019
Annex Table 112 Asian and Pacific Economies Real GDP Consumer Prices Current Account Balance and Unemployment(Annual percent change unless noted otherwise)
Real GDP Consumer Prices1 Current Account Balance2 Unemployment3
Projections Projections Projections Projections2018 2019 2020 2018 2019 2020 2018 2019 2020 2018 2019 2020
Asia 55 50 51 24 24 26 13 15 13
Advanced Asia 18 13 13 13 10 13 40 39 36 32 32 32Japan 08 09 05 10 10 13 35 33 33 24 24 24Korea 27 20 22 15 05 09 44 32 29 38 40 42Australia 27 17 23 20 16 18 ndash21 ndash03 ndash17 53 51 51Taiwan Province of China 26 20 19 15 08 11 122 114 108 37 38 38Singapore 31 05 10 04 07 10 179 165 166 21 22 22
Hong Kong SAR 30 03 15 24 30 26 43 55 51 28 29 30New Zealand 28 25 27 16 14 19 ndash38 ndash41 ndash43 43 43 45Macao SAR 47 ndash13 ndash11 30 24 27 352 357 353 18 18 18
Emerging and Developing Asia 64 59 60 26 27 30 ndash01 04 02 China 66 61 58 21 23 24 04 10 09 38 38 38India4 68 61 70 34 34 41 ndash21 ndash20 ndash23
ASEAN-5 52 48 49 28 24 26 02 04 01 Indonesia 52 50 51 32 32 33 ndash30 ndash29 ndash27 53 52 50Thailand 41 29 30 11 09 09 64 60 54 12 12 12Malaysia 47 45 44 10 10 21 21 31 19 33 34 34Philippines 62 57 62 52 25 23 ndash26 ndash20 ndash23 53 52 51Vietnam 71 65 65 35 36 37 24 22 19 22 22 22
Other Emerging and Developing Asia5 63 63 62 50 53 53 ndash31 ndash28 ndash29
MemorandumEmerging Asia6 64 59 60 25 26 29 00 05 03 Note Data for some countries are based on fiscal years Please refer to Table F in the Statistical Appendix for a list of economies with exceptional reporting periods1Movements in consumer prices are shown as annual averages Year-end to year-end changes can be found in Tables A6 and A7 in the Statistical Appendix2Percent of GDP3Percent National definitions of unemployment may differ4See country-specific note for India in the ldquoCountry Notesrdquo section of the Statistical Appendix5Other Emerging and Developing Asia comprises Bangladesh Bhutan Brunei Darussalam Cambodia Fiji Kiribati Lao PDR Maldives Marshall Islands Micronesia Mongolia Myanmar Nauru Nepal Palau Papua New Guinea Samoa Solomon Islands Sri Lanka Timor-Leste Tonga Tuvalu and Vanuatu6Emerging Asia comprises the ASEAN-5 (Indonesia Malaysia Philippines Thailand Vietnam) economies China and India
59
C H A P T E R 1 G LO b a L P R O s P E C Ts a N D P O L I C I E s
International Monetary Fund | October 2019
Annex Table 113 Western Hemisphere Economies Real GDP Consumer Prices Current Account Balance and Unemployment(Annual percent change unless noted otherwise)
Real GDP Consumer Prices1 Current Account Balance2 Unemployment3
Projections Projections Projections Projections2018 2019 2020 2018 2019 2020 2018 2019 2020 2018 2019 2020
North America 27 21 20 27 20 23 ndash24 ndash24 ndash24 United States 29 24 21 24 18 23 ndash24 ndash25 ndash25 39 37 35Canada 19 15 18 22 20 20 ndash26 ndash19 ndash17 58 58 60Mexico 20 04 13 49 38 31 ndash18 ndash12 ndash16 33 34 34Puerto Rico4 ndash49 ndash11 ndash07 13 ndash01 10 92 92 94
South America5 04 ndash02 18 71 92 86 ndash18 ndash16 ndash14 Brazil 11 09 20 37 38 35 ndash08 ndash12 ndash10 123 118 108Argentina ndash25 ndash31 ndash13 343 544 510 ndash53 ndash12 03 92 106 101Colombia 26 34 36 32 36 37 ndash40 ndash42 ndash40 97 97 95Chile 40 25 30 23 22 28 ndash31 ndash35 ndash29 70 69 69Peru 40 26 36 13 22 19 ndash16 ndash19 ndash20 67 67 67
Venezuela ndash180 ndash350 ndash100 653741 200000 500000 64 70 15 350 472 505Ecuador 14 ndash05 05 ndash02 04 12 ndash14 01 07 37 43 47Paraguay 37 10 40 40 35 37 05 ndash01 13 56 61 59Bolivia 42 39 38 23 17 31 ndash49 ndash50 ndash41 35 40 40Uruguay 16 04 23 76 76 72 ndash06 ndash17 ndash30 84 86 81
Central America6 26 27 34 26 27 30 ndash32 ndash27 ndash26
Caribbean7 47 33 37 37 28 44 ndash16 ndash18 ndash22
MemorandumLatin America and the Caribbean8 10 02 18 62 72 67 ndash19 ndash16 ndash15 Eastern Caribbean Currency Union9 40 36 34 13 15 20 ndash84 ndash79 ndash77 Note Data for some countries are based on fiscal years Please refer to Table F in the Statistical Appendix for a list of economies with exceptional reporting periods1Movements in consumer prices are shown as annual averages Aggregates exclude Venezuela Year-end to year-end changes can be found in Tables A6 and A7 in the Statisti-cal Appendix2Percent of GDP3Percent National definitions of unemployment may differ4Puerto Rico is a territory of the United States but its statistical data are maintained on a separate and independent basis5Includes Guyana and Suriname See country-specific notes for Argentina and Venezuela in the ldquoCountry Notesrdquo section of the Statistical Appendix6Central America comprises Belize Costa Rica El Salvador Guatemala Honduras Nicaragua and Panama7The Caribbean comprises Antigua and Barbuda Aruba The Bahamas Barbados Dominica Dominican Republic Grenada Haiti Jamaica St Kitts and Nevis St Lucia St Vincent and the Grenadines and Trinidad and Tobago8Latin America and the Caribbean comprises Mexico and economies from the Caribbean Central America and South America See country-specific notes for Argentina and Venezuela in the ldquoCountry Notesrdquo section of the Statistical Appendix9Eastern Caribbean Currency Union comprises Antigua and Barbuda Dominica Grenada St Kitts and Nevis St Lucia and St Vincent and the Grenadines as well as Anguilla and Montserrat which are not IMF members
60
W O R L D E C O N O M I C O U T L O O K G LO b a L M a N U FaC T U R I N G D OW N T U R N R Is I N G T R a D E b a R R I E R s
International Monetary Fund | October 2019
Annex Table 114 Middle East and Central Asia Economies Real GDP Consumer Prices Current Account Balance and Unemployment(Annual percent change unless noted otherwise)
Real GDP Consumer Prices1 Current Account Balance2 Unemployment3
Projections Projections Projections Projections2018 2019 2020 2018 2019 2020 2018 2019 2020 2018 2019 2020
Middle East and Central Asia 19 09 29 99 82 91 27 ndash04 ndash14
Oil Exporters4 06 ndash07 23 85 69 80 59 16 01 Saudi Arabia 24 02 22 25 ndash11 22 92 44 15 60 Iran ndash48 ndash95 00 305 357 310 41 ndash27 ndash34 145 168 174United Arab Emirates 17 16 25 31 ndash15 12 91 90 71 Iraq ndash06 34 47 04 ndash03 10 69 ndash35 ndash37 Algeria 14 26 24 43 20 41 ndash96 ndash126 ndash119 117 125 133
Kazakhstan 41 38 39 60 53 52 00 ndash12 ndash15 49 49 49Qatar 15 20 28 02 ndash04 22 87 60 41 Kuwait 12 06 31 06 15 22 144 82 68 13 13 13Oman 18 00 37 09 08 18 ndash55 ndash72 ndash80 Azerbaijan 10 27 21 23 28 30 129 97 100 50 50 50Turkmenistan 62 63 60 132 134 130 57 ndash06 ndash30
Oil Importers5 44 38 39 127 107 113 ndash66 ndash60 ndash53 Egypt 53 55 59 209 139 100 ndash24 ndash31 ndash28 109 86 79Pakistan 55 33 24 39 73 130 ndash63 ndash46 ndash26 61 61 62Morocco 30 27 37 19 06 11 ndash54 ndash45 ndash38 98 92 89Uzbekistan 51 55 60 175 147 141 ndash71 ndash65 ndash56 Sudan ndash22 ndash26 ndash15 633 504 621 ndash136 ndash74 ndash125 195 221 210
Tunisia 25 15 24 73 66 54 ndash111 ndash104 ndash94 154 Jordan 19 22 24 45 20 25 ndash70 ndash70 ndash62 183 Lebanon 02 02 09 61 31 26 ndash256 ndash264 ndash263 Afghanistan 27 30 35 06 26 45 91 20 02 Georgia 47 46 48 26 42 38 ndash77 ndash59 ndash58 127
Tajikistan 73 50 45 38 74 71 ndash50 ndash58 ndash58 Armenia 52 60 48 25 17 25 ndash94 ndash74 ndash74 182 177 175Kyrgyz Republic 35 38 34 15 13 50 ndash87 ndash100 ndash83 66 66 66
MemorandumCaucasus and Central Asia 42 44 44 83 76 76 03 ndash13 ndash17 Middle East North Africa Afghanistan and
Pakistan 16 05 27 101 83 93 29 ndash03 ndash14 Middle East and North Africa 11 01 27 110 84 89 38 01 ndash13 Israel6 34 31 31 08 10 13 27 24 25 40 40 40Maghreb7 30 14 27 43 23 37 ndash73 ndash86 ndash91 Mashreq8 48 50 54 188 125 91 ndash67 ndash69 ndash62 Note Data for some countries are based on fiscal years Please refer to Table F in the Statistical Appendix for a list of economies with exceptional reporting periods1Movements in consumer prices are shown as annual averages Year-end to year-end changes can be found in Tables A6 and A7 in the Statistical Appendix2Percent of GDP3Percent National definitions of unemployment may differ4Includes Bahrain Libya and Yemen5Includes Djibouti Mauritania and Somalia Excludes Syria because of the uncertain political situation6Israel which is not a member of the economic region is included for reasons of geography but is not included in the regional aggregates7The Maghreb comprises Algeria Libya Mauritania Morocco and Tunisia8The Mashreq comprises Egypt Jordan and Lebanon Syria is excluded because of the uncertain political situation
61
C H A P T E R 1 G LO b a L P R O s P E C Ts a N D P O L I C I E s
International Monetary Fund | October 2019
Annex Table 115 Sub-Saharan African Economies Real GDP Consumer Prices Current Account Balance and Unemployment(Annual percent change unless noted otherwise)
Real GDP Consumer Prices1 Current Account Balance2 Unemployment3
Projections Projections Projections Projections2018 2019 2020 2018 2019 2020 2018 2019 2020 2018 2019 2020
Sub-Saharan Africa 32 32 36 85 84 80 ndash27 ndash36 ndash38
Oil Exporters4 13 20 24 130 114 114 19 ndash01 ndash03 Nigeria 19 23 25 121 113 117 13 ndash02 ndash01 226 Angola ndash12 ndash03 12 196 172 150 61 09 ndash07 Gabon 08 29 34 48 30 30 ndash24 01 09 Republic of Congo 16 40 28 12 15 18 67 68 53 Chad 24 23 54 40 30 30 ndash34 ndash64 ndash61
Middle-Income Countries5 28 28 29 46 46 52 ndash36 ndash36 ndash39 South Africa 08 07 11 46 44 52 ndash35 ndash31 ndash36 271 279 284Ghana 63 75 56 98 93 92 ndash31 ndash36 ndash38 Cocircte drsquoIvoire 74 75 73 04 10 20 ndash47 ndash38 ndash38 Cameroon 41 40 42 11 21 22 ndash37 ndash37 ndash35 Zambia 37 20 17 70 99 100 ndash26 ndash36 ndash34 Senegal 67 60 68 05 10 15 ndash88 ndash85 ndash111
Low-Income Countries6 62 53 59 76 92 74 ndash70 ndash79 ndash80 Ethiopia 77 74 72 138 146 127 ndash65 ndash60 ndash53 Kenya 63 56 60 47 56 53 ndash50 ndash47 ndash46 Tanzania 70 52 57 35 36 42 ndash37 ndash41 ndash36 Uganda 61 62 62 26 32 38 ndash89 ndash115 ndash105 Democratic Republic of the Congo 58 43 39 293 55 50 ndash46 ndash34 ndash42 Mali 47 50 50 17 02 13 ndash38 ndash55 ndash55 Madagascar 52 52 53 73 67 63 08 ndash16 ndash27
MemorandumSub-Saharan Africa Excluding
South Sudan 32 32 36 82 83 80 ndash27 ndash36 ndash38 Note Data for some countries are based on fiscal years Please refer to Table F in the Statistical Appendix for a list of economies with exceptional reporting periods1Movements in consumer prices are shown as annual averages Year-end to year-end changes can be found in Table A7 in the Statistical Appendix2Percent of GDP3Percent National definitions of unemployment may differ4Includes Equatorial Guinea and South Sudan5Includes Botswana Cabo Verde Eswatini Lesotho Mauritius Namibia and Seychelles6Includes Benin Burkina Faso Burundi the Central African Republic Comoros Eritrea The Gambia Guinea Guinea-Bissau Liberia Malawi Mali Mozambique Niger Rwanda Satildeo Tomeacute and Priacutencipe Sierra Leone Togo and Zimbabwe
62
W O R L D E C O N O M I C O U T L O O K G LO b a L M a N U FaC T U R I N G D OW N T U R N R Is I N G T R a D E b a R R I E R s
International Monetary Fund | October 2019
Annex Table 116 Summary of World Real per Capita Output(Annual percent change in international currency at purchasing power parity)
Average Projections2001ndash10 2011 2012 2013 2014 2015 2016 2017 2018 2019 2020 2024
World 24 30 20 22 23 21 21 25 24 18 23 25
Advanced Economies 11 12 07 09 16 18 12 20 18 13 13 12United States 08 08 15 11 18 22 09 17 23 18 15 11Euro Area1 08 13 ndash12 ndash05 12 18 16 24 18 10 13 12
Germany 10 39 02 02 18 09 14 21 12 05 12 13France 06 17 ndash02 01 04 07 08 20 16 11 10 11Italy ndash02 02 ndash32 ndash23 ndash03 09 13 18 10 02 07 09Spain 08 ndash14 ndash30 ndash13 17 38 32 30 25 17 14 12
Japan 06 ndash03 17 22 05 13 06 21 10 11 08 10United Kingdom 10 08 08 14 22 15 10 12 08 06 09 11Canada 08 21 07 13 18 ndash01 01 17 05 03 08 08Other Advanced Economies2 27 25 13 17 21 14 16 22 19 09 12 17
Emerging Market and Developing Economies 46 48 36 36 32 28 31 33 32 25 33 35
Emerging and Developing Asia 72 67 59 59 58 57 57 56 55 50 51 51China 99 90 74 73 67 64 61 62 62 58 55 53India3 59 52 41 50 60 66 68 58 54 47 56 59ASEAN-54 37 31 47 37 33 36 38 42 41 37 38 42
Emerging and Developing Europe 44 56 27 27 16 04 16 37 29 16 24 24Russia 51 50 35 15 ndash11 ndash24 01 16 23 11 19 20
Latin America and the Caribbean 19 34 17 17 02 ndash09 ndash18 02 01 ndash09 11 19Brazil 25 31 10 21 ndash03 ndash44 ndash41 03 03 02 14 17Mexico 02 24 24 02 17 22 18 11 10 ndash06 04 16
Middle East and Central Asia 22 37 09 04 05 04 28 ndash02 ndash01 ndash12 10 14Saudi Arabia 03 68 25 ndash01 25 17 ndash06 ndash33 00 ndash18 02 05
Sub-Saharan Africa 29 25 15 24 24 04 ndash13 03 06 06 09 15Nigeria 61 21 15 26 35 00 ndash42 ndash18 ndash07 ndash03 ndash01 01South Africa 21 17 07 09 03 ndash03 ndash11 ndash01 ndash07 ndash09 ndash04 02
MemorandumEuropean Union 12 16 ndash06 00 16 21 18 25 20 13 15 14Low-Income Developing Countries 38 36 17 36 37 19 12 24 28 27 29 32Middle East and North Africa 19 61 03 ndash03 ndash02 00 31 ndash11 ndash11 ndash21 08 08
Note Data for some countries are based on fiscal years Please refer to Table F in the Statistical Appendix for a list of economies with exceptional reporting periods1Data calculated as the sum of individual euro area countries2Excludes the G7 (Canada France Germany Italy Japan United Kingdom United States) and euro area countries3See country-specific note for India in the ldquoCountry Notesrdquo section of the Statistical Appendix4Indonesia Malaysia Philippines Thailand Vietnam
63
C H A P T E R 1 G LO b a L P R O s P E C Ts a N D P O L I C I E s
International Monetary Fund | October 2019
ReferencesAbbritti Mirko and Stephan Fahr 2013 ldquoDownward Wage
Rigidity and Business Cycle Asymmetriesrdquo Journal of Monetary Economics 60 871ndash86
Adrian Tobias and Maurice Obstfeld 2017 ldquoWhy Inter-national Financial Cooperation Remains Essentialrdquo IMF Blog March 23
Aiyar Shekhar and Simon Voigts 2019 ldquoThe Negative Mean Output Gaprdquo IMF Working Paper 19183 International Monetary Fund Washington DC
Baker Scott R Nicholas Bloom and Steven J Davis 2016 ldquoMeasuring Economic Policy Uncertaintyrdquo Quarterly Journal of Economics 131 (4) 1593ndash636
Banque Centrale du Luxembourg (BCL) 2019 Bulletin 2019 (2)
Bekaert Geert and Xiaozheng Wang 2010 ldquoInflation Risk and the Inflation Risk Premiumrdquo Economic Policy 25 (64) 755ndash806
Bems Rudolf Robert C Johnson and Key-Mu Yi 2011 ldquoVertical Linkages and the Collapse of Global Traderdquo American Economic Review Papers and Proceedings 101 (3) 308ndash12
British Petroleum (BP) 2019 ldquoStatistical Review of World Energyrdquo https www bp com content dam bp business -sites en global corporate pdfs energy -economics statistical -review bp -stats -review -2019 -full -report pdf
Broadberry Stephen and Bishnupriya Gupta 2006 ldquoThe Early Modern Great Divergence Wages Prices and Economic Development in Europe and Asia 1500ndash1800rdquo The Economic History Review 59 (1) 2ndash31
Caldara Dario and Matteo Iacoviello 2018 ldquoMeasuring Geo-political Riskrdquo International Finance Discussion Papers 1222 Board of Governors of the Federal Reserve System
Caliendo Lorenzo Robert C Feenstra John Romalis and Alan Taylor 2017 ldquoTariff Reductions Entry and Welfare Theory and Evidence for the Last Two Decadesrdquo NBER Working Paper 21768 National Bureau of Economic Research Cambridge MA
Capie Forrest Terence Mills and Geoffrey Wood 2005 ldquoGold as a Hedge against the Dollarrdquo Journal of International Financial Markets 15 (4) 343ndash52
Damgaard Jannick and Thomas Elkjaer 2017 ldquoThe Global FDI Network Searching for Ultimate Investorsrdquo IMF Working Paper 17258 International Monetary Fund Washington DC
De Nederlandsche Bank (DNB) 2019 ldquoStatistical News Release Current Account Surplus Contracts in First Quarterrdquo https www dnb nl en news news -and -archive Statistischnieuws2019 dnb384751 jsp
Dupraz Steacutephane Emi Nakamura and Joacuten Steinsson 2019 ldquoA Plucking Model of Business Cyclerdquo mimeo
Erb Claude and Campbell Harvey 2013 ldquoThe Golden Dilemmardquo NBER Working Paper 18706 National Bureau of Economic Research Cambridge MA
European Central Bank (ECB) 2019 ldquoWhat the Matur-ing Tech Cycle Signals for the Global Economyrdquo ECB Economic Bulletin 32019 https www ecb europa eu pub economic -bulletin focus 2019 html ecb ebbox201903 _01~4e6e0fcef6 en html
Friedman Milton 1964 ldquoMonetary Studies of the National Bureaurdquo In The National Bureau Enters Its 45th Year 44th Annual Report 7ndash25 http www nber org nberhistory annualreports html
mdashmdashmdash 1990 ldquoBimetallism Revisitedrdquo Journal of Economic Perspectives 4 (4) 85ndash104
mdashmdashmdash 1993 ldquoThe Plucking Model of Business Fluctuations Revisitedrdquo Economic Inquiry 31 171ndash77
Green Timothy 2007 The Ages of Gold Mines Markets Merchants and Goldsmiths from Egypt to Troy Rome to Byzantium and Venice to the Space Age GFMS Limited
Gruss Bertrand 2014 ldquoAfter the BoommdashCommodity Prices and Economic Growth in Latin America and the Caribbeanrdquo IMF Working Paper 14154 International Monetary Fund Washington DC
International Monetary Fund (IMF) 2018 ldquoFinal Report of the Task Force on Special Purpose Entitiesrdquo IMF Com-mittee on Balance of Payments Statistics (BOCPOM) BOPCOM-1803 (https www imf org external pubs ft bop 2018 pdf 18 -03 pdf )
mdashmdashmdash 2019 ldquoFiscal Policies for Paris Climate StrategiesmdashFrom Principle to Practicerdquo Policy Paper 19010
Kaya Yoichi and Keiichi Yokobori eds 1997 Environment Energy and Economy Strategies for Sustainability Tokyo United Nations University Press
Kilian Lutz and Xiaoqing Zhou 2019 ldquoOil Prices Exchange Rates and Interest Ratesrdquo Manuscript University of Michigan Michigan https drive google com file d 1SAz _WsNhsHJ5OCxi12HcFyhDYfUjzyw6 view
Lane Philip and Gian Maria Milesi Ferretti 2018 ldquoThe External Wealth of Nations Revisited International Financial Integration in the Aftermath of the Global Financial Crisisrdquo IMF Economic Review 66 (1) 189ndash222
Lopez-Cordova Ernesto and Christopher Meissner 2003 ldquoThe Globalization of Trade and Democracy 1870ndash2000rdquo NBER Working Paper 11117 National Bureau of Economic Research Cambridge MA
Malanima Paolo 2009 Pre-Modern European Economy One Thousand Years (10thndash19th Centuries) Boston Brill
Mian Atif and Amir Sufi 2012 ldquoThe Effects of Fiscal Stimu-lus Evidence from the 2009 Cash for Clunkers Programrdquo Quarterly Journal of Economics 127 (3) 1107ndash142
Mundell Robert A 2002 ldquoThe Birth of Coinagerdquo Columbia University Department of Economics Discussion Paper Series 0102ndash08 New York NY
Newey Whitney and Kenneth West 1987 ldquoA Simple Positive Semi-Definite Heteroskedasticity and Autocorrelation Consistent Covariance Matrixrdquo Econometrica 55 (3) 703ndash08
64
W O R L D E C O N O M I C O U T L O O K G LO b a L M a N U FaC T U R I N G D OW N T U R N R Is I N G T R a D E b a R R I E R s
International Monetary Fund | October 2019
Nieuwenhuis Paul and Peter Wells eds 2015 The Global Automotive Industry John Wiley and Sons
Officer Lawrence 2008 ldquoGold Standardrdquo In The New Palgrave Dictionary of Economics 2501ndash507
Schultz M K Dziczek Y Chen and B Swiechi 2019 US Consumer amp Economic Impacts of US Automotive Trade Policies Center for Automotive Research Ann Arbor Michigan
Setser Brad 2019 ldquo$500 Billion in Dividends Out of the Double Irish with a Dutch Twist (with a Bit of Help from Bermuda)rdquo Blog Council of Foreign Relations August 12
Sjaastad Larry H 2008 ldquoThe Price of Gold and the Exchange Rates Once Againrdquo Resources Policy 33 118ndash24
Smolyansky Michael Gustavo Suarez and Alexandra Tabova 2019 ldquoUS Corporationsrsquo Repatriation of Offshore Profits
Evidence from 2018rdquo FEDS Notes Board of Governors of the Federal Reserve System Washington DC August 6 https doi org 10 17016 2380 -7172 2396
Swiss National Bank (SNB) 2019 ldquoSwiss Balance of Payments and International Investment Position Q4 2018 and Review of the Year 2018rdquo https www snb ch en mmr reference pre _20190325 source pre _20190325 en pdf
Timmer Marcel P Erik Dietzenbacher Bart Los Robert Stehrer and Gaaitzen J de Vries 2015 ldquoAn Illustrated User Guide to the World Input-Output Database The Case of Global Automotive Productionrdquo Review of International Economics 23 (3) 575ndash605
Vilar Pierre 1976 A History of Gold and Money 1450ndash1920 Translated by Judith White London New Left Books
International Monetary Fund | October 2019 65
Subnationalmdashwithin-countrymdashregional disparities in real output employment and productivity in advanced econo-mies have attracted greater interest in recent years against a backdrop of growing social and political tensions Regional disparities in the average advanced economy have risen since the late 1980s reflecting gains from economic concentration in some regions and relative stagnation in others On average lagging regions have worse health outcomes lower labor productivity and greater employ-ment shares in agriculture and industry sectors than other within-country regions Moreover adjustment in lagging regions is slower with adverse shocks having longer-lived negative effects on economic performance Although much discussed trade shocksmdashin particular greater import competition in external marketsmdashdo not appear to drive the differences in labor market performance between lagging and other regions on average By contrast tech-nology shocksmdashproxied by declines in the relative costs of machinery and equipment capital goodsmdashraise unemploy-ment in regions that are more vulnerable to automation with more exposed lagging regions particularly hurt National policies that reduce distortions and encourage more flexible and open markets while providing a robust social safety net can facilitate regional adjustment to adverse shocks dampening rises in unemployment Place-based policies targeted at lagging regions may also play a role but they must be carefully calibrated to ensure they help rather than hinder beneficial adjustment
IntroductionDisparities in economic activity across subnational
regions in the average advanced economy have been gradually creeping upward since the late 1980s undoing some of the marked decline over the previous three decades and mirroring trends in overall income inequality in many advanced economies (Figure 21
The authors of this chapter are John Bluedorn (co-lead) Zsoacuteka Koacuteczaacuten (co-lead) Weicheng Lian Natalija Novta and Yannick Timmer with support from Christopher Johns Evgenia Pugacheva Adrian Robles Villamil and Yuan Zeng The chapter also benefited from discussions with Philip Engler Antonio Spilimbergo and Jiaxiong Yao and from comments from internal seminar participants
panel 1)12 Real GDP per capita in the advanced economy region at the 90th percentile is now on average 70 percent higher than that in the region at the 10th percentile Such a wide disparity means that within-country regional differences in economic activity in a number of advanced economies are larger than the average differences between peer countries (Figure 22) By contrast average subnational regional (simply regional hereafter) disparities in emerging market economies have trended down since 2010 after rising from the early 2000s (Figure 21 panel 3) On average though they remain about double those in advanced economies In parallel the average speed of regional convergence in advanced economies has slowed to less than one-half percent per year while picking up to more than 1 percent in emerging market economies (Figure 21 panels 2 and 4)
Slowing regional convergence and rising dispari-ties in some advanced economies alongside regional labor market and productivity developments have attracted much interest in recent years in part because of evidence that poor regional performance within a country can fuel discontent and political polarization erode social trust and threaten national cohesion3
1For evidence on trends in overall income inequality in advanced economies see Dabla-Norris and others (2015) the October 2017 Fiscal Monitor and Nolan Richiardi and Valenzuela (2019) among others Immervoll and Richardson (2011) argues that declining fiscal redistribution accounts for some of this rise
2Subnational regions are the TL2 regions as defined in OECD (2018) unless otherwise indicated These are typically the first-level administrative units within a country corresponding roughly to US states or German Laumlnder Consequently the geographic extents of TL2 regions are not homogenous across or within countries Alterna-tive geographic aggregates (for example higher resolution areal or metropolitan aggregates or different administrative classifications) may generate different findings Subnational regional real GDP per capita is purchasing power parity (PPP) adjusted for cross-country comparability although not adjusted for within-country regional price differences Box 21 discusses some of the issues with measur-ing regional real GDP per capita and its link to welfare
3See Algan and Cahuc (2014) and Guriev (2018) on social trust regional performance and rising political polarization Looking at Europe Winkler (2019) presents evidence that regional income inequality engenders greater political polarization in regions Rajan (2019) argues that lack of attention to peripheral regions is fostering despair and a backlash destabilizing societies
CLOSER TOGETHER OR FURTHER APART WITHIN-COUNTRY REGIONAL DISPARITIES AND ADJUSTMENT IN ADVANCED ECONOMIES2CH
APTE
R
W O R L D E C O N O M I C O U T L O O K G LO b a L M a N U FaC T U R I N G D OW N T U R N R Is I N G T R a D E b a R R I E R s
66 International Monetary Fund | October 2019
More generally a recurring theme in the latest eco-nomic research is that local conditions play an essential role in shaping individual opportunities and social mobilitymdashin other words place can be primal4
Aside from their political and social ramifica-tions are disparities in regional economic activity a macroeconomic concern To be sure increases in
4For example see Chetty and Hendren (2018a 2018b) on how place-of-birth has profound and long-lasting effects on an individualrsquos lifetime economic opportunities even accounting for family background and other influences Durlauf and Seshadri (2018) argues that causation flows from economic inequality to lower social mobility rather than the reverse Drawing on other evidence from the United States Chetty Hendren and Katz (2016) contends that geographic mobility is a key means by which social mobilitymdashimproved lifetime incomes and opportunitiesmdashcan be achieved See also Conolly Corak and Haeck (2019) for similar analyses and evidence from Canada
Subnational regional disparities in the average advanced economy have risen over the past three decades while regional convergence has slowed Disparities in emerging market economies are typically larger but have been coming down while within-country average convergence has picked up
Figure 21 Subnational Regional Disparities and Convergence over Time
20
25
30
35
40
45
1980 90 2000 10 16
ndash05
00
05
10
15
20
1970 80 90 2000 10 1612
14
16
18
20
22
1950 60 70 80 90 2000 10 16
ndash05
00
05
10
15
20
2000 04 08 12 16
Average 9010 Ratio of RegionalReal GDP per Capita
(Ratio)
Average Speed of RegionalConvergence
(Percent)
1 Advanced Economies 2 Advanced Economies
3 Emerging MarketEconomies
4 Emerging MarketEconomies
Sources Gennaioli and others (2014) Organisation for Economic Co-operation and Development Regional Database and IMF staff calculationsNote The regional 9010 ratio for a country is defined as real GDP per capita in the region at the 90th percentile of the countryrsquos regional real GDP per capita distribution over that of the region at the 10th percentile The solid line in panels 1 and 3 shows the year fixed effects from a regression of regional 9010 ratios from the indicated sample on year fixed effects and country fixed effects to account for entry and exit during the period and level differences in the 9010 regional GDP ratios Blue shaded areas indicate the associated 90 percent confidence interval Panels 2 and 4 show the coefficient on initial log real GDP per capita from a cross-sectional regression of average real purchasing power parity GDP per capita growth on initial log real GDP per capita estimated over 20-year rolling windows (plotted at the last year of the window) The regression includes country fixed effects so it indicates average within-country regional convergence The coefficient is expressed in annualized terms indicating the average annual speed of convergence See Online Annex 21 for the country samples
Many advanced economies have larger within-country regional disparities than exist between advanced economies
04
08
12
00
16
Sources Organisation for Economic Co-operation and Development Regional Database and IMF staff calculationsNote The figure plots the kernel density of the country-level regional 9010 ratio across advanced economies (the ratio of real GDP per capita PPP-adjusted of the 90th percentile subnational region to the 10th percentile subnational region calculated for each country) The vertical line indicates the national 9010 ratio within the same group of advanced economies (that is the ratio of real GDP per capita PPP-adjusted of the country at the 90th percentile to the country at the 10th percentile) Selected countriesrsquo positions in the distribution are indicated by their International Organization for Standardization (ISO) codes and corresponding regional 9010 value in parentheses See Online Annex 21 for the country sample PPP = purchasing power parity
Regional 9010 ratio of real GDP per capita
Figure 22 Distribution of Subnational Regional Disparities in Advanced Economies(Density 2013)
10 14 18 22 26 30 34 38
9010 ratio for AEs(USASlovak Republic)
CZE (276) SVK (362)
CAN (209)
ITA (201)
USA (170)
CHAPTER 2 C LO s E R TO G E T H E R O R F U RT H E R a Pa RT W I T H I N - CO U N T Ry R E G I O N a L D I s Pa R I T I E s a N D a DJ U s TM E N T I N a DVa N C E D E CO N O M I E s
67International Monetary Fund | October 2019
disparities between regions of a country can be a normal feature of growth Increasing specialization and agglomerationmdashthe phenomenon in which the increasing spatial density of economic activity makes trade and exchange more efficientmdashcan boost produc-tivity and lead to a greater concentration of economic activity in some regions within a country causing them to pull away from others5 Growth in core regions can nonetheless eventually spread outward to peripheral regions generating catch-up6
However persistently large or increasing regional disparities can also be a sign that some regions are not adjusting to changing economic circumstances and are falling behind Failure to adjust to adverse shocksmdashcontributing to high regional unemployment and per-sistent shortfalls in productivitymdashcould reflect barriers to labor and capital moving to regions and firms where their returns would be higher Indeed long-term unem-ployment rates tend to be higher in worse-performing regions within advanced economies suggesting some persistent inefficiencies may be at work (Figure 23)
Consistent with the notion that regional disparities can drive social and political discontent lagging regions in advanced economiesmdashthose failing to converge toward richer regions of the same country over the past couple of decadesmdashtend to do worse than other regions on average on key measures of well-being including health human capital and labor market outcomes (Figure 24)7 The age profiles of populations in lagging regions may explain part of their overall lower employ-ment ratemdashlagging regions have significantly lower
5The underlying impetus for these dynamics may be simple geography (less costly access to trading partners and inputs) natural resource booms or the persistent effects of historical factors See Krugman (1991) Davis and Weinstein (2002) Duranton and Puga (2004) Moretti (2011) and Nunn (2014) for further discussion of these mechanisms and drivers
6See Coe Kelly and Yeung (2007) and WB (2009) for evidence on these spillovers
7Specifically lagging regions are defined as those whose real GDP per capita in 2000 was below the countryrsquos regional median and whose growth was slower than the countryrsquos average from 2000ndash16 Similar patterns for human capital and labor market outcomes also hold if lagging regions are defined by predetermined criteria such as below median initial real GDP per capita and initial service sector employment share Nunn Parsons and Shambaugh (2018) finds that US counties that had initially low human capital were less diversified in production and were more dependent on manufacturing had worse health income and labor market outcomes It is important to note that the findings for lagging regions hold on average it is possible for a given region to differ from that average behavior Moreover due to data availability constraints as noted the classification is based on real GDP per capita data from 2000ndash16 See Online Annex 21 for further details All annexes are available at wwwimforgenPublicationsWEO
prime age (ages 25ndash54) population shares and skew significantly younger (under age 25) than other regions But these demographic characteristics are not the com-plete story for lagging regions as seen by their higher overall unemployment rate and higher youth inactivity rate (share of youth not in employment education or training) on average Given the importance of employment status for life satisfaction independent of its effect on income improving regional labor market performance can generate welfare gains beyond those that can be achieved through income redistribution8
Motivated by these considerations and taking into account the greater recent rise in disparities in advanced economies alongside data availability constraints this chapter examines regional disparities and labor market adjustment in advanced economies with a focus on the
8See Clark and Oswald (1994) Gruumln Hauser and Rhein (2010) and Clark (2018) among others for evidence on the positive link between employment and happiness independent of income and job quality
0
1
2
3
4
5
6
7
Long
-ter
m u
nem
ploy
men
t rat
e (p
erce
nt)
Regional long-term unemployment rates tend to be higher where economic activity per person is lower suggesting the existence of greater inefficiencies in lagging regions
100 102 104 106 108 110 112Log real GDP per capita
Figure 23 Subnational Regional Unemployment and Economic Activity in Advanced Economies 1999ndash2016
Sources Organisation for Economic Co-operation and Development Regional Database and IMF staff calculationsNote The figure illustrates the regression slope for the relationship between regional long-term unemployment rates and log regional real GDP per capita after controlling for country-year fixed effects Dots show the binned underlying data from the regression based on the method from Chetty Friedman and Rockoff (2014) See Online Annex 21 for the country sample
W O R L D E C O N O M I C O U T L O O K G LO b a L M a N U FaC T U R I N G D OW N T U R N R Is I N G T R a D E b a R R I E R s
68 International Monetary Fund | October 2019
characteristics and dynamics of lagging regions since 2000 It also explores whether differences in national policies related to labor and product market functioning influence regional disparities and adjustment Specifi-cally the chapter investigates the following questions bull How different are advanced economies in the extent
of their regional disparities in economic activity How do regional differences in sectoral production account for variation in labor productivity across regions within countries How do lagging regions compare with other regions in their sectoral mix of employment and productivity How effective have lagging regions been in responding to trends in the sectoral reallocation of labor
bull What are the regional labor market effects of local labor demand shocksmdashin particular trade and technology shocksmdashin advanced economies Is adjustment to these shocks in lagging regions different from that in other regions
bull Do national policies and distortions play a role in regional disparities and adjustment in advanced economies
The chapterrsquos main findings are the following bull The extent of regional disparities differs markedly
across advanced economiesmdashwith the 9010 ratios for regional real GDP per capita ranging from about 13 to more than 3 Underlying these disparities are regional differences in sectoral labor productivities and the sectoral employment mix with lagging regions on average being systematically less produc-tive and more specialized in agriculture and industry
o Intrinsic sectoral productivity differences across regions tend to drive most regional labor produc-tivity differences within a country But for lagging regions the employment mix matters more than it does for other regions
o Even controlling for differences in trends across countries lagging regionsrsquo employment is more concentrated in agriculture (suggesting that some are more rural) and industry and less in services Moreover labor productivity across sectors is sys-tematically lower in lagging regions than in others
o From the early 2000s to the mid-2010s one-third of the increase in the overall labor productivity gap between lagging and other regions appears to have reflected relatively ineffective sectoral labor market adjustment in lagging regions with the rest attributed to growing sectoral productivity differences
ndash2
ndash1
0
1
2
3
4
5
Depe
nden
cy ra
tio
Loss
of l
ife e
xpec
tanc
y (y
ears
)
Infa
nt m
orta
lity
(per
10
00 li
ve b
irths
)
Yout
h (1
5ndash24
) sha
re o
f WAP
Prim
e (2
5ndash54
) sha
re o
f WAP
Olde
r (55
ndash64)
sha
re o
f WAP
Belo
w-t
ertia
ry e
duca
tion
shar
e of
labo
r for
ce
Terti
ary
unde
r-en
rollm
ent
None
mpl
oym
ent r
ate
Labo
r for
ce n
onpa
rtici
patio
n ra
te
Unem
ploy
men
t rat
e
Long
-ter
m u
nem
ploy
men
t rat
e
Yout
h un
empl
oym
ent r
ate
NEET
rate
Demographics and health Labor marketEducation andhuman capital
Sources Organisation for Economic Co-operation and Development Regional Database and IMF staff calculationsNote Bars show the difference in lagging regions versus other regions for each of the variables Results are based on regressions of each variable on an indicator for whether a region is lagging or not controlling for country-year fixed effects and with standard errors clustered at the country-year level Solid bars indicate that the estimated coefficient on the lagging indicator is statistically significant at the 10 percent level Variables are defined so that positive estimated coefficients indicate worse performance by lagging regions Tertiary under-enrollment is the difference in the percent of population enrolled in tertiary education in other regions versus lagging regions The nonemployment rate is defined as 100 minus the employment rate (in percent) The labor force nonparticipation rate is defined as 100 minus the labor force participation rate of the working-age (ages 15ndash64) population (in percent) The unemployment rate is the share of the working-age labor force that is unemployed The long-term unemployment rate is the share of the working-age labor force that has been unemployed for one year or more The youth unemployment rate is the share of the youth (ages 15ndash24) labor force that is unemployed The NEET rate is the percent of the youth population that is not in education employment or training Lagging regions are defined as those with real GDP per capita below their country median in 2000 and with average growth below the countryrsquos average over 2000ndash16 NEET = not in education employment or training WAP = working-age population See Online Annex 21 for the country sample
Figure 24 Demographics Health Human Capital and Labor Market Outcomes in Advanced Economies Lagging versus Other Regions(Percentage point difference unless otherwise noted)
Lagging regions tend to have worse health education and labor market outcomesthan other regions
CHAPTER 2 C LO s E R TO G E T H E R O R F U RT H E R a Pa RT W I T H I N - CO U N T Ry R E G I O N a L D I s Pa R I T I E s a N D a DJ U s TM E N T I N a DVa N C E D E CO N O M I E s
69International Monetary Fund | October 2019
bull Adverse trade and technology shocks affect more exposed regional labor markets but only technology shocks tend to have lasting effects with even larger unemployment rises for vulnerable lagging regions on average
o Increases in import competition in external markets associated with the rise of Chinarsquos pro-ductivity do not have marked effects on regional unemployment although labor force participation falls in the near term but quickly abates Condi-tions in lagging regions do not look very different from other regions after such shocks
o By contrast differences in vulnerability to automa-tion across regions translate into noticeable differ-ences in labor market responses to capital goods prices When machinery and equipment prices fall more vulnerable regions see more persistent rises in unemployment and declines in labor force participa-tion than do less vulnerable regions More vulnerable lagging regions have even larger rises in unemploy-ment rates Out-migration from more vulnerable lagging regions also appears to drop suggesting that adjustment to technology shocks through labor mobility may be weaker in lagging regions that are more vulnerable to automation pressures
bull National structural policies that encourage more open and flexible markets are associated with improved regional adjustment to shocks and a lower dispersion of firmsrsquo efficiencies in allocating capital which may narrow regional disparities
o Less stringent employment protection regulations and less generous unemployment benefits are associated with milder unemployment effects of trade and technology shocks
o National policies that encourage more open and flexible product markets are associated with lower variability in firmsrsquo capital allocative efficiencies which is associated with lower regional disparities
This chapter documents patterns and associa-tions between regional disparities and adjustment and national policies in advanced economies This is intended to help inform debate and discussion complementing the vast literature examining regional differences on a country-by-country basis9 Much of
9For a selection of work examining or leveraging regional eco-nomic differences in specific countries see for example Kaufman Swagel and Dunaway (2003) and Breau and Saillant (2016) on Canadian provincial differences Bande Fernaacutendez and Montuenga (2008) IMF (2018) and Liu (2018) on Spanish regional differences
the chapterrsquos analysis focuses on the relatively short period since 2000 for which broad cross-country regional data are available enabling a look at labor market adjustment but precluding study of longer-term regional development dynamics Furthermore regions in the analysis are typically defined as countriesrsquo first-level administrative units which are economically and politically meaningful within countries and for which good data coverage is available (see also footnote 2) However this means that regions as diverse in size as Texas and Rhode Island in the United States are pooled together despite the very different potential extents of their within-region markets for adjustment Although the analysis attempts to account for this diversity through the inclusion of a variety of controls alternative levels of geographic aggregation could gen-erate different findings Robustness checks are under-taken to confirm that the stylized facts and analysis results hold excluding capital-intensive resource-rich regions Finally given that national policies may be affected by many different variables their estimated effects on regional adjustment should be interpreted as associational rather than causal
Although regional differences in economic activity and labor market outcomes are substan-tial within advanced economies analysis of overall household-level inequality in disposable incomes at the country-level suggests that its regional component is small (Figure 25 see also Box 21 for a discussion of the measurement of regional economic activity and welfare)10 For the subset of advanced economies and years since 2008 for which the decomposition can be calculated the regional component of household disposable income inequality ranges from less than 1 percent in Austria to about 15 percent in Italy This means that for advanced economies further reducing differences in average disposable income across regions would typically have only moderate effects on income inequality in a country However there are some important exceptions If for example average regional differences were eliminated in Italy its income inequal-ity could drop to levels seen in the early 1990s which
Felice (2011) Giordano and others (2015) and Boeri and others (2019) on Italian regional differences
10See Shorrocks and Wan (2005) Novotnyacute (2007) and Cowell (2011) which come to broadly similar conclusions with alter-native personal income concepts and multiple decomposable income inequality metrics A similar finding holds using pretax and pretransfer household income Note that household disposable income differs from GDP in that it incorporates factor income flows tofrom elsewhere and the effects of fiscal redistribution
W O R L D E C O N O M I C O U T L O O K G LO b a L M a N U FaC T U R I N G D OW N T U R N R Is I N G T R a D E b a R R I E R s
70 International Monetary Fund | October 2019
were the lowest since the 1970s11 But as discussed above reducing regional disparities and improving performance in economic activity and employment can have important consequences beyond current income Moreover some evidence indicates that countries with larger regional disparities may experience lower long-term growth (Che and Spilimbergo 2012)
The chapter begins with a brief discussion of how to think about regional development and adjustment The subsequent section presents evidence on patterns
11Based on the historical path of Italyrsquos Gini coefficient from Atkinson and others (2017) and the assumption that the Gini would decline in proportion to the decline in the mean log deviation or generalized entropy index (Theilrsquos L which is a decomposable income inequality measure) if the regional component were eliminated
of regional disparities in advanced economies and how lagging regions differ from others Then the regional responses to local labor demand shocks arising from trade and technology shocks are examined focusing on how lagging regions differ and how national labor market policies may influence regional adjustment The chapter then presents some evidence on labor mobility and the effects of national policies on regional disparities in the effectiveness of factor reallocation Finally a sum-mary and concluding thoughts consider the potential implications for policies including place-based policies
Regional Development and Adjustment A Primer
As in the large body of literature on the drivers of cross-country economic differences the causes of persistent regional disparities within countries are hotly debated12 However unlike countries regions within a country are typically subject to the same overarching institutional structure (both political and economic) and common national policies with free exchange of goods and services and no legal impediments to the move-ments of capital and labor across the country13 Under perfectly competitive output and input markets and no market frictions (such as barriers to cross-regional factor movements) capital and labor would flow within and across regions to equalize marginal returns of capital and
12The development accounting framework (Caselli 2005 Hsieh and Klenow 2010) is often used to organize the potential drivers of regional differences within a country into proximate (physical capital labor and human capital and total factor productivity) and other intermediate and ultimate determinants (such as policies culture institutions geography climate luck) Based on the analysis of global samples Acemoglu and Dell (2010) and Gennaioli and others (2013 2014) argue for the critical importance of human capital for development Lessmann and Seidel (2017) also points to the importance of mobility and trade openness for regional development Hsieh and Moretti (2019) contends that economies arising from regional agglomeration are substantial and that regional zoning restrictions lowered US aggregate output growth by one-third from the 1960s through the 2000s Rodriacuteguez-Pose and Storper (2019) pushes back against Hsieh and Morettirsquos (2019) contention arguing that housing price differences across regions are not the primary drivers of regional migration Rodriacuteguez-Pose and Ketterer (forthcoming) asserts that regional differences in governance quality within-country lead to persistent differences in regional development and performance See also OECD (2016b 2018) for further analysis and evidence on broad patterns and drivers of persistent regional disparities across a wide range of countries
13There are exceptionsmdashoften in federal statesmdashwhere free exchange and movement within countries are inhibited For exam-ple Canadian provinces and territories differ in their standards and regulations for some goods and services de facto restricting interpro-vincial trade (Alvarez Krznar and Tombe 2019)
Within regionsBetween regions
OverallGini
DNK
SVK
FIN
CZE
CHE
AUT
DEU
FRA
CAN
AUS
ESP
IRL
GRC
ITA
GBR
EST
USA
ISR
00
01
02
03
04
Sources Luxembourg Income Study and IMF staff calculationsNote The overall index shown is the generalized entropy index also known as Theilrsquos L or the mean log deviation index of inequality The income measure used is equivalized household disposable income (household income after tax and transfers transformed to account for household size differences) by country in the latest available year after 2008 The height of the bar indicates the overall level of the income inequality index which is then decomposed into two components (1) inequality attributable to average income differences across regions (the between component) and (2) inequality attributable to income differences across households within regions after adjusting for average regional income differences (the within component) The Gini index of income inequality is also shown for comparison as a more familiar inequality measure (but that is not decomposable) Data labels use International Organization for Standardization (ISO) country codes
The regional component of income inequality in most advanced economies is relatively small accounting for only about 5 percent of overall country inequality on average
Figure 25 Inequality in Household Disposable Income within Advanced Economies(Indexes)
CHAPTER 2 C LO s E R TO G E T H E R O R F U RT H E R a Pa RT W I T H I N - CO U N T Ry R E G I O N a L D I s Pa R I T I E s a N D a DJ U s TM E N T I N a DVa N C E D E CO N O M I E s
71International Monetary Fund | October 2019
labor within a country even if differences in regional total factor productivity were persistent For instance workers would move to regions with the highest returns to labor and hence wages pushing down wages in the destination region over time At the same time lower labor supply in source regions where wages are relatively low would in turn help raise wage rates there facilitating convergence of labor productivities
Nonetheless such an efficient allocation of factors across regions can be consistent with differences in regional real GDP per capita if for example labor is differentiated by skill level14 In practice though markets may be neither perfectly competitive nor friction-free across regions leading to diminished efficiency misallocation of factors across regions and hampered adjustment to shocks Labor mobility may be constrained or evident only among the highly skilled leading to more persistent regional unemploy-ment in response to adverse shocks15
The propensities for economic activity to cluster in space (agglomeration economies) and for productivity to rise with the density of skilled workers (human capital externalities) can also generate divergence if differences in production costs and the concentration of skills across regions are large enough16 Although these fea-tures may suggest the presence of market failures (that is inefficient barriers to regions growing even more concentrated) their implications for optimal policies are ambiguous17 Overall social welfare could actually be larger if lagging regions were given help to create their own virtuous cycles of growing agglomeration econo-mies rather than be depopulated through population shifts to leading regions Given these ambiguities and
14For example if labor and human capital are differentiated (such as high skilllow skill) then total factor productivity differences may entail differences in the human capital composition of the workforce affecting output per worker If technology differs across regions this may also lead to differences in output per worker across regions even if marginal returns to factors are equalized
15See Kim (2008) and Duranton and Venables (2018) for evi-dence and arguments
16See Krugman and Venables (1995) Fujita Krugman and Venables (1999) and Gennaioli and others (2013) on how increas-ing returns from agglomeration economies and human capital externalities can manifest in spatial economic models
17See Austin Glaeser and Summers (2018) for further discussion of the ambiguous implications of agglomeration economies As noted earlier Hsieh and Moretti (2019) argues that housing and zoning restrictions present substantial barriers to beneficial agglomeration in the United States lowering welfare and increasing spatial wage disper-sion However Giannone (2018) suggests that the bulk of the increase in spatial wage dispersion in the United States over the past 40 years is due to skill-biased technological change rather than agglomeration
the more general difficulty of quantifying the relative importance of efficient versus inefficient allocation in driving regional disparities the chapter focuses on lag-ging regions and their characteristics and adjustment
Patterns of Regional Disparities in Advanced Economies
The extent of regional disparities in economic activity varies widely across advanced economies (Figure 26) For example Japanrsquos regional differences are relatively narrow with real GDP per capita of the region at the 90th percentile only about 30 percent higher than
FRA
JPN
CHE
KOR
GBR
GRC
FIN
NZL
PRT
USA
SWE
NLD
ESP
AUT
DEU
DNK
NOR
ITA
AUS
CAN
CZE
SVK
AE c
ount
ry le
vel0
50
100
150
200
250
300
350
The extent of regional disparities differs widely across advanced economies
Sources Organisation for Economic Co-operation and Development (OECD) Regional Database and IMF staff calculationsNote P10(50 90) indicates the 10(50 90)th percentile of the regional real GDP per capita (purchasing power parity-adjusted) distribution within the country Countries are sorted by the ratio of the within-country 90th percentile to the 10th percentile of regional real GDP per capita Regional medians (P50) by country are normalized to 100 with other percentiles and the maximum and minimum shown relative to the median by country Underlying regions are OECD territorial level 2 entities The sample includes 22 advanced economies (all countries with four or more regions) The AE country level shows the corresponding quantiles calculated over the country-level sample of advanced economies AE = advanced economies Data labels use International Organization for Standardization (ISO) country codes
Figure 26 Subnational Regional Disparities in Real GDP per Capita(Ratio to regional median times 100 2013)
Min P10 P90 Max
W O R L D E C O N O M I C O U T L O O K G LO b a L M a N U FaC T U R I N G D OW N T U R N R Is I N G T R a D E b a R R I E R s
72 International Monetary Fund | October 2019
that of the 10th percentile region France has a similar 9010 ratio but with a notable better-performing outlier region (centered on the capital Paris) that has about double the real GDP per capita of the median French region The United States has a 9010 ratio which is about average for advanced economies but it also shows greater dispersion in the tails of the distribu-tion with even more extreme regional outcomes than average (the District of Columbiarsquos regional real GDP per capita is more than three times that of the median US region while Mississippirsquos is about one-third lower than the median) Among the advanced economies with larger regional differences are Canada and Italy with 9010 ratios at about 2
Regional labor productivitymdashoutput per workermdashis closely related to regional real GDP per capita A shift-share analysis of regional labor productivity provides insights into the relative importance of differences in sectoral labor productivities sectoral employment shares and the allocation of workers to more or less productive sectors in accounting for regional dis-parities within a country (Figure 27)18 For most advanced economies the bulk of regional variation in labor productivity appears to be due to sectoral labor productivity differences across regions rather than the sectoral employment mixmdashin other words intrinsic sectoral productivity differences across regions tend to be the most important However Greece Italy Korea and Portugal are notable examples in which other components explain the overall regional variation In these cases simply reallocating regional employment across sectors (holding sectoral productivity differences constant) could substantially lower regional variability in labor productivity
The greater presence of lagging regions does not appear to be systematically related to differences in the drivers of regional variation across countries About 20 percent of regions in advanced economies are clas-sified as lagging with the distribution differing across countries That said analysis suggests that the sectoral employment mix has been more influential in driving regional differences for lagging regions compared to others consistent with the view that labor markets in lagging regions may be reallocating employment across sectors less effectively than other regions19
18For the variance decomposition of the shift-share analysis there is an additional fourth term equal to the sum of the covariances across the three components described here See Esteban (2000) and Online Annex 23 for further details on the calculation
19See Online Annex 23 for further details
Lagging regions also have significantly lower labor productivities across sectors than do other regions (Figure 28 panel 1) These range from about 5 percent less in public services to about 15 percent less in industry and finance and professional services This lower productivity for lagging regions could reflect a mix of poorer characteristics such as lower human capitalmdashsomething highlighted as essential in much work on regional development including Acemoglu and Dell 2010 and Gennaioli and others 2013 2014mdashand less efficient labor allocation across sectors It may also reflect poorer quality of complements to labor in lagging regions such as connective infrastructure which has been identified as important in development in some
Productivity differential Sectoral employment mixAllocative Covariance
GRC
ITA
NOR
FRA
GBR
PRT
AUT
FIN
NZL
NLD
CZE
ESP
DNK
USA
KOR
CAN
SWE
AUS
ndash10
ndash05
00
05
10
15
20
Sources Organisation for Economic Co-operation and Development (OECD) Regional Database and IMF staff calculationsNote The figure illustrates the shift-share analysis and variance decomposition for regional differences by country from Esteban (2000) sorted according to the share of the overall average regional variance explained by regional productivity differentials across sectors For further details see Online Annex 23 The sample includes 18 advanced economies (all countries with five or more regions at the OECD territorial level 2) from 2003ndash14 For all countries the 10-sector ISIC Revision 4 classification of the OECD regional database is used (see Online Annex 21 for details) Bars sum up to 1 (overall average regional variance by country) Data labels use International Organization for Standardization (ISO) country codes
Figure 27 Shift-Share Variance Decomposition by Country 2003ndash14(Share of overall average regional variance)
For most advanced economies much of the regional variation in labor productivity can be attributed to differences in sector productivity across regions
CHAPTER 2 C LO s E R TO G E T H E R O R F U RT H E R a Pa RT W I T H I N - CO U N T Ry R E G I O N a L D I s Pa R I T I E s a N D a DJ U s TM E N T I N a DVa N C E D E CO N O M I E s
73International Monetary Fund | October 2019
studies (Allen and Arkolakis 2014 Donaldson and Hornbeck 2016) Box 22 presents evidence that local climate also plays a role and that climate change may exacerbate differences in productivity between lagging and other regions in advanced economies
In addition to being less productive lagging regions on average are also significantly likelier to have employment more concentrated in agriculture and industry than in services including the high productivity growth service sectors of information technology and communications and finance (Figure 28 panel 2) In other words lagging regions on average tend to be more rural and have employment more reliant on sectors with lower potential for productivity growth20
A simple counterfactual exercise supports the view that sectoral labor allocation plays an important role in the relative performance of regions (Figure 29) In advanced economies from 2002 to 2014 the average labor productivity of lagging regions as a percentage of the labor productivity of other regions declined by about 5 percent reflecting the evolution of both sectoral labor productivities and employment shares If only sectoral labor productivity changes were oper-ative with no change in employment shares the ratio would still have declined but by about one-third less than it did In other words rather than mitigating the relative decline in overall labor productivity for lagging regions the shift in sectoral labor allocation appears to have exacerbated it
Regional Labor Market Adjustment in Advanced Economies
To get a better sense of how differences in regional performance may reflect differences in shocks and responses to shocks the chapter investigates the effects of adverse local labor demand shocks on regional unemployment and migration21 If sectoral
20See Chapter 3 of the April 2018 World Economic Outlook (WEO) for how structural change in advanced economies and the (in)ability to shift into highly productive service sectors may impact inequality
21There has been a host of work in this vein inspired by Blanchard and Katzrsquos (1992) early work on US regional labor market dynamics and convergence Decressin and Fataacutes (1995) contrasts US and European regional dynamics finding less of a common com-ponent for employment and less migration in response to shocks in Europe More recently Dao Furceri and Loungani (2017) updates the analysis by Blanchard and Katz (1992) for the United States with improved and more recent data finding that labor mobility has declined
1 Labor Productivity(Percent difference)
2 Employment Share(Percentage point difference)
Sources Organisation for Economic Co-operation and Development Regional Database and IMF staff calculationsNote Lagging regions in a country are defined as those with real GDP per capita below the countryrsquos regional median in 2000 and with average growth below the countryrsquos average over 2000ndash16 Panel 1 shows the estimated difference in sectoral labor productivity in lagging versus other regions All models control for country-year fixed effects with standard errors clustered at the country-year level Solid bars indicate statistical significance at the 10 percent level while hollow bars do not Panel 2 shows the estimated difference in sectoral employment shares between lagging and other regions High productivity service sectors are finance and insurance information technology and communications and real estate All other service sectors are low-productivity service sectors See Online Annex 21 for the country sample
Lagging regions tend to have lower labor productivity across sectors and higher shares of employment in agriculture and industry sectors with lower shares of employment in services
Figure 28 Sectoral Labor Productivity and Employment Shares Lagging versus Other Regions
ndash20
10
ndash15
ndash10
ndash5
0
5
Indu
stry
Cons
truct
ion
Agric
ultu
re
Trad
e
Info
rmat
ion
tech
nolo
gyan
d co
mm
unic
atio
ns
Fina
nce
and
insu
ranc
e
Real
est
ate
Prof
essi
onal
ser
vice
s
Publ
ic s
ervi
ces
Othe
r ser
vice
s
ndash3
2
ndash2
ndash1
0
1
Agric
ultu
re
Indu
stry
Cons
truct
ion
Low
-pro
duct
ivity
ser
vice
s
High
pro
duct
ivity
ser
vice
s
W O R L D E C O N O M I C O U T L O O K G LO b a L M a N U FaC T U R I N G D OW N T U R N R Is I N G T R a D E b a R R I E R s
74 International Monetary Fund | October 2019
labor reallocation in a region functions effectively regional unemployment and participation should be largely shielded from adverse shocks while migration flows and within-region sectoral employment shifts to absorb them The critical insight that regional differences in the preexisting sectoral employment mix translate into regional differences in exposure to external shocks enables region-level shocks to be constructed22 Two particular types of local labor demand shocks are considered They attempt to
22First conceptualized and used by Bartik (1991) this insight for the construction of plausibly exogenous regional shocks based on preexisting regional differences in exposure to aggregate drivers was then popularized in the field of regional development and adjustment by Blanchard and Katz (1992) and for trade by Topalova (2010) Goldsmith-Pinkham Sorkin and Swift (2019) presents a critical evaluation of these kind of instruments
capture some of the much-discussed drivers of trade and technology23
bull A shock from increased import competition in external markets that is associated with the rise of Chinarsquos pro-ductivity (Autor Dorn and Hanson 2013a 2013b)24
bull A shock based on the interaction between a regionrsquos vulnerability to automation and the costs of machin-ery and equipment capital goods (building upon Autor and Dorn 2013 Chapter 3 of the April 2017 WEO Das and Hilgenstock 2018 and Lian and others 2019)
In general the findings point to regional labor markets having sluggish adjustment and reallocation in response to negative shocks in advanced economies25 Moreover even though the incidence of these shocks is actually somewhat lower for lagging than other regions (see Online Annex 25) some evidence detailed below suggests that lagging regions do suffer more in response to some shocks
Shocks from increasing import competition in exter-nal markets from Chinarsquos economic rise do not have marked average effects on regional unemployment in a broad sample of advanced economies although they do tend to reduce labor force participation after one year but this quickly abates (Figure 210) The responses of
23For recent work on the roles of trade and technology in driving disparities and other trends see Jaumotte Lall and Papageorgiou (2013) Karabarbounis and Neiman (2014) Dabla-Norris and others (2015) Autor Dorn and Hanson (2015) Helpman (2016) Abdih and Danninger (2017) Dao and others (2017) and Chapter 2 of the April 2018 WEO among others
24Although the trade shock associated with Chinarsquos rising produc-tivity has been well studied it is by no means the only trade shock for advanced economies In general advanced economies have faced increasing competition as emerging market economies have become more productive and engaged in international markets
25See Online Annex 25 for further details on the construction of the shocks and the regression model specification and estimation The dynamic responses of regional unemployment and labor force participation rates and inward and outward migration are estimated using the local projection method (Jordagrave 2005) controlling for lagged regional real GDP per capita lagged regional population density (helping to capture the degree of urbanization) lagged country real GDP per capita and region-specific and year fixed effects Although the analysis controls for many regional character-istics through region-specific fixed effects (capturing time-invariant characteristics of regions including geography and membership in a federation) and lagged regional real GDP per capita (proxying for many aspects of regional development) unobserved time-varying regional variables such as the extent of cross-regional fiscal redistri-bution may also impact adjustment and reallocation The findings therefore represent the average effects of the shocks within the sample given the existing distribution of unobservables Changes in the distribution of unobservables could entail changes in the effects of the shocks
The overall productivity difference between lagging and other regions has grown with about one-third due to poor allocation of labor across sectors and the rest to worsening sectoral productivity differences
Figure 29 Labor Productivity Lagging versus Other Regions(Ratio)
Sources Organisation for Economic Co-operation and Development Regional Database IMF staff calculationsNote Bars show the average country ratio of labor productivity (defined as real gross value-added per worker) in lagging regions to that of other regions in 2002 and 2014 across advanced economies In the counterfactual scenario sectoral employment shares are held constant at their 2002 levels while sectoral productivities are set at their realized values Lagging regions in a country are defined as those with real GDP per capita below the countryrsquos regional median in 2000 and with average growth below the countryrsquos average over 2000ndash16 See Online Annex 21 for the country sample and Online Annex 24 for further details on the calculation
080
085
081
082
083
084
2002 14 counterfactual 14
CHAPTER 2 C LO s E R TO G E T H E R O R F U RT H E R a Pa RT W I T H I N - CO U N T Ry R E G I O N a L D I s Pa R I T I E s a N D a DJ U s TM E N T I N a DVa N C E D E CO N O M I E s
75International Monetary Fund | October 2019
lagging regions do not look very different from those of other regions This stands in contrast to recent literature examining more highly localized labor markets in spe-cific countries For example Autor Dorn and Hanson (2013a) finds significant adverse local effects on employ-ment for the United States from a similarly defined shock Applying a similar approach over a similar period Dauth Findeisen and Suedekum (2014) estimates an overall positive net employment effect of the rise in trade
for Germany These studies suggest that the regional effects of trade may vary across countries However the results presented here are not inconsistent with these studies given that they reflect the average regional effect within countries for the group of advanced economies rather than country-specific responses Moreover the analysis here is undertaken at a higher level of regional aggregation and over a later period (post-1999)
By contrast adverse shocks to local labor demand arising from technological change have noticeable and persistent effects on labor markets (Figure 211) Although there is little sign of an impact effect unem-ployment rates in regions more vulnerable to automa-tion rise steadily over the following four yearsmdasha pattern consistent with a gradual substitution of capital for labor The absence of much change in gross migration flows over the near term indicates that labor mobility across regions is low after automation shocks For lagging regions that are more vulnerable to automation the rise in unemployment rates is even larger and statis-tically significantly different from that of other regions Moreover unlike other regions more vulnerable lagging regions see a persistent and statistically significant drop in out-migration after an automation shock suggest-ing that workers in these regions may find it harder to move than if they were in other regions Box 23 studies the regional effects of automotive manufacturing plant closures which may ultimately be driven by trade or technology shocks finding similarly persistent increases in unemployment which tend to be worse in regions where gross migration flows are lower
Can national labor market policies and distortions inhibit regional labor market adjustment They might if they contribute to more rigid regional labor markets leading adverse shocks to have more long-lived effects on unemployment and participation26 The following discussion examines how the calibration of two national labor market policiesmdashthe stringency of employment protection regulations and the gener-osity of unemployment insurance schemesmdashinfluence regional labor market responses to local shocks More stringent employment protection regulation will tend to reduce job destruction dampening the likelihood of layoffs but also job creation and the hiring rate as employers recognize that new hires come with the potential cost of more sluggish adjustment in
26An example of a national structural policy that alters the func-tioning of regional labor markets is presented in Boeri and others (2019) which compares the regional effects of Italyrsquos and Germanyrsquos national collective bargaining systems
Average region90 percent confidence bandsLagging region
Figure 210 Regional Effects of Import Competition Shocks
ndash06
3 In-Migration(Percent)
0 1 2ndash6
ndash4
ndash2
0
2
4
6
8
10
Years after shockYears after shock3 0 1 2 3 44
ndash6
ndash4
ndash2
0
2
4
6
8
10
ndash04
ndash02
00
4 Out-Migration(Percent)
2 Labor ForceParticipation Rate(Percentage points)
1 Unemployment Rate(Percentage points)
02
04
06
0 1 2 3 0 1 2 3 44Years after shockYears after shock
ndash02
ndash01
00
01
02
03
04
Source IMF staff estimationsNote The blue and red solid lines plot the impulse responses of the indicated variable to a one standard deviation import competition shock defined as the growth of Chinese imports per worker in external markets weighted by the lagged regional employment mix Impulse responses are estimated using the local projection method of Jordagrave (2005) Horizon 0 is the year of the shock Lagging regions in a country are defined as those with real GDP per capita below the countryrsquos regional median in 2000 and with average growth below the countryrsquos average over 2000ndash16 See Online Annex 21 for the country sample and Online Annex 25 for further details about the shock definition and econometric specification
Greater competition in external markets tends to raise unemployment in the near term for exposed regions with little difference between lagging and other regions But this rise unwinds as regions adjust relatively quickly
W O R L D E C O N O M I C O U T L O O K G LO b a L M a N U FaC T U R I N G D OW N T U R N R Is I N G T R a D E b a R R I E R s
76 International Monetary Fund | October 2019
downturns Whether unemployment rises in response to adverse shocks depends on which of these two forces dominates which is theoretically ambiguous (Pissarides 2001) Unemployment insurance provides security against income shocks from job loss but can also impact the dynamics of unemployment through its impacts on an individualrsquos job search efforts and job quality with reemployment (Chetty 2008 Tatsiramos and van Ours 2014 Schmieder von Wachter and Bender 2016)
Analysis suggests that national policies do matter for regional labor market adjustmentmdashthey may exacerbate or dampen adverse unemployment effects although their impact varies across outcomes and shocks (Figure 212) Moreover the findings should be interpreted as associational given that national policies are only considered one-by-one rather than jointly That means that the change in regional responses associated with national employment protection and unemployment benefits policies may incorporate the influence of correlated national policies that are not included in the analysis
More stringent national employment protection is associated with greater regional unemployment effects from import competition and automation shocks Automation shocks are also associated with higher unemployment in the near term where benefits are greater suggesting that the incentive effects of greater benefits do make unemployment more persistent although the difference vanishes at longer horizons Responses to import competition shocks meanwhile show little difference between more versus less generous unemployment benefit regimes The overall takeaway from these findings is that national policies that encourage more flexible labor markets may ease adjustment and reallocation in regional labor markets improving their resilience to shocks
Regional Labor Mobility and Factor Allocation Individual and Firm-Level Evidence
As noted regional adjustment to shocks depends on the effectiveness of factor reallocationmdashthe ability of capital and labor to move across sectors firms and space toward their most productive use Where factor mobility within and across regions is hampered or reallocation ineffective negative shocks may have prolonged effects contributing to poorer performance in some regions and exacerbating disparities within a country This section examines differences in labor mobility between lagging regions and others the characteristics of regional migrants and the differences across regions in the efficiency with which firms allo-cate capitalmdashthe sensitivity of their investments to the marginal returns to capital
Lagging regions on average have lower gross migra-tion flows (inward or outward) than other regions This suggests that their labor reallocation mecha-nisms are less powerful given that lagging regions are actually less likely than other regions to experience
Average region90 percent confidence bandsLagging region
Figure 211 Regional Effects of Automation Shocks
1 Unemployment Rate(Percentage points)
ndash3
ndash2
ndash1
0
1
2
ndash03
ndash02
ndash01
00
01
022 Labor ForceParticipation Rate(Percentage points)
4 Out-Migration(Percent)
3 In-Migration(Percent)
0 1 2Years after shock Years after shock
3 0 1 2 3 44ndash3
ndash2
ndash1
0
1
2
0 1 2Years after shockYears after shock
3 0 1 2 3 44ndash02
00
02
04
06
08
Source IMF staff estimationsNote The blue and red solid lines plot the impulse responses of the indicated variable to an automation shock defined as a one standard deviation decline in machinery and equipment capital price growth for a region that experiences a one standard deviation rise in its vulnerability to automation (Autor and Dorn 2013 Lian and others 2019) Horizon 0 is the year of the shock Lagging regions in a country are defined as those with real GDP per capita below the countryrsquos regional median in 2000 and with average growth below the countryrsquos average over 2000ndash16 See Online Annex 21 for the country sample and Online Annex 25 for further details about the shock definition and econometric specification
Falling machinery and equipment prices tend to raise unemployment in regions where production is more vulnerable to automation with exposed lagging regions hurt even more Out-migration stalls or drops for more exposed lagging regions
CHAPTER 2 C LO s E R TO G E T H E R O R F U RT H E R a Pa RT W I T H I N - CO U N T Ry R E G I O N a L D I s Pa R I T I E s a N D a DJ U s TM E N T I N a DVa N C E D E CO N O M I E s
77International Monetary Fund | October 2019
shocks (Figure 213 panel 1)27 The better educated (either upper secondary or tertiary education) or employed are more likely to move within countries (Figure 213 panels 2 and 3) Those facts are consistent with migration being more constrained in lagging regions where unemployment tends to be higher and education and skills lower
For another perspective on factor allocation across regions within a country differences in firmsrsquo alloca-tive efficiency across regions of a country are analyzed Allocative efficiency is measured at the firm level by the responsiveness of their investment (capital growth) to the firmrsquos marginal return on an additional unit of capital (captured by the marginal revenue product of capital) after accounting for a host of region-sector-country-year differences These firm-level estimates are then mapped to the region-country-sector-year enabling the construction of their distribution across regions by country sector and year Analysis shows that greater variability in firmsrsquo allocative efficiency across regions within a countrymdashas captured by the ratio of the standard deviation to the mean allocative efficiency by country-sector-yearmdashis correlated with greater regional disparities in economic activity In essence when regional differences in firmsrsquo responsiveness to marginal returns to capital are large the spread in regional performance also tends to be wider28
As with regional adjustment dynamics national-level structural policies and distortions may affect the vari-ability in firmsrsquo allocative efficiencies across regions of a country by creating incentives for more or less efficient firm choices The analysis indicates that national policies that support greater flexibility and openness in product markets are associated with lower variability of firmsrsquo allocative efficiency across regions of a country (Figure 214) In particular countries with less strin-gent product market regulation (related to the level of protection for incumbent firms) lower administrative costs for starting a business and greater trade open-ness are all associated with lower variability in capital allocative efficiency across regions These associations might reflect the selective effects of more competitive and contestable markets on firms pushing allocative efficiency across regions closer together and of the beneficial effects of greater flexibility for factors to be reallocated by individual firms and also across firms
27See Online Annex 25 for further details on the incidence of import competition from China and automation shocks for lagging versus other regions
28See Online Annex 26 for further details on the construction of the measure The ratio of the standard deviation to the mean of a distribution is also known as the coefficient of variation
Less stringent EPLMore stringent EPL
Lower UBHigher UB
Employment Protection Legislation
Regional adjustment to adverse trade and technology shocks tends to be faster in countries with policies supporting more flexible labor markets
Figure 212 Regional Effects of Trade and Technology Shocks Conditional on National Policies(Percentage points)
Source IMF staff estimationsNote Years after impact on x-axis Less (more) stringentlow (high) = 25th (75th) percentile of the indicated variable EPL = Index of employment protection legislation UB = gross replacement rate of unemployment benefits Dashed lines indicate the 90 percent confidence bands See Figures 210 and 211 for definitions of the import competition and automation shocks See Online Annex 25 for detailed definitions of import competition and automation shocks and Online Annex 21 for country samples
Unemployment Benefits
1 Import Competition Shock
2 Automation Shock
4 Automation Shock
3 Import Competition Shock
ndash08
ndash04
00
04
08
12
ndash04
ndash02
00
02
04
06
08
ndash04
ndash02
00
02
04
ndash20ndash15ndash10ndash05
0005101520
ndash04
ndash02
00
02
04
06
08
ndash03
ndash02
ndash01
00
01
02
ndash04
ndash02
00
02
04
06
08
ndash04
ndash02
00
02
04
06
08
0 1 2 3 4 0 1 2 3 4
0 1 2 3 4 0 1 2 3 4
0 1 2 3 4 0 1 2 3 4
0 1 2 3 4 0 1 2 3 4
Unemployment Rate
Unemployment Rate
Unemployment Rate
Unemployment Rate Labor ForceParticipation Rate
Labor ForceParticipation Rate
Labor ForceParticipation Rate
Labor ForceParticipation Rate
W O R L D E C O N O M I C O U T L O O K G LO b a L M a N U FaC T U R I N G D OW N T U R N R Is I N G T R a D E b a R R I E R s
78 International Monetary Fund | October 2019
Summary and Policy ImplicationsThe regional dimension of economic performance
has generated much interest in recent years reflecting the perception that increasing regional differences in growth and employment opportunities in advanced economies are stoking social unease and distrust as some regions and peoples are left behind The chapter shows that while there is a grain of truth in these contentions the size and scope of regional disparities differs markedly across economies Regional disparities are closely associated with differences in the sectoral composition of employment and levels of sectoral pro-ductivity Lagging regions of a country are more likely to have lower labor productivity across sectors and to be more concentrated in agriculture and industry than in services (and particularly high productivity growth service sectors such as information technology
Other regionsLagging regions
1 Migration into and out of Lagging and Other Regions(Percent of population)
00 05 10 15 20
Migration out (young)
Migration in (young)
Migration out
Migration in
Gross migration flows tend to be smaller in lagging regions The better educated and employed are more likely to migrate within a country
Figure 213 Subnational Regional Migration and Labor Mobility
Sources Organisation for Economic Co-operation and Development Regional Database European Union (EU) Labor Force Survey and IMF staff calculationsNote Panel 1 shows migration into and out of lagging regions versus other regions between 2000ndash16 defined as gross inflows and outflows of migrants divided by the population in the previous period in the region Lagging regions in a country are defined as those with real GDP per capita below country regional median in 2000 and with average growth below the countryrsquos average over 2000ndash16 Panel 2 plots the share of the population who moved within the past year by education level based on individual worker level data from the EU Labor Force Survey between 2000ndash16 Lower secondary education indicates educational attainment less than 9 years upper secondary education between 9 and 12 years and tertiary education greater than 12 years Panel 3 plots the share of the population who moved within the past year by employment status based on individual worker level data from the EU Labor Force Survey between 2000ndash16 See Online Annex 21 for the country sample
Up to lower secondaryeducation
Inactive Unemployed Employed
Upper secondaryeducation
Tertiary education0
2
4
6
8
10
12
14
16 2 Share of Population Moving within Countries by EducationalAttainment(Percent)
0
2
4
6
8
10
12 3 Share of Population Moving within Countries by EmploymentStatus in the Preceding Year(Percent)
ndash010
ndash008
ndash006
ndash004
ndash002
000
Less stringent productmarket regulation
Tradeopenness
Ease of startingbusiness
Chan
ge in
coe
ffici
ent o
f var
iatio
n of
regi
onal
capi
tal a
lloca
tive
effic
ienc
y
The regional dispersion of firmsrsquo allocative efficiencymdashthe responsiveness of their investment to capital returnsmdashtends to be lower in countries where national policies support more open markets
Source IMF staff calculationsNote Bars show the associated average change in the coefficient of variation of regional capital allocative efficiency calculated by country-sector-year for a one standard deviation change in the indicated structural policy variable All effects shown are statistically significant at the 10 percent level Regression controls for country-sector and sector-year fixed effects with standard errors clustered at the country-year level See Online Annex 21 for the country sample and Online Annex 26 for further details on the econometric methods
Figure 214 Effects of National Structural Policies on Subnational Regional Dispersion of Capital Allocative Efficiency(Response to one standard deviation increase in indicated policy variable)
CHAPTER 2 C LO s E R TO G E T H E R O R F U RT H E R a Pa RT W I T H I N - CO U N T Ry R E G I O N a L D I s Pa R I T I E s a N D a DJ U s TM E N T I N a DVa N C E D E CO N O M I E s
79International Monetary Fund | October 2019
and communications) They also tend to have smaller populations of prime-age workers than other regions which may contribute further to their poorer productivity performance (Feyrer 2007 Adler and others 2017)
Regional adjustment to adverse local labor demand shocks generally takes time and is associated with higher unemployment reflecting frictions in shift-ing production and employment across sectors and labor mobility Lagging regions do not appear more likely to be hit by these shocks but they do appear to suffer more in response to somemdashin particular shocks related to differences in exposure to technological changesmdashsuggesting that adjustment mechanisms in lagging regions may be more obstructed than in other regions
How might policies reduce these disparities and promote improved regional adjustment The analyses here and in earlier literature suggest several possible actions As noted earlier the consensus is that human capital plays a pivotal role in driving regional develop-ment Boosting educational and training quality and opportunities where there are gaps as well as introduc-ing more broad-based educational reforms to improve learning outcomes and adapt to the changing world of work would disproportionately benefit lagging regions (see also Coady and Dizioli 2017 and WB 2018 2019a) Similarly deploying more active labor market policies to create jobs retrain the displaced and find new job matches for the unemployed could also help lift lagging regions and ease adjustment However the design of active labor market policies matters enormously for their success They must be carefully tailored to address the labor market failures specific to a regionrsquos context and assessed and improved regularly (Card Kluve and Weber 2018)
National labor and product market policies and distortions also affect regional adjustment and factor reallocation (Dabla-Norris and others 2015 Boeri and others 2019) Evidence presented here suggests that the appropriate calibration of employment protection regulations and unemployment insurance regimes can
facilitate regional labor market adjustment damp-ening the unemployment effects of adverse shocks Greater flexibility can also be helpfully accompanied by stronger retraining and other forms of job assis-tance to help ensure displaced workers achieve any necessary reskilling and reemployment rapidly (Aiyar and others 2019)29 Product markets that are more openmdashthrough lower barriers to entry and greater trade opennessmdashare associated with lower variability in the capital allocative efficiencies of firms across the regions of a country which is in turn associated with lower regional disparities More competitive markets within a country are associated with greater efficiency in the reallocation of capital both in and across regions
Although not a focus of the analysis here owing to data constraints spatially targeted place-based fiscal policies and investments may also help lagging regions but only when need is spatially concentrated and individual-level targeting has been less effective (Box 24 explores place-based policies and offers more in-depth discussion) There is evidence that greater fiscal decentralization which effectively enables more spatially differentiated policies may also help reduce regional disparities (Lessmann 2009 Kappeler and others 2013 Bloumlchliger Bartolini and Stossberg 2016) Austin Glaeser and Summers (2018) argues that explicit spatial targeting may also be justified if some regions are more sensitive to fiscal interven-tions than othersmdashfor example if an area has greater labor market slack because local demand conditions are depressed However place-based policies must be carefully designed to ensure that beneficial adjust-ment is encouraged rather than resisted (Kline and Moretti 2014) and to avoid interfering with the continued success of leading regions (Barca McCann and Rodriacuteguez-Pose 2012 Pike Rodriacuteguez-Pose and Tomaney 2017 Rodriacuteguez-Pose 2018)
29For example see the Danish model of ldquoflexicurityrdquo which accompanies great flexibility in hiring and firing with retraining job matching and unemployment benefits that are subject to strong monitoring and conditionality (OECD 2016a)
W O R L D E C O N O M I C O U T L O O K G LO b a L M a N U FaC T U R I N G D OW N T U R N R Is I N G T R a D E b a R R I E R s
80 International Monetary Fund | October 2019
Although real GDP per capita has many shortcom-ings as a measure of individual well-being and social welfare it remains a touchstone in much economic analysis and cross-country comparisons1 Recent research suggests that it is also still useful as a broad metric for cross-country comparisons finding it highly correlated for a large set of indicators based on various aspects of human welfare (including subjec-tive well-being mortality inequality and leisure)2 However in the case of within-country regional comparisons two issues arise that can complicate the welfare interpretation of patterns of real GDP per capitamdashregional price or cost-of-living differences and the effects on personal income of fiscal redistribution and income flows to and from elsewhere
Although real GDP per capita is typically corrected for average cross-country differences in cost-of-living (purchasing power parity adjustments) regional differences in the cost-of-living are often not fully reflected in regional real GDP per capita measures largely because regional price indexes are not broadly available3 Gennaioli and others (2014) attempts to correct for this for a subset of countries in its global data set using housing cost differences as a proxy for the cost of living The study finds that although the size of regional disparities fell they remained substantial Gbohoui Lam and Lledo (2019) undertakes a similar calculation using more recent data As shown in Figure 211 it also finds that regional disparities (as captured by the ratio of real GDP per capita in the 75th to the 25th percentile region within-country) narrowed with the correction but remained significant with the ratio going from 134 to 126 on average Hence although regional price differences are part of the picture they do not account for all regional disparities in economic activity
Real GDP per capita is a measure of real output or economic activity occurring within a territory
The author of this box is John Bluedorn with contributions from William Gbohoui W Raphael Lam and Victor Lledo
1See Fleurbaey (2009) Coyle (2015) Feldstein (2017) and Stiglitz Fitoussi and Durand (2018) among others
2See Stevenson and Wolfers (2008) and Jones and Klenow (2016) for evidence
3See Feenstra Inklaar and Timmer (2015) for a discussion of the purchasing power parity adjustment of GDP measures and OECD (2018) for details on the construction in the OECD Regional Database
over a given period (UN 2009) It is not a measure of an individualrsquos or householdrsquos income available for their consumption and investment which would be a more direct measure of welfare This is more properly captured by disposable incomemdashthe sum of labor compensation and investment income after taxes and transfers4 Given that disposable income incorporates income streams from elsewhere such as capital income from geographically diversified port-folios it can better capture interregional risk sharing and result in narrower regional disparities5 Fiscal
4See OECD (2013 2018) for further details on disposable income and its construction and availability at the region-level
5Asdrubali Soslashrensen and Yosha (1996) leverages this fact to estimate the extent of interregional risk-sharing within the United States
Before price adjustmentsAfter price adjustments
Figure 211 Subnational Regional Disparities Before and after Regional Price Adjustment(Ratio for the interquartile range of real GDP per capita across subnational regions by country during 2010ndash14)
Source Gbohoui Lam and Lledo (2019)Note Constructed from Organisation for Economic Co-operation and Development Regional Database Gennaioli and others (2014) and Luxembourg Income Study for available years The price adjustment is based on the housing deflator Data labels use International Organization for Standardization (ISO) country codes
10
12
14
16
18
20
IRL
DEU
CAN
ITA
FIN
AUS
GRC
NLD
AUT
DNK
ESP
USA
SWE
CZE
FRA
GBR
Aver
age
Box 21 Measuring Subnational Regional Economic Activity and Welfare
CHAPTER 2 C LO s E R TO G E T H E R O R F U RT H E R a Pa RT W I T H I N - CO U N T Ry R E G I O N a L D I s Pa R I T I E s a N D a DJ U s TM E N T I N a DVa N C E D E CO N O M I E s
81International Monetary Fund | October 2019
redistribution through taxes and transfers within and across regions can provide a further channel for narrowing income differences across regions6 For the limited countries and years for which data on regional disposable income per capita are available regional differences are smaller than they are as mea-sured by real GDP per capita differences but again can be substantial (OECD 2018) For example the top income regions in the United States had average
6See Obstfeld and Peri (1998) and Boadway and Shah (2007) for a discussion of the role of fiscal redistribution in facilitating adjustment
disposable income per capita more than 50 percent higher than the national average
With its wider availability across time and countries regional real GDP per capita remains the best measure for assessing the extent and evolution of regional differences in economic activity However recognizing its drawbacks as a measure of welfare and motivated by the extensive evidence on the pivotal role of employment in individualrsquos life satisfaction the chapterrsquos analysis focuses more on regional labor market outcomes and adjustment paralleling some of the latest research (Austin Glaeser and Summers 2018)
Box 21 (continued)
W O R L D E C O N O M I C O U T L O O K G LO b a L M a N U FaC T U R I N G D OW N T U R N R Is I N G T R a D E b a R R I E R s
82 International Monetary Fund | October 2019
Climate change may further exacerbate subnational regional disparities in many advanced economies by the end of the 21st century This conclusion is based on two findings First estimates of the effect of temperature increases on sectoral labor productivitymdashagriculture industry and servicesmdashat the subnational level indicate that agriculture and industry are likely to suffer even in advanced economies Second because lagging regions tend to specialize in agriculture and industry (see Figure 29) the negative effect of global warming on labor productivity may be larger in lagging regions therefore pushing them to fall behind even more by the end of the 21st century1
Analysis at the country-level presented in Chapter 3 of the October 2017 World Economic Outlook already establishes that a 10degC increase in temperature lowers labor productivity in heat-exposed industries (mostly agriculture and industry) while there is no negative effect on non-heat-exposed industries (mostly services)2 It also shows little adaptation to climate change except in advanced economies Because the analysis in this box focuses only on the advanced economies which have already invested in climate adaptation any negative effects uncovered here are likely to be at the lower bound of estimates in a global sample
In general temperature has a nonlinear effect on economic activitymdashin very cold regions warming may bring economic benefits Beyond a certain ldquooptimalrdquo level temperature increases hurt economic output and labor productivity However there is significant heterogeneity in the relationship between temperature and labor productivity across sectors as Figure 221 demonstrates3 For example for a median lagging region which has an average annual temperature of 12degC in this sample an increase in temperature by 1degC would reduce labor productivity in the agriculture and industry sectors and have no effect on the service
The author of this box is Natalija Novta1See also the October 2019 Fiscal Monitor for analysis
examining how climate change mitigation policies may differ-entially impact regions within a country depending on their industry mix
2Heat-exposed industries include forestry fishing and hunting construction mining transportation utilities and manufacturing following the classification by Graff Zivin and Neidell (2014)
3Based on the estimates in Figure 221 the optimal tempera-ture is about 14degC for the service sector but only 5degC and 9degC for industry and agriculture sectors respectively
sector In contrast because the median non-lagging region is at 105degC an increase in average annual tem-perature by 1degC would raise productivity in the service sector lower it in the industry sector and have no statistically significant effect on the agriculture sector
Services Industry Agriculture
Figure 221 Marginal Effect of 1degC Increase in Temperature on Sectoral LaborProductivity
Sources Organisation for Economic Co-operation and Development (OECD) Regional Database University of East Anglia Climate Research Unit and IMF staff calculationsNote The figure shows the contemporaneous effect of a 1degC increase in temperature on sectoral labor productivity Because temperature has a nonlinear effect its marginal effect is shown at each level of regional average annual temperature The baseline specification mirrors that of Chapter 3 of the October 2017 World Economic Outlook but is reestimated in a sample of subnational regions within advanced economies with a population of at least a quarter million The industry sector includes industry manufacturing and construction from the OECD classification (ISIC Revision 4) Sectoral labor productivity is defined as sectoral gross value added divided by the number of employees in that sector The dependent variable is the growth of sectoral labor productivity and it is regressed on average annual population-weighted temperature temperature squared precipitation and precipitation squared controlling for one-year lags of all the climate variables a lag of the dependent variable and subnational regional fixed effects The solid lines show the point estimates for each sector and the dashed lines show 90 percent confidence intervals Standard errors are clustered at the level of subnational regions
ndash20
ndash15
ndash10
ndash5
0
5
10
15
0 2 4 6 8 10 12 14 16 18 20 22
Perc
ent c
hang
e in
labo
r pro
duct
ivity
Temperature
Box 22 Climate Change and Subnational Regional Disparities
CHAPTER 2 C LO s E R TO G E T H E R O R F U RT H E R a Pa RT W I T H I N - CO U N T Ry R E G I O N a L D I s Pa R I T I E s a N D a DJ U s TM E N T I N a DVa N C E D E CO N O M I E s
83International Monetary Fund | October 2019
Given these findings it is not surprising that lagging (warmer) regions might be expected to fall further behind in the coming decades In the early 2000s labor productivity in lagging regions was on average at about 85 percent of that in other regions (Figure 29) Under an unmitigated climate change scenario (Representative Concentration Pathway (RCP) 85)4 labor productivity in lagging regions could fall by about 2ndash3 percentage points in Italy Spain and the United States by 2100 (Figure 222) This is similar to the decline in relative labor produc-tivity of the lagging regions between 2002 and 2014 (Figure 29) Under a milder scenario which assumes emissions peaking around 2050 (RCP 45) the decline in labor productivity of lagging regions would be smaller at about 15 percentage points
Historical weather patterns may have already contributed to some regions falling behind An increase in a regionrsquos average annual temperature by 1degC increases the probability of being lagging by about 2 percentage points or about 10 percent relative to the baseline likelihood of about 20 percent even after controlling for country-year fixed effects This means that a hypothetical move from the coolest to the warmest region within a country which have a median temperature difference of about 55degC is associated with about an 11 percentage point higher chance of being lagging
Finally it is important to note that even though climate change is a relatively slow process it is very persistent and its negative effects have historically been extremely hard to eliminate Therefore even the seemingly small absolute effects demonstrated here should be a cause for concern especially because they appear in the context of advanced economies that are relatively well-adapted and tend to have temperate climates
4As constructed by the Intergovernmental Panel on Climate Change
RCP 45RCP 85
Figure 222 Change in Labor Productivity of Lagging versus Other Regions Due to Projected Temperature Increases between 2005 and 2100(Percentage points)
Sources National Aeronautics and Space Administration temperature projections for scenarios RCP 45 and 85 Organisation for Economic Co-operation and Development Regional Database and IMF staff calculationsNote To construct the figure the following procedure is followed first for 2005 the ratio of labor productivity in lagging regions relative to other regions is calculated as the weighted average of labor productivities in agriculture industry and services second the mean projected temperature increases for 2005ndash2100 under RCP scenarios 45 and 85 and the estimated sectoral labor productivitiesare used to project sectoral labor productivity at the level of subnational regions in 2100 under each of the two RCP scenarios and finally the difference between the projected labor productivity of lagging regions (relative to others) in 2100 and actual labor productivity of lagging regions (relative to others) in 2005 is calculated Representative Concentration Pathways (RCP) are scenarios of greenhouse gas concentrations constructed by the Intergovernmental Panel on Climate Change (IPCC 2014) RCP 45 is an intermediate scenario which assumes emissions peaking around 2050 and declining thereafter RCP 85 is an unmitigated scenario in which emissions continue to rise throughout the 21st century
ndash30 ndash25 ndash20 ndash15 ndash10 ndash05 00
Netherlands
United Kingdom
Germany
Canada
Sweden
Italy
Spain
United States
Box 22 (continued)
W O R L D E C O N O M I C O U T L O O K G LO b a L M a N U FaC T U R I N G D OW N T U R N R Is I N G T R a D E b a R R I E R s
84 International Monetary Fund | October 2019
The declining share of manufacturing jobs in overall employment over the past decades has attracted atten-tion in recent years due to concerns that manufac-turing might play a role as a catalyst for productivity growth and income convergence and be a source of well-paid jobs for less-skilled workers (Chapter 3 of the April 2018 World Economic Outlook presents in-depth analysis of this contention) Factory closures have accompanied this trend with job losses some-times concentrated in particular regions within coun-tries A large literature exists on the local labor market impacts of factory closures with most early studies focused on closures affecting heavy industry such as coal steel and shipbuilding1 In more recent years the effects of automotive manufacturing plant closures have become the focus of more studies although most examine the effects for a single country or of a specific closure2
With these in mind this box looks at the impact of automotive manufacturing plant closuresmdashevents caused by forces originating outside the immediate regionmdashon the regional labor markets for a sample of six advanced economies for which historical data on automotive factory closures are available3 The box compares unemployment rates in regions that experienced car factory closures during 2000ndash16 and in regions in the same country that did not experience such shocks If regions of a country were adept at real-locating labor and capital they could absorb shocks including permanent shocks and show no persistent effects on local activity and employment and little difference between the two groups of regions
The analysis suggests that regions that experienced car factory closures typically had bigger increases in unemployment rates after the closures than comparator regions in the same countries with the difference being statistically significant Regressing regional unemployment rates on a dummy variable
The author of this box is Zsoacuteka Koacuteczaacuten1See Martin and Rowthorn (1986) Pinch and Mason (1991)
Hinde (1994) Kirkham and Watts (1998) Tomaney Pike and Cornford (1999) Shutt Henderson and Kumi-Ampofo (2003) and Henderson and Shutt (2004) among others
2See Chapain and Murie (2008) Ryan and Campo (2013) Bailey and others (2014) and Stanford (2017) for recent examples
3The sample of countries includes Australia Canada Germany Italy the United Kingdom and the United States covering 2000ndash16 Over the period 30 closures were recorded in these countries
for whether the region experienced at least one plant closure points to significant and persistent effects even after controlling for differences between regionsrsquo employment shares in industry initial real GDP per capita population density and dependency ratios (Figure 231 full sample) Unemployment rates in regions with car factory closures increase for three years after the shock as the initial impact of the closure is magnified by local spillover effects to other sectors4
Out-migration is expected to be a key adjustment mechanism after automotive factory closures if other local employment options are insufficient
4See Goldstein (2017) for vivid descriptions of such effects
Full sample High migration Low migration
Figure 231 Associations between Automotive Manufacturing Plant Closures and Unemployment Rates(Percentage point change in unemployment rate)
Sources Organisation for Economic Co-operation and Development Regional Database and IMF staff calculationsNote The figure shows coefficient estimates from regressions of the unemployment rate on a dummy variable for whether the region experienced at least one plant closure controlling for initial GDP per capita population density share of employment in industry and the dependency ratio Solid bars indicate statistical significance at the 10 percent level while hollow bars do not High and low migration refer to gross migration flows split at the sample median
ndash10
30
ndash05
00
05
10
15
20
25
ndash1 0 1 2 3 4 5Years beforeafter plant closures
Box 23 The Persistent Effects of Local Shocks The Case of Automotive Manufacturing Plant Closures
CHAPTER 2 C LO s E R TO G E T H E R O R F U RT H E R a Pa RT W I T H I N - CO U N T Ry R E G I O N a L D I s Pa R I T I E s a N D a DJ U s TM E N T I N a DVa N C E D E CO N O M I E s
85International Monetary Fund | October 2019
To examine the role of migration the regressions in this study are repeated separately for regions with high and low gross migration flows The persistent unem-ployment effects are driven by regions with low gross migration flows The negative effects of closures are not statistically significant in regions with high gross migration flows (Figure 231 high and low migration subsamples) The highly persistent effects of perma-nent automotive factory closures are consistent with adjustment being stuck in some regions particularly
those where mobility is low potentially due to the more constrained and selective nature of migration5 Endogenous local demand effects and expectations about the future development of a place hit by factory closures could further reinforce the effects of such local shocks exacerbating regional disparities within countries
5See Kim (2008) and Duranton and Venables (2018) for discussions of the nature of mobile labor
Box 23 (continued)
W O R L D E C O N O M I C O U T L O O K G LO b a L M a N U FaC T U R I N G D OW N T U R N R Is I N G T R a D E b a R R I E R s
86 International Monetary Fund | October 2019
Policymakers deploy a variety of tools to reduce economic inequality including fiscal redistribution through taxes and transfers and growth-friendly poli-cies to improve education health care infrastructure and affordable housing (October 2017 Fiscal Monitor) Most national policies have been spatially blind targeting individuals based on their circumstances and characteristics regardless of their residency Examples of such policy measures include national disability and unemployment payments in the United States and unemployment benefits in France and Spain which are targeted to individuals in need or who are unemployed irrespective of their location However persistent and growing regional economic disparities in some countries have increased interest in place-based or spatially targeted fiscal policies as a further way to tackle inequality
Place-based policies intend to promote regional equity and inclusive growth and to insure against region-specific shocks (Kim and Dougherty 2018) Examples of such policies include the European Unionrsquos Regional Development Funds that support naturally disadvantaged (remote less-developed or disaster-stricken) subnational regions Canadarsquos Regional Development Agencies which provide support to diversify regional economies and foster community development and US enterprise zones
The authors of this box are William Gbohoui W Raphael Lam and Victor Lledo
which provide tax credits to generate new jobs and investment As shown in Table 241 spatially targeted interventions can differ according to their proximate objectives spatial coverage and fiscal instruments The decision on what to use will depend on the nature of the underlying regional issues
Place-based policies can boost the success of existing fiscal policies in reducing inequality if (1) the intended recipients such as low-income households or the unemployed are geographically concentrated and (2) traditional nationwide means-testing approaches have limited coverage are less progressive or are diffi-cult to enforce (Coady Grosh and Hoddinott 2004 October 2017 Fiscal Monitor)1 Place-based policies may also have merit if fiscal interventions are expected to have stronger impacts on the disadvantaged in cer-tain regions for example in the case of hiring incen-tives that might be more effective in creating jobs and growth in regions with higher unemployment rates (Austin Glaeser and Summers 2018) Place-based policies should ensure that interventions facilitate convergence and sectoral reallocation in response to shocks rather than create new barriers But policy-makers should also be mindful that such policies may raise horizontal equity concerns as individuals with
1Limited coverage refers to the fact that in most countries only a portion of the households that meet the criteria to receive a transfer (for example means-tested) actually receive the trans-fer Coverage is calculated as the percent of eligible households that in fact receive the transfer
Table 241 Examples of Place-Based PoliciesAims Instruments Country Programs CoverageEnterprise zones attract firms to create jobs and invest
Tax incentives on investment job creation and corporate income taxes streamlined regulations
US Federal Empowerment Zones
Zones and communities within the region
Cluster promotion agglomeration of high-tech firms and research institutions
Tax incentives public research and development spending grants
Francersquos Local Productive System ldquoHigh-tech Offensiverdquo programs in Bavaria Germany
Region at large communities within the region
Relocation programs Compensate people to liverelocate in selected regions
Tax exemptions on personal income tax grants and transfers
US low-income housing tax credit Spainrsquos income tax credits for unemployed that relocate for jobs Canadian Northern Economic Development initiative to retain youth in northern regions
Low-income neighborhoods
Sources Neumark and Simpson (2014) WB (2009) and IMF staff estimates
Box 24 Place-Based Policies Rethinking Fiscal Policies to Tackle Inequalities within Countries
CHAPTER 2 C LO s E R TO G E T H E R O R F U RT H E R a Pa RT W I T H I N - CO U N T Ry R E G I O N a L D I s Pa R I T I E s a N D a DJ U s TM E N T I N a DVa N C E D E CO N O M I E s
87International Monetary Fund | October 2019
the same status but living in different regions may receive different treatment
Drawing on individual household income surveys for a selected sample of countries illustrative simu-lations suggest that combining spatial targeting with conventional means-testing programs could improve the effectiveness of fiscal redistributionmdashas captured by the size of the decline in income inequalitymdashby 7ndash10 percent without increasing fiscal costs (see Figure 241 and Gbohoui Lam and Lledo 2019 for further details) For example because France and the United Kingdom have highly progressive social safety nets and are successful at reaching a high percentage of households eligible for transfers the potential gains from spatial targeting are relatively small (at about 7ndash8 percent) But improvements are larger (about 10 percent) in the United States where poorer house-holds are more concentrated in lagging regions and a higher percentage of eligible households end up not receiving transfers (that is coverage is worse)
When designing and implementing place-based policies it is important to assign responsibili-ties to the appropriate level of government The choice should be sensitive to intergovernmental fiscal arrangements within a country (for exam-ple a unitary or federal state) and the associated revenue-raising capacity and scope for intergovern-mental transfers As a general principle the central government should take the lead on overall policy design and monitoring given that it can account for possible externalities and spillovers across states and provinces Subnational governments could be more involved in the implementation as they are more attuned to local needs and preferences For exam-ple in federal or highly decentralized countries such as the United States subnational governments have greater autonomy to determine income and property tax rates and spending on education and health care
Conventional means-testedSpatially targeted means-testedImprovement from spatial targeting (as percent ofconventional means-tested transfers right scale)
Figure 241 Effects of Fiscal Redistribution by Conventional versus Spatially Targeted Means-Tested Transfers(Reduction in Gini points unless otherwise noted)
Sources Luxembourg Income Study and IMF staff calculationsNote The figure is based on an illustrative exercise that compares conventional (spatially blind) means-tested transfers with spatially targeted means-testing Conventional means-tested transfers have limited coverage that is some percentage of eligible households do not receive the transfer (see October 2017 Fiscal Monitor) Spatially targeted means-testing can enhance the coverage at the same fiscal cost The fiscal redistribution effect is defined as the difference in nationwide income inequality (Gini coefficient) before and after taxes and transfers and is calculated separately for conventional and spatially targeted means-tested transfers The improvement is calculated as the difference in Gini reduction expressed as a percentage of the fiscal redistribution under conventional means-tested transfers
00
16
04
08
12
France United Kingdom United States0
2
4
6
8
10
Box 24 (continued)
W O R L D E C O N O M I C O U T L O O K G LO b a L M a N U FaC T U R I N G D OW N T U R N R Is I N G T R a D E b a R R I E R s
88 International Monetary Fund | October 2019
ReferencesAbdih Yasser and Stephan Danninger 2017 ldquoWhat Explains
the Decline of the US Labor Share of Income An Analysis of State and Industry Level Datardquo IMF Working Paper 17167 International Monetary Fund Washington DC
Acemoglu Daron and Melissa Dell 2010 ldquoProductivity Differences between and within Countriesrdquo American Economic Journal Macroeconomics 2 (1) 169ndash88
Adler Gustavo Romain Duval Davide Furceri Sinem Kiliccedil Ccedilelik and Marcos Poplawski-Ribeiro 2017 ldquoGone with the Headwinds Global Productivityrdquo IMF Staff Discussion Note 1704 International Monetary Fund Washington DC
Aiyar Shekhar John Bluedorn Romain Duval Davide Furceri Daniel Garcia-Macia Yi Ji Davide Malacrino Haonan Qu Jesse Siminitz and Aleksandra Zdzienicka 2019 ldquoStrength-ening the Euro Area The Role of National Structural Reforms in Enhancing Resiliencerdquo IMF Staff Discussion Note 1905 International Monetary Fund Washington DC
Algan Yann and Pierre Cahuc 2014 ldquoTrust Growth and Well-Being New Evidence and Policy Implicationsrdquo Chapter 2 in Handbook of Economic Growth 2 edited by Philippe Aghion and Steven N Durlauf 49ndash120 North Holland Elsevier
Allen Treb and Costas Arkolakis 2014 ldquoTrade and the Topog-raphy of the Spatial Economyrdquo Quarterly Journal of Economics 129 (3) 1085ndash140
Alvarez Jorge Ivo Krznar and Trevor Tombe 2019 ldquoInter-nal Trade in Canada Case for Liberalizationrdquo IMF Working Paper 19158 International Monetary Fund Washington DC
Asdrubali Pierfederico Bent E Soslashrensen and Oved Yosha 1996 ldquoChannels of Interstate Risk Sharing United States 1963ndash1990rdquo Quarterly Journal of Economics 111 (4) 1081ndash110
Atkinson Tony Joe Hasell Salvatore Morelli and Max Roser 2017 The Chartbook of Economic Inequality Institute for New Economic Thinking Oxford United Kingdom
Austin Benjamin Edward Glaeser and Lawrence H Summers 2018 ldquoJobs for the Heartland Place-Based Policies in 21st Century Americardquo Brooking Papers on Economic Activity Spring 151ndash255
Autor David H and David Dorn 2013 ldquoThe Growth of Low-Skill Service Jobs and the Polarization of the US Labor Marketrdquo American Economic Review 103 (5) 1553ndash597
Autor David H David Dorn and Gordon H Hanson 2013a ldquoThe China Syndrome Local Labor Market Effects of Import Competition in the United Statesrdquo American Economic Review 103 (6) 2121ndash168
mdashmdashmdash 2013b ldquoThe Geography of Trade and Technology Shocks in the United Statesrdquo American Economic Review 103 (3) 220ndash25
mdashmdashmdash 2015 ldquoUntangling Trade and Technology Evidence from Local Labour Marketsrdquo Economic Journal 125 (584) 621ndash46
Bailey David Gill Bentley Alex de Ruyter and Stephen Hall 2014 ldquoPlant Closures and Taskforce Responses An Analysis of the Impact of and Policy Response to MG Rover in Birminghamrdquo Regional Studies Regional Science 1 (1) 60ndash78
Bande Roberto Melchor Fernaacutendez and Victor Montuenga 2008 ldquoRegional Unemployment in Spain Disparities Business Cycle and Wage Settingrdquo Labour Economics 15 (5) 885ndash914
Barca Fabrizio Philip McCann and Andreacutes Rodriacuteguez-Pose 2012 ldquoThe Case for Regional Development Intervention Place-Based versus Place-Neutral Approachesrdquo Journal of Regional Science 52 (1) 134ndash52
Bartik Timothy J 1991 ldquoWho Benefits from State and Local Economic Development Policiesrdquo W E Upjohn Institute for Employment Research Kalamazoo MI
Blanchard Olivier Jean and Lawrence F Katz 1992 ldquoRegional Evolutionsrdquo Brookings Papers on Economic Activity 1 1ndash75
Bloumlchliger Hansjorg David Bartolini and Sibylle Stossberg 2016 ldquoDoes Fiscal Decentralisation Foster Regional Conver-gencerdquo OECD Economic Policy Paper 17 Organisation for Economic Co-operation and Development Paris
Boadway Robin and Anwar Shah eds 2007 Intergovernmental Fiscal Transfers Principles and Practice Public Sector Governance and Accountability Series World Bank Group Washington DC
Boeri Tito Andrea Ichino Enrico Moretti and Johanna Posch 2019 ldquoWage Equalization and Regional Misallocation Evidence from Italian and German Provincesrdquo NBER Working Paper 25612 National Bureau of Economic Research Cambridge MA
Breau Seacutebastien and Richard Saillant 2016 ldquoRegional Income Disparities in Canada Exploring the Geographical Dimensions of an Old Debaterdquo Regional Studies Regional Science 3 (1) 463ndash81
Card David Jochen Kluve and Andrea Weber 2018 ldquoWhat Works A Meta Analysis of Recent Active Labor Market Program Evaluationsrdquo Journal of the European Economic Association 16 (3) 894ndash931
Caselli Francesco 2005 ldquoAccounting for Cross-Country Income Differencesrdquo Chapter 9 in Handbook of Economic Growth 1a edited by Philippe Aghion and Steven N Durlauf Old Holland Elsevier 679ndash741
Chapain Caroline and Alan Murie 2008 ldquoThe Impact of Factory Closure on Local Communities and Economies The Case of the MG Rover Longbridge Closure in Birminghamrdquo Policy Studies 29 (3) 305ndash17
Che Natasha X and Antonio Spilimbergo 2012 ldquoStructural Reforms and Regional Convergencerdquo IMF Working Paper 12106 International Monetary Fund Washington DC
Chetty Raj 2008 ldquoMoral Hazard versus Liquidity and Optimal Unemployment Insurancerdquo Journal of Political Economy 116 (2) 173ndash234
Chetty Raj John N Friedman and Jonah E Rockoff 2014 ldquoMeasuring the Impacts of Teachers II Teacher Value-Added and Student Outcomes in Adulthoodrdquo American Economic Review 104 (9) 2633ndash79
CHAPTER 2 C LO s E R TO G E T H E R O R F U RT H E R a Pa RT W I T H I N - CO U N T Ry R E G I O N a L D I s Pa R I T I E s a N D a DJ U s TM E N T I N a DVa N C E D E CO N O M I E s
89International Monetary Fund | October 2019
Chetty Raj and Nathaniel Hendren 2018a ldquoThe Impacts of Neighborhoods on Intergenerational Mobility I Childhood Exposure Effectsrdquo Quarterly Journal of Economics 133 (3) 1107ndash62
mdashmdashmdash 2018b ldquoThe Impacts of Neighborhoods on Intergenera-tional Mobility II County-Level Estimatesrdquo Quarterly Journal of Economics 133 (3) 1163ndash228
Chetty Raj Nathaniel Hendren and Lawrence F Katz 2016 ldquoThe Effects of Exposure to Better Neighborhoods on Children New Evidence from the Moving to Opportunity Experimentrdquo American Economic Review 106 (4) 855ndash902
Clark Andrew E 2018 ldquoFour Decades of the Economics of Happiness Where Nextrdquo Review of Income and Wealth 64 (2) 245ndash69
Clark Andrew E and Andrew J Oswald 1994 ldquoUnhappiness and Unemploymentrdquo Economic Journal 104 (424) 648ndash59
Coady David and Allan Dizioli 2017 ldquoIncome Inequality and Education Revisited Persistence Endogeneity and Heterogeneityrdquo IMF Working Paper 17126 International Monetary Fund Washington DC
Coady David Margaret Grosh and John Hoddinott 2004 Targeting of Transfers in Developing Countries Review of Lessons and Experience Washington DC World Bank Group
Coe Neil M Philip F Kelly and Henry W C Yeung 2007 Economic Geography A Contemporary Introduction Oxford Blackwell Publishing
Conolly Marie Miles Corak and Catherine Haeck 2019 ldquoIntergenerational Mobility between and within Canada and the United Statesrdquo Journal of Labor Economics 37 (S2) S595ndashS641
Cowell Frank 2011 Measuring Inequality Third edition Oxford Oxford University Press
Coyle Diane 2015 GDP A Brief but Affectionate History Revised and expanded edition Princeton NJ Princeton University Press
Dabla-Norris Era Kalpana Kochhar Nujin Suphaphiphat Frantisek Ricka and Evridiki Tsounta 2015 ldquoCauses and Consequences of Income Inequality A Global Perspectiverdquo IMF Staff Discussion Note 1513 International Monetary Fund Washington DC
Dao Mai Chi Mitali Das Zsoacuteka Koacuteczaacuten and Weicheng Lian 2017 ldquoWhy Is Labor Receiving a Smaller Share of Global Income Theory and Empirical Evidencerdquo IMF Working Paper 17169 International Monetary Fund Washington DC
Dao Mai Davide Furceri and Prakash Loungani 2017 ldquoRegional Labor Market Adjustment in the United States Trend and Cyclerdquo Review of Economics and Statistics 99 (2) 243ndash57
Das Mitali and Benjamin Hilgenstock 2018 ldquoThe Exposure to Routinization Labor Market Implications for Developed and Developing Economiesrdquo IMF Working Paper 18135 International Monetary Fund Washington DC
Dauth Wolfgang Sebastian Findeisen and Jens Suedekum 2014 ldquoThe Rise of the East and the Far East German Labor
Markets and Trade Integrationrdquo Journal of the European Economic Association 12 (6) 1643ndash75
Davis Donald R and David E Weinstein 2002 ldquoBones Bombs and Break Points The Geography of Economic Activityrdquo American Economic Review 92 (5) 1269ndash89
Decressin Joumlrg and Antonio Fataacutes 1995 ldquoRegional Labor Market Dynamics in Europerdquo European Economic Review 39 1627ndash55
Diacuteez Federico Jiayue Fan and Carolina Villegas-Saacutenchez 2018 ldquoGlobal Declining Competitionrdquo IMF Working Paper 1982 International Monetary Fund Washington DC
Donaldson Dave and Richard Hornbeck 2016 ldquoRailroads and American Economic Growth A lsquoMarket Accessrsquo Approachrdquo Quarterly Journal of Economics 131 (2) 799ndash858
Duranton Gilles and Diego Puga 2004 ldquoMicro-Foundations of Urban Agglomeration Economiesrdquo Chapter 48 in Hand-book of Regional and Urban Economics 4 edited by J Vernon Henderson and Jacques-Franccedilois Thisse North Holland Elsevier 2063ndash3073
Duranton Gilles and Anthony J Venables 2018 ldquoPlace-Based Policies for Developmentrdquo NBER Working Paper 24562 National Bureau of Economic Research Cambridge MA
Durlauf Steven N and Ananth Seshadri 2018 ldquoUnderstanding the Great Gatsby Curverdquo Chapter 4 in NBER Macroeconomics Annual 2017 32 edited by Martin Eichenbaum and Jonathan A Parker Cambridge MA National Bureau of Economic Research 333ndash93
Esteban J 2000 ldquoRegional Convergence in Europe and the Industry Mix A Shift-Share Analysisrdquo Regional Science and Urban Economics 30 (3) 353ndash64
Feenstra Robert C Robert Inklaar and Marcel P Timmer 2015 ldquoThe Next Generation of the Penn World Tablerdquo American Economic Review 105 (10) 3150ndash82
Feldstein Martin 2017 ldquoUnderestimating the Real Growth of GDP Personal Income and Productivityrdquo Journal of Economic Perspectives 31 (2) 145ndash64
Felice Emanuele 2011 ldquoRegional Value Added in Italy 1891ndash2001 and the Foundation of a Long-Term Picturerdquo Economic History Review 64 (3) 929ndash50
Feyrer James 2007 ldquoDemographics and Productivityrdquo Review of Economics and Statistics 89 (1) 100ndash09
Fleurbaey Marc 2009 ldquoBeyond GDP The Quest for a Measure of Social Welfarerdquo Journal of Economic Literature 47 (4) 1029ndash75
Fujita Masahisa Paul Krugman and Anthony J Venables 1999 The Spatial Economy Cities Regions and International Trade Cambridge MA MIT Press
Gal Peter 2013 ldquoMeasuring Total Factor Productivity at the Firm Level Using OECD-ORBISrdquo OECD Economics Department Working Paper 1049 Organisation for Economic Co-operation and Development Paris
Gandhi Amit Salvador Navarro and David Rivers 2018 ldquoOn the Identification of Gross Output Production Functionsrdquo University of Western Ontario Centre for Human Capital and Productivity Working Papers London Ontario Canada
W O R L D E C O N O M I C O U T L O O K G LO b a L M a N U FaC T U R I N G D OW N T U R N R Is I N G T R a D E b a R R I E R s
90 International Monetary Fund | October 2019
Gbohoui William W Raphael Lam and Victor Lledo 2019 ldquoThe Great Divide Regional Inequality and Fiscal Policyrdquo IMF Working Paper 1988 International Monetary Fund Washington DC
Gennaioli Nicola Rafael La Porta Florencio Lopez-de-Silanes and Andrei Schleifer 2013 ldquoHuman Capital and Regional Developmentrdquo Quarterly Journal of Economics February 128 (1) 105ndash64
mdashmdashmdash 2014 ldquoGrowth in Regionsrdquo Journal of Economic Growth 19 (3) 259ndash309
Giannone Elisa 2018 ldquoSkill-Biased Technical Change and Regional Convergencerdquo 2017 Meeting Papers 190 Society for Economic Dynamics Stonybrook NY
Giordano Raffaela Sergi Lanau Pietro Tommasino and Petia Topalova 2015 ldquoDoes Public Sector Inefficiency Constrain Firm Productivity Evidence from Italian Provincesrdquo IMF Working Paper 15168 International Monetary Fund Washington DC
Goldsmith-Pinkham Paul Isaac Sorkin and Henry Swift 2019 ldquoBartik Instruments What When Why and Howrdquo NBER Working Paper 24408 National Bureau of Economic Research Cambridge MA
Goldstein Amy 2017 Janesville An American Story New York Simon and Schuster
Gopinath Gita Şebnem Kalemli-Oumlzcan Loukas Karabarbounis and Carolina Villegas-Saacutenchez 2017 ldquoCapital Allocation and Productivity in South Europerdquo Quarterly Journal of Economics 132 (4) 1915ndash967
Graff Zivin Joshua and Matthew Neidell 2014 ldquoTemperature and the Allocation of Time Implications for Climate Changerdquo Journal of Labor Economics 32 (1) 1ndash26
Gruumln Carola Wolfgang Hauser and Thomas Rhein 2010 ldquoIs Any Job Better than No Job Life Satisfaction and Re-employmentrdquo Journal of Labor Research 31 (3) 285ndash306
Guriev Sergei 2018 ldquoEconomic Drivers of Populismrdquo American Economic Review Papers and Proceedings 108 200ndash03
Harris I Philip D Jones Timothy J Osborn and David H Lister 2014 ldquoUpdated High-Resolution Grids of Monthly Climatic Observationsmdashthe CRU TS310 Datasetrdquo Interna-tional Journal of Climatology 34 (3) 623 ndash42 Version 32401
Helpman Elhanan 2016 ldquoGlobalization and Wage Inequalityrdquo NBER Working Paper 22944 National Bureau of Economic Research Cambridge MA
Henderson Roger and John Shutt 2004 ldquoResponding to a Coalfield Closure Old Issues for a New Regional Develop-ment Agencyrdquo Local Economy 19 (1) 25ndash37
Hinde Kevin 1994 ldquoLabor Market Experiences Following Plant Closures Sunderlandrsquos Shipyard Workersrdquo Regional Studies 28 (7) 713ndash24
Hsieh Chang-Tai and Peter J Klenow 2010 ldquoDevelopment Accountingrdquo American Economic Journal Macroeconomics 2 (1) 207ndash23
Hsieh Chang-Tai and Enrico Moretti 2019 ldquoHousing Constraints and Spatial Misallocationrdquo American Economic Journal Macroeconomics 11 (2) 1ndash39
Immervoll Herwig and Linda Richardson 2011 ldquoRedistribution Policy and Inequality Reduction in OECD Countries What Has Changed in Two Decadesrdquo OECD Social Employment and Migration Working Paper 122 Organisation for Economic Co-operation and Development Paris
Intergovernmental Panel on Climate Change (IPCC) 2014 ldquoClimate Change 2014 Impacts Adaptation and Vulnera-bility Part A Global and Sectoral Aspectsrdquo Contribution of Working Group II to the Fifth Assessment Report of the Inter-governmental Panel on Climate Change Cambridge University Press Cambridge United Kingdom and New York
International Monetary Fund (IMF) 2018 ldquoSpain Selected Issuesrdquo IMF Country Report 18331 Washington DC
Jakubik Adam and Victor Stolzenburg 2018 ldquoThe lsquoChina Shockrsquo Revisited Insights from Value Added Trade Flowsrdquo WTO Staff Working Paper ERSD-2018ndash10
Jaumotte Florence Subir Lall and Chris Papageorgiou 2013 ldquoRising Income Inequality Technology or Trade and Financial Globalizationrdquo IMF Economic Review 61 (2) 271ndash309
Jones Charles I and Peter J Klenow 2016 ldquoBeyond GDP Welfare across Countries and Timerdquo American Economic Review 106 (9) 2426ndash57
Jordagrave Ogravescar 2005 ldquoEstimation and Inference of Impulse Responses by Local Projectionsrdquo American Economic Review 95 (1) 161ndash82
Kalemli-Oumlzcan Şebnem Bent Sorensen Carolina Villegas- Saacutenchez Vadym Volosovych and Sevcan Yesiltas 2015 ldquoHow to Construct Nationally Representative Firm Level Data from the ORBIS Global Databaserdquo NBER Working Paper 21558 National Bureau of Economic Research Cambridge MA
Kappeler Andreas Albert Soleacute-Olleacute Andreas Stephan and Timo Vaumllilauml 2013 ldquoDoes Fiscal Decentralization Foster Regional Investment in Productive Infrastructurerdquo European Journal of Political Economy 31 15ndash25
Karabarbounis Loukas and Brent Neiman 2014 ldquoThe Global Decline of the Labor Sharerdquo Quarterly Journal of Economics 129 (1) 61ndash103
Kaufman Martin Phillip Swagel and Steven Dunaway 2003 ldquoRegional Convergence and the Role of Federal Transfers in Canadardquo IMF Working Paper 0397 International Monetary Fund Washington DC
Kim Junghun and Sean Dougherty eds 2018 Fiscal Decentralisation and Inclusive Growth OECD Fiscal Federalism Studies OECD Publishing ParisKIPF Seoul
Kim Sukkoo 2008 ldquoSpatial Inequality and Economic Development Theories Facts and Policiesrdquo Commission on Growth and Development Working Paper 16 World Bank Group Washington DC
Kirkham Janet D and Hugh D Watts 1998 ldquoMulti-Locational Manufacturing Organisations and Plant Closures in Urban Areasrdquo Urban Studies 35 (9) 1559ndash75
CHAPTER 2 C LO s E R TO G E T H E R O R F U RT H E R a Pa RT W I T H I N - CO U N T Ry R E G I O N a L D I s Pa R I T I E s a N D a DJ U s TM E N T I N a DVa N C E D E CO N O M I E s
91International Monetary Fund | October 2019
Klein Goldewijk Kees Arthur Beusen Jonathan Doelman and Elke Stehfest 2017 ldquoAnthropogenic Land-Use Estimates for the Holocene ndash HYDE 32rdquo Earth System Science Data 9 924ndash53
Kline Patrick and Enrico Moretti 2014 ldquoPeople Places and Public Policy Some Simple Welfare Economics of Local Economic Development Programsrdquo Annual Review of Economics 6 (1) 629ndash62
Krugman Paul 1991 ldquoIncreasing Returns and Economic Geographyrdquo Journal of Political Economy 99 (3) 483ndash99
Krugman Paul and Anthony J Venables 1995 ldquoGlobalization and the Inequality of Nationsrdquo Quarterly Journal of Economics 110 (4) 857ndash80
Lessmann Christian 2009 ldquoFiscal Decentralization and Regional Disparity Evidence from Cross-Section and Panel Datardquo Environment and Planning A Economy and Space 41(10) 2455ndash73
Lessmann Christian and Andreacute Seidel 2017 ldquoRegional Inequality Convergence and its Determinants A View from Outer Spacerdquo European Economic Review 92 110ndash32
Lian Weicheng Natalija Novta Evgenia Pugacheva Yannick Timmer and Petia B Topalova 2019 ldquoThe Price of Capital Goods A Driver of Investment under Threatrdquo IMF Working Paper 19134 International Monetary Fund Washington DC
Liu Lucy Qian 2018 ldquoRegional Labor Mobility in Spainrdquo IMF Working Paper 18282 International Monetary Fund Washington DC
Luxembourg Income Study (LIS) Database Multiple years http www lisdatacenter org (multiple countries) Luxembourg
Martin Ron and Bob Rowthorn 1986 The Geography of De-Industrialisation London Macmillan
Moretti Enrico 2011 ldquoLocal Labor Marketsrdquo Chapter 14 in Handbook of Labor Economics 4b edited by David Card and Orley Ashenfelter North Holland Elsevier 1237ndash313
Neumark David and Helen Simpson 2015 ldquoPlace-Based Policiesrdquo Chapter 18 in Handbook of Regional and Urban Economics 5 edited by Gilles Duranton J Vernon Henderson and William C Strange North Holland Elsevier 1197ndash287
Nolan Brian Matteo G Richiardi and Luis Valenzuela 2019 ldquoThe Drivers of Income Inequality in Rich Countriesrdquo Journal of Economic Surveys early view 1ndash40
Novotnyacute Josef 2007 ldquoOn the Measurement of Regional Inequality Does Spatial Dimension of Income Inequality Matterrdquo Annals of Regional Science 41 (3) 563ndash80
Nunn Nathan 2014 ldquoHistorical Developmentrdquo Chapter 7 in Handbook of Economic Growth 2 edited by Philippe Aghion and Steven N Durlauf North Holland Elsevier 347ndash402
Nunn Ryan Jana Parsons and Jay Shambaugh 2018 ldquoThe Geography of Prosperityrdquo In Place-Based Policies for Shared Economic Growth edited by Jay Shambaugh and Ryan Nunn Washington DC Hamilton Project Brookings Institution
Obstfeld Maurice and Giovanni Peri 1998 ldquoRegional Non- Adjustment and Fiscal Policyrdquo Economic Policy 13 (26) 205ndash59
Organisation for Economic Co-operation and Development (OECD) 2013 Understanding National Accounts Second edition Paris OECD Publishing
mdashmdashmdash 2016a Back to Work Denmark Improving the Re-Employment Prospects of Displaced Workers Paris OECD Publishing
mdashmdashmdash 2016b OECD Regional Outlook 2016 Productive Regions for Inclusive Societies Paris OECD Publishing
mdashmdashmdash 2018 OECD Regions and Cities at a Glance 2018 Paris OECD Publishing
Pike Andy Andreacutes Rodriacuteguez-Pose and John Tomaney 2017 Local and Regional Development Second edition New York Routledge
Pinch Steven and Colin Mason 1991 ldquoRedundancy in an Expanding Labour Market A Case-Study of Displaced Workers from Two Manufacturing Plants in Southamptonrdquo Urban Studies 28 (5) 735ndash57
Pissarides Christopher A 2001 ldquoEmployment Protectionrdquo Labour Economics 8 (2) 131ndash59
Rajan Raghuram 2019 The Third Pillar How Markets and the State Leave the Community Behind New York Penguin Press
Rodriacuteguez-Pose Andreacutes 2018 ldquoThe Revenge of the Places that Donrsquot Matter (and What to Do About it)rdquo Cambridge Journal of Regions Economy and Society 11 (1) 189ndash209
Rodriacuteguez-Pose Andreacutes and Tobias Ketterer Forthcoming ldquoInstitutional Change and the Development of Lagging Regions in Europerdquo Regional Studies
Rodriacuteguez-Pose Andreacutes and Michael Storper 2019 ldquoHousing Urban Growth and Inequalities The Limits to Deregulation and Upzoning in Reducing Economic and Spatial Inequalityrdquo CEPR Discussion Paper DP 13713 Center for Economic Policy Research Washington DC
Ryan Brent D and Daniel Campo 2013 ldquoAutopiarsquos End The Decline and Fall of Detroitrsquos Automotive Manufacturing Landscaperdquo Journal of Planning History 12 (2) 95ndash132
Schmieder Johannes F Till von Wachter and Stefan Bender 2016 ldquoThe Effect of Unemployment Benefits and Nonemployment Durations on Wagesrdquo American Economic Review 106 (3) 739ndash77
Shorrocks Anthony 1980 ldquoThe Class of Additively Decomposable Inequality Measuresrdquo Econometrica 48 (3) 613ndash25
Shorrocks Anthony and Guanghua Wan 2005 ldquoSpatial Decomposition of Inequalityrdquo Journal of Economic Geography 5 (1) 59ndash81
Shutt John Roger Henderson and Felix Kumi-Ampofo 2003 ldquoResponding to a Regional Economic Crisis An Impact and Regeneration Assessment of the Selby Coalfield Closure on the Yorkshire and Humber Regionrdquo Paper delivered to the Regional Studies Association International Conference Pisa Italy April 2003
W O R L D E C O N O M I C O U T L O O K G LO b a L M a N U FaC T U R I N G D OW N T U R N R Is I N G T R a D E b a R R I E R s
92 International Monetary Fund | October 2019
Stanford Jim 2017 ldquoWhen an Auto Industry Disappears Australiarsquos Experience and Lessons for Canadardquo Canadian Public Policy 43 (S1) S57ndashS74
Stevenson Betsey and Justin Wolfers 2008 ldquoEconomic Growth and Subjective Well-Being Reassessing the Easterlin Paradoxrdquo Brookings Papers on Economy Activity 2008 (1) 1ndash102
Stiglitz Joseph E Jean-Paul Fitoussi and Martine Durand 2018 Beyond GDP Measuring What Counts for Economic and Social Performance Paris OECD Publishing
Tatsiramos Konstantinos and Jan C van Ours 2014 ldquoLabor Market Effects of Unemployment Insurance Designrdquo Journal of Economic Surveys 28 (2) 284ndash311
Timmer Marcel P Erik Dietzenbacher Bart Los Robert Stehrer and Gaaitzen J de Vries 2015 ldquoAn Illustrated User Guide to the World InputndashOutput Database The Case of Global Automotive Productionrdquo Review of International Economics 23 (3) 575ndash605
Tomaney John Andy Pike and James Cornford 1999 ldquoPlant Closure and the Local Economy The Case of Swan Hunter on Tynesiderdquo Regional Studies 33 (5) 401ndash11
Topalova Petia 2010 ldquoFactor Immobility and Regional Impacts of Trade Liberalization Evidence on Poverty from Indiardquo American Economic Journal Applied Economics 2 (4) 1ndash41
United Nations (UN) 2009 System of National Accounts 2008 New York United Nations
Winkler Hernan 2019 ldquoThe Effect of Income Inequality on Political Polarization Evidence from European Regions 2002ndash2014rdquo Economics and Politics 31 (2) 137ndash62
World Bank (WB) 2009 World Development Report 2009 Reshaping Economic Geography Washington DC
mdashmdashmdash 2018 World Development Report 2018 Learning to Realize Educationrsquos Promise Washington DC
mdashmdashmdash 2019a World Development Report 2019 The Changing Nature of Work Washington DC
mdashmdashmdash 2019b Doing Business Database Washington DC
93International Monetary Fund | October 2019
The pace of structural reforms in emerging market and developing economies was strong during the 1990s but it has slowed since the early 2000s Using a newly constructed database on structural reforms this chapter finds that a reform push in such areas as governance domestic and external finance trade and labor and product markets could deliver sizable output gains in the medium term A major and comprehensive reform package might double the speed of convergence of the average emerging market and developing economy to the living standards of advanced economies raising annual GDP growth by about 1 percentage point for some time At the same time reforms take several years to deliver and some of themmdasheasing job protection reg-ulation and liberalizing domestic financemdashmay entail greater short-term costs when carried out in bad times these are best implemented under favorable economic conditions and early in authoritiesrsquo electoral mandate Reform gains also tend to be larger when governance and access to creditmdashtwo binding constraints on growthmdashare strong and where labor market informality is highermdashbecause reforms help reduce it These findings underscore the importance of carefully tailoring reforms to country circumstances to maximize their benefits
IntroductionEmerging market and developing economies have
enjoyed good growth over the past two decades Living standards have been converging toward those in advanced economies at a fast pace in the aggregate However for many countries the speed of income convergence remains modest The typical (median) emerging market has been closing its (purchasing- power-parity-adjusted) income per capita gap with the
The authors of this chapter are Gabriele Ciminelli Romain Duval (co-lead) Davide Furceri (co-lead) Guzman Gonzalez-Torres Fernandez Joao Jalles Giovanni Melina and Cian Ruane with con-tributions from Zidong An Hites Ahir Jun Ge Yi Ji and Qiaoqiao Zhang and supported by Luisa Calixto Grey Ramos and Ariana Tayebi Funding from the UK Department of International Develop-ment (DFID) is gratefully acknowledged The views expressed in this chapter do not necessarily represent those of DFID
United States by about 13 percent a year since the 2008 financial crisis while the equivalent speed for a typical low-income developing country is 07 percent (Figure 31) At these rates it would take more than 50 years for a typical emerging market economy and 90 years for a typical low-income developing country to close half of their current gaps in living standards Furthermore convergence has been highly heteroge-neous while some countries have been converging fast (mostly Asian economies and during the 2000s some commodity producers) others have stagnated ormdashin the case of almost a quarter of economiesmdasheven diverged For the latter disasters (crises wars disease outbreaks extreme climatic events) played a role in some cases but there is also broader concern about weak underlying trends in income per capita growth
Subdued and uneven growth concerns about policies and growth prospects in advanced economiesmdasha key driver of growth in emerging market and develop-ing economies (April 2017 World Economic Outlook (WEO)) waning chances of a new commodity price boom and shrinking macroeconomicmdashprimarily fiscal policy (April 2019 Fiscal Monitor)mdashspace have revived emerging market and developing economy policymak-ersrsquo interest in structural reforms There is also a sense that reform efforts waned after the liberalization wave that followed the economic crises of the 1990s leaving much scope for improving the functioning of (financial labor product) markets and for improving the quality of other government-influenced drivers of economic growthmdashsuch as education health care and infrastruc-ture In some areas such as for example labor markets automation and globalization put existing regulations that protect jobs rather than workers under pressure further strengthening the case for reform
At the same time broad uncertainty surrounds the potential scope for and gains to be reaped from struc-tural reforms in emerging market and developing econ-omies Individual countriesrsquo experience with reforms have been mixed1 Some prominent reformers over one
1Zettelmeyer (2006) provides an overview of reform experiences in Latin America and a comprehensive discussion of existing explana-tions for why gains may have undershot expectations
REIGNITING GROWTH IN LOW-INCOME AND EMERGING MARKET ECONOMIES WHAT ROLE CAN STRUCTURAL REFORMS PLAY3CH
APTE
R
94
W O R L D E C O N O M I C O U T L O O K G LO b a L M a N U FaC T U R I N G D OW N T U R N R Is I N G T R a D E b a R R I E R s
International Monetary Fund | October 2019
particular decade such as Sri Lanka during 1988ndash97 or Colombia Egypt and Romania during 1998ndash2007 have seen their per capita incomes converge fast toward that of the United States (and other advanced econo-mies) during the subsequent decade (Figure 32) But other major reformers such as Argentina Mexico and the Philippines during 1988ndash97 and Nigeria during 1998ndash2007 failed to converge over the subsequent decade In some cases such as Mexico this could reflect disappointing payoffs from reforms because of pervasive microeconomic distortions that have encouraged informality (Levy 2018) In other cases it may be that reform gains were negated by adverse events such as macroeconomic shocks or misguided policies Examples include the exchange rate overvalu-ation and the collapse of the currency board in the
EMs LIDCs
ndash6
ndash4
ndash2
0
2
4
6
1978ndash87 1988ndash97 1998ndash2007 2008ndash17
The average speed of convergence to living standards in advanced economies has been rather modest among EMDEs
Sources Penn World Tables and IMF staff calculationsNote For each country the speed of convergence for each decade is computed as the ratio between average annual real per capita GDP growth relative to the United States and the percent difference between the US real per capita GDP and that of each country at the beginning of each decade at purchasing power parity The horizontal line inside each box represents the median the upper and lower edges of each box show the top and bottom quartiles respectively and the top and bottom markers denote the maximum and the minimum respectively EMs = emerging markets EMDEs = emerging market and developing economies LIDCs = low-income developing countries
Figure 31 Speed of Income-per-Capita Convergence in Emerging Markets and Low-Income Developing Countries(Percent)
Reform intensity Speed of convergence Median of EMDEs
2 Egypt1 Colombia
1998ndash2007 1998ndash20072008ndash17 2008ndash1700
05
10
15
20
25
30
00
05
10
15
20
4 Sri Lanka3 Romania
5 Argentina
1998ndash2007 1988ndash972008ndash17 1998ndash200700
05
10
15
20
25
30
00051015202530354045
6 Mexico
1988ndash97 1988ndash971998ndash2007 1998ndash200700
05
10
15
20
25
35
30
ndash20
00
20
40
60
7 Nigeria 8 Philippines
1998ndash2007 1988ndash972008ndash17 1998ndash2007ndash20
ndash10
00
10
20
30
40
ndash10
ndash05
00
05
10
15
20
25
Sources Alesina and others (forthcoming) Penn World Tables and IMF staff calculationsNote For each country the speed of convergence for each decade is computed as the ratio between average annual real per capita purchasing power parity GDP growth relative to the United States and the percent difference between the US real per capita GDP and that of each country at the beginning of each decade Reform intensity is computed as the average annual change in each decade (multiplied by 100) of the average reform index The average reform index is computed as the arithmetic average of indicators capturing liberalizations in five areas domestic finance external finance trade product market and labor market The index ranges from 0 to 1 with higher values denoting greater liberalization EMDEs = emerging market and developing economies
Figure 32 Reform Intensity and Speed of Income-per-Capita Convergence in Selected Economies(Percent)
Some top reformers have enjoyed strong subsequent income growth and convergence while others have not
95
C H A P T E R 3 R E I G N I T I N G G R OW T H I N LOW - I N CO M E a N D E M E R G I N G Ma R K E T E CO N O M I E s W H aT R O L E C a N s T R U C T U R a L R E F O R M s P L ay
International Monetary Fund | October 2019
early 2000s in Argentinamdashwhich also led to a reversal of earlier reforms the 2016 recession driven by the decline in global oil prices delayed policy adjustment and oil production disruptions in Nigeria and the hit from the 1997 Asian crisis in the Philippines which then recovered quickly and grew rapidly beginning in the early 2000s Macroeconomic shocks can entail persistent or even permanent income losses (Cerra and Saxena 2008) especially when their impact is amplified by specific macroeconomic and structural vulnerabilities (for example high public debt mostly denominated in foreign currency or an unsustainable exchange rate peg) This underscores the importancemdashand difficultymdashof disentangling the effects of reforms from those of other drivers of economic growth such as macroeconomic shocks and policies
Mixed experience with past reforms could also reflect a given reformrsquos different effects across countries depending on their specific characteristics In particu-lar reforms may pay off only if strong core institutions are in place (Acemoglu Johnson and Robinson 2005) Key among these may be laws and institutions that deliver strong governance for example reducing bor-der or behind-the-border barriers to competition may not lead to much new firm entry innovation and pro-ductivity growth if property rights are not well defined and enforced or incumbent domestic firms continue to benefit from tacit government support More broadly given the many market imperfections in most emerg-ing market and developing economies addressing one may not necessarily help the economy if other market distortions are not remedied (Hausmann Rodrik and Velasco 2005) For example opening up the capital account may trigger fickle and poorly allocated capital inflows if the domestic financial system is insufficiently developed regulated and supervised to mediate these inflows safely and so weakens the benefits from capital flow liberalization Likewise raising female labor sup-ply through support for childcare or stronger legal pro-tections against discrimination may not fully translate into formal employment gains if labor market institu-tions such as stringent job protection legislation for formal workers make firms less willing to hire This points to the need to uncover some of the important factors that may account for cross-country differences in the impact of reforms
A more practical difficulty in assessing the case for structural reforms is the lack of recent comprehensive data and analysis Although information on structural policies is up to date for selected areas (for example
governance or the cost of doing business as assessed in Kaufmann Kraay and Mastruzzi 2010 and WB 2019) and for a broader range of areas for a few larger emerging market economies (for example OECD 2018) compre-hensive cross-country time-series information is lacking Partly reflecting these data limitations there has also been little recent cross-country evidence regarding the growth impact of past reforms with some exceptions including earlier IMF work based on indicators con-structed in the late 2000s (Christiansen Schindler and Tressel 2013 Prati Onorato and Papageorgiou 2013)
To assess the macroeconomic effects of structural reforms this chapter builds on a new IMF reform data set covering regulations for many emerging market economies and low-income developing countries during 1973ndash2014 in five areas (Alesina and others forthcoming) trade (tariffs) domestic finance (credit and interest rate controls entry barriers public ownership quality of supervision in the domestic financial system) external finance (capital account openness encompassing regulations governing international transactions) labor market regulation (stringency of job protection legis-lation) and product market regulation (stringency of regulations and public ownership in two large network industriesmdashnamely electricity and telecommunications) These new data are supplemented by the World Gov-ernance Indicators (Kaufmann Kraay and Mastruzzi 2010)2 The growth impact of regulatory changes in each of the six areas is then explored through empirical analy-sis supplemented by model-based analysis that provides alternative quantification of the impact of reforms and sheds light on the channels through which they affect the economy including the role of informality Specifically the chapter tackles the following questions bull How has structural reform progress evolved over
the past couple of decades Has the pace of reform slowed in emerging market and developing econo-mies in recent years What is the remaining scope for reform and how does it vary across regulatory areas and countries
bull What are the short- to medium-term effects of reforms on economic activity To what extent could such reforms speed up the convergence of emerg-ing market economies and low-income developing countries to living standards in advanced economies
2While the database covers 90 economies around the world the analysis in this chapter excludes those classified as advanced economies at the beginning of the sample as such it covers the 41 current emerging markets seven former emerging markets and 20 low-income developing countries
96
W O R L D E C O N O M I C O U T L O O K G LO b a L M a N U FaC T U R I N G D OW N T U R N R Is I N G T R a D E b a R R I E R s
International Monetary Fund | October 2019
bull What are the channels through which reforms affect the economy For example do reforms affect primarily productivity or employment How do they affect informality which is often associated with poor firm productivity
bull When should reforms be implemented Do they pay off less or more in bad times
bull Do the effects of reforms vary across economies and if so why Are there particular reforms that could magnify the gains from others More broadly should reforms be implemented as packages or should policymakers focus on the most binding constraint(s) to growth and if so which one(s)
In addressing these questions the chapter reaches the following conclusions bull After the major liberalization waves of the late
1980s and the 1990s reform in emerging market and developing economies slowed in the 2000s Although this reflects in part gradual narrowing of the scope for further deregulation there is still ample room for a renewed reform push particularly in low-income developing countriesmdashnotably across sub-Saharan Africa and to a lesser extent in the Middle East and North Africa and Asia and Pacific regions
bull Reforms can yield sizable payoffs in the medium term even though gains vary across different types of regulations For the average emerging market and developing economy empirical analysis sug-gests that major simultaneous reforms across all six areas considered in this chapter could raise output by more than 7 percent over a six-year period This would increase annual GDP growth by more than 1 percentage point and double the average current speed of income-per-capita convergence to advanced economy levels from about 1 percent to more than 2 percent Model-based analysis points to output gains about twice as large in the longer term
bull Reducing informality which helps boost firmsrsquo productivity and capital investment is one import-ant channel through which reforms raise output Given that reforms facilitate formalization they tend to pay off more in countries where informality is higher all else equal to start with
bull However reforms generally take time to deliver It typically takes at least three years for significant pos-itive effects on output to materialize although some reformsmdashsuch as product market deregulationmdashpay off more quickly Possibly reflecting this delay the
political cost of reformmdashin the executive powerrsquos electoral prospectsmdashis lowest when measures are enacted early in the governmentrsquos political mandate
bull The timing of reform mattersmdashsome reforms are best implemented in good times In normal times the reforms studied in this chapter are not found to entail short-term macroeconomic costs However when macroeconomic conditions are weak easing job protection legislation or deregulating domes-tic finance does not pay off and may even lower employment and output in the short term possibly because stimulating labor or credit supply fails to elicit much response when the demand for labor or credit is depressed
bull Getting reform packaging and sequencing right can also make a difference Reforms typically deliver larger gains in countries where governance is stron-ger This means that strengthening governance can support economic growth and income convergence not just directly by incentivizing more productive formal firms to invest and recruit but also indirectly by magnifying the payoff from reforms in other areas Therefore there are advantages to combining trade financial labor and product market reforms with or implementing them after concrete actions to improve governance Such concrete actions include streamlined and transparent public spending and tax administration procedures and stronger pro-tection and enforcement of property and contractual rights for example Reforms that incentivize formal firms to growmdashsuch as lower administrative burdens or easier labor regulationsmdashalso tend to work better when there is better access to credit which makes it possible for firms to expand This underscores the importance of domestic finance liberalization supported by a strong regulatory and supervisory framework More broadly identifying binding constraints on growth and specific reform comple-mentarities is key
Three other important issues that go beyond the scope of this analysis should be borne in mind when considering prioritizing and designing reforms First this chapter considers reforms essentially aimed at improving the functioning of (financial labor product) markets It ignores others that seek instead to directly facilitate the accumulation of productive factorsmdashphysical and human capital and labor Key reforms in this regard involve improving education and health systems public infrastructure spending
97
C H A P T E R 3 R E I G N I T I N G G R OW T H I N LOW - I N CO M E a N D E M E R G I N G Ma R K E T E CO N O M I E s W H aT R O L E C a N s T R U C T U R a L R E F O R M s P L ay
International Monetary Fund | October 2019
frameworks and laws and regulations that obstruct womenrsquos participation in the labor force Second in the long term reforms could entail larger gains than found here by (1) enabling economies to be not just more efficient but also more innovative leading to more persistent effects on economic growth and (2) enhancing the reforming economiesrsquo resilience to and thereby alleviating permanent output losses from economic and financial crises (Aiyar and others 2019) Third policymakers should factor in and implement up-front complementary reforms to mitigate any adverse effects of reforms on income distribution Absent any redistribution through the tax-benefit system some of the reforms considered in this chapter might yield highly uneven gains across the population (Fabrizio and others 2017 Furceri Loungani and Ostry forthcoming) Tackling inequality issues is an important policy objective but it also matters for the ultimate impact of reform on economic growth (Ostry Berg and Kothari 2018) The poor have fewer oppor-tunities for education and less financial access and therefore are less likely to reap the benefits of market reform More fundamentally reforms whose gains are captured only by a small fraction of society risk losing support and stalling or being undone down the road (Alesina and others forthcoming)
The next section examines reform patterns in emerging market and developing economies over the past four decades It also identifies remaining scope for reform and existing differences across geographic regions and countries The subsequent section analyzes the effects of reforms on growth and the channels through which they materialize After that the investi-gation turns to the drivers of differences in the effects of reforms across countries and over time In partic-ular it looks at whether the effects of reforms vary depending on business conditions and explores reform complementarities The final section discusses the main takeaways and policy implications
Structural Policy and Reform Patterns in Emerging Market and Developing Economies
This chapter relies on a new IMF database on economic regulations that identifies structural poli-cies and reforms in trade (tariffs) domestic finance (regulation and supervision) external finance (capital account openness) labor market regulation (job pro-tection legislation) and product market regulation (in electricity and telecommunications two large network
industries) in 90 advanced and emerging market and developing economiesmdashof which 48 are current and former emerging markets and 20 are low-income developing countriesmdashduring 1973ndash2014 (see Online Annex 31 for details about the indicators and coun-try coverage) The database was compiled through a systematic reading and coding of policy actions docu-mented in various sources including national laws and regulations as well as in IMF staff reports (for more details see Alesina and others forthcoming) While the indices capture the stringency of regulations in each area they need not imply that all such regulations are unwarranted indeed whether full deregulation is optimal depends on individual countriesrsquo circum-stances and the availability of alternative policy tools to meet governmentsrsquo policy objectivesmdashas discussed in IMF (2012) regarding capital account liberalization for example These data on market regulations and reforms are complemented by a composite indicator of the quality of governance (political stability govern-ment effectiveness strength of rule of law control of corruption) based on the Worldwide Governance Indicators (WGIs)3 All indices are normalized to vary continuously between 0 and 1 with 0 indicating the most restrictive regulations in a given policy area and 1 indicating the most unrestricted For the governance indicator higher scores denote stronger governance frameworks
These indicators have several limitations First the new IMF data capture de jure regulations As such they may not always fully capture de facto changes in intended outcomesmdasheven though indicator scores in domestic finance external finance and trade correlate rather well with related outcomes such as the share of credit in GDP financial openness and trade openness (see Online Annex 31) Second indicator scores are comparable across time and countries within each indi-vidual policy area but they are not comparable across different policy areas4 Therefore while useful to study broad reform trends the overall reform index con-structed as a simple average of the five IMF indicators should be interpreted with caution Third the WGIs
3The analysis in the chapter uses a composite governance indicator rather than all its individual components because the latter are highly correlated Empirical analysis based on each indicator considered in isolation yields qualitatively similar findings
4For instance if a country has a higher score in the area of domestic finance than in product market regulation it cannot be concluded that the country has a more liberalized financial than product market
98
W O R L D E C O N O M I C O U T L O O K G LO b a L M a N U FaC T U R I N G D OW N T U R N R Is I N G T R a D E b a R R I E R s
International Monetary Fund | October 2019
are perception indices summarizing the views of many businesses citizens and expert survey respondents on the quality of governance in a country the quality of underlying data can vary across countries and data sources5 Therefore individual country rankings based on these indicators should be avoided Fourth the scope of reforms studied in this chapter is limited to the six areas mentioned earlier which relate mainly to the functioning of markets There are however several other important reforms that could facilitate the accu-mulation of capital and labor such as improving edu-cation and health care systems strengthening public infrastructure spending frameworks or changing laws and regulations that obstruct womenrsquos participation in the labor force Finally within each reform area the scope of regulations covered by the corresponding indicator is also limited For example the indicator for product market regulations focuses on two important network industriesmdashthat is electricity and telecom-municationsmdashbut it does not cover other industries or broader administrative burdens on companies Likewise the domestic finance indicator captures regulations in the banking system but does not cover nonbank financial institutions
After the major liberalization waves in the late 1980s andmdashmost importantmdashthe 1990s the pace of structural reform slowed in emerging market and developing economies in the late 2000s especially in low-income developing countries (Figure 33) This was the result of some stabilization of policy in (domestic and external) finance trade and prod-uct markets after the significant deregulation of the previous decades Deregulation included phasing out of credit and interest rate controls in banking sectors liberalization of foreign capital inflows and outflows external tariff reductions including from multilat-eral trade liberalization rounds and reduced entry barriers as well as privatization in network industries (Figure 34) In turn stabilization during the 2000s in part reflects a gradual narrowing of the scope for further reforms but also waning reform efforts nota-bly in the sub-Saharan Africa and Middle East and North Africa regions Labor market regulation differs from other areas it has been far more stable for the average emerging market and developing economy without any noticeable deregulation trend since the
5WGIs do not reflect the official views of the World Bank and are not used by the World Bank Group to allocate resources
1970smdashand roughly in line with the experience in advanced economies (Chapter 3 of the April 2016 WEO) This may be because labor market regulations importantly aim to protect workers from the risk of income lossmdasheven though this may be best pursued by shifting from stringent employment protection legislation which is the dimension considered in this chapter toward unemployment insurance (Duval and Loungani 2019) Finally over the past two decades there has been no noticeable improvement in gover-nance in the average emerging market and developing economy6
6Figure 34 does not report the evolution of the governance indica-tor because the WGIs are not comparable across different time periods given that they are normalized to keep the world average constant over time However based on the underlying data sources there seems to be little evidence of a systematic improvement in governance over time (https info worldbank org governance wgi home)
AEs EMs LIDCs
Regulatory convergence has stalled in the past decade especially in low-income developing economies
Sources Alesina and others forthcoming and IMF staff calculationsNote The average reform index is computed as the arithmetic average of indicators capturing liberalizations in five areas domestic finance external finance trade product market and labor market It excludes the governance indicator due to its lower time coverage The index ranges from 0 to 1 with higher values denoting greater liberalization AEs = advanced economies EMs = emerging markets LIDCs = low-income developing countries
Figure 33 Overall Reform Trends(Scale 0ndash1 higher score indicates greater liberalization)
00
10
01
02
03
04
05
06
07
08
09
1973 80 90 2000 10 14
99
C H A P T E R 3 R E I G N I T I N G G R OW T H I N LOW - I N CO M E a N D E M E R G I N G Ma R K E T E CO N O M I E s W H aT R O L E C a N s T R U C T U R a L R E F O R M s P L ay
International Monetary Fund | October 2019
Reforms have been generally more far-reaching in emerging markets than in low-income developing countries over the past few decades Exceptions include international trademdashwidespread international trade liberalization has led to tariff convergence toward low levels around the worldmdashand labor lawsmdashthere is no evidence of a trend toward labor market deregulation and in fact there has even been tightening in recent years In product markets and in domestic and external finance regulation was strict for both the average emerging market economy and low-income developing country until the 1990s but since then liberalization has sped up particularly in emerging markets These average patterns mask considerable heterogeneity how-ever Among both emerging markets and low-income developing countries some economies have undergone far-reaching liberalization while others have maintained stringent restrictions most strikingly on international capital flows (external finance) For example since the early 1990s emerging market economies that have substantially improved their structural indicator scores include among others Estonia and Latvia (domestic finance) Peru and Romania (external finance) Chile and Colombia (product markets) China and Egypt (labor markets) and South Africa and Uruguay (inter-national trade) Among low-income countries exam-ples of major reformers over the same period include Madagascar and Tanzania (domestic finance) Kenya and Uganda (external finance) Nicaragua and Senegal (product markets) Cameroon and Cocircte drsquoIvoire (labor markets) and Bolivia and Ghana (international trade) A few emerging market economies have achieved significant improvements in governance (Albania and Georgia for example) as have some low-income developing countries (Cameroon and Ethiopia for example)
Broad differences in reform trends have also been observed across and within regions Overall reform efforts have been greater among emerging market and developing economies in Europe and in the Latin America and Caribbean region than across sub-Saharan Africa and to a lesser extent the Middle East and North Africa and Asia and Pacific regions (Figure 35) The European integration process after the collapse of the Soviet Union played a key role for Europe while for Latin American emerging market and developing economies the crises of the 1980s and 1990s were contributing factors Again there have been wide dif-ferences across countries in these reform trends Within
EMs LIDCs
Sources Alesina and others (forthcoming) and IMF staff calculationsNote The horizontal line inside each box represents the median the upper and lower edges of each box show the top and bottom quartiles respectively and the top and bottom markers denote the maximum and the minimum respectively EMs = emerging markets LIDCs = low-income developing countries
00
02
04
06
08
10 1 Domestic Finance
1973ndash75 81ndash85 91ndash95 01ndash05 11ndash1476ndash80 86ndash90 1996ndash2000 06ndash10
00
02
04
06
08
10 2 External Finance
1973ndash75 81ndash85 91ndash95 01ndash05 11ndash1476ndash80 86ndash90 1996ndash2000 06ndash10
00
02
04
06
08
10 3 Trade
1973ndash75 81ndash85 91ndash95 01ndash05 11ndash1476ndash80 86ndash90 1996ndash2000 06ndash10
00
02
04
06
08
10 4 Product Market
1973ndash75 81ndash85 91ndash95 01ndash05 11ndash1476ndash80 86ndash90 1996ndash2000 06ndash10
00
02
04
06
08
10 5 Labor Market
1973ndash75 81ndash85 91ndash95 01ndash05 11ndash1476ndash80 86ndash90 1996ndash2000 06ndash10
Figure 34 Reform Trends by Area(Scale 0ndash1 higher score indicates greater liberalization)
Reform trends have been heterogenous across areas with deregulation mostly taking place in trade finance and product markets
100
W O R L D E C O N O M I C O U T L O O K G LO b a L M a N U FaC T U R I N G D OW N T U R N R Is I N G T R a D E b a R R I E R s
International Monetary Fund | October 2019
each broad geographic region significant reformers across the five market regulation areas over the past decades have included among others China and the Philippines (Asia) Bulgaria and Hungary (Europe) Argentina and Peru (Latin America) Egypt and Jordan (Middle East and North Africa) and South Africa and Uganda (sub-Saharan Africa)
Past reforms have not exhausted the scope for deregulation which remains sizable in most emerging market and developing economies and particularly in low-income developing countries Except for labor market regulationmdashan area in which many advanced economies also could benefit from employment protection legislation reform (Chapter 3 of the April 2016 WEO)mdashemerging market and developing economies retain significantly more restrictive market regulations than advanced economies they also lag on governance (Figure 36) Regarding international
Asia-Pacific Europe MENAP SSA LAC
00
01
02
03
04
05
06
07
08
09
10
1973 80 90 2000 10 14
Reforms have been on average more far-reaching in Europe and the Latin America and the Caribbean region than they have been in the Middle East and North Africa Asia-Pacific and sub-Saharan Africa regions
Sources Alesina and others (forthcoming) and IMF staff calculationsNote Each region includes only EMDEs The average reform index is computed as the arithmetic average of indicators capturing liberalizations in five areas domestic finance external finance trade product market and labor market It excludes the governance indicator due to its lower time coverage EMDEs = emerging market and developing economies LAC = Latin America and the Caribbean MENAP = Middle East North Africa Afghanistan and Pakistan SSA = sub-Saharan Africa
Figure 35 Overall Reform Trends across DifferentGeographical Regions(Scale 0ndash1 higher score indicates greater liberalization)
There remains ample scope for further reforms in most areas across emergingmarket and low-income developing economies
Figure 36 Regulatory Indices by Country Income Groups(Scale 0ndash1 higher score indicates greater liberalization)
Sources Alesina and others (forthcoming) and IMF staff calculationsNote Bars represent the 2014 value of each index (2013 for the governance index) The horizontal line inside each box represents the median the upper and lower edges of each box show the top and bottom quartiles respectively and the top and bottom markers denote the maximum and the minimum respectively AEs = advanced economies EMs = emerging markets LIDCs = low-income developing countries
1 Domestic Finance
4 Product Market
00
02
04
06
08
10
00
02
04
06
08
10
00
02
04
06
08
10
00
02
04
06
08
10
00
02
04
06
08
10
00
02
04
06
08
10
2 External Finance
3 Trade
5 Labor Market 6 Governance
AEs EMs LIDCs AEs EMs LIDCs
AEs EMs LIDCs AEs EMs LIDCs
AEs EMs LIDCs AEs EMs LIDCs
101
C H A P T E R 3 R E I G N I T I N G G R OW T H I N LOW - I N CO M E a N D E M E R G I N G Ma R K E T E CO N O M I E s W H aT R O L E C a N s T R U C T U R a L R E F O R M s P L ay
International Monetary Fund | October 2019
trade over and above cutting remaining tariffs much room exists for reducing nontariff barriers to trade which are not captured by the indicator considered here7 Overall the Middle East and North Africa Asia and the Pacific and to a greater extent sub-Saharan Africa on average have the most room for reforms although there are broad differences across countries within each region (Figure 37)
The Macroeconomic Effects of Reforms in Emerging Market and Developing Economies
This section quantifies the macroeconomic effects of reforms focusing on average effects in the average emerging market and developing economy Three complementary approaches are followed The first is country time-series empirical analysis of the short- to medium-term response of key macroeconomic outcomesmdashprimarily output but also investment and employmentmdashto reforms in each of the six areas con-sidered in the chapter Special care is taken to control for other drivers of output growth that may obscure the actual impact of reforms (omitted variable bias) and to address the impact that expected growth may have on decisions to undertake reform itself (reverse causality)8 Second to provide additional insight into
7Although they can differ in nature nontariff barriers to trade tend to be pervasive in both advanced and emerging market econ-omies and in low-income developing countries (see for example Ederington and Ruta 2016)
8The statistical method follows the approach proposed by Jordagrave (2005) The baseline specifications control for past economic growth and past reforms as well as country and time-fixed effects A possible concern regarding the analysis is that the probability of structural reform is influenced not only by past economic growth and the occurrence of recessions but also by contemporaneous economic developments and expectations of future growth However this is unlikely to be a major issue given long lags associated with the implementation of structural reforms and that information about future growth is likely to be largely embedded in past economic activity Most important controlling for expectations of current and future growth delivers very similar results to and not different with statistical signif-icance from those reported in this chapter Similar results for the medium-term effects are also obtained when controlling for current economic growth Another possible concern regarding the analysis is that the results may suffer from omitted variable bias as reforms may occur across different areas at the same time or because they are undertaken within the context of broader macroeconomic stabilization packages However including all the reforms simultaneously in the estimated equation and controlling for macroeconomic policies aimed at reducing inflation and pub-lic debt does not substantially alter the magnitude and statistical significance of the results See the discussion later in the chapter and in Online Annex 32 for details
Asia-Pacific Europe MENAP SSA LAC
The scope for further reforms is largest in the Middle East and North Africa and sub-Saharan Africa regions although there is also wide cross-country heterogeneity within each geographical region
Figure 37 Regulatory Indices by Geographical Regions(Scale 0ndash1 higher score indicates greater liberalization)
Sources Alesina and others (forthcoming) and IMF staff calculationsNote Each region includes only EMDEs Bars represent the 2014 value of each index (2013 for the governance index) The horizontal line inside each box represents the median the upper and lower edges of each box show the top and bottom quartiles respectively and the top and bottom markers denote the maximum and the minimum respectively LAC = Latin America and the Caribbean MENAP = Middle East North Africa Afghanistan and Pakistan SSA = sub-Saharan Africa
1 Domestic Finance
00
02
04
06
08
10
00
02
04
06
08
10
Euro
pe
MEN
AP SSA
LAC
2 External Finance
Asia
-Pacific
Euro
pe
MEN
AP SSA
LAC
Asia
-Pacific
3 Trade
00
02
04
06
08
10
00
02
04
06
08
10
Euro
pe
MEN
AP SSA
LAC
4 Product Market
Asia
-Pacific
Euro
pe
MEN
AP SSA
LAC
Asia
-Pacific
5 Labor Market
00
02
04
06
08
10
00
02
04
06
08
10
Euro
pe
MEN
AP SSA
LAC
6 Governance
Asia
-Pacific
Euro
pe
MEN
AP SSA
LAC
Asia
-Pacific
102
W O R L D E C O N O M I C O U T L O O K G LO b a L M a N U FaC T U R I N G D OW N T U R N R Is I N G T R a D E b a R R I E R s
International Monetary Fund | October 2019
the channels through which reforms affect economic activity and to deal with some of the limitations of the country time-series approach industry-level empirical analysis is carried out This analysis exploits the fact that reforms benefit some industries more than othersmdashfor example job protection reform that makes it easier for firms to hire and lay off workers is expected to offer more benefit for industries that typically need high job turnover The third approach adopted to analyze the effects of reforms and shed light on transmission channelsmdashthe role of informality in particularmdashis to use a model that captures key regula-tions and other features of a ldquotypicalrdquo emerging market and developing economy
Country-Level Results
Major historical reforms have had sizable average positive effects on output over the medium term ( Figure 38)9 In normal times the reforms studied in this chapter do not appear to entail short-term macro-economic costs However with some exceptions such as product market deregulation which pays off rather quickly it takes some timemdashtypically at least three yearsmdashfor reform gains to become economically and statistically significant In addition wide confidence bands around point estimates are indicative of signif-icant cross-country differences in the effects of past reforms Some important aspects of this heterogeneity are explored in the next section
The quantitative effects vary across historical major reforms10
bull For domestic finance (Figure 38 panel 1) a major liberalization eventmdashfor example a reform of the size that took place in Egypt in 1992mdashleads to a statistically significant increase in output of about 2 percent on average six years after reform implementation11 Estimates suggest that domestic finance liberalization also increases investment and employment although to a smaller extent The weak impact on investment is
9Major historical reforms correspond to those associated with a change in the relevant indicator above two standard deviations of the distribution (of annual changes in the relevant indicator across the whole sample)
10As stressed earlier the magnitudes of historical reforms are not comparable across different policy areas
11The reform in Egypt involved easing bank entry restrictions and improving banking supervision and regulation
consistent with existing literature that fails to find an unambiguous positive relationship between domestic finance reforms and the quantity of savings and investment (for example Bandiera and others 2000) In contrast the main channel at play seems to be that of an improvement in the
ndash1
0
1
2
3
0 1 2 3 4 5 6ndash1
0
1
2
ndash1 0 1 2 3 4 5 6
ndash1
ndash1
ndash1
0
1
2
3
ndash10 1 2 3 4 5 6
0
2
4
6
0 1 2 3 4 5 6ndash1
0
1
2
ndash1 0 1 2 3 4 5 6
ndash2
0
2
4
6
ndash1 0 1 2 3 4 5 6
1 Domestic Finance
4 Product Market3 Trade
2 External Finance
6 Governance5 Labor Market(Effect on employment)
Empirical estimates point to sizable average effects of reforms that materialize only gradually
Figure 38 Average Effects of Reforms(Percent effect on output unless noted otherwise)
Source IMF staff calculationsNote x-axes in years t = 0 is the year of the shock The lines denote the response to a major historical reform (two standard deviations) The shaded areas denote 90 percent confidence bands
103
C H A P T E R 3 R E I G N I T I N G G R OW T H I N LOW - I N CO M E a N D E M E R G I N G Ma R K E T E CO N O M I E s W H aT R O L E C a N s T R U C T U R a L R E F O R M s P L ay
International Monetary Fund | October 2019
allocative efficiency of financial markets (see for example Abiad Oomes and Ueda 2008)12
bull For external finance (Figure 38 panel 2) a major liberalizationmdashof the type carried out by Romania in 2003 for examplemdashis found to lead to a statistically significant increase in the output level of more than 1 percent six years after the reform13 Estimates also suggest that one of the channels underpinning this increase is higher investment In contrast external finance reforms do not have a large or statistically significant effect on employment (see for example Furceri Loungani and Ostry forthcoming) This implies that the positive output impact of liberaliza-tion largely reflects increases in labor productivity14
bull For international trade (Figure 38 panel 3) a large tariff cutmdashfor example similar to that in Kenya in 1994mdashis estimated to increase output by an average of about 1 percent six years later Labor productivity which rises by about 14 percent after six years is the key transmission channel in line with extensive literature on the productivity gains from trade lib-eralization (for example Ahn and others 2019 and references therein) These aggregate effects on real activity bolster the traditional view against protec-tionism (Furceri and others 2018)
bull In product markets (Figure 38 panel 4) major deregulationmdashsuch as for example the adoption of the Law on Regulators of Public Utilities in Latvia in 2001mdashleads to a statistically significant increase in output of about 1 percent three years after the reform This is a remarkable effect considering that the analysis is restricted to deregulation in only two key network industries namely electricity and telecommunications The gains from broader reforms across a wider range of protected industries would therefore be expected to be larger Further estimates suggest that product market deregulation increases employment and investment as well as productivity in the medium term
12Furthermore the increase in output is larger than the increase in employment which implies an increase in labor productivity At a six-year horizon the productivity increase amounts to 14 percent and the effect is statistically significant
13The reform in Romania included the liberalization of capital movements related to the performance of insurance contracts and other capital flows with significant influence on the real economy such as lifting restrictions concerning the access of nonresidents to bank deposits
14This is in line with recent cross-country studies finding that financial openness affects growth primarily through higher produc-tivity (Bonfiglioli 2008 Bekaert and others 2011)
bull In labor markets (Figure 38 panel 5) a major easing of job protection legislationmdashalong the lines of the labor code revisions in Kazakhstan in 2000 which facilitated dismissal procedures and lowered severance paymdashis found to increase employment by almost 1 percent on average in the medium term Also investment is positively impacted possibly reflecting higher (marginal) returns on capital as employment rises and profitability increases However the short- to medium-term output and productivity effects of job protection deregulation are not found to be statistically significant at conventional levels (Duval and Furceri 2018 has a similar finding for advanced economies)
bull As regards governance (Figure 38 panel 6) an improvement of a magnitude similar to that achieved by Ghana when it adopted its anti-corruption laws in 2006 for example increases output by about 2 percent after six years15 The main transmission channel is investment (IMF 2018) although the reform also has a (smaller) positive and statistically significant effect on employ-ment and labor productivity
Summarizing the results of the empirical analysis suggest that a very ambitious and comprehensive reform agenda involving simultaneous major reforms across all six areas consideredmdashthat is summing up the effects of each individual reform and abstracting from possible complementarities between them which are explored in the next sectionmdashmight raise output in the average emerging market and developing economy by more than 7 percent over a six-year period16 This would raise annual GDP growth more than 1 percentage point and double the current speed of income-per-capita conver-gence to advanced economy levels from about 1 percent to more than 2 percent An even larger increase in annual GDP growth exceeding 125 and 2 percentage points in the average emerging market economy and low-income developing country respectively would be possible under an even more ambitious scenario in
15The index is computed as the arithmetic average of six WGIs (see Online Annex 31 for details)
16Summing up the effects of each individual reform implicitly assumes that reforms do not entail major complementaritymdashwhich would imply a larger gain from a package than from the sum of each individual reform undertaken in isolationmdashor substitutability As discussed in detail in the next section while not all reforms are complementary some of them are As a result the potential gain from a comprehensive reform package may be even larger than reported here
104
W O R L D E C O N O M I C O U T L O O K G LO b a L M a N U FaC T U R I N G D OW N T U R N R Is I N G T R a D E b a R R I E R s
International Monetary Fund | October 2019
which all emerging market and developing economies align their policies in each area with those of the cur-rently most liberalized emerging market economies
Sector-Level Results
As a robustness check for the economy-wide results and to shed further light on transmission channels country-industry-level analysis explores how reforms affect within-country differences in the response of output between industries17 For domestic and external finance the empirical approach follows the method-ology proposed by Rajan and Zingales (1998) which assesses the long-term effect of financial depth on industry growth according to differences in external finance dependence across industries18 For labor market reforms the approach follows Duval Furceri and Jalles (2019) which examines the effect of job protection deregulation on industry-level employment in advanced economies depending on differences in ldquonaturalrdquo layoff rates across industriesmdashthat is the nat-ural propensity of firms in a given industry to adjust their workforce to idiosyncratic shocks19
The industry-level analysis confirms the findings of the aggregate country-level analysis for domes-tic and external finance reforms The difference in medium-term output effects of major domestic finance liberalization between industries with high and low dependence on external finance (at the 75th and
17The analysis focuses on the manufacturing sector and explores the differential effects of reforms across different industries using an unbalanced panel of 19 manufacturing industries at the 2-digit level in 66 emerging market and developing economies from 1973 to 2014 Like the country-level analysis the industry-level analysis also relies on the local projection method but reforms are identified at the industry level by interacting the (country-level) reform variable with relevant industry-specific characteristics that capture each industryrsquos exposure to reform The main advantage of this approach is that it is less prone to endogeneity concerns and thereby to enhance the causal interpretation of the chapterrsquos findings (see Online Annex 32 for technical details)
18Following Rajan and Zingales (1998) the degree of dependence on external finance in each industry is measured as the median across all US firms in each industry of the ratio of total capital expendi-tures minus current cash flows to total capital expenditures
19The measure of ldquonaturalrdquo industry-specific layoff rates is the ratio of the number of workers dismissed for business reasons to total employment in the United States following the methodology proposed by Micco and Pageacutes (2006) and Bassanini Nunziata and Venn (2009) Data on laid-off workers and employed individuals come from the US Current Population Survey covering 2003ndash07 Because of the quasi absence of employment protection legisla-tion the United States provides the closest empirical example of a frictionless labor market and as a result its industries can be seen as exhibiting ldquonaturalrdquo layoff rates
25th percentiles of the cross-industry distribution of external financial dependence) is estimated to be about 6 percentage points (Figure 39 panel 1) Compara-ble results are obtained for external finance reforms ( Figure 39 panel 2)mdasheven though the magnitude and the precision of the point estimates decline in the medium term For labor market reforms the analysis does not find a statistically significant difference on average in the impact of deregulation between indus-tries with high turnover and low turnover However as discussed in the next section this insignificant effect masks considerable heterogeneity depending on whether the reform was undertaken in good or bad times
ndash5
0
5
10
15
ndash1 0 1 2 3 4 5
ndash5
0
5
10
15
ndash1 0 1 2 3 4 5
1 Domestic Finance
2 External Finance
Financial reforms have stronger effects in industries with greater dependence on external sources of financing
Figure 39 Industry-Level Effect of Domestic and External Finance Reforms on Output(Percent)
Source IMF staff calculationsNote x-axes in years t = 0 is the year of the shock The shock represents a major historical reform (two standard deviations) the lines denote the differential impact in percent between the sector at the 75th percentile of the degree of dependence on external finance versus the sector at the 25th percentile the shaded areas denote 90 percent confidence bands External finance dependence in each industry is measured as the median across all US firms in each industry of the ratio of total capital expenditures minus the current cash flow to total capital expenditure
105
C H A P T E R 3 R E I G N I T I N G G R OW T H I N LOW - I N CO M E a N D E M E R G I N G Ma R K E T E CO N O M I E s W H aT R O L E C a N s T R U C T U R a L R E F O R M s P L ay
International Monetary Fund | October 2019
Model-Based Results
The empirical estimates are complemented by use of a structural general equilibrium model that brings three key benefits for assessments of reform impacts20 First it allows for quantification of reform gains over a longer horizon than considered in the empirical analysismdashthe medium to long term once the effects of reforms on the economy fully play out Second while the effects of historical reforms may have varied depending on the quality of their implementation and other prevailing circumstances that might not be fully controlled for in the empirical setup model-based analysis is by design free of such limitations Third it sheds light on the transmission channels of reforms This is because the model captures several key features of many emerging market and developing economiesmdashtheir large informal sectors (La Porta and Shleifer 2008 2014) financial constraints on firm growth (Midrigan and Xu 2014) large sunk costs of registering in the formal sector (Djankov and others 2002) employment protection laws that raise formal sector labor costs (Alesina and others forthcoming) and weak governance that acts as a tax on the output of formal sector firms (Mauro 1995 IMF 2018)21 Another important model feature is that the formal sector is both more capital intensive and more productive than the informal sector and only firms in the formal sector have access to external finance (La Porta and Shleifer 2008 2014)
The model-based analysis points to three key chan-nels through which reforms can increase output they facilitate entry from the informal sector to the formal sector incentivize formal firms to invest and grow and can reduce misallocation of resources between formal firms22 In particular product market and
20The model is an extension of Midrigan and Xu (2014) Online Annex 33 provides a technical description of the model
21It is important to note that data limitations mean that the costs of governance are simply modeled as a fraction of formal sector out-put that is lost (potentially due to corruption and weak rule of law) The model therefore abstracts from many other channels through which governance can affect GDP including through informal firms (see Online Annex 33 for further discussion)
22The model is calibrated to account for the distortions created by regulations studied in the empirical analysis such as productivity differentials between sectors and financial market distortions based on the observed values of key variables such as the private sector debt-to-GDP ratio and the share of employment in the informal sec-tor across a large set of emerging market and developing economies between 2013 and 2018 The size of reforms considered in the analy-sis is designed to be as comparable as possible to the size of reforms presented in the empirical analysis The results are qualitatively robust to and quantitatively stable across alternative calibrations (see Online Annex 33 for further details)
financial market reforms make it easier for infor-mal firms to enter the formal sectormdashthe former by reducing entry costs and the latter by enabling firms to finance such costs Formalization in turn leads to capital deepening higher aggregate productivity and increased output23 Improving governance or easing job protection legislation increases the profitability of formal sector firms directly this encourages them to grow increasing investment and reallocating resources from the less productive informal sector Domestic finance reforms have qualitatively similar effects given that they relax credit constraints on formal sec-tor firms and so enable them to grow rapidly to their optimal size24
The reforms are found to yield largermdashtwice as large on averagemdashoutput gains in the long term than those estimated in the empirical analysis for the medium term (Figure 310)25 Two key factors help explain the higher long-term gains predicted by the model First firm formalization and capital accumulation typically take place over a longer horizon than is considered in the empirical analysis Second the model represents an ideal reform scenario while average empirical estimates also reflect cases of imperfect reform implementation These effects are those for an average emerging market and developing economy given that the model is calibrated to match a large set of average microeco-nomic and macroeconomic characteristics across a large sample of emerging market and developing economies
23The productivity gain from doing business in the formal sector is consistent with the large gap in value added per worker between informal and formal firms reported in La Porta and Shleifer (2008 2014) Drivers of this gap may include among others better access to intermediate inputs (Amiti and Konings 2007) access to export markets (De Loecker 2007) and higher-skilled workers (Ulyssea 2018) Aggregate capital deepening follows from the formal sectorrsquos greater access to credit markets and capital intensity Martin Nataraj and Harrison (2017) finds that product market deregulation in India between 2000 and 2007 led to increases in district-level capital as well as in output and employment
24By contrast resource misallocation across formal firms does not constitute an important source of output gains from these reforms in the model compared with the gains from formalization and increased investment This is partly because restricted access to credit is the only regulation that affects different formal firms differentlymdashand therefore the only one that generates misallocationmdashin this version of the model (see Online Annex 33 for details)
25Reforms simulated with the model are designed to be com-parable in magnitude to those considered in the empirical section (see Online Annex 33 for details) These are large reforms in prac-tice for example the size of the domestic finance reform considered in Figure 310 would enable Mexican firms to increase their leverage raising the corporate sector debt-to-GDP ratio to the level observed in Poland
106
W O R L D E C O N O M I C O U T L O O K G LO b a L M a N U FaC T U R I N G D OW N T U R N R Is I N G T R a D E b a R R I E R s
International Monetary Fund | October 2019
Accounting for Differences across CountriesWhile past reforms have delivered sizable average gains
wide confidence intervals around these estimated impacts point to substantial differences across countries So do the mixed experiences of past reformers even within given regions For example reforms in Latin American economies during the 1980s and 1990s were followed by growth spurts in some cases (such as Chile) but not
in others (such as Argentina or Mexico) Likewise while most reforming countries in central and eastern Europe converged fast to advanced economiesrsquo living standards after the collapse of the Soviet Union in the early 1990s most reforming economies of the Commonwealth of Independent States did not
This section investigates some of the drivers of that heterogeneity by asking the following question Which country characteristics tend to be associated with larger gains from reforms In doing so it highlights the influence of business conditions at the time of reform andmdashfocusing more on longer-term effectsmdashthe importance of informality and interactions across reform areas26
Role of Business Conditions
Prevailing business conditions may affect an econ-omyrsquos short- to medium-term response to reforms in certain areas For example liberalizing credit supply may not elicit much credit and output growth when demand for credit is weak as would be the case in a depressed economy Likewise easing job protection legislation in a recession may not induce firms to recruit but instead incentivize them to lay off work-ers so further reducing aggregate employment and output in the short term (Cacciatore and others 2016) The role of business conditions is explored empirically using state-dependent regressions in which the state of the economy at the time of reform is captured by a smooth-transition function of the GDP growth rate (Auerbach and Gorodnichenko 2012) or alternatively by a dummy variable for crisis27
Although the effects of most reforms do not appear to differ significantly whether passed in good or bad times domestic finance liberalization appears to pay off far more when implemented in an expansionary
26Another open question is whether reform priorities should differ according to the level of development including between emerging market economies and low-income developing countries While there is generally a strong case for tailoring reform priorities along these lines no evidence could be found that the effects of reforms considered in this chapter vary systematically depending on the level of income per capita or across country income groups Likewise a comprehensive analysis of interactions across reforms performed by conditioning the impact of reform in one area on the regulatory stance in other areas did not provide systematic evidence of comple-mentarity (or substitutability) between reforms One exception is the importance of strong governance for other reformsrsquo payoffs which is discussed below
27For technical details see Online Annex 32
Model-based analysis generally predicts larger output gains in the long term than those found in the empirical analysis for the medium term
Figure 310 Output Gains from Major Historical ReformsModel-Based versus Empirical Estimates(Percent of GDP)
Source IMF staff calculationsNote Bars represent the percent increase in aggregate output from a reduction in the corresponding friction at the benchmark calibration The size of the reforms is designed to be in line with a major reform in the reform indices (∆Reform ∆Targeted Moment = (2σ∆Reform Index σReform Index ) middot σTargeted Moment ) For example in the case of domestic finance reform the parameter representing the financial friction is changed such that the credit-to-GDP ratio shifts across the distribution (of the credit-to-GDP ratios across countries) the same way the domestic finance regulation indicator does across the distribution (of this indicator across countries) after a major reform in the empirical analysis1ldquoGovernancerdquo is modeled as a reduction in an implicit tax on formal firmsrsquo revenue While conventional this modeling choice ignores other potential gains from strengthening governance such as lower costs of doing business in the informal sector lower operational uncertainty and reduced misallocation across firms in the formal sectormdashto the extent that these might suffer to different degrees from poor governance
0
2
4
6
Model Empirics0
1
2
3
Model Empirics
0
2
4
6
Model Empirics0
2
4
6
8
Model Empirics
1 Domestic Finance 2 Labor Market
3 Product Market 4 Governance1
107
C H A P T E R 3 R E I G N I T I N G G R OW T H I N LOW - I N CO M E a N D E M E R G I N G Ma R K E T E CO N O M I E s W H aT R O L E C a N s T R U C T U R a L R E F O R M s P L ay
International Monetary Fund | October 2019
phase of the business cycle (Figure 311 panels 1 and 2) Under very strong business conditions the estimated impact of reform on output is found to be three times larger than it would be in normal times consistent with a stronger response of credit demand to credit supply deregulation during an economic boom By contrast point estimates suggest that financial liberalization can be contractionary if passed when economic conditions are weak although this negative effect is not statistically distinguishable from zero One interpretation of this result is that increasing compe-tition in the financial sector at a time of weak credit demand may push certain financial intermediaries out of business further weakening the economy
Likewise job protection deregulation appears to deliver short-term gains in good times but not in bad times (Figure 311 panels 3 and 4) This is in line with previous IMF evidence for advanced economies (Duval and Furceri 2018 Duval Furceri and Jalles 2019) and reflects the fact that when it is easier to hire and fire workers firms tend to increase primarily hires when they face strong demand for their goods and servicesmdashwhile they tend to increase primarily layoffs when facing weak demand Job protection deregulation when implemented during strong economic conditions is estimated to raise employment three times as much as when enacted in normal times If undertaken during a financial crisis it may even be contractionary although the estimated negative effect is not statisti-cally distinguishable from zero Industry-level results are consistent with these country-level estimates (Figure 311 panels 5 and 6) When the labor mar-ket is liberalized in good times employment rises significantly in industries with high natural layoff ratesmdashthat is those where stringent job protection legislation is likely to be more bindingmdashrelative to those with low layoff rates The reverse holds when the reform is implemented during bad times employment in industries with high layoff rates falls more than in industries with low layoff rates These results suggest that accompanying macroeconomic policies that boost aggregate demand could magnify the effects of certain structural reforms28
28For example further analysis not reported here suggests that labor market reforms are more effective at raising output when implemented together with expansionary fiscal policy This is in line with previous IMF analysis for advanced economies (Chapter 3 of the April 2016 WEO Duval Furceri and Jalles 2019)
ndash1
ndash1
ndash1
Some reforms do not pay off when undertaken in bad times
Figure 311 Effects of Reforms The Role of Macroeconomic Conditions(Percent)
Source IMF staff calculationsNote x-axes in years t = 0 is the year of the shock Red lines denote the percent response to a major historical reform (two standard deviations) Shaded areas denote 90 percent confidence bands Blue lines represent the unconditional result
1 Weak EconomicConditions
2 Strong EconomicConditions
5 Weak EconomicConditions
6 Strong EconomicConditions
3 Crisis 4 No Crisis
0 1 2 3 4 50 1 2 3 4 5
ndash1 0 1 2 3 4 5ndash20
ndash15
ndash10
ndash5
0
5
ndash1 0 1 2 3 4 5
0
1
2
3
ndash1 0 1 2 3 4 5
0
2
4
6
8
10
12
14
ndash2
ndash5
ndash4
ndash3
ndash2
ndash1
0
1
2
0 1 2 3 4 5
ndash2
0
2
4
6
8
10
ndash5
ndash4
ndash3
ndash2
ndash1
0
1
2
3
Effect of Domestic Finance Reforms on Output
Effect of Labor Market Reforms on Employment
Effect of Labor Market Reforms on Sectoral Employment
108
W O R L D E C O N O M I C O U T L O O K G LO b a L M a N U FaC T U R I N G D OW N T U R N R Is I N G T R a D E b a R R I E R s
International Monetary Fund | October 2019
Role of Informality
The role of individual country characteristics for the impact of reform is investigated using both empirical and model-based analyses On the empirical side the chapter uses a flexible approach to explore sources of parameter heterogeneity across units (countries) the Bayesian hierarchical empirical model along the lines of Boz Gopinath and Plagborg-Moslashller (2017) This method makes it possible to estimate flexibly the country-specific impact of each reform conditional on observed individual country characteristics such as the weight of the informal sector in the economy (see Online Annex 32 for technical details)29 On the model side the impact of a given reform is simulated under alternative sets of regulations and characteris-tics such as under low versus high barriers to entry in the formal sectormdashthat is under high versus low informality30
Among the many possible country characteristics that could shape the impact of reforms informality appears particularly important Empirical find-ings suggest that in most areas (domestic finance product and labor market regulations governance) reforms have larger effects when informality is high ( Figure 312 panels 1ndash4) At a five-year horizon the gain from reform is typically twice as large in a country with a high degree of informality (at the 75th percentile of the cross-country distribution of informality rates) as in a country with low infor-mality (at the 25th percentile of the distribution) Model-based analysis also points to larger reform gains in an economy with a higher initial level of informality (such as India) than in one with lower informality (such as South Africa or Panama) as shown in Figure 313
Reforms tend to pay off more when informality is higher because one of the effects of reforms is precisely
29The main advantage of this approach over the more conven-tional use of multiplicative interactions is that it does not impose any functional form on the interaction between the country characteristic of interest (for example the level of informality) and the reform coefficient but instead uses a nonparametric specification for the distribution of the coefficient conditional on the country characteristic
30In the model the size of the informal sector is determined by all the structural features of the economy including regulations Here the lower-informality economy is one in which entry costs into the formal sector are lower than in the baseline casemdashthey are set equal to the 25th percentile of the cross-country distribution of entry costs The higher-informality economy is the baseline economy
to reduce informality which in turn benefits the econ-omy This channel is generally more powerful when informality is high to start with For example cut-ting barriers to entry in the formal sector or explicit (labor) and implicit (corruption) taxes on formal firms induces some informal firms to become formal In turn formalization boosts output by increasing productivity and capital accumulation for example becoming formal can help firms invest by enhancing their access to credit and improve their productivity by giving them access to better intermediate inputs or export markets Empirical analysis confirms that this formalization channel is important Applying the local projection method to study the impact on informal-ity of a change in the average regulation indicator (across the areas studied in this chapter) suggests
Gains from past reforms have been larger in economies with higher informality
Figure 312 Effects of Reforms on Output The Role of Informality(Percent)
Source IMF staff calculationsNote Bars denote the five-year-ahead output response to a major historical reform (two standard deviations) Low (high) informality refers to a level of informality equal to the 25th (75th) percentile of the distribution of the informality index
00
05
10
15
0
1
2
3
4
Lowinformality
Medianinformality
Highinformality
Lowinformality
Medianinformality
Highinformality
Lowinformality
Medianinformality
Highinformality
Lowinformality
Medianinformality
Highinformality
1 Domestic Finance 2 Product Market
3 Labor Market 4 Governance
0
2
1
3
4
5
00
05
10
15
20
109
C H A P T E R 3 R E I G N I T I N G G R OW T H I N LOW - I N CO M E a N D E M E R G I N G Ma R K E T E CO N O M I E s W H aT R O L E C a N s T R U C T U R a L R E F O R M s P L ay
International Monetary Fund | October 2019
that a major broad-based reform is associated with a statistically significant decrease in informality of about 1 percentage point at a five-year horizon (Figure 314) This is consistent with evidence reported in microeco-nomic studies31
31See McCaig and Pavcnik (2018) for the effects of liberalizations in Vietnam Martin Nataraj and Harrison (2017) for the same in India and Paz (2014) for the same in Brazil Benhassine and others (2018) provides experimental evidence on the impact of formalization reforms in Benin Kaplan Piedra and Seira (2011) and Bruhn (2011) study
Reform Complementarities
Reforms do not always entail complementarity (or substitutability) in the sense that a package combining multiple reforms does not necessarily yield a larger (or smaller) gain than the sum of the effects of each reform taken in isolation This is confirmed by rather inconclusive empirical analysis (using the Bayesian pro-cedure mentioned earlier) of whether countries reaped larger gains from a given reform when they had already deregulated other areas in general reforms are not found to have widely different effects across different countries with different regulations Model analysis confirms that reforms need not always be complemen-tary and it also explains why For example as reforms
the impact of deregulation on firmsrsquo market entry in Mexico How-ever Mexicorsquos experience highlights the variation in the response of informality across reform areas and its dependence on reform design Despite major macroeconomic reforms during the 1990s informality has since risen considerably (Levy 2018) coinciding with slow pro-ductivity growth Levy (2008) argues that this increase in informality resulted from the introduction of new policies (such as changes in the relative benefits provided by contributory and noncontributory social insurance programs among others) in the early 2000s that disincentiv-ized firms and workers to formalize
Model simulations imply that economies with larger informal sectors benefit somewhat more from reforms
Figure 313 Model-Implied Gains from Reforms The Role of Informality(Percent)
0
1
2
3
4
5
0
2
4
6
0
2
4
6
8
Lowerinformality
Higherinformality
Lowerinformality
Lowerinformality
Higherinformality
Higherinformality
Lowerinformality
Higherinformality
00
05
10
15
20
25
1 Domestic Finance 2 Labor Market
3 Product Market 4 Governance1
Source IMF staff calculationsNote Bars represent the percent increase in aggregate output from a reduction in the corresponding friction at either the lower informality or higher informality benchmark calibration The higher informality calibration is the benchmark calibration for the median economy The lower informality calibration is constructed by reducing the entry regulation friction to its 25th percentile in the data The size of the reforms is designed to be in line with a two-standard-deviation change in the reform indices1ldquoGovernancerdquo is modeled as a reduction in an implicit tax on formal firmsrsquo revenue While conventional this modeling choice ignores other potential gains from strengthening governance such as lower costs of doing business in the informal sector lower operational uncertainty and reduced misallocation across firms in the formal sectormdashto the extent that these might suffer to different degrees from poor governance
A major reform across the areas covered in the empirical analysis is associated with a subsequent reduction in informality
Figure 314 Effect of Reforms on Informality(Percent)
Source IMF staff calculationsNote x-axis in years t = 0 is the year of the shock The lines denote the response of the informality indicator to an average reform of size two standard deviations The shaded areas denote 90 percent confidence bands
ndash25
ndash20
ndash15
ndash10
ndash05
00
ndash1 0 1 2 3 4 5
110
W O R L D E C O N O M I C O U T L O O K G LO b a L M a N U FaC T U R I N G D OW N T U R N R Is I N G T R a D E b a R R I E R s
International Monetary Fund | October 2019
are implemented informality falls reducing the scope for further declines in informality and thereby damp-ening potential gains from other reforms
However policymakers can exploit specific reform complementarities notably by prioritizing improve-ments in governance This may in part help explain the success in income convergence of some eastern Euro-pean countries such as Estonia Latvia and Romania that joined the European Union and have carried out major reforms alongside improvements in governance since the 1990s Bearing in mind the limitations of governance indicators mentioned above the empirical
analysis indicates that the impact of past reforms was most often larger in countries where the quality of gov-ernance was higher while reforms yielded considerably smaller gains where governance was weaker (Figure 315 panel 4) The quality of governance matters particularly for the impact of product market deregulation such reforms failed to pay off where governance was poor but delivered larger gains where governance was strong This is consistent with the view that reduced entry barriers in product markets foster new firm entry and push incum-bent firms to be more efficient and innovative only if all firms are treated equally which is easier to achieve when the rule of law is strong and property rights are strictly enforced By the same token strong governance can magnify the gains from other pro-competition reforms in finance or international trade
Complementarities also exist between reforms that incentivize firms to grow and reforms that enable them to do so Key among the growth-enabling reforms is domes-tic finance liberalization which by improving access to credit can magnify the gains from reforms in other areas As an illustration model-based analysis highlights the complementarity between reforms that liberalize labor markets and financial markets simultaneouslymdashas for example Bolivia did in 198532 Labor market reform improves the profitability of the formal sector inducing formal firms to expand and informal ones to formalize Given that entrepreneurs need to finance their entry into the formal sector and their capital investment improv-ing access to credit through liberalization of domestic financemdashalongside strengthened financial sector super-vision33mdashamplifies the investment and output effects of labor market reform (Figure 316)34
Summary and Policy ImplicationsKey findings of this chapter make a strong case for
a renewed structural reform push in emerging market and developing economies for two main reasons First even after the major liberalization wave of the 1990s much scope generally remains for further reforms in
32In 1985 Bolivia removed directed credit by the government and liberalized interest rate controls In addition Supreme Decrees 7072 9190 and 17610 were repealed reestablishing the right of employers to dismiss workers according to previously existing provisions
33While not captured by the model used here sound supervision is key to alleviating risks of a buildup in financial sector vulner-abilities following domestic finance liberalization (Johnston and Sundararajan 1999)
34See Online Annex 33 for further technical details
Stronger governance magnifies the impact of reforms
Figure 315 Effects of Reforms on Output The Role of Governance(Percent)
00
05
10
15
0
1
2
3
0
1
2
3
4
Wea
kgo
vern
ance
Med
ian
gove
rnan
ce
Stro
nggo
vern
ance
Wea
kgo
vern
ance
Med
ian
gove
rnan
ce
Stro
nggo
vern
ance
Wea
kgo
vern
ance
Med
ian
gove
rnan
ce
Stro
nggo
vern
ance
Wea
kgo
vern
ance
Med
ian
gove
rnan
ce
Stro
nggo
vern
ance
0
1
2
3
4
1 Domestic Finance 2 External Finance
3 Trade 4 Product Market
Sources IMF reform data set and IMF staff calculationsNote Bars denote the five-year-ahead output response to a major historical reform (two standard deviations) Weak (strong) governance refers to a level of governance equal to the 25th (75th) percentile of the distribution of the governance index
111
C H A P T E R 3 R E I G N I T I N G G R OW T H I N LOW - I N CO M E a N D E M E R G I N G Ma R K E T E CO N O M I E s W H aT R O L E C a N s T R U C T U R a L R E F O R M s P L ay
International Monetary Fund | October 2019
the areas covered in this chapter domestic and external finance international trade labor and product market regulations and governance This holds true particu-larly for low-income developing countriesmdashnotably across sub-Saharan Africa and to a lesser extent in the Middle East and North Africa and Asia and Pacific regions Second the reforms studied in this chapter are not found to entail short-term macroeconomic costsmdashexcept for some of them when implemented in bad timesmdashand they can yield sizable output and employ-ment gains in the medium to long term for a typical emerging market and developing economy major simultaneous reforms across the areas listed above could raise annual economic growth by about 1 percentage point over five to 10 years doubling the current speed of income-per-capita convergence to advanced econ-omy levels over the next decade In countries where informality is comparatively high reform gains could be even larger all else equal In addition these esti-mates do not factor in further potential gains from other growth-oriented policies not covered in this chapter such as improving education and health care
systems public infrastructure spending frameworks and laws and regulations that impede womenrsquos labor force participation
At the same time reform in one area has different effects across economies depending on their exist-ing regulations in other areas and prevailing business conditions at the time of reform This suggests that getting reform packaging sequencing and prioritizing right is key to maximizing payoffs Concrete actions to improve governance and facilitate access to credit by firms are often an important step to remove bind-ing constraints on growth and amplify reform gains In countries where economic conditions are weak priority should also be given to reformsmdashsuch as cutting barriers to international trade or firm entry in domestic nonmanufacturing industriesmdashwhose gains do not depend on prevailing economic conditions Reforms such as easing job protection legislation and deregulating the domestic financial sector that do not pay off in bad times would be best enacted with a credible provision that they will take effect later when economic conditions are stronger If it is not possi-ble to delay when they take effect (for labor market reforms) reforms can be grandfatheredmdashthat is new rules would apply only to new beneficiariesmdashalthough this comes at the cost of delaying the full gains from reform In addition job protection deregulation should be accompanied by some strengthening of social safety nets (Duval and Loungani 2019) In countries with credible medium-term fiscal frameworks and available fiscal space countercyclical fiscal policy could also alleviate short-term costs of reforms
Reform strategies should also internalize political economy considerations Even if reforms deliver a net gain for society as a whole they often produce hard-to-perceive gains that are spread broadly across the population while losses are more visible and concen-trated on small but sometimes powerful population groups (Olson 1971) Experience with past reforms highlights the need for careful design and prioritiza-tion ownership good communication and transpar-ency to ensure broad-based support
There are also three more specific lessons from the past First given that reforms take time to deliver government should act swiftly following an electoral victory to implement them during their political ldquohoneymoonrdquo period This strategy will mitigate potential political costs (Box 31) Second reforms are best implemented when economic conditions are
Packaging labor market reform with domestic finance deregulation entails complementarities and amplifies aggregate output gains
Figure 316 Gain from Packaging Domestic Finance and Labor Market Reforms(Additional percent gain from packaging reforms)
Source IMF staff calculationsNote Bars represent the difference between the impact from a package combining both reforms and the sum of the impacts from each reform in isolation in percent
0
2
4
6
8
10
12
14
Output Investment
112
W O R L D E C O N O M I C O U T L O O K G LO b a L M a N U FaC T U R I N G D OW N T U R N R Is I N G T R a D E b a R R I E R s
International Monetary Fund | October 2019
W O R L D E C O N O M I C O U T L O O K G LO b a L M a N U FaC T U R I N G D OW N T U R N R Is I N G T R a D E b a R R I E R s
favorablemdashthat is governments should ldquofix the roof while the sun is shiningrdquo In bad times because voters are often unable to disentangle the effect of reform from that of poor economic conditions reforms tend to be electorally costly During recessions macro-economic policy supportmdashwhere feasiblemdashmay reduce the political costs of reform Third policy-makers should factor in and implement up-front
complementary reforms to mitigate any adverse effects of reforms on income distribution Strong social safety nets and active labor market programs that help workers move across jobs can help in this regard given that reforms often lead simultaneously to new job creation and destruction Reforms whose gains are captured only by a small fraction of society risk losing support and could stall or be undone down the road
113
C H A P T E R 3 R E I G N I T I N G G R OW T H I N LOW - I N CO M E a N D E M E R G I N G Ma R K E T E CO N O M I E s W H aT R O L E C a N s T R U C T U R a L R E F O R M s P L ay
International Monetary Fund | October 2019
While the evidence presented in this chapter speaks strongly in favor of the economic benefits of struc-tural reforms their political benefits are much less clear which has long been perceived as an obstacle to reform One problem is that even if reforms deliver a net gain for society as whole they often produce hard-to-perceive gains spread broadly across the population and more visible losses that are concentrated on small but sometimes powerful population groups (Olson 1971) For example cutting barriers to entry in a network industrymdashsuch as electricity or telecommuni-cations both of which are considered in this chaptermdashtypically yields diffuse gains to consumers in the form of lower prices or better products while incumbent firms and workers may lose much from the entry of new competitors and reduced profits In these circum-stances politicians may hold back on reforms for fear they will be penalized at the ballot box by vocal losers from reform
This box examines empirically whether fears of a political cost of reform are supported by historical experience Specifically it asks whether structural reforms lead to electoral losses or gains and whether the timing of reform in the electoral cycle and the state of the economy matter for subsequent electoral outcomes
To examine these issues the analysis maps a new data set on electoral outcomes with the new reform data set presented in the chapter and estimates the effect of reforms on the change in the vote share of the incumbent party or coalition in the following elec-tion1 This dependent variable is especially useful in assessing the magnitude of electoral penalties or gains from reforms A leader of the executive might remain in office but with a much-reduced majority or might be forced into a coalition government
The key independent variable used in the analysis is the unweighted average of all the reform indices2
This box was prepared by Davide Furceri and largely draws from Ciminelli and others (forthcoming) and Alesina and others (forthcoming)
1The electoral database in this study covers an unbalanced sample of democratic elections from 1973 (or the first year in which the country is characterized as a democratic regime) to 2014 for 66 advanced and developing economies
2See Alesina and others (forthcoming) for additional details including estimates for each individual reform indicator sepa-rately The baseline specification includes the following set of con-trol variables (1) average GDP growth during the electoral term (2) a developed country dummy (taking value 1 for continuous
The results of the analysis suggest that reforms entail electoral costs only when implemented in the year before an election in this case a major broad-based reform (defined in the rest of the chapter as a major change across all regulatory areas simultaneously) is associated with a decrease in the vote share of the coalition of about 3 percentage points This effect is economically significant and is roughly equivalent to a 17 percentage point reduction in the likelihood of the incumbent leader of the coalition being reelected (Figure 311) In contrast reforms earlier in an incumbentrsquos term do not appear to affect election pros-pects These results are suggestive of myopic behavior of the electorate and are also consistent with empirical evidence in this chapter that the economic gains from reforms take time to materialize
These average results mask considerable differences across reformers depending on whether measures were implemented in good or bad times (Figure 312) Reforms are not found to entail political costs when undertaken under strong economic conditions but they tend to be politically costly when enacted in peri-ods of weak economic activity possibly because they lead to larger distributional costs (Alesina and others forthcoming) and voters fail to disentangle the effects of reform from those of poor economic conditions Because reforms have been predominantly undertaken under weak economic conditions (Box 32) their average impact on the vote share is also estimated to be negative (Figure 312)
These results hint at two ways reform strategies can helpfully internalize political-economy consider-ations and maximize chances of political success First because reforms take time to deliver governments should act swiftly following an electoral victory to implement reforms during their political ldquohoneymoonrdquo period Second reforms are best implemented when economies are performing well
Organisation for Economic Co-operation and Development membership since 1963 and 0 otherwise) (3) a dummy variable for new democracies (taking value 1 for the first four elections after a year in which the country considered gets a negative Polity score on the ndash10 to 10 scale and 0 otherwise) (4) a dummy variable for a majoritarian political system (taking value 1 for countries with an electoral system that awards seats in winner-takes-all fashion in geographically based districts according to the Database of Political Institutions and 0 otherwise) (5) the initial average level of regulation across the areas considered and (6) the level of the vote share in the previous election See Online Annex 33 for further details on the empirical methodology
Box 31 The Political Effects of Structural Reforms
114
W O R L D E C O N O M I C O U T L O O K G LO b a L M a N U FaC T U R I N G D OW N T U R N R Is I N G T R a D E b a R R I E R s
International Monetary Fund | October 2019
1 Vote Share
ndash20
ndash15
ndash10
ndash5
0
5
ndash35
ndash30
ndash25
ndash20
ndash15
ndash10
ndash05
00
05
Year of election Rest of term
Year of election Rest of term
2 Probability of Reelection
Figure 311 The Effect of Reform onElectoral Outcomes(Percentage points)
Source IMF staff calculationsNote The bars denote the effect of a major reform eventmdashdefined as a change in the broad regulation indicator of two standard deviations (of the sample distribution of annual changes in the regulation indicator)mdashon electoral outcomes and denote statistical significance at the 5 percent and 1 percent confidence levels respectively
ndash7
ndash6
ndash5
ndash4
ndash3
ndash2
ndash1
0
1
2
Average Weakeconomicconditions
Strongeconomicconditions
Source IMF staff calculationsNote The bars denote the effect of a major reform eventmdashdefined as a change in the broad regulation indicator of two standard deviations (of the sample distribution of annual changes in the regulation indicator)mdashon electoral outcomes denotes statistical significance at the 1 percent confidence level
Figure 312 The Effect of Reform on Vote Share The Role of Economic Conditions(Percentage points)
Box 31 (continued)Box 31 (continued)
115
C H A P T E R 3 R E I G N I T I N G G R OW T H I N LOW - I N CO M E a N D E M E R G I N G Ma R K E T E CO N O M I E s W H aT R O L E C a N s T R U C T U R a L R E F O R M s P L ay
International Monetary Fund | October 2019
A broad range of political and economic factors can explain why and when reforms (do not) happen one of these which is particularly significant is the presence of a crisis Political factors may include government ideology the type of political system (presidential versus parliamentary) the degree of political fragmentation and the strength of democratic institutions (Ciminelli and others forthcoming and references therein) Economic factors may include prevailing business conditions in particular Crises can act as turning points and catalyze popular support for reform by increasing the cost of and the support of incumbent workers and firms (ldquoinsidersrdquo) for maintaining the status quo At the same time crises may lead to increased parliamentary fragmentation which could weaken reform efforts (Mian Sufi and Trebbi 2014)
The relationship between crisis and reform may depend on whether the crisis is economic or finan-cial and it may also differ across regulatory areas A collapse in domestic demand may lower opposition to trade liberalization from industries that usually rely on domestic demand (Lora and Olivera 2005) Similarly periods of high unemployment may increase pressure on governments to enact reforms that ease labor mar-ket regulation in the hope of boosting employment (Duval Furceri and Miethe 2018) By contrast a financial crisis after a period of deregulation could lead governments to reregulate the financial sector and the economy (Mian Sufi and Trebbi 2014 Gokmen and others 2017)
This box examines empirically the role of crises in fostering reforms using a vector autoregression (VAR) framework This approach has two main advantages over a static framework First it allows investigation of the possibility that crises lead to reforms with long lags an issue neglected in the empirical literature Second it makes it possible to account for feedback effects between changes in regulation in different areas The set of structural reforms considered in the analysis is the same as in the rest of the chapter As for
This box was prepared by Gabriele Ciminelli and draws largely from Ciminelli and others (forthcoming)
crises both economic recessions (defined as periods of negative real GDP growth) and systemic banking crises (defined in Laeven and Valencia 2008 2012) are investigated
Two VARs (one for eachmdasheconomic or financialmdashtype of crisis) are estimated according to the fol-lowing model
X it = A 0 + sum l=1 4 A l X itminusl + τ t + γ i + ε it (321)
in which the subscripts i and t refer to country and time X it is a seven-variable vector containing the crisis dummy considered and the six structural reform indicators (in first differences) A 0 is a vector of constant terms A l is the vector of parameters to be estimated τ t and γ i refer respectively to time- and country-fixed effects and ε it is the error term Four lags of the dependent variables are included The responses of reforms to crises are obtained using a Cholesky decomposition with the crisis dummy ordered first the implicit assumption is that the occur-rence of a crisis in year t does not depend on reforms implemented in the same year1
The results suggest that economic and banking crises have different effects on structural reforms ( Figure 321) Economic recessions foster trade liberalization and to a lesser extent labor market and financial deregulation over the medium term These results are supportive of the ldquocrisis-induces-reformrdquo hypothesis and consistent with the findings of Lora and Olivera (2004) and Duval Furceri and Miethe (2018) They suggest that governments respond to weaker external demand and higher unemployment by opening up to trade and liberalizing the labor market to foster employment By contrast banking crises are found to foster tighter regulation in the domestic finance and capital account areas These effects are rather large and can be interpreted as an attempt by governments to control or mitigate perceived sources of financial instability
1The ordering of the (reform) variables ldquobelowrdquo the crisis dummy does not alter the results (for a formal derivation see Christiano Eichenbaum and Evans 1999)
Box 32 The Impact of Crises on Structural Reforms
116
W O R L D E C O N O M I C O U T L O O K G LO b a L M a N U FaC T U R I N G D OW N T U R N R Is I N G T R a D E b a R R I E R s
International Monetary Fund | October 2019
Two years Four years Six years
1 Banking Crisis
Trad
e
Capi
tal
acco
untndash005
ndash004
ndash003
ndash002
ndash001
000
001
002
003
ndash005
ndash004
ndash003
ndash002
ndash001
000
001
002
003
Dom
estic
finance
Prod
uct
mar
ket
Labo
rm
arke
t
Gove
rnan
ce
2 Recession
Trad
e
Capi
tal
acco
unt
Dom
estic
finance
Prod
uct
mar
ket
Labo
rm
arke
t
Gove
rnan
ce
Source IMF staff calculationsNote The figure reports the effects of banking crises (panel 1) and economic recessions (panel 2) on structural reforms over two- four- and six-year horizons Each indicator ranges from 0 to 1 Bars with denote statistical significance at least at 10 percent Bars without denote statistically insignificant results Standard errors are computed via Monte Carlo simulations with 1000 repetitions
Figure 321 The Effect of Crises on Structural Reforms(Reform indicator units)
Box 32 (continued)
117
C H A P T E R 3 R E I G N I T I N G G R OW T H I N LOW - I N CO M E a N D E M E R G I N G Ma R K E T E CO N O M I E s W H aT R O L E C a N s T R U C T U R a L R E F O R M s P L ay
International Monetary Fund | October 2019
ReferencesAbiad Abdul Enrica Detragiache and Thierry Tressel 2010 ldquoA
New Database of Financial Reformsrdquo IMF Working Paper 08266 International Monetary Fund Washington DC
Abiad Abdul Nienke Oomes and Kenichi Ueda 2008 ldquoThe Quality Effect Does Financial Liberalization Improve the Allocation of Capitalrdquo Journal of Development Economics 87 (2) 270ndash82
Acemoglu Daron Simon Johnson and James Robinson 2005 ldquoInstitutions as a Fundamental Cause of Long-Run Growthrdquo In Handbook of Economic Growth 1A edited by Philippe Aghion and Steven Durlauf Amsterdam Elsevier
Ahn Jaebin Era Dabla-Norris Romain Duval Bingjie Hu and Lamin Njie 2019 ldquoReassessing the Productivity Gains from Trade Liberalizationrdquo Review of International Economics 27 (1) 130ndash54
Aiyar Shekhar John Bluedorn Romain Duval Davide Furceri Daniel Garcia-Macia Yi Ji Davide Malacrino Haonan Qu Jesse Siminitz and Aleksandra Zdzienicka 2019 ldquoStrength-ening the Euro Area The Role of National Reforms in Enhancing Resiliencerdquo IMF Staff Discussion Note 1905 International Monetary Fund Washington DC
Alesina Alberto Davide Furceri Jonathan Ostry Chris Papageorgiou and Dennis Quinn Forthcoming ldquoStruc-tural Reforms and Electoral Outcomes Evidence from a New Database of Regulatory Stances and Policy Changesrdquo IMF Working Paper International Monetary Fund Washington DC
Amiti Mary and Jozef Konings 2007 ldquoTrade Liberalization Intermediate Inputs and Productivityrdquo American Economic Review 97 (5) 1611ndash38
Atkeson Andrew and Patrick J Kehoe 2007 ldquoModeling the Transition to a New Economy Lessons from Two Technologi-cal Revolutionsrdquo American Economic Review 97 (1) 64ndash88
Auerbach Alan and Youri Gorodnichenko 2012 ldquoMeasuring the Output Responses to Fiscal Policyrdquo American Economic Journal Economic Policy 4 (2) 1ndash27
Bandiera Oriana Gerard Caprio Patrick Honohan and Fabio Schiantarelli 2000 ldquoDoes Financial Reform Raise or Reduce Savingrdquo Review of Economics and Statistics 82 (2) 239ndash63
Bassanini Andrea Luca Nunziata and Danielle Venn 2009 ldquoJob Protection Legislation and Productivity Growth in OECD Countriesrdquo Economic Policy 24 (58) 349ndash402
Basu Susanto and John G Fernald 1997 ldquoReturns to Scale in US Production Estimates and Implicationsrdquo Journal of Political Economy 105 (2) 249ndash83
Bekaert Geert Campbell Harvey Christian Lundblad and Stephan Siegel 2011 ldquoWhat Segments Equity Mar-ketsrdquo Review of Financial Studies 24 (12) 3841ndash90
Benhassine Najy David McKenzie Victor Pouliquen and Massimiliano Santini 2018 ldquoDoes Inducing Informal Firms to Formalize Make Sense Experimental Evidence from Beninrdquo Journal of Public Economics 157 1ndash14
Bonfiglioli Alessandra 2008 ldquoFinancial Integration Produc-tivity and Capital Accumulationrdquo Journal of International Economics 76 (2) 337ndash55
Botero Juan C Simeon Djankov Rafael La Porta Florencio Lopez-de-Silanes and Andrei Shleifer 2004 ldquoThe Regulation of Laborrdquo Quarterly Journal of Economics 119 (4) 1339ndash82
Boz Emine Gita Gopinath and Mikkel Plagborg-Moslashller 2017 ldquoGlobal Trade and the Dollarrdquo IMF Working Paper 17239 International Monetary Fund Washington DC
Bruhn Miriam 2011 ldquoLicense to Sell The Effect of Business Registration Reform on Entrepreneurial Activity in Mexicordquo Review of Economics and Statistics 93 (1) 382ndash86
Buera Francisco J and Yongseok Shin 2017 ldquoProduc-tivity Growth and Capital Flows The Dynamics of Reformsrdquo American Economic Journal Macroeconomics 9 (3) 147ndash85
Cacciatore Matteo Romain Duval Giuseppe Fiori and Fabio Ghironi 2016 ldquoMarket Reforms in the Time of Imbalancerdquo Journal of Economic Dynamics and Control 72 69ndash93
Cerra Valerie and Sweta Saxena 2008 ldquoGrowth Dynamics The Myth of Economic Recoveryrdquo American Economic Review 102 (7) 3774ndash77
Christiano Lawrence J Martin Eichenbaum and Charles L Evans 1999 ldquoMonetary Policy Shocks What Have We Learned and to What Endrdquo In Handbook of Macroeconomics 1 (1) edited by John B Taylor and Michael Woodford 65ndash148 Amsterdam Elsevier
Christiansen Lone Martin Schindler and Thierry Tressel 2013 ldquoGrowth and Structural Reforms A New Assessmentrdquo Journal of International Economics 89 (2) 347ndash56
Ciminelli Gabriele Davide Furceri Jun Ge Jonathan D Ostry and Chris Papageorgiou Forthcoming ldquoThe Political Costs of Reforms Fear or Realityrdquo IMF Staff Discussion Note International Monetary Fund Washington DC
De Loecker Jan 2007 ldquoDo Exports Generate Higher Productivity Evidence from Sloveniardquo Journal of International Economics 73 (1) 69ndash98
Djankov Simeon Rafael La Porta Florencio Lopez-de-Silanes and Andrei Shleifer 2002 ldquoThe Regulation of Entryrdquo Quarterly Journal of Economics 117 (1) 1ndash37
Duval Romain and Davide Furceri 2018 ldquoThe Effects of Labor and Product Market Reforms The Role of Macro-economic Conditions and Policiesrdquo IMF Economic Review 66 (1) 31ndash69
Duval Romain Davide Furceri and Joao Jalles 2019 ldquoJob Protection Deregulation in Good and Bad Timesrdquo Oxford Economic Papers (July 21)
Duval Romain Davide Furceri and Jakob Miethe 2018 ldquoThe Needle in the Haystack What Drives Labor and Product Market Reforms in Advanced Countriesrdquo IMF Working Paper 18101 International Monetary Fund Washington DC
Duval Romain and Prakash Loungani 2019 ldquo Designing Labor Market Institutions in Emerging Market and Developing
118
W O R L D E C O N O M I C O U T L O O K G LO b a L M a N U FaC T U R I N G D OW N T U R N R Is I N G T R a D E b a R R I E R s
International Monetary Fund | October 2019
Economies Evidence and Policy Optionsrdquo IMF Staff Discussion Note 1904 International Monetary Fund Washington DC
Ebell Monique and Christian Haefke 2009 ldquoProduct Market Deregulation and the US Employment Miraclerdquo Review of Economic Dynamics 12 (3) 479ndash504
Ederington Josh and Michele Ruta 2016 ldquoNon-Tariff Measures and the World Trading Systemrdquo World Bank Policy Research Paper 7661 World Bank Washington DC
Fabrizio Stefania Davide Furceri Rodrigo Garcia-Verdu Bin G Li Sandra V Lizarazo Ruiz Marina Mendes Tavares Futoshi Narita and Adrian Peralta-Alva 2017 ldquoMacro-Structural Policies and Income Inequality in Low-Income Developing Countriesrdquo IMF Staff Discussion Note 1701 International Monetary Fund Washington DC
Furceri Davide Swarnali Hannan Jonathan Ostry and Andrew Rose 2018 ldquoMacroeconomic Consequences of Tariffsrdquo NBER Working Paper 25402 National Bureau of Economic Research Cambridge MA
Furceri Davide Prakash Loungani and Jonanthan Ostry Forthcoming ldquoThe Aggregate and Distributional Effects of Financial Globalization Evidence from Macro and Sectoral Datardquo Journal of Money Credit and Banking
Gokmen Gunes Massimiliano G Onorato Tommaso Nannicini and Chris Papageorgiou 2017 ldquoPolicies in Hard Times Assessing the Impact of Financial Crises on Structural Reformsrdquo IGIER Working Paper 605 Innocenzo Gasparini Institute for Economic Research Bocconi University Milan
Granger Clive and Timo Teraumlsvirta 1993 Modelling Nonlinear Economic Relationships New York Oxford University Press
Hausmann Ricardo Dani Rodrik and Andres Velasco 2005 ldquoGrowth Diagnosticsrdquo John F Kennedy School of Government Harvard University Cambridge MA
Hsieh Chang-Tai and Peter J Klenow 2009 ldquoMisallocation and Manufacturing TFP in China and Indiardquo Quarterly Journal of Economics 124 (4) 1403ndash48
International Monetary Fund (IMF) 2012 ldquoThe Liberalization of Management of Capital Flows An Institutional Viewrdquo IMF Policy Paper Washington DC
mdashmdashmdash 2018 ldquoReview of 1997 Guidance Note on GovernancemdashA Proposed Framework for Enhanced Fund Engagementrdquo IMF Policy Paper 18142 Washington DC
Johnston R Barry and V Sundararajan 1999 Sequencing Financial Sector Reforms Washington DC International Monetary Fund
Jordagrave Ogravescar 2005 ldquoEstimation and Inference of Impulse Responses by Local Projectionsrdquo American Economic Review 95 (1) 161ndash82
Kaplan David S Eduardo Piedra and Enrique Seira 2011 ldquoEntry Regulation and Business Start-Ups Evidence from Mexicordquo Journal of Public Economics 95 (11ndash12) 1501ndash15
Kaufmann Daniel Aart Kraay and Massimo Mastruzzi 2010 ldquoThe Worldwide Governance Indicators Methodology and Analytical Issuesrdquo World Bank Policy Research Working Paper 5430 World Bank Washington DC
Laeven Luc and Fabian Valencia 2008 ldquoSystemic Banking Crises A New Databaserdquo IMF Working Paper 08224 Inter-national Monetary Fund Washington DC
mdashmdashmdash 2012 ldquoSystemic Banking Crises An Updaterdquo IMF Working Paper 12163 International Monetary Fund Washington DC
La Porta Rafael and Andrei Shleifer 2008 ldquoThe Unofficial Economy and Economic Developmentrdquo NBER Work-ing Paper 1452 National Bureau of Economic Research Cambridge MA
mdashmdashmdash 2014 ldquoInformality and Developmentrdquo Journal of Economic Perspectives 28 (3) 109ndash26
Levy Santiago 2008 Good Intentions Bad Outcomes Washing-ton DC Brookings Institution
mdashmdashmdash 2018 Unrewarded Efforts The Elusive Quest for Prosperity in Mexico Washington DC Inter-American Development Bank
Lora Eduardo and Mauricio Olivera 2004 ldquoWhat Makes Reforms Likely Political Economy Determinants of Reforms in Latin Americardquo Journal of Applied Economics 7 (1) 99ndash135
mdashmdashmdash 2005 ldquoThe Electoral Consequences of the Washington Consensusrdquo Economiacutea 5 (2) 1ndash61
Martin Leslie A Shanthi Nataraj and Ann E Harrison 2017 ldquoIn with the Big Out with the Small Removing Small-Scale Reservations in Indiardquo American Economic Review 107 (2) 354ndash86
Mauro Paulo 1995 ldquoCorruption and Growthrdquo Quarterly Journal of Economics 110 (3) 681ndash712
McCaig Brian and Nina Pavcnik 2018 ldquoExport Markets and Labor Allocation in a Low-Income Countryrdquo American Economic Review 108 (7) 1899ndash941
Mian Atif Amir Sufi and Francesco Trebbi 2014 ldquoResolving Debt Overhang Political Constraints in the Aftermath of Financial Crisesrdquo American Economic Journal Macroeconomics 6 (2) 1ndash28
Micco Alejandro and Carmen Pageacutes 2006 ldquoThe Economic Effects of Employment Protection Evidence from Interna-tional Industry-Level Datardquo IZA Discussion Paper 2433 Institute of Labor Economics Bonn
Midrigan Virgiliu and Daniel Yi Xu 2014 ldquoFinance and Misallocation Evidence from Plant-Level Datardquo American Economic Review 104 (2) 422ndash58
Olson Mancur 1971 The Logic of Collective Action Public Goods and the Theory of Groups Cambridge MA Harvard University Press
Organisation for Economic Co-operation and Develop-ment (OECD) 2018 Economic Policy Reforms Going for Growth Paris
Ostry Jonathan Andrew Berg and Siddharth Kothari 2018 ldquoGrowth Equity Trade-Offs in Structural Reformsrdquo IMF Working Paper 185 International Monetary Fund Washington DC
Ostry Jonathan David Alessandro Prati and Antonio Spilim-bergo 2009 ldquoStructural Reforms and Economic Performance
119
C H A P T E R 3 R E I G N I T I N G G R OW T H I N LOW - I N CO M E a N D E M E R G I N G Ma R K E T E CO N O M I E s W H aT R O L E C a N s T R U C T U R a L R E F O R M s P L ay
International Monetary Fund | October 2019
in Advanced and Developing Countriesrdquo IMF Occasional Paper 268 International Monetary Fund Washington DC
Paz Lourenccedilo S 2014 ldquoThe Impacts of Trade Liberalization on Informal Labor Markets A Theoretical and Empirical Evalua-tion of the Brazilian Caserdquo Journal of International Economics 92 (2) 330ndash48
Prati Alessandro Massimiliano Gaetano Onorato and Chris Papageorgiou 2013 ldquoWhich Reforms Work and under Which Institutional Environment Evidence from a New Data Set on Structural Reformsrdquo Review of Economics and Statistics 95 (3) 946ndash68
Quinn Dennis 1997 ldquoThe Correlates of Change in Interna-tional Financial Regulationrdquo American Political Science Review 91 (3) 531ndash51
Quinn Dennis P and A Maria Toyoda 2008 ldquoDoes Capital Account Liberalization Lead to Economic Growthrdquo Review of Financial Studies 21 (3) 1403ndash49
Rajan Raghuram and Luigi Zingales 1998 ldquoFinancial Dependence and Growthrdquo American Economic Review 88 (3) 559ndash86
Ulyssea Gabriel 2018 ldquoFirms Informality and Development Theory and Evidence from Brazilrdquo American Economic Review 108 (8) 2015ndash47
World Bank (WB) 2019 Doing Business Training for Reform Washington DC World Bank
Zettelmeyer Jeromin 2006 ldquoGrowth and Reforms in Latin America A Survey of Facts and Argumentsrdquo IMF Working Paper 06210 International Monetary Fund Washington DC
International Monetary Fund | October 2019 121
STATISTICAL APPENDIX
T he Statistical Appendix presents histori-cal data as well as projections It comprises seven sections Assumptions Whatrsquos New Data and Conventions Country Notes
Classification of Countries Key Data Documentation and Statistical Tables
The assumptions underlying the estimates and pro-jections for 2019ndash20 and the medium-term scenario for 2021ndash24 are summarized in the first section The second section presents a brief description of the changes to the database and statistical tables since the April 2019 World Economic Outlook (WEO) The third section provides a general description of the data and the conventions used for calculating country group composites The fourth section summarizes selected key information for each country The fifth section summarizes the classification of countries in the vari-ous groups presented in the WEO The sixth section provides information on methods and reporting stan-dards for the member countriesrsquo national account and government finance indicators included in the report
The last and main section comprises the statistical tables (Statistical Appendix A is included here Statistical Appendix B is available online at wwwimf orgenPublicationsWEO)
Data in these tables have been compiled on the basis of information available through September 30 2019 The figures for 2019 and beyond are shown with the same degree of precision as the historical figures solely for convenience because they are projections the same degree of accuracy is not to be inferred
AssumptionsReal effective exchange rates for the advanced economies
are assumed to remain constant at their average levels measured during the period July 26 to August 23 2019 For 2019 and 2020 these assumptions imply average US dollarndashspecial drawing right (SDR) conversion rates of 1382 and 1377 US dollarndasheuro conversion rates of 1123 and 1120 and yenndashUS dollar conversion rates of 1082 and 1045 respectively
It is assumed that the price of oil will average $6178 a barrel in 2019 and $5794 a barrel in 2020
Established policies of national authorities are assumed to be maintained The more specific policy assumptions underlying the projections for selected economies are described in Box A1
With regard to interest rates it is assumed that the London interbank offered rate (LIBOR) on six-month US dollar deposits will average 23 percent in 2019 and 20 percent in 2020 that three-month euro depos-its will average ndash04 percent in 2019 and ndash06 percent in 2020 and that six-month yen deposits will average 00 percent in 2019 and ndash01 percent in 2020
As a reminder in regard to the introduction of the euro on December 31 1998 the Council of the European Union decided that effective January 1 1999 the irrevocably fixed conversion rates between the euro and currencies of the member countries adopting the euro are as described in Box 54 of the October 1998 WEO See Box 54 of the October 1998 WEO for details on how the conversion rates were established
1 euro = 137603 Austrian schillings = 403399 Belgian francs = 0585274 Cyprus pound1
= 195583 Deutsche marks = 156466 Estonian krooni2
= 594573 Finnish markkaa = 655957 French francs = 340750 Greek drachmas3
= 0787564 Irish pound = 193627 Italian lire = 0702804 Latvian lat4
= 345280 Lithuanian litas5
= 403399 Luxembourg francs = 042930 Maltese lira1
= 220371 Netherlands guilders = 200482 Portuguese escudos = 301260 Slovak koruna6
= 239640 Slovenian tolars7
= 166386 Spanish pesetas1Established on January 1 20082Established on January 1 20113Established on January 1 20014Established on January 1 20145Established on January 1 20156Established on January 1 20097Established on January 1 2007
W O R L D E C O N O M I C O U T L O O K G LO B A L M A N U FAC T U R I N G D OW N T U R N R IS I N G T R A D E B A R R I E R S
122 International Monetary Fund | October 2019
Whatrsquos Newbull Mauritania redenominated its currency in
January 2018 by replacing 10 old Mauritanian ouguiya (MRO) with 1 new Mauritanian ouguiya (MRU) Local currency data for Mauritania are expressed in the new currency beginning with the October 2019 WEO database
bull Satildeo Tomeacute and Priacutencipe redenominated its currency in January 2018 by replacing 1000 old Satildeo Tomeacute and Priacutencipe dobra (STD) with 1 new Satildeo Tomeacute and Priacutencipe dobra (STN) Local currency data for Satildeo Tomeacute and Priacutencipe are expressed in the new currency beginning with the October 2019 WEO database
bull Beginning with the October 2019 WEO the regional group Commonwealth of Independent States (CIS) is discontinued Four of the CIS econo-mies (Belarus Moldova Russia and Ukraine) are added to the regional group Emerging and Devel-oping Europe The remaining eight economiesmdashArmenia Azerbaijan Georgia Kazakhstan Kyrgyz Republic Tajikistan Turkmenistan and Uzbekistan which comprise the regional subgroup Caucasus and Central Asia (CCA)mdashare combined with Middle East North Africa Afghanistan and Pakistan (MENAP) to form the new regional group Middle East and Central Asia (MECA)
Data and ConventionsData and projections for 194 economies form the
statistical basis of the WEO database The data are maintained jointly by the IMFrsquos Research Department and regional departments with the latter regularly updating country projections based on consistent global assumptions
Although national statistical agencies are the ultimate providers of historical data and definitions international organizations are also involved in statisti-cal issues with the objective of harmonizing meth-odologies for the compilation of national statistics including analytical frameworks concepts definitions classifications and valuation procedures used in the production of economic statistics The WEO database reflects information from both national source agencies and international organizations
Most countriesrsquo macroeconomic data presented in the WEO conform broadly to the 2008 version of the System of National Accounts (SNA) The IMFrsquos sector statistical
standardsmdashthe sixth edition of the Balance of Payments and International Investment Position Manual (BPM6) the Monetary and Financial Statistics Manual and Compilation Guide (MFSMCG) and the Government Finance Statistics Manual 2014 (GFSM 2014)mdashhave been or are being aligned with the SNA 2008 These standards reflect the IMFrsquos special interest in countriesrsquo external positions financial sector stability and public sector fiscal positions The process of adapting country data to the new standards begins in earnest when the manuals are released However full concordance with the manuals is ultimately dependent on the provision by national statistical compilers of revised country data hence the WEO estimates are only partially adapted to these manuals Nonetheless for many countries the impact on major balances and aggregates of conversion to the updated standards will be small Many other countries have partially adopted the latest standards and will continue implementation over a period of years1
The fiscal gross and net debt data reported in the WEO are drawn from official data sources and IMF staff estimates While attempts are made to align gross and net debt data with the definitions in the GFSM as a result of data limitations or specific country circum-stances these data can sometimes deviate from the formal definitions Although every effort is made to ensure the WEO data are relevant and internationally comparable differences in both sectoral and instru-ment coverage mean that the data are not universally comparable As more information becomes available changes in either data sources or instrument cover-age can give rise to data revisions that can sometimes be substantial For clarification on the deviations in sectoral or instrument coverage please refer to the metadata for the online WEO database
Composite data for country groups in the WEO are either sums or weighted averages of data for individual countries Unless noted otherwise multiyear averages of growth rates are expressed as compound annual rates of change2 Arithmetically weighted averages are used
1 Many countries are implementing the SNA 2008 or European System of National and Regional Accounts (ESA) 2010 and a few countries use versions of the SNA older than that from 1993 A similar adoption pattern is expected for the BPM6 and GFSM 2014 Please refer to Table G which lists the statistical standards adhered to by each country
2 Averages for real GDP and its components employment inflation factor productivity GDP per capita trade and commodity prices are calculated based on the compound annual rate of change except in the case of the unemployment rate which is based on the simple arithmetic average
S TAT I S T I C A L A P P E N D I X
International Monetary Fund | October 2019 123
for all data for the emerging market and developing economies groupmdashexcept data on inflation and money growth for which geometric averages are used The following conventions apply
Country group composites for exchange rates interest rates and growth rates of monetary aggregates are weighted by GDP converted to US dollars at market exchange rates (averaged over the preceding three years) as a share of group GDP
Composites for other data relating to the domestic economy whether growth rates or ratios are weighted by GDP valued at purchasing power parity as a share of total world or group GDP3 Annual inflation rates are simple percentage changes from the previous years except in the case of emerging market and developing economies for which the rates are based on logarithmic differences
Composites for real GDP per capita in purchasing power parity terms are sums of individual country data after conversion to the international dollar in the years indicated
Unless noted otherwise composites for all sectors for the euro area are corrected for reporting discrepan-cies in intra-area transactions Unadjusted annual GDP data are used for the euro area and for the majority of individual countries except for Cyprus Ireland Portugal and Spain which report calendar-adjusted data For data prior to 1999 data aggregations apply 1995 European currency unit exchange rates
Composites for fiscal data are sums of individual country data after conversion to US dollars at the average market exchange rates in the years indicated
Composite unemployment rates and employment growth are weighted by labor force as a share of group labor force
Composites relating to external sector statistics are sums of individual country data after conversion to US dollars at the average market exchange rates in the years indicated for balance of payments data and at end-of-year market exchange rates for debt denominated in currencies other than US dollars
Composites of changes in foreign trade volumes and prices however are arithmetic averages of
3 See ldquoRevised Purchasing Power Parity Weightsrdquo in the July 2014 WEO Update for a summary of the revised purchasing-power-parity-based weights as well as Box A2 of the April 2004 WEO and Annex IV of the May 1993 WEO See also Anne-Marie Gulde and Marianne Schulze-Ghattas ldquoPurchasing Power Parity Based Weights for the World Economic Outlookrdquo in Staff Studies for the World Economic Outlook (Washington DC International Monetary Fund December 1993) 106ndash23
percent changes for individual countries weighted by the US dollar value of exports or imports as a share of total world or group exports or imports (in the preceding year)
Unless noted otherwise group composites are computed if 90 percent or more of the share of group weights is represented
Data refer to calendar years except in the case of a few countries that use fiscal years Table F lists the economies with exceptional reporting periods for national accounts and government finance data for each country
For some countries the figures for 2018 and earlier are based on estimates rather than actual outturns Table G lists the latest actual outturns for the indicators in the national accounts prices government finance and balance of payments indicators for each country
Country NotesThe consumer price data for Argentina before
December 2013 reflect the consumer price index (CPI) for the Greater Buenos Aires Area (CPI-GBA) while from December 2013 to October 2015 the data reflect the national CPI (IPCNu) The government that took office in December 2015 discontinued the IPCNu stating that it was flawed and released a new CPI for the Greater Buenos Aires Area on June 15 2016 (a new national CPI has been disseminated starting in June 2017) At its November 9 2016 meeting the IMF Executive Board considered the new CPI series to be in line with international standards and lifted the declara-tion of censure issued in 2013 Given the differences in geographical coverage weights sampling and method-ology of these series the average CPI inflation for 2014 2015 and 2016 and end-of-period inflation for 2015 and 2016 are not reported in the October 2019 WEO
Argentinarsquos authorities discontinued the publication of labor market data in December 2015 and released new series starting in the second quarter of 2016
The fiscal series for the Dominican Republic have the following coverage public debt debt service and the cyclically adjustedstructural balances are for the con-solidated public sector (which includes central govern-ment rest of the nonfinancial public sector and the central bank) and the remaining fiscal series are for the central government
Indiarsquos real GDP growth rates are calculated as per national accounts for 1998 to 2011 with base year 200405 and thereafter with base year 201112
W O R L D E C O N O M I C O U T L O O K G LO B A L M A N U FAC T U R I N G D OW N T U R N R IS I N G T R A D E B A R R I E R S
124 International Monetary Fund | October 2019
Against the backdrop of a civil war and weak capacity the reliability of Libyarsquos data especially medium-term projections is low
Data for Syria are excluded from 2011 onward because of the uncertain political situation
Trinidad and Tobagorsquos growth estimates for 2018 are based on full-year energy sector data from the Ministry of Energy and Ministry of Finance prelimi-nary national accounts data for the first three quarters of the year from the Central Statistical Office and staff projections for fourth-quarter nonenergy output based on available information Growth projections from 2019 are unchanged from the April 2019 WEO in the absence of updates to published national accounts data
Ukrainersquos revised national accounts data are available beginning in 2000 and exclude Crimea and Sevastopol from 2010
Starting from October 2018 Uruguayrsquos public pen-sion system has been receiving transfers in the context of a new law that compensates persons affected by the creation of the mixed pension system These funds are recorded as revenues consistent with the IMFrsquos meth-odology Therefore data and projections for 2018ndash22 are affected by these transfers which amounted to 13 percent of GDP in 2018 and are projected to be 12 percent of GDP in 2019 09 percent of GDP in 2020 04 percent of GDP in 2021 02 percent of GDP in 2022 and zero percent of GDP thereafter Please see IMF Country Report 1964 for further details The disclaimer about the public pension system applies only to the revenues and net lendingborrowing series
The coverage of the fiscal data for Uruguay was changed from consolidated public sector (CPS) to nonfinancial public sector (NFPS) with the October 2019 WEO In Uruguay NFPS coverage includes central government local government social security funds nonfinancial public corporations and Banco de Seguros del Estado Historical data were also revised accordingly Under this narrower fiscal perimetermdashwhich excludes the central bankmdashassets and liabilities held by the NFPS where the counterpart is the central bank are not netted out in debt figures In this context capitalization bonds issued in the past by the government to the central bank are now part of the NFPS debt Gross and net debt estimates for the period 2008ndash11 are preliminary
Projecting the economic outlook in Venezuela including assessing past and current economic
developments as the basis for the projections is complicated by the lack of discussions with the authorities (the last Article IV consultation took place in 2004) incomplete understanding of the reported data and difficulties in interpreting certain reported economic indicators given economic developments The fiscal accounts include the budgetary central government social security FOGADE (insurance deposit institution) and a sample of public enterprises including Petroacuteleos de Venezuela SA (PDVSA) and data for 2018 are IMF staff estimates The effects of hyperinflation and the paucity of reported data mean that the IMF staffrsquos estimated macroeconomic indica-tors need to be interpreted with caution For example nominal GDP is estimated assuming the GDP deflator rises in line with the IMF staffrsquos estimated average inflation Public external debt in relation to GDP is estimated using the IMF staffrsquos estimate of the average exchange rate for the year Wide uncertainty surrounds these projections Venezuelarsquos consumer prices are excluded from all WEO group composites
Classification of CountriesSummary of the Country Classification
The country classification in the WEO divides the world into two major groups advanced economies and emerging market and developing economies4 This classification is not based on strict criteria economic or otherwise and it has evolved over time The objective is to facilitate analysis by providing a reasonably meaningful method of organizing data Table A provides an overview of the country classification showing the number of countries in each group by region and summarizing some key indicators of their relative size (GDP valued at purchasing power parity total exports of goods and services and population)
Some countries remain outside the country classification and therefore are not included in the analysis Cuba and the Democratic Peoplersquos Republic of Korea are examples of countries that are not IMF members and their economies therefore are not monitored by the IMF
4 As used here the terms ldquocountryrdquo and ldquoeconomyrdquo do not always refer to a territorial entity that is a state as understood by interna-tional law and practice Some territorial entities included here are not states although their statistical data are maintained on a separate and independent basis
S TAT I S T I C A L A P P E N D I X
International Monetary Fund | October 2019 125
General Features and Composition of Groups in the World Economic Outlook ClassificationAdvanced Economies
The 39 advanced economies are listed in Table B The seven largest in terms of GDP based on market exchange ratesmdashthe United States Japan Germany France Italy the United Kingdom and Canadamdashconstitute the subgroup of major advanced econo-mies often referred to as the Group of Seven (G7) The members of the euro area are also distinguished as a subgroup Composite data shown in the tables for the euro area cover the current members for all years even though the membership has increased over time
Table C lists the member countries of the European Union not all of which are classified as advanced economies in the WEO
Emerging Market and Developing Economies
The group of emerging market and developing econ-omies (155) includes all those that are not classified as advanced economies
The regional breakdowns of emerging market and developing economies are emerging and developing Asia emerging and developing Europe (sometimes also referred to as ldquocentral and eastern Europerdquo) Latin America and the Caribbean (LAC) Middle East and Central Asia (MECA which comprises the regional subgroups Middle East North Africa Afghanistan and Pakistan and Caucasus and Central Asia) and sub-Saharan Africa (SSA)
Emerging market and developing economies are also classified according to analytical criteria The analytical criteria reflect the composition of export earnings and a distinction between net creditor and net debtor economies The detailed composition of emerging market and developing economies in the regional and analytical groups is shown in Tables D and E
The analytical criterion source of export earnings dis-tinguishes between the categories fuel (Standard Inter-national Trade Classification [SITC] 3) and nonfuel and then focuses on nonfuel primary products (SITCs 0 1 2 4 and 68) Economies are categorized into one of these groups if their main source of export earn-ings exceeded 50 percent of total exports on average between 2014 and 2018
The financial criteria focus on net creditor economies net debtor economies heavily indebted poor countries (HIPCs) and low-income developing countries (LIDCs) Economies are categorized as net debtors when their latest net international investment position where available was less than zero or their current account balance accumulations from 1972 (or earliest available data) to 2018 were negative Net debtor economies are further differentiated on the basis of experience with debt servicing5
The HIPC group comprises the countries that are or have been considered by the IMF and the World Bank for participation in their debt initiative known as the HIPC Initiative which aims to reduce the external debt burdens of all the eligible HIPCs to a ldquosustainablerdquo level in a reasonably short period of time6 Many of these countries have already benefited from debt relief and have graduated from the initiative
The LIDCs are countries that have per capita income levels below a certain threshold (set at $2700 in 2016 as measured by the World Bankrsquos Atlas method) structural features consistent with limited development and structural transformation and external financial linkages insufficiently close for them to be widely seen as emerging market economies
5 During 2014ndash18 25 economies incurred external payments arrears or entered into official or commercial bank debt-rescheduling agreements This group is referred to as economies with arrears andor rescheduling during 2014ndash18
6 See David Andrews Anthony R Boote Syed S Rizavi and Sukwinder Singh ldquoDebt Relief for Low-Income Countries The Enhanced HIPC Initiativerdquo IMF Pamphlet Series 51 (Washington DC International Monetary Fund November 1999)
W O R L D E C O N O M I C O U T L O O K G LO B A L M A N U FAC T U R I N G D OW N T U R N R IS I N G T R A D E B A R R I E R S
126 International Monetary Fund | October 2019
Table A Classification by World Economic Outlook Groups and Their Shares in Aggregate GDP Exports of Goods and Services and Population 20181
(Percent of total for group or world)
GDPExports of Goods
and Services Population
Number of Economies
Advanced Economies World
Advanced Economies World
Advanced Economies World
Advanced Economies 39 1000 408 1000 630 1000 143United States 372 152 160 101 306 44Euro Area 19 279 114 420 265 317 45
Germany 79 32 119 75 78 11France 54 22 58 36 61 09Italy 43 18 42 27 57 08Spain 34 14 31 20 43 06
Japan 101 41 59 37 118 17United Kingdom 55 22 54 34 62 09Canada 33 14 35 22 35 05Other Advanced Economies 16 159 65 272 171 161 23
MemorandumMajor Advanced Economies 7 737 301 527 332 716 102
Emerging Market and Developing Economies World
Emerging Market and Developing Economies World
Emerging Market and Developing Economies World
Emerging Market and Developing Economies 155 1000 592 1000 370 1000 857Regional GroupsEmerging and Developing Asia 30 562 332 486 180 563 482
China 315 187 288 107 218 187India 131 77 59 22 208 179ASEAN-5 5 94 55 123 46 88 76
Emerging and Developing Europe 16 121 72 165 61 59 51Russia 53 31 55 20 23 20
Latin America and the Caribbean 33 126 75 137 51 97 84Brazil 42 25 30 11 33 28Mexico 32 19 52 19 19 17
Middle East and Central Asia 31 139 82 166 62 123 106Saudi Arabia 23 14 34 13 05 04
Sub-Saharan Africa 45 52 30 46 17 157 135Nigeria 15 09 07 03 31 26South Africa 10 06 12 04 09 08
Analytical Groups2
By Source of Export EarningsFuel 27 171 101 221 82 116 100Nonfuel 127 829 490 779 288 884 757
Of Which Primary Products 35 51 30 52 19 90 77By External Financing SourceNet Debtor Economies 122 517 306 497 184 684 586Net Debtor Economies by Debt-
Servicing ExperienceEconomies with Arrears andor
Rescheduling during 2014ndash18 25 34 20 28 10 58 49Other GroupsHeavily Indebted Poor Countries 39 25 15 20 07 118 101Low-Income Developing Countries 59 73 43 70 26 230 198
1The GDP shares are based on the purchasing-power-parity valuation of economiesrsquo GDP The number of economies comprising each group reflects those for which data are included in the group aggregates2Syria is omitted from the source of export earnings and South Sudan and Syria are omitted from the net external position group composites because of insufficient data
S TAT I S T I C A L A P P E N D I X
International Monetary Fund | October 2019 127
Table B Advanced Economies by SubgroupMajor Currency AreasUnited StatesEuro AreaJapanEuro AreaAustria Greece NetherlandsBelgium Ireland PortugalCyprus Italy Slovak RepublicEstonia Latvia SloveniaFinland Lithuania SpainFrance LuxembourgGermany MaltaMajor Advanced EconomiesCanada Italy United StatesFrance JapanGermany United KingdomOther Advanced EconomiesAustralia Korea SingaporeCzech Republic Macao SAR2 SwedenDenmark New Zealand SwitzerlandHong Kong SAR1 Norway Taiwan Province of ChinaIceland Puerto RicoIsrael San Marino
1On July 1 1997 Hong Kong was returned to the Peoplersquos Republic of China and became a Special Administrative Region of China2On December 20 1999 Macao was returned to the Peoplersquos Republic of China and became a Special Administrative Region of China
Table C European UnionAustria Germany PolandBelgium Greece PortugalBulgaria Hungary RomaniaCroatia Ireland Slovak RepublicCyprus Italy SloveniaCzech Republic Latvia SpainDenmark Lithuania SwedenEstonia Luxembourg United KingdomFinland MaltaFrance Netherlands
W O R L D E C O N O M I C O U T L O O K G LO B A L M A N U FAC T U R I N G D OW N T U R N R IS I N G T R A D E B A R R I E R S
128 International Monetary Fund | October 2019
Table D Emerging Market and Developing Economies by Region and Main Source of Export EarningsFuel Nonfuel Primary Products
Emerging and Developing Asia
Brunei Darussalam Kiribati
Timor-Leste Lao PDR
Marshall Islands
Papua New Guinea
Solomon Islands
Tuvalu
Emerging and Developing Europe
Russia
Latin America and the Caribbean
Ecuador Argentina
Trinidad and Tobago Bolivia
Venezuela Chile
Guyana
Paraguay
Peru
Suriname
Uruguay
Middle East and Central Asia
Algeria Afghanistan
Azerbaijan Mauritania
Bahrain Somalia
Iran Sudan
Iraq Tajikistan
Kazakhstan Uzbekistan
Kuwait
Libya
Oman
Qatar
Saudi Arabia
Turkmenistan
United Arab Emirates
Yemen
Sub-Saharan Africa
Angola Burkina Faso
Chad Burundi
Republic of Congo Central African Republic
Equatorial Guinea Democratic Republic of the Congo
Gabon Cocircte drsquoIvoire
Nigeria Eritrea
South Sudan Guinea
Guinea-Bissau
Liberia
Malawi
Mali
Sierra Leone
South Africa
Zambia
Zimbabwe
S TAT I S T I C A L A P P E N D I X
International Monetary Fund | October 2019 129
Table E Emerging Market and Developing Economies by Region Net External Position and Status as Heavily Indebted Poor Countries and Low-Income Developing Countries
Net External Position1
Heavily Indebted Poor Countries2
Low-Income Developing Countries
Emerging and Developing Asia
Bangladesh
Bhutan
Brunei Darussalam bull
Cambodia
China bull
Fiji
India
Indonesia
Kiribati bull
Lao PDR
Malaysia
Maldives
Marshall Islands
Micronesia bull
Mongolia
Myanmar
Nauru
Nepal bull
Palau bull
Papua New Guinea
Philippines
Samoa
Solomon Islands
Sri Lanka
Thailand
Timor-Leste bull
Tonga
Tuvalu bull
Vanuatu
Vietnam
Emerging and Developing Europe
Albania
Belarus
Bosnia and Herzegovina
Bulgaria
Croatia
Hungary
Kosovo
Moldova
Montenegro
Net External Position1
Heavily Indebted Poor Countries2
Low-Income Developing Countries
North Macedonia
Poland
Romania
Russia bull
Serbia
Turkey
Ukraine
Latin America and the Caribbean
Antigua and Barbuda
Argentina bull
Aruba
The Bahamas
Barbados
Belize
Bolivia bull
Brazil
Chile
Colombia
Costa Rica
Dominica bull
Dominican Republic
Ecuador
El Salvador
Grenada
Guatemala
Guyana bull
Haiti bull
Honduras bull
Jamaica
Mexico
Nicaragua bull
Panama
Paraguay
Peru
St Kitts and Nevis
St Lucia
St Vincent and the Grenadines
Suriname
Trinidad and Tobago bull
Uruguay
Venezuela bull
W O R L D E C O N O M I C O U T L O O K G LO B A L M A N U FAC T U R I N G D OW N T U R N R IS I N G T R A D E B A R R I E R S
130 International Monetary Fund | October 2019
Net External Position1
Heavily Indebted Poor Countries2
Low-Income Developing Countries
Middle East and Central Asia
Afghanistan bull bull
Algeria bull
Armenia
Azerbaijan bull
Bahrain bull
Djibouti
Egypt
Georgia
Iran bull
Iraq bull
Jordan
Kazakhstan
Kuwait bull
Kyrgyz Republic
Lebanon
Libya bull
Mauritania bull
Morocco
Oman
Pakistan
Qatar bull
Saudi Arabia bull
Somalia
Sudan
Syria3
Tajikistan
Tunisia
Turkmenistan
United Arab Emirates bull
Uzbekistan bull
Yemen
Sub-Saharan Africa
Angola
Benin bull
Botswana bull
Burkina Faso bull
Burundi bull
Cabo Verde
Net External Position1
Heavily Indebted Poor Countries2
Low-Income Developing Countries
Cameroon bull
Central African Republic bull
Chad bull
Comoros bull
Democratic Republic of the Congo bull
Republic of Congo bull
Cocircte drsquoIvoire bull
Equatorial Guinea bull
Eritrea
Eswatini bull
Ethiopia bull
Gabon bull
The Gambia bull
Ghana bull
Guinea bull
Guinea-Bissau bull
Kenya
Lesotho
Liberia bull
Madagascar bull
Malawi bull
Mali bull
Mauritius bull
Mozambique bull
Namibia
Niger bull
Nigeria
Rwanda bull
Satildeo Tomeacute and Priacutencipe bull
Senegal bull
Seychelles
Sierra Leone bull
South Africa bull
South Sudan3
Tanzania bull
Togo bull
Uganda bull
Zambia bull
Zimbabwe 1Dot (star) indicates that the country is a net creditor (net debtor)2Dot instead of star indicates that the country has reached the completion point which allows it to receive the full debt relief committed to at the decision point3South Sudan and Syria are omitted from the net external position group composite for lack of a fully developed database
Table E Emerging Market and Developing Economies by Region Net External Position and Status as Heavily Indebted Poor Countries and Low-Income Developing Countries (continued)
S TAT I S T I C A L A P P E N D I X
International Monetary Fund | October 2019 131
Table F Economies with Exceptional Reporting Periods1
National Accounts Government Finance
The Bahamas JulJunBarbados AprMarBhutan JulJun JulJunBotswana AprMarDominica JulJunEgypt JulJun JulJunEswatini AprMarEthiopia JulJun JulJunHaiti OctSep OctSepHong Kong SAR AprMarIndia AprMar AprMarIran AprMar AprMarJamaica AprMarLesotho AprMar AprMarMalawi JulJunMarshall Islands OctSep OctSepMauritius JulJunMicronesia OctSep OctSepMyanmar OctSep OctSepNamibia AprMarNauru JulJun JulJunNepal AugJul AugJulPakistan JulJun JulJunPalau OctSep OctSepPuerto Rico JulJun JulJunSt Lucia AprMarSamoa JulJun JulJunSingapore AprMarThailand OctSepTrinidad and Tobago OctSep
1Unless noted otherwise all data refer to calendar years
W O R L D E C O N O M I C O U T L O O K G LO B A L M A N U FAC T U R I N G D OW N T U R N R IS I N G T R A D E B A R R I E R S
132 International Monetary Fund | October 2019
Table G Key Data Documentation
Country Currency
National Accounts Prices (CPI)
Historical Data Source1
Latest Actual Annual Data Base Year2
System of National Accounts
Use of Chain-Weighted
Methodology3Historical Data
Source1
Latest Actual
Annual Data
Afghanistan Afghan afghani NSO 2018 200203 SNA 1993 NSO 2018
Albania Albanian lek IMF staff 2018 1996 ESA 2010 From 1996 NSO 2018
Algeria Algerian dinar NSO 2018 2001 SNA 1993 From 2005 NSO 2018
Angola Angolan kwanza NSO and MEP 2018 2002 ESA 1995 NSO 2018
Antigua and Barbuda
Eastern Caribbean dollar
CB 2017 20066 SNA 1993 NSO 2018
Argentina Argentine peso NSO 2018 2004 SNA 2008 NSO 2018
Armenia Armenian dram NSO 2018 2005 SNA 2008 NSO 2018
Aruba Aruban Florin NSO 2017 2000 SNA 1993 From 2000 NSO 2018
Australia Australian dollar NSO 2018 201516 SNA 2008 From 1980 NSO 2018
Austria Euro NSO 2018 2010 ESA 2010 From 1995 NSO 2018
Azerbaijan Azerbaijan manat NSO 2018 2005 SNA 1993 From 1994 NSO 2018
The Bahamas Bahamian dollar NSO 2018 2012 SNA 1993 NSO 2018
Bahrain Bahrain dinar NSO 2018 2010 SNA 2008 NSO 2018
Bangladesh Bangladesh taka NSO 2018 200506 SNA 1993 NSO 2018
Barbados Barbados dollar NSO and CB 2018 2010 SNA 1993 NSO 2018
Belarus Belarusian ruble NSO 2018 2014 SNA 2008 From 2005 NSO 2018
Belgium Euro CB 2018 2016 ESA 2010 From 1995 CB 2018
Belize Belize dollar NSO 2018 2000 SNA 1993 NSO 2018
Benin CFA franc NSO 2018 2015 SNA 1993 NSO 2018
Bhutan Bhutanese ngultrum
NSO 201718 2000016 SNA 1993 CB 201718
Bolivia Bolivian boliviano NSO 2017 1990 SNA 2008 NSO 2018
Bosnia and Herzegovina
Bosnian convertible marka
NSO 2018 2010 ESA 2010 From 2000 NSO 2018
Botswana Botswana pula NSO 2018 2006 SNA 1993 NSO 2018
Brazil Brazilian real NSO 2018 1995 SNA 2008 NSO 2018
Brunei Darussalam Brunei dollar NSO and GAD 2018 2010 SNA 1993 NSO and GAD 2018
Bulgaria Bulgarian lev NSO 2018 2010 ESA 2010 From 1996 NSO 2018
Burkina Faso CFA franc NSO and MEP 2018 1999 SNA 1993 NSO 2018
Burundi Burundi franc NSO 2015 2005 SNA 1993 NSO 2017
Cabo Verde Cabo Verdean escudo
NSO 2018 2007 SNA 2008 From 2011 NSO 2018
Cambodia Cambodian riel NSO 2018 2000 SNA 1993 NSO 2018
Cameroon CFA franc NSO 2017 2005 SNA 2008 NSO 2018
Canada Canadian dollar NSO 2018 2012 SNA 2008 From 1980 NSO 2018
Central African Republic
CFA franc NSO 2017 2005 SNA 1993 NSO 2018
Chad CFA franc CB 2017 2005 SNA 1993 NSO 2017
Chile Chilean peso CB 2018 20136 SNA 2008 From 2003 NSO 2018
China Chinese yuan NSO 2018 2015 SNA 2008 NSO 2018
Colombia Colombian peso NSO 2018 2015 SNA 1993 From 2005 NSO 2018
Comoros Comorian franc MEP 2016 2007 From 2007 NSO 2018
Democratic Republic of the Congo
Congolese franc NSO 2018 2005 SNA 1993 CB 2018
Republic of Congo CFA franc NSO 2017 1990 SNA 1993 NSO 2018
Costa Rica Costa Rican coloacuten CB 2018 2012 SNA 2008 CB 2018
S TAT I S T I C A L A P P E N D I X
International Monetary Fund | October 2019 133
Table G Key Data Documentation (continued)
Country
Government Finance Balance of Payments
Historical Data Source1
Latest Actual Annual Data
Statistics Manual in
Use at SourceSubsectors Coverage4
Accounting Practice5
Historical Data Source1
Latest Actual Annual Data
Statistics Manual
in Use at Source
Afghanistan MoF 2018 2001 CG C NSO MoF and CB 2018 BPM 6
Albania IMF staff 2018 1986 CGLGSSMPC NFPC
CB 2018 BPM 6
Algeria MoF 2018 1986 CG C CB 2018 BPM 6
Angola MoF 2018 2001 CGLG CB 2018 BPM 6
Antigua and Barbuda
MoF 2018 2001 CG C CB 2016 BPM 6
Argentina MEP 2018 1986 CGSGSS C NSO 2018 BPM 6
Armenia MoF 2018 2001 CG C CB 2018 BPM 6
Aruba MoF 2018 2001 CG Mixed CB 2017 BPM 5
Australia MoF 201718 2014 CGSGLGTG A NSO 2018 BPM 6
Austria NSO 2018 2001 CGSGLGSS A CB 2018 BPM 6
Azerbaijan MoF 2018 CG C CB 2018 BPM 6
The Bahamas MoF 201718 2001 CG C CB 2018 BPM 5
Bahrain MoF 2018 2001 CG C CB 2018 BPM 6
Bangladesh MoF 2018 CG C CB 2018 BPM 6
Barbados MoF 201819 1986 BCG C CB 2018 BPM 5
Belarus MoF 2018 2001 CGLGSS C CB 2018 BPM 6
Belgium CB 2018 ESA 2010 CGSGLGSS A CB 2018 BPM 6
Belize MoF 2018 1986 CGMPC Mixed CB 2018 BPM 6
Benin MoF 2018 1986 CG C CB 2017 BPM 6
Bhutan MoF 201718 1986 CG C CB 201718 BPM 6
Bolivia MoF 2017 2001 CGLGSSNMPC NFPC
C CB 2017 BPM 6
Bosnia and Herzegovina
MoF 2018 2001 CGSGLGSS Mixed CB 2018 BPM 6
Botswana MoF 201819 1986 CG C CB 2018 BPM 6
Brazil MoF 2018 2001 CGSGLGSS MPCNFPC
C CB 2018 BPM 6
Brunei Darussalam MoF 2018 CG BCG C NSO MEP and GAD 2018 BPM 6
Bulgaria MoF 2018 2001 CGLGSS C CB 2018 BPM 6
Burkina Faso MoF 2018 2001 CG CB CB 2017 BPM 6
Burundi MoF 2015 2001 CG A CB 2016 BPM 6
Cabo Verde MoF 2018 2001 CG A NSO 2018 BPM 6
Cambodia MoF 2018 1986 CGLG Mixed CB 2018 BPM 5
Cameroon MoF 2017 2001 CGNFPC C MoF 2017 BPM 6
Canada MoF 2018 2001 CGSGLGSSother A NSO 2018 BPM 6
Central African Republic
MoF 2018 2001 CG C CB 2017 BPM 5
Chad MoF 2017 1986 CGNFPC C CB 2015 BPM 6
Chile MoF 2018 2001 CGLG A CB 2018 BPM 6
China MoF 2018 CGLG C GAD 2018 BPM 6
Colombia MoF 2018 2001 CGSGLGSS CB and NSO 2018 BPM 6
Comoros MoF 2018 1986 CG Mixed CB and IMF staff 2018 BPM 5
Democratic Republic of the Congo
MoF 2018 2001 CGLG A CB 2018 BPM 5
Republic of Congo MoF 2018 2001 CG A CB 2017 BPM 6
Costa Rica MoF and CB 2018 1986 CG C CB 2018 BPM 6
W O R L D E C O N O M I C O U T L O O K G LO B A L M A N U FAC T U R I N G D OW N T U R N R IS I N G T R A D E B A R R I E R S
134 International Monetary Fund | October 2019
Table G Key Data Documentation (continued)
Country Currency
National Accounts Prices (CPI)
Historical Data Source1
Latest Actual Annual Data Base Year2
System of National Accounts
Use of Chain-Weighted
Methodology3Historical Data
Source1
Latest Actual
Annual Data
Cocircte drsquoIvoire CFA franc NSO 2016 2009 SNA 1993 NSO 2017
Croatia Croatian kuna NSO 2018 2010 ESA 2010 NSO 2018
Cyprus Euro NSO 2018 2010 ESA 2010 From 1995 NSO 2018
Czech Republic Czech koruna NSO 2018 2010 ESA 2010 From 1995 NSO 2018
Denmark Danish krone NSO 2018 2010 ESA 2010 From 1980 NSO 2018
Djibouti Djibouti franc NSO 2018 2013 SNA 1993 NSO 2018
Dominica Eastern Caribbean dollar
NSO 2017 2006 SNA 1993 NSO 2016
Dominican Republic Dominican peso CB 2018 2007 SNA 2008 From 2007 CB 2018
Ecuador US dollar CB 2018 2007 SNA 1993 NSO and CB 2018
Egypt Egyptian pound MEP 201718 201112 SNA 2008 NSO 201718
El Salvador US dollar CB 2018 2014 SNA 2008 NSO 2018
Equatorial Guinea CFA franc MEP and CB 2017 2006 SNA 1993 MEP 2018
Eritrea Eritrean nakfa IMF staff 2018 2011 SNA 1993 NSO 2018
Estonia Euro NSO 2018 2015 ESA 2010 From 2010 NSO 2018
Eswatini Swazi lilangeni NSO 2017 2011 SNA 1993 NSO 2018
Ethiopia Ethiopian birr NSO 201718 201516 SNA 1993 NSO 2018
Fiji Fijian dollar NSO 2018 2014 SNA 1993 NSO 2018
Finland Euro NSO 2018 2010 ESA 2010 From 1980 NSO 2018
France Euro NSO 2018 2014 ESA 2010 From 1980 NSO 2018
Gabon CFA franc MoF 2018 2001 SNA 1993 NSO 2018
The Gambia Gambian dalasi NSO 2018 2013 SNA 1993 NSO 2018
Georgia Georgian lari NSO 2018 2010 SNA 1993 From 1996 NSO 2018
Germany Euro NSO 2018 2015 ESA 2010 From 1991 NSO 2018
Ghana Ghanaian cedi NSO 2018 2013 SNA 1993 NSO 2018
Greece Euro NSO 2018 2010 ESA 2010 From 1995 NSO 2018
Grenada Eastern Caribbean dollar
NSO 2018 2006 SNA 1993 NSO 2018
Guatemala Guatemalan quetzal
CB 2018 2001 SNA 1993 From 2001 NSO 2018
Guinea Guinean franc NSO 2018 2010 SNA 1993 NSO 2018
Guinea-Bissau CFA franc NSO 2018 2005 SNA 1993 NSO 2018
Guyana Guyanese dollar NSO 2017 20066 SNA 1993 NSO 2018
Haiti Haitian gourde NSO 201718 198687 SNA 1993 NSO 201718
Honduras Honduran lempira CB 2017 2000 SNA 1993 CB 2018
Hong Kong SAR Hong Kong dollar NSO 2018 2017 SNA 2008 From 1980 NSO 2018
Hungary Hungarian forint NSO 2018 2005 ESA 2010 From 2005 IEO 2018
Iceland Icelandic kroacutena NSO 2018 2005 ESA 2010 From 1990 NSO 2018
India Indian rupee NSO 201718 201112 SNA 2008 NSO 201718
Indonesia Indonesian rupiah NSO 2018 2010 SNA 2008 NSO 2018
Iran Iranian rial CB 201718 201112 SNA 1993 CB 201718
Iraq Iraqi dinar NSO 2017 2007 SNA 196893 NSO 2017
Ireland Euro NSO 2018 2017 ESA 2010 From 1995 NSO 2018
Israel New Israeli shekel NSO 2018 2015 SNA 2008 From 1995 NSO 2018
Italy Euro NSO 2018 2010 ESA 2010 From 1980 NSO 2018
Jamaica Jamaican dollar NSO 2018 2007 SNA 1993 NSO 2018
S TAT I S T I C A L A P P E N D I X
International Monetary Fund | October 2019 135
Table G Key Data Documentation (continued)
Country
Government Finance Balance of Payments
Historical Data Source1
Latest Actual Annual Data
Statistics Manual in
Use at SourceSubsectors Coverage4
Accounting Practice5
Historical Data Source1
Latest Actual Annual Data
Statistics Manual
in Use at Source
Cocircte drsquoIvoire MoF 2018 1986 CG A CB 2017 BPM 6
Croatia MoF 2018 2001 CGLG A CB 2018 BPM 6
Cyprus NSO 2018 ESA 2010 CGLGSS A CB 2018 BPM 6
Czech Republic MoF 2018 2001 CGLGSS A NSO 2018 BPM 6
Denmark NSO 2018 2001 CGLGSS A NSO 2018 BPM 6
Djibouti MoF 2018 2001 CG A CB 2018 BPM 5
Dominica MoF 201819 1986 CG C CB 2018 BPM 6
Dominican Republic MoF 2018 2014 CGLGSSNMPC A CB 2018 BPM 6
Ecuador CB and MoF 2018 1986 CGSGLGSSNFPC Mixed CB 2018 BPM 6
Egypt MoF 201718 2001 CGLGSSMPC C CB 201718 BPM 5
El Salvador MoF and CB 2018 1986 CGLGSS C CB 2018 BPM 6
Equatorial Guinea MoF and MEP 2017 1986 CG C CB 2017 BPM 5
Eritrea MoF 2018 2001 CG C CB 2018 BPM 5
Estonia MoF 2018 19862001 CGLGSS C CB 2018 BPM 6
Eswatini MoF 201819 2001 CG A CB 2018 BPM 6
Ethiopia MoF 201718 1986 CGSGLGNFPC C CB 201718 BPM 5
Fiji MoF 2018 1986 CG C CB 2018 BPM 6
Finland MoF 2018 2001 CGLGSS A NSO 2018 BPM 6
France NSO 2018 2001 CGLGSS A CB 2018 BPM 6
Gabon IMF staff 2018 2001 CG A CB 2018 BPM 5
The Gambia MoF 2018 1986 CG C CB and IMF staff 2018 BPM 5
Georgia MoF 2017 2001 CGLG C NSO and CB 2018 BPM 6
Germany NSO 2018 2001 CGSGLGSS A CB 2018 BPM 6
Ghana MoF 2018 2001 CG C CB 2018 BPM 5
Greece NSO 2018 2014 CGLGSS A CB 2018 BPM 6
Grenada MoF 2018 2014 CG CB CB 2018 BPM 6
Guatemala MoF 2018 2001 CG C CB 2018 BPM 6
Guinea MoF 2018 2001 CG C CB and MEP 2018 BPM 6
Guinea-Bissau MoF 2018 2001 CG A CB 2018 BPM 6
Guyana MoF 2018 1986 CGSSNFPC C CB 2018 BPM 6
Haiti MoF 201718 2001 CG C CB 201718 BPM 5
Honduras MoF 2018 2014 CGLGSSother Mixed CB 2018 BPM 6
Hong Kong SAR NSO 201819 2001 CG C NSO 2018 BPM 6
Hungary MEP and NSO 2018 ESA 2010 CGLGSSNMPC A CB 2018 BPM 6
Iceland NSO 2018 2001 CGLGSS A CB 2018 BPM 6
India MoF and IMF staff 201718 1986 CGSG C CB 201718 BPM 6
Indonesia MoF 2018 2001 CGLG C CB 2018 BPM 6
Iran MoF 201718 2001 CG C CB 201718 BPM 5
Iraq MoF 2017 2001 CG C CB 2017 BPM 6
Ireland MoF and NSO 2018 2001 CGLGSS A NSO 2018 BPM 6
Israel MoF and NSO 2017 2014 CGLGSS NSO 2018 BPM 6
Italy NSO 2018 2001 CGLGSS A NSO 2018 BPM 6
Jamaica MoF 201819 1986 CG C CB 201718 BPM 5
W O R L D E C O N O M I C O U T L O O K G LO B A L M A N U FAC T U R I N G D OW N T U R N R IS I N G T R A D E B A R R I E R S
136 International Monetary Fund | October 2019
Table G Key Data Documentation (continued)
Country Currency
National Accounts Prices (CPI)
Historical Data Source1
Latest Actual Annual Data Base Year2
System of National Accounts
Use of Chain-Weighted
Methodology3Historical Data
Source1
Latest Actual
Annual Data
Japan Japanese yen GAD 2018 2011 SNA 2008 From 1980 GAD 2018
Jordan Jordanian dinar NSO 2018 2016 SNA 2008 NSO 2018
Kazakhstan Kazakhstani tenge NSO 2018 2007 SNA 1993 From 1994 CB 2018
Kenya Kenyan shilling NSO 2018 2009 SNA 2008 NSO 2018
Kiribati Australian dollar NSO 2017 2006 SNA 2008 IMF staff 2017
Korea South Korean won CB 2018 2015 SNA 2008 From 1980 NSO 2018
Kosovo Euro NSO 2018 2016 ESA 2010 NSO 2018
Kuwait Kuwaiti dinar MEP and NSO 2017 2010 SNA 1993 NSO and MEP 2018
Kyrgyz Republic Kyrgyz som NSO 2018 2005 SNA 1993 NSO 2018
Lao PDR Lao kip NSO 2018 2012 SNA 1993 NSO 2018
Latvia Euro NSO 2018 2010 ESA 2010 From 1995 NSO 2018
Lebanon Lebanese pound NSO 2017 2010 SNA 2008 From 2010 NSO 201718
Lesotho Lesotho loti NSO 201617 201213 SNA 2008 NSO 2018
Liberia US dollar CB 2018 1992 SNA 1993 CB 2018
Libya Libyan dinar MEP 2017 2007 SNA 1993 NSO 2017
Lithuania Euro NSO 2018 2010 ESA 2010 From 2005 NSO 2018
Luxembourg Euro NSO 2018 2010 ESA 2010 From 1995 NSO 2018
Macao SAR Macanese pataca NSO 2018 2017 SNA 2008 From 2001 NSO 2018
Madagascar Malagasy ariary NSO 2017 2000 SNA 1968 NSO 2018
Malawi Malawian kwacha NSO 2011 2010 SNA 2008 NSO 2018
Malaysia Malaysian ringgit NSO 2018 2015 SNA 2008 NSO 2018
Maldives Maldivian rufiyaa MoF and NSO 2018 2014 SNA 1993 CB 2018
Mali CFA franc NSO 2018 1999 SNA 1993 NSO 2018
Malta Euro NSO 2018 2010 ESA 2010 From 2000 NSO 2018
Marshall Islands US dollar NSO 201617 200304 SNA 1993 NSO 201617
Mauritania New Mauritanian ouguiya
NSO 2014 2004 SNA 1993 NSO 2017
Mauritius Mauritian rupee NSO 2018 2006 SNA 1993 From 1999 NSO 2018
Mexico Mexican peso NSO 2018 2013 SNA 2008 NSO 2018
Micronesia US dollar NSO 201718 200304 SNA 1993 NSO 201718
Moldova Moldovan leu NSO 2018 1995 SNA 2008 NSO 2018
Mongolia Mongolian toumlgroumlg NSO 2016 2010 SNA 1993 NSO 201617
Montenegro Euro NSO 2018 2006 ESA 2010 NSO 2018
Morocco Moroccan dirham NSO 2018 2007 SNA 1993 From 1998 NSO 2018
Mozambique Mozambican metical
NSO 2018 2009 SNA 1993 2008
NSO 2018
Myanmar Myanmar kyat MEP 201718 201011 NSO 201718
Namibia Namibian dollar NSO 2018 2000 SNA 1993 NSO 2018
Nauru Australian dollar 201718 200607 SNA 1993 NSO 201617
Nepal Nepalese rupee NSO 201819 200001 SNA 1993 CB 201718
Netherlands Euro NSO 2018 2015 ESA 2010 From 1980 NSO 2018
New Zealand New Zealand dollar NSO 2018 200910 SNA 2008 From 1987 NSO 2018
Nicaragua Nicaraguan coacuterdoba
CB 2018 2006 SNA 1993 From 1994 CB 2018
Niger CFA franc NSO 2018 2000 SNA 1993 NSO 2018
Nigeria Nigerian naira NSO 2018 2010 SNA 2008 NSO 2018
North Macedonia Macedonian denar NSO 2018 2005 ESA 2010 NSO 2018
Norway Norwegian krone NSO 2018 2017 ESA 2010 From 1980 NSO 2018
S TAT I S T I C A L A P P E N D I X
International Monetary Fund | October 2019 137
Table G Key Data Documentation (continued)
Country
Government Finance Balance of Payments
Historical Data Source1
Latest Actual Annual Data
Statistics Manual in
Use at SourceSubsectors Coverage4
Accounting Practice5
Historical Data Source1
Latest Actual Annual Data
Statistics Manual
in Use at Source
Japan GAD 2017 2014 CGLGSS A MoF 2018 BPM 6
Jordan MoF 2018 2001 CGNFPC C CB 2018 BPM 6
Kazakhstan NSO 2018 2001 CGLG A CB 2018 BPM 6
Kenya MoF 2018 2001 CG C CB 2018 BPM 6
Kiribati MoF 2017 1986 CG C NSO 2017 BPM 6
Korea MoF 2017 2001 CGSS C CB 2018 BPM 6
Kosovo MoF 2018 CGLG C CB 2018 BPM 6
Kuwait MoF 2017 1986 CG Mixed CB 2017 BPM 6
Kyrgyz Republic MoF 2018 CGLGSS C CB 2018 BPM 5
Lao PDR MoF 2017 2001 CG C CB 2017 BPM 5
Latvia MoF 2018 ESA 2010 CGLGSS C CB 2018 BPM 6
Lebanon MoF 2017 2001 CG Mixed CB and IMF staff 2017 BPM 5
Lesotho MoF 201718 2001 CGLG C CB 201718 BPM 5
Liberia MoF 2018 2001 CG A CB 2018 BPM 5
Libya MoF 2018 1986 CGSGLG C CB 2017 BPM 5
Lithuania MoF 2018 2014 CGLGSS A CB 2018 BPM 6
Luxembourg MoF 2018 2001 CGLGSS A NSO 2018 BPM 6
Macao SAR MoF 2017 2014 CGSS C NSO 2017 BPM 6
Madagascar MoF 2018 1986 CGLG C CB 2018 BPM 5
Malawi MoF 201718 1986 CG C NSO and GAD 2017 BPM 6
Malaysia MoF 2018 2001 CGSGLG C NSO 2018 BPM 6
Maldives MoF 2018 1986 CG C CB 2018 BPM 6
Mali MoF 2018 2001 CG Mixed CB 2018 BPM 6
Malta NSO 2018 2001 CGSS A NSO 2018 BPM 6
Marshall Islands MoF 201617 2001 CGLGSS A NSO 201617 BPM 6
Mauritania MoF 2017 1986 CG C CB 2016 BPM 5
Mauritius MoF 201718 2001 CGLGNFPC C CB 2018 BPM 6
Mexico MoF 2018 2014 CGSSNMPCNFPC C CB 2018 BPM 6
Micronesia MoF 201718 2001 CGSGLGSS NSO 201718 BPM 5
Moldova MoF 2018 1986 CGLG C CB 2018 BPM 6
Mongolia MoF 201718 2001 CGSGLGSS C CB 2016 BPM 6
Montenegro MoF 2018 19862001 CGLGSS C CB 2018 BPM 6
Morocco MEP 2018 2001 CG A GAD 2018 BPM 6
Mozambique MoF 2018 2001 CGSG Mixed CB 2018 BPM 6
Myanmar MoF 201718 2014 CGNFPC C IMF staff 201718 BPM 6
Namibia MoF 201819 2001 CG C CB 2018 BPM 6
Nauru MoF 201617 2001 CG Mixed IMF staff 201617 BPM 6
Nepal MoF 201718 2001 CG C CB 201718 BPM 5
Netherlands MoF 2018 2001 CGLGSS A CB 2018 BPM 6
New Zealand MoF 201718 2001 CG LG A NSO 2018 BPM 6
Nicaragua MoF 2018 1986 CGLGSS C IMF staff 2018 BPM 6
Niger MoF 2017 1986 CG A CB 2018 BPM 6
Nigeria MoF 2018 2001 CGSGLG C CB 2018 BPM 6
North Macedonia MoF 2018 1986 CGSGSS C CB 2018 BPM 6
Norway NSO and MoF 2018 2014 CGLGSS A NSO 2017 BPM 6
W O R L D E C O N O M I C O U T L O O K G LO B A L M A N U FAC T U R I N G D OW N T U R N R IS I N G T R A D E B A R R I E R S
138 International Monetary Fund | October 2019
Table G Key Data Documentation (continued)
Country Currency
National Accounts Prices (CPI)
Historical Data Source1
Latest Actual Annual Data Base Year2
System of National Accounts
Use of Chain-Weighted
Methodology3Historical Data
Source1
Latest Actual
Annual Data
Oman Omani rial NSO 2018 2010 SNA 1993 NSO 2018
Pakistan Pakistan rupee NSO 201718 2005066 NSO 201718
Palau US dollar MoF 201718 201415 SNA 1993 MoF 201718
Panama US dollar NSO 2018 2007 SNA 1993 From 2007 NSO 2018
Papua New Guinea Papua New Guinea kina
NSO and MoF 2015 2013 SNA 1993 NSO 2015
Paraguay Paraguayan guaraniacute
CB 2018 2014 SNA 2008 CB 2018
Peru Peruvian nuevo sol CB 2018 2007 SNA 1993 CB 2018
Philippines Philippine peso NSO 2018 2000 SNA 2008 NSO 2018
Poland Polish zloty NSO 2018 2010 ESA 2010 From 1995 NSO 2018
Portugal Euro NSO 2018 2016 ESA 2010 From 1980 NSO 2018
Puerto Rico US dollar NSO 201718 1954 SNA 1968 NSO 201718
Qatar Qatari riyal NSO and MEP 2018 2013 SNA 1993 NSO and MEP 2018
Romania Romanian leu NSO 2018 2010 ESA 2010 From 2000 NSO 2018
Russia Russian ruble NSO 2018 2016 SNA 2008 From 1995 NSO 2018
Rwanda Rwandan franc NSO 2018 2014 SNA 2008 NSO 2018
Samoa Samoan tala NSO 201718 200910 SNA 1993 NSO 201718
San Marino Euro NSO 2017 2007 NSO 2017
Satildeo Tomeacute and Priacutencipe
Satildeo Tomeacute and Priacutencipe dobra
NSO 2017 2008 SNA 1993 NSO 2017
Saudi Arabia Saudi riyal NSO 2018 2010 SNA 1993 NSO 2018
Senegal CFA franc NSO 2018 2014 SNA 1993 NSO 2018
Serbia Serbian dinar NSO 2018 2010 ESA 2010 From 2010 NSO 2018
Seychelles Seychelles rupee NSO 2017 2006 SNA 1993 NSO 2018
Sierra Leone Sierra Leonean leone
NSO 2017 2006 SNA 1993 From 2010 NSO 2017
Singapore Singapore dollar NSO 2018 2015 SNA 2008 From 2015 NSO 2018
Slovak Republic Euro NSO 2018 2010 ESA 2010 From 1997 NSO 2018
Slovenia Euro NSO 2018 2010 ESA 2010 From 2000 NSO 2018
Solomon Islands Solomon Islands dollar
CB 2018 2004 SNA 1993 NSO 2018
Somalia US dollar CB 2018 2013 SNA 1993 CB 2018
South Africa South African rand NSO 2018 2010 SNA 2008 NSO 2018
South Sudan South Sudanese pound
NSO 2017 2010 SNA 1993 NSO 2018
Spain Euro NSO 2018 2010 ESA 2010 From 1995 NSO 2018
Sri Lanka Sri Lankan rupee NSO 2018 2010 SNA 1993 NSO 2018
St Kitts and Nevis Eastern Caribbean dollar
NSO 2018 2006 SNA 1993 NSO 2018
St Lucia Eastern Caribbean dollar
NSO 2018 2006 SNA 1993 NSO 2018
St Vincent and the Grenadines
Eastern Caribbean dollar
NSO 2018 20066 SNA 1993 NSO 2018
Sudan Sudanese pound NSO 2016 1982 SNA 1968 NSO 2018
Suriname Surinamese dollar NSO 2017 2007 SNA 1993 NSO 2018
S TAT I S T I C A L A P P E N D I X
International Monetary Fund | October 2019 139
Table G Key Data Documentation (continued)
Country
Government Finance Balance of Payments
Historical Data Source1
Latest Actual Annual Data
Statistics Manual in
Use at SourceSubsectors Coverage4
Accounting Practice5
Historical Data Source1
Latest Actual Annual Data
Statistics Manual
in Use at Source
Oman MoF 2018 2001 CG C CB 2018 BPM 5
Pakistan MoF 201718 1986 CGSGLG C CB 201718 BPM 6
Palau MoF 201718 2001 CG MoF 201718 BPM 6
Panama MoF 2018 1986 CGSGLGSSNFPC C NSO 2018 BPM 6
Papua New Guinea MoF 2015 1986 CG C CB 2015 BPM 5
Paraguay MoF 2018 2001 CGSGLGSSMPC NFPC
C CB 2018 BPM 6
Peru CB and MoF 2018 2001 CGSGLGSS Mixed CB 2018 BPM 5
Philippines MoF 2018 2001 CGLGSS C CB 2018 BPM 6
Poland MoF and NSO 2018 ESA 2010 CGLGSS A CB 2018 BPM 6
Portugal NSO 2018 2001 CGLGSS A CB 2018 BPM 6
Puerto Rico MEP 201516 2001 A
Qatar MoF 2018 1986 CG C CB and IMF staff 2018 BPM 5
Romania MoF 2018 2001 CGLGSS C CB 2018 BPM 6
Russia MoF 2018 2001 CGSGSS Mixed CB 2018 BPM 6
Rwanda MoF 2018 1986 CGLG Mixed CB 2018 BPM 6
Samoa MoF 201718 2001 CG A CB 201718 BPM 6
San Marino MoF 2017 CG Other 2017
Satildeo Tomeacute and Priacutencipe
MoF and Customs 2018 2001 CG C CB 2017 BPM 6
Saudi Arabia MoF 2018 2014 CG C CB 2018 BPM 6
Senegal MoF 2018 2001 CG C CB and IMF staff 2018 BPM 6
Serbia MoF 2018 19862001 CGSGLGSSother C CB 2018 BPM 6
Seychelles MoF 2018 1986 CGSS C CB 2016 BPM 6
Sierra Leone MoF 2018 1986 CG C CB 2017 BPM 5
Singapore MoF and NSO 201819 2014 CG C NSO 2018 BPM 6
Slovak Republic NSO 2018 2001 CGLGSS A CB 2018 BPM 6
Slovenia MoF 2018 1986 CGSGLGSS C NSO 2018 BPM 6
Solomon Islands MoF 2017 1986 CG C CB 2018 BPM 6
Somalia MoF 2018 2001 CG C CB 2018 BPM 5
South Africa MoF 2018 2001 CGSGSS C CB 2018 BPM 6
South Sudan MoF and MEP 2018 CG C MoF NSO and MEP 2018 BPM 6
Spain MoF and NSO 2018 ESA 2010 CGSGLGSS A CB 2018 BPM 6
Sri Lanka MoF 2018 2001 CG C CB 2018 BPM 6
St Kitts and Nevis MoF 2018 1986 CG SG C CB 2018 BPM 6
St Lucia MoF 201718 1986 CG C CB 2018 BPM 6
St Vincent and the Grenadines
MoF 2018 1986 CG C CB 2017 BPM 6
Sudan MoF 2018 2001 CG Mixed CB 2018 BPM 6
Suriname MoF 2017 1986 CG Mixed CB 2017 BPM 5
W O R L D E C O N O M I C O U T L O O K G LO B A L M A N U FAC T U R I N G D OW N T U R N R IS I N G T R A D E B A R R I E R S
140 International Monetary Fund | October 2019
Table G Key Data Documentation (continued)
Country Currency
National Accounts Prices (CPI)
Historical Data Source1
Latest Actual Annual Data Base Year2
System of National Accounts
Use of Chain-Weighted
Methodology3Historical Data
Source1
Latest Actual
Annual Data
Sweden Swedish krona NSO 2018 2018 ESA 2010 From 1993 NSO 2018
Switzerland Swiss franc NSO 2017 2010 ESA 2010 From 1980 NSO 2018
Syria Syrian pound NSO 2010 2000 SNA 1993 NSO 2011
Taiwan Province of China
New Taiwan dollar NSO 2018 2011 SNA 2008 NSO 2018
Tajikistan Tajik somoni NSO 2017 1995 SNA 1993 NSO 2017
Tanzania Tanzanian shilling NSO 2018 2015 SNA 2008 NSO 2018
Thailand Thai baht MEP 2018 2002 SNA 1993 From 1993 MEP 2018
Timor-Leste US dollar MoF 2017 20156 SNA 2008 NSO 2018
Togo CFA franc NSO 2016 2007 SNA 1993 NSO 2018
Tonga Tongan parsquoanga CB 2018 2010 SNA 1993 CB 2018
Trinidad and Tobago Trinidad and Tobago dollar
NSO 2017 2012 SNA 1993 NSO 2018
Tunisia Tunisian dinar NSO 2017 2010 SNA 1993 From 2009 NSO 2016
Turkey Turkish lira NSO 2018 2009 ESA 2010 From 2009 NSO 2018
Turkmenistan New Turkmen manat
NSO 2017 2008 SNA 1993 From 2000 NSO 2017
Tuvalu Australian dollar PFTAC advisors 2015 2005 SNA 1993 NSO 2018
Uganda Ugandan shilling NSO 2018 2010 SNA 1993 CB 201819
Ukraine Ukrainian hryvnia NSO 2018 2010 SNA 2008 From 2005 NSO 2018
United Arab Emirates
UAE dirham NSO 2017 2010 SNA 2008 NSO 2018
United Kingdom British pound NSO 2018 2016 ESA 2010 From 1980 NSO 2018
United States US dollar NSO 2018 2012 SNA 2008 From 1980 NSO 2018
Uruguay Uruguayan peso CB 2018 2005 SNA 1993 NSO 2018
Uzbekistan Uzbek sum NSO 2018 2015 SNA 1993 NSO and IMF staff
2018
Vanuatu Vanuatu vatu NSO 2017 2006 SNA 1993 NSO 2017
Venezuela Venezuelan boliacutevar soberano
CB 2018 1997 SNA 2008 CB 2018
Vietnam Vietnamese dong NSO 2018 2010 SNA 1993 NSO 2018
Yemen Yemeni rial IMF staff 2017 1990 SNA 1993 NSOCB and IMF staff
2017
Zambia Zambian kwacha NSO 2017 2010 SNA 2008 NSO 2018
Zimbabwe RTGS dollar NSO 2015 2012 NSO 2018
S TAT I S T I C A L A P P E N D I X
International Monetary Fund | October 2019 141
Table G Key Data Documentation (continued)
Country
Government Finance Balance of Payments
Historical Data Source1
Latest Actual Annual Data
Statistics Manual in
Use at SourceSubsectors Coverage4
Accounting Practice5
Historical Data Source1
Latest Actual Annual Data
Statistics Manual
in Use at Source
Sweden MoF 2018 2001 CGLGSS A NSO 2018 BPM 6
Switzerland MoF 2017 2001 CGSGLGSS A CB 2018 BPM 6
Syria MoF 2009 1986 CG C CB 2009 BPM 5
Taiwan Province of China
MoF 2018 2001 CGLGSS C CB 2018 BPM 6
Tajikistan MoF 2017 1986 CGLGSS C CB 2016 BPM 6
Tanzania MoF 2018 1986 CGLG C CB 2018 BPM 5
Thailand MoF 201718 2001 CGBCGLGSS A CB 2018 BPM 6
Timor-Leste MoF 2017 2001 CG C CB 2017 BPM 6
Togo MoF 2018 2001 CG C CB 2017 BPM 6
Tonga MoF 2017 2014 CG C CB and NSO 2018 BPM 6
Trinidad and Tobago MoF 201718 1986 CG C CB 2018 BPM 6
Tunisia MoF 2016 1986 CG C CB 2018 BPM 5
Turkey MoF 2018 2001 CGLGSSother A CB 2018 BPM 6
Turkmenistan MoF 2017 1986 CGLG C NSO and IMF staff 2015 BPM 6
Tuvalu MoF 2018 CG Mixed IMF staff 2012 BPM 6
Uganda MoF 2018 2001 CG C CB 2018 BPM 6
Ukraine MoF 2018 2001 CGLGSS C CB 2018 BPM 6
United Arab Emirates
MoF 2017 2001 CGBCGSGSS C CB 2017 BPM 5
United Kingdom NSO 2018 2001 CGLG A NSO 2018 BPM 6
United States MEP 2018 2014 CGSGLG A NSO 2018 BPM 6
Uruguay MoF 2018 1986 CGLGSSNFPC NMPC
C CB 2018 BPM 6
Uzbekistan MoF 2018 2014 CGSGLGSS C MEP 2018 BPM 6
Vanuatu MoF 2017 2001 CG C CB 2017 BPM 6
Venezuela MoF 2017 2001 BCGNFPC C CB 2018 BPM 5
Vietnam MoF 2017 2001 CGSGLG C CB 2018 BPM 5
Yemen MoF 2017 2001 CGLG C IMF staff 2017 BPM 5
Zambia MoF 2017 1986 CG C CB 2017 BPM 6
Zimbabwe MoF 2017 1986 CG C CB and MoF 2017 BPM 6
Note BPM = Balance of Payments Manual CPI = consumer price index ESA = European System of National Accounts SNA = System of National Accounts1CB = central bank Customs = Customs Authority GAD = General Administration Department IEO = international economic organization MEP = Ministry of Economy Planning Commerce andor Development MoF = Ministry of Finance andor Treasury NSO = National Statistics Office PFTAC = Pacific Financial Technical Assistance Centre2National accounts base year is the period with which other periods are compared and the period for which prices appear in the denominators of the price relationships used to calculate the index3Use of chain-weighted methodology allows countries to measure GDP growth more accurately by reducing or eliminating the downward biases in volume series built on index numbers that average volume components using weights from a year in the moderately distant past4BCG = budgetary central government CG = central government EUA = extrabudgetary unitsaccounts LG = local government MPC = monetary public corporation including central bank NFPC = nonfinancial public corporation NMPC = nonmonetary financial public corporation SG = state government SS = social security fund TG = territorial governments5Accounting standard A = accrual accounting C = cash accounting CB = commitments basis accounting Mixed = combination of accrual and cash accounting6Base year is not equal to 100 because the nominal GDP is not measured in the same way as real GDP or the data are seasonally adjusted
W O R L D E C O N O M I C O U T L O O K G LO B A L M A N U FAC T U R I N G D OW N T U R N R IS I N G T R A D E B A R R I E R S
142 International Monetary Fund | October 2019
Fiscal Policy Assumptions
The short-term fiscal policy assumptions used in the World Economic Outlook (WEO) are normally based on officially announced budgets adjusted for differences between the national authorities and the IMF staff regarding macroeconomic assumptions and projected fiscal outturns When no official budget has been announced projections incorporate policy mea-sures that are judged likely to be implemented The medium-term fiscal projections are similarly based on a judgment about the most likely path of policies For cases in which the IMF staff has insufficient informa-tion to assess the authoritiesrsquo budget intentions and prospects for policy implementation an unchanged structural primary balance is assumed unless indicated otherwise Specific assumptions used in regard to some of the advanced economies follow (See also Tables B5 to B9 in the online section of the Statistical Appendix for data on fiscal net lendingborrowing and structural balances)1
Argentina Fiscal projections are based on the avail-able information regarding budget outturn and budget plans for the federal and provincial governments fiscal measures announced by the authorities and the IMF staffrsquos macroeconomic projections
Australia Fiscal projections are based on data from the Australian Bureau of Statistics the fiscal year 201920 budgets of the commonwealth and states and the IMF staffrsquos estimates and projections
Austria Fiscal projections are based on data from Statistics Austria the authoritiesrsquo projections and the IMF staffrsquos estimates and projections
Belgium Projections are based on the 2019ndash22 Stability Programme and other available information
1 The output gap is actual minus potential output as a percentage of potential output Structural balances are expressed as a percentage of potential output The structural balance is the actual net lendingborrowing minus the effects of cyclical output from potential output corrected for one-time and other factors such as asset and commodity prices and output composition effects Changes in the structural balance consequently include effects of temporary fiscal measures the impact of fluctuations in interest rates and debt-service costs and other noncyclical fluctuations in net lendingborrowing The computations of structural balances are based on the IMF staffrsquos estimates of potential GDP and revenue and expenditure elasticities (See Annex I of the October 1993 WEO) Net debt is calculated as gross debt minus financial assets corresponding to debt instru-ments Estimates of the output gap and of the structural balance are subject to significant margins of uncertainty
on the authoritiesrsquo fiscal plans with adjustments for the IMF staffrsquos assumptions
Brazil Fiscal projections for 2019 take into account the deficit target approved in the budget law
Canada Projections use the baseline forecasts in the 2019 federal budget and the latest provincial budget updates as available The IMF staff makes some adjust-ments to these forecasts including for differences in macroeconomic projections The IMF staffrsquos forecast also incorporates the most recent data releases from Sta-tistics Canadarsquos Canadian System of National Economic Accounts including federal provincial and territorial budgetary outturns through the first quarter of 2019
Chile Projections are based on the authoritiesrsquo budget projections adjusted to reflect the IMF staffrsquos projections for GDP and copper prices
China Fiscal expansion is expected for 2019 due to a series of tax reforms and expenditure measures in response to the economic slowdown
Denmark Estimates for 2018 are aligned with the latest official budget numbers adjusted where appro-priate for the IMF staffrsquos macroeconomic assumptions For 2019 the projections incorporate key features of the medium-term fiscal plan as embodied in the authoritiesrsquo Convergence Programme 2019 submitted to the European Union
France Projections for 2019 and beyond are based on the measures of the 2018 budget law the multiyear law for 2018ndash22 and the 2019 budget law adjusted for differences in assumptions on macroeconomic and financial variables and revenue projections Historical fiscal data reflect the May 2019 revisions and update of the historical fiscal accounts debt data and national accounts
Germany The IMF staffrsquos projections for 2019 and beyond are based on the 2019 Stability Program and data updates from the national statistical agency adjusted for the differences in the IMF staffrsquos mac-roeconomic framework and assumptions concerning revenue elasticities The estimate of gross debt includes portfolios of impaired assets and noncore business transferred to institutions that are winding up as well as other financial sector and EU support operations
Greece Greecersquos general government primary balance estimate for 2018 is based on the April 2019 Excessive Deficit Procedure release by Eurostat Historical data since 2010 reflect adjustments in line with the primary balance definition under the enhanced surveillance framework for Greece
Box A1 Economic Policy Assumptions Underlying the Projections for Selected Economies
S TAT I S T I C A L A P P E N D I X
International Monetary Fund | October 2019 143
Hong Kong Special Administrative Region Projections are based on the authoritiesrsquo medium-term fiscal projec-tions on expenditures
Hungary Fiscal projections include the IMF staffrsquos projections of the macroeconomic framework and of the impact of recent legislative measures as well as fis-cal policy plans announced in the 2018 budget
India Historical data are based on budgetary execu-tion data Projections are based on available information on the authoritiesrsquo fiscal plans with adjustments for the IMF staffrsquos assumptions Subnational data are incorpo-rated with a lag of up to one year general government data are thus finalized well after central government data IMF and Indian presentations differ particularly regarding disinvestment and license-auction proceeds net versus gross recording of revenues in certain minor categories and some public-sector lending
Indonesia IMF projections are based on moderate tax policy and administration reforms and a gradual increase in social and capital spending over the medium term in line with fiscal space
Ireland Fiscal projections are based on the countryrsquos Budget 2019
Israel Historical data are based on government finance statistics data prepared by the Central Bureau of Statistics The medium-term fiscal projections are not in line with medium-term fiscal targets consistent with long experience of revisions to those targets
Italy The IMF staffrsquos estimates and projections are informed by the fiscal plans included in the govern-mentrsquos 2019 budget and April 2019 Economic and Financial Document The IMF staff assumes that the automatic value-added tax hikes for future years will be canceled
Japan The projections reflect the consumption tax rate increase in October 2019 the mitigating measures included in the FY2019 budget and tax reform and other fiscal measures already announced by the government
Korea The medium-term forecast incorporates the medium-term path for public spending announced by the government
Mexico Fiscal projections for 2019 are broadly in line with the approved budget projections for 2020 onward assume compliance with rules established in the Fiscal Responsibility Law
Netherlands Fiscal projections for 2019ndash24 are based on the authoritiesrsquo Bureau for Economic Policy Analysis budget projections after differences in
macroeconomic assumptions are adjusted for Histori-cal data were revised following the June 2014 Central Bureau of Statistics release of revised macro data because of the adoption of the European System of National and Regional Accounts (ESA 2010) and the revisions of data sources
New Zealand Fiscal projections are based on the fis-cal year 201920 budget and the IMF staffrsquos estimates
Portugal The projections for the current year are based on the authoritiesrsquo approved budget adjusted to reflect the IMF staffrsquos macroeconomic forecast Projections thereafter are based on the assumption of unchanged policies
Puerto Rico Fiscal projections are based on the Puerto Rico Fiscal and Economic Growth Plans (FEGPs) which were prepared in October 2018 and are certified by the Oversight Board In line with this planrsquos assumptions IMF projections assume federal aid for rebuilding after Hurricane Maria which devastated the island in September 2017 The projections also assume revenue losses from the following elimination of federal funding for the Affordable Care Act start-ing in 2020 for Puerto Rico elimination of federal tax incentives starting in 2018 that had neutralized the effects of Puerto Ricorsquos Act 154 on foreign firms and the effects of the Tax Cuts and Jobs Act which reduce the tax advantage of US firms producing in Puerto Rico Given sizable policy uncertainty some FEGP and IMF assumptions may differ in particu-lar those relating to the effects of the corporate tax reform tax compliance and tax adjustments (fees and rates) reduction of subsidies and expenses freez-ing of payroll operational costs and improvement of mobility reduction of expenses and increased health care efficiency On the expenditure side measures include extension of Act 66 which freezes much government spending through 2020 reduction of operating costs decreases in government subsidies and spending cuts in education Although IMF policy assumptions are similar to those in the FEGP scenario with full measures the IMFrsquos projections of fiscal revenues expenditures and balance are different from the FEGPsrsquo This stems from two main differences in methodologies first while IMF projections are on an accrual basis the FEGPsrsquo are on a cash basis Second the IMF and FEGPs make very different macroeco-nomic assumptions
Russia Projections for 2019ndash24 are based on the new oil price rule with adjustments by the IMF staff
Box A1 (continued)
W O R L D E C O N O M I C O U T L O O K G LO B A L M A N U FAC T U R I N G D OW N T U R N R IS I N G T R A D E B A R R I E R S
144 International Monetary Fund | October 2019
Saudi Arabia The IMF staff baseline projections of total government revenues except exported oil revenues are based on IMF staff understanding of government policies as announced in the 2019 Budget and Fiscal Balance Program 2019 Update Exported oil revenues are based on WEO baseline oil prices and the assumption that Saudi Arabia will overperform the Organization of Petroleum Exporting Countries+ agreement Expenditure projections take the 2019 budget and the Fiscal Balance Program 2019 Update as a starting point and reflect IMF staff estimates of the latest changes in policies and economic developments
Singapore For fiscal year 2019 projections are based on budget numbers For the rest of the projection period the IMF staff assumes unchanged policies
South Africa Fiscal assumptions are based on the 2019 Budget Review and the special appropriation of July 2019 for Eskom Nontax revenue excludes transactions in financial assets and liabilities as they involve primarily revenues associated with realized exchange rate valuation gains from the holding of for-eign currency deposits sale of assets and conceptually similar items
Spain For 2019 projections assume expenditures under the 2018 budget extension scenario and already legislated measures including pension and public wage increases and the IMF staffrsquos projection of revenues For 2020 and beyond fiscal projections are IMF staff projections which assume an unchanged structural primary balance
Sweden Fiscal projections take into account the authoritiesrsquo projections based on the 2019 Spring Bud-get The impact of cyclical developments on the fiscal accounts is calculated using the 2014 Organisation for Economic Co-operation and Developmentrsquos elasticity to take into account output and employment gaps
Switzerland The projections assume that fiscal policy is adjusted as necessary to keep fiscal balances in line with the requirements of Switzerlandrsquos fiscal rules
Turkey The fiscal projections assume a more nega-tive primary and overall balance than envisaged in the authoritiesrsquo New Economic Program 2019ndash21 based partly on recent weak growth and fiscal out-turns and partly on definitional differences the basis for the projections in the WEO and Fiscal Monitor is the IMF-defined fiscal balance which excludes some revenue and expenditure items that are included in the authoritiesrsquo headline balance
United Kingdom Fiscal projections are based on the UKrsquos Spring Statement 2019 with expenditure projections based on the budgeted nominal values but adjusted to account for the Spending Round 2019 and with revenue projections adjusted for differences between the IMF staffrsquos forecasts of macroeconomic vari-ables (such as GDP growth and inflation) and the fore-casts of these variables assumed in the authoritiesrsquo fiscal projections The IMF staffrsquos data exclude public sector banks and the effect of transferring assets from the Royal Mail Pension Plan to the public sector in April 2012 Real government consumption and investment are part of the real GDP path which according to the IMF staff may or may not be the same as projected by the UK Office for Budget Responsibility Fiscal year GDP is different from current year GDP The fiscal accounts are presented in terms of fiscal year Projections do not take into account revisions to the accounting (including on student loans) implemented on September 24 2019
United States Fiscal projections are based on the August 2019 Congressional Budget Office baseline adjusted for the IMF staffrsquos policy and macroeconomic assumptions Projections incorporate the effects of tax reform (the Tax Cuts and Jobs Act signed into law at the end of 2017) the Bipartisan Budget Act of 2018 passed in February 2018 and the Bipartisan Budget Act of 2019 passed in July 2019 Finally fiscal projections are adjusted to reflect the IMF staffrsquos forecasts for key macroeconomic and financial variables and different accounting treatment of financial sector support and of defined-benefit pension plans and are converted to a general government basis Data is compiled using SNA 2008 when translated into government finance statistics this is in accordance with the Government Finance Statistics Manual 2014 Because of data limitations most series begin in 2001
Monetary Policy AssumptionsMonetary policy assumptions are based on the
established policy framework in each country In most cases this implies a nonaccommodative stance over the business cycle official interest rates will increase when economic indicators suggest that infla-tion will rise above its acceptable rate or range they will decrease when indicators suggest inflation will not exceed the acceptable rate or range that output growth is below its potential rate and that the margin of slack in the economy is significant On this basis the London interbank offered rate on six-month US
Box A1 (continued)
S TAT I S T I C A L A P P E N D I X
International Monetary Fund | October 2019 145
dollar deposits is assumed to average 23 percent in 2019 and 20 percent in 2020 (see Table 11) The rate on three-month euro deposits is assumed to average ndash04 percent in 2019 and ndash06 percent in 2020 The interest rate on six-month Japanese yen depos-its is assumed to average 00 percent in 2019 and ndash01 percent in 2020
Argentina Monetary policy assumptions are con-sistent with the current monetary policy framework which targets zero base money growth in seasonally adjusted terms
Australia Monetary policy assumptions are in line with market expectations
Brazil Monetary policy assumptions are consistent with gradual convergence of inflation toward the middle of the target range
Canada Monetary policy assumptions are based on the IMF staffrsquos analysis
China Monetary policy is expected to remain on hold
Denmark Monetary policy is to maintain the peg to the euro
Euro area Monetary policy assumptions for euro area member countries are in line with market expectations
Hong Kong Special Administrative Region The IMF staff assumes that the currency board system will remain intact
India Monetary policy projections are consistent with achieving the Reserve Bank of Indiarsquos inflation target over the medium term
Indonesia Monetary policy assumptions are in line with the maintenance of inflation within the central bankrsquos targeted band
Japan Monetary policy assumptions are in line with market expectations
Korea The projections assume no change in the policy rate in 2019ndash20
Mexico Monetary policy assumptions are consistent with attaining the inflation target
Russia Monetary projections assume that the Central Bank of Russia is moving toward a neutral monetary policy stance
Saudi Arabia Monetary policy projections are based on the continuation of the exchange rate peg to the US dollar
Singapore Broad money is projected to grow in line with the projected growth in nominal GDP
South Africa Monetary policy will be moderately accommodative
Sweden Monetary projections are in line with Riksbank projections
Switzerland The projections assume no change in the policy rate in 2019ndash20
Turkey The outlook for monetary and financial con-ditions assumes further monetary policy easing in 2019
United Kingdom The short-term interest rate path is based on market interest rate expectations
United States The IMF staff expects the Federal Open Market Committee to continue to adjust the federal funds target rate in line with the broader macroeconomic outlook
Box A1 (continued)
W O R L D E C O N O M I C O U T L O O K G LO B A L M A N U FAC T U R I N G D OW N T U R N R IS I N G T R A D E B A R R I E R S
146 International Monetary Fund | October 2019
List of Tables
Output
A1 Summary of World Output A2 Advanced Economies Real GDP and Total Domestic DemandA3 Advanced Economies Components of Real GDP A4 Emerging Market and Developing Economies Real GDP
Inflation
A5 Summary of Inflation A6 Advanced Economies Consumer Prices A7 Emerging Market and Developing Economies Consumer Prices
Financial Policies
A8 Major Advanced Economies General Government Fiscal Balances and Debt
Foreign Trade
A9 Summary of World Trade Volumes and Prices
Current Account Transactions
A10 Summary of Current Account Balances A11 Advanced Economies Balance on Current Account A12 Emerging Market and Developing Economies Balance on Current Account
Balance of Payments and External Financing
A13 Summary of Financial Account Balances
Flow of Funds
A14 Summary of Net Lending and Borrowing
Medium-Term Baseline Scenario
A15 Summary of World Medium-Term Baseline Scenario
S TAT I S T I C A L A P P E N D I X
International Monetary Fund | October 2019 147
Table A1 Summary of World Output1(Annual percent change)
Average Projections2001ndash10 2011 2012 2013 2014 2015 2016 2017 2018 2019 2020 2024
World 39 43 35 35 36 35 34 38 36 30 34 36Advanced Economies 17 17 12 14 21 23 17 25 23 17 17 16United States 17 16 22 18 25 29 16 24 29 24 21 16Euro Area 12 16 ndash09 ndash03 14 21 19 25 19 12 14 13Japan 06 ndash01 15 20 04 12 06 19 08 09 05 05Other Advanced Economies2 28 30 20 24 29 21 21 27 22 15 18 21Emerging Market and Developing Economies 62 64 54 51 47 43 46 48 45 39 46 48
Regional GroupsEmerging and Developing Asia 85 79 70 69 68 68 67 66 64 59 60 60Emerging and Developing Europe 44 58 30 31 19 08 18 39 31 18 25 25Latin America and the Caribbean 32 46 29 29 13 03 ndash06 12 10 02 18 27Middle East and Central Asia 53 46 49 30 31 26 50 23 19 09 29 33Sub-Saharan Africa 59 53 47 52 51 31 14 30 32 32 36 42Analytical Groups
By Source of Export EarningsFuel 55 52 50 26 22 03 22 09 08 ndash03 20 21Nonfuel 64 67 54 57 53 52 51 56 53 47 50 53
Of Which Primary Products 42 49 25 41 22 29 17 28 18 12 24 35By External Financing SourceNet Debtor Economies 51 53 44 47 45 41 41 48 46 40 46 51Net Debtor Economies by
Debt-Servicing ExperienceEconomies with Arrears andor
Rescheduling during 2014ndash18 50 25 19 30 20 04 23 28 34 34 40 48Other GroupsEuropean Union 16 18 ndash04 03 19 25 21 28 22 15 16 15Low-Income Developing Countries 65 53 47 60 60 45 36 47 50 50 51 55Middle East and North Africa 50 44 49 24 27 24 54 18 11 01 27 29
MemorandumMedian Growth RateAdvanced Economies 22 19 10 14 25 22 24 30 27 18 18 17Emerging Market and Developing Economies 46 47 42 41 38 33 32 35 35 32 35 35Low-Income Developing Countries 53 60 51 52 54 39 42 45 40 50 50 48Output per Capita3
Advanced Economies 11 12 07 09 16 18 12 20 18 13 13 12Emerging Market and Developing Economies 46 48 36 36 32 28 31 33 32 25 33 35Low-Income Developing Countries 38 36 17 36 37 19 12 24 28 27 29 32World Growth Rate Based on Market
Exchange Rates 26 31 25 26 28 28 26 32 31 25 27 29Value of World Output (billions of US dollars)At Market Exchange Rates 49881 73312 74690 76842 78944 74779 75824 80262 84930 86599 90520 111569At Purchasing Power Parities 70721 95143 100020 105216 110903 115799 120832 127703 135436 141860 149534 1861561Real GDP2Excludes the United States euro area countries and Japan3Output per capita is in international currency at purchasing power parity
W O R L D E C O N O M I C O U T L O O K G L O B A L M A N U F A C T U R I N G D O W N T U R N R I S I N G T R A D E B A R R I E R S
148 International Monetary Fund | October 2019
Table A2 Advanced Economies Real GDP and Total Domestic Demand1
(Annual percent change)Fourth Quarter2
Average Projections Projections2001ndash10 2011 2012 2013 2014 2015 2016 2017 2018 2019 2020 2024 2018Q4 2019Q4 2020Q4
Real GDPAdvanced Economies 17 17 12 14 21 23 17 25 23 17 17 16 18 16 18United States 17 16 22 18 25 29 16 24 29 24 21 16 25 24 20Euro Area 12 16 ndash09 ndash03 14 21 19 25 19 12 14 13 12 10 18
Germany 09 39 04 04 22 17 22 25 15 05 12 12 06 04 13France 13 22 03 06 10 11 11 23 17 12 13 14 12 10 13Italy 03 06 ndash28 ndash17 01 09 11 17 09 00 05 06 00 02 10Spain 22 ndash10 ndash29 ndash17 14 36 32 30 26 22 18 16 23 20 18Netherlands 14 15 ndash10 ndash01 14 20 22 29 26 18 16 15 21 17 18Belgium 16 18 02 02 13 17 15 17 14 12 13 14 12 12 14Austria 15 29 07 00 07 11 20 26 27 16 17 16 22 13 20Ireland 28 03 02 14 85 251 37 81 83 43 35 27 37 34 44Portugal 07 ndash17 ndash41 ndash09 08 18 20 35 24 19 16 15 20 18 17Greece 18 ndash91 ndash73 ndash32 07 ndash04 ndash02 15 19 20 22 09 15 30 14Finland 17 26 ndash14 ndash08 ndash06 05 28 30 17 12 15 13 08 17 14Slovak Republic 49 28 17 15 28 42 31 32 41 26 27 25 37 22 27Lithuania 43 60 38 35 35 20 24 41 35 34 27 23 37 23 16Slovenia 27 09 ndash26 ndash10 28 22 31 48 41 29 29 21 30 31 28Luxembourg 27 25 ndash04 37 43 39 24 15 26 26 28 26 17 33 21Latvia 38 64 40 24 19 30 21 46 48 28 28 30 53 33 24Estonia 34 74 31 13 30 18 26 57 48 32 29 28 50 21 34Cyprus 33 04 ndash29 ndash58 ndash13 20 48 45 39 31 29 25 38 38 14Malta 20 13 28 46 87 108 57 67 68 51 43 32 71 69 18
Japan 06 ndash01 15 20 04 12 06 19 08 09 05 05 03 03 12United Kingdom 16 16 14 20 29 23 18 18 14 12 14 15 14 10 16Korea 47 37 24 32 32 28 29 32 27 20 22 29 30 19 19Canada 19 31 18 23 29 07 11 30 19 15 18 17 16 18 17Australia 31 28 39 21 26 25 28 24 27 17 23 26 22 20 24Taiwan Province of China 42 38 21 22 40 08 15 31 26 20 19 20 18 20 17Singapore 58 63 44 48 39 29 30 37 31 05 10 25 14 08 12Switzerland 18 18 10 19 25 13 17 19 28 08 13 16 15 11 16Sweden 22 31 ndash06 11 27 44 24 24 23 09 15 20 23 00 24Hong Kong SAR 41 48 17 31 28 24 22 38 30 03 15 29 12 05 28Czech Republic 32 18 ndash08 ndash05 27 53 25 44 30 25 26 25 27 22 30Norway 16 10 27 10 20 20 11 23 13 19 24 17 16 32 09Israel 32 51 24 43 38 23 40 36 34 31 31 30 29 30 34Denmark 08 13 02 09 16 23 24 23 15 17 19 15 26 15 19New Zealand 27 19 25 22 31 40 42 26 28 25 27 25 25 21 34Puerto Rico 07 ndash04 00 ndash03 ndash12 ndash10 ndash13 ndash27 ndash49 ndash11 ndash07 ndash08 Macao SAR 217 92 112 ndash12 ndash216 ndash09 97 47 ndash13 ndash11 03 Iceland 26 19 13 41 21 47 66 44 48 08 16 19 31 22 15San Marino ndash83 ndash70 ndash08 ndash07 25 25 06 11 08 07 05 MemorandumMajor Advanced Economies 13 16 14 14 20 22 15 23 21 16 16 14 16 15 17
Real Total Domestic DemandAdvanced Economies 16 15 08 11 21 26 20 25 22 18 18 16 21 17 18United States 17 15 22 16 27 36 19 26 31 26 22 15 29 24 20Euro Area 11 08 ndash24 ndash05 14 24 24 21 15 13 15 14 18 14 14
Germany 03 33 ndash09 11 17 16 30 24 21 13 17 13 21 08 14France 15 21 ndash04 07 15 15 15 23 10 13 13 15 06 16 14Italy 05 ndash06 ndash56 ndash26 02 15 15 15 10 ndash03 04 08 01 06 ndash03Spain 23 ndash31 ndash51 ndash32 20 40 24 30 30 18 17 14 26 18 15
Japan 02 07 23 24 04 08 00 14 05 12 08 04 08 ndash01 17United Kingdom 17 ndash02 18 21 32 23 24 14 16 11 16 15 20 ndash05 32Canada 29 34 20 22 17 ndash01 07 39 18 08 13 19 03 11 17Other Advanced Economies3 30 33 19 16 28 24 28 35 24 15 19 25 18 22 17MemorandumMajor Advanced Economies 13 14 11 14 20 24 17 23 22 18 17 13 20 15 18
1In this and other tables when countries are not listed alphabetically they are ordered on the basis of economic size2From the fourth quarter of the preceding year3Excludes the Group of Seven (Canada France Germany Italy Japan United Kingdom United States) and euro area countries
S TAT I S T I C A L A P P E N D I X
International Monetary Fund | October 2019 149
Table A3 Advanced Economies Components of Real GDP(Annual percent change)
Averages Projections2001ndash10 2011ndash20 2011 2012 2013 2014 2015 2016 2017 2018 2019 2020
Private Consumer ExpenditureAdvanced Economies 18 18 12 09 11 19 25 22 22 21 18 17United States 21 25 19 15 15 30 37 27 26 30 25 22Euro Area 11 08 01 ndash12 ndash07 09 19 20 16 14 12 13
Germany 04 14 19 15 04 11 19 23 13 13 14 13France 18 09 06 ndash04 05 08 15 18 14 09 11 13Italy 05 00 00 ndash40 ndash24 02 19 13 15 06 03 04Spain 20 06 ndash24 ndash35 ndash31 15 30 29 25 23 15 15
Japan 09 05 ndash04 20 24 ndash09 ndash02 ndash01 11 03 06 02United Kingdom 18 17 ndash07 15 18 20 26 31 21 17 16 14Canada 31 23 23 19 26 26 23 22 35 21 16 16Other Advanced Economies1 30 25 30 21 22 25 28 25 28 26 19 23MemorandumMajor Advanced Economies 16 17 12 11 12 18 25 21 21 20 18 16
Public ConsumptionAdvanced Economies 22 11 ndash06 00 ndash01 06 18 19 12 17 21 21United States 21 03 ndash30 ndash15 ndash19 ndash08 18 18 06 17 22 22Euro Area 19 09 ndash01 ndash03 04 08 13 18 15 11 12 13
Germany 14 20 10 13 14 17 28 41 24 14 20 18France 16 12 11 16 15 13 10 14 15 08 08 06Italy 10 ndash05 ndash18 ndash14 ndash03 ndash07 ndash06 01 03 02 ndash09 04Spain 47 02 ndash03 ndash47 ndash21 ndash03 20 10 19 21 16 11
Japan 15 13 19 17 15 05 15 14 03 08 17 18United Kingdom 26 12 01 12 ndash02 22 14 08 ndash02 04 28 39Canada 25 12 13 07 ndash08 06 14 18 21 29 07 11Other Advanced Economies1 31 29 18 24 28 27 28 31 31 35 38 31MemorandumMajor Advanced Economies 19 08 ndash11 ndash02 ndash05 01 16 18 08 13 18 20
Gross Fixed Capital FormationAdvanced Economies 05 27 32 26 17 35 32 22 40 26 18 22United States 00 38 46 69 36 51 32 19 37 41 25 27Euro Area 04 17 15 ndash33 ndash24 15 50 40 35 23 31 26
Germany ndash03 26 74 ndash02 ndash13 32 18 38 25 35 31 25France 12 17 20 02 ndash08 00 10 27 47 28 23 22Italy 01 ndash03 ndash19 ndash93 ndash66 ndash23 21 35 43 34 28 22Spain 12 10 ndash69 ndash86 ndash34 47 67 29 48 53 29 27
Japan ndash22 21 17 35 49 31 16 ndash03 30 12 13 09United Kingdom 03 24 26 21 34 72 34 23 35 02 ndash06 06Canada 38 07 46 49 14 23 ndash52 ndash43 30 12 ndash14 12Other Advanced Economies1 28 24 43 30 24 24 21 29 57 07 ndash07 15MemorandumMajor Advanced Economies 00 28 37 37 22 38 23 17 35 31 20 21
W O R L D E C O N O M I C O U T L O O K G L O B A L M A N U F A C T U R I N G D O W N T U R N R I S I N G T R A D E B A R R I E R S
150 International Monetary Fund | October 2019
Averages Projections2001ndash10 2011ndash20 2011 2012 2013 2014 2015 2016 2017 2018 2019 2020
Final Domestic DemandAdvanced Economies 16 18 13 11 11 20 26 22 24 21 18 19United States 17 24 16 20 13 28 33 24 25 30 25 23Euro Area 11 11 04 ndash14 ndash08 10 24 24 20 15 16 16
Germany 04 18 28 11 02 17 21 30 18 18 19 17France 16 12 10 02 05 08 13 19 21 13 13 14Italy 05 ndash02 ndash08 ndash45 ndash28 ndash04 14 14 18 10 05 08Spain 23 06 ndash30 ndash48 ndash30 18 36 25 29 29 18 17
Japan 02 10 05 23 28 02 06 01 14 06 11 08United Kingdom 17 17 00 16 17 29 25 25 19 12 14 17Canada 31 17 26 24 16 21 03 06 31 21 07 15Other Advanced Economies1 29 25 31 24 24 25 26 28 33 22 15 22MemorandumMajor Advanced Economies 13 18 13 14 11 20 23 20 22 21 19 18
Stock Building2
Advanced Economies 00 00 02 ndash03 00 01 01 ndash02 01 01 00 ndash01United States 00 00 ndash01 02 02 ndash01 03 ndash06 00 01 01 ndash02Euro Area 00 00 04 ndash10 03 04 00 00 01 00 ndash03 ndash01
Germany ndash01 ndash01 04 ndash18 08 00 ndash04 01 05 03 ndash05 00France ndash01 01 11 ndash06 02 07 03 ndash04 02 ndash03 00 00Italy 00 ndash01 02 ndash11 02 06 01 01 ndash03 ndash01 ndash08 ndash03Spain 00 00 ndash01 ndash02 ndash03 02 05 ndash01 01 01 00 00
Japan 00 00 02 00 ndash04 01 03 ndash01 00 01 00 00United Kingdom 00 00 ndash02 02 02 07 ndash02 ndash01 ndash06 04 ndash03 ndash01Canada ndash01 01 07 ndash03 05 ndash04 ndash04 00 08 ndash02 01 ndash01Other Advanced Economies1 00 ndash01 02 ndash04 ndash07 02 ndash01 00 02 02 01 ndash03MemorandumMajor Advanced Economies 00 00 02 ndash02 02 01 01 ndash03 01 01 ndash01 ndash01
Foreign Balance2
Advanced Economies 01 00 03 04 02 00 ndash03 ndash02 00 00 ndash01 ndash01United States 00 ndash02 00 00 02 ndash03 ndash08 ndash03 ndash03 ndash03 ndash03 ndash01Euro Area 01 03 09 15 03 01 ndash02 ndash04 05 05 ndash01 ndash01
Germany 05 01 08 12 ndash05 07 03 ndash06 02 ndash05 ndash07 ndash03France ndash02 00 01 07 ndash01 ndash05 ndash04 ndash04 ndash01 07 00 ndash02Italy ndash02 04 12 28 08 ndash01 ndash05 ndash04 02 ndash01 03 01Spain ndash02 06 21 22 15 ndash05 ndash03 08 01 ndash03 04 02
Japan 03 ndash01 ndash09 ndash08 ndash04 00 03 06 05 00 ndash01 ndash02United Kingdom ndash01 ndash01 15 ndash04 ndash05 ndash04 ndash03 ndash07 05 ndash02 00 ndash02Canada ndash11 02 ndash03 ndash04 01 12 09 04 ndash11 00 07 04Other Advanced Economies1 06 02 06 05 07 04 00 ndash01 ndash05 03 03 01MemorandumMajor Advanced Economies 00 ndash01 01 02 00 ndash01 ndash04 ndash02 00 ndash02 ndash02 ndash01
1Excludes the Group of Seven (Canada France Germany Italy Japan United Kingdom United States) and euro area countries2Changes expressed as percent of GDP in the preceding period
Table A3 Advanced Economies Components of Real GDP (continued)(Annual percent change)
S TAT I S T I C A L A P P E N D I X
International Monetary Fund | October 2019 151
Table A4 Emerging Market and Developing Economies Real GDP(Annual percent change)
Average Projections2001ndash10 2011 2012 2013 2014 2015 2016 2017 2018 2019 2020 2024
Emerging and Developing Asia 85 79 70 69 68 68 67 66 64 59 60 60Bangladesh 58 65 63 60 63 68 72 76 79 78 74 73Bhutan 84 97 64 36 40 62 74 63 46 55 72 64Brunei Darussalam 14 37 09 ndash21 ndash25 ndash04 ndash25 13 01 18 47 21Cambodia 80 71 73 74 71 70 69 70 75 70 68 65China 105 95 79 78 73 69 67 68 66 61 58 55Fiji 13 27 14 47 56 47 25 54 35 27 30 32India1 75 66 55 64 74 80 82 72 68 61 70 73Indonesia 54 62 60 56 50 49 50 51 52 50 51 53Kiribati 07 16 47 42 ndash07 104 51 03 23 23 23 18Lao PDR 72 80 78 80 76 73 70 68 63 64 65 68Malaysia 46 53 55 47 60 50 44 57 47 45 44 49Maldives 65 84 24 73 73 29 73 69 75 65 60 55Marshall Islands 20 11 32 28 ndash07 ndash06 18 45 26 24 23 12Micronesia 02 33 ndash20 ndash39 ndash22 50 07 24 12 14 08 06Mongolia 63 173 123 116 79 24 12 53 69 65 54 50Myanmar 107 55 65 79 82 75 52 63 68 62 63 64Nauru 108 104 310 272 34 30 ndash55 ndash15 15 07 20Nepal 40 34 48 41 60 33 06 82 67 71 63 50Palau 03 49 18 ndash14 44 101 08 ndash35 17 03 18 20Papua New Guinea 37 11 47 38 135 95 41 27 ndash11 50 26 35Philippines 48 37 67 71 61 61 69 67 62 57 62 65Samoa 25 56 04 ndash19 12 17 72 27 09 34 44 22Solomon Islands 34 132 46 30 23 25 32 37 39 27 29 29Sri Lanka 51 84 91 34 50 50 45 34 32 27 35 48Thailand 46 08 72 27 10 31 34 40 41 29 30 36Timor-Leste2 43 67 57 24 47 35 51 ndash35 ndash02 45 50 48Tonga 12 20 ndash11 ndash06 27 36 47 27 15 35 37 20Tuvalu 09 79 ndash38 46 13 91 30 32 43 41 44 27Vanuatu 29 12 18 20 23 02 35 44 32 38 31 29Vietnam 68 62 52 54 60 67 62 68 71 65 65 65Emerging and Developing Europe 44 58 30 31 19 08 18 39 31 18 25 25Albania 56 25 14 10 18 22 33 38 41 30 40 40Belarus 74 55 17 10 17 ndash38 ndash25 25 30 15 03 ndash04Bosnia and Herzegovina 39 09 ndash07 24 11 31 32 31 36 28 26 30Bulgaria 46 19 00 05 18 35 39 38 31 37 32 28Croatia 25 ndash03 ndash23 ndash05 ndash01 24 35 29 26 30 27 20Hungary 20 17 ndash16 21 42 35 23 41 49 46 33 22Kosovo 46 44 28 34 12 41 41 42 38 42 40 40Moldova 51 58 ndash06 90 50 ndash03 44 47 40 35 38 38Montenegro 33 32 ndash27 35 18 34 29 47 49 30 25 29North Macedonia 30 23 ndash05 29 36 39 28 02 27 32 34 35Poland 39 50 16 14 33 38 31 49 51 40 31 25Romania 42 20 21 35 34 39 48 70 41 40 35 30Russia 48 51 37 18 07 ndash23 03 16 23 11 19 18Serbia 50 20 ndash07 29 ndash16 18 33 20 43 35 40 40Turkey 40 111 48 85 52 61 32 75 28 02 30 35Ukraine1 39 55 02 00 ndash66 ndash98 24 25 33 30 30 33Latin America and the Caribbean 32 46 29 29 13 03 ndash06 12 10 02 18 27Antigua and Barbuda 14 ndash20 34 ndash06 38 38 55 31 74 40 33 20Argentina 34 60 ndash10 24 ndash25 27 ndash21 27 ndash25 ndash31 ndash13 32Aruba ndash08 35 ndash14 42 09 ndash04 05 23 12 07 10 11The Bahamas 07 06 31 ndash30 07 06 04 01 16 09 ndash06 16Barbados 07 ndash07 ndash04 ndash14 ndash01 24 25 05 ndash06 ndash01 06 18Belize 39 22 29 09 37 34 ndash06 14 30 27 21 17Bolivia 38 52 51 68 55 49 43 42 42 39 38 37Brazil 37 40 19 30 05 ndash36 ndash33 11 11 09 20 23Chile 42 61 53 40 18 23 17 13 40 25 30 32Colombia 40 74 39 46 47 30 21 14 26 34 36 37
W O R L D E C O N O M I C O U T L O O K G L O B A L M A N U F A C T U R I N G D O W N T U R N R I S I N G T R A D E B A R R I E R S
152 International Monetary Fund | October 2019
Average Projections2001ndash10 2011 2012 2013 2014 2015 2016 2017 2018 2019 2020 2024
Latin America and the Caribbean (continued) 32 46 29 29 13 03 ndash06 12 10 02 18 27
Costa Rica 43 43 48 23 35 36 42 34 26 20 25 35Dominica 24 ndash02 ndash11 ndash06 44 ndash26 25 ndash95 05 94 49 15Dominican Republic 46 31 27 49 71 69 67 47 70 50 52 50Ecuador 41 79 56 49 38 01 ndash12 24 14 ndash05 05 25El Salvador 16 38 28 22 17 24 25 23 25 25 23 22Grenada 18 08 ndash12 24 73 64 37 44 42 31 27 30Guatemala 33 42 30 37 42 41 31 28 31 34 35 35Guyana 24 54 50 50 39 31 34 21 41 44 856 32Haiti 01 55 29 42 28 12 15 12 15 01 12 15Honduras 41 38 41 28 31 38 38 49 37 34 35 39Jamaica 06 14 ndash05 02 06 09 15 07 16 11 10 22Mexico 15 37 36 14 28 33 29 21 20 04 13 24Nicaragua 29 63 65 49 48 48 46 47 ndash38 ndash50 ndash08 15Panama 59 113 98 69 51 57 50 53 37 43 55 55Paraguay 37 42 ndash05 84 49 31 43 50 37 10 40 39Peru 56 65 60 58 24 33 40 25 40 26 36 38St Kitts and Nevis 22 32 ndash44 64 72 16 18 09 46 35 35 27St Lucia 20 41 ndash04 ndash20 13 02 32 26 09 15 32 15St Vincent and the Grenadines 26 02 13 25 02 08 08 07 20 23 23 23Suriname 50 58 27 29 03 ndash34 ndash56 17 20 22 25 26Trinidad and Tobago1 57 ndash02 ndash07 20 ndash10 18 ndash65 ndash19 03 00 15 17Uruguay 32 52 35 46 32 04 17 26 16 04 23 24Venezuela 31 42 56 13 ndash39 ndash62 ndash170 ndash157 ndash180 ndash350 ndash100 Middle East and Central Asia 53 46 49 30 31 26 50 23 19 09 29 33Afghanistan 65 140 57 27 10 22 27 27 30 35 55Algeria 39 28 34 28 38 37 32 13 14 26 24 08Armenia 81 47 71 33 36 33 02 75 52 60 48 45Azerbaijan 144 ndash16 22 58 28 10 ndash31 02 10 27 21 24Bahrain 54 20 37 54 44 29 35 38 18 20 21 30Djibouti 35 73 48 50 71 77 69 51 55 60 60 60Egypt 49 18 22 33 29 44 43 41 53 55 59 60Georgia 63 72 64 34 46 29 28 48 47 46 48 52Iran 47 31 ndash77 ndash03 32 ndash16 125 37 ndash48 ndash95 00 11Iraq 121 75 139 76 07 25 152 ndash25 ndash06 34 47 21Jordan 60 26 27 28 31 24 20 21 19 22 24 30Kazakhstan 83 74 48 60 42 12 11 41 41 38 39 35Kuwait 46 96 66 12 05 06 29 ndash35 12 06 31 29Kyrgyz Republic 40 60 ndash01 109 40 39 43 47 35 38 34 34Lebanon 57 09 27 26 19 04 16 06 02 02 09 27Libya1 18 ndash667 1247 ndash368 ndash530 ndash130 ndash74 640 179 ndash191 00 00Mauritania 49 47 58 61 56 04 18 31 36 66 59 58Morocco 49 52 30 45 27 45 11 42 30 27 37 45Oman 30 26 91 51 14 47 49 03 18 00 37 16Pakistan 45 36 38 37 41 41 46 52 55 33 24 50Qatar 131 134 47 44 40 37 21 16 15 20 28 28Saudi Arabia 34 100 54 27 37 41 17 ndash07 24 02 22 25Somalia 12 19 24 35 29 14 28 29 32 35Sudan3 51 ndash28 ndash170 20 47 19 29 17 ndash22 ndash26 ndash15 14Syria4 45 Tajikistan 80 74 75 74 67 60 69 71 73 50 45 40Tunisia 42 ndash19 40 29 30 12 13 18 25 15 24 44Turkmenistan 132 147 111 102 103 65 62 65 62 63 60 58United Arab Emirates 39 69 45 51 44 51 30 05 17 16 25 25Uzbekistan 69 83 82 80 72 74 61 45 51 55 60 60Yemen 43 ndash127 24 48 ndash02 ndash280 ndash94 ndash51 08 21 20 36
Table A4 Emerging Market and Developing Economies Real GDP (continued)(Annual percent change)
S TAT I S T I C A L A P P E N D I X
International Monetary Fund | October 2019 153
Average Projections2001ndash10 2011 2012 2013 2014 2015 2016 2017 2018 2019 2020 2024
Sub-Saharan Africa 59 53 47 52 51 31 14 30 32 32 36 42Angola 88 35 85 50 48 09 ndash26 ndash02 ndash12 ndash03 12 38Benin 39 30 48 72 64 18 33 57 67 66 67 67Botswana 41 60 45 113 41 ndash17 43 29 45 35 43 39Burkina Faso 59 66 65 58 43 39 59 63 68 60 60 60Burundi 37 40 44 59 45 ndash40 ndash10 00 01 04 05 05Cabo Verde 54 40 11 08 06 10 47 37 51 50 50 50Cameroon 39 41 45 54 59 57 46 35 41 40 42 54Central African Republic 24 42 51 ndash364 01 43 47 45 38 45 50 50Chad 98 01 88 58 69 18 ndash56 ndash24 24 23 54 37Comoros 31 41 32 45 21 11 26 30 30 13 42 35Democratic Republic of the Congo 47 69 71 85 95 69 24 37 58 43 39 46Republic of Congo 47 34 38 33 68 26 ndash28 ndash18 16 40 28 23Cocircte drsquoIvoire 11 ndash49 109 93 88 88 80 77 74 75 73 64Equatorial Guinea 152 65 83 ndash41 04 ndash91 ndash88 ndash47 ndash57 ndash46 ndash50 ndash28Eritrea 13 257 19 ndash105 309 ndash206 74 ndash96 122 31 39 48Eswatini 35 22 54 39 09 23 13 20 24 13 05 05Ethiopia 85 114 87 99 103 104 80 101 77 74 72 65Gabon 14 71 53 55 44 39 21 05 08 29 34 45The Gambia 35 ndash81 52 29 ndash14 41 19 48 65 65 64 48Ghana 58 174 90 79 29 22 34 81 63 75 56 51Guinea 31 56 59 39 37 38 108 100 58 59 60 50Guinea-Bissau 25 81 ndash17 33 10 61 63 59 38 46 49 53Kenya 42 61 46 59 54 57 59 49 63 56 60 59Lesotho 39 67 49 22 27 21 27 05 28 28 ndash02 13Liberia 20 77 84 88 07 00 ndash16 25 12 04 16 37Madagascar 26 14 30 22 33 31 42 43 52 52 53 48Malawi 49 49 19 52 57 29 23 40 32 45 51 65Mali 58 32 ndash08 23 71 62 58 54 47 50 50 48Mauritius 40 41 35 34 37 36 38 38 38 37 38 40Mozambique 82 71 72 71 74 66 38 37 33 18 60 115Namibia 40 51 51 56 64 61 11 ndash09 ndash01 ndash02 16 30Niger 54 22 118 53 75 43 49 49 65 63 60 68Nigeria 89 49 43 54 63 27 ndash16 08 19 23 25 26Rwanda 82 80 86 47 62 89 60 61 86 78 81 75Satildeo Tomeacute and Priacutencipe 52 44 31 48 65 38 42 39 27 27 35 45Senegal 40 15 51 28 66 64 64 71 67 60 68 80Seychelles 20 54 37 60 45 49 45 43 41 35 33 36Sierra Leone 89 63 152 207 46 ndash205 64 38 35 50 47 47South Africa 35 33 22 25 18 12 04 14 08 07 11 18South Sudan ndash524 293 29 ndash02 ndash167 ndash55 ndash11 79 82 47Tanzania 66 79 51 68 67 62 69 68 70 52 57 65Togo 22 64 65 61 59 57 56 44 49 51 53 54Uganda 79 68 22 47 46 57 23 50 61 62 62 101Zambia 74 56 76 51 47 29 38 35 37 20 17 15Zimbabwe5 ndash39 142 167 20 24 18 07 47 35 ndash71 27 221See country-specific notes for India Libya Trinidad and Tobago and Ukraine in the ldquoCountry Notesrdquo section of the Statistical Appendix2In this table only the data for Timor-Leste are based on non-oil GDP3Data for 2011 exclude South Sudan after July 9 Data for 2012 and onward pertain to the current Sudan4Data for Syria are excluded for 2011 onward owing to the uncertain political situation5The Zimbabwe dollar ceased circulating in early 2009 Data are based on IMF staff estimates of price and exchange rate developments in US dollars IMF staff estimates of US dollar values may differ from authoritiesrsquo estimates Real GDP is in constant 2009 prices
Table A4 Emerging Market and Developing Economies Real GDP (continued)(Annual percent change)
W O R L D E C O N O M I C O U T L O O K G L O B A L M A N U F A C T U R I N G D O W N T U R N R I S I N G T R A D E B A R R I E R S
154 International Monetary Fund | October 2019
Table A5 Summary of Inflation(Percent)
Average Projections2001ndash10 2011 2012 2013 2014 2015 2016 2017 2018 2019 2020 2024
GDP DeflatorsAdvanced Economies 17 14 13 13 15 12 10 14 16 15 16 18United States 21 21 19 18 19 10 10 19 24 18 20 20Euro Area 19 11 13 12 09 13 08 09 13 15 16 19Japan ndash11 ndash17 ndash08 ndash03 17 21 03 ndash02 ndash01 07 10 09Other Advanced Economies1 21 19 12 15 13 11 13 20 15 14 12 19
Consumer PricesAdvanced Economies 20 27 20 14 14 03 08 17 20 15 18 20United States 24 31 21 15 16 01 13 21 24 18 23 23Euro Area2 21 27 25 13 04 02 02 15 18 12 14 18Japan ndash03 ndash03 ndash01 03 28 08 ndash01 05 10 10 13 13Other Advanced Economies1 21 33 21 17 15 05 09 18 19 14 16 20Emerging Market and Developing Economies3 66 71 58 55 47 47 43 43 48 47 48 43
Regional GroupsEmerging and Developing Asia 43 65 46 46 34 27 28 24 26 27 30 33Emerging and Developing Europe 115 79 62 56 65 105 55 54 62 68 56 53Latin America and the Caribbean 58 52 46 46 49 55 56 60 62 72 67 43Middle East and Central Asia 72 92 94 88 66 55 55 67 99 82 91 71Sub-Saharan Africa 99 93 92 65 64 69 108 109 85 84 80 66Analytical Groups
By Source of Export EarningsFuel 97 86 80 81 64 86 71 54 70 65 68 62Nonfuel 57 67 53 49 43 38 37 40 43 44 44 39
Of Which Primary Products4 65 69 69 65 70 52 61 111 134 165 156 88By External Financing SourceNet Debtor Economies 74 76 69 62 56 54 51 55 54 51 51 45Net Debtor Economies by
Debt-Servicing ExperienceEconomies with Arrears andor
Rescheduling during 2014ndash18 100 103 80 68 101 143 112 184 175 140 117 83Other GroupsEuropean Union 24 31 26 15 05 01 02 17 19 15 17 20Low-Income Developing Countries 97 119 97 80 72 69 91 97 91 88 88 73Middle East and North Africa 69 87 97 94 65 56 52 67 110 84 89 78
MemorandumMedian Inflation RateAdvanced Economies 22 32 26 14 07 01 06 16 17 15 16 20Emerging Market and Developing Economies3 52 55 46 38 31 27 27 33 30 29 32 301Excludes the United States euro area countries and Japan2Based on Eurostatrsquos harmonized index of consumer prices3Excludes Venezuela but includes Argentina from 2017 onward See country-specific notes for Venezuela and Argentina in the ldquoCountry Notesrdquo section of the Statistical Appendix4Includes Argentina from 2017 onward See country-specific note for Argentina in the ldquoCountry Notesrdquo section of the Statistical Appendix
S TAT I S T I C A L A P P E N D I X
International Monetary Fund | October 2019 155
Table A6 Advanced Economies Consumer Prices1
(Annual percent change)End of Period2
Average Projections Projections2001ndash10 2011 2012 2013 2014 2015 2016 2017 2018 2019 2020 2024 2018 2019 2020
Advanced Economies 20 27 20 14 14 03 08 17 20 15 18 20 16 17 17United States 24 31 21 15 16 01 13 21 24 18 23 23 19 22 24Euro Area3 21 27 25 13 04 02 02 15 18 12 14 18 15 13 13
Germany 16 25 22 16 08 07 04 17 19 15 17 21 18 18 17France 19 23 22 10 06 01 03 12 21 12 13 17 20 10 14Italy 22 29 33 12 02 01 ndash01 13 12 07 10 15 12 07 10Spain 28 32 24 14 ndash02 ndash05 ndash02 20 17 07 10 18 12 07 11Netherlands 21 25 28 26 03 02 01 13 16 25 16 20 18 21 17Belgium 21 34 26 12 05 06 18 22 23 15 13 18 22 11 13Austria 19 35 26 21 15 08 10 22 21 15 19 20 17 16 19Ireland 22 12 19 05 03 00 ndash02 03 07 12 15 20 08 14 15Portugal 25 36 28 04 ndash02 05 06 16 12 09 12 17 06 43 ndash31Greece 34 31 10 ndash09 ndash14 ndash11 00 11 08 06 09 18 06 09 09Finland 17 33 32 22 12 ndash02 04 08 12 12 13 18 13 11 13Slovak Republic 41 41 37 15 ndash01 ndash03 ndash05 14 25 26 21 20 19 24 20Lithuania 30 41 32 12 02 ndash07 07 37 25 23 22 22 18 24 22Slovenia 42 18 26 18 02 ndash05 ndash01 14 17 18 19 20 14 22 19Luxembourg 26 37 29 17 07 01 00 21 20 17 17 19 19 20 16Latvia 54 42 23 00 07 02 01 29 26 30 26 22 25 21 23Estonia 42 51 42 32 05 01 08 37 34 25 24 21 33 25 24Cyprus 24 35 31 04 ndash03 ndash15 ndash12 07 08 07 16 20 11 12 13Malta 24 25 32 10 08 12 09 13 17 17 18 20 12 20 19
Japan ndash03 ndash03 ndash01 03 28 08 ndash01 05 10 10 13 13 08 16 02United Kingdom 21 45 28 26 15 00 07 27 25 18 19 20 23 16 21Korea 32 40 22 13 13 07 10 19 15 05 09 20 13 07 09Canada 20 29 15 09 19 11 14 16 22 20 20 20 21 22 19Australia 30 34 17 25 25 15 13 20 20 16 18 25 18 18 17Taiwan Province of China 09 14 16 10 13 ndash06 10 11 15 08 11 14 ndash01 08 11Singapore 16 52 46 24 10 ndash05 ndash05 06 04 07 10 15 05 07 11Switzerland 09 02 ndash07 ndash02 00 ndash11 ndash04 05 09 06 06 10 07 03 09Sweden 19 14 09 04 02 07 11 19 20 17 15 19 22 16 14Hong Kong SAR 04 53 41 43 44 30 24 15 24 30 26 25 24 30 26Czech Republic 25 19 33 14 04 03 07 25 22 26 23 20 20 23 20Norway 20 13 07 21 20 22 36 19 28 23 19 20 35 19 19Israel 21 35 17 15 05 ndash06 ndash05 02 08 10 13 20 08 11 18Denmark 20 27 24 05 04 02 00 11 07 13 15 20 07 12 14New Zealand 26 41 10 11 12 03 06 19 16 14 19 20 19 15 20Puerto Rico 27 29 13 11 06 ndash08 ndash03 18 13 ndash01 10 12 06 ndash01 10Macao SAR 58 61 55 60 46 24 12 30 24 27 30 29 24 27Iceland 62 40 52 39 20 16 17 18 27 28 25 25 37 26 26San Marino 20 28 16 11 01 06 10 15 13 15 17 15 13 15Memorandum Major Advanced Economies 18 26 19 13 15 03 08 18 21 16 19 20 17 18 181Movements in consumer prices are shown as annual averages2Monthly year-over-year changes and for several countries on a quarterly basis3Based on Eurostatrsquos harmonized index of consumer prices
W O R L D E C O N O M I C O U T L O O K G L O B A L M A N U F A C T U R I N G D O W N T U R N R I S I N G T R A D E B A R R I E R S
156 International Monetary Fund | October 2019
Table A7 Emerging Market and Developing Economies Consumer Prices1
(Annual percent change)End of Period2
Average Projections Projections2001ndash10 2011 2012 2013 2014 2015 2016 2017 2018 2019 2020 2024 2018 2019 2020
Emerging and Developing Asia 43 65 46 46 34 27 28 24 26 27 30 33 23 28 30Bangladesh 63 115 62 75 70 62 57 56 56 55 55 55 55 55 55Bhutan 46 73 93 113 95 76 76 55 35 36 42 45 32 31 39Brunei Darussalam 05 01 01 04 ndash02 ndash04 ndash07 ndash02 01 01 02 02 00 01 02Cambodia 51 55 29 30 39 12 30 29 24 22 25 30 16 23 25China 21 54 26 26 20 14 20 16 21 23 24 30 19 22 24Fiji 37 73 34 29 05 14 39 34 41 35 30 30 49 35 30India 65 95 100 94 58 49 45 36 34 34 41 40 25 39 41Indonesia 86 53 40 64 64 64 35 38 32 32 33 30 31 34 31Kiribati 31 15 ndash30 ndash15 21 06 19 04 19 17 24 26 14 17 22Lao PDR 76 76 43 64 41 13 18 07 20 31 33 31 15 29 31Malaysia 22 32 17 21 31 21 21 38 10 10 21 23 02 19 21Maldives 40 113 109 38 21 19 08 23 14 15 23 20 05 21 24Marshall Islands 54 43 19 11 ndash22 ndash15 00 08 06 18 21 08 06 18Micronesia 32 41 63 23 07 00 ndash09 01 15 18 20 20 15 18 20Mongolia 88 77 150 86 129 59 05 46 76 90 83 71 97 84 81Myanmar 195 68 04 58 51 73 91 46 59 78 67 55 86 72 68Nauru ndash34 03 ndash11 03 98 82 51 05 25 23 20 34 15 22Nepal 61 96 83 99 90 72 99 45 42 45 61 53 46 62 60Palau 26 26 54 28 40 22 ndash13 09 16 22 20 20 14 22 20Papua New Guinea 65 44 45 50 52 60 67 49 52 39 44 48 48 35 48Philippines 52 48 30 26 36 07 13 29 52 25 23 30 51 16 30Samoa 57 29 62 ndash02 ndash12 19 01 13 37 29 27 28 58 40 29Solomon Islands 85 74 59 54 52 ndash06 05 05 27 04 22 43 32 32 35Sri Lanka 97 67 75 69 28 22 40 66 43 41 45 50 28 42 46Thailand 26 38 30 22 19 ndash09 02 07 11 09 09 20 04 13 12Timor-Leste 45 132 109 95 08 06 ndash15 05 23 25 31 40 21 28 35Tonga 77 63 11 21 12 ndash11 26 74 29 38 39 25 48 28 49Tuvalu 29 05 14 20 11 31 35 41 21 21 32 20 23 21 32Vanuatu 29 09 13 15 08 25 08 31 29 20 22 26 26 26 22Vietnam 77 187 91 66 41 06 27 35 35 36 37 40 30 37 38Emerging and Developing Europe 115 79 62 56 65 105 55 54 62 68 56 53 74 60 55Albania 30 34 20 19 16 19 13 20 20 18 20 30 18 18 22Belarus 201 532 592 183 181 135 118 60 49 54 48 40 56 50 45Bosnia and Herzegovina 28 40 21 ndash01 ndash09 ndash10 ndash16 08 14 11 14 19 16 12 14Bulgaria3 60 34 24 04 ndash16 ndash11 ndash13 12 26 25 23 22 23 25 22Croatia 28 23 34 22 ndash02 ndash05 ndash11 11 15 10 12 15 09 12 13Hungary 56 39 57 17 ndash02 ndash01 04 24 28 34 34 30 27 32 34Kosovo 28 73 25 18 04 ndash05 03 15 11 28 15 20 29 16 17Moldova 95 76 46 46 51 96 64 66 31 49 57 50 09 75 50Montenegro 73 35 41 22 ndash07 15 ndash03 24 26 11 19 19 17 23 16North Macedonia 21 39 33 28 ndash03 ndash03 ndash02 14 15 13 17 22 08 14 18Poland 28 43 37 09 00 ndash09 ndash06 20 16 24 35 28 11 33 35Romania 121 58 33 40 11 ndash06 ndash16 13 46 42 33 25 33 45 35Russia 125 84 51 68 78 155 70 37 29 47 35 40 43 38 37Serbia 147 111 73 77 21 14 11 31 20 22 19 30 20 20 22Turkey 175 65 89 75 89 77 78 111 163 157 126 110 203 135 120Ukraine4 111 80 06 ndash03 121 487 139 144 109 87 59 50 98 70 56Latin America and the Caribbean5 58 52 46 46 49 55 56 60 62 72 67 43 71 73 60Antigua and Barbuda 22 35 34 11 11 10 ndash05 24 12 16 20 20 17 20 20Argentina4 95 98 100 106 257 343 544 510 170 476 573 392Aruba 33 44 06 ndash24 04 05 ndash09 ndash05 36 30 20 22 46 18 27The Bahamas 23 31 19 04 12 19 ndash03 16 22 18 26 22 20 28 24Barbados 41 94 45 18 18 ndash11 15 44 37 19 18 23 06 14 23Belize 25 17 12 05 12 ndash09 07 11 03 12 16 20 ndash01 24 08Bolivia 46 99 45 57 58 41 36 28 23 17 31 50 15 23 40Brazil 66 66 54 62 63 90 87 34 37 38 35 35 37 36 39Chile 32 33 30 18 47 43 38 22 23 22 28 30 21 26 29Colombia 56 34 32 20 29 50 75 43 32 36 37 30 32 39 31
S TAT I S T I C A L A P P E N D I X
International Monetary Fund | October 2019 157
Table A7 Emerging Market and Developing Economies Consumer Prices1 (continued)(Annual percent change)
End of Period2
Average Projections Projections2001ndash10 2011 2012 2013 2014 2015 2016 2017 2018 2019 2020 2024 2018 2019 2020
Latin America and the Caribbean (continued)5 58 52 46 46 49 55 56 60 62 72 67 43 71 73 60
Costa Rica 103 49 45 52 45 08 00 16 22 27 31 30 20 32 30Dominica 22 11 14 00 08 ndash09 00 06 14 16 18 20 14 18 18Dominican Republic 121 85 37 48 30 08 16 33 36 18 41 40 12 30 40Ecuador 81 45 51 27 36 40 17 04 ndash02 04 12 11 03 05 11El Salvador 34 51 17 08 11 ndash07 06 10 11 09 11 10 04 14 12Grenada 30 30 24 00 ndash10 ndash06 17 09 08 10 16 19 14 10 19Guatemala 68 62 38 43 34 24 44 44 38 42 42 43 23 38 39Guyana 59 44 24 19 07 ndash09 08 19 13 21 33 28 16 27 35Haiti 140 74 68 68 39 75 134 147 129 176 171 59 133 197 150Honduras 76 68 52 52 61 32 27 39 43 44 42 40 42 44 42Jamaica 118 75 69 94 83 37 23 44 37 36 46 50 24 47 45Mexico 47 34 41 38 40 27 28 60 49 38 31 30 48 32 30Nicaragua 83 81 72 71 60 40 35 39 50 56 42 50 39 70 42Panama 26 59 57 40 26 01 07 09 08 00 15 20 02 08 18Paraguay 78 83 37 27 50 31 41 36 40 35 37 37 32 37 37Peru 24 34 37 28 32 35 36 28 13 22 19 20 22 19 20St Kitts and Nevis 33 58 08 11 02 ndash23 ndash03 00 ndash02 06 20 20 ndash07 20 20St Lucia 26 28 42 15 35 ndash10 ndash31 01 20 21 23 20 22 21 22St Vincent and the
Grenadines 29 32 26 08 02 ndash17 ndash02 22 23 14 20 20 14 20 20Suriname 131 177 50 19 34 69 555 220 69 55 58 48 54 71 48Trinidad and Tobago 70 51 93 52 57 47 31 19 10 09 15 26 10 09 15Uruguay 87 81 81 86 89 87 96 62 76 76 72 70 80 75 70Venezuela 4 220 261 211 406 622 1217 2549 4381 653741 200000 500000 1300602 200000 500000Middle East and
Central Asia 72 92 94 88 66 55 55 67 99 82 91 71 111 79 89Afghanistan 118 64 74 47 ndash07 44 50 06 26 45 50 08 45 45Algeria 36 45 89 33 29 48 64 56 43 20 41 87 27 39 32Armenia 44 77 25 58 30 37 ndash14 10 25 17 25 41 19 15 33Azerbaijan 74 78 10 24 14 40 124 128 23 28 30 35 23 28 30Bahrain 18 ndash04 28 33 27 18 28 14 21 14 28 22 19 20 28Djibouti 37 52 42 11 13 ndash08 27 06 01 22 20 20 20 20 20Egypt 79 111 86 69 101 110 102 235 209 139 100 71 144 94 87Georgia 66 85 ndash09 ndash05 31 40 21 60 26 42 38 30 15 54 30Iran 147 215 306 347 156 119 91 96 305 357 310 250 475 311 300Iraq 56 61 19 22 14 05 01 04 ndash03 10 20 ndash01 03 12Jordan 40 42 45 48 29 ndash09 ndash08 33 45 20 25 25 36 25 25Kazakhstan 86 84 51 58 67 67 146 74 60 53 52 40 53 57 47Kuwait 32 49 32 27 31 37 35 15 06 15 22 25 04 18 30Kyrgyz Republic 74 166 28 66 75 65 04 32 15 13 50 50 05 40 51Lebanon 26 50 66 48 18 ndash37 ndash08 45 61 31 26 24 40 34 24Libya4 04 159 61 26 24 98 259 285 93 42 89 65 ndash45 120 65Mauritania 65 57 49 41 38 05 15 23 31 30 34 40 32 28 40Morocco 18 09 13 19 04 15 16 08 19 06 11 20 01 06 11Oman 29 40 29 12 10 01 11 16 09 08 18 25 09 08 18Pakistan 81 137 110 74 86 45 29 41 39 73 130 50 52 89 118Qatar 51 20 18 32 34 18 27 04 02 ndash04 22 20 Saudi Arabia 21 38 29 35 22 13 20 ndash09 25 ndash11 22 21 23 ndash11 22Somalia 32 40 30Sudan6 108 181 356 365 369 169 178 324 633 504 621 747 729 569 669Syria7 57 Tajikistan 135 124 58 50 61 58 59 73 38 74 71 65 54 70 68Tunisia 33 32 46 53 46 44 36 53 73 66 54 40 75 59 55Turkmenistan 72 53 53 68 60 74 36 80 132 134 130 60 72 90 80United Arab Emirates 55 09 07 11 23 41 16 20 31 ndash15 12 21 31 ndash15 12Uzbekistan 145 124 119 117 91 85 88 139 175 147 141 76 143 156 124Yemen 109 195 99 110 82 220 213 304 276 147 355 50 143 150 363
W O R L D E C O N O M I C O U T L O O K G L O B A L M A N U F A C T U R I N G D O W N T U R N R I S I N G T R A D E B A R R I E R S
158 International Monetary Fund | October 2019
Table A7 Emerging Market and Developing Economies Consumer Prices1 (continued)(Annual percent change)
End of Period2
Average Projections Projections2001ndash10 2011 2012 2013 2014 2015 2016 2017 2018 2019 2020 2024 2018 2019 2020
Sub-Saharan Africa 99 93 92 65 64 69 108 109 85 84 80 66 79 90 74Angola 424 135 103 88 73 92 307 298 196 172 150 60 186 170 120Benin 31 27 67 10 ndash11 02 ndash08 18 08 ndash03 10 20 ndash01 05 11Botswana 86 85 75 59 44 31 28 33 32 30 35 40 35 27 35Burkina Faso 28 28 38 05 ndash03 09 ndash02 04 20 11 14 20 03 20 20Burundi 89 96 182 79 44 56 55 166 12 73 90 90 53 90 90Cabo Verde 24 45 25 15 ndash02 01 ndash14 08 13 12 16 18 10 10 16Cameroon 26 29 24 21 19 27 09 06 11 21 22 20 20 23 22Central African Republic 33 12 59 66 116 45 46 45 16 30 26 25 46 30 25Chad 32 20 75 02 17 48 ndash16 ndash09 40 30 30 42 44 91 ndash64Comoros 42 22 59 04 00 09 08 01 17 32 14 19 09 48 06Democratic Republic of the Congo 368 149 09 09 12 07 32 358 293 55 50 50 72 55 50Republic of Congo 29 18 50 46 09 32 32 04 12 15 18 30 09 19 25Cocircte drsquoIvoire 29 49 13 26 04 12 07 07 04 10 20 20 11 10 20Equatorial Guinea 56 48 34 32 43 17 14 07 13 09 17 20 26 16 17Eritrea 180 59 48 59 100 285 ndash56 ndash133 ndash144 ndash276 00 20 ndash293 ndash01 00Eswatini 71 61 89 56 57 50 78 62 48 28 40 70 53 23 44Ethiopia 111 332 241 81 74 96 66 107 138 146 127 80 106 145 100Gabon 12 13 27 05 45 ndash01 21 27 48 30 30 25 63 30 30The Gambia 70 48 46 52 63 68 72 80 65 69 65 50 64 70 60Ghana 159 77 71 117 155 172 175 124 98 93 92 80 94 93 90Guinea 160 214 152 119 97 82 82 89 98 89 83 78 99 86 81Guinea-Bissau 23 51 21 08 ndash10 15 15 11 14 ndash26 13 25 59 15 ndash14Kenya 70 140 94 57 69 66 63 80 47 56 53 50 57 62 62Lesotho 70 60 55 50 46 43 62 45 47 59 57 55 52 60 53Liberia 100 85 68 76 99 77 88 124 235 222 205 135 285 206 190Madagascar 102 95 57 58 61 74 67 83 73 67 63 50 61 64 60Malawi 81 76 213 283 238 219 217 115 92 88 84 50 99 86 78Mali 27 31 53 ndash24 27 14 ndash18 18 17 02 13 19 10 10 15Mauritius 57 65 39 35 32 13 10 37 32 09 23 33 18 20 27Mozambique 110 112 26 43 26 36 199 151 39 56 76 55 35 85 65Namibia 71 50 67 56 53 34 67 61 43 48 55 55 51 48 55Niger 25 29 05 23 ndash09 10 02 02 27 ndash13 22 20 16 04 20Nigeria 129 108 122 85 80 90 157 165 121 113 117 110 114 117 117Rwanda 79 57 63 42 18 25 57 48 14 35 50 50 11 50 50Satildeo Tomeacute and Priacutencipe 162 143 106 81 70 52 54 57 79 88 89 30 90 78 100Senegal 21 34 14 07 ndash11 01 08 13 05 10 15 15 13 20 15Seychelles 76 26 71 43 14 40 ndash10 29 37 20 18 30 34 23 19Sierra Leone 83 68 66 55 46 67 109 182 169 157 130 83 175 140 120South Africa 59 50 56 58 61 46 63 53 46 44 52 53 49 47 53South Sudan 451 00 17 528 3798 1879 835 245 169 80 401 359 108Tanzania 66 127 160 79 61 56 52 53 35 36 42 50 33 41 43Togo 26 36 26 18 02 18 09 ndash02 09 14 20 20 20 17 22Uganda 64 150 127 49 31 54 55 56 26 32 38 50 22 35 39Zambia 154 87 66 70 78 101 179 66 70 99 100 80 79 120 80Zimbabwe8 ndash56 35 37 16 ndash02 ndash24 ndash16 09 106 1618 497 30 421 1829 941Movements in consumer prices are shown as annual averages2Monthly year-over-year changes and for several countries on a quarterly basis3Based on Eurostatrsquos harmonized index of consumer prices4See country-specific notes for Argentina Libya Ukraine and Venezuela in the ldquoCountry Notesrdquo section of the Statistical Appendix5Excludes Venezuela but includes Argentina from 2017 onward See country-specific notes for Venezuela and Argentina in the ldquoCountry Notesrdquo section of the Statistical Appendix6Data for 2011 exclude South Sudan after July 9 Data for 2012 and onward pertain to the current Sudan7Data for Syria are excluded for 2011 onward owing to the uncertain political situation8The Zimbabwe dollar ceased circulating in early 2009 Data are based on IMF staff estimates of price and exchange rate developments in US dollars IMF staff estimates of US dollar values may differ from authoritiesrsquo estimates
S TAT I S T I C A L A P P E N D I X
International Monetary Fund | October 2019 159
Table A8 Major Advanced Economies General Government Fiscal Balances and Debt1(Percent of GDP unless noted otherwise)
Average Projections2001ndash10 2013 2014 2015 2016 2017 2018 2019 2020 2024
Major Advanced EconomiesNet LendingBorrowing ndash46 ndash43 ndash36 ndash30 ndash32 ndash31 ndash36 ndash38 ndash36 ndash33Output Gap2 ndash04 ndash18 ndash12 ndash06 ndash05 02 08 08 09 08Structural Balance2 ndash43 ndash38 ndash32 ndash29 ndash32 ndash33 ndash38 ndash41 ndash40 ndash36
United StatesNet LendingBorrowing3 ndash52 ndash46 ndash40 ndash36 ndash43 ndash45 ndash57 ndash56 ndash55 ndash51Output Gap2 ndash04 ndash19 ndash11 00 00 06 15 18 20 15Structural Balance2 ndash47 ndash45 ndash38 ndash36 ndash44 ndash48 ndash60 ndash63 ndash63 ndash57Net Debt 478 808 804 803 816 816 800 809 839 944Gross Debt 683 1048 1044 1047 1068 1060 1043 1062 1080 1158Euro AreaNet LendingBorrowing ndash30 ndash31 ndash25 ndash20 ndash16 ndash10 ndash05 ndash09 ndash09 ndash08Output Gap2 04 ndash29 ndash25 ndash20 ndash13 ndash03 03 01 00 00Structural Balance2 ndash32 ndash12 ndash09 ndash08 ndash07 ndash07 ndash06 ndash07 ndash09 ndash08Net Debt 565 751 754 742 738 718 700 689 676 627Gross Debt 706 919 921 902 895 873 854 839 823 761
GermanyNet LendingBorrowing ndash26 00 06 09 12 12 19 11 10 10Output Gap2 ndash02 ndash08 ndash03 ndash03 01 09 11 04 01 00Structural Balance2 ndash22 06 12 12 13 11 14 09 10 10Net Debt 543 586 550 521 493 456 427 401 378 299Gross Debt 665 786 756 720 691 652 617 586 557 456FranceNet LendingBorrowing ndash38 ndash41 ndash39 ndash36 ndash35 ndash28 ndash25 ndash33 ndash24 ndash26Output Gap2 ndash01 ndash11 ndash10 ndash09 ndash10 ndash01 03 02 01 00Structural Balance2 ndash38 ndash34 ndash33 ndash30 ndash28 ndash26 ndash25 ndash24 ndash25 ndash26Net Debt 591 830 855 864 892 895 895 904 904 889Gross Debt 683 934 949 956 980 984 984 993 992 978ItalyNet LendingBorrowing ndash34 ndash29 ndash30 ndash26 ndash25 ndash24 ndash21 ndash20 ndash25 ndash26Output Gap2 00 ndash41 ndash41 ndash34 ndash27 ndash14 ndash09 ndash10 ndash08 ndash01Structural Balance2 ndash40 ndash06 ndash11 ndash07 ndash14 ndash17 ndash18 ndash15 ndash21 ndash26Net Debt 957 1165 1187 1194 1190 1192 1202 1213 1220 1232Gross Debt 1042 1290 1318 1316 1314 1314 1322 1332 1337 1340
JapanNet LendingBorrowing ndash64 ndash79 ndash56 ndash38 ndash37 ndash32 ndash32 ndash30 ndash22 ndash20Output Gap2 ndash16 ndash17 ndash20 ndash15 ndash17 ndash05 ndash05 ndash02 ndash02 01Structural Balance2 ndash60 ndash75 ndash55 ndash43 ndash41 ndash34 ndash31 ndash29 ndash21 ndash20Net Debt 999 1464 1485 1478 1526 1511 1532 1538 1537 1536Gross Debt4 1759 2325 2361 2316 2363 2350 2371 2377 2376 2376United KingdomNet LendingBorrowing ndash41 ndash53 ndash53 ndash42 ndash29 ndash18 ndash14 ndash14 ndash15 ndash10Output Gap2 06 ndash17 ndash05 00 01 03 01 ndash01 ndash01 00Structural Balance2 ndash45 ndash40 ndash47 ndash41 ndash29 ndash20 ndash15 ndash13 ndash14 ndash11Net Debt 404 768 788 793 788 775 775 761 754 739Gross Debt 454 852 870 879 879 871 868 856 848 833CanadaNet LendingBorrowing ndash02 ndash15 02 ndash01 ndash04 ndash03 ndash04 ndash07 ndash07 ndash04Output Gap2 ndash03 ndash08 ndash03 ndash17 ndash21 ndash06 ndash04 ndash06 01 01Structural Balance2 ndash01 ndash11 01 08 07 00 ndash02 ndash05 ndash08 ndash04Net Debt5 297 298 286 285 288 276 268 264 257 221Gross Debt 745 862 857 913 918 901 899 875 850 746
Note The methodology and specific assumptions for each country are discussed in Box A1 The country group composites for fiscal data are calculated as the sum of the US dollar values for the relevant individual countries1Debt data refer to the end of the year and are not always comparable across countries Gross and net debt levels reported by national statistical agencies for countries that have adopted the System of National Accounts 2008 (Australia Canada Hong Kong SAR United States) are adjusted to exclude unfunded pension liabilities of government employeesrsquo defined-benefit pension plans Fiscal data for the aggregated major advanced economies and the United States start in 2001 and the average for the aggregate and the United States is therefore for the period 2001ndash072Percent of potential GDP3Figures reported by the national statistical agency are adjusted to exclude items related to the accrual-basis accounting of government employeesrsquo defined-benefit pension plans4Nonconsolidated basis5Includes equity shares
W O R L D E C O N O M I C O U T L O O K G L O B A L M A N U F A C T U R I N G D O W N T U R N R I S I N G T R A D E B A R R I E R S
160 International Monetary Fund | October 2019
Table A9 Summary of World Trade Volumes and Prices(Annual percent change)
Averages Projections2001ndash10 2011ndash20 2011 2012 2013 2014 2015 2016 2017 2018 2019 2020
Trade in Goods and ServicesWorld Trade1
Volume 50 36 70 31 36 39 28 23 57 36 11 32Price Deflator
In US Dollars 39 ndash05 111 ndash18 ndash07 ndash18 ndash132 ndash41 42 55 ndash16 ndash03In SDRs 24 06 73 12 01 ndash17 ndash58 ndash34 44 33 08 01
Volume of TradeExports
Advanced Economies 39 33 62 29 32 40 38 18 47 31 09 25Emerging Market and Developing Economies 82 41 79 35 47 33 14 30 73 39 19 41
ImportsAdvanced Economies 35 33 54 17 26 39 48 26 47 30 12 27Emerging Market and Developing Economies 92 44 106 54 51 43 ndash09 18 75 51 07 43
Terms of TradeAdvanced Economies ndash01 01 ndash15 ndash07 10 03 18 12 ndash02 ndash07 00 ndash01Emerging Market and Developing Economies 10 ndash03 36 07 ndash06 ndash06 ndash42 ndash16 08 15 ndash13 ndash11
Trade in GoodsWorld Trade1
Volume 50 35 75 29 33 30 22 21 58 37 09 33Price Deflator
In US Dollars 39 ndash07 122 ndash19 ndash13 ndash24 ndash144 ndash48 48 59 ndash18 ndash07In SDRs 23 03 84 11 ndash05 ndash23 ndash71 ndash42 50 37 06 ndash03
World Trade Prices in US Dollars2
Manufactures 19 ndash02 43 23 ndash28 ndash04 ndash31 ndash51 ndash03 19 14 ndash02Oil 108 ndash31 317 09 ndash09 ndash75 ndash472 ndash157 233 294 ndash96 ndash62Nonfuel Primary Commodities 89 ndash10 200 ndash78 ndash54 ndash54 ndash171 ndash10 64 16 09 17
Food 56 ndash03 188 ndash38 07 ndash14 ndash168 00 39 ndash06 ndash34 28Beverages 84 ndash18 241 ndash181 ndash137 201 ndash72 ndash31 ndash47 ndash82 ndash51 62Agricultural Raw Materials 59 ndash26 243 ndash205 ndash44 ndash75 ndash115 00 52 19 ndash57 ndash19Metal 145 ndash37 127 ndash178 ndash39 ndash122 ndash273 ndash53 222 66 43 ndash62
World Trade Prices in SDRs2
Manufactures 04 08 08 54 ndash20 ndash04 52 ndash45 ndash01 ndash02 39 02Oil 92 ndash21 272 40 ndash01 ndash75 ndash427 ndash151 236 267 ndash74 ndash59Nonfuel Primary Commodities 74 00 159 ndash49 ndash47 ndash54 ndash100 ndash04 67 ndash05 33 21
Food 40 07 148 ndash08 15 ndash13 ndash97 07 42 ndash26 ndash11 32Beverages 68 ndash08 200 ndash156 ndash130 201 07 ndash25 ndash45 ndash101 ndash28 66Agricultural Raw Materials 43 ndash16 201 ndash181 ndash37 ndash75 ndash40 06 55 ndash02 ndash35 ndash16Metal 129 ndash27 89 ndash153 ndash31 ndash121 ndash211 ndash47 225 44 68 ndash59
World Trade Prices in Euros2
Manufactures ndash17 15 ndash06 108 ndash59 ndash05 161 ndash49 ndash23 ndash26 67 00Oil 69 ndash14 255 92 ndash41 ndash76 ndash368 ndash154 208 237 ndash49 ndash60Nonfuel Primary Commodities 51 07 144 ndash02 ndash85 ndash55 ndash07 ndash08 43 ndash28 61 20
Food 18 14 132 42 ndash26 ndash14 ndash04 03 18 ndash49 16 31Beverages 45 ndash01 184 ndash114 ndash164 200 111 ndash28 ndash66 ndash122 ndash01 65Agricultural Raw Materials 21 ndash10 185 ndash140 ndash75 ndash76 59 03 31 ndash26 ndash08 ndash17Metal 104 ndash21 74 ndash110 ndash70 ndash122 ndash129 ndash50 197 19 97 ndash60
S TAT I S T I C A L A P P E N D I X
International Monetary Fund | October 2019 161
Table A9 Summary of World Trade Volumes and Prices (continued)(Annual percent change)
Averages Projections2001ndash10 2011ndash20 2011 2012 2013 2014 2015 2016 2017 2018 2019 2020
Trade in GoodsVolume of TradeExports
Advanced Economies 38 31 64 27 26 32 32 15 47 31 06 26Emerging Market and Developing Economies 80 39 80 39 47 27 11 29 70 38 15 39
Fuel Exporters 48 17 59 27 21 ndash04 31 12 14 03 ndash26 30Nonfuel Exporters 93 46 88 44 58 39 04 33 84 47 27 42
ImportsAdvanced Economies 35 31 60 11 23 34 38 22 50 35 10 28Emerging Market and Developing Economies 93 43 114 52 47 27 ndash07 22 78 50 04 47
Fuel Exporters 110 17 119 85 36 10 ndash71 ndash55 50 ndash17 02 32Nonfuel Exporters 89 48 113 44 50 30 07 38 84 62 04 49
Price Deflators in SDRsExports
Advanced Economies 17 02 61 ndash05 04 ndash19 ndash65 ndash21 43 29 00 ndash03Emerging Market and Developing Economies 43 05 131 30 ndash13 ndash31 ndash89 ndash72 66 49 08 ndash10
Fuel Exporters 77 ndash10 254 43 ndash26 ndash69 ndash300 ndash127 170 157 ndash32 ndash51Nonfuel Exporters 30 09 82 25 ndash07 ndash15 ndash08 ndash57 40 21 19 00
ImportsAdvanced Economies 17 02 81 06 ndash06 ndash20 ndash80 ndash35 44 37 00 ndash01Emerging Market and Developing Economies 31 07 82 24 ndash08 ndash27 ndash47 ndash56 55 37 23 ndash01
Fuel Exporters 37 09 62 29 02 ndash24 ndash34 ndash33 36 15 31 05Nonfuel Exporters 30 07 86 23 ndash10 ndash27 ndash49 ndash61 59 41 21 ndash02
Terms of TradeAdvanced Economies ndash01 00 ndash18 ndash10 10 01 17 14 ndash01 ndash08 00 ndash02Emerging Market and Developing Economies 12 ndash02 45 06 ndash05 ndash04 ndash44 ndash17 10 12 ndash15 ndash09
Regional GroupsEmerging and Developing Asia ndash13 05 ndash27 15 11 24 85 00 ndash34 ndash22 01 03Emerging and Developing Europe 21 ndash06 113 15 ndash31 ndash06 ndash109 ndash60 29 45 ndash27 ndash10Middle East and Central Asia 23 ndash09 51 ndash18 ndash11 ndash25 ndash88 08 35 ndash05 ndash14 ndash13Latin America and the Caribbean 32 ndash16 128 02 ndash01 ndash44 ndash248 ndash55 104 105 ndash46 ndash46Sub-Saharan Africa 39 ndash07 128 ndash13 ndash24 ndash28 ndash146 ndash03 66 40 ndash43 ndash20Analytical Groups
By Source of Export EarningsFuel 39 ndash19 181 14 ndash27 ndash46 ndash275 ndash97 129 140 ndash61 ndash56Nonfuel 00 02 ndash04 02 03 13 43 04 ndash18 ndash19 ndash02 02
MemorandumWorld Exports in Billions of US DollarsGoods and Services 13477 23161 22315 22608 23319 23752 21096 20713 22801 24882 24739 25381Goods 10661 17992 17928 18129 18542 18632 16197 15737 17439 19106 18898 19312Average Oil Price3 108 ndash31 317 09 ndash09 ndash75 ndash472 ndash157 233 294 ndash96 ndash62
In US Dollars a Barrel 5425 7439 10405 10501 10407 9625 5079 4284 5281 6833 6178 5794Export Unit Value of Manufactures4 19 ndash02 43 23 ndash28 ndash04 ndash31 ndash51 ndash03 19 14 ndash021Average of annual percent change for world exports and imports2As represented respectively by the export unit value index for manufactures of the advanced economies and accounting for 83 percent of the advanced economiesrsquo trade (export of goods) weights the average of UK Brent Dubai Fateh and West Texas Intermediate crude oil prices and the average of world market prices for nonfuel primary commodities weighted by their 2014ndash16 shares in world commodity imports3Percent change of average of UK Brent Dubai Fateh and West Texas Intermediate crude oil prices4Percent change for manufactures exported by the advanced economies
W O R L D E C O N O M I C O U T L O O K G L O B A L M A N U F A C T U R I N G D O W N T U R N R I S I N G T R A D E B A R R I E R S
162 International Monetary Fund | October 2019
Table A10 Summary of Current Account Balances(Billions of US dollars)
Projections2011 2012 2013 2014 2015 2016 2017 2018 2019 2020 2024
Advanced Economies ndash387 253 2039 2254 2697 3377 4115 3623 3049 2522 2614United States ndash4457 ndash4268 ndash3488 ndash3652 ndash4078 ndash4283 ndash4396 ndash4910 ndash5395 ndash5691 ndash5865Euro Area ndash124 1735 3007 3404 3131 3703 4097 3966 3766 3689 3441
Germany 2329 2516 2447 2800 2884 2938 2958 2895 2691 2610 2703France ndash246 ndash259 ndash143 ndash273 ndash90 ndash115 ndash187 ndash162 ndash137 ndash137 ndash142Italy ndash683 ndash70 210 411 246 475 507 520 570 588 464Spain ndash474 ndash31 207 149 139 279 243 132 128 150 176
Japan 1298 597 459 368 1364 1979 2020 1753 1721 1805 2286United Kingdom ndash516 ndash1009 ndash1419 ndash1496 ndash1424 ndash1393 ndash881 ndash1091 ndash947 ndash996 ndash1154Canada ndash496 ndash657 ndash593 ndash432 ndash552 ndash489 ndash463 ndash452 ndash325 ndash302 ndash364Other Advanced Economies1 2646 2741 3421 3572 3598 3431 3285 3592 3496 3264 3392Emerging Market and Developing Economies 3766 3432 1701 1730 ndash603 ndash813 126 19 ndash144 ndash1348 ndash3832
Regional GroupsEmerging and Developing Asia 980 1206 988 2293 3094 2269 1752 ndash201 826 476 ndash702Emerging and Developing Europe ndash387 ndash277 ndash633 ndash127 309 ndash144 ndash237 637 604 232 ndash74Latin America and the Caribbean ndash1102 ndash1465 ndash1694 ndash1832 ndash1705 ndash977 ndash788 ndash992 ndash809 ndash819 ndash1226Middle East and Central Asia 4361 4233 3404 2025 ndash1373 ndash1399 ndash239 1014 ndash149 ndash547 ndash1078Sub-Saharan Africa ndash86 ndash266 ndash364 ndash629 ndash927 ndash563 ndash362 ndash438 ndash616 ndash690 ndash752Analytical Groups
By Source of Export EarningsFuel 6198 5962 4651 3112 ndash763 ndash737 849 2979 1455 687 165Nonfuel ndash2431 ndash2530 ndash2950 ndash1382 160 ndash76 ndash723 ndash2960 ndash1599 ndash2035 ndash3997
Of Which Primary Products ndash281 ndash613 ndash832 ndash538 ndash661 ndash414 ndash574 ndash727 ndash514 ndash499 ndash652By External Financing SourceNet Debtor Economies ndash3278 ndash4073 ndash3819 ndash3499 ndash3187 ndash2261 ndash2419 ndash2918 ndash2924 ndash3322 ndash4631Net Debtor Economies by
Debt-Servicing ExperienceEconomies with Arrears andor
Rescheduling during 2014ndash18 ndash183 ndash347 ndash394 ndash334 ndash522 ndash494 ndash354 ndash241 ndash339 ndash403 ndash419MemorandumWorld 3380 3685 3740 3984 2094 2563 4241 3642 2905 1174 ndash1219European Union 752 2063 2772 2887 2828 3232 4126 3839 3726 3584 3192Low-Income Developing Countries ndash218 ndash311 ndash371 ndash415 ndash746 ndash374 ndash332 ndash529 ndash666 ndash749 ndash811Middle East and North Africa 4052 4130 3335 1937 ndash1203 ndash1169 ndash44 1183 28 ndash412 ndash886
S TAT I S T I C A L A P P E N D I X
International Monetary Fund | October 2019 163
Projections2011 2012 2013 2014 2015 2016 2017 2018 2019 2020 2024
Advanced Economies ndash01 01 04 05 06 07 09 07 06 05 04United States ndash29 ndash26 ndash21 ndash21 ndash22 ndash23 ndash23 ndash24 ndash25 ndash25 ndash23Euro Area ndash01 14 23 25 27 31 32 29 28 27 22
Germany 62 71 66 72 86 85 81 73 70 66 58France ndash09 ndash10 ndash05 ndash10 ndash04 ndash05 ndash07 ndash06 ndash05 ndash05 ndash04Italy ndash30 ndash03 10 19 13 25 26 25 29 29 21Spain ndash32 ndash02 15 11 12 23 18 09 09 10 10
Japan 21 10 09 08 31 40 42 35 33 33 37United Kingdom ndash20 ndash38 ndash51 ndash49 ndash49 ndash52 ndash33 ndash39 ndash35 ndash37 ndash37Canada ndash28 ndash36 ndash32 ndash24 ndash35 ndash32 ndash28 ndash26 ndash19 ndash17 ndash16Other Advanced Economies1 40 41 50 51 56 52 47 49 48 44 38Emerging Market and Developing Economies 14 12 06 06 ndash02 ndash03 00 00 00 ndash04 ndash08
Regional GroupsEmerging and Developing Asia 08 09 07 15 20 14 10 ndash01 04 02 ndash02Emerging and Developing Europe ndash09 ndash06 ndash14 ndash03 09 ndash04 ndash06 17 16 06 ndash01Latin America and the Caribbean ndash19 ndash25 ndash28 ndash31 ndash32 ndash19 ndash14 ndash19 ndash16 ndash15 ndash19Middle East and Central Asia 121 114 88 52 ndash39 ndash41 ndash07 27 ndash04 ndash14 ndash22Sub-Saharan Africa ndash06 ndash17 ndash22 ndash36 ndash60 ndash39 ndash23 ndash27 ndash36 ndash38 ndash31Analytical Groups
By Source of Export EarningsFuel 105 97 74 51 ndash15 ndash16 17 56 28 13 03Nonfuel ndash12 ndash11 ndash12 ndash06 01 00 ndash03 ndash10 ndash05 ndash06 ndash09
Of Which Primary Products ndash16 ndash33 ndash43 ndash28 ndash35 ndash23 ndash29 ndash38 ndash28 ndash26 ndash27By External Financing SourceNet Debtor Economies ndash25 ndash30 ndash27 ndash24 ndash24 ndash17 ndash17 ndash20 ndash19 ndash20 ndash21Net Debtor Economies by
Debt-Servicing ExperienceEconomies with Arrears andor
Rescheduling during 2014ndash18 ndash22 ndash39 ndash42 ndash35 ndash59 ndash57 ndash44 ndash29 ndash39 ndash43 ndash35MemorandumWorld 05 05 05 05 03 03 05 04 03 01 ndash01European Union 04 12 15 15 17 20 24 20 20 19 14Low-Income Developing Countries ndash15 ndash19 ndash21 ndash21 ndash40 ndash21 ndash18 ndash26 ndash31 ndash32 ndash25Middle East and North Africa 135 135 106 60 ndash43 ndash42 ndash02 38 01 ndash13 ndash23
Table A10 Summary of Current Account Balances (continued)(Percent of GDP)
W O R L D E C O N O M I C O U T L O O K G L O B A L M A N U F A C T U R I N G D O W N T U R N R I S I N G T R A D E B A R R I E R S
164 International Monetary Fund | October 2019
Projections2011 2012 2013 2014 2015 2016 2017 2018 2019 2020 2024
Advanced Economies ndash03 02 14 15 20 25 28 23 20 16 14United States ndash210 ndash192 ndash152 ndash154 ndash180 ndash193 ndash187 ndash196 ndash215 ndash220 ndash191Euro Area ndash04 54 88 95 96 114 116 103
Germany 138 154 144 158 183 184 170 155 147 139 119France ndash30 ndash32 ndash17 ndash31 ndash12 ndash15 ndash23 ndash18 ndash15 ndash14 ndash12Italy ndash111 ndash12 34 65 45 86 83 79 89 88 58Spain ndash110 ndash08 47 33 35 68 54 27 27 30 29
Japan 139 65 55 43 174 244 231 189 190 198 220United Kingdom ndash64 ndash126 ndash173 ndash175 ndash179 ndash185 ndash111 ndash129 ndash116 ndash126 ndash131Canada ndash91 ndash119 ndash107 ndash76 ndash112 ndash103 ndash91 ndash83 ndash59 ndash53 ndash55Other Advanced Economies1 68 68 82 86 97 94 83 84 84 77 67Emerging Market and Developing Economies 45 37 19 22 ndash07 ndash10 01 00 ndash02 ndash14 ndash32
Regional GroupsEmerging and Developing Asia 28 33 26 57 82 62 43 ndash05 18 10 ndash12Emerging and Developing Europe ndash28 ndash19 ndash43 ndash09 26 ndash13 ndash18 42 39 15 ndash04Latin America and the Caribbean ndash89 ndash115 ndash134 ndash147 ndash158 ndash93 ndash67 ndash78 ndash64 ndash63 ndash77Middle East and Central Asia 256 225 192 129 ndash102 ndash115 ndash20 66 ndash10 ndash35 ndash65Sub-Saharan Africa ndash18 ndash56 ndash76 ndash138 ndash269 ndash178 ndash99 ndash104 ndash151 ndash164 ndash142Analytical Groups
By Source of Export EarningsFuel 254 226 185 138 ndash41 ndash47 48 146 77 39 10Nonfuel ndash42 ndash42 ndash46 ndash21 03 ndash01 ndash11 ndash41 ndash22 ndash27 ndash41
Of Which Primary Products ndash57 ndash125 ndash172 ndash114 ndash164 ndash104 ndash129 ndash152 ndash108 ndash101 ndash107By External Financing SourceNet Debtor Economies ndash83 ndash101 ndash92 ndash84 ndash87 ndash62 ndash58 ndash64 ndash62 ndash68 ndash72Net Debtor Economies by
Debt-Servicing ExperienceEconomies with Arrears andor
Rescheduling during 2014ndash18 ndash59 ndash112 ndash128 ndash118 ndash240 ndash255 ndash158 ndash93 ndash127 ndash143 ndash117MemorandumWorld 15 15 16 18 10 13 18 15 12 05 ndash04European Union 10 28 36 36 39 44 52 44 43 40 30Low-Income Developing Countries ndash46 ndash65 ndash72 ndash78 ndash155 ndash78 ndash59 ndash82 ndash99 ndash102 ndash75Middle East and North Africa 271 249 213 141 ndash99 ndash107 ndash06 86 02 ndash29 ndash601Excludes the Group of Seven (Canada France Germany Italy Japan United Kingdom United States) and euro area countries
Table A10 Summary of Current Account Balances (continued)(Percent of exports of goods and services)
S TAT I S T I C A L A P P E N D I X
International Monetary Fund | October 2019 165
Table A11 Advanced Economies Balance on Current Account(Percent of GDP)
Projections2011 2012 2013 2014 2015 2016 2017 2018 2019 2020 2024
Advanced Economies ndash01 01 04 05 06 07 09 07 06 05 04United States ndash29 ndash26 ndash21 ndash21 ndash22 ndash23 ndash23 ndash24 ndash25 ndash25 ndash23Euro Area1 ndash01 14 23 25 27 31 32 29 28 27 22
Germany 62 71 66 72 86 85 81 73 70 66 58France ndash09 ndash10 ndash05 ndash10 ndash04 ndash05 ndash07 ndash06 ndash05 ndash05 ndash04Italy ndash30 ndash03 10 19 13 25 26 25 29 29 21Spain ndash32 ndash02 15 11 12 23 18 09 09 10 10Netherlands 85 102 98 82 63 81 108 109 98 95 85Belgium ndash11 ndash01 ndash03 ndash09 ndash10 ndash06 07 ndash13 ndash11 ndash08 ndash13Austria 16 15 19 25 17 25 20 23 16 18 19Ireland ndash16 ndash34 16 11 44 ndash42 05 106 108 96 57Portugal ndash60 ndash18 16 01 01 06 04 ndash06 ndash06 ndash07 ndash15Greece ndash100 ndash24 ndash26 ndash23 ndash15 ndash23 ndash24 ndash35 ndash30 ndash33 ndash45Finland ndash17 ndash23 ndash19 ndash15 ndash07 ndash07 ndash07 ndash16 ndash07 ndash05 04Slovak Republic ndash50 09 19 11 ndash17 ndash22 ndash20 ndash25 ndash25 ndash17 01Lithuania ndash46 ndash14 08 32 ndash28 ndash08 09 16 11 11 ndash08Slovenia ndash08 13 33 51 38 48 61 57 42 41 14Luxembourg 60 56 54 52 51 51 50 47 45 45 44Latvia ndash32 ndash36 ndash27 ndash17 ndash05 16 07 ndash10 ndash18 ndash21 ndash34Estonia 13 ndash19 05 08 18 20 32 17 07 03 ndash08Cyprus ndash41 ndash60 ndash49 ndash43 ndash15 ndash51 ndash84 ndash70 ndash78 ndash75 ndash50Malta ndash02 17 27 87 28 38 105 98 76 62 61
Japan 21 10 09 08 31 40 42 35 33 33 37United Kingdom ndash20 ndash38 ndash51 ndash49 ndash49 ndash52 ndash33 ndash39 ndash35 ndash37 ndash37Korea 13 38 56 56 72 65 46 44 32 29 29Canada ndash28 ndash36 ndash32 ndash24 ndash35 ndash32 ndash28 ndash26 ndash19 ndash17 ndash16Australia ndash31 ndash43 ndash34 ndash31 ndash46 ndash33 ndash26 ndash21 ndash03 ndash17 ndash19Taiwan Province of China 78 87 97 114 139 135 145 122 114 108 80Singapore 222 176 157 180 172 175 164 179 165 166 150Switzerland 78 107 116 85 112 94 67 102 96 98 98Sweden 55 55 52 45 41 38 28 17 29 27 24Hong Kong SAR 56 16 15 14 33 40 46 43 55 51 40Czech Republic ndash21 ndash16 ndash05 02 02 16 17 03 ndash01 ndash02 ndash07Norway 124 125 103 105 79 40 57 81 69 72 59Israel 21 05 29 44 50 36 27 27 24 25 25Denmark 66 63 78 89 82 79 80 57 55 52 46New Zealand ndash28 ndash39 ndash32 ndash31 ndash30 ndash22 ndash29 ndash38 ndash41 ndash43 ndash43Puerto Rico Macao SAR 409 393 402 342 253 272 331 352 357 353 298Iceland ndash51 ndash38 58 39 51 76 38 28 31 16 03San Marino ndash05 04 04 02 02Memorandum Major Advanced Economies ndash08 ndash09 ndash07 ndash06 ndash05 ndash02 ndash01 ndash04 ndash05 ndash05 ndash04Euro Area2 08 23 28 29 32 35 36 35 34 32 271Data corrected for reporting discrepancies in intra-area transactions2Data calculated as the sum of the balances of individual euro area countries
W O R L D E C O N O M I C O U T L O O K G L O B A L M A N U F A C T U R I N G D O W N T U R N R I S I N G T R A D E B A R R I E R S
166 International Monetary Fund | October 2019
Table A12 Emerging Market and Developing Economies Balance on Current Account(Percent of GDP)
Projections2011 2012 2013 2014 2015 2016 2017 2018 2019 2020 2024
Emerging and Developing Asia 08 09 07 15 20 14 10 ndash01 04 02 ndash02Bangladesh ndash10 07 12 13 19 06 ndash21 ndash27 ndash20 ndash21 ndash20Bhutan ndash298 ndash214 ndash254 ndash268 ndash272 ndash308 ndash230 ndash184 ndash125 ndash96 64Brunei Darussalam 347 298 209 319 167 129 164 79 85 120 198Cambodia ndash79 ndash85 ndash84 ndash85 ndash87 ndash84 ndash79 ndash113 ndash125 ndash123 ndash88China 18 25 15 22 27 18 16 04 10 09 04Fiji ndash47 ndash13 ndash89 ndash61 ndash38 ndash39 ndash70 ndash89 ndash73 ndash62 ndash52India ndash43 ndash48 ndash17 ndash13 ndash10 ndash06 ndash18 ndash21 ndash20 ndash23 ndash25Indonesia 02 ndash27 ndash32 ndash31 ndash20 ndash18 ndash16 ndash30 ndash29 ndash27 ndash25Kiribati ndash95 19 ndash55 311 328 108 380 362 132 24 ndash42Lao PDR ndash153 ndash213 ndash265 ndash233 ndash224 ndash110 ndash106 ndash120 ndash121 ndash120 ndash109Malaysia 107 51 34 43 30 24 28 21 31 19 09Maldives ndash148 ndash66 ndash43 ndash37 ndash75 ndash232 ndash219 ndash253 ndash204 ndash157 ndash87Marshall Islands ndash22 ndash63 ndash107 ndash17 144 97 48 51 41 32 ndash02Micronesia ndash200 ndash146 ndash116 ndash09 16 39 75 245 157 26 ndash42Mongolia ndash265 ndash274 ndash254 ndash113 ndash40 ndash63 ndash101 ndash170 ndash144 ndash124 ndash88Myanmar ndash17 ndash17 ndash06 ndash42 ndash31 ndash40 ndash65 ndash42 ndash48 ndash49 ndash46Nauru 287 357 495 252 ndash213 20 127 19 36 ndash43 ndash36Nepal ndash10 48 33 45 50 63 ndash04 ndash81 ndash83 ndash100 ndash50Palau ndash127 ndash153 ndash142 ndash179 ndash87 ndash136 ndash191 ndash166 ndash254 ndash248 ndash199Papua New Guinea ndash240 ndash361 ndash308 123 175 346 287 274 230 248 222Philippines 25 28 42 38 25 ndash04 ndash07 ndash26 ndash20 ndash23 ndash19Samoa ndash69 ndash90 ndash17 ndash81 ndash31 ndash47 ndash18 23 ndash06 ndash03 ndash12Solomon Islands ndash82 15 ndash34 ndash43 ndash30 ndash40 ndash48 ndash52 ndash71 ndash82 ndash68Sri Lanka ndash71 ndash58 ndash34 ndash25 ndash23 ndash21 ndash26 ndash32 ndash26 ndash28 ndash21Thailand 25 ndash12 ndash21 29 69 105 97 64 60 54 37Timor-Leste 391 397 424 271 66 ndash217 ndash114 ndash70 11 ndash29 ndash91Tonga ndash169 ndash123 ndash80 ndash100 ndash107 ndash66 ndash62 ndash77 ndash110 ndash132 ndash122Tuvalu ndash371 182 ndash66 29 ndash528 232 309 71 299 ndash75 11Vanuatu ndash78 ndash65 ndash33 62 ndash16 08 ndash64 34 61 ndash56 ndash37Vietnam 02 60 45 49 ndash01 29 21 24 22 19 10Emerging and Developing Europe ndash09 ndash06 ndash14 ndash03 09 ndash04 ndash06 17 16 06 ndash01Albania ndash132 ndash101 ndash93 ndash108 ndash86 ndash76 ndash75 ndash68 ndash66 ndash64 ndash62Belarus ndash82 ndash28 ndash100 ndash66 ndash33 ndash34 ndash17 ndash04 ndash09 ndash34 ndash28Bosnia and Herzegovina ndash95 ndash87 ndash53 ndash74 ndash53 ndash47 ndash47 ndash41 ndash48 ndash49 ndash48Bulgaria 03 ndash09 13 12 00 26 31 46 32 25 03Croatia ndash07 ndash01 09 20 46 25 35 25 17 10 00Hungary 04 15 36 13 24 46 23 ndash05 ndash09 ndash06 00Kosovo ndash127 ndash58 ndash34 ndash69 ndash86 ndash79 ndash64 ndash80 ndash65 ndash66 ndash72Moldova ndash101 ndash74 ndash52 ndash60 ndash60 ndash35 ndash58 ndash105 ndash91 ndash89 ndash68Montenegro ndash148 ndash153 ndash114 ndash124 ndash110 ndash162 ndash161 ndash172 ndash171 ndash149 ndash95North Macedonia ndash25 ndash32 ndash16 ndash05 ndash21 ndash31 ndash13 ndash03 ndash07 ndash12 ndash20Poland ndash52 ndash37 ndash13 ndash21 ndash06 ndash05 01 ndash06 ndash09 ndash11 ndash21Romania ndash50 ndash48 ndash11 ndash07 ndash12 ndash21 ndash32 ndash45 ndash55 ndash52 ndash44Russia 48 33 15 28 50 19 21 68 57 39 32Serbia ndash81 ndash108 ndash57 ndash56 ndash35 ndash29 ndash52 ndash52 ndash58 ndash51 ndash41Turkey ndash89 ndash55 ndash67 ndash47 ndash37 ndash38 ndash56 ndash35 ndash06 ndash09 ndash19Ukraine1 ndash63 ndash81 ndash92 ndash39 17 ndash15 ndash22 ndash34 ndash28 ndash35 ndash33Latin America and the Caribbean ndash19 ndash25 ndash28 ndash31 ndash32 ndash19 ndash14 ndash19 ndash16 ndash15 ndash19Antigua and Barbuda 03 22 ndash24 ndash88 ndash70 ndash61 ndash55 ndash47Argentina ndash10 ndash04 ndash21 ndash16 ndash27 ndash27 ndash49 ndash53 ndash12 03 ndash16Aruba ndash105 35 ndash129 ndash51 42 50 10 02 ndash18 ndash11 07The Bahamas ndash118 ndash140 ndash141 ndash174 ndash120 ndash60 ndash124 ndash121 ndash74 ndash128 ndash55Barbados ndash118 ndash85 ndash84 ndash92 ndash61 ndash43 ndash38 ndash37 ndash39 ndash35 ndash25Belize ndash11 ndash12 ndash45 ndash79 ndash98 ndash90 ndash70 ndash81 ndash70 ndash64 ndash47Bolivia 22 72 34 17 ndash58 ndash56 ndash50 ndash49 ndash50 ndash41 ndash30Brazil ndash29 ndash34 ndash32 ndash41 ndash30 ndash13 ndash04 ndash08 ndash12 ndash10 ndash16Chile ndash17 ndash39 ndash41 ndash17 ndash23 ndash16 ndash21 ndash31 ndash35 ndash29 ndash17Colombia ndash29 ndash31 ndash33 ndash52 ndash63 ndash43 ndash33 ndash40 ndash42 ndash40 ndash37
S TAT I S T I C A L A P P E N D I X
International Monetary Fund | October 2019 167
Projections2011 2012 2013 2014 2015 2016 2017 2018 2019 2020 2024
Latin America and the Caribbean (continued) ndash19 ndash25 ndash28 ndash31 ndash32 ndash19 ndash14 ndash19 ndash16 ndash15 ndash19
Costa Rica ndash53 ndash51 ndash48 ndash48 ndash35 ndash22 ndash29 ndash31 ndash24 ndash25 ndash33Dominica ndash69 ndash76 ndash89 ndash127 ndash434 ndash336 ndash258 ndash95Dominican Republic ndash75 ndash65 ndash41 ndash32 ndash18 ndash11 ndash02 ndash14 ndash13 ndash11 ndash25Ecuador ndash05 ndash02 ndash10 ndash07 ndash22 13 ndash05 ndash14 01 07 17El Salvador ndash55 ndash58 ndash69 ndash54 ndash32 ndash23 ndash19 ndash48 ndash49 ndash50 ndash53Grenada ndash116 ndash122 ndash110 ndash120 ndash112 ndash113 ndash99 ndash89Guatemala ndash34 ndash26 ndash25 ndash21 ndash02 15 16 08 06 03 ndash10Guyana ndash122 ndash113 ndash133 ndash95 ndash51 04 ndash68 ndash175 ndash227 ndash184 17Haiti ndash43 ndash57 ndash66 ndash85 ndash30 ndash09 ndash10 ndash37 ndash33 ndash32 ndash26Honduras ndash80 ndash85 ndash95 ndash69 ndash47 ndash26 ndash18 ndash42 ndash42 ndash43 ndash39Jamaica ndash122 ndash111 ndash92 ndash75 ndash31 ndash14 ndash26 ndash24 ndash25 ndash22 ndash31Mexico ndash10 ndash15 ndash25 ndash19 ndash26 ndash22 ndash17 ndash18 ndash12 ndash16 ndash20Nicaragua ndash119 ndash107 ndash109 ndash71 ndash90 ndash66 ndash49 06 23 18 ndash10Panama ndash130 ndash92 ndash90 ndash134 ndash90 ndash80 ndash79 ndash78 ndash61 ndash53 ndash55Paraguay 06 ndash09 16 ndash01 ndash04 35 31 05 ndash01 13 18Peru ndash20 ndash32 ndash51 ndash45 ndash50 ndash26 ndash12 ndash16 ndash19 ndash20 ndash18St Kitts and Nevis 01 ndash94 ndash138 ndash117 ndash74 ndash63 ndash158 ndash131St Lucia ndash03 23 ndash46 15 30 25 17 08St Vincent and the Grenadines ndash263 ndash153 ndash130 ndash120 ndash122 ndash116 ndash107 ndash90Suriname 98 33 ndash38 ndash79 ndash164 ndash54 ndash01 ndash55 ndash57 ndash58 ndash26Trinidad and Tobago 169 129 200 146 74 ndash40 50 71 24 17 24Uruguay ndash40 ndash36 ndash32 ndash09 06 08 ndash06 ndash17 ndash30 ndash18Venezuela 49 08 20 23 ndash50 ndash14 61 64 70 15 Middle East and Central Asia 121 114 88 52 ndash39 ndash41 ndash07 27 ndash04 ndash14 ndash22Afghanistan 266 109 03 58 29 84 47 91 20 02 ndash16Algeria 99 59 04 ndash44 ndash164 ndash165 ndash132 ndash96 ndash126 ndash119 ndash69Armenia ndash104 ndash100 ndash73 ndash76 ndash26 ndash23 ndash24 ndash94 ndash74 ndash74 ndash59Azerbaijan 260 214 166 139 ndash04 ndash36 41 129 97 100 76Bahrain 88 84 74 46 ndash24 ndash46 ndash45 ndash59 ndash43 ndash44 ndash41Djibouti ndash18 ndash234 ndash297 231 277 ndash10 ndash36 151 ndash03 06 26Egypt ndash25 ndash36 ndash22 ndash09 ndash37 ndash60 ndash61 ndash24 ndash31 ndash28 ndash25Georgia ndash128 ndash119 ndash59 ndash108 ndash126 ndash131 ndash88 ndash77 ndash59 ndash58 ndash53Iran 104 60 67 32 03 40 38 41 ndash27 ndash34 ndash36Iraq 109 51 11 26 ndash65 ndash83 18 69 ndash35 ndash37 ndash73Jordan ndash102 ndash150 ndash103 ndash72 ndash90 ndash94 ndash106 ndash70 ndash70 ndash62 ndash60Kazakhstan 53 11 08 28 ndash33 ndash59 ndash31 00 ndash12 ndash15 ndash09Kuwait 429 455 403 334 35 ndash46 80 144 82 68 32Kyrgyz Republic ndash77 ndash155 ndash139 ndash170 ndash159 ndash116 ndash62 ndash87 ndash100 ndash83 ndash94Lebanon ndash157 ndash252 ndash274 ndash282 ndash193 ndash231 ndash259 ndash256 ndash264 ndash263 ndash231Libya1 99 299 00 ndash784 ndash544 ndash247 79 22 ndash03 ndash116 ndash76Mauritania ndash50 ndash242 ndash220 ndash273 ndash198 ndash151 ndash144 ndash184 ndash137 ndash201 ndash71Morocco ndash76 ndash93 ndash76 ndash59 ndash21 ndash40 ndash34 ndash54 ndash45 ndash38 ndash28Oman 130 102 66 52 ndash159 ndash191 ndash156 ndash55 ndash72 ndash80 ndash91Pakistan 01 ndash21 ndash11 ndash13 ndash10 ndash17 ndash41 ndash63 ndash46 ndash26 ndash18Qatar 311 332 304 240 85 ndash55 38 87 60 41 33Saudi Arabia 236 224 181 98 ndash87 ndash37 15 92 44 15 ndash18Somalia ndash29 ndash70 ndash60 ndash94 ndash90 ndash83 ndash80 ndash77 ndash97Sudan2 ndash40 ndash128 ndash110 ndash58 ndash84 ndash76 ndash100 ndash136 ndash74 ndash125 ndash109Syria3 Tajikistan ndash63 ndash90 ndash104 ndash34 ndash61 ndash42 22 ndash50 ndash58 ndash58 ndash55Tunisia ndash84 ndash91 ndash97 ndash98 ndash97 ndash93 ndash102 ndash111 ndash104 ndash94 ndash57Turkmenistan ndash08 ndash09 ndash73 ndash61 ndash156 ndash202 ndash103 57 ndash06 ndash30 ndash74United Arab Emirates 126 197 190 135 49 37 73 91 90 71 52Uzbekistan 48 10 24 14 06 04 25 ndash71 ndash65 ndash56 ndash42Yemen ndash30 ndash17 ndash31 ndash07 ndash71 ndash32 ndash02 ndash18 ndash40 13 ndash08
Table A12 Emerging Market and Developing Economies Balance on Current Account (continued)(Percent of GDP)
W O R L D E C O N O M I C O U T L O O K G L O B A L M A N U F A C T U R I N G D O W N T U R N R I S I N G T R A D E B A R R I E R S
168 International Monetary Fund | October 2019
Projections2011 2012 2013 2014 2015 2016 2017 2018 2019 2020 2024
Sub-Saharan Africa ndash06 ndash17 ndash22 ndash36 ndash60 ndash39 ndash23 ndash27 ndash36 ndash38 ndash31Angola 117 108 61 ndash26 ndash88 ndash48 ndash05 61 09 ndash07 ndash09Benin ndash53 ndash54 ndash61 ndash72 ndash73 ndash68 ndash73 ndash60 ndash61 ndash58 ndash50Botswana 31 03 89 154 78 78 53 19 ndash30 ndash10 30Burkina Faso ndash15 ndash15 ndash113 ndash81 ndash86 ndash72 ndash73 ndash58 ndash57 ndash40 ndash37Burundi ndash144 ndash186 ndash193 ndash185 ndash177 ndash131 ndash123 ndash134 ndash126 ndash119 ndash88Cabo Verde ndash163 ndash126 ndash49 ndash91 ndash32 ndash39 ndash66 ndash45 ndash44 ndash42 ndash36Cameroon ndash25 ndash33 ndash35 ndash40 ndash38 ndash32 ndash27 ndash37 ndash37 ndash35 ndash32Central African Republic ndash68 ndash56 ndash29 ndash133 ndash91 ndash53 ndash78 ndash80 ndash41 ndash49 ndash50Chad ndash58 ndash78 ndash91 ndash89 ndash136 ndash102 ndash66 ndash34 ndash64 ndash61 ndash59Comoros ndash36 ndash32 ndash41 ndash38 ndash03 ndash43 ndash22 ndash38 ndash80 ndash74 ndash44Democratic Republic of the Congo ndash50 ndash43 ndash50 ndash47 ndash38 ndash41 ndash32 ndash46 ndash34 ndash42 ndash45Republic of Congo 139 177 138 13 ndash542 ndash635 ndash59 67 68 53 ndash21Cocircte drsquoIvoire 104 ndash12 ndash14 14 ndash06 ndash12 ndash27 ndash47 ndash38 ndash38 ndash31Equatorial Guinea ndash57 ndash11 ndash24 ndash43 ndash164 ndash130 ndash58 ndash54 ndash59 ndash62 ndash56Eritrea 134 129 23 173 208 153 238 166 113 132 29Eswatini ndash58 50 108 116 129 78 70 20 25 50 42Ethiopia ndash25 ndash71 ndash61 ndash66 ndash117 ndash94 ndash86 ndash65 ndash60 ndash53 ndash39Gabon 240 179 73 76 ndash56 ndash99 ndash44 ndash24 01 09 40The Gambia ndash74 ndash45 ndash67 ndash73 ndash99 ndash92 ndash74 ndash97 ndash94 ndash131 ndash114Ghana ndash66 ndash87 ndash90 ndash70 ndash58 ndash52 ndash34 ndash31 ndash36 ndash38 ndash20Guinea ndash184 ndash199 ndash125 ndash129 ndash129 ndash319 ndash71 ndash184 ndash207 ndash177 ndash103Guinea-Bissau ndash13 ndash84 ndash46 05 19 13 03 ndash45 ndash42 ndash37 ndash22Kenya ndash92 ndash84 ndash88 ndash104 ndash67 ndash49 ndash62 ndash50 ndash47 ndash46 ndash47Lesotho ndash134 ndash84 ndash51 ndash49 ndash40 ndash84 ndash47 ndash86 ndash146 ndash49 ndash56Liberia ndash176 ndash173 ndash217 ndash264 ndash267 ndash186 ndash234 ndash234 ndash212 ndash210 ndash147Madagascar ndash77 ndash89 ndash63 ndash03 ndash19 06 ndash05 08 ndash16 ndash27 ndash41Malawi ndash86 ndash92 ndash84 ndash82 ndash172 ndash185 ndash256 ndash153 ndash143 ndash142 ndash102Mali ndash51 ndash22 ndash29 ndash47 ndash53 ndash72 ndash73 ndash38 ndash55 ndash55 ndash66Mauritius ndash135 ndash71 ndash62 ndash54 ndash36 ndash40 ndash46 ndash58 ndash72 ndash65 ndash50Mozambique ndash253 ndash447 ndash429 ndash382 ndash403 ndash390 ndash200 ndash304 ndash580 ndash667 ndash393Namibia ndash30 ndash57 ndash40 ndash108 ndash124 ndash154 ndash50 ndash21 ndash41 ndash23 ndash45Niger ndash223 ndash147 ndash150 ndash158 ndash205 ndash155 ndash157 ndash181 ndash200 ndash227 ndash121Nigeria 26 38 37 02 ndash32 07 28 13 ndash02 ndash01 ndash02Rwanda ndash73 ndash99 ndash87 ndash118 ndash133 ndash143 ndash68 ndash78 ndash92 ndash87 ndash80Satildeo Tomeacute and Priacutencipe ndash279 ndash218 ndash145 ndash217 ndash122 ndash66 ndash132 ndash109 ndash115 ndash90 ndash65Senegal ndash65 ndash87 ndash82 ndash70 ndash56 ndash40 ndash73 ndash88 ndash85 ndash111 ndash33Seychelles ndash230 ndash211 ndash119 ndash231 ndash186 ndash206 ndash204 ndash170 ndash167 ndash170 ndash168Sierra Leone ndash650 ndash318 ndash175 ndash93 ndash155 ndash44 ndash144 ndash138 ndash123 ndash105 ndash80South Africa ndash22 ndash51 ndash58 ndash51 ndash46 ndash29 ndash25 ndash35 ndash31 ndash36 ndash47South Sudan 182 ndash159 ndash39 ndash15 ndash25 49 ndash34 ndash65 23 ndash42 ndash100Tanzania ndash110 ndash120 ndash107 ndash100 ndash79 ndash43 ndash30 ndash37 ndash41 ndash36 ndash26Togo ndash78 ndash76 ndash132 ndash100 ndash110 ndash98 ndash20 ndash49 ndash63 ndash55 ndash44Uganda ndash99 ndash67 ndash72 ndash81 ndash73 ndash34 ndash50 ndash89 ndash115 ndash105 ndash16Zambia 47 54 ndash06 21 ndash39 ndash45 ndash39 ndash26 ndash36 ndash34 ndash20Zimbabwe4 ndash172 ndash107 ndash132 ndash116 ndash76 ndash36 ndash13 ndash49 ndash05 ndash25 ndash281See country-specific notes for Libya and Ukraine in the ldquoCountry Notesrdquo section of the Statistical Appendix2Data for 2011 exclude South Sudan after July 9 Data for 2012 and onward pertain to the current Sudan3Data for Syria are excluded for 2011 onward owing to the uncertain political situation4The Zimbabwe dollar ceased circulating in early 2009 Data are based on IMF staff estimates of price and exchange rate developments in US dollars IMF staff estimates of US dollar values may differ from authoritiesrsquo estimates
Table A12 Emerging Market and Developing Economies Balance on Current Account (continued)(Percent of GDP)
S TAT I S T I C A L A P P E N D I X
International Monetary Fund | October 2019 169
Table A13 Summary of Financial Account Balances(Billions of US dollars)
Projections2011 2012 2013 2014 2015 2016 2017 2018 2019 2020
Advanced EconomiesFinancial Account Balance ndash2376 ndash1535 2300 3146 3248 4364 3947 3230 3860 2557
Direct Investment Net 3583 1168 1550 2104 ndash391 ndash2600 3221 ndash1482 149 422Portfolio Investment Net ndash11104 ndash2488 ndash5530 741 2523 5582 57 3535 4171 4719Financial Derivatives Net ndash48 ndash977 747 ndash27 ndash887 203 136 579 ndash154 ndash187Other Investment Net 1696 ndash1982 3990 ndash1025 ndash254 ndash608 ndash1911 ndash696 ndash925 ndash2965Change in Reserves 3499 2732 1531 1349 2268 1786 2443 1293 609 567United StatesFinancial Account Balance ndash5260 ndash4482 ndash4003 ndash2973 ndash3259 ndash3820 ndash3576 ndash4455 ndash4420 ndash5609
Direct Investment Net 1731 1269 1047 1357 ndash2020 ndash1761 299 ndash3368 ndash1640 ndash1591Portfolio Investment Net ndash2263 ndash4983 ndash307 ndash1149 ndash535 ndash1951 ndash2231 184 ndash2489 ndash1579Financial Derivatives Net ndash350 71 22 ndash543 ndash270 78 240 ndash207 ndash200 ndash45Other Investment Net ndash4537 ndash884 ndash4734 ndash2601 ndash371 ndash208 ndash1867 ndash1113 ndash93 ndash2394Change in Reserves 159 45 ndash31 ndash36 ndash63 21 ndash17 50 02 00
Euro AreaFinancial Account Balance ndash409 1826 4390 3376 2979 3726 4248 3301
Direct Investment Net 1249 589 135 691 1785 2068 887 423 Portfolio Investment Net ndash3834 ndash1770 ndash1685 754 1912 5098 3354 2556 Financial Derivatives Net 55 389 418 658 956 169 271 1145 Other Investment Net 1977 2428 5442 1230 ndash1792 ndash3780 ndash248 ndash1119 Change in Reserves 143 190 80 44 118 171 ndash16 295 GermanyFinancial Account Balance 1677 1943 3000 3178 2594 2868 3199 2704 2691 2610
Direct Investment Net 103 336 260 878 684 465 540 514 530 550Portfolio Investment Net ndash514 668 2096 1777 2099 2203 2245 1336 1783 1634Financial Derivatives Net 398 309 318 508 338 321 132 275 223 190Other Investment Net 1651 611 314 48 ndash503 ndash140 297 574 155 235Change in Reserves 39 17 12 ndash33 ndash24 19 ndash15 05 00 00
FranceFinancial Account Balance ndash786 ndash480 ndash192 ndash103 ndash08 ndash186 ndash350 ndash323 ndash114 ndash114
Direct Investment Net 198 194 ndash139 472 79 418 115 652 456 481Portfolio Investment Net ndash3352 ndash506 ndash793 ndash238 432 02 266 ndash59 500 600Financial Derivatives Net ndash194 ndash184 ndash223 ndash318 145 ndash176 ndash14 ndash305 ndash398 ndash525Other Investment Net 2639 ndash36 982 ndash29 ndash742 ndash454 ndash683 ndash733 ndash697 ndash695Change in Reserves ndash77 52 ndash19 10 80 25 ndash34 123 24 25
ItalyFinancial Account Balance ndash799 ndash41 290 685 391 663 581 354 587 605
Direct Investment Net 172 68 09 31 27 ndash107 37 ndash37 ndash30 ndash25Portfolio Investment Net 256 ndash224 ndash54 55 1082 1765 988 1438 105 335Financial Derivatives Net ndash101 75 40 ndash48 26 ndash33 ndash82 ndash33 ndash13 ndash04Other Investment Net ndash1139 21 275 659 ndash750 ndash950 ndash392 ndash1045 525 300Change in Reserves 13 19 20 ndash13 06 ndash13 30 31 00 00
W O R L D E C O N O M I C O U T L O O K G L O B A L M A N U F A C T U R I N G D O W N T U R N R I S I N G T R A D E B A R R I E R S
170 International Monetary Fund | October 2019
Projections2011 2012 2013 2014 2015 2016 2017 2018 2019 2020
SpainFinancial Account Balance ndash414 24 442 161 243 274 244 262 201 225
Direct Investment Net 128 ndash272 ndash246 86 284 160 191 ndash110 ndash37 ndash37Portfolio Investment Net 431 537 ndash836 ndash121 118 561 286 101 484 495Financial Derivatives Net 29 ndash107 14 17 ndash13 ndash33 ndash25 15 00 00Other Investment Net ndash1142 ndash163 1503 128 ndash201 ndash505 ndash248 231 ndash247 ndash234Change in Reserves 139 28 07 51 56 91 40 25 00 00
JapanFinancial Account Balance 1584 539 ndash43 589 1809 2668 1668 1827 1691 1768
Direct Investment Net 1178 1175 1447 1186 1333 1375 1534 1329 1451 1564Portfolio Investment Net ndash1629 288 ndash2806 ndash422 1315 2765 ndash506 915 728 649Financial Derivatives Net ndash171 67 581 340 177 ndash161 304 08 09 09Other Investment Net 434 ndash611 348 ndash601 ndash1067 ndash1254 100 ndash666 ndash608 ndash569Change in Reserves 1773 ndash379 387 85 51 ndash57 236 240 110 115
United KingdomFinancial Account Balance ndash433 ndash926 ndash1325 ndash1542 ndash1426 ndash1458 ndash1158 ndash858 ndash972 ndash1020
Direct Investment Net 534 ndash348 ndash112 ndash1761 ndash1060 ndash2195 163 ndash146 ndash08 ndash117Portfolio Investment Net ndash2155 2750 ndash2842 164 ndash2018 ndash1954 ndash1349 ndash3617 00 00Financial Derivatives Net 74 ndash658 634 312 ndash1286 293 133 177 ndash50 ndash103Other Investment Net 1034 ndash2791 918 ndash375 2616 2310 ndash192 2481 ndash1064 ndash956Change in Reserves 79 121 78 117 322 88 88 248 151 156
CanadaFinancial Account Balance ndash494 ndash627 ndash569 ndash423 ndash562 ndash495 ndash404 ndash364 ndash325 ndash302
Direct Investment Net 125 128 ndash120 13 236 339 550 74 ndash80 53Portfolio Investment Net ndash1044 ndash638 ndash271 ndash329 ndash481 ndash1186 ndash805 ndash82 ndash300 ndash278Financial Derivatives Net Other Investment Net 343 ndash134 ndash225 ndash160 ndash402 295 ndash156 ndash340 55 ndash77Change in Reserves 81 17 47 53 86 56 08 ndash15 00 00
Other Advanced Economies1
Financial Account Balance 2860 2534 3761 3431 2910 3321 3067 3247 3382 3259Direct Investment Net ndash62 ndash337 308 ndash63 ndash1012 ndash719 ndash738 ndash712 ndash553 ndash476Portfolio Investment Net 472 1500 1396 1815 3355 2640 1793 3611 3142 2737Financial Derivatives Net 311 ndash288 ndash335 ndash235 ndash129 41 ndash42 276 90 92Other Investment Net 888 ndash1100 1367 847 ndash1055 ndash144 ndash77 ndash444 417 683Change in Reserves 1251 2747 1013 1063 1759 1502 2131 516 276 223
Table A13 Summary of Financial Account Balances (continued)(Billions of US dollars)
S TAT I S T I C A L A P P E N D I X
International Monetary Fund | October 2019 171
Projections2011 2012 2013 2014 2015 2016 2017 2018 2019 2020
Emerging Market and Developing Economies
Financial Account Balance 2329 1069 265 288 ndash2728 ndash3959 ndash2391 ndash1606 215 ndash1004Direct Investment Net ndash5316 ndash4942 ndash4828 ndash4301 ndash3448 ndash2594 ndash3029 ndash3832 ndash3849 ndash4086Portfolio Investment Net ndash1343 ndash2445 ndash1502 ndash897 1233 ndash546 ndash2106 ndash1161 ndash209 ndash81Financial Derivatives Net Other Investment Net 1527 4152 756 4085 4688 3967 1108 2327 3123 2389Change in Reserves 7420 4324 5837 1264 ndash5271 ndash4710 1613 1028 1158 771
Regional GroupsEmerging and Developing AsiaFinancial Account Balance 619 134 372 1528 754 ndash245 ndash638 ndash2040 930 524
Direct Investment Net ndash2767 ndash2200 ndash2713 ndash2013 ndash1395 ndash257 ndash1033 ndash1829 ndash1786 ndash1918Portfolio Investment Net ndash579 ndash1156 ndash648 ndash1244 816 310 ndash697 ndash1013 52 358Financial Derivatives Net ndash03 15 ndash20 07 07 ndash46 23 47 ndash13 ndash09Other Investment Net ndash298 2095 ndash729 2819 4615 3568 ndash883 530 1912 1395Change in Reserves 4286 1403 4449 1933 ndash3300 ndash3822 1971 236 773 710
Emerging and Developing EuropeFinancial Account Balance ndash326 ndash259 ndash646 ndash302 632 27 ndash180 1047 711 339
Direct Investment Net ndash395 ndash377 ndash156 05 ndash259 ndash451 ndash280 ndash206 ndash128 ndash62Portfolio Investment Net ndash407 ndash929 ndash378 235 541 ndash73 ndash351 139 ndash157 ndash123Financial Derivatives Net 36 ndash17 ndash11 55 54 02 ndash23 ndash30 07 09Other Investment Net 168 548 ndash25 621 314 200 309 670 416 126Change in Reserves 272 516 ndash77 ndash1218 ndash18 350 165 474 573 389
Latin America and the CaribbeanFinancial Account Balance ndash1266 ndash1559 ndash1968 ndash1967 ndash1868 ndash971 ndash892 ndash1139 ndash806 ndash811
Direct Investment Net ndash1468 ndash1585 ndash1498 ndash1384 ndash1319 ndash1254 ndash1220 ndash1455 ndash1399 ndash1373Portfolio Investment Net ndash1044 ndash809 ndash1004 ndash1094 ndash508 ndash494 ndash419 ndash49 92 ndash130Financial Derivatives Net 55 25 18 70 12 ndash29 39 39 34 36Other Investment Net 110 221 398 48 236 595 534 189 505 553Change in Reserves 1081 589 118 393 ndash288 211 172 138 ndash37 105
Middle East and Central AsiaFinancial Account Balance 3438 2999 3058 1796 ndash1525 ndash2188 ndash311 959 ndash89 ndash461
Direct Investment Net ndash360 ndash432 ndash227 ndash426 ndash103 ndash291 ndash126 ndash46 ndash97 ndash232Portfolio Investment Net 880 730 752 1299 618 ndash122 ndash415 ndash39 ndash97 ndash63Financial Derivatives Net Other Investment Net 1350 1085 1213 686 ndash517 ndash423 1055 905 239 299Change in Reserves 1575 1617 1320 237 ndash1518 ndash1350 ndash823 141 ndash128 ndash458
Sub-Saharan AfricaFinancial Account Balance ndash136 ndash245 ndash550 ndash766 ndash721 ndash582 ndash369 ndash433 ndash531 ndash595
Direct Investment Net ndash326 ndash346 ndash235 ndash483 ndash373 ndash341 ndash370 ndash295 ndash439 ndash502Portfolio Investment Net ndash192 ndash282 ndash223 ndash93 ndash234 ndash167 ndash224 ndash199 ndash98 ndash124Financial Derivatives Net ndash17 ndash17 ndash08 ndash15 ndash04 09 03 ndash05 ndash05 ndash05Other Investment Net 197 204 ndash102 ndash89 40 27 93 32 51 17Change in Reserves 206 200 26 ndash80 ndash147 ndash100 128 37 ndash23 26
Table A13 Summary of Financial Account Balances (continued)(Billions of US dollars)
W O R L D E C O N O M I C O U T L O O K G L O B A L M A N U F A C T U R I N G D O W N T U R N R I S I N G T R A D E B A R R I E R S
172 International Monetary Fund | October 2019
Projections2011 2012 2013 2014 2015 2016 2017 2018 2019 2020
Analytical GroupsBy Source of Export Earnings
FuelFinancial Account Balance 5121 4471 3753 2269 ndash828 ndash1562 663 2782 1521 782
Direct Investment Net ndash231 ndash282 148 66 63 ndash277 224 383 235 188Portfolio Investment Net 981 414 875 1774 932 ndash123 ndash421 ndash47 ndash117 ndash49Financial Derivatives Net Other Investment Net 2437 1989 1744 1450 ndash17 301 1407 1810 1132 860Change in Reserves 1927 2336 981 ndash1076 ndash1875 ndash1464 ndash553 643 274 ndash214
NonfuelFinancial Account Balance ndash2792 ndash3402 ndash3487 ndash1982 ndash1900 ndash2397 ndash3054 ndash4389 ndash1306 ndash1785
Direct Investment Net ndash5085 ndash4660 ndash4975 ndash4367 ndash3511 ndash2318 ndash3253 ndash4215 ndash4084 ndash4275Portfolio Investment Net ndash2324 ndash2859 ndash2377 ndash2671 301 ndash423 ndash1685 ndash1114 ndash92 ndash32Financial Derivatives Net 58 ndash09 ndash24 65 ndash02 ndash64 37 58 24 32Other Investment Net ndash909 2163 ndash988 2635 4705 3666 ndash299 517 1991 1530Change in Reserves 5492 1988 4856 2340 ndash3396 ndash3247 2166 384 884 985
By External Financing SourceNet Debtor EconomiesFinancial Account Balance ndash3555 ndash4099 ndash4030 ndash3575 ndash2938 ndash2294 ndash2672 ndash2797 ndash2620 ndash3076
Direct Investment Net ndash2758 ndash2788 ndash2700 ndash2798 ndash2893 ndash2885 ndash2658 ndash3054 ndash3076 ndash3242Portfolio Investment Net ndash1863 ndash2215 ndash1783 ndash1884 ndash307 ndash542 ndash1191 ndash217 ndash720 ndash774Financial Derivatives Net Other Investment Net ndash679 ndash270 ndash295 ndash25 385 393 135 371 359 307Change in Reserves 1719 1218 742 1034 ndash106 881 1024 119 816 619
Net Debtor Economies by Debt-Servicing ExperienceEconomies with Arrears
andor Rescheduling during 2014ndash18
Financial Account Balance ndash146 ndash381 ndash365 ndash289 ndash470 ndash533 ndash348 ndash221 ndash279 ndash353Direct Investment Net ndash146 ndash166 ndash101 ndash166 ndash344 ndash237 ndash139 ndash177 ndash235 ndash282Portfolio Investment Net 10 ndash13 ndash118 ndash17 ndash12 ndash23 ndash248 ndash189 ndash94 ndash105Financial Derivatives Net Other Investment Net 44 05 ndash182 18 ndash158 ndash210 101 101 17 10Change in Reserves ndash55 ndash208 38 ndash121 47 ndash60 ndash59 48 38 30
MemorandumWorldFinancial Account Balance ndash47 ndash466 2566 3434 521 405 1556 1623 4074 1553
Note The estimates in this table are based on individual countriesrsquo national accounts and balance-of-payments statistics Country group composites are calculated as the sum of the US dollar values for the relevant individual countries Some group aggregates for the financial derivatives are not shown because of incomplete data Projections for the euro area are not available because of data constraints1Excludes the Group of Seven (Canada France Germany Italy Japan United Kingdom United States) and euro area countries
Table A13 Summary of Financial Account Balances (continued)(Billions of US dollars)
S TAT I S T I C A L A P P E N D I X
International Monetary Fund | October 2019 173
Table A14 Summary of Net Lending and Borrowing(Percent of GDP)
ProjectionsAverages Average
2001ndash10 2005ndash12 2013 2014 2015 2016 2017 2018 2019 2020 2021ndash24
Advanced EconomiesNet Lending and Borrowing ndash07 ndash06 05 05 06 07 08 06 06 05 04
Current Account Balance ndash07 ndash06 04 05 06 07 09 07 06 05 04Savings 217 215 219 226 228 223 227 226 225 224 226Investment 224 221 212 215 216 214 218 220 220 220 222
Capital Account Balance 00 00 00 00 00 00 00 ndash01 00 00 00United StatesNet Lending and Borrowing ndash44 ndash40 ndash21 ndash21 ndash22 ndash23 ndash22 ndash24 ndash25 ndash25 ndash23
Current Account Balance ndash44 ndash40 ndash21 ndash21 ndash22 ndash23 ndash23 ndash24 ndash25 ndash25 ndash24Savings 173 168 192 203 202 186 186 184 185 185 189Investment 215 208 204 208 211 204 206 210 211 211 213
Capital Account Balance 00 00 00 00 00 00 01 00 00 00 00Euro AreaNet Lending and Borrowing 01 01 25 26 29 31 31 26
Current Account Balance 00 00 23 25 27 31 32 29 28 27 23Savings 229 228 225 230 238 243 249 251 250 251 251Investment 225 222 198 201 206 209 213 216 217 218 222
Capital Account Balance 01 01 02 01 02 00 ndash02 ndash03 GermanyNet Lending and Borrowing 42 60 65 73 86 85 80 74 70 66 60
Current Account Balance 42 60 66 72 86 85 81 73 70 66 60Savings 248 263 266 276 286 287 288 291 288 287 289Investment 206 204 201 204 200 202 207 218 218 221 230
Capital Account Balance 00 00 00 01 00 01 ndash01 01 00 00 00FranceNet Lending and Borrowing 07 ndash03 ndash05 ndash10 ndash04 ndash04 ndash07 ndash05 ndash04 ndash04 ndash03
Current Account Balance 07 ndash03 ndash05 ndash10 ndash04 ndash05 ndash07 ndash06 ndash05 ndash05 ndash04Savings 230 225 218 218 223 221 226 229 228 228 226Investment 224 229 223 227 227 226 234 235 233 233 230
Capital Account Balance 00 00 00 ndash01 00 01 00 01 01 01 01ItalyNet Lending and Borrowing ndash12 ndash18 09 21 17 24 26 25 29 30 25
Current Account Balance ndash13 ndash19 10 19 13 25 26 25 29 29 24Savings 199 187 179 189 186 201 202 205 204 204 202Investment 211 207 170 170 173 176 176 180 176 175 178
Capital Account Balance 01 01 00 02 04 ndash02 00 00 01 01 01SpainNet Lending and Borrowing ndash55 ndash54 22 16 18 25 21 14 14 16 16
Current Account Balance ndash61 ndash59 15 11 12 23 18 09 09 10 11Savings 219 207 202 205 216 227 229 228 231 233 236Investment 280 265 187 195 204 204 211 219 222 223 226
Capital Account Balance 06 05 06 05 07 02 02 05 05 05 05JapanNet Lending and Borrowing 32 30 07 07 31 39 41 35 33 33 34
Current Account Balance 33 31 09 08 31 40 42 35 33 33 35Savings 274 263 241 247 271 274 281 280 279 280 281Investment 241 232 232 239 240 234 239 244 246 247 246
Capital Account Balance ndash01 ndash01 ndash01 00 ndash01 ndash01 ndash01 00 ndash01 ndash01 ndash01United KingdomNet Lending and Borrowing ndash29 ndash32 ndash52 ndash50 ndash50 ndash53 ndash34 ndash40 ndash35 ndash38 ndash38
Current Account Balance ndash29 ndash32 ndash51 ndash49 ndash49 ndash52 ndash33 ndash39 ndash35 ndash37 ndash37Savings 143 134 111 123 123 120 139 133 130 126 130Investment 172 166 162 173 172 173 172 172 164 162 167
Capital Account Balance 00 00 ndash01 ndash01 ndash01 ndash01 ndash01 ndash01 ndash01 ndash01 ndash01
W O R L D E C O N O M I C O U T L O O K G L O B A L M A N U F A C T U R I N G D O W N T U R N R I S I N G T R A D E B A R R I E R S
174 International Monetary Fund | October 2019
ProjectionsAverages Average
2001ndash10 2005ndash12 2013 2014 2015 2016 2017 2018 2019 2020 2021ndash24
CanadaNet Lending and Borrowing 04 ndash11 ndash32 ndash24 ndash35 ndash32 ndash28 ndash26 ndash19 ndash17 ndash16
Current Account Balance 05 ndash11 ndash32 ndash24 ndash35 ndash32 ndash28 ndash26 ndash19 ndash17 ndash16Savings 226 225 217 225 203 197 207 204 207 208 210Investment 221 236 249 249 238 229 235 230 226 225 226
Capital Account Balance 00 00 00 00 00 00 00 00 00 00 00Other Advanced Economies1
Net Lending and Borrowing 40 40 50 50 52 53 45 48 47 43 40Current Account Balance 40 40 50 51 56 52 47 49 48 44 40
Savings 300 305 304 306 308 303 304 303 299 294 290Investment 257 262 253 253 249 250 255 255 250 249 248
Capital Account Balance 00 00 01 ndash01 ndash04 01 ndash02 ndash01 ndash01 ndash01 ndash01Emerging Market and Developing
EconomiesNet Lending and Borrowing 25 27 07 06 ndash01 ndash02 01 01 00 ndash03 ndash06
Current Account Balance 25 26 06 06 ndash02 ndash03 00 00 00 ndash04 ndash07Savings 303 326 329 329 323 317 323 329 326 322 318Investment 281 303 325 325 327 319 325 330 327 327 326
Capital Account Balance 01 02 02 00 01 01 01 01 01 01 01Regional Groups
Emerging and Developing AsiaNet Lending and Borrowing 37 37 08 16 20 14 10 ndash01 04 02 ndash01
Current Account Balance 36 36 07 15 20 14 10 ndash01 04 02 ndash01Savings 398 431 431 436 425 410 410 404 399 392 381Investment 364 396 423 421 405 396 401 406 395 390 382
Capital Account Balance 01 01 01 00 00 00 00 00 00 00 00Emerging and Developing EuropeNet Lending and Borrowing 01 ndash05 ndash09 ndash07 16 ndash01 ndash03 22 19 09 02
Current Account Balance 02 ndash06 ndash14 ndash03 09 ndash04 ndash06 17 16 06 00Savings 229 235 228 234 246 235 242 258 252 244 241Investment 226 240 242 237 236 238 248 240 235 238 241
Capital Account Balance ndash02 01 05 ndash04 07 03 03 05 04 03 02Latin America and the CaribbeanNet Lending and Borrowing ndash01 ndash05 ndash28 ndash30 ndash32 ndash19 ndash14 ndash19 ndash15 ndash15 ndash17
Current Account Balance ndash02 ndash06 ndash28 ndash31 ndash32 ndash19 ndash14 ndash19 ndash16 ndash15 ndash17Savings 204 211 191 178 164 169 167 177 178 180 181Investment 206 216 222 215 211 185 185 196 194 195 198
Capital Account Balance 01 01 01 00 00 00 00 00 00 00 00Middle East and Central AsiaNet Lending and Borrowing 73 95 90 58 ndash36 ndash39 ndash07 28 ndash03 ndash12 ndash20
Current Account Balance 77 99 88 52 ndash39 ndash41 ndash07 27 ndash04 ndash14 ndash22Savings 343 371 351 314 237 232 276 297 273 273 271Investment 276 280 259 256 272 265 286 271 277 287 294
Capital Account Balance 01 01 00 02 00 01 01 01 01 01 01Sub-Saharan AfricaNet Lending and Borrowing 18 19 ndash18 ndash32 ndash56 ndash35 ndash19 ndash23 ndash32 ndash34 ndash30
Current Account Balance 05 05 ndash22 ndash36 ndash60 ndash39 ndash23 ndash27 ndash36 ndash38 ndash34Savings 208 217 195 193 173 180 190 180 176 176 187Investment 209 216 217 226 228 215 212 206 212 214 216
Capital Account Balance 13 14 04 04 04 04 04 04 04 04 04
Table A14 Summary of Net Lending and Borrowing (continued)(Percent of GDP)
S TAT I S T I C A L A P P E N D I X
International Monetary Fund | October 2019 175
ProjectionsAverages Average
2001ndash10 2005ndash12 2013 2014 2015 2016 2017 2018 2019 2020 2021ndash24
Analytical GroupsBy Source of Export Earnings
FuelNet Lending and Borrowing 87 100 74 47 ndash15 ndash15 17 56 28 14 04
Current Account Balance 92 104 74 51 ndash15 ndash16 17 56 28 13 04Savings 336 353 322 297 242 242 278 308 286 280 276Investment 250 253 251 247 267 245 264 250 256 265 271
Capital Account Balance ndash02 00 00 ndash07 ndash01 00 00 00 00 00 00NonfuelNet Lending and Borrowing 09 06 ndash10 ndash04 02 01 ndash02 ndash09 ndash04 ndash05 ndash08
Current Account Balance 06 04 ndash12 ndash06 01 00 ndash03 ndash10 ndash05 ndash06 ndash08Savings 294 319 330 337 339 331 332 333 332 329 325Investment 290 316 343 343 338 332 335 344 338 336 333
Capital Account Balance 02 02 02 02 02 01 01 01 01 01 01By External Financing Source
Net Debtor EconomiesNet Lending and Borrowing ndash07 ndash13 ndash24 ndash21 ndash21 ndash15 ndash15 ndash17 ndash17 ndash18 ndash20
Current Account Balance ndash10 ndash16 ndash27 ndash24 ndash24 ndash17 ndash17 ndash20 ndash19 ndash20 ndash21Savings 229 238 228 228 224 224 227 228 229 231 238Investment 241 256 254 251 248 241 244 248 248 252 258
Capital Account Balance 03 03 03 03 03 02 02 02 02 02 01Net Debtor Economies by
Debt-Servicing ExperienceEconomies with Arrears andor
Rescheduling during 2014ndash18Net Lending and Borrowing 00 ndash12 ndash40 ndash32 ndash56 ndash57 ndash42 ndash27 ndash36 ndash40 ndash36
Current Account Balance ndash04 ndash17 ndash42 ndash35 ndash59 ndash57 ndash44 ndash29 ndash39 ndash43 ndash39Savings 221 217 163 172 145 139 155 170 166 170 179Investment 232 236 205 201 205 199 204 200 207 215 219
Capital Account Balance 05 05 02 03 02 01 02 02 02 02 02MemorandumWorldNet Lending and Borrowing 01 04 06 05 03 04 05 04 04 02 00
Current Account Balance 01 03 05 05 03 03 05 04 03 01 00Savings 241 250 262 267 265 260 265 267 265 265 266Investment 240 247 255 258 260 254 260 263 262 263 266
Capital Account Balance 01 01 01 00 00 00 00 00 00 00 00
Note The estimates in this table are based on individual countriesrsquo national accounts and balance-of-payments statistics Country group composites are calculated as the sum of the US dollar values for the relevant individual countries This differs from the calculations in the April 2005 and earlier issues of the World Economic Outlook in which the composites were weighted by GDP valued at purchasing power parities as a share of total world GDP The estimates of gross national savings and investment (or gross capital formation) are from individual countriesrsquo national accounts statistics The estimates of the current account balance the capital account balance and the financial account balance (or net lendingnet borrowing) are from the balance-of-payments statistics The link between domestic transactions and transactions with the rest of the world can be expressed as accounting identities Savings (S ) minus investment (I ) is equal to the current account balance (CAB ) (S ndash I = CAB ) Also net lendingnet borrowing (NLB ) is the sum of the current account balance and the capital account balance (KAB ) (NLB = CAB + KAB ) In practice these identities do not hold exactly imbalances result from imperfections in source data and compilation as well as from asymmetries in group composition due to data availability1Excludes the Group of Seven (Canada France Germany Italy Japan United Kingdom United States) and euro area countries
Table A14 Summary of Net Lending and Borrowing (continued)(Percent of GDP)
W O R L D E C O N O M I C O U T L O O K G L O B A L M A N U F A C T U R I N G D O W N T U R N R I S I N G T R A D E B A R R I E R S
176 International Monetary Fund | October 2019
Table A15 Summary of World Medium-Term Baseline ScenarioProjections
Averages Averages2001ndash10 2011ndash20 2017 2018 2019 2020 2017ndash20 2021ndash24
World Real GDP 39 36 38 36 30 34 35 36Advanced Economies 17 19 25 23 17 17 20 16Emerging Market and Developing Economies 62 48 48 45 39 46 44 48MemorandumPotential Output
Major Advanced Economies 18 14 15 16 15 15 15 14World Trade Volume1 50 36 57 36 11 32 34 38Imports
Advanced Economies 35 33 47 30 12 27 29 31Emerging Market and Developing Economies 92 44 75 51 07 43 44 51
ExportsAdvanced Economies 39 33 47 31 09 25 28 31Emerging Market and Developing Economies 82 41 73 39 19 41 43 46
Terms of TradeAdvanced Economies ndash01 01 ndash02 ndash07 00 ndash01 ndash02 01Emerging Market and Developing Economies 10 ndash03 08 15 ndash13 ndash11 00 ndash01
World Prices in US DollarsManufactures 19 ndash02 ndash03 19 14 ndash02 07 08Oil 108 ndash31 233 294 ndash96 ndash62 78 ndash12Nonfuel Primary Commodities 89 ndash10 64 16 09 17 26 07Consumer PricesAdvanced Economies 20 15 17 20 15 18 17 19Emerging Market and Developing Economies 66 51 43 48 47 48 46 44Interest RatesReal Six-Month LIBOR2 07 ndash06 ndash04 01 05 00 01 02World Real Long-Term Interest Rate3 19 02 ndash02 ndash01 ndash03 ndash08 ndash04 ndash02Current Account BalancesAdvanced Economies ndash07 05 09 07 06 05 07 04Emerging Market and Developing Economies 25 03 00 00 00 ndash04 ndash01 ndash07Total External DebtEmerging Market and Developing Economies 304 299 307 316 310 302 309 284Debt ServiceEmerging Market and Developing Economies 90 107 99 110 109 106 106 1011Data refer to trade in goods and services2London interbank offered rate on US dollar deposits minus percent change in US GDP deflator3GDP-weighted average of 10-year (or nearest-maturity) government bond rates for Canada France Germany Italy Japan the United Kingdom and the United States
Annual Percent Change
Percent
Percent of GDP
International Monetary Fund | October 2019 177
World Economic Outlook ArchivesWorld Economic Outlook Financial Systems and Economic Cycles September 2006
World Economic Outlook Spillovers and Cycles in the Global Economy April 2007
World Economic Outlook Globalization and Inequality October 2007
World Economic Outlook Housing and the Business Cycle April 2008
World Economic Outlook Financial Stress Downturns and Recoveries October 2008
World Economic Outlook Crisis and Recovery April 2009
World Economic Outlook Sustaining the Recovery October 2009
World Economic Outlook Rebalancing Growth April 2010
World Economic Outlook Recovery Risk and Rebalancing October 2010
World Economic Outlook Tensions from the Two-Speed RecoverymdashUnemployment Commodities and Capital Flows April 2011
World Economic Outlook Slowing Growth Rising Risks September 2011
World Economic Outlook Growth Resuming Dangers Remain April 2012
World Economic Outlook Coping with High Debt and Sluggish Growth October 2012
World Economic Outlook Hopes Realities Risks April 2013
World Economic Outlook Transitions and Tensions October 2013
World Economic Outlook Recovery Strengthens Remains Uneven April 2014
World Economic Outlook Legacies Clouds Uncertainties October 2014
World Economic Outlook Uneven GrowthmdashShort- and Long-Term Factors April 2015
World Economic Outlook Adjusting to Lower Commodity Prices October 2015
World Economic Outlook Too Slow for Too Long April 2016
World Economic Outlook Subdued DemandmdashSymptoms and Remedies October 2016
World Economic Outlook Gaining Momentum April 2017
World Economic Outlook Seeking Sustainable Growth Short-Term Recovery Long-Term Challenges October 2017
World Economic Outlook Cyclical Upswing Structural Change April 2018
World Economic Outlook Challenges to Steady Growth October 2018
World Economic Outlook Growth Slowdown Precarious Recovery April 2019
World Economic Outlook Global Manufacturing Downturn Rising Trade Barriers October 2019
I MethodologymdashAggregation Modeling and ForecastingMeasuring Inequality Conceptual Methodological and Measurement Issues October 2007 Box 41New Business Cycle Indices for Latin America A Historical Reconstruction October 2007 Box 53Implications of New PPP Estimates for Measuring Global Growth April 2008 Appendix 11Measuring Output Gaps October 2008 Box 13Assessing and Communicating Risks to the Global Outlook October 2008 Appendix 11Fan Chart for Global Growth April 2009 Appendix 12Indicators for Tracking Growth October 2010 Appendix 12Inferring Potential Output from Noisy Data The Global Projection Model View October 2010 Box 13Uncoordinated Rebalancing October 2010 Box 14
WORLD ECONOMIC OUTLOOK SELECTED TOPICS
WO R L D E CO N O M I C O U T LO O K G LO B A L M A N U FAC T U R I N G D OW N T U R N R IS I N G T R A D E B A R R I E R S
178 International Monetary Fund | October 2019
World Economic Outlook Downside Scenarios April 2011 Box 12
Fiscal Balance Sheets The Significance of Nonfinancial Assets and Their Measurement October 2014 Box 33
Tariff Scenarios October 2016 Scenario Box
World Growth Projections over the Medium Term October 2016 Box 11
Global Growth Forecast Assumptions on Policies Financial Conditions and Commodity Prices April 2019 Box 12
On the Underlying Source of Changes in Capital Goods Prices A Model-Based Analysis April 2019 Box 33
Global Growth Forecast Assumptions on Policies Financial Conditions and Commodity Prices October 2019 Box 13
II Historical SurveysHistorical Perspective on Growth and the Current Account October 2008 Box 63
A Historical Perspective on International Financial Crises October 2009 Box 41
The Good the Bad and the Ugly 100 Years of Dealing with Public Debt Overhangs October 2012 Chapter 3
What Is the Effect of Recessions October 2015 Box 11
III Economic GrowthmdashSources and PatternsAsia Rising Patterns of Economic Development and Growth September 2006 Chapter 3
Japanrsquos Potential Output and Productivity Growth September 2006 Box 31
The Evolution and Impact of Corporate Governance Quality in Asia September 2006 Box 32
Decoupling the Train Spillovers and Cycles in the Global Economy April 2007 Chapter 4
Spillovers and International Business Cycle Synchronization A Broader Perspective April 2007 Box 43
The Discounting Debate October 2007 Box 17
Taxes versus Quantities under Uncertainty (Weitzman 1974) October 2007 Box 18
Experience with Emissions Trading in the European Union October 2007 Box 19
Climate Change Economic Impact and Policy Responses October 2007 Appendix 12
What Risks Do Housing Markets Pose for Global Growth October 2007 Box 21
The Changing Dynamics of the Global Business Cycle October 2007 Chapter 5
Major Economies and Fluctuations in Global Growth October 2007 Box 51
Improved Macroeconomic PerformancemdashGood Luck or Good Policies October 2007 Box 52
House Prices Corrections and Consequences October 2008 Box 12
Global Business Cycles April 2009 Box 11
How Similar Is the Current Crisis to the Great Depression April 2009 Box 31
Is Credit a Vital Ingredient for Recovery Evidence from Industry-Level Data April 2009 Box 32
From Recession to Recovery How Soon and How Strong April 2009 Chapter 3
Whatrsquos the Damage Medium-Term Output Dynamics after Financial Crises October 2009 Chapter 4
Will the Recovery Be Jobless October 2009 Box 13
Unemployment Dynamics during Recessions and Recoveries Okunrsquos Law and Beyond April 2010 Chapter 3
Does Slow Growth in Advanced Economies Necessarily Imply Slow Growth in Emerging Economies October 2010 Box 11
The Global Recovery Where Do We Stand April 2012 Box 12
How Does Uncertainty Affect Economic Performance October 2012 Box 13
Resilience in Emerging Market and Developing Economies Will It Last October 2012 Chapter 4
Jobs and Growth Canrsquot Have One without the Other October 2012 Box 41
Spillovers from Policy Uncertainty in the United States and Europe April 2013 Chapter 2 Spillover Feature
Breaking through the Frontier Can Todayrsquos Dynamic Low-Income Countries Make It April 2013 Chapter 4
What Explains the Slowdown in the BRICS October 2013 Box 12
Dancing Together Spillovers Common Shocks and the Role of Financial and Trade Linkages October 2013 Chapter 3
S E L E C T E D TO P I C S
International Monetary Fund | October 2019 179
Output Synchronicity in the Middle East North Africa Afghanistan and Pakistan and in the Caucasus and Central Asia October 2013 Box 31
Spillovers from Changes in US Monetary Policy October 2013 Box 32Saving and Economic Growth April 2014 Box 31On the Receiving End External Conditions and Emerging Market Growth before during
and after the Global Financial Crisis April 2014 Chapter 4The Impact of External Conditions on Medium-Term Growth in Emerging Market Economies April 2014 Box 41The Origins of IMF Growth Forecast Revisions since 2011 October 2014 Box 12Underlying Drivers of US Yields Matter for Spillovers October 2014 Chapter 2
Spillover FeatureIs It Time for an Infrastructure Push The Macroeconomic Effects of Public Investment October 2014 Chapter 3The Macroeconomic Effects of Scaling Up Public Investment in Developing Economies October 2014 Box 34Where Are We Headed Perspectives on Potential Output April 2015 Chapter 3Steady as She GoesmdashEstimating Sustainable Output April 2015 Box 31Macroeconomic Developments and Outlook in Low-Income Developing Countriesmdash
The Role of External Factors April 2016 Box 12Time for a Supply-Side Boost Macroeconomic Effects of Labor and Product Market
Reforms in Advanced Economies April 2016 Chapter 3Road Less Traveled Growth in Emerging Market and Developing Economies in a Complicated
External Environment April 2017 Chapter 3Growing with Flows Evidence from Industry-Level Data April 2017 Box 22Emerging Market and Developing Economy Growth Heterogeneity and Income Convergence
over the Forecast Horizon October 2017 Box 13Manufacturing Jobs Implications for Productivity and Inequality April 2018 Chapter 3Is Productivity Growth Shared in a Globalized Economy April 2018 Chapter 4Recent Dynamics of Potential Growth April 2018 Box 13Growth Outlook Advanced Economies October 2018 Box 12Growth Outlook Emerging Market and Developing Economies October 2018 Box 13The Global Recovery 10 Years after the 2008 Financial Meltdown October 2018 Chapter 2The Plucking Theory of the Business Cycle October 2019 Box 14Reigniting Growth in Low-Income and Emerging Market Economies What Role Can
Structural Reforms Play October 2019 Chapter 3
IV Inflation and Deflation and Commodity MarketsThe Boom in Nonfuel Commodity Prices Can It Last September 2006 Chapter 5International Oil Companies and National Oil Companies in a Changing Oil Sector Environment September 2006 Box 14Commodity Price Shocks Growth and Financing in Sub-Saharan Africa September 2006 Box 22Has Speculation Contributed to Higher Commodity Prices September 2006 Box 51Agricultural Trade Liberalization and Commodity Prices September 2006 Box 52Recent Developments in Commodity Markets September 2006 Appendix 21Who Is Harmed by the Surge in Food Prices October 2007 Box 11Refinery Bottlenecks October 2007 Box 15Making the Most of Biofuels October 2007 Box 16Commodity Market Developments and Prospects April 2008 Appendix 12Dollar Depreciation and Commodity Prices April 2008 Box 14Why Hasnrsquot Oil Supply Responded to Higher Prices April 2008 Box 15Oil Price Benchmarks April 2008 Box 16Globalization Commodity Prices and Developing Countries April 2008 Chapter 5The Current Commodity Price Boom in Perspective April 2008 Box 52
WO R L D E CO N O M I C O U T LO O K G LO B A L M A N U FAC T U R I N G D OW N T U R N R IS I N G T R A D E B A R R I E R S
180 International Monetary Fund | October 2019
Is Inflation Back Commodity Prices and Inflation October 2008 Chapter 3Does Financial Investment Affect Commodity Price Behavior October 2008 Box 31Fiscal Responses to Recent Commodity Price Increases An Assessment October 2008 Box 32Monetary Policy Regimes and Commodity Prices October 2008 Box 33Assessing Deflation Risks in the G3 Economies April 2009 Box 13Will Commodity Prices Rise Again When the Global Economy Recovers April 2009 Box 15Commodity Market Developments and Prospects April 2009 Appendix 11Commodity Market Developments and Prospects October 2009 Appendix 11What Do Options Markets Tell Us about Commodity Price Prospects October 2009 Box 16What Explains the Rise in Food Price Volatility October 2009 Box 17How Unusual Is the Current Commodity Price Recovery April 2010 Box 12Commodity Futures Price Curves and Cyclical Market Adjustment April 2010 Box 13Commodity Market Developments and Prospects October 2010 Appendix 11Dismal Prospects for the Real Estate Sector October 2010 Box 12Have Metals Become More Scarce and What Does Scarcity Mean for Prices October 2010 Box 15Commodity Market Developments and Prospects April 2011 Appendix 12Oil Scarcity Growth and Global Imbalances April 2011 Chapter 3Life Cycle Constraints on Global Oil Production April 2011 Box 31Unconventional Natural Gas A Game Changer April 2011 Box 32Short-Term Effects of Oil Shocks on Economic Activity April 2011 Box 33Low-Frequency Filtering for Extracting Business Cycle Trends April 2011 Appendix 31The Energy and Oil Empirical Models April 2011 Appendix 32Commodity Market Developments and Prospects September 2011 Appendix 11Financial Investment Speculation and Commodity Prices September 2011 Box 14Target What You Can Hit Commodity Price Swings and Monetary Policy September 2011 Chapter 3Commodity Market Review April 2012 Chapter 1
Special FeatureCommodity Price Swings and Commodity Exporters April 2012 Chapter 4Macroeconomic Effects of Commodity Price Shocks on Low-Income Countries April 2012 Box 41Volatile Commodity Prices and the Development Challenge in Low-Income Countries April 2012 Box 42Commodity Market Review October 2012 Chapter 1
Special FeatureUnconventional Energy in the United States October 2012 Box 14Food Supply Crunch Who Is Most Vulnerable October 2012 Box 15Commodity Market Review April 2013 Chapter 1
Special FeatureThe Dog That Didnrsquot Bark Has Inflation Been Muzzled or Was It Just Sleeping April 2013 Chapter 3Does Inflation Targeting Still Make Sense with a Flatter Phillips Curve April 2013 Box 31Commodity Market Review October 2013 Chapter 1
Special FeatureEnergy Booms and the Current Account Cross-Country Experience October 2013 Box 1SF1Oil Price Drivers and the Narrowing WTI-Brent Spread October 2013 Box 1SF2Anchoring Inflation Expectations When Inflation Is Undershooting April 2014 Box 13Commodity Prices and Forecasts April 2014 Chapter 1
Special FeatureCommodity Market Developments and Forecasts with a Focus on Natural Gas October 2014 Chapter 1
in the World Economy Special FeatureCommodity Market Developments and Forecasts with a Focus on Investment April 2015 Chapter 1
in an Era of Low Oil Prices Special Feature
The Oil Price Collapse Demand or Supply April 2015 Box 11
S E L E C T E D TO P I C S
International Monetary Fund | October 2019 181
Commodity Market Developments and Forecasts with a Focus on Metals in the World Economy October 2015 Chapter 1 Special Feature
The New Frontiers of Metal Extraction The North-to-South Shift October 2015 Chapter 1 Special Feature Box 1SF1
Where Are Commodity Exporters Headed Output Growth in the Aftermath of the Commodity Boom October 2015 Chapter 2
The Not-So-Sick Patient Commodity Booms and the Dutch Disease Phenomenon October 2015 Box 21
Do Commodity Exportersrsquo Economies Overheat during Commodity Booms October 2015 Box 24
Commodity Market Developments and Forecasts with a Focus on the April 2016 Chapter 1 Energy Transition in an Era of Low Fossil Fuel Prices Special Feature
Global Disinflation in an Era of Constrained Monetary Policy October 2016 Chapter 3
Commodity Market Developments and Forecasts with a Focus on Food Security and October 2016 Chapter 1 Markets in the World Economy Special Feature
How Much Do Global Prices Matter for Food Inflation October 2016 Box 33
Commodity Market Developments and Forecasts with a Focus on the Role of Technology and April 2017 Chapter 1 Unconventional Sources in the Global Oil Market Special Feature
Commodity Market Developments and Forecasts October 2017 Chapter 1 Special Feature
Commodity Market Developments and Forecasts April 2018 Chapter 1 Special Feature
What Has Held Core Inflation Back in Advanced Economies April 2018 Box 12
The Role of Metals in the Economics of Electric Vehicles April 2018 Box 1SF1
Inflation Outlook Regions and Countries October 2018 Box 14
Commodity Market Developments and Forecasts with a Focus on Recent Trends in Energy Demand October 2018 Chapter 1 Special Feature
The Demand and Supply of Renewable Energy October 2018 Box 1SF1
Challenges for Monetary Policy in Emerging Markets as Global Financial Conditions Normalize October 2018 Chapter 3
Inflation Dynamics in a Wider Group of Emerging Market and Developing Economies October 2018 Box 31
Commodity Special Feature April 2019 Chapter 1 Special Feature
Special Feature Commodity Market Developments and Forecasts October 2019 Chapter 1 Special Feature
V Fiscal PolicyImproved Emerging Market Fiscal Performance Cyclical or Structural September 2006 Box 21
When Does Fiscal Stimulus Work April 2008 Box 21
Fiscal Policy as a Countercyclical Tool October 2008 Chapter 5
Differences in the Extent of Automatic Stabilizers and Their Relationship with Discretionary Fiscal Policy October 2008 Box 51
Why Is It So Hard to Determine the Effects of Fiscal Stimulus October 2008 Box 52
Have the US Tax Cuts Been ldquoTTTrdquo [Timely Temporary and Targeted] October 2008 Box 53
Will It Hurt Macroeconomic Effects of Fiscal Consolidation October 2010 Chapter 3
Separated at Birth The Twin Budget and Trade Balances September 2011 Chapter 4
Are We Underestimating Short-Term Fiscal Multipliers October 2012 Box 11
The Implications of High Public Debt in Advanced Economies October 2012 Box 12
The Good the Bad and the Ugly 100 Years of Dealing with Public Debt Overhangs October 2012 Chapter 3
The Great Divergence of Policies April 2013 Box 11
Public Debt Overhang and Private Sector Performance April 2013 Box 12
Is It Time for an Infrastructure Push The Macroeconomic Effects of Public Investment October 2014 Chapter 3
Improving the Efficiency of Public Investment October 2014 Box 32
WO R L D E CO N O M I C O U T LO O K G LO B A L M A N U FAC T U R I N G D OW N T U R N R IS I N G T R A D E B A R R I E R S
182 International Monetary Fund | October 2019
The Macroeconomic Effects of Scaling Up Public Investment in Developing Economies October 2014 Box 34Fiscal Institutions Rules and Public Investment October 2014 Box 35Commodity Booms and Public Investment October 2015 Box 22Cross-Border Impacts of Fiscal Policy Still Relevant October 2017 Chapter 4The Spillover Impact of US Government Spending Shocks on External Positions October 2017 Box 41Macroeconomic Impact of Corporate Tax Policy Changes April 2018 Box 15Place-Based Policies Rethinking Fiscal Policies to Tackle Inequalities within Countries October 2019 Box 24
VI Monetary Policy Financial Markets and Flow of FundsHow Do Financial Systems Affect Economic Cycles September 2006 Chapter 4Financial Leverage and Debt Deflation September 2006 Box 41Financial Linkages and Spillovers April 2007 Box 41Macroeconomic Conditions in Industrial Countries and Financial Flows to Emerging Markets April 2007 Box 42Macroeconomic Implications of Recent Market Turmoil Patterns from Previous Episodes October 2007 Box 12What Is Global Liquidity October 2007 Box 14The Changing Housing Cycle and the Implications for Monetary Policy April 2008 Chapter 3Is There a Credit Crunch April 2008 Box 11Assessing Vulnerabilities to Housing Market Corrections April 2008 Box 31Financial Stress and Economic Downturns October 2008 Chapter 4The Latest Bout of Financial Distress How Does It Change the Global Outlook October 2008 Box 11Policies to Resolve Financial System Stress and Restore Sound Financial Intermediation October 2008 Box 41How Vulnerable Are Nonfinancial Firms April 2009 Box 12The Case of Vanishing Household Wealth April 2009 Box 21Impact of Foreign Bank Ownership during Home-Grown Crises April 2009 Box 41A Financial Stress Index for Emerging Economies April 2009 Appendix 41Financial Stress in Emerging Economies Econometric Analysis April 2009 Appendix 42How Linkages Fuel the Fire April 2009 Chapter 4Lessons for Monetary Policy from Asset Price Fluctuations October 2009 Chapter 3Were Financial Markets in Emerging Economies More Resilient than in Past Crises October 2009 Box 12Risks from Real Estate Markets October 2009 Box 14Financial Conditions Indices April 2011 Appendix 11House Price Busts in Advanced Economies Repercussions for Global Financial Markets April 2011 Box 11International Spillovers and Macroeconomic Policymaking April 2011 Box 13Credit Boom-Bust Cycles Their Triggers and Policy Implications September 2011 Box 12Are Equity Price Drops Harbingers of Recession September 2011 Box 13Cross-Border Spillovers from Euro Area Bank Deleveraging April 2012 Chapter 2
Spillover FeatureThe Financial Transmission of Stress in the Global Economy October 2012 Chapter 2
Spillover FeatureThe Great Divergence of Policies April 2013 Box 11Taper Talks What to Expect When the United States Is Tightening October 2013 Box 11Credit Supply and Economic Growth April 2014 Box 11Should Advanced Economies Worry about Growth Shocks in Emerging Market Economies April 2014 Chapter 2
Spillover FeaturePerspectives on Global Real Interest Rates April 2014 Chapter 3Housing Markets across the Globe An Update October 2014 Box 11US Monetary Policy and Capital Flows to Emerging Markets April 2016 Box 22A Transparent Risk-Management Approach to Monetary Policy October 2016 Box 35
S E L E C T E D TO P I C S
International Monetary Fund | October 2019 183
Will the Revival in Capital Flows to Emerging Markets Be Sustained October 2017 Box 12The Role of Financial Sector Repair in the Speed of the Recovery October 2018 Box 23Clarity of Central Bank Communications and the Extent of Anchoring of Inflation Expectations October 2018 Box 32
VII Labor Markets Poverty and InequalityThe Globalization of Labor April 2007 Chapter 5Emigration and Trade How Do They Affect Developing Countries April 2007 Box 51Labor Market Reforms in the Euro Area and the Wage-Unemployment Trade-Off October 2007 Box 22Globalization and Inequality October 2007 Chapter 4The Dualism between Temporary and Permanent Contracts Measures Effects and Policy Issues April 2010 Box 31Short-Time Work Programs April 2010 Box 32Slow Recovery to Nowhere A Sectoral View of Labor Markets in Advanced Economies September 2011 Box 11The Labor Share in Europe and the United States during and after the Great Recession April 2012 Box 11Jobs and Growth Canrsquot Have One without the Other October 2012 Box 41Reforming Collective-Bargaining Systems to Achieve High and Stable Employment April 2016 Box 32Understanding the Downward Trend in Labor Shares April 2017 Chapter 3Labor Force Participation Rates in Advanced Economies October 2017 Box 11Recent Wage Dynamics in Advanced Economies Drivers and Implications October 2017 Chapter 2Labor Market Dynamics by Skill Level October 2017 Box 21Worker Contracts and Nominal Wage Rigidities in Europe Firm-Level Evidence October 2017 Box 22Wage and Employment Adjustment after the Global Financial Crisis Firm-Level Evidence October 2017 Box 23Labor Force Participation in Advanced Economies Drivers and Prospects April 2018 Chapter 2Youth Labor Force Participation in Emerging Market and Developing Economies versus
Advanced Economies April 2018 Box 21Storm Clouds Ahead Migration and Labor Force Participation Rates April 2018 Box 24Are Manufacturing Jobs Better Paid Worker-Level Evidence from Brazil April 2018 Box 33The Global Financial Crisis Migration and Fertility October 2018 Box 21The Employment Impact of Automation Following the Global Financial Crisis
the Case of Industrial Robots October 2018 Box 22Labor Market Dynamics in Select Advanced Economies April 2019 Box 11Worlds Apart Within-Country Regional Disparities April 2019 Box 13Closer Together or Further Apart Within-Country Regional Disparities and Adjustment in
Advanced Economies October 2019 Chapter 2Climate Change and Subnational Regional Disparities October 2019 Box 22
VIII Exchange Rate IssuesHow Emerging Market Countries May Be Affected by External Shocks September 2006 Box 13Exchange Rates and the Adjustment of External Imbalances April 2007 Chapter 3Exchange Rate Pass-Through to Trade Prices and External Adjustment April 2007 Box 33Depreciation of the US Dollar Causes and Consequences April 2008 Box 12Lessons from the Crisis On the Choice of Exchange Rate Regime April 2010 Box 11Exchange Rate Regimes and Crisis Susceptibility in Emerging Markets April 2014 Box 14Exchange Rates and Trade Flows Disconnected October 2015 Chapter 3The Relationship between Exchange Rates and Global-Value-Chain-Related Trade October 2015 Box 31Measuring Real Effective Exchange Rates and Competitiveness The Role of Global Value Chains October 2015 Box 32Labor Force Participation Rates in Advanced Economies October 2017 Box 11Recent Wage Dynamics in Advanced Economies Drivers and Implications October 2017 Chapter 2
WO R L D E CO N O M I C O U T LO O K G LO B A L M A N U FAC T U R I N G D OW N T U R N R IS I N G T R A D E B A R R I E R S
184 International Monetary Fund | October 2019
Labor Market Dynamics by Skill Level October 2017 Box 21Worker Contracts and Nominal Wage Rigidities in Europe Firm-Level Evidence October 2017 Box 22Wage and Employment Adjustment after the Global Financial Crisis Firm-Level Evidence October 2017 Box 23
IX External Payments Trade Capital Movements and Foreign DebtCapital Flows to Emerging Market Countries A Long-Term Perspective September 2006 Box 11
How Will Global Imbalances Adjust September 2006 Box 21
External Sustainability and Financial Integration April 2007 Box 31
Large and Persistent Current Account Imbalances April 2007 Box 32
Multilateral Consultation on Global Imbalances October 2007 Box 13
Managing the Macroeconomic Consequences of Large and Volatile Aid Flows October 2007 Box 23
Managing Large Capital Inflows October 2007 Chapter 3
Can Capital Controls Work October 2007 Box 31
Multilateral Consultation on Global Imbalances Progress Report April 2008 Box 13
How Does the Globalization of Trade and Finance Affect Growth Theory and Evidence April 2008 Box 51
Divergence of Current Account Balances across Emerging Economies October 2008 Chapter 6
Current Account Determinants for Oil-Exporting Countries October 2008 Box 61
Sovereign Wealth Funds Implications for Global Financial Markets October 2008 Box 62
Global Imbalances and the Financial Crisis April 2009 Box 14
Trade Finance and Global Trade New Evidence from Bank Surveys October 2009 Box 11
From Deficit to Surplus Recent Shifts in Global Current Accounts October 2009 Box 15
Getting the Balance Right Transitioning out of Sustained Current Account Surpluses April 2010 Chapter 4
Emerging Asia Responding to Capital Inflows October 2010 Box 21
Latin America-5 Riding Another Wave of Capital Inflows October 2010 Box 22
Do Financial Crises Have Lasting Effects on Trade October 2010 Chapter 4
Unwinding External Imbalances in the European Union Periphery April 2011 Box 21
International Capital Flows Reliable or Fickle April 2011 Chapter 4
External Liabilities and Crisis Tipping Points September 2011 Box 15
The Evolution of Current Account Deficits in the Euro Area April 2013 Box 13
External Rebalancing in the Euro Area October 2013 Box 13
The Yin and Yang of Capital Flow Management Balancing Capital Inflows with Capital Outflows October 2013 Chapter 4
Simulating Vulnerability to International Capital Market Conditions October 2013 Box 41
The Trade Implications of the US Shale Gas Boom October 2014 Box 1SF1
Are Global Imbalances at a Turning Point October 2014 Chapter 4
Switching Gears The 1986 External Adjustment October 2014 Box 41
A Tale of Two Adjustments East Asia and the Euro Area October 2014 Box 42
Understanding the Role of Cyclical and Structural Factors in the Global Trade Slowdown April 2015 Box 12
Small Economies Large Current Account Deficits October 2015 Box 12
Capital Flows and Financial Deepening in Developing Economies October 2015 Box 13
Dissecting the Global Trade Slowdown April 2016 Box 11
Understanding the Slowdown in Capital Flows to Emerging Markets April 2016 Chapter 2
Capital Flows to Low-Income Developing Countries April 2016 Box 21
The Potential Productivity Gains from Further Trade and Foreign Direct Investment Liberalization April 2016 Box 33
Global Trade Whatrsquos behind the Slowdown October 2016 Chapter 2
The Evolution of Emerging Market and Developing Economiesrsquo Trade Integration with Chinarsquos Final Demand April 2017 Box 23
S E L E C T E D TO P I C S
International Monetary Fund | October 2019 185
Shifts in the Global Allocation of Capital Implications for Emerging Market and Developing Economies April 2017 Box 24
Macroeconomic Adjustment in Emerging Market Commodity Exporters October 2017 Box 14Remittances and Consumption Smoothing October 2017 Box 15A Multidimensional Approach to Trade Policy Indicators April 2018 Box 16The Rise of Services Trade April 2018 Box 32Role of Foreign Aid in Improving Productivity in Low-Income Developing Countries April 2018 Box 43Global Trade Tensions October 2018 Scenario BoxThe Price of Capital Goods A Driver of Investment under Threat April 2019 Chapter 3Evidence from Big Data Capital Goods Prices across Countries April 2019 Box 32Capital Goods Tariffs and Investment Firm-Level Evidence from Colombia April 2019 Box 34The Drivers of Bilateral Trade and the Spillovers from Tariffs April 2019 Chapter 4Gross versus Value-Added Trade April 2019 Box 41Bilateral and Aggregate Trade Balances April 2019 Box 42Understanding Trade Deficit Adjustments Does Bilateral Trade Play a Special Role April 2019 Box 43The Global Macro and Micro Effects of a USndashChina Trade Dispute Insights from Three Models April 2019 Box 44A No-Deal Brexit April 2019 Scenario BoxImplications of Advanced Economies Reshoring Some Production October 2019 Scenario Box 11Trade Tensions Updated Scenario October 2019 Scenario Box 12The Decline in World Foreign Direct Investment in 2018 October 2019 Box 12
X Regional IssuesEMU 10 Years On October 2008 Box 21Vulnerabilities in Emerging Economies April 2009 Box 22East-West Linkages and Spillovers in Europe April 2012 Box 21The Evolution of Current Account Deficits in the Euro Area April 2013 Box 13Still Attached Labor Force Participation Trends in European Regions April 2018 Box 23
XI Country-Specific AnalysesWhy Is the US International Income Account Still in the Black and Will This Last September 2005 Box 12Is India Becoming an Engine for Global Growth September 2005 Box 14Saving and Investment in China September 2005 Box 21Chinarsquos GDP Revision What Does It Mean for China and the Global Economy April 2006 Box 16What Do Country Studies of the Impact of Globalization on Inequality Tell Us
Examples from Mexico China and India October 2007 Box 42Japan after the Plaza Accord April 2010 Box 41Taiwan Province of China in the Late 1980s April 2010 Box 42Did the Plaza Accord Cause Japanrsquos Lost Decades April 2011 Box 14Where Is Chinarsquos External Surplus Headed April 2012 Box 13The US Home Ownersrsquo Loan Corporation April 2012 Box 31Household Debt Restructuring in Iceland April 2012 Box 32Abenomics Risks after Early Success October 2013 Box 14Is Chinarsquos Spending Pattern Shifting (away from Commodities) April 2014 Box 12Public Investment in Japan during the Lost Decade October 2014 Box 31Japanese Exports Whatrsquos the Holdup October 2015 Box 33The Japanese Experience with Deflation October 2016 Box 32Permanently Displaced Labor Force Participation in US States and Metropolitan Areas April 2018 Box 22
WO R L D E CO N O M I C O U T LO O K G LO B A L M A N U FAC T U R I N G D OW N T U R N R IS I N G T R A D E B A R R I E R S
186 International Monetary Fund | October 2019
XII Special TopicsClimate Change and the Global Economy April 2008 Chapter 4Rising Car Ownership in Emerging Economies Implications for Climate Change April 2008 Box 41South Asia Illustrative Impact of an Abrupt Climate Shock April 2008 Box 42Macroeconomic Policies for Smoother Adjustment to Abrupt Climate Shocks April 2008 Box 43Catastrophe Insurance and Bonds New Instruments to Hedge Extreme Weather Risks April 2008 Box 44Recent Emission-Reduction Policy Initiatives April 2008 Box 45Complexities in Designing Domestic Mitigation Policies April 2008 Box 46Getting By with a Little Help from a Boom Do Commodity Windfalls Speed Up Human Development October 2015 Box 23Breaking the Deadlock Identifying the Political Economy Drivers of Structural Reforms April 2016 Box 31Can Reform Waves Turn the Tide Some Case Studies Using the Synthetic Control Method April 2016 Box 34A Global Rush for Land October 2016 Box 1SF1Conflict Growth and Migration April 2017 Box 11Tackling Measurement Challenges of Irish Economic Activity April 2017 Box 12Within-Country Trends in Income per Capita The Case of the Brazil Russia India China
and South Africa April 2017 Box 21Technological Progress and Labor Shares A Historical Overview April 2017 Box 31The Elasticity of Substitution Between Capital and Labor Concept and Estimation April 2017 Box 32Routine Tasks Automation and Economic Dislocation around the World April 2017 Box 33Adjustments to the Labor Share of Income April 2017 Box 34The Effects of Weather Shocks on Economic Activity How Can Low-Income Countries Cope October 2017 Chapter 3The Growth Impact of Tropical Cyclones October 2017 Box 31The Role of Policies in Coping with Weather Shocks A Model-Based Analysis October 2017 Box 32Strategies for Coping with Weather Shocks and Climate Change Selected Case Studies October 2017 Box 33Coping with Weather Shocks The Role of Financial Markets October 2017 Box 34Historical Climate Economic Development and the World Income Distribution October 2017 Box 35Mitigating Climate Change October 2017 Box 36Smartphones and Global Trade April 2018 Box 11Has Mismeasurement of the Digital Economy Affected Productivity Statistics April 2018 Box 14The Changing Service Content of Manufactures April 2018 Box 31Patent Data and Concepts April 2018 Box 41International Technology Sourcing and Knowledge Spillovers April 2018 Box 42Relationship between Competition Concentration and Innovation April 2018 Box 44Increasing Market Power October 2018 Box 11Sharp GDP Declines Some Stylized Facts October 2018 Box 15Predicting Recessions and Slowdowns A Daunting Task October 2018 Box 16The Rise of Corporate Market Power and Its Macroeconomic Effects April 2019 Chapter 2The Comovement between Industry Concentration and Corporate Saving April 2019 Box 21Effects of Mergers and Acquisitions on Market Power April 2019 Box 22The Price of Manufactured Low-Carbon Energy Technologies April 2019 Box 31The Global Automobile Industry Recent Developments and Implications for the Global Outlook October 2019 Box 11Whatrsquos Happening with Global Carbon Emissions October 2019 Box 1SF1Measuring Subnational Regional Economic Activity and Welfare October 2019 Box 21The Persistent Effects of Local Shocks The Case of Automotive Manufacturing Plant Closures October 2019 Box 23The Political Effects of Structural Reforms October 2019 Box 31The Impact of Crises on Structural Reforms October 2019 Box 32
International Monetary Fund | October 2019 187
Executive Directors broadly shared the assess-ment of global economic prospects and risks They observed that global growth in 2019 is expected to slow to its lowest level since the
financial crisis The slowdown reflects a notable down-turn in a number of emerging market and developing economies under stress or underperforming relative to past averages and a more broad-based weakening of industrial output amid rising tariff barriers Against this backdrop global trade has slowed to its lowest pace of expansion since 2012 Directors noted that with macroeconomic policies turning accommoda-tive in many countries growth is expected to pick up modestly in 2020
Directors observed that beyond 2020 growth is forecast to remain subdued in advanced econo-mies reflecting moderate productivity growth and slow labor force growth amid population aging In emerging market and developing economies growth is expected to increase modestly as activity strength-ens in currently underperforming countries and as strains ease among those under severe stress The projected growth pickup among these countries more than offsets the expected structural slowdown in China as its economy moves toward a more sus-tainable pace of expansion over the medium term Convergence prospects toward advanced economy income levels however remain bleak for many emerging market and developing economies due to structural bottlenecks and in some cases natural disasters high debt subdued commodity prices and civil strife
Directors observed that the global economy is in a difficult situation and the forecast is subject to considerable downside risks In the near term these include the possibility that stress fails to dissipate among a few key emerging markets and developing economies currently underperforming or experienc-ing severe strains intensifying trade and geopolitical
tensions with associated increases in uncertainty disruptions from a no-deal Brexit and a market reas-sessment of the monetary policy outlook of major central banks leading to an abrupt tightening of financial conditions Downside risks remain elevated in the medium term reflecting increased trade bar-riers a further accumulation of financial vulnerabili-ties that could amplify the next downturn and the consequences of unmitigated climate change
Considering these risks Directors noted the need for sustained multilateral cooperation including resolving trade disagreements curbing cross-border cyberattacks limiting greenhouse gas emissions and reducing global imbalances Closer multilat-eral cooperation on international taxation and the global financial regulatory reform agenda would help address vulnerabilities and broaden the gains from economic integration
Considering the prolonged weakness in activity muted inflation and downside risks to the outlook Directors welcomed the shift toward more accom-modative monetary policy in many economies While supportive of the global economy they noted that the shift toward a more dovish stance in policy may result in a further buildup of financial vulner-abilities which need to be addressed urgently with stronger macroprudential policies Directors stressed that fiscal policy can provide support to aggregate demand where the room to ease monetary policy is limited In countries where activity has weakened fiscal stimulus can be provided if fiscal space exists In countries with fiscal consolidation needs its pace could be adjusted if market conditions permit to avoid prolonged economic weakness and disinfla-tionary dynamics Low policy rates in many coun-tries and historically very low or negative long-term interest rates have reduced the cost of debt service Where debt is sustainable the freed-up resources could be used to support activity as needed and to
The following remarks were made by the Chair at the conclusion of the Executive Boardrsquos discussion of the Fiscal Monitor Global Financial Stability Report and World Economic Outlook on October 3 2019
IMF EXECUTIVE BOARD DISCUSSION OF THE OUTLOOK OCTOBER 2019
WO R L D E CO N O M I C O U T LO O K G LO B A L M A N U FAC T U R I N G D OW N T U R N R IS I N G T R A D E B A R R I E R S
188 International Monetary Fund | October 2019
adopt measures to raise potential output However in many emerging market and developing econo-mies monetary policy is not constrained In many of these countries public debt and interest-to-tax ratios have significantly increased and fiscal poli-cies should build fiscal space and be medium-term oriented Across all economies the priority is to take actions that improve inclusiveness and strengthen resilience Structural policies for more open and flexible markets and improvements in governance can ease adjustment to shocks and boost output over the medium term helping to narrow within-country income differences and encourage faster convergence across countries
Directors noted that markets expect interest rates to remain low for longer than previously antici-pated and with financial conditions easing further over the past six months this has prompted a search for yield among institutional investors with nominal return targets This financial risk-taking has boosted asset prices and led to a continued build-up in financial vulnerabilities such as lever-aged and liquidity and maturity mismatches These include rising corporate debt burdens increas-ing holdings of riskier and more illiquid assets by institutional investors and a growing reliance on external borrowing by emerging and frontier market economies Policymakers should address corporate vulnerabilities with stricter supervisory and macroprudential oversight tackle risks among institutional investors through strengthened over-sight and disclosures and implement prudent sov-ereign debt management practices and frameworks Macroprudential toolkits should be expanded as needed to address vulnerabilities outside the banking sector In economies where activity is still robust financial conditions are still easy and finan-cial vulnerabilities are high or rising policymakers should urgently tighten macroprudential policies including broad-based tools (such as countercycli-cal capital buffers) to increase financial systemsrsquo resilience In economies where macroeconomic policies are being eased but where vulnerabilities are still a concern policymakers should use a more
targeted approach to address vulnerabilities in specific sectors
Directors noted that emerging market and devel-oping economies need to enhance resilience with an appropriate mix of fiscal monetary exchange rate and macroprudential policies Many countries can strengthen institutions governance and policy frameworks to bolster their growth prospects and resilience
Directors urged low-income developing economies to enact policies aimed at lifting potential growth improving inclusiveness and combating challenges that hinder progress toward the 2030 Sustainable Development Goals Priorities include strengthen-ing monetary and macroprudential policy frame-works and ensuring that fiscal policy is in line with debt sustainability importantly through building tax capacity while protecting measures that help the vulnerable Complementarity among domestic revenues official assistance and private financing is essential for success As low-income countries are significantly impacted by climate change investing in disaster readiness and climate-smart infrastructure will be key Commodity exporters need to continue diversifying their economies through policies that improve education quality narrow infrastructure gaps enhance financial inclusion and boost private investment
Directors welcomed the call to action on climate change mitigation and the recommendations for fis-cal policy in the Fiscal Monitor Directors agreed that carbon taxation or similar pricing is a highly effective tool for reducing emissions as a part of a compre-hensive strategy including productive and equitable use of revenues and supportive measures for clean technology investment Directors also emphasized that alternative approaches such as feebates and regulations may be appropriate depending on coun-try circumstances Directors recognized that current mitigation pledges fall well short of what is needed for the Paris Agreementrsquos temperature stabilization goals and welcomed staff rsquos proposal for an interna-tional carbon price floor arrangement to scale up global mitigation ambition
Highlights from IMF Publications
BookstoreIMForg
$30 English PaperbackISBN 978-1-48432-594-0 imfbkst24708
$25 English PaperbackISBN 978-1-51355-890-5 imfbkst23550
$30 English PaperbackISBN 978-1-48433-974-9 imfbkst24306
$25 English PaperbackISBN 978-1-48435-384-4 imfbkst25145
$40 English PaperbackISBN 978-1-48437-2-142 imfbkst25402
$29 annual subscription fee Free to developing countriesEnglish ISSN 978-1-49831-651-4imfbkst26081
- 21107_Ch 00 FM_Web
- 21107_Ch 01_Web
- 21107_Ch 02_Web
- 21107_Ch 03_Web
- 21107_Ch 04_StatAppIntro_Web
- 21107_Ch 04a_WEO_StatApp_Tables_A01-A15_Web
- 21107_Ch 05_SelTopics_Web
- 21107_Ch 06_Board Discussion_Ad_Web
-

copy2019 International Monetary Fund
Cover and Design IMF CSF Creative Solutions DivisionComposition AGS An RR Donnelley Company
Cataloging-in-Publication Data
Joint Bank-Fund Library
Names International Monetary FundTitle World economic outlook (International Monetary Fund)Other titles WEO | Occasional paper (International Monetary Fund) | World economic and
financial surveysDescription Washington DC International Monetary Fund 1980- | Semiannual | Some
issues also have thematic titles | Began with issue for May 1980 | 1981-1984 Occasional paper International Monetary Fund 0251-6365 | 1986- World economic and financial surveys 0256-6877
Identifiers ISSN 0256-6877 (print) | ISSN 1564-5215 (online)Subjects LCSH Economic developmentmdashPeriodicals | International economic relationsmdash
Periodicals | Debts ExternalmdashPeriodicals | Balance of paymentsmdashPeriodicals | International financemdashPeriodicals | Economic forecastingmdashPeriodicals
Classification LCC HC10W79
HC1080
ISBN 978-1-51350-821-4 (English Paper) 978-1-51351-617-2 (English ePub) 978-1-51351-616-5 (English PDF)
The World Economic Outlook (WEO) is a survey by the IMF staff published twice a year in the spring and fall The WEO is prepared by the IMF staff and has benefited from comments and suggestions by Executive Directors following their discussion of the report on October 3 2019 The views expressed in this publication are those of the IMF staff and do not necessarily represent the views of the IMFrsquos Executive Directors or their national authorities
Recommended citation International Monetary Fund 2019 World Economic Outlook Global Manufacturing Downturn Rising Trade Barriers Washington DC October
Publication orders may be placed online by fax or through the mail International Monetary Fund Publication Services
PO Box 92780 Washington DC 20090 USATel (202) 623-7430 Fax (202) 623-7201
E-mail publicationsimforgwwwimfbookstoreorgwwwelibraryimforg
International Monetary Fund | October 2019 iii
CONTENTS
Assumptions and Conventions ix
Further Information xi
Data xii
Preface xiii
Foreword xiv
Executive Summary xvi
Chapter 1 Global Prospects and Policies 1
Subdued Momentum Weak Trade and Industrial Production 1Weakening Growth 2Muted Inflation 3Volatile Market Sentiment Monetary Policy Easing 5Global Growth Outlook Modest Pickup amid Difficult Headwinds 7Growth Forecast for Advanced Economies 12Growth Forecast for Emerging Market and Developing Economies 13Inflation Outlook 16External Sector Outlook 16Risks Skewed to the Downside 19Policy Priorities 22Scenario Box 11 Implications of Advanced Economies Reshoring Some Production 29Scenario Box 12 Trade Tensions Updated Scenario 31Box 11 The Global Automobile Industry Recent Developments and Implications for
the Global Outlook 34Box 12 The Decline in World Foreign Direct Investment in 2018 38Box 13 Global Growth Forecast Assumptions on Policies Financial Conditions and
Commodity Prices 41Box 14 The Plucking Theory of the Business Cycle 43Special Feature Commodity Market Developments and Forecasts 45Box 1SF1 Whatrsquos Happening with Global Carbon Emissions 56References 63
Online Annex
Special Feature Online Annex
Chapter 2 Closer Together or Further Apart Within-Country Regional Disparities and Adjustment in Advanced Economies 65
Introduction 65Regional Development and Adjustment A Primer 70Patterns of Regional Disparities in Advanced Economies 71Regional Labor Market Adjustment in Advanced Economies 73Regional Labor Mobility and Factor Allocation Individual and Firm-Level Evidence 76Summary and Policy Implications 78
W O R L D E C O N O M I C O U T L O O K G LO B A L M A N U FAC T U R I N G D OW N T U R N R IS I N G T R A D E B A R R I E R S
iv International Monetary Fund | October 2019
Box 21 Measuring Subnational Regional Economic Activity and Welfare 80Box 22 Climate Change and Subnational Regional Disparities 82Box 23 The Persistent Effects of Local Shocks The Case of Automotive Manufacturing
Plant Closures 84Box 24 Place-Based Policies Rethinking Fiscal Policies to Tackle Inequalities
within Countries 86References 88
Online Annexes
Annex 21 Variables Data Sources and Sample CoverageAnnex 22 Calculation and Decomposition of Income InequalityAnnex 23 Shift-Share Analysis of Regional Labor ProductivityAnnex 24 Counterfactual Exercise for Labor Productivity Changes in Lagging versus
Other RegionsAnnex 25 Regional Labor Market Effects of Local Labor Demand Shocks Trade and
Technology ShocksAnnex 26 Firm-Level Analysis of Capital Allocative Efficiency
Chapter 3 Reigniting Growth in Low-Income and Emerging Market Economies What Role Can Structural Reforms Play 93
Introduction 93Structural Policy and Reform Patterns in Emerging Market and Developing Economies 97The Macroeconomic Effects of Reforms in Emerging Market and Developing Economies 101Accounting for Differences across Countries 106Summary and Policy Implications 110Box 31 The Political Effects of Structural Reforms 113Box 32 The Impact of Crises on Structural Reforms 115References 117
Online Annexes
Annex 31 Data Sources and SampleAnnex 32 Empirical AnalysismdashMethodological Details and Robustness ChecksAnnex 33 Model Analysis
Statistical Appendix 121
Assumptions 121Whatrsquos New 122Data and Conventions 122Country Notes 123Classification of Countries 124General Features and Composition of Groups in the World Economic Outlook Classification 125Table A Classification by World Economic Outlook Groups and Their Shares in Aggregate
GDP Exports of Goods and Services and Population 2018 126Table B Advanced Economies by Subgroup 127Table C European Union 127Table D Emerging Market and Developing Economies by Region and Main Source of
Export Earnings 128Table E Emerging Market and Developing Economies by Region Net External Position
and Status as Heavily Indebted Poor Countries and Low-Income Developing Countries 129Table F Economies with Exceptional Reporting Periods 131Table G Key Data Documentation 132
co n t e n ts
International Monetary Fund | October 2019 v
Box A1 Economic Policy Assumptions Underlying the Projections for Selected Economies 142List of Tables Output (Tables A1ndashA4) 147Inflation (Tables A5ndashA7) 154Financial Policies (Table A8) 159Foreign Trade (Table A9) 160Current Account Transactions (Tables A10ndashA12) 162Balance of Payments and External Financing (Table A13) 169Flow of Funds (Table A14) 173Medium-Term Baseline Scenario (Table A15) 176
World Economic Outlook Selected Topics 177
IMF Executive Board Discussion of the Outlook October 2019 187
Tables
Table 11 Overview of the World Economic Outlook Projections 10Table 1SF1 Official Gold Reserves 50Table 1SF2 Precious Metals Production 2016ndash18 50Table 1SF3 Relative Rarity 52Table 1SF4 World Average Inflation Betas 54Table 1SF5 Determinants of One-Month Return on Precious Metals 54Table 1SF6 Asset Returns Associated with Largest Single-Day Changes in the SampP
500 Index 55Annex Table 111 European Economies Real GDP Consumer Prices Current Account
Balance and Unemployment 57Annex Table 112 Asian and Pacific Economies Real GDP Consumer Prices Current
Account Balance and Unemployment 58Annex Table 113 Western Hemisphere Economies Real GDP Consumer Prices
Current Account Balance and Unemployment 59Annex Table 114 Middle East and Central Asia Economies Real GDP Consumer Prices
Current Account Balance and Unemployment 60Annex Table 115 Sub-Saharan African Economies Real GDP Consumer Prices
Current Account Balance and Unemployment 61Annex Table 116 Summary of World Real per Capita Output 62Table 241 Examples of Place-Based Policies 86
Online TablesmdashStatistical Appendix
Table B1 Advanced Economies Unemployment Employment and Real GDP per CapitaTable B2 Emerging Market and Developing Economies Real GDPTable B3 Advanced Economies Hourly Earnings Productivity and Unit Labor Costs
in ManufacturingTable B4 Emerging Market and Developing Economies Consumer PricesTable B5 Summary of Fiscal and Financial IndicatorsTable B6 Advanced Economies General and Central Government Net
LendingBorrowing and General Government Net LendingBorrowing Excluding Social Security Schemes
Table B7 Advanced Economies General Government Structural BalancesTable B8 Emerging Market and Developing Economies General Government Net
LendingBorrowing and Overall Fiscal Balance
W O R L D E C O N O M I C O U T L O O K G LO B A L M A N U FAC T U R I N G D OW N T U R N R IS I N G T R A D E B A R R I E R S
vi International Monetary Fund | October 2019
Table B9 Emerging Market and Developing Economies General Government Net LendingBorrowing
Table B10 Selected Advanced Economies Exchange RatesTable B11 Emerging Market and Developing Economies Broad Money AggregatesTable B12 Advanced Economies Export Volumes Import Volumes and Terms of Trade
in Goods and ServicesTable B13 Emerging Market and Developing Economies by Region Total Trade in GoodsTable B14 Emerging Market and Developing Economies by Source of Export Earnings
Total Trade in GoodsTable B15 Summary of Current Account TransactionsTable B16 Emerging Market and Developing Economies Summary of External Debt
and Debt ServiceTable B17 Emerging Market and Developing Economies by Region External Debt
by MaturityTable B18 Emerging Market and Developing Economies by Analytical Criteria External
Debt by MaturityTable B19 Emerging Market and Developing Economies Ratio of External Debt to GDPTable B20 Emerging Market and Developing Economies Debt-Service RatiosTable B21 Emerging Market and Developing Economies Medium-Term Baseline
Scenario Selected Economic Indicators
Figures
Figure 1 GDP Growth World and Group of Four xviiFigure 11 Global Activity Indicators 2Figure 12 Contribution to Global Imports 2Figure 13 Global Investment and Trade 3Figure 14 Spending on Durable Goods 3Figure 15 Global Purchasing Managersrsquo Index and Consumer Confidence 4Figure 16 Global Inflation 4Figure 17 Wages Unit Labor Costs and Labor Shares 5Figure 18 Commodity Prices 5Figure 19 Advanced Economies Monetary and Financial Market Conditions 6Figure 110 Emerging Market Economies Interest Rates and Spreads 7Figure 111 Emerging Market Economies Equity Markets and Credit 8Figure 112 Emerging Market Economies Capital Flows 8Figure 113 Real Effective Exchange Rate Changes March 2019ndashSeptember 2019 9Figure 114 Global Growth 12Figure 115 Emerging Market and Developing Economies
Per Capita Real GDP Growth 15Figure 116 Sub-Saharan Africa Population in 2018 and Projected Growth Rates in
GDP per Capita 2019ndash24 16Figure 117 Global Current Account Balance 17Figure 118 Current Account Balances in Relation to Economic Fundamentals 18Figure 119 Net International Investment Position 18Figure 120 Tech Hardware Supply Chains 20Figure 121 Policy Uncertainty and Trade Tensions 21Figure 122 Geopolitical Risk Index 21Figure 123 Probability of One-Year-Ahead Global Growth of Less than 25 Percent 22Scenario Figure 111 Advanced Economies Reshoring 29Scenario Figure 121 Real GDP 32
co n t e n ts
International Monetary Fund | October 2019 vii
Figure 111 Global Vehicle Industry Share of Total 2018 34Figure 112 Global Vehicle Industry Structure of Production 2014 35Figure 113 Global Vehicle Production 36Figure 114 World Passenger Vehicle Sales and Usage 36Figure 121 Advanced Economies Financial Flows 38Figure 122 Foreign Direct Investment Flows 39Figure 123 Emerging Markets Financial Flows 40Figure 131 Forecast Assumptions Fiscal Indicators 42Figure 132 Commodity Price Assumptions and Terms-of-Trade Windfall Gains
and Losses 42Figure 141 An Illustration of the Plucking Theory 43Figure 142 Unemployment Dynamics in Advanced Economies 44Figure 1SF1 Commodity Market Developments 46Figure 1SF2 Gold and Silver Prices 49Figure 1SF3 Macro Relevance of Precious Metals 51Figure 1SF4 Share of Total Demand 52Figure 1SF5 Correlation Precious Metals Copper and Oil 53Figure 1SF6 Precious Metals versus Consumer Price Index Inflation 53Figure 1SF11 Contribution to World Emissions by Location 56Figure 1SF12 Contribution to World Emissions by Source 56Figure 21 Subnational Regional Disparities and Convergence over Time 66Figure 22 Distribution of Subnational Regional Disparities in Advanced Economies 66Figure 23 Subnational Regional Unemployment and Economic Activity in Advanced
Economies 1999ndash2016 67Figure 24 Demographics Health Human Capital and Labor Market Outcomes in
Advanced Economies Lagging versus Other Regions 68Figure 25 Inequality in Household Disposable Income within
Advanced Economies 70Figure 26 Subnational Regional Disparities in Real GDP per Capita 71Figure 27 Shift-Share Variance Decomposition by Country 2003ndash14 72Figure 28 Sectoral Labor Productivity and Employment Shares Lagging versus
Other Regions 73Figure 29 Labor Productivity Lagging versus Other Regions 74Figure 210 Regional Effects of Import Competition Shocks 75Figure 211 Regional Effects of Automation Shocks 76Figure 212 Regional Effects of Trade and Technology Shocks Conditional on
National Policies 77Figure 213 Subnational Regional Migration and Labor Mobility 78Figure 214 Effects of National Structural Policies on Subnational Regional Dispersion
of Capital Allocative Efficiency 78Figure 211 Subnational Regional Disparities Before and after Regional Price Adjustment 80Figure 221 Marginal Effect of 1degC Increase in Temperature on Sectoral Labor Productivity 82Figure 222 Change in Labor Productivity of Lagging versus Other Regions Due to
Projected Temperature Increases between 2005 and 2100 83Figure 231 Associations between Automotive Manufacturing Plant Closures and
Unemployment Rates 84Figure 241 Effects of Fiscal Redistribution by Conventional versus Spatially Targeted
Means-Tested Transfers 87Figure 31 Speed of Income-per-Capita Convergence in Emerging Markets and
Low-Income Developing Countries 94
W O R L D E C O N O M I C O U T L O O K G LO B A L M A N U FAC T U R I N G D OW N T U R N R IS I N G T R A D E B A R R I E R S
viii International Monetary Fund | October 2019
Figure 32 Reform Intensity and Speed of Income-per-Capita Convergence in Selected Economies 94
Figure 33 Overall Reform Trends 98Figure 34 Reform Trends by Area 99Figure 35 Overall Reform Trends across Different Geographical Regions 100Figure 36 Regulatory Indices by Country Income Groups 100Figure 37 Regulatory Indices by Geographical Regions 101Figure 38 Average Effects of Reforms 102Figure 39 Industry-Level Effect of Domestic and External Finance Reforms on Output 104Figure 310 Output Gains from Major Historical Reforms Model-Based versus
Empirical Estimates 106Figure 311 Effects of Reforms The Role of Macroeconomic Conditions 107Figure 312 Effects of Reforms on Output The Role of Informality 108Figure 313 Model-Implied Gains from Reforms The Role of Informality 109Figure 314 Effect of Reforms on Informality 109Figure 315 Effects of Reforms on Output The Role of Governance 110Figure 316 Gain from Packaging Domestic Finance and Labor Market Reforms 111Figure 311 The Effect of Reform on Electoral Outcomes 114Figure 312 The Effect of Reform on Vote Share The Role of Economic Conditions 114Figure 321 The Effect of Crises on Structural Reforms 116
International Monetary Fund | October 2019 ix
ASSUMPTIONS AND CONVENTIONS
A number of assumptions have been adopted for the projections presented in the World Economic Outlook (WEO) It has been assumed that real effective exchange rates remained constant at their average levels during July 26 to August 23 2019 except for those for the currencies participating in the European exchange rate mechanism II (ERM II) which are assumed to have remained constant in nominal terms relative to the euro that established policies of national authorities will be maintained (for specific assumptions about fiscal and monetary policies for selected economies see Box A1 in the Statistical Appendix) that the average price of oil will be $6178 a barrel in 2019 and $5794 a barrel in 2020 and will remain unchanged in real terms over the medium term that the six-month London interbank offered rate (LIBOR) on US dollar deposits will average 23 percent in 2019 and 20 percent in 2020 that the three-month euro deposit rate will average ndash04 percent in 2019 and ndash06 in 2020 and that the six-month Japanese yen deposit rate will yield on average 00 percent in 2019 and ndash01 percent in 2020 These are of course working hypotheses rather than forecasts and the uncertainties surrounding them add to the margin of error that would in any event be involved in the projections The estimates and projections are based on statistical information available through September 30 2019
The following conventions are used throughout the WEO to indicate that data are not available or not applicablendash between years or months (for example 2018ndash19 or JanuaryndashJune) to indicate the years or months
covered including the beginning and ending years or months and between years or months (for example 201819) to indicate a fiscal or financial year
ldquoBillionrdquo means a thousand million ldquotrillionrdquo means a thousand billionldquoBasis pointsrdquo refers to hundredths of 1 percentage point (for example 25 basis points are equivalent to frac14 of
1 percentage point)Data refer to calendar years except in the case of a few countries that use fiscal years Please refer to Table F in
the Statistical Appendix which lists the economies with exceptional reporting periods for national accounts and government finance data for each country
For some countries the figures for 2018 and earlier are based on estimates rather than actual outturns Please refer to Table G in the Statistical Appendix which lists the latest actual outturns for the indicators in the national accounts prices government finance and balance of payments indicators for each country
What is new in this publication
bull Mauritania redenominated its currency in January 2018 by replacing 10 old Mauritanian ouguiya (MRO) with 1 new Mauritanian ouguiya (MRU) Local currency data for Mauritania are expressed in the new currency beginning with the October 2019 WEO database
bull Satildeo Tomeacute and Priacutencipe redenominated its currency in January 2018 by replacing 1000 old Satildeo Tomeacute and Priacutencipe dobra (STD) with 1 new Satildeo Tomeacute and Priacutencipe dobra (STN) Local currency data for Satildeo Tomeacute and Priacutencipe are expressed in the new currency beginning with the October 2019 WEO database
bull Beginning with the October 2019 WEO the regional group Commonwealth of Independent States (CIS) is dis-continued Four of the CIS economies (Belarus Moldova Russia and Ukraine) are added to the regional group Emerging and Developing Europe The remaining eight economiesmdashArmenia Azerbaijan Georgia Kazakhstan Kyrgyz Republic Tajikistan Turkmenistan and Uzbekistan which comprise the regional subgroup Caucasus and Central Asia (CCA)mdashare combined with Middle East North Africa Afghanistan and Pakistan (MENAP) to form the new regional group Middle East and Central Asia (MECA)
In the tables and figures the following conventions applybull If no source is listed on tables and figures data are drawn from the WEO databasebull When countries are not listed alphabetically they are ordered on the basis of economic sizebull Minor discrepancies between sums of constituent figures and totals shown reflect rounding
W O R L D E C O N O M I C O U T L O O K G LO B A L M A N U FAC T U R I N G D OW N T U R N R IS I N G T R A D E B A R R I E R S
x International Monetary Fund | October 2019
As used in this report the terms ldquocountryrdquo and ldquoeconomyrdquo do not in all cases refer to a territorial entity that is a state as understood by international law and practice As used here the term also covers some territorial entities that are not states but for which statistical data are maintained on a separate and independent basis
Composite data are provided for various groups of countries organized according to economic characteristics or region Unless noted otherwise country group composites represent calculations based on 90 percent or more of the weighted group data
The boundaries colors denominations and any other information shown on the maps do not imply on the part of the IMF any judgment on the legal status of any territory or any endorsement or acceptance of such boundaries
International Monetary Fund | October 2019 xi
Corrections and Revisions The data and analysis appearing in the World Economic Outlook (WEO) are compiled by the IMF staff at the
time of publication Every effort is made to ensure their timeliness accuracy and completeness When errors are discovered corrections and revisions are incorporated into the digital editions available from the IMF website and on the IMF eLibrary (see below) All substantive changes are listed in the online table of contents
Print and Digital EditionsPrint
Print copies of this WEO can be ordered from the IMF bookstore at imfbkst28248
Digital
Multiple digital editions of the WEO including ePub enhanced PDF and HTML are available on the IMF eLibrary at wwwelibraryimforgOCT19WEO
Download a free PDF of the report and data sets for each of the charts therein from the IMF website at wwwimforgpublicationsweo or scan the QR code below to access the World Economic Outlook web page directly
Copyright and ReuseInformation on the terms and conditions for reusing the contents of this publication are at wwwimforgexternal
termshtm
FURTHER INFORMATION
xii International Monetary Fund | October 2019
WO R L D E CO N O M I C O U T LO O K T E N S I O N S F R O M T H E T WO - S P E E D R E COV E RY
DATA
This version of the World Economic Outlook (WEO) is available in full through the IMF eLibrary (wwwelibraryimforg) and the IMF website (wwwimforg) Accompanying the publication on the IMF website is a larger com-pilation of data from the WEO database than is included in the report itself including files containing the series most frequently requested by readers These files may be downloaded for use in a variety of software packages
The data appearing in the WEO are compiled by the IMF staff at the time of the WEO exercises The histori-cal data and projections are based on the information gathered by the IMF country desk officers in the context of their missions to IMF member countries and through their ongoing analysis of the evolving situation in each country Historical data are updated on a continual basis as more information becomes available and structural breaks in data are often adjusted to produce smooth series with the use of splicing and other techniques IMF staff estimates continue to serve as proxies for historical series when complete information is unavailable As a result WEO data can differ from those in other sources with official data including the IMFrsquos International Financial Statistics
The WEO data and metadata provided are ldquoas isrdquo and ldquoas availablerdquo and every effort is made to ensure their timeliness accuracy and completeness but these cannot be guaranteed When errors are discovered there is a concerted effort to correct them as appropriate and feasible Corrections and revisions made after publication are incorporated into the electronic editions available from the IMF eLibrary (wwwelibraryimforg) and on the IMF website (wwwimforg) All substantive changes are listed in detail in the online tables of contents
For details on the terms and conditions for usage of the WEO database please refer to the IMF Copyright and Usage website (wwwimforgexternaltermshtm)
Inquiries about the content of the WEO and the WEO database should be sent by mail fax or online forum (telephone inquiries cannot be accepted)
World Economic Studies DivisionResearch Department
International Monetary Fund700 19th Street NW
Washington DC 20431 USAFax (202) 623-6343
Online Forum wwwimforgweoforum
International Monetary Fund | October 2019 xiii
The analysis and projections contained in the World Economic Outlook are integral elements of the IMFrsquos surveillance of economic developments and policies in its member countries of developments in international financial markets and of the global economic system The survey of prospects and policies is the product of a comprehensive interdepartmental review of world economic developments which draws primarily on information the IMF staff gathers through its consultations with member countries These consultations are carried out in particular by the IMFrsquos area departmentsmdashnamely the African Department Asia and Pacific Department European Department Middle East and Central Asia Department and Western Hemisphere Departmentmdashtogether with the Strategy Policy and Review Department the Monetary and Capital Markets Department and the Fiscal Affairs Department
The analysis in this report was coordinated in the Research Department under the general direction of Gita Gopinath Economic Counsellor and Director of Research The project was directed by Gian Maria Milesi-Ferretti Deputy Director Research Department and Oya Celasun Division Chief Research Department
The primary contributors to this report were John Bluedorn Christian Bogmans Gabriele Ciminelli Romain Duval Davide Furceri Guzman Gonzales-Torres Fernandez Joao Jalles Zsoacuteka Koacuteczaacuten Toh Kuan Weicheng Lian Akito Matsumoto Giovanni Melina Malhar Nabar Natalija Novta Andrea Pescatori Cian Ruane and Yannick Timmer
Other contributors include Zidong An Hites Ahir Gavin Asdorian Srijoni Banerjee Carlos Caceres Luisa Calixto Benjamin Carton Diego Cerdeiro Luisa Charry Allan Dizioli Angela Espiritu William Gbohoui Jun Ge Mandy Hemmati Ava Yeabin Hong Youyou Huang Benjamin Hunt Sarma Jayanthi Yi Ji Christopher Johns Lama Kiyasseh W Raphael Lam Jungjin Lee Claire Mengyi Li Victor Lledo Rui Mano Susana Mursula Savannah Newman Cynthia Nyanchama Nyakeri Emory Oakes Rafael Portillo Evgenia Pugacheva Aneta Radzikowski Grey Ramos Adrian Robles Villamil Damiano Sandri Susie Xiaohui Sun Ariana Tayebi Nicholas Tong Julia Xueliang Wang Shan Wang Yarou Xu Yuan Zeng Qiaoqiao Zhang Huiyuan Zhao and Jillian Zirnhelt
Joseph Procopio from the Communications Department led the editorial team for the report with production and editorial support from Christine Ebrahimzadeh and editorial assistance from James Unwin Lucy Scott Morales and Vector Talent Resources
The analysis has benefited from comments and suggestions by staff members from other IMF departments as well as by Executive Directors following their discussion of the report on October 3 2019 However both projections and policy considerations are those of the IMF staff and should not be attributed to Executive Directors or to their national authorities
PREFACE
xiv International Monetary Fund | October 2019
WO R L D E CO N O M I C O U T LO O K T E N S I O N S F R O M T H E T WO - S P E E D R E COV E RY
The global economy is in a synchronized slowdown with growth for 2019 down-graded againmdashto 3 percentmdashits slowest pace since the global financial crisis This
is a serious climbdown from 38 percent in 2017 when the world was in a synchronized upswing This subdued growth is a consequence of rising trade barriers elevated uncertainty surrounding trade and geopolitics idiosyncratic factors causing macroeco-nomic strain in several emerging market economies and structural factors such as low productivity growth and aging demographics in advanced economies
Global growth in 2020 is projected to improve modestly to 34 percent a downward revision of 02 percent from our April projections However unlike the synchronized slowdown this recovery is not broad based and is precarious Growth for advanced economies is projected to slow to 17 percent in 2019 and 2020 while emerging market and developing economies are projected to experi-ence a growth pickup from 39 percent in 2019 to 46 percent in 2020 About half of this is driven by recoveries or shallower recessions in stressed emerging markets such as Turkey Argentina and Iran and the rest by recoveries in countries where growth slowed significantly in 2019 relative to 2018 such as Brazil Mexico India Russia and Saudi Arabia
A notable feature of the sluggish growth in 2019 is the sharp and geographically broad-based slowdown in manufacturing and global trade A few factors are driving this Higher tariffs and prolonged uncertainty surrounding trade policy have dented investment and demand for capital goods which are heavily traded The automobile industry is contracting owing also to idiosyncratic shocks such as disruptions from new emission standards in the euro area and China that have had durable effects Consequently trade volume growth in the first half of 2019 is at 1 percent the weakest level since 2012
In contrast to weak manufacturing and trade the services sector across much of the globe continues to hold up this has kept labor markets buoyant and wage growth healthy in advanced economies
The divergence between manufacturing and services has persisted for an atypically long duration which raises concerns of whether and when weakness in manufacturing may spill over into the services sector Some leading indicators such as new services orders have softened in the United States Germany and Japan while remaining robust in China
It is important to keep in mind that the subdued world growth of 3 percent is occurring at a time when monetary policy has significantly eased almost simul-taneously across advanced and emerging markets The absence of inflationary pressures has led major central banks to move preemptively to reduce downside risks to growth and to prevent de-anchoring of inflation expectations in turn supporting buoyant financial conditions In our assessment in the absence of such monetary stimulus global growth would be lower by 05 percentage points in both 2019 and 2020 This stimulus has therefore helped offset the negative impact of USndashChina trade tensions which is esti-mated to cumulatively reduce the level of global GDP in 2020 by 08 percent With central banks having to spend limited ammunition to offset policy mistakes they may have little left when the economy is in a tougher spot Fiscal stimulus in China and the United States have also helped counter the negative impact of the tariffs
Advanced economies continue to slow toward their long-term potential For the United States trade-related uncertainty has had negative effects on invest-ment but employment and consumption continue to be robust buoyed also by policy stimulus In the euro area growth has been downgraded due to weak exports while Brexit-related uncertainty continues to weaken growth in the United Kingdom Some of the biggest downward revisions for growth are for advanced economies in Asia including Hong Kong Special Administrative Region Korea and Singapore a common factor being their exposure to slowing growth in China and spillovers from USndashChina trade tensions
Growth in 2019 has been revised down across all large emerging market and developing economies
FOREWORD
F o R e Wo R D
linked in part to trade and domestic policy uncertain-ties In China the growth downgrade reflects not only escalating tariffs but also slowing domestic demand following needed measures to rein in debt In a few major economies including India Brazil Mexico Russia and South Africa growth in 2019 is sharply lower than in 2018 also for idiosyncratic reasons but is expected to recover in 2020
Growth in low-income developing countries remains robust though growth performance is more heterogenous within this group Robust growth is expected for noncommodity exporters such as Vietnam and Bangladesh while the performance of commodity exporters such as Nigeria is projected to remain lackluster
Downside risks to the outlook are elevated Trade barriers and heightened geopolitical tensions includ-ing Brexit-related risks could further disrupt sup-ply chains and hamper confidence investment and growth Such tensions as well as other domestic policy uncertainties could negatively affect the pro-jected growth pickup in emerging market economies and the euro area A realization of these risks could lead to an abrupt shift in risk sentiment and expose financial vulnerabilities built up over years of low interest rates Low inflation in advanced economies could become entrenched and constrain monetary policy space further into the future limiting its effec-tiveness The risks from climate change are playing out now and will dramatically escalate in the future if not urgently addressed
As policy priorities go undoing the trade barriers put in place with durable agreements and reining in geopolitical tensions top the list Such actions can significantly boost confidence rejuvenate investment halt the slide in trade and manufacturing and raise world growth In its absence and to fend off other risks to growth and raise potential output economic activity should be supported in a more balanced manner Monetary policy cannot be the only game in town and should be coupled with fiscal support where fiscal space is available and where policy is not already too expansionary A country like Germany should take advantage of negative borrowing rates to invest in social and infrastructure capital even from a pure cost-benefit perspective If growth were
to further deteriorate an internationally coordinated fiscal response tailored to country circumstances may be required
While monetary easing has supported growth it is important to ensure that financial risks do not build up As discussed in the October 2019 Global Financial Stability Report with interest rates expected to be ldquolow for longrdquo there is a significant risk of financial vulner-abilities growing which makes effective macropruden-tial regulation imperative
Countries should simultaneously undertake struc-tural reforms to raise productivity resilience and equity As Chapter 2 of this World Economic Outlook demonstrates reforms that raise human capital and improve labor and product market flexibility can help reverse a trend of growing divergence across regions within advanced economies that started in the late 1980s The evidence points to automationmdashnot trade shocksmdashas being behind the divergence in labor market performance across regions for the average advanced economy which requires prepar-ing the workforce for the future through appropriate skills training
Chapter 3 makes a strong case for a renewed struc-tural reform push in emerging market and develop-ing economies and low-income developing countries Structural reforms have slowed since the 2000s The chapter shows that the appropriate sequencing and timing of reforms matters as reforms deliver larger results during good times and when good governance is already in place
With a synchronized slowdown and uncertain recovery the global outlook remains precarious At 3 percent growth there is no room for policy mistakes and an urgent need for policymakers to cooperatively deescalate trade and geopolitical tensions Besides supporting growth such actions can also help catalyze needed cooperative solutions to improve the global trading system Moreover it is essential that countries continue to work together to address major issues such as climate change (the October 2019 Fiscal Monitor provides concrete solutions) international taxation corruption and cybersecurity
Gita GopinathEconomic Counsellor
International Monetary Fund | October 2019 xv
xvi International Monetary Fund | October 2019
WO R L D E CO N O M I C O U T LO O K T E N S I O N S F R O M T H E T WO - S P E E D R E COV E RY
EXECUTIVE SUMMARY
After slowing sharply in the last three quarters of 2018 the pace of global economic activity remains weak Momentum in manufacturing activity in particular has weakened substantially to levels not seen since the global financial crisis Rising trade and geopolitical ten-sions have increased uncertainty about the future of the global trading system and international cooperation more generally taking a toll on business confidence invest-ment decisions and global trade A notable shift toward increased monetary policy accommodationmdashthrough both action and communicationmdashhas cushioned the impact of these tensions on financial market sentiment and activity while a generally resilient service sector has supported employment growth That said the outlook remains precarious
Global growth is forecast at 30 percent for 2019 its lowest level since 2008ndash09 and a 03 percentage point downgrade from the April 2019 World Economic Outlook Growth is projected to pick up to 34 percent in 2020 (a 02 percentage point downward revision compared with April) reflecting primarily a projected improvement in economic performance in a number of emerging markets in Latin America the Middle East and emerging and developing Europe that are under macroeconomic strain Yet with uncertainty about pros-pects for several of these countries a projected slowdown in China and the United States and prominent down-side risks a much more subdued pace of global activity could well materialize To forestall such an outcome poli-cies should decisively aim at defusing trade tensions rein-vigorating multilateral cooperation and providing timely support to economic activity where needed To strengthen resilience policymakers should address financial vulner-abilities that pose risks to growth in the medium term Making growth more inclusive which is essential for securing better economic prospects for all should remain an overarching goal
After a sharp slowdown during the last three quarters of 2018 global growth stabilized at a weak pace in the first half of 2019 Trade tensions which had abated earlier in the year have risen again sharply resulting in significant tariff increases between the United States and China and hurting business
sentiment and confidence globally While financial market sentiment has been undermined by these developments a shift toward increased monetary policy accommodation in the United States and many other advanced and emerging market economies has been a counterbalancing force As a result financial conditions remain generally accommodative and in the case of advanced economies more so than in the spring
The world economy is projected to grow at 30 percent in 2019mdasha significant drop from 2017ndash18 for emerging market and developing econo-mies as well as advanced economiesmdashbefore recover-ing to 34 percent in 2020 A slightly higher growth rate is projected for 2021ndash24 This global growth pattern reflects a major downturn and projected recovery in a group of emerging market economies By contrast growth is expected to moderate into 2020 and beyond for a group of systemic economies comprising the United States euro area China and Japanmdashwhich together account for close to half of global GDP (Figure 1)
The groups of emerging market economies that have driven part of the projected decline in growth in 2019 and account for the bulk of the projected recovery in 2020 include those that have either been under severe strain or have underperformed relative to past averages In particular Argentina Iran Turkey Venezuela and smaller countries affected by conflict such as Libya and Yemen have been or continue to be experiencing very severe macroeconomic distress Other large emerging market economiesmdashBrazil Mexico Russia and Saudi Arabia among othersmdashare projected to grow in 2019 about 1 percent or less considerably below their historical averages In India growth softened in 2019 as corporate and environ-mental regulatory uncertainty together with concerns about the health of the nonbank financial sector weighed on demand The strengthening of growth in 2020 and beyond in India as well as for these two groups (which in some cases entails continued con-traction but at a less severe pace) is the driving factor behind the forecast of an eventual global pickup
e x e c u t I v e s uM Ma Ry
Growth has also weakened in China where the regulatory efforts needed to rein in debt and the mac-roeconomic consequences of increased trade tensions have taken a toll on aggregate demand Growth is pro-jected to continue to slow gradually in coming years reflecting a decline in the growth of the working-age population and gradual convergence in per capita incomes
Among advanced economies growth in 2019 is forecast to be considerably weaker than in 2017ndash18 in the euro area North America and smaller advanced Asian economies This lower growth reflects to an important extent a broad-based slowdown in industrial output resulting from weaker external demand (includ-ing from China) the widening global repercussions of trade tensions and increased uncertainty on confidence and investment and a notable slowdown in global car production which has been particularly significant for Germany Growth is forecast to remain broadly stable for the advanced economy group at 1frac34 percent in 2020 with a modest pickup in the euro area offsetting a gradual decline in US growth Over the medium term growth in advanced economies is projected
to remain subdued reflecting a moderate pace of productivity growth and slow labor force growth as populations age
The risks to this baseline outlook are significant As elaborated in the chapter should stress fail to dissipate in a few key emerging market and developing econo-mies that are currently underperforming or experi-encing severe strains global growth in 2020 would fall short of the baseline Further escalation of trade tensions and associated increases in policy uncertainty could weaken growth relative to the baseline projec-tion Financial market sentiment could deteriorate giving rise to a generalized risk-off episode that would imply tighter financial conditions especially for vulner-able economies Possible triggers for such an episode include worsening trade and geopolitical tensions a no-deal Brexit withdrawal of the United Kingdom from the European Union and persistently weak economic data pointing to a protracted slowdown in global growth Over the medium term increased trade barriers and higher trade and geopolitical tensions could take a toll on productivity growth includ-ing through the disruption of supply chains and the buildup in financial vulnerabilities could amplify the next downturn Finally unmitigated climate change could weaken prospects especially in vulnerable countries
At the multilateral level countries need to resolve trade disagreements cooperatively and roll back the recently imposed distortionary barriers Curbing greenhouse gas emissions and containing the associ-ated consequences of rising global temperatures and devastating climate events are urgent global impera-tives As Chapter 2 of the Fiscal Monitor argues higher carbon pricing should be the centerpiece of that effort complemented by efforts to foster the supply of low-carbon energy and the development and adoption of green technologies At the national level macroeconomic policies should seek to stabilize activity and strengthen the foundations for a recov-ery or continued growth Accommodative monetary policy remains appropriate to support demand and employment and guard against a downshift in infla-tion expectations As the resulting easier financial conditions could also contribute to a further buildup of financial vulnerabilities stronger macroprudential policies and a proactive supervisory approach will be critical to secure the strength of balance sheets and limit systemic risks
World Group of Four
Figure 1 GDP Growth World and Group of Four(Percent)
The global growth pattern reflects a major downturn and projected recovery in a group of emerging market economies By contrast growth is expected to moderate into 2020 and beyond for a group of systemic economies
Source IMF staff estimatesNote Group of Four = China euro area Japan United States
25
30
35
40
45
2011 12 13 14 15 16 17 18 19 20 21 22 23 24
International Monetary Fund | October 2019 xvii
W O R L D E C O N O M I C O U T L O O K G LO B A L M A N U FAC T U R I N G D OW N T U R N R IS I N G T R A D E B A R R I E R S
Considering the precarious outlook and large downside risks fiscal policy can play a more active role especially where the room to ease monetary policy is limited In countries where activity has weakened or could decelerate sharply fiscal stimulus can be provided if fiscal space exists and fiscal policy is not already overly expansionary In countries where fiscal consolidation is necessary its pace could be adjusted if market condi-tions permit to avoid prolonged economic weakness and disinflationary dynamics Low policy rates in many countries and the decline in long-term interest rates to historically very low or negative levels reduce the cost of debt service while these conditions persist Where debt
sustainability is not a problem the freed-up resources could be used to support activity as needed and to adopt measures to raise potential output such as infrastructure investment to address climate change
Across all economies the priority is to take actions that boost potential output growth improve inclusive-ness and strengthen resilience As the analysis pre-sented in Chapters 2 and 3 suggests structural policies for more open and flexible markets and improvements in governance can ease adjustment to shocks and boost output over the medium term helping to narrow within-country differences and encourage faster con-vergence across countries
xviii International Monetary Fund | October 2019
1International Monetary Fund | October 2019
Subdued Momentum Weak Trade and Industrial Production
Over the past year global growth has fallen sharply Among advanced economies the weakening has been broad based affecting major economies (the United States and especially the euro area) and smaller Asian advanced economies The slowdown in activity has been even more pronounced across emerging market and developing economies including Brazil China India Mexico and Russia as well as a few economies suffering macroeconomic and financial stress
One common feature of the weakening in growth momentum over the past 12 months has been a geo-graphically broad-based notable slowdown in indus-trial output driven by multiple and interrelated factors (Figure 11 panel 1) bull A sharp downturn in car production and sales which
saw global vehicle purchases decline by 3 percent in 2018 (Box 11) The automobile industry slump reflects both supply disruptions and demand influencesmdasha drop in demand after the expiration of tax incentives in China production lines adjusting to comply with new emission standards in the euro area (especially Germany) and China and possible prefer-ence shifts as consumers adopt a wait-and-see attitude with technology and emission standards changing rapidly in many countries as well as evolving car transportation and sharing options
bull Weak business confidence amid growing tensions between the United States and China on trade and technology As the reach of US tariffs and retaliation by trad-ing partners has steadily broadened since January 2018 the cost of some intermediate inputs has risen and uncertainty about future trade relation-ships has ratcheted up Manufacturing firms have become more cautious about long-range spending and have held back on equipment and machinery purchases This trend is most evident in the trade- and global-value-chain-exposed economies of east Asia In Germany and Japan industrial production was recently lower than one year ago while its growth slowed considerably in China and the United Kingdom and to some extent in the United States
(Figure 11 panel 2) The weakness appeared particu-larly pronounced in the production of capital goods1
bull A slowdown in demand in China driven by needed regulatory efforts to rein in debt and exacerbated by the macroeconomic consequences of increased trade tensions
With the slowdown in industrial production trade growth has come to a near standstill In the first half of 2019 the volume of global trade stood just 1 percent above its value one year agomdashthe slowest pace of growth for any six-month period since 2012 From a geographical standpoint major contributors to the weakening in global imports were China and east Asia (both advanced and emerging) and emerging market economies under stress (Figure 12) Down-turns in global trade are related to reduced investment spendingmdashas was the case for instance in 2015ndash16 Investment is intensive in intermediate and capital goods that are heavily traded Global investment did indeed slow (Figure 13) in line with reduced import growth reflecting cyclical factors the steep downturn in investment in stressed economies and the impact of increased trade tensions on business sentiment in the manufacturing sector Another contributor to the slowdown in global trade has been the downturn in car production and sales which is reflected in a slowdown in purchases of consumer durables (Figure 14)
In Chinamdashthe country with the highest investment spending in the worldmdashthe slowdown in invest-ment in 2019 has been much more limited than the slowdown in imports similar to what happened in 2015ndash16 Factors contributing to import weakness (beyond domestic capital spending) include reduced export growth which is intensive in imports and a decline in demand for cars (Box 11) and technology products such as smartphones The front-loading of exports before tariffs were imposed in late 2018 likely also played a role by bringing forward demand for import components
1Global semiconductor sales declined in 2018 in part related to seeming market saturation in smartphones and fewer launches of new tech products more broadly (ECB 2019)
GLOBAL PROSPECTS AND POLICIES1CHAP
TER
2
W O R L D E C O N O M I C O U T L O O K G LO b a L M a N U FaC T U R I N G D OW N T U R N R Is I N G T R a D E b a R R I E R s
International Monetary Fund | October 2019
While manufacturing lost steam services (a larger share of the economy) broadly held firm (Figure 15 panel 1) Resilient services activity has meant steady aggregate employment creation which supported consumer confidence (Figure 15 panel 2) and in turn household spending on services This favorable feedback cycle between service sector output employment and consumer confi-dence has supported domestic demand in several advanced economies
Weakening GrowthGrowth in the advanced economy group stabilized
in the first half of 2019 after a sharp decline in the second half of 2018 The US economy shifted to a
somewhat slower pace of expansion (about 2 per-cent on an annualized basis) in the past few quarters as the boost from the tax cuts of early 2018 faded and the UK economy slowed with investment held back by Brexit-related uncertainty The euro area economy registered stronger growth in the first half of this year than in the second half of 2018 but the German economy contracted in the second quar-ter as industrial activity slumped In general weak exports have been a drag on activity in the euro area since early 2018 while domestic demand has so far stayed firm Japan posted strong growth in the first half of this year driven by robust private and public consumption
Preliminary data suggest a modest pickup in growth in the first half of 2019 for the emerging market and developing economy group but well below its pace in 2017 and early 2018 Chinarsquos growth was lifted by fiscal stimulus and some easing
Industrial productionWorld trade volumesManufacturing PMI New orders
United StatesUnited KingdomGermany
JapanChina (right scale)Euro area 41
Figure 11 Global Activity Indicators(Three-month moving average year-over-year percent change unlessnoted otherwise)
Over the past 12 months there has been a geographically broad-based notable slowdown in industrial output
Sources CPB Netherlands Bureau for Economic Policy Analysis Haver Analytics Markit Economics and IMF staff calculationsNote PMI = purchasing managersrsquo index1Euro area 4 comprises France Italy the Netherlands and Spain
ndash5
0
5
10
50
55
60
65
70
75
2015 16 17 18
ndash1
0
1
2
3
4
5
6
7
8
2015 16 17 18 Aug19
Aug19
1 World Trade Industrial Production and Manufacturing PMI(Deviations from 50 for manufacturing PMI)
2 Industrial Production(Three-month moving average year-over-year percent change)
USA and CAN China Euro areaOther EMDEs United Kingdom Rest of worldEast Asia excluding China
In the first half of 2019 the volume of global trade stood just 1 percent above its value one year agomdashthe slowest pace of growth for any six-month period since 2012
Source IMF staff calculationsNote CAN = Canada EMDEs = emerging market and developing economies USA = United States
Figure 12 Contribution to Global Imports(Percentage points three-month moving average)
ndash2
ndash1
0
1
2
3
4
5
6
7
Jan2018
Apr18
Jul18
Oct18
Jan19
Apr19
Jun19
3
C H A P T E R 1 G LO b a L P R O s P E C Ts a N D P O L I C I E s
International Monetary Fund | October 2019
of the pace of financial regulatory strengthening initiated in the second half of 2018 Indiarsquos econ-omy decelerated further in the second quarter held back by sector-specific weaknesses in the automobile sector and real estate as well as lingering uncertainty about the health of nonbank financial companies In Mexico growth slowed sharply during the first half of the year owing to elevated policy uncertainty
budget under-execution and some transitory factors On the other hand growth resumed in the second quarter in Brazil after a first-quarter contraction driven in part by a mining disaster Likewise growth recovered modestly in the second quarter in South Africa helped by improved electricity supply Growth recovered in Turkey in the first half of the year following a deep contraction in the second half of 2018 benefiting from more favorable global financial conditions and fiscal and credit support In contrast the contraction in Argentina continued through the first half of the year albeit at a slower pace and risks going forward are clearly to the downside due to the sharp deterioration in market conditions
Muted InflationThe broad synchronized global expansion from
mid-2016 through mid-2018 helped narrow output gaps particularly in advanced economies but did not
Real investment Real GDP at market exchange rates Real imports
0
5
ndash20
ndash15
ndash10
ndash5
10
15
2005 07 09 11 13 15 17 19
1 Advanced Economies
ndash5
0
5
10
15
20
25
2005 07 09 11 13 15 17 19
3 China
ndash15
ndash10
ndash5
0
5
10
15
20
2005 07 09 11 13 15 17 19
2 Emerging Market and Developing Economies Excluding China
Source IMF staff estimates
Global investment slowed in 2019 in line with reduced import growth
Figure 13 Global Investment and Trade(Percent change)
Machinery and equipment1 Consumer durables (right scale)2
Sources Haver Analytics Markit Economics and IMF staff calculations1Australia Brazil Canada Chile China euro area India Indonesia Japan Korea Malaysia Mexico Russia South Africa Turkey United Kingdom United States2Australia Brazil Canada Chile China euro area Indonesia Japan Korea Malaysia Mexico South Africa Turkey United Kingdom United States
Weaker spending on machinery equipment and consumer durables has been an important contributor to the slowdown in global trade
0
6
1
2
3
4
5
0
1
2
3
4
5
6
7
8
9
10
2015 16 17 18 19Q2
Figure 14 Spending on Durable Goods(Percent change from a year ago)
4
W O R L D E C O N O M I C O U T L O O K G LO b a L M a N U FaC T U R I N G D OW N T U R N R Is I N G T R a D E b a R R I E R s
International Monetary Fund | October 2019
generate sustained increases in core consumer price inflation Not surprisingly as the global expansion has weakened core inflation has slid further below target across advanced economies and below historical averages in many emerging market and developing economies (Figure 16) The few exceptions to this broad pattern of softening are economies where large currency depreciations have fed through to higher domestic price pressure (such as in Argentina) or where there are acute shortages of essential goods (Venezuela)
Despite higher import tariffs in some countries cost pressures have generally remained subdued Wage growth has inched up from modest levels as unem-ployment rates have dropped further (close to record lows for example in the United States and the United Kingdom) (Figure 17 panel 1) The labor share of
Advanced economies1
Emerging market economies2
World
Manufacturing Services
While manufacturing lost steam services broadly held firm
Sources Haver Analytics Markit Economics and IMF staff calculations1Australia Czech Republic Denmark euro area Hong Kong SAR Israel Japan Korea Norway Sweden Switzerland Taiwan Province of China United Kingdom United States2Argentina Brazil Chile China Colombia Hungary Indonesia Malaysia Mexico Philippines Poland Russia South Africa Thailand Turkey Ukraine
2 Consumer Confidence(Index 2015 = 100)
48
50
52
54
56
96
98
100
102
104
106
108
110
112
2015 16 17 18 Aug19
Jun2017
Sep17
Dec17
Mar18
Jun18
Sep18
Dec18
Mar19
Aug19
1 Global Manufacturing and Services PMI(Index greater than 50 = expansion)
Figure 15 Global Purchasing Managersrsquo Index and Consumer Confidence
Consumer price inflation Core consumer price inflation
AE core goods AE core services2002ndash08 average 2011ndash17 average
ndash1
0
1
2
3
4
2003 04 05 06 07 08 09 10 11 12 13 14 15 16 17 18 Aug19
ndash2
ndash1
0
1
2
3
2015 16 17 18 Jul19
1
2
3
4
5
6
2015 16 17 18 Jul19
Sources Consensus Economics Haver Analytics and IMF staff calculationsNote Country lists use International Organization for Standardization (ISO) country codes1Advanced economies are AUT BEL CAN CHE CZE DEU DNK ESP EST FIN FRA GBR GRC HKG IRL ISR ITA JPN KOR LTU LUX LVA NLD NOR PRT SGP SVK SVN SWE TWN USA2Emerging market and developing economies are BGR BRA CHL CHN COL HUN IDN IND MEX MYS PER PHL POL ROU RUS THA TUR ZAF3Sample comprises 16 advanced economies (AE) Australia Austria Canada Denmark Finland France Germany Italy Japan Netherlands Norway Portugal Spain Sweden United Kingdom and United States
2 Emerging Market and Developing Economies2
3 Advanced Economy Core Goods and Core Services Consumer PriceInflation3
(Year over year percent)
1 Advanced Economies1
Figure 16 Global Inflation(Three-month moving average annualized percent change unless noted otherwise)
Since mid-2018 core inflation has slid further below target across advanced economies and below historical averages in many emerging market and developing economies
5
C H A P T E R 1 G LO b a L P R O s P E C Ts a N D P O L I C I E s
International Monetary Fund | October 2019
income has been on a gentle upward trend since around 2014 in Japan the United Kingdom and the United States and has increased in the euro area since early 2018 (Figure 17 panel 2) These developments appear not to have passed through to core consumer price inflation suggesting some modest compression of firmsrsquo profit margins In the emerging and developing Europe region labor shortages have contributed to robust wage growth in many economies Nonetheless as discussed in Chapter 2 of the Regional Economic Outlook for Europe wage growth has not transmitted to rising final goods price inflation across the region (Turkeyrsquos relatively high inflation can be attributed to other drivers including past currency depreciation)
Energy prices declined by 13 percent between the reference periods for the April 2019 and current World Economic Outlook (WEO) as record-high US crude oil production together with soft demand outweighed the influence of supply shortfalls related to US sanctions on Iran producer cuts by the Organization for the Petro-leum Exporting Countries and strife in Venezuela and
Libya (Figure 18) The September 14 attack on key oil refining facilities in Saudi Arabia threatened severe supply disruptions causing crude oil prices to spike by more than 10 percent in the immediate aftermath Prices sub-sequently retreated somewhat on reports of less damage than initially feared Coal and natural gas prices also declined between the reference periods as a result of weak demand prospects Metal prices remained broadly flat with declines in copper and aluminum prices offsetting increases in those for nickel and iron ore between the two reference periods (see the Commodities Special Feature)
Overall low core inflation readings and sub-dued impulses from commodity prices to headline inflation have led to declines in market pricing of expected inflation especially in the United States and the euro area
Volatile Market Sentiment Monetary Policy Easing
Market sentiment has been volatile since April reflecting multiple influences that include additional US tariffs on Chinese imports and retaliation by
Unit labor costCompensation
United States JapanEuro areaUnited Kingdom
1 Unit Labor Cost and Compensation 2019H1(Percent change from one year ago)
2 Labor Share(2007 = 100)
Sources Haver Analytics and IMF staff calculations
United States Euro area Japan
2007 08 09 10 11 12 13 14 15 16 17 18 19Q2
0
106
104
102
100
98
96
1
2
3
4
5
Figure 17 Wages Unit Labor Costs and Labor Shares
Wage growth and the labor share of income have increased recently in some advanced economies
Average petroleum spot price Food Metals
Figure 18 Commodity Prices(Deflated using US consumer price index 2014 = 100)
Commodity price indices have generally softened since the spring
Sources IMF Primary Commodity Price System and IMF staff calculations
120
110
90
80
70
60
50
40
100
302014 15 16 17 18 Aug
19
6
W O R L D E C O N O M I C O U T L O O K G LO b a L M a N U FaC T U R I N G D OW N T U R N R Is I N G T R a D E b a R R I E R s
International Monetary Fund | October 2019
China fears of disruptions to technology supply chains prolonged uncertainty on Brexit geopolitical strains and policy rate cuts and dovish communication by several central banks The net effect of these forces is that financial conditions across advanced econo-mies are now generally easier than at the time of the April 2019 WEO but they are broadly unchanged across most emerging market and developing econo-mies (see the October 2019 Global Financial Stability Report (GFSR))
Among advanced economies major central banks have turned more accommodative with a dovish shift in communications earlier in the year followed by easing actions during the summer The US Fed-eral Reserve cut the Federal Funds rate in July and September and ended its balance sheet reduction In September the European Central Bank reduced its deposit rate and announced a resumption of quan-titative easing These policy shifts together with rising market concerns of slower growth momentum contributed to sizable declines in sovereign bond yieldsmdashin some cases deep into negative territory (Figure 19) Yields on 10-year US Treasury notes UK gilts German bunds and French securities for example dropped between 60 and 100 basis points from March to late September while yields on Italian 10-year bonds declined by 175 basis points on the formation of a new government Prices of riskier securities have been volatile Credit spreads on US and euro area high-yield corporate securities have widened marginally since April but remain below their levels in late 2018 Equity markets in the United States and Europe have lost some ground since April but are still well above the lows during the sell-off at the end of 2018
Currency movements for advanced economies have been notable in some cases In real effective terms the yen appreciated by more than 5 percent and the Swiss franc by 3 percent between March and late September as market volatility spiked In contrast the British pound has depreciated by 4 percent on increased concern about a no-deal Brexit The US dollar has strengthened by about 2frac12 percent whereas the euro has depreciated by about 1frac12 percent Financial flows to and from advanced economies have remained generally subdued especially since early 2018 One factor explaining these develop-ments is the notable decline in foreign direct investment flows which have been affected by financial operations of multinational corporations following tax reform in the United States (Box 12)
United States JapanGermany Italy
TOPIXEuro StoxxMSCI Emerging Market
SampP 500
JapanUnited StatesUnited KingdomGermanyItaly
Mar 21 2018Sep 17 2018Mar 22 2019Sep 30 2019
United StatesEuro areaUnited Kingdom
Sovereign bond yields have declined notably in recent months in some cases deep into negative territory
Figure 19 Advanced Economies Monetary and Financial Market Conditions(Percent unless noted otherwise)
Sources Bloomberg Finance LP Haver Analytics Thomson Reuters Datastream and IMF staff calculationsNote MSCI = Morgan Stanley Capital International SampP = Standard amp Poorrsquos TOPIX = Tokyo Stock Price Index WEO = World Economic Outlook1Expectations are based on the federal funds rate futures for the United States the sterling overnight interbank average rate for the United Kingdom and the euro interbank offered forward rate for the euro area updated September 30 20192Data are through September 27 2019
ndash1
0
1
2
3
4
5
6
7
8
2019 20 21
10
15
20
25
30
35
020406080
100120140160180200220
ndash1
0
1
2
3
4
5
6
00
05
10
15
20
25
30
35
2018 19 20 21 Sep22
Sep22
2015 16 17 18 Sep19
2015 16 17 18 Sep19
2015 16 17 18 Sep19
2015 16 17 18 Sep19
0
200
400
600
800
1000
6 Price-to-Earnings Ratios25 Equity Markets2
(Index 2007 = 100)
3 Ten-Year Government BondYields2
4 Credit Spreads2
(Basis points)
US high yield
Euro high yieldUS high grade
Euro high grade
2 Policy Rate Expectations1
(Dashed lines arefrom the April 2019WEO)
1 US Policy RateExpectations1
7
C H A P T E R 1 G LO b a L P R O s P E C Ts a N D P O L I C I E s
International Monetary Fund | October 2019
Among emerging market and developing economies central banks in several countries (for example Brazil Chile India Indonesia Mexico Peru Philippines Russia South Africa Thailand and Turkey) have cut policy rates since April Sovereign spreads have been broadly stable over this period with a few exceptions (Figure 110) Spreads narrowed in Brazil on growing optimism that the long-awaited pension reform would be enacted Mexicorsquos sovereign spreads widened temporarily following a credit rating downgrade in June Meanwhile in Argentina the primary elections in August triggered a sharp increase in government bond yields amid a wider sell-off in Argentine assets In Turkey spreads decom-pressed significantly following municipal elections in June and are still wider than in April Emerging market equity indices are broadly trading at April levels which reflects offsetting influences on earnings prospects from increased domestic and external monetary policy support and intensifying trade tensions (Figure 111)
Capital flows to emerging market economies have reflected the broader shifts in risk sentiment since April with investors lowering their exposure to equities and rotating toward hard currency bonds (Figure 112) Portfolio flows into the emerging market asset class remain stronger overall than during the retrenchment of late 2018 investors continue to differentiate across individual economies based on economic and political fundamentals Most currencies appreciated between March and July helped by the US Federal Reserversquos dovish communications and move toward a more accommodative stance But several currencies lost ground in August with the deterioration in risk sentiment particularly the Argentine peso The Chinese renminbi has depreciated by about 3frac12 percent since March (Figure 113)
Global Growth Outlook Modest Pickup amid Difficult Headwinds
Projected growth for 2019 at 30 percent is the weakest since 2009 Except in sub-Saharan Africa more than half of countries are expected to register per capita growth lower than their median rate during the past 25 years The marked deceleration reflects carryover from broad-based weakness in the second half of 2018 followed by a mild growth uptick in the first half of 2019 and supported in some cases by more accommodative policy stances (such as in China and to some extent the United States) With growth estimates for both the second half of 2018 and the
China Brazil TurkeyMexico Argentina (right scale)
April 2019 versus April 2018Latest versus April 2019
ndash100
0
100
200
300
400
500
600
ARGBRA
CHLCHN
COLEGY
HUNIDN
INDMAR
MYSMEX
PERPHL
POLROU
RUSTUR
TUNZAF
0
5
10
15
20
25
10
20
30
40
50
60
70
80
2015 16 17 18 Sep19
4 Current Account Balance and Change in EMBI Spreads
2
6
10
14
18
22
Sep19
2015 16 17 18
ndash100
0
100
200
300
400
ndash12 ndash10 ndash8 ndash6 ndash4 ndash2 0 2 4
TUN
HUN
MARPER
CHL
ROU
COL
ZAF
PHL
ARG(1771)
ARG(1357)
MYS
POL
EGY
TUR MEXBRAIDN
RUS
IND
CHN
Chan
ge in
EM
BI s
prea
d(b
asis
poi
nts
Apr
16
201
8ndashSe
p 2
7 2
019)
Current account 2017 (percent of GDP)
y = ndash4618x + 32862R2 = 01382
Sources Haver Analytics IMF International Financial Statistics Thomson ReutersDatastream and IMF staff calculationsNote EMBI = JP Morgan Emerging Markets Bond Index All financial market data are through September 27 2019 Data labels use International Organization for Standardization (ISO) country codes
1 Policy Rate(Percent)
3 Change in EMBI Spreads(Basis points)
2 Ten-Year Government Bond Yields(Percent)
Figure 110 Emerging Market Economies Interest Rates and Spreads
Barring a few cases emerging market sovereign spreads have been broadly stable since April
8
W O R L D E C O N O M I C O U T L O O K G LO b a L M a N U FaC T U R I N G D OW N T U R N R Is I N G T R a D E b a R R I E R s
International Monetary Fund | October 2019
ArgentinaBrazilMexicoRussia
ChinaEmerging Asiaexcluding China
South AfricaTurkey
CHNMYS
BRA CHNIND MEX
COL IDNMYS RUSTUR
BRA COLIDN INDMEX RUSTUR
1 2
Equity Markets(Index 2015 = 100)
Figure 111 Emerging Market Economies Equity Markets and Credit
Emerging market equity indices are broadly trading at April levels which reflects offsetting influences on earnings prospects from increased domestic and external monetary policy support and intensifying trade tensions
Sources Bloomberg Finance LP Haver Analytics IMF International Financial Statistics (IFS) Thomson Reuters Datastream and IMF staff calculationsNote Data labels use International Organization for Standardization (ISO) country codes1Credit is other depository corporationsrsquo claims on the private sector (from IFS) except in the case of Brazil for which private sector credit is from the Monetary Policy and Financial System Credit Operations published by Banco Central do Brasil and China for which credit is total social financing after adjusting for local government debt swaps
2015 16 17 18 Aug19
2015 16 17 18 Aug19
150
60
70
80
90
100
110
120
130
140
180
70
9080
100110120130140150160170
Real Credit Growth1
(Year-over-year percent change)
ndash15
ndash10
ndash5
0
5
10
15
20
25
ndash15
ndash10
ndash5
0
5
10
15
20
2015 16 17 18 Jul19
2015 16 17 18 Jul19
80
100
120
140
160
180
200
220
240
260
Credit-to-GDP Ratio1
(Percent)
4
15
25
35
45
55
65
75
85
2006 08 10 12 14 16 19Q2
2006 08 10 12 14 16 19Q2
5 6
3
Bond EM-VXYEquity
Emerging EuropeEmerging Asia excluding ChinaLatin America
Emerging EuropeEmerging Asia excluding ChinaLatin America
ChinaSaudi Arabia
Total
ChinaSaudi Arabia
Total
Emerging EuropeEmerging Asia excluding ChinaLatin America
ChinaSaudi Arabia
Total
Sep19
19Q2
19Q2
19Q2
Sources EPFR Global Haver Analytics IMF International Financial Statistics Thomson Reuters Datastream and IMF staff calculationsNote Capital inflows are net purchases of domestic assets by nonresidents Capital outflows are net purchases of foreign assets by domestic residents Emerging Asia excluding China comprises India Indonesia Malaysia the Philippines and Thailand emerging Europe comprises Poland Romania Russia and Turkey Latin America comprises Brazil Chile Colombia Mexico and Peru ECB = European Central Bank EM-VXY = JP Morgan Emerging Market Volatility Index LTROs = long-term refinancing operations
1 Net Flows in Emerging Market Funds(Billions of US dollars)
2 Capital Inflows(Percent of GDP)
4 Change in Reserves(Percent of GDP)
3 Capital Outflows Excluding Change in Reserves(Percent of GDP)
ndash6
ndash3
0
3
6
9
12
15
2007 08 09 10 11 12 13 14 15 16 17 18
ndash40ndash30ndash20ndash10
010203040
2010 11 12 13 14 15 16 17 18
Figure 112 Emerging Market Economies Capital Flows
Tapertantrum
Greekcrisis Irish
crisis
1st ECBLTROs
ndash6
ndash3
0
3
6
9
12
15
2007 08 09 10 11 12 13 14 15 16 17 18
ndash6
ndash3
0
3
6
9
12
15
2007 08 09 10 11 12 13 14 15 16 17 18
China equitymarket sell-off
US presidentialelection
Capital flows to emerging market economies have reflected the broader shifts in risk sentiment since April with investors lowering their exposure to equities and rotating toward hard currency bonds
9
C H A P T E R 1 G LO b a L P R O s P E C Ts a N D P O L I C I E s
International Monetary Fund | October 2019
first half of this year marked down the 2019 growth projection is 03 percentage point weaker than in the April 2019 WEO
The forces behind the slowdown in global growth during 2018ndash19mdashapart from the direct effect of very weak growth or contractions in stressed economiesmdashinclude a return to a more normal pace of expansion in the US economy softer external demand and disrup-tions associated with the rollout of new car emission standards in Europe especially Germany weaker mac-roeconomic conditions largely because of idiosyncratic factors in a group of key emerging market economies such as Brazil Mexico and Russia a softening in
Chinarsquos growth because of necessary financial regula-tory strengthening and drag from trade tensions with the United States slowing demand from China and broader global trade policy uncertainty weighing on east Asian economies a slowdown in domestic demand in India and the shadow cast by the possibility of a no-deal Brexit on the United Kingdom and the European Union more broadly
Continued macroeconomic policy support in major economies and projected stabilization in some stressed emerging market economies are expected to lift global growth modestly over the remainder of 2019 and into 2020 bringing projected global growth to 34 percent for 2020 (Table 11) The forecast markdown of 02 percentage point for 2020 relative to the April 2019 WEO largely reflects the fact that tariffs have risen and are costing the global economy following tariff announcements in May and August 2019 the average US tariff on imports from China will rise to just over 24 percent by December 2019 (compared with about 12frac14 percent assumed in the April 2019 WEO) while the average China tariff on imports from the United States will increase to about 26 percent (compared with about 16frac12 percent assumed in the April 2019 WEO) Scenario Box 12 provides simula-tions of the direct impact of the tariffs included in the baseline on global economic activity as well as their potential repercussions for financial market sentiment business confidence and productivity As Scenario Box 12 illustrates trade diversion spillovers for some economies while positive are temporary and are likely outweighed by business confidence and financial market sentiment effects Box 13 provides more details on the key policy and commodity price assumptions behind the global growth forecast
Figure 114 illustrates the countries and regions where growth fluctuations have affected changes in world growth since its peak in 2017 The dramatic worsening of macroeconomic conditions between 2017 and 2019 in a small number of economies under severe distress (in particular Argentina Iran Turkey and Venezuela) accounts for about half of the decline in world growth from 38 percent in 2017 to 30 percent in 2019 These same economiesmdashtogether with Brazil Mexico and Russia all three of which are expected to grow by about 1 percent or less in 2019mdashaccount for over 70 percent of the pickup in growth for 2020 Argentinarsquos economy is projected to contract again in 2020 but by less than this year and in Venezuela the multiyear collapse in output is projected to continue
Latest versus July 2019 July 2019 versus March 2019
ndash8
ndash6
ndash4
ndash2
0
2
4
6
USA EA JPN GBR SWE CHE KOR TWN SGP CAN NOR AUS NZL
ndash24
ndash20
ndash16
ndash12
ndash8
ndash4
0
4
8
12
ZAFCHN
INDIDN
MYSPHL
THAHUN
POLRUS
TURARG
BRACHL
COLMEX
PERPAK
2 Emerging Market Economies
1 Advanced Economies
Most emerging market currencies appreciated between March and July helped by the US Federal Reserversquos dovish communications and move toward a more accommodative stance But several currencies lost ground in August with the deterioration in risk sentiment
Source IMF staff calculationsNote EA = euro area Data labels use International Organization for Standardization (ISO) country codes Latest data available are for September 27 2019
Figure 113 Real Effective Exchange Rate Changes March 2019ndashSeptember 2019(Percent)
10
W O R L D E C O N O M I C O U T L O O K G LO b a L M a N U FaC T U R I N G D OW N T U R N R Is I N G T R a D E b a R R I E R s
International Monetary Fund | October 2019
Table 11 Overview of the World Economic Outlook Projections(Percent change unless noted otherwise)
2018Projections
Difference from July 2019 WEO Update1
Difference from April 2019 WEO1
2019 2020 2019 2020 2019 2020World Output 36 30 34 ndash02 ndash01 ndash03 ndash02
Advanced Economies 23 17 17 ndash02 00 ndash01 00United States 29 24 21 ndash02 02 01 02Euro Area 19 12 14 ndash01 ndash02 ndash01 ndash01
Germany2 15 05 12 ndash02 ndash05 ndash03 ndash02France 17 12 13 ndash01 ndash01 ndash01 ndash01Italy 09 00 05 ndash01 ndash03 ndash01 ndash04Spain 26 22 18 ndash01 ndash01 01 ndash01
Japan 08 09 05 00 01 ndash01 00United Kingdom 14 12 14 ndash01 00 00 00Canada 19 15 18 00 ndash01 00 ndash01Other Advanced Economies3 26 16 20 ndash05 ndash04 ndash06 ndash05
Emerging Market and Developing Economies 45 39 46 ndash02 ndash01 ndash05 ndash02Emerging and Developing Asia 64 59 60 ndash03 ndash02 ndash04 ndash03
China 66 61 58 ndash01 ndash02 ndash02 ndash03India4 68 61 70 ndash09 ndash02 ndash12 ndash05ASEAN-55 52 48 49 ndash02 ndash02 ndash03 ndash03
Emerging and Developing Europe 31 18 25 06 04 06 02Russia 23 11 19 ndash01 00 ndash05 02
Latin America and the Caribbean 10 02 18 ndash04 ndash05 ndash12 ndash06Brazil 11 09 20 01 ndash04 ndash12 ndash05Mexico 20 04 13 ndash05 ndash06 ndash12 ndash06
Middle East and Central Asia 19 09 29 ndash05 ndash03 ndash09 ndash04Saudi Arabia 24 02 22 ndash17 ndash08 ndash16 01
Sub-Saharan Africa 32 32 36 ndash02 00 ndash03 ndash01Nigeria 19 23 25 00 ndash01 02 00South Africa 08 07 11 00 00 ndash05 ndash04
MemorandumEuropean Union 22 15 16 ndash01 ndash02 ndash01 ndash01Low-Income Developing Countries 50 50 51 01 00 00 00Middle East and North Africa 11 01 27 ndash06 ndash04 ndash12 ndash05World Growth Based on Market Exchange Rates 31 25 27 ndash02 ndash02 ndash02 ndash02
World Trade Volume (goods and services) 36 11 32 ndash14 ndash05 ndash23 ndash07Imports
Advanced Economies 30 12 27 ndash10 ndash06 ndash18 ndash05Emerging Market and Developing Economies 51 07 43 ndash22 ndash08 ndash39 ndash10
ExportsAdvanced Economies 31 09 25 ndash13 ndash04 ndash18 ndash06Emerging Market and Developing Economies 39 19 41 ndash10 ndash05 ndash21 ndash07
Commodity Prices (US dollars)Oil6 294 ndash96 ndash62 ndash55 ndash37 38 ndash60Nonfuel (average based on world commodity import
weights) 16 09 17 15 12 11 06
Consumer PricesAdvanced Economies 20 15 18 ndash01 ndash02 ndash01 ndash03Emerging Market and Developing Economies7 48 47 48 ndash01 01 ndash02 01
London Interbank Offered Rate (percent) On US Dollar Deposits (six month) 25 23 20 ndash01 ndash03 ndash09 ndash18On Euro Deposits (three month) ndash03 ndash04 ndash06 ndash01 ndash03 ndash01 ndash04On Japanese Yen Deposits (six month) 00 00 ndash01 00 ndash01 00 ndash01Note Real effective exchange rates are assumed to remain constant at the levels prevailing during July 26ndashAugust 23 2019 Economies are listed on the basis of economic size The aggregated quarterly data are seasonally adjusted WEO = World Economic Outlook Beginning with the October 2019 WEO the regional group Commonwealth of Independent States (CIS) is discontinued Four of the CIS economies (Belarus Moldova Russia and Ukraine) are added to the regional group Emerging and Developing Europe The remaining eight economiesmdashArmenia Azerbaijan Georgia Kazakhstan Kyrgyz Republic Tajikistan Turkmenistan and Uzbekistan which comprise the regional subgroup Caucasus and Central Asia (CCA)mdashare combined with Middle East North Africa Afghanistan and Pakistan (MENAP) to form the new regional group Middle East and Central Asia (MECA)1Difference based on rounded figures for the current (July 2019) WEO Update and April 2019 WEO forecasts and on revised and new groups2For Germany the definition of GDP has been changed from a working-day-adjusted basis (through the April 2019 WEO) to an unadjusted basis from the July 2019 WEO Update onward The change in definition implies a higher level of GDP for 2020 which is a leap year3Excludes the Group of Seven (Canada France Germany Italy Japan United Kingdom United States) and euro area countries
11
C H A P T E R 1 G LO b a L P R O s P E C Ts a N D P O L I C I E s
International Monetary Fund | October 2019
Table 11 (continued)
Year over Year Q4 over Q48
Projections
Projections
2017 2018 2019 2020 2017 2018 2019 2020World Output 38 36 30 34 41 32 32 34
Advanced Economies 25 23 17 17 28 18 16 18United States 24 29 24 21 28 25 24 20Euro Area 25 19 12 14 30 12 10 18
Germany2 25 15 05 12 34 06 04 13France 23 17 12 13 30 12 10 13Italy 17 09 00 05 17 00 02 10Spain 30 26 22 18 31 23 20 18
Japan 19 08 09 05 24 03 03 12United Kingdom 18 14 12 14 16 14 10 16Canada 30 19 15 18 29 16 18 17Other Advanced Economies3 29 26 16 20 30 22 17 21
Emerging Market and Developing Economies 48 45 39 46 52 45 45 47Emerging and Developing Asia 66 64 59 60 68 60 60 59
China 68 66 61 58 67 64 60 57India4 72 68 61 70 81 58 67 72ASEAN-55 53 52 48 49 54 52 48 49
Emerging and Developing Europe 39 31 18 25 Russia 16 23 11 19 05 29 18 12
Latin America and the Caribbean 12 10 02 18 13 03 04 18Brazil 11 11 09 20 22 11 12 23Mexico 21 20 04 13 15 16 10 07
Middle East and Central Asia 23 19 09 29 Saudi Arabia ndash07 24 02 22 ndash13 43 ndash09 30
Sub-Saharan Africa 30 32 32 36 Nigeria 08 19 23 25 South Africa 14 08 07 11 22 02 08 06
MemorandumEuropean Union 28 22 15 16 30 17 13 18Low-Income Developing Countries 47 50 50 51 Middle East and North Africa 18 11 01 27 World Growth Based on Market Exchange Rates 32 31 25 27 35 26 25 28
World Trade Volume (goods and services) 57 36 11 32 Imports
Advanced Economies 47 30 12 27 Emerging Market and Developing Economies 75 51 07 43
ExportsAdvanced Economies 47 31 09 25 Emerging Market and Developing Economies 73 39 19 41
Commodity Prices (US dollars)Oil6 233 294 ndash96 ndash62 196 95 ndash38 ndash88Nonfuel (average based on world commodity export weights) 64 16 09 17 35 ndash18 49 ndash10
Consumer PricesAdvanced Economies 17 20 15 18 17 19 17 16Emerging Market and Developing Economies7 43 48 47 48 37 42 41 40
London Interbank Offered Rate (percent) On US Dollar Deposits (six month) 15 25 23 20 On Euro Deposits (three month) ndash03 ndash03 ndash04 ndash06 On Japanese Yen Deposits (six month) 00 00 00 ndash01 4For India data and forecasts are presented on a fiscal year basis and GDP from 2011 onward is based on GDP at market prices with fiscal year 201112 as a base year5Indonesia Malaysia Philippines Thailand Vietnam6Simple average of prices of UK Brent Dubai Fateh and West Texas Intermediate crude oil The average price of oil in US dollars a barrel was $6833 in 2018 the assumed price based on futures markets is $6178 in 2019 and $5794 in 20207Excludes Venezuela See country-specific note for Venezuela in the ldquoCountry Notesrdquo section of the Statistical Appendix8For World Output the quarterly estimates and projections account for approximately 90 percent of annual world output at purchasing-power-parity weights For Emerging Market and Developing Economies the quarterly estimates and projections account for approximately 80 percent of annual emerging market and developing economiesrsquo output at purchasing-power-parity weights
12
W O R L D E C O N O M I C O U T L O O K G LO b a L M a N U FaC T U R I N G D OW N T U R N R Is I N G T R a D E b a R R I E R s
International Monetary Fund | October 2019
albeit at a less dramatic pace than in 2019 In Iran modest growth is expected to resume after recession Activity should pick up in Brazil Mexico Russia Saudi Arabia and Turkey The projected uptick in global growth also relies importantly on financial mar-ket sentiment staying supportive and continued fading of temporary drags notably in the euro area where industrial output is expected to improve gradually after protracted weakness In turn these factors rely on a conducive global policy backdrop that ensures that the dovish tilt of central banks and the buildup of policy stimulus in China are not blunted by escalating trade tensions or a disorderly Brexit
The world economy faces difficult headwinds over the forecast horizon Despite the recent decline in
long-term interest rates creating more fiscal room the global environment is expected to be characterized by relatively limited macroeconomic policy space to combat downturns and weaker trade flows in part reflecting the increase in trade barriers and anticipated protracted trade policy uncertainty (global export and import volume projections have been cumulatively marked down by about 3frac12 percent over the forecast horizon relative to the April 2019 WEO) Weighed down by aging populations and tepid productivity growth advanced economies are expected to return to their modest potential rate of expansion Moreover China is projected to slow gradually to a more sustain-able rate of growth
Against this backdrop beyond 2020 global growth is projected at about 36 percent The forecast relies to a large extent on durable normalization in emerg-ing market and developing economies currently in macroeconomic distress and on continued healthy performance of relatively faster-growing emerging mar-ket and developing economies The resultant shifting weights in the global economy toward faster-growing emerging market and developing economies help sup-port the projected stable medium-term growth profile contributing frac14 percentage point to global growth by the end of the forecast horizon compared with a global growth projection with country weights held constant at their 2018 level
Growth Forecast for Advanced EconomiesFor advanced economies growth is projected to
soften to 17 percent in 2019 and 2020 The fore-cast is 01 percentage point lower for 2019 than in the April 2019 WEO bull In the United States the economy maintained
momentum in the first half of the year Although investment remained sluggish employment and consumption were buoyant Growth in 2019 is expected to be 24 percent moderating to 21 per-cent in 2020 The projected moderation reflects an assumed shift in the fiscal stance from expansionary in 2019 to broadly neutral in 2020 as stimulus from the recently adopted two-year budget deal offsets the fading effects of the 2017 Tax Cuts and Jobs Act Overall the growth forecast is revised up from the April 2019 WEO (01 percentage point higher for 2019 and 02 for 2020) Revisions to past GDP data imply weaker carryover into 2019 and trade-related policy uncertainty imparts further
2017ndash18 2018ndash19 2019ndash20
ndash03
ndash02
ndash01
00
01
02
03
Stressed Euroarea
UnitedStates
BRAMEXRUS
China NIEs India GCC Other
20
25
30
35
40
45
2017 18 19 20
Figure 114 Global Growth
Source IMF staff estimatesNote NIEs = newly industrialized Asian economies (Hong Kong SAR Korea Macao SAR Singapore Taiwan Province of China) stressed = Argentina Iran Libya Sudan Turkey Venezuela GCC = Gulf Cooperation Council (Bahrain Kuwait Oman Qatar Saudi Arabia United Arab Emirates) Data labels use International Organization for Standardization (ISO) country codes
2 Global Growth 2017ndash20(Percent)
1 Contributions to Changes in Global Growth 2017ndash20(Percentage points)
The slowdown in global growth since 2017 and the projected pick up in 2020 reflects a major downturn and projected recovery in a group of emerging market economies under severe distress
13
C H A P T E R 1 G LO b a L P R O s P E C Ts a N D P O L I C I E s
International Monetary Fund | October 2019
negative effects but the two-year budget deal and the Federal Reserversquos policy rate cuts yield net upward revisions
bull In the euro area weaker growth in foreign demand and a drawdown of inventories (reflecting weak industrial production) have kept a lid on growth since mid-2018 Activity is expected to pick up only modestly over the remainder of this year and into 2020 as external demand is projected to regain some momentum and temporary factors (including new emission standards that hit German car production) continue to fade Growth is pro-jected at 12 percent in 2019 (01 percentage point lower than in April) and 14 percent in 2020 The 2019 forecast is revised down slightly for France and Germany (due to weaker-than-expected external demand in the first half of the year) Both the 2019 and 2020 forecasts were marked down for Italy owing to softening private consumption a smaller fiscal impulse and a weaker external environment The outlook is also slightly weaker for Spain with growth projected to slow gradually from 26 percent in 2018 to 22 percent in 2019 and 18 percent in 2020 (01 percentage point lower than in April)
bull The United Kingdom is set to expand at 12 per-cent in 2019 and 14 percent in 2020 The unchanged projection for both years (relative to the April 2019 WEO) reflects the combination of a negative impact from weaker global growth and ongoing Brexit uncertainty and a positive impact from higher public spending announced in the recent Spending Review The economy contracted in the second quarter and recent indicators point to weak growth in the third quarter The forecast assumes an orderly exit from the European Union followed by a gradual transition to the new regime However as of early September the ultimate form of Brexit remains highly uncertain
bull Japanrsquos economy is projected to grow by 09 per-cent in 2019 (01 percentage point lower than anticipated in the April 2019 WEO) Strong pri-vate consumption and public spending in the first half of 2019 outweighed continued weakness in the external sector Growth is projected at 05 percent in 2020 (unchanged from the April 2019 WEO) with temporary fiscal measures expected to cushion part of the anticipated decline in private consump-tion following the October 2019 increase in the consumption tax rate
Beyond 2020 growth in the advanced economy group is projected to stabilize at about 16 percent similar to the April 2019 WEO forecast A modest uptick expected in productivity is projected to coun-teract the drag on potential output growth from slower labor force growth as populations continue to age
Growth Forecast for Emerging Market and Developing Economies
Growth in the emerging market and developing economy group is expected to bottom out at 39 per-cent in 2019 rising to 46 percent in 2020 The fore-casts for 2019 and 2020 are 05 percentage point and 02 percentage point lower respectively than in April reflecting downward revisions in all major regions except emerging and developing Europe2
bull Emerging and Developing Asia remains the main engine of the world economy but growth is softening gradually with the structural slowdown in China Output in the region is expected to grow at 59 per-cent this year and at 60 percent in 2020 (04 and 03 percentage point lower respectively than in the April 2019 WEO forecast) In China the effects of escalating tariffs and weakening external demand have exacerbated the slowdown associated with needed regulatory strengthening to rein in the accumulation of debt With policy stimulus expected to continue supporting activity in the face of the adverse exter-nal shock growth is forecast at 61 percent in 2019 and 58 percent in 2020mdash02 and 03 percentage point lower than in the April 2019 WEO projection Indiarsquos economy is set to grow at 61 percent in 2019 picking up to 7 percent in 2020 The downward revision relative to the April 2019 WEO of 12 per-centage points for 2019 and 05 percentage point for 2020 reflects a weaker-than-expected outlook for domestic demand Growth will be supported by the lagged effects of monetary policy easing a reduc-tion in corporate income tax rates recent measures to address corporate and environmental regulatory
2Beginning with the October 2019 WEO the regional group Commonwealth of Independent States (CIS) is discontinued Four of the CIS economies (Belarus Moldova Russia and Ukraine) are added to the regional group Emerging and Developing Europe The remaining eight economiesmdashArmenia Azerbaijan Georgia Kazakhstan Kyrgyz Republic Tajikistan Turkmenistan and Uzbekistan which comprise the regional subgroup Caucasus and Central Asia (CCA)mdashare combined with Middle East North Africa Afghanistan and Pakistan (MENAP) to form the new regional group Middle East and Central Asia (MECA)
14
W O R L D E C O N O M I C O U T L O O K G LO b a L M a N U FaC T U R I N G D OW N T U R N R Is I N G T R a D E b a R R I E R s
International Monetary Fund | October 2019
uncertainty and government programs to support rural consumption
bull Subdued growth in emerging and developing Europe in 2019 largely reflects a slowdown in Russia and flat activity in Turkey The region is expected to grow at 18 percent in 2019 and 25 percent in 2020 The upward revision to 2019 growth relative to the April 2019 forecast reflects a shallower-than-expected downturn in Turkey in the first half of the year as a result of fiscal support In Russia by contrast growth has been weaker this year than forecast in April but is projected to recover next year contributing to the upward revision to projected 2020 growth for the region Several countries in central and eastern Europe including Hungary and Poland are experi-encing solid growth on the back of resilient domestic demand and rising wages
bull In Latin America activity slowed notably at the start of the year across the larger economies mostly reflecting idiosyncratic factors Growth in the region is now expected at 02 percent this year (12 percentage point lower than in the April 2019 WEO) The sizable downward revision for 2019 reflects downgrades to Brazil (where mining supply disruptions have hurt activity) and Mexico (where investment remains weak and private consumption has slowed reflecting policy uncertainty weakening confidence and higher borrowing costs) Argentinarsquos economy is expected to contract further in 2019 on lower confidence and tighter external financ-ing conditions Chilersquos growth projection is revised down following weaker-than-expected performance at the start of the year The deep humanitarian crisis and economic implosion in Venezuela continue to have a devastating impact with the economy expected to shrink by about one-third in 2019 For the region as a whole growth is expected to firm up to 18 percent in 2020 (06 percentage point lower than in the April forecast) The projected strength-ening reflects expected recovery in Brazil (on the back of accommodative monetary policy) and in Mexico (as uncertainty gradually subsides) together with less severe contractions for 2020 compared to this year in Argentina and Venezuela
bull Growth in the Middle East and Central Asia region is expected to be 09 percent in 2019 rising to 29 percent in 2020 The forecast is 09 and 04 per-centage point lower respectively than in the April 2019 WEO largely due to the downward forecast
revision for Iran (owing to the effect of tighter US sanctions) and Saudi Arabia While non-oil growth is expected to strengthen in 2019 on higher government spending and confidence oil GDP in Saudi Arabia is projected to decline against the backdrop of the extension of the OPEC+ agreement and a generally weak global oil market The impact on growth of the recent attacks on Saudi Arabiarsquos oil facilities is difficult to gauge at this stage but adds uncertainty to the near-term outlook Growth is projected to pick up in 2020 as oil GDP stabilizes and solid momentum in the non-oil sector continues Civil strife in some other economies including Libya Syria and Yemen weigh on the regionrsquos outlook
bull In sub-Saharan Africa growth is expected at 32 per-cent in 2019 and 36 percent in 2020 slightly lower for both years than in the April 2019 WEO Higher albeit volatile oil prices earlier in the year have supported the subdued outlook for Nigeria and some other oil-exporting countries in the region but Angolarsquos economymdashbecause of a decline in oil productionmdashis expected to contract this year and recover only mildly next year In South Africa despite a moderate rebound in the second quarter growth is expected to be weaker in 2019 than projected in the April 2019 WEO following a very weak first quarter reflecting a larger-than-anticipated impact of labor strikes and energy supply issues in mining together with weak agricultural production While the three largest economies of the region are projected to continue their lackluster performance many other economiesmdashtypically more diversified onesmdashare experiencing solid growth About 20 economies in the region accounting for about 45 percent of the sub-Saharan African population and 34 percent of the regionrsquos GDP (1 percent of global GDP) are estimated to be growing faster than 5 percent this year while growth in a somewhat larger set of countries in per capita terms is faster than in advanced economies
Over the medium term growth for the emerging market and developing economies group is pro-jected to stabilize at about 48 percent but with important differences across regions In emerging and developing Asia it is expected to remain at about 6 percent through the forecast horizon This smooth growth profile rests on a gradual slowdown in China to 55 percent by 2024 and firming and
15
C H A P T E R 1 G LO b a L P R O s P E C Ts a N D P O L I C I E s
International Monetary Fund | October 2019
stabilization of growth in India at about 73 percent over the medium term based on continued imple-mentation of structural reforms In Latin America growth is projected to increase from the 18 percent projected for 2020 but remain below 3 percent over the medium term as structural rigidities subdued terms of trade and fiscal imbalances (particularly for Brazil) weigh on the outlook Activity in emerg-ing and developing Europe is projected to pick up from its current post-global-financial-crisis low with the region expected to grow at about 2frac12 per-cent over the medium term Prospects vary across sub-Saharan Africa but growth for the region as a whole is projected to increase from 36 percent in 2020 to 42 percent in 2024 (although for close to two-fifths of economies the average growth rate over the medium term is projected to exceed 5 percent) The medium-term outlook for the Middle East and Central Asia region is largely shaped by the outlook
for fuel prices needed adjustment to correct macroeco-nomic imbalances in certain economies and geopoliti-cal tensions
Forty emerging market and developing economies (about a quarter of the total) are projected to grow in per capita terms above the 33 percent weighted average of the group which is more than 2 percent-age points above the average for advanced economies (Figure 115) For these economiesmdashwhich include China India and Indonesiamdashthe challenge is to ensure that these growth rates materialize and that the benefits of growth are shared widely Convergence prospects are instead bleak for some emerging mar-ket and developing economies Across sub-Saharan Africa and in the Middle East and Central Asia region 47 economies accounting for about 10 percent of global GDP in purchasing-power-parity terms and close to 1 billion in population are projected to grow by less than advanced economies in per capita terms
Lower than the AE aggregate (13 percent a year)Higher than or equal to the AE aggregate and lower than the EMDE aggregate (33 percent a year)Higher than or equal to the EMDE aggregate
Source IMF staff estimatesNote The AE (EMDE) aggregate per capita growth rate refers to the growth rate of per capita real GDP in the advanced economy (emerging market and developing economy) group calculated as the sum of real GDP at purchasing-power-parity rates divided by total population in the group See also Annex Table 116 AE = advanced economy EMDE = emerging market and developing economy Country borders shown on this map do not imply official endorsement or acceptance by the IMF
Forty emerging market and developing economies are projected to grow in per capita terms above the 33 percent weighted average of the group which is more than 2 percentage points above the average for advanced economies
Figure 115 Emerging Market and Developing Economies Per Capita GDP Growth(2019ndash24 average)
16
W O R L D E C O N O M I C O U T L O O K G LO b a L M a N U FaC T U R I N G D OW N T U R N R Is I N G T R a D E b a R R I E R s
International Monetary Fund | October 2019
over the next five years implying that their income levels are set to fall further behind those economies Figure 116 documents the heterogeneity in per capita growth rates in sub-Saharan Africa where most countries are projected to grow at rates well above the weighted average for the region
Inflation OutlookConsistent with the softening of energy prices and
the moderation in growth consumer price inflation is expected to average 15 percent this year in advanced economies down from 20 percent in 2018 With the US economy operating above potential core consumer price inflation is projected at about 26 percent in 2020ndash21 above its medium-term value of 22 percent (the level consistent with the medium-term target of 20 percent for personal consumption expenditure inflation) Japanrsquos core inflation rate (excluding fresh food and energy) is projected to rise to about 1 percent in 2019ndash20 due to the October consumption tax rate increase inching up
further to 12 percent in the medium term Headline inflation is expected to rise gradually in the euro area from 12 percent in 2019 to 14 percent in 2020
Inflation in emerging market and developing economies excluding Venezuela is expected to inch down to 47 percent this year Exceptions include Argentina where inflation has increased on the back of the peso depreciation Russia where an increase in the value-added tax rate early in the year boosted inflation and to a lesser degree China in part due to rising pork prices As inflation expectations become better anchored around targets in some economies and the pass-through from previous depreciations wanes further inflation in the emerging market economy group is set to moderate to about 44 percent over the medium term
External Sector OutlookTrade Growth
After peaking in 2017 global trade growth slowed considerably in 2018 and the first half of 2019 and is projected at 1frac14 percent in 2019 The slowdown reflects a confluence of factors including a slowdown in investment the impact of increased trade tensions on spending on capital goods (which are heavily traded) a tech cycle and a sizable decline in trade in cars and car parts Global trade growth is projected to recover to 32 percent in 2020 and 375 percent in subsequent years The waning of some temporary fac-tors together with some recovery in global economic activity in 2020 buttressed by a gradual pickup in investment demand in emerging market and devel-oping economies should support the pickup in trade growth offsetting the slowdown in capital spending in advanced economies that is projected for 2020 and beyond However there is sizable uncertainty con-cerning the future structure of value chains and the repercussions of tensions related to technology and these could weigh on trade growth
Current Account Positions
After widening marginally in 2018 primarily reflecting higher oil prices global current account deficits and surpluses are projected to gradually narrow in 2019 and subsequent years (Figure 117) Among surplus countries current account balances are projected to gradually decline in oil exporters advanced European creditors and advanced Asian economies in 2019 and into the medium term
In sub-Saharan Africa most countries are projected to grow at rates well above the weighted average for the region
Sources National statistical agencies United Nations and IMF staff estimatesNote The dashed line shows the weighted average per capita growth rate in sub-Saharan Africa during 2019ndash24 Nigeria is not shown on the chart as its population estimated by the United Nations at about 196 million in 2018 is outside the x-axis range Its average projected per capita growth rate in 2019ndash24 is about zero Data labels use International Organization for Standardization (ISO) country codes
Figure 116 Sub-Saharan Africa Population in 2018 and Projected Growth Rates in GDP per Capita 2019ndash24
8
6
2
0
Aver
age
grow
th ra
te 2
019ndash
24
ndash2
ndash4
ndash6
4
ndash8ndash10 0 20
Population 2018 (millions)4010 30 50 60 70 80 90 100
UGA
TZA
ZAF
SENRWA
KEN
ETHCIV
COD
AGO
17
C H A P T E R 1 G LO b a L P R O s P E C Ts a N D P O L I C I E s
International Monetary Fund | October 2019
The modest widening of Chinarsquos current account surplus in 2019 is projected to be reversed in sub-sequent years as the rebalancing process continues Current account deficits are projected to shrink in central and eastern Europe in 2019 reflecting the balancing of the current account in Turkey following a sharp reduction in domestic demand After widen-ing in 2019ndash20 driven by expansionary fiscal policy and a strengthening dollar the US current account deficit is projected to shrink over the medium term as the growth rate of domestic demand declines3
3Balance of payments data show a notable positive world current account discrepancy in recent years This discrepancy is assumed to decline gradually during the forecast period with projected global current account surpluses compressing more than global current account deficits
The recently imposed trade measures by the United States and retaliatory actions by trading partners are expected to have a limited impact on overall exter-nal imbalances (see the IMFrsquos 2018 External Sector Report and Chapter 4 of the April 2019 WEO for a discussion of the relationship between trade costs and external imbalances)
As highlighted in the 2019 External Sector Report many countriesrsquo current account imbalances in 2018 were too large in relation to country-specific norms consistent with underlying fundamentals and desir-able policies As shown in panel 1 of Figure 118 excess current account balances in 2019 are projected to decline modestly with medium-term projections suggesting on average further movement in the same direction (Figure 118 panel 2)4 At the same time given that changes in macroeconomic fundamen-tals relative to 2018 affect not only current account balances but also their equilibrium values the path of future excess imbalances cannot be precisely inferred from this exercise5
International Investment Positions
Changes in international investment positions reflect both net financial flows and valuation changes arising from fluctuations in exchange rates and asset prices Given that WEO projections assume broadly stable real effective exchange rates and limited variation in asset prices changes in international investment positions are driven by projections for net external borrowing and lending (in line with the current account balance) with their ratios to domestic and world GDP affected by projected growth rates for individual countries and for the global economy as a whole67
4The change in the current account balance during 2019 is esti-mated to have offset on average about one-fifth of the 2018 current account gap the change between 2018 and 2024 would offset less than half of the 2018 gap
5For instance an improvement in the terms of trade is typically associated with a more appreciated equilibrium exchange rate
6WEO forecasts include projections of 10-year government bond yields which would affect bond prices but the impact of those changes in bond prices on the valuation of external assets and liabilities is typically not included in international investment position forecasts
7In addition to changes in exchange rates the decline in global equity prices in late 2018 (compared with levels at the end of 2017) implies deterioration of international investment positions at the end of 2018 in countries with significant net holdings of equity and foreign direct investment abroad and a corresponding improvement in positions for countries with net equity liabilities
Afr and ME Japan ChinaEur creditors Adv Asia Oil exporters
United States Other adv Em Asia DiscrepancyEuro debtors Lat Am CEE
Source IMF staff estimatesNote Adv Asia = advanced Asia (Hong Kong SAR Korea Singapore Taiwan Province of China) Afr and ME = Africa and the Middle East (Democratic Republic of the Congo Egypt Ethiopia Ghana Jordan Kenya Lebanon Morocco South Africa Sudan Tanzania Tunisia) CEE = central and eastern Europe (Belarus Bulgaria Croatia Czech Republic Hungary Poland Romania Slovak Republic Turkey Ukraine) Em Asia = emerging Asia (India Indonesia Pakistan Philippines Thailand Vietnam) Eur creditors = European creditors (Austria Belgium Denmark Finland Germany Luxembourg Netherlands Norway Sweden Switzerland) Euro debtors = euro area debtors (Cyprus Greece Ireland Italy Portugal Spain Slovenia) Lat Am = Latin America (Argentina Brazil Chile Colombia Mexico Peru Uruguay) Oil exporters = Algeria Azerbaijan Iran Kazakhstan Kuwait Nigeria Oman Qatar Russia Saudi Arabia United Arab Emirates Venezuela Other adv = other advanced economies (Australia Canada France Iceland New Zealand United Kingdom)
Global current account deficits and surpluses are projected to gradually narrow in 2019 and subsequent years
ndash4
ndash3
ndash2
ndash1
0
1
2
3
4
2002 04 06 08 10 12 14 16 18 20 22 24
Figure 117 Global Current Account Balance(Percent of world GDP)
18
W O R L D E C O N O M I C O U T L O O K G LO b a L M a N U FaC T U R I N G D OW N T U R N R Is I N G T R a D E b a R R I E R s
International Monetary Fund | October 2019
As panel 1 of Figure 119 shows creditor and debtor positions as a share of world GDP are projected to widen slightly this year and then to stabilize as a share of world GDP over the forecast horizon On the creditor side the growing creditor positions of a group of European advanced economies andmdashto a lesser extentmdashof advanced economies in Asia is partly offset by some reduction in the creditor position of China and oil exporters On the debtor side the net liability position of the United States increases initially and then stabilizes with the forecast reduction in its current account deficit as fiscal stimulus is withdrawn while the position of euro area debtor countries improves further
Similar trends are highlighted in panel 2 of Figure 119 which shows projected changes in net international investment positions as a percentage of domestic GDP across countries and regions between 2018 and 2024 the last year of the WEO projection horizon The net creditor position is projected to be more than 80 percent GDP for European advanced economies more than 65 percent for Japan and more than 140 percent of GDP for smaller advanced
Figure 118 Current Account Balances in Relation to Economic Fundamentals
Excess current account balances in 2019 are projected to decline modestly with medium-term projections suggesting on average further movement in the same direction
Source IMF staff calculationsNote Data labels use International Organization for Standardization (ISO) country codes
1 2018 Current Account Gaps and Change in CurrentAccount Balances 2018ndash19
2 2018 Current Account Gaps and Change in CurrentAccount Balances 2018ndash24
Chan
ge in
cur
rent
-acc
ount
-to-
GDP
ratio
201
8ndash19
Chan
ge in
cur
rent
-acc
ount
-to-
GDP
ratio
201
8ndash24
Current account gap 2018
Current account gap 2018
ndash10
ndash8
ndash6
ndash4
ndash2
0
2
4
ndash4 ndash2 0 2 4 6 8
ndash6
ndash4
ndash2
0
2
4
6
8
ndash4 ndash2 0 2 4 6 8
ESP NLDITA
DEUFRA
BELSGP
HKG
CHE
SWE
KOR
SAU
CAN
AUSTUR
THA
ZAF
POLRUS
MEX
MYSIDN
INDBRA
ARG
USAGBR
JPNCHN
ESP NLD
ITADEU
FRABELSGPHKG
CHE
SWE
KOR
SAU
CANAUS
TUR
THAZAF
POL
RUS
MEX
MYS
IND
BRA
ARG
USA
GBR
JPN
CHN
Afr and ME Japan ChinaEur creditors Adv Asia Oil exporters
United States Other adv Em AsiaEuro debtors Lat Am CEE
1 Global International Investment Position(Percent of world GDP)
2 Net IIP 2018 and Projected Changes 2019ndash24(Percent of GDP)
Source IMF staff estimatesNote Adv Asia = advanced Asia (Hong Kong SAR Korea Singapore Taiwan Province of China) Afr and ME = Africa and the Middle East (Democratic Republic of the Congo Egypt Ethiopia Ghana Jordan Kenya Lebanon Morocco South Africa Sudan Tanzania Tunisia) CEE = central and eastern Europe (Belarus Bulgaria Croatia Czech Republic Hungary Poland Romania Slovak Republic Turkey Ukraine) Em Asia = emerging Asia (India Indonesia Pakistan Philippines Thailand Vietnam) Eur creditors = European creditors (Austria Belgium Denmark Finland Germany Luxembourg Netherlands Norway Sweden Switzerland) Euro debtors = euro area debtors (Cyprus Greece Ireland Italy Portugal Spain Slovenia) IIP = international investment position Lat Am = Latin America (Argentina Brazil Chile Colombia Mexico Peru Uruguay) Oil exporters = Algeria Azerbaijan Iran Kazakhstan Kuwait Nigeria Oman Qatar Russia Saudi Arabia United Arab Emirates Venezuela Other adv = other advanced economies (Australia Canada France Iceland New Zealand United Kingdom)
Creditor and debtor positions as a share of world GDP are projected to widen slightly this year and then stabilize over the forecast horizon
ndash20
ndash10
0
10
20
30
40
ndash100 ndash75 ndash50 ndash25 0 25 50 75 100 125 150
Adv AsiaJapan
Eur creditors
Afr and ME
Em Asia
Other adv
United States
Oil exportersChina
CEELat Am
Euro debtors
Proj
ecte
d ch
ange
in II
P 2
018ndash
24
Net IIP 2018
ndash40
ndash30
ndash20
ndash10
0
10
20
30
40
2005 07 09 11 13 15 17 19 21 23 24
Figure 119 Net International Investment Position
19
C H A P T E R 1 G LO b a L P R O s P E C Ts a N D P O L I C I E s
International Monetary Fund | October 2019
economies in Asia while the net creditor position of China would decline to about 12 percent The debtor position of the United States is projected to rise to about 50 percent of GDP some 5 percentage points above the 2018 estimate while the net international investment position of a group of euro area debtor countries including Italy and Spain is expected to improve by more than 16 percentage points of their collective GDP
Implications of Imbalances
Sustained excess external imbalances in key econ-omies and policy actions that threaten to widen such imbalances pose risks to global stability Expansion-ary fiscal policy in the United States is projected to increase the current account deficit over 2019ndash20 which could further aggravate trade tensions Over the medium term widening debtor positions in key economies could constrain global growth and possibly result in sharp and disruptive currency and asset price adjustments (see also the 2019 External Sector Report)
As discussed in the ldquoPolicy Prioritiesrdquo section the US economymdashwhich is already operating beyond full employmentmdashshould implement a medium-term plan to reverse the rising ratio of public debt accompanied by fiscal measures to grad-ually boost domestic supply potential This would help ensure more sustainable growth dynamics and contain external imbalances Stronger reliance on demand growth in some creditor countries espe-cially those such as Germany with the policy space to support it and facing a weakening of demand would help facilitate domestic and global rebal-ancing while sustaining global growth over the medium term
Risks Skewed to the DownsideRisks around the baseline forecasts remain skewed
to the downside Though the recent easing of mon-etary policy in many countries could lift demand more than projected especially if trade tensions between the United States and China ease and a no-deal Brexit is averted downside risks seem to dominate the outlook As discussed in the section on the Global Growth Outlook about 70 percent of the projected 2020 pickup in global growth is accounted for by a small group of emerging mar-ket and developing economies in severe distress or
currently underperforming relative to past averages Moreover the global forecast is predicated on contin-ued steady growth in a number of emerging market economies that are expected to maintain relatively healthy performance even as growth is projected to moderate in the United States and China Global growth will fall short of the projected baseline if strains fail to dissipate in the stressed and underper-forming economies or if activity disappoints among the group of economies expected to maintain healthy rates of expansion
Further disruptions to trade and supply chains Tensions in trade and technology linkages have contin-ued to ratchet up in recent months Since the spring financial markets have been buffeted by the broaden-ing of US tariffs to all imports from China restric-tions placed by the United States on commerce with Chinese technology companies and a greater perceived risk of a no-deal Brexit (see Scenario Box 1 of the April 2019 WEO for a discussion of the macroeconomic implications of the United Kingdom withdrawing from the European Union without a free trade deal) These developments have followed a sequence of tariff hikes and threats since early 2018 between the United States and China that have contributed to the gener-alized retreat in business confidence and investment and the marked slowdown in global trade leading fiscal and monetary policymakers in some cases to deploy policy space to counter drags on confidence and demand If tensions in these areas were to intensify the harm to investment would deepen and could lead to dislocation of global supply chains as well as reduced technology spillovers harming productivity and output growth into the medium term (see Scenario Box 11 for an analysis of the impact of advanced economy firms reshoring production in response to growing uncertainty on trade policies) The latest data on input-output linkages point to ever-more-interrelated technology including the US technology sectorrsquos increasing dependence on imports of value added from Chinese producers (Figure 120) Trade policy uncertainty and barriers have risen more broadly including with Japan and Korea imposing strengthened procedures for exports to one another While these restrictions have had limited effects so far an escalation of tensions could affect both economies significantly with regional repercussions through technology sector supply chains
As discussed above still-resilient service sector activity is a relative bright spot in the global economy particularly
20
W O R L D E C O N O M I C O U T L O O K G LO b a L M a N U FaC T U R I N G D OW N T U R N R Is I N G T R a D E b a R R I E R s
International Monetary Fund | October 2019
among advanced economies With protracted weakness in global manufacturing business-facing services such as logistics finance legal and wholesale trading are vulner-able to a softening in demand Depending on the severity firms in these services categories could cut back on hiring and weaken the feedback cycle between employment growth consumer confidence and consumer spending Resultant lower demand for consumer-facing services such as retail and hospitality would dampen business sen-timent among these categories and amplify the feedback to the labor market
Abrupt declines in risk appetite Amid easy monetary policy and supportive financial conditions in many economies financial markets are susceptible to abrupt drops in sentiment In recent months rising tensions between the United States and China surrounding
trade and technology companies triggered rapid declines in global risk appetite and flight to safe assets Scenario Box 12mdashwhich updates the scenarios first presented in the October 2018 WEO to incorporate recent tariff measuresmdashhighlights the large effects of trade tensions on global growth via worsening finan-cial market sentiment as well as productivity Potential triggers for risk-off episodes remain plentiful These include further increases in trade tensions protracted fiscal policy uncertainty and worsening debt dynam-ics in some high-debt countries an intensification of stress in large emerging markets currently undergo-ing difficult macroeconomic adjustment processes a no-deal Brexit or a sharper-than-expected slowdown in China which is dealing with multiple drags on growth from trade tensions and needed domestic regulatory strengthening An abrupt risk-off episode could expose financial vulnerabilities accumulated during years of low interest rates and depress global growth as highly leveraged borrowers find it difficult to roll over debt and as capital flows retrench from emerging market and frontier economies (see the October 2019 GFSR for further discussion on financial vulnerabilities)
Continued buildup of financial vulnerabilities Muted inflation pressures have allowed central banks to ease policy in response to mounting downside risks to growth These actions together with shifts in market expectations regarding future policy moves have helped ease financial conditions (possibly more than warranted by central bank communications notably in the case of the market-implied path of the federal funds rate which remains well below the Federal Open Market Committeersquos ldquodot plotrdquo projection) While easier financial conditions have supported demand and employment they could also lead to an underpricing of risk in some financial market segments Insufficient regulatory and supervisory responses to risk underpricing in this context could allow for a further buildup of financial vulnerabili-ties potentially amplifying the next downturn
Threat of cyberattacks Cyberattacks on financial infrastructure pose a threat to the outlook because they can severely disrupt cross-border payment systems and the flow of goods and services
Disinflationary pressures Concerns about disinfla-tionary spirals eased during the cyclical upswing of mid-2016 to mid-2018 Slower global growth and a softening of core inflation across advanced and emerging market economies have revived this risk Lower inflation and entrenched lower inflation expectations can increase the real costs of debt service for borrowers and weigh
USA Germany JapanEuro area Korea Taiwan Province of China
Input-output linkages point to ever-more-interrelated technology including the US technology sectorrsquos increasing dependence on imports of value added from Chinese producers
Source Organisation for Economic Co-operation and Development Trade in Value Added database1Computers electronics and electrical equipment
1 Chinarsquos Value-Added Share Embedded in Trading Partner FinalDemand1
0
2
4
6
8
10
12
0
2
4
6
8
10
12
14
16
2005 06 07 08 09 10 11 12 13 14 15
2005 06 07 08 09 10 11 12 13 14 15
2 Trading Partnersrsquo Value-Added Share Embedded in Chinarsquos FinalDemand1
Figure 120 Tech Hardware Supply Chains(Percent)
21
C H A P T E R 1 G LO b a L P R O s P E C Ts a N D P O L I C I E s
International Monetary Fund | October 2019
on corporate investment spending By keeping nominal interest rates low softer inflation would also constrain the monetary policy space that central banks have to counter downturns meaning that growth could be persistently lower for any given adverse shock
Geopolitical tensions domestic political uncertainty and conflict Perceived changes in the direction of policies in some countries and elevated uncertainty regarding reforms have been weighing on investment and growth At the same time some geopolitical risk factors discussed in previous WEOs have become more salientmdashnotably rising tensions in the Persian Gulf following attacks on major oil refining facili-ties in Saudi Arabia which have added to broader conflict in the Middle Eastmdashand tensions in east Asia (Figures 121 and 122) These factors in isolation may not have a strong impact on growth beyond the countries directly affected but an accumulation
of such eventsmdashcombined with trade tensions and tighter global financial conditionsmdashcould have out-sized effects on sentiment that are felt on a broader scale At the same time ongoing civil strife in many countries raises the risks of horrific humanitarian costs migration strains in neighboring countries andmdashtogether with geopolitical tensionsmdashhigher volatility in commodity markets
Climate change Mitigating the serious threats posed by climate change to health and livelihoods in many countries requires a rapid transition to a low-carbon economy on an ambitious scale (Chapter 2 of the Fiscal Monitor) However domestic mitigation policy strategies are failing to muster wide societal support in some countries while international cooperation is diluted by large emitters declining to participate (see Commodities Special Feature Box 1SF1 for more discussion on emissions) The Intergovernmental Panel on Climate Change warned in October 2018 that at current rates of increase global warming could reach 15degC above preindustrial levels between 2030
Global economic policy uncertainty (PPP weight)US trade policy uncertainty (right scale)
Source Baker Bloom and Davis (2016)Note Baker Bloom Davis Index of Global Economic Policy Uncertainty (GEPU) is a GDP-weighted average of national EPU indices for 20 countries Australia Brazil Canada Chile China France Germany Greece India Ireland Italy Japan Korea Mexico the Netherlands Russia Spain Sweden the United Kingdom and the United States Mean of global economic policy uncertainty index from 1997 to 2015 = 100 mean of US trade policy uncertainty index from 1985 to 2010 = 100 PPP = purchasing power parity
Global economic policy uncertainty remains elevated
100
150
200
250
300
350
400
0
100
200
300
400
500
600
700
800
Jan2016
Apr16
Jul16
Oct16
Jan17
Apr17
Jul17
Oct17
Jan18
Apr18
Jul18
Oct18
Jan19
Apr19
Aug19
Figure 121 Policy Uncertainty and Trade Tensions(Index)
Source Caldara and Iacoviello (2018)Note The Caldara and Iacoviello Geopolitical Risk (GPR) index reflects automated text-search results of the electronic archives of 11 national and international newspapers The index is calculated by counting the number of articles related to geopolitical risk in each newspaper for each month (as a share of the total number of news articles) and normalized to average a value of 100 in the 2000ndash09 decade ISIS = Islamic State
High geopolitical tension raises the risk of severe humanitarian costs and intensifying economic strains in some regions
Figure 122 Geopolitical Risk Index(Index)
0
50
100
150
200
250
300
2010 11 12 13 14 15 16 17 18 Aug19
Arab SpringSyrian andLibyan wars
Russianactionsin Crimea
ISISescalation
Parisattacks
Syriancivil warescalation
22
W O R L D E C O N O M I C O U T L O O K G LO b a L M a N U FaC T U R I N G D OW N T U R N R Is I N G T R a D E b a R R I E R s
International Monetary Fund | October 2019
and 2052 accompanied by extremes of temperature precipitation and drought Given the uncertainties the climate could warm faster engendering more catastrophic outcomes which would have devastat-ing humanitarian effects and inflict severe persistent output losses across many economies Climate change may also exacerbate inequality within countries even in advanced economies which are expected to be more adaptable (see Chapter 2 Box 22)
Globally consistent risk assessment of the WEO forecast Confidence bands for the WEO forecast are obtained using the G20MOD module of the IMFrsquos Flexible System of Global Models8 The confidence bands for the WEO forecast for most regions are asymmetric skewed toward lower growth than in the baseline This reflects both the preponderance of neg-ative growth surprises in the past and limited mon-etary policy space available to offset negative growth shocks as interest rates in most advanced economies are at or close to their effective lower bounds9 The resulting risk assessment can also be used to calculate the probability of a global economic downturn The estimated probability of one-year-ahead global growth below 25 percentmdashthe 10th percentile of global growth outturns in the past 25 yearsmdashhas increased since the spring and now stands at close to 9 percent (Figure 123)
Policy PrioritiesThe global economy remains at a delicate juncture
Even if the threats discussed in the previous section are thwarted as assumed in the baseline per capita growth is projected to stay below past norms across most groups except in sub-Saharan Africa over the medium term Moreover conditions are very challenging for a
8G20MOD is a global structural model of the world economy capturing international spillovers and key economic relationships among the household corporate and government sectors including monetary policy
9Using the model to provide a risk assessment of the forecast is done in two steps First the model is used to solve for economic shocks that drove the world economy in the past Historically the key drivers of the cyclical dynamics of output inflation and interest rates were domestic demand and oil price shocks Second these estimated shocks are then used to generate a large number of counter-factual scenarios for the world economy by sampling five-year histories from their empirical joint distribution function The resulting joint predictive distribution for a rich set of economic variables is internally and globally consistent and is suitable for risk assessment both at the global and individual-country level
number of emerging market economies that need to adjust their macroeconomic policies sharply
As discussed in the section on the Global Growth Outlook the world economy is confronting a diverse set of headwinds These headwinds affect countries differently adding to idiosyncratic factors and varied cyclical positions meaning that policy objectives and priorities vary widely across countries A common thread and the foremost priority in many cases is to remove policy-induced uncertainty or threats to growth Policy missteps at this juncture such as a no-deal Brexit or a further deepening of trade disputes could severely undermine sentiment growth and job creation and may exhaust policy space for avoid-able reasons
Multilateral Policies
Multilateral cooperation is indispensable for tackling some of the short- and long-term issues that threaten the sustainability and inclusiveness of
Source IMF staff estimatesNote Probabilities are calculated using the G20MOD module of the IMFrsquos Flexible System of Global Models G20MOD is a global structural model of the world economy capturing international spillovers and key economic relationships among the household corporate and government sectors including monetary policy
Figure 123 Probability of One-Year-Ahead Global Growth of Less than 25 Percent(Percent)
The estimated probability of one-year-ahead global growth below 25 percentmdashthe 10th percentile of global growth outturns in the past 25 yearsmdashhas increased since the spring
65
70
75
80
85
90
Fall 2018 Spring 19 Fall 19
23
C H A P T E R 1 G LO b a L P R O s P E C Ts a N D P O L I C I E s
International Monetary Fund | October 2019
global growth The most pressing needs for greater cooperation are in the areas of trade and technology Likewise closer multilateral cooperation on interna-tional taxation global financial regulatory reform climate change and corruption would help address vulnerabilities and broaden the gains from economic integration
Trade and technology Policymakers should work together to reduce trade tensions which have weak-ened global activity and hurt confidence They should also expeditiously resolve uncertainty around changes to long-standing trade arrangements (including those between the United Kingdom and the European Union as well as between Canada Mexico and the United States) Countries should not use tariffs to target bilateral trade balances More fundamentally trade conflicts signal deeper frustrations with gaps in the rules-based multilateral trading system Policymak-ers should cooperatively address the roots of dissatis-faction with the system and improve the governance of trade This requires resolving the deadlock over the World Trade Organization (WTO) dispute settle-ment systemrsquos appellate body to ensure the continued enforcement of existing WTO rules modernizing WTO rules to encompass areas such as e-commerce subsidies and technology transfer and advancing negotiations in new areas such as digital trade The idea that all countries need to participate in all nego-tiations could be reconsidered potentially allowing countries that wish to move further and faster to do so while keeping new agreements inside the WTO and open to all its members At the least calling a truce on further escalation of trade barriers would avoid inject-ing more destabilizing forces into a slowing global economy Policymakers should also cooperate more closely to curb cross-border cyberattacks on national security and commercial entities as well as limit distortionary practices such as requiring companies to hand over their intellectual property in return for market access Without definite progress in these areas technology tensions are likely to intensify impeding the free flow of ideas across countries and potentially impairing long-term productivity growth
International taxation With the rise of multinational enterprises international tax competition has made it increasingly difficult for governments to tackle tax evasion and collect revenue needed to finance their budgets Efforts to minimize cross-border opportunities for tax evasion and avoidance such as the Organisation for Economic Co-operation and DevelopmentndashG20
Base Erosion and Profit Shifting initiative (see Box 13 of the April 2019 Fiscal Monitor) should be rein-forced As discussed in IMF (2019) this initiative has made significant progress in international tax cooperation but vulnerabilities remain Limitations of the armrsquos-length principlemdashunder which transactions between related parties are to be priced as if they were between independent entitiesmdashand reliance on notions of physical presence of the taxpayer to establish a legal basis to impose income tax have allowed apparently profitable firms to pay little tax Some improvements can be achieved unilaterally or regionally but more fundamental solutions require stronger institutions for global cooperation
Financial regulatory reforms and global financial safety net The reform agenda begun after the global financial crisis is still unfinished Some areas of progressmdashsuch as greater supervisory intensity for globally important financial institutions and more effective resolution regimesmdashare under pressure or being reversed Policy-makers should ensure the reform agenda is completed including through enhanced international resolution frameworks and further improvements to macropru-dential policy frameworks (which may entail simpli-fication of complex rules in some areas as discussed in Adrian and Obstfeld 2017) Emerging risks to cybersecurity in the financial system and combating money laundering and the financing of terrorism also require coordinated and collective action Comple-menting these moves policymakers should ensure that the global financial safety net is adequately resourced to help counteract disruptive portfolio adjustments in a world economy heavily laden with debt and reduce the need for countries to self-insure against external shocks
Climate change and migration Curbing greenhouse gas emissions and containing the associated conse-quences of rising global temperatures and devastating climate events are urgent global imperatives10 In that respect the ongoing political polarization and discord in many economies does not bode well for reaching agreement on domestic and international strategies in time to contain climate change to manageable levels A redoubling of efforts is urgently needed which will require a distribution of the costs and benefits in a
10See Chapter 3 of the October 2017 WEO on the macroeco-nomic impacts of weather shocks and IMF (2019) and Chapter 2 of the October 2019 Fiscal Monitor for a discussion of fiscal policy options for implementing climate change mitigation and adapta-tion strategies
24
W O R L D E C O N O M I C O U T L O O K G LO b a L M a N U FaC T U R I N G D OW N T U R N R Is I N G T R a D E b a R R I E R s
International Monetary Fund | October 2019
manner than can muster sufficient domestic and inter-national political support By adding to migrant flows climate-related events also compound an already- complex situation of refugee flight from conflict areas International migration will become increasingly important too as many advanced economies con-front issues related to aging populations Interna-tional cooperation would facilitate the integration of migrantsmdashand so help to maximize the labor supply and productivity benefits they bring to destination countriesmdashand to support remittance flows that lessen the burden on source countries
Corruption and governance A global effort is also needed to curb corruption which is undermining faith in government and institutions in many countries (see the April 2019 Fiscal Monitor) Left unchecked pervasive corruption can lead to distorted policies lower revenue declining quality of public services and deteriorating infrastructure
Country-Level Policies
In response to continued weakness and downside risks macroeconomic policiesmdashparticularly monetary policymdashhave already turned more supportive in many countries Looking ahead macroeconomic policies in most economies should seek to stabilize activity and strengthen the foundations for a recovery or continued growth Where fiscal space is available and growth has decelerated sharply more active fiscal policy supportmdashincluding through greater public investment in workforce skills and infrastructure to raise growth potentialmdashmay be warranted Making growth more inclusive and avoiding protracted downturns that disproportionately affect the most vulnerable segments of population are essential for securing better economic prospects for all Strengthening resilience to adverse shifts in financial market sentiment and alleviating structural constraints on potential output growth also remain overarching needs
Advanced Economies
For advanced economies where growth in final demand is generally subdued inflation pressure is muted and market-pricing-implied measures of inflation expectations have softened in recent months accommodative monetary policy remains appropriate to guard against a further deceleration in activity and a downshift in inflation expectations This is especially
important in economies with inflation persistently below target and output that already is or may fall below potential As discussed in Box 14 the sluggish-ness in inflation suggests that potential output could be higher and output gaps could be more negative than currently estimated However given that contin-ued monetary accommodation can foster a buildup of financial vulnerabilities stronger macroprudential policies and a proactive supervisory approach will be critical As discussed in the October 2019 GFSR financial sector policies should aim to secure the strength of balance sheets and limit systemic risks by deploying such tools as liquidity buffers countercycli-cal capital buffers or targeted sectoral capital buffers developing borrower-based tools to mitigate debt vulnerabilities where needed and enhancing macropru-dential oversight of nonbank financial institutions In some countries bank balance sheets need further repair to mitigate the risk of sovereign-bank feedback loops Avoiding a rollback of postcrisis regulatory reforms is of essence in the context of continued monetary policy accommodation and high debt levels
Considering the precarious outlook and large downside risks fiscal policy can play a more active role especially where room to ease monetary policy is limited The low level of policy rates in many coun-tries and the decline in long-term interest rates to historically very low or negative levels while reducing the likely impact of further monetary policy easing expands fiscal room as long as these conditions last In this context in countries where activity has weak-ened or could decelerate sharply fiscal stimulus can be provided if fiscal space exists and fiscal policy is not already overly expansionary In countries where demand is weak yet fiscal consolidation is neces-sary its pace could be slowed if market conditions permit to avoid prolonged economic weakness and disinflationary dynamics Policymakers would need to prepare for a contingent fiscal policy response in advance to be able to act quickly and plan ahead for the appropriate composition of fiscal easing Infrastruc-ture spending or investment incentives (including for clean energy sources) would be ideal as they would boost output not only in the near term but also in the medium term helping to improve debt sustainability More generally modest medium-term potential output in most advanced economies calls for the composition of fiscal spending and taxes to be calibrated carefully with a view to raising labor force participation rates and productivity growth through public investment in
25
C H A P T E R 1 G LO b a L P R O s P E C Ts a N D P O L I C I E s
International Monetary Fund | October 2019
workforce skills physical infrastructure and research and development
National structural policies that encourage more open and flexible markets in advanced economies would not only boost economic resilience and poten-tial output but could also help reduce within-country disparities in performance and improve the labor market adjustment to shocks by lagging regions within countries (see Chapter 2) There is also a pressing need to reduce carbon emissions to avert the severe economic and social risks associated with climate change Moving toward less-carbon-intensive produc-tion structuresmdashincluding through carbon taxation boosting low-carbon infrastructure and encouraging innovation in green technologies (see Chapter 2 of the October 2019 Fiscal Monitor)mdashare therefore necessary Beyond fiscal measures to boost potential output pro-tecting opportunities and dynamismmdashby ensuring that competition policies facilitate new-firm entry and curb incumbentsrsquo abuse of market powermdashremains vital when a minority of big firms are capturing increasingly larger market shares in advanced economies (Chapter 2 of the April 2019 WEO)
In the United States where the unemployment rate is historically low and inflation is close to tar-get a combination of accommodative monetary policy vigilant financial regulation and supervision and a gradual fiscal consolidation path would help maintain the expansion and limit downside risks The absence of strong wage and inflation pressures (inflation has averaged just below target over the past year and expectations have recently softened) has allowed the Federal Reserve to reduce the fed-eral funds rate to guard against downside risks from the global economy The path of the policy interest rate going forward should depend on the economic outlook and risks as informed by incoming data Supportive financial conditions require maintain-ing the current risk-based approach to regulation supervision and resolution (and strengthening it in the case of nonbank financial institutions) to limit vulnerabilities from rising corporate leverage and emerging cybersecurity threats Public debt remains on a clear upward trajectory calling for consolidation There is a need to raise the revenue-to-GDP ratio by putting in place a broad-based carbon tax a federal consumption tax and a higher federal gas tax Doing so would create the fiscal space to provide support to low- and middle-income families (including through help with childcare expenses and smoothing out the
existing ldquocliffsrdquo in social benefits) and to pursue policies that raise potential growthmdashinfrastructure investment (including to facilitate the supply of green energy alternatives) support for lifelong learning and work-force skills and steps to raise labor force participation Counteracting the anticipated rise in aging-related spending requires indexing social security benefits to chained inflation and raising the retirement age
In the United Kingdom desired policy settings in the near term will depend on the ultimate form of the countryrsquos departure from the European Union The extra public spending envisaged by the government should mitigate the cost of Brexit for the economy but continued efforts to bring down the debt ratio remain important to build buffers against future shocks In case of a disorderly Brexit accompanied by a sharp rise in barriers to goods and services trade with the European Union the policy response will need to take into account the extent of the adverse financial market reaction and its likely impact on macroeconomic stability Structural reforms should focus on improving infrastructure quality and boosting labor skills as well as ensuring smooth reallocation of workers to expand-ing sectors from those adversely affected by Brexit
In the euro area monetary policy has become appro-priately more accommodative in response to stubbornly weak core inflation and a significant loss of momentum since mid-2018 The fiscal stance though ideally more supportive than envisaged before the slowdown needs to vary across countries depending on the extent of fiscal space In Germany where there is room to ease fiscal policy and growth has been weak raising public investment in physical and human capital or reducing the labor tax wedge would boost demand help reduce the excess current account surplus and strengthen potential output In countries with high debt includ-ing France Italy and Spain fiscal buffers should be rebuilt gradually while protecting investment Credibly committing to a downward-sloping debt path over the medium term is particularly critical in Italy where debt and gross financing needs are large If growth were to weaken significantly countries with fiscal space would need to use it more actively to complement monetary easing to guard against disinflationary dynamics and a prolonged period of weak growth In parallel the path of fiscal consolidation could be adjusted tempo-rarily in countries where fiscal space is at risk provided their financing conditions remain amenable and debt sustainability is not jeopardized A synchronized fis-cal response albeit differentiated appropriately across
26
W O R L D E C O N O M I C O U T L O O K G LO b a L M a N U FaC T U R I N G D OW N T U R N R Is I N G T R a D E b a R R I E R s
International Monetary Fund | October 2019
member countries can amplify the area-wide impact Completing the banking union and continuing the cleanup of bank balance sheets remain vital for raising resilience and strengthening credit intermediation in some economies Amid prolonged monetary accommo-dation and disparate cyclical positions regulators need to calibrate macroprudential instruments to address any emergent financial stability risks Reforms are urgently needed in many economies to lift productiv-ity and competitiveness Further deepening the single market for services would boost efficiency across the European Union EU-level instruments can be used to foster reform efforts at the national level Raising labor market flexibility removing barriers to entry in product markets upgrading the functioning of corporate insol-vency regimes and cutting administrative burdens are cross-cutting needs
In Japan demand is expected to slow from its recent strong pace following the October consumption tax rate increase while government mitigating measures will moderate the decline Inflation remains well below the central bankrsquos target Sustained monetary accommodation will be necessary over a long period to durably lift inflation expectations Fiscal policy should be geared toward long-term fiscal sustainability amid a rapidly aging and shrinking population while protect-ing demand and the reflation effort Averting fiscal risks over the long term requires additional increases in the consumption tax rate and reforms to curb pension health and long-term-care spending Some progress has been made on structural reforms with the adop-tion of the Work Style Reform that aims at improving working conditions a new residency status for foreign workers with professional and technical skills and further trade integration with the European Union and the economies comprising the Comprehensive and Progressive Agreement for Trans-Pacific Partner-ship More effort is needed on labor market reformmdashincluding to improve workersrsquo skills and career opportunities for nonregular workers reduce duality and raise mobilitymdashand in product market and corpo-rate reforms to lift productivity and investment
Emerging Market and Developing Economies
The circumstances of emerging market and developing economies are diverse Some economies are experiencing extremely challenging conditions because of political discord or cross-border conflict others are experiencing tight external financing
conditions given their macroeconomic imbalances and needed policy adjustments Among countries facing more stable conditions the recent softening of inflation has given central banks the option of easing monetary policy to support activity Against a volatile external backdrop and possible adverse turns in mar-ket sentiment ensuring financial resilience is a key objective for many emerging market and developing economies Regulation and supervision should ensure adequate capital and liquidity buffers to guard against disruptive shifts in global portfolios and a possible deterioration in growth and credit quality Efforts to monitor and minimize currency and maturity mis-matches on balance sheets are also vital to preserve financial stability and will help exchange rates to cushion against shocks In the many economies with high public debt fiscal policy should generally aim for consolidation to contain borrowing costs and create space to counter future downturns as well as to address development needs while adjusting its pace and timing to avoid prolonged weakness Improving the targeting of subsidies rationalizing recurrent expenditure and broadening the revenue base can help preserve investments needed to boost potential growth and social spendingmdashon education health care and safety net policies Revenue mobilization is particularly important in low-income developing countries that need to advance toward the United Nations Sustainable Development Goals
Beyond getting the mix of macroeconomic and financial policies right many emerging market and developing economies can strengthen their institu-tions governance and policy frameworks through structural reforms to bolster their growth prospects and resilience Indeed the key findings of Chapter 3 make a strong case for a renewed structural reform push in emerging market and developing economies The chapter documents that much scope remains for further reforms in domestic and external finance trade labor and product market regulations and gov-ernance in these countries especially in low-income developing countries The chapter finds that for a typical economy major simultaneous reforms across these areas could add 1 percentage point to growth over 5ndash10 years roughly doubling the speed of convergence
In China the overarching policy objective is to raise the sustainability and quality of growth while navigating headwinds from trade tensions and weaker global demand Meeting this goal calls for short-term
27
C H A P T E R 1 G LO b a L P R O s P E C Ts a N D P O L I C I E s
International Monetary Fund | October 2019
action to support the economy while making progress with shifting the underlying sources of growth from credit-fueled investment toward private consumption and improving the allocation of resources and effi-ciency in the economy In addition to some monetary easing fiscal support (financed mainly on-budget) has prevented trade tensions from exerting a sharp drag on confidence and activity Any further stimulus should emphasize targeted transfers to low-income households rather than large-scale infrastructure spending In sup-port of the transition to sustainable growth regulatory efforts to restrain shadow banking have helped lessen reliance on debt but corporate leverage remains high and household debt is growing rapidly Further prog-ress with reining in debt requires continued scaling back of widespread implicit guarantees and enhancing the macroprudential toolkit Meanwhile continuing with reducing the role of state-owned enterprises and lowering barriers to entry in such sectors as telecom-munications and banking would help raise productivity while improving labor mobility Moving toward a more progressive tax code and higher spending on health care education and social transfers would help lower precautionary saving and support consumption
In India monetary policy and broad-based struc-tural reforms should be used to address cyclical weakness and strengthen confidence A credible fiscal consolidation path is needed to bring down Indiarsquos elevated public debt over the medium term This should be supported by subsidy-spending rationaliza-tion and tax-base enhancing measures Governance of public sector banks and the efficiency of their credit allocation needs strengthening and the public sec-torrsquos role in the financial system needs to be reduced Reforms to hiring and dismissal regulations would help incentivize job creation and absorb the countryrsquos large demographic dividend Land reforms should also be enhanced to encourage and expedite infrastructure development
In Brazil pension reform is an essential step toward ensuring the viability of the social security system and the sustainability of public debt Further gradual fiscal consolidation will be needed to comply with the constitutional expenditure ceiling over the next few years Monetary policy should remain accommodative to support economic growth provided that inflation expectations remain anchored To lift potential growth the government will need to pursue an ambitious reform agenda including tax reforms trade openness and infrastructure investment
In Mexico adherence to the governmentrsquos medium- term fiscal consolidation plan is essential to preserve market confidence and stabilize public debt More ambitious medium-term fiscal targets would create larger buffers to respond to negative shocks and better deal with long-term spending pressure from demo-graphic trends If inflation remains on a downward path toward the target and inflation expectations are anchored monetary policy could become more accommodative in the coming months The exchange rate should remain flexible with foreign-exchange intervention being used only if market conditions are disorderly
In Russia the authorities should move toward a more growth-friendly composition of taxes and public spending while refraining from using the National Welfare Fund for quasi-fiscal activities Monetary pol-icy can be eased toward a neutral stance if inflationary pressures continue to abate To enhance the efficiency of credit intermediation the authorities should con-tinue to consolidate the banking sector while reducing the statersquos footprint Further structural reforms are needed to boost potential growth including measures to enhance competition improve public procurement and reform the labor market
In Turkey a comprehensive and clearly communi-cated policy plan is needed to repair private balance sheets increase public balance sheet transparency and ultimately restore the credibility independence and rules-based functioning of economic institutions To achieve these goals the policy agenda should include (1) keeping monetary policy rates on hold until there is a durable downturn in inflation and inflation expec-tations which would also help underpin the lira and rebuild reserves (2) steps to bolster medium-term fiscal strength (3) restoring confidence in banks through thorough assessment (third-party asset quality reviews rigorous stress tests) credible bank recapitalization plans and reining in state bank credit (4) further improving the insolvency regime and the out-of-court restructuring framework to promote meaningful restructuring solutions and free up lending capacity to healthy and productive firms and (5) focusing structural reforms to support more sustainable total-factor-productivity-led growth
In South Africa gradual but meaningful and growth-friendly fiscal consolidation is needed to stabilize public debt Measures should include reducing the public wage bill downsizing and eliminating wasteful spending by public entities expanding the tax base
28
W O R L D E C O N O M I C O U T L O O K G LO b a L M a N U FaC T U R I N G D OW N T U R N R Is I N G T R a D E b a R R I E R s
International Monetary Fund | October 2019
and strengthening tax administration Monetary policy should continue to be data-dependent and carefully monitor inflation risks Structural reforms are needed to regain investorsrsquo trust lift growth potential and foster job creation Priorities include revamping the business models of state-owned enterprises improving compe-tition in the product market by reducing entry barriers and streamlining regulations and increasing labor market flexibility
Low-income countries share many of the policy prior-ities of the emerging market economy group especially in enhancing resilience to volatile external conditions Several ldquofrontierrdquo low-income countries have seen exter-nal financing conditions fluctuate sharply in the past year Strengthening monetary and macroprudential pol-icy frameworks while preserving exchange rate flexibility will help them withstand this environment During the recent period of low interest rates public debt stocks in this group have increased rapidly When financial conditions turn less accommodative rollover risks may rise and wider sovereign spreads may lead to higher borrowing costs for firms and households Fiscal policy should be geared toward ensuring debt sustainability while protecting measures that help the vulnerable and support progress toward the United Nations Sustain-able Development Goals This requires broadening the
revenue base improving tax administration eliminating wasteful subsidies and prioritizing spending on infra-structure health care education and poverty reduction Low-income countries also bear the brunt of natural disasters and increasing climate change Lowering the fallout from these events will require adaptation strate-gies that invest in disaster readiness and climate-smart infrastructure incorporate appropriate technologies and zoning regulations and deploy well-targeted social safety nets to help reduce vulnerability and improve countriesrsquo ability to respond
Commodity-exporting developing economies have similar policy priorities but face additional pressure on their public finances from the subdued outlook for commodity prices Beyond placing public finances on a sustainable footing economies in this group also need to diversify away from dependence on resource extraction and refining Although country circumstances differ policies to help achieve this broad goal include sound macroeconomic management lifting of education quality and worker skills to encourage more broad-based labor force participation investment to reduce infra-structure shortfalls boosting of financial development and inclusion strengthening of property rights contract enforcement and reduction of trade barriers to incentiv-ize the entry of firms and private investment
29
C H A P T E R 1 G LO b a L P R O s P E C Ts a N D P O L I C I E s
International Monetary Fund | October 2019
Activity would suffer in advanced and emerg-ing market economies if production were reshored to advanced economies that could not match the efficiency and lower labor costs of the abandoned foreign value chains If multinational firms absorb some of the implications by allowing margins to be squeezed it could soften the implications However a possibly more likely outcome is that a less open global economy could constrain technology diffusion causing activity to fall further
The IMFrsquos Global Integrated Monetary and Fiscal Model is used here to examine the implications of multinational firms reshoring production to advanced economies This reshoring could be motivated by a desire to keep some production closer to final con-sumers to avoid potential supply chain disruptions from developments in distant countries or by policy actions closer to home A very stylized experiment is considered designed to illustrate the implications and highlight the possible channels through which they could play out
The assumption is that over a three-year horizon multinational firms in the United States the euro area and Japan reshore enough production that their nominal imports decline by 10 percent (blue line in Scenario Figure 111) Given the relative costs of production reshoring leads to higher-priced consump-tion and investment goods in advanced economies Domestic demand declines as does output despite the decline in imports1 In emerging market economies lower production and exports reduce incomes house-holds and firms cut expenditure and output declines more modestly than in advanced economies However households in both advanced and emerging market economies suffer equally owing to the deterioration in emerging market economiesrsquo terms of trade Advanced economy exchange rates appreciate raising the real cost of emerging market economiesrsquo imports More emerging market production must be exported to pay for their import bundle leaving less for domestic consumption
1It is worth noting that in sectors where domestic production expands employment could increase here however the aggre-gate net impact is shown which is negative
ReshoringReshoring plus lower margins Reshoring plus weaker technological diffusion
Scenario Figure 111 Advanced Economies Reshoring(Percent deviation from control)
Source IMF staff estimatesNote AE = advanced economy EM = emerging market
ndash6ndash5ndash4ndash3ndash2ndash1
01
ndash6ndash5ndash4ndash3ndash2ndash1
01
2019 22 25
1 AE Real GDP
Longterm
2019 22 25 Longterm
2 AE Consumption
ndash6ndash5ndash4ndash3ndash2ndash1
01
ndash6ndash5ndash4ndash3ndash2ndash1
01
2019 22 25
3 AE Investment
Longterm
2019 22 25 Longterm
4 AE Imports
ndash6ndash5ndash4ndash3ndash2ndash1
01
ndash6ndash5ndash4ndash3ndash2ndash1
01
2019 22 25
5 EM Real GDP
Longterm
2019 22 25 Longterm
6 EM Consumption
ndash6ndash5ndash4ndash3ndash2ndash1
01
ndash6ndash5ndash4ndash3ndash2ndash1
01
2019 22 25
7 EM Investment
Longterm
2019 22 25 Longterm
8 EM Imports
Scenario Box 11 Implications of Advanced Economies Reshoring Some Production
30
W O R L D E C O N O M I C O U T L O O K G LO b a L M a N U FaC T U R I N G D OW N T U R N R Is I N G T R a D E b a R R I E R s
International Monetary Fund | October 2019
One possible response of multinational firms might be to not pass on the higher production costs fully and so allow their profit margins to be squeezed (yellow line) Moderating the resulting price increase helps maintain household consumption and supports investment as firms need more capital to produce the additional goods The extent to which firms would compress margins is highly uncertain and the modest reduction considered here is for illustrative purposes only The more margins are squeezed the less harmful is the impact of reshoring on advanced economies However lower margins do little to ameliorate the impact on emerging markets
Although reductions in profit margins could offset some of the negative implications of reshoring a less favorable implication of a more closed global economy could be less technologi-cal diffusion Empirical evidence points to trade openness as a key driver of technological diffusion2
2See ldquoIs Productivity Growth Shared in a Globalized Econ-omyrdquo in Chapter 4 of the April 2018 World Economic Outlook
If multinational firms shorten supply chains by producing more goods closer to final consumers in advanced economies emerging markets could have much less access to the latest technological developments This box considers modest tempo-rary reductions in productivity growth in tradable goods sectors (red line) that are a function of a countryrsquos or regionrsquos distance from the productivity frontier and relative openness (01 percentage point for advanced economies 025 percentage point for emerging markets)3 Weaker technological diffusion would notably amplify the negative implications for emerging markets and modestly exacerbate the impact on advanced economies
3A temporary decline in productivity growth is assumed However it is possible that a more closed global economy could lead to some lasting damage to productivity growth If that were the case the longer-term implications would be much worse than those estimated here
Scenario Box 11 (continued)
31
C H A P T E R 1 G LO b a L P R O s P E C Ts a N D P O L I C I E s
International Monetary Fund | October 2019
Updates of the estimated impact of ongoing global trade tensions on economies are generated here using the IMFrsquos Global Integrated Monetary and Fiscal Model (GIMF) Inputs to the modelrsquos simulations include explicit tariff measures and off-model analysis of the possible impact of con-fidence effects on investment financial conditions for firms and productivity developments that result when resources are reallocated across economies Given that all of the tariff measures considered in these simulations are incorporated in the baseline projections of this World Economic Outlook (WEO) their impact on global GDP should be interpreted as relative to a no-tariff baseline (such as the one in the October 2017 WEO)1
The first three layers (out of six) of the analysis estimate the direct trade impacts of tariff measures both implemented and announced All of the mea-sures are assumed to be permanent The first layer contains the impact of implemented tariff measures included in the April 2019 WEO baseline Among them are tariffs that the United States imposed on aluminum and steel 25 percentage points in tariffs on $50 billion in imports from China and 10 percentage points in tariffs on an additional $200 billion in imports from China All retaliatory measures by US trading partners are included in this layer The second layer adds the impact of the May 2019 US tariff increase of $200 billion on Chinese imports and Chinarsquos retaliation The third layer adds the US imposition of 15 percentage points in tariffs on all goods from China (roughly $300 billion) that had not yet incurred tariffs starting in September 2019 and a 5 percentage-point increase on the already-tariffed $250 billion in imports from China Chinarsquos retaliation is included in this layer
The remaining three layers are based on off-model analysis The fourth layer adds the potential impact on investment of declining confidence This is the same temporary effect that is included in the October 2018 WEO analysis of the impact of trade tensions on investment via confidence effects2 However the
1The analysis in the October 2018 WEO also includes a layer of US-imposed tariffs on all imported cars and car parts This layer is not included in this analysis
2The magnitude of this effect was calibrated based on the Baker Bloom and Davis (BBD) overall ldquoeconomic policy uncertaintyrdquo measure and its estimated impact on investment in the United States (For details on the BBD
timing has been altered to more closely match changes in timing of implementation of tariff measures from that assumed in 2018 The peak impact on activity is delayed given that the tariff measures were imposed later than had been assumed The fifth layer adds the impact on corporate spreads of the potential market reaction to the trade tensions The size of the impact is identical to that used in the October 2018 WEO but the timing is adjusted to match the delayed implemen-tation of the tariff measures The peak in the increase in corporate bond spreads now occurs in 2020 one year later than assumed in the October 2018 WEO analysis3 The final layer adds the potential impact on productivity resulting from the reallocation of resources across sectors within economies This layer is new and is not included in the analysis in the October 2018 WEO The impact of tariff measures in GIMF captures the macroeconomic distortions that tariffs induce in the utilization of productive factors capital and labor as well as income effects How-ever tariffs also lead to sectoral distortions from the reallocation of factors across sectors within econo-mies which highly aggregated models such as GIMF cannot capture Computable general equilibrium (CGE) trade models in contrast capture the impact on output of the shift of resources across sectors
Uncertainty Index see http www policyuncertainty com) A one-standard-deviation increase in the BBD uncertainty measure (which is roughly one-sixth of the change during the global financial crisis) leads to an estimated 1 percent drop in investment in the United States in one year Here this 1 per-cent decline in investment is spread over three years with the peak effect in 2020 The impact of the decline in investment in other countries is then scaled by their trade openness relative to the United Statesmdashcountries more dependent on trade than the United States experience greater declines in investment than does the United States Note that since fall 2018 some of this impact would already be factored into WEO forecasts given that the tariff measures were imposed
3The magnitude of this tightening is based on several financial market participantsrsquo estimates of the impact on US corporate earnings of a worst-case United StatesndashChina trade war (In the worst-case scenario the United States imposes tariffs of 25 percent on all Chinese imports and China does the same in response) Based on historical relationships this esti-mated 15 percent decline in earnings is then mapped into an increase in US corporate bond spreads The rise in US spreads is then mapped into corporate bond spreads in other countries based on their credit rating relative to US corporate debt This increase in spreads is assumed to start in 2019 and peak in 2020 with half of the peak increase remaining in corporate spreads in 2021
Scenario Box 12 Trade Tensions Updated Scenario
32
W O R L D E C O N O M I C O U T L O O K G LO b a L M a N U FaC T U R I N G D OW N T U R N R Is I N G T R a D E b a R R I E R s
International Monetary Fund | October 2019
under the assumption that total utilization of resources remains unchanged Implicitly this is an estimate of the impact on productivity of the movement of factors between sectors with different underlying productivity To estimate the possible magnitude of this productiv-ity effect the tariff increases in the first three layers are run on a new global CGE model detailed in Caliendo and others (2017) The resulting impact on activity is an estimate of the medium-term effect and embodies an implicit change in labor productivity The final layer adds this change in labor productivity phased in over five years beginning in 2020
Consistent with past scenarios all layers assume that the euro area and Japan are unable to ease (conven-tional) monetary policy further in response to mac-roeconomic developments given the lower bound on nominal interest rates If other unconventional mon-etary policy measures are implemented the decline in GDP in Japan and the euro area would be smaller in the near term than estimated here In all other countries and regions conventional monetary policy responds according to a Taylor-type reaction function It is important to note the considerable uncertainty surrounding the magnitude and persistence of the confidence effects on investment and the tightening in corporate spreads These effects could be either milder or more severe than assumed here Regarding the layer that contains the tightening in corporate spreads one aspect not included in the analysis is the potential for safe-haven flows to mitigate the impact of financial tightening in such countries as Germany Japan and the United States
The estimated impact on activity (shown in Scenario Figure 121) indicates that tariffs included in the April 2019 WEO baseline (dark blue line) are estimated to have a fairly mild direct effect the United States and China are most affected and China bears the greatest burden The largest effect falling on the United States and China also holds true for the direct effect of tariff measures implemented in May 2019 (gray line) and those announced in August 2019 (yellow line) However the magnitude of the impact becomes much more material The short-term spillovers on other countries from these measures are estimated to be pos-itive as some countriesmdashnotably the North American trading partners of the United Statesmdashbenefit from trade diversion These benefits however disappear in the medium term and the spillovers become negative as households and firms in China and the United States are able to source more goods domestically that
Tariffs in April 2019 baselineAdd tariffs implemented May 2019Add tariffs announced August 2019Add confidence effectAdd market reactionAdd productivity effect
Source IMF staff estimatesNote G20 = Group of Twenty NAFTA = North American Free Trade Agreement
ndash20
ndash16
ndash12
ndash08
ndash04
00
04
ndash20
ndash16
ndash12
ndash08
ndash04
00
04
2017 20 23 Longterm
2017 20 23 Longterm
ndash20
ndash16
ndash12
ndash08
ndash04
00
04
ndash20
ndash16
ndash12
ndash08
ndash04
00
04
2017 20 23 Longterm
2017 20 23 Longterm
ndash20
ndash16
ndash12
ndash08
ndash04
00
04
ndash20
ndash16
ndash12
ndash08
ndash04
00
04
2017 20 23
23
Longterm
2017 20 23 Longterm
ndash20
ndash16
ndash12
ndash08
ndash04
00
04
ndash20
ndash16
ndash12
ndash08
ndash04
00
04
2017 20 Longterm
2017 20 23 Longterm
1 United States 2 China
3 Japan 4 Euro Area
6 World5 US NAFTA Trading Partners
7 G20 AdvancedEconomies
8 G20 EmergingEconomies
Scenario Figure 121 Real GDP(Percent deviation from control)
Scenario Box 12 (continued)
33
C H A P T E R 1 G LO b a L P R O s P E C Ts a N D P O L I C I E s
International Monetary Fund | October 2019
were previously imported Adding the confidence effects on investment (green line) and the increase in corporate spreads (red line) results in a negative result for all countries For the United States and China adding the estimated productivity effects (light blue line) amplifies the economic damage but because they are phased in over five years that negative impact grows over time and is substantial in both the medium and the long term For some other countries the productivity impact is positive but small Changes in global demand reallocate resources in these countries from less to more productive sectors4
4As noted earlier the productivity effect arises from resources shifting between sectors with different productivity The countries with the closest trading ties to Canada Mexico and the United States benefit the most In the trade model analysis
Overall China suffers the most as output falls by 2 percent in the short term and 1 percent in the long term (light blue bar) The United States runs a close second with output falling by 06 percent in both time spans The trough in global activity is estimated to take place in 2020 with output about 08 percent below baseline The trough in activity across advanced econo-mies is very similar to the trough in the United States at roughly ndashfrac12 percent Unlike in the United States the long-term direct trade effects are small and negative in advanced economies although they are more than offset by positive productivity effects in some countries
resources shifting from agriculture and mining to manufactur-ing in these two countries drives the improvement in aggregate productivity
Scenario Box 12 (continued)
34
W O R L D E C O N O M I C O U T L O O K G LO b a L M a N U FaC T U R I N G D OW N T U R N R Is I N G T R a D E b a R R I E R s
International Monetary Fund | October 2019
The automobile industry contracted in 2018 for the first time since the global financial crisis con-tributing to the global slowdown since last year Two main factors explain the downturn the removal of tax breaks in China and the rollout of new carbon emission tests in Europe Near-term prospects for the industry remain sluggish and efforts to decarbonize pose a fundamental challenge in the medium term
The automobile sector is a globally interconnected industry with a large economic footprint The size of the sectorrsquos gross output (that is the sum of its value added and intermediate consumption) is about 57 percent of global output according to the World Input-Output Database (Timmer and others 2015) Vehicles and related parts are the worldrsquos fifth largest export product accounting for about 8 percent of global goods exports in 2018 (Figure 111) The sector is also a major consumer of commodities other man-ufactured products and services the vehicle industry is the second largest consumer of steel and aluminum and demands significant amounts of copper rubber plastic and electronics (Figure 112)
During the 2018 contraction (measured in units Figure 113 panel 1) global automobile production declined by about 17 percent or about ndash24 percent after correcting for differences in unit values (for exam-ple German cars on average are more expensive than Indian cars) Global car sales fell by about 3 percent China (the largest vehicle market in the world) experi-enced a 4 percent contraction in units produced its first decline in more than two decades Large declines were registered in Germany Italy and the United Kingdom while production in the United States and large emerg-ing markets expanded marginally (Figure 113 panel 2) The downturn has continued into 2019 as indicated by declining global light vehicle sales through June 2019 (Figure 114 panel 1) on continued subdued momentum in China and Europe Consistent with performance stock prices of the largest 14 car manu-facturers have declined by 28 percent on average since March 2018 (compared with about a 1 percent increase in the MSCI World index during that time)
The industryrsquos downturn contributed to the slow-down in global growth beginning in the second half of 2018 National income account data by sector are
The author of this box is Luisa Charry with research assistance from Aneta Radzikowski
not yet available for 2018 in many countries However assuming a proportional decline in value added IMF estimates suggest that the contraction in car production directly subtracted 004 percentage point from global output growth last year (following a positive contribu-tion of 002 percentage point in 2017) Considering that global growth slowed by 02 percentage point last yearmdashfrom 38 percent in 2017 to 36 percentmdashthese estimates suggest that automobile production has been an important factor in the global slowdown
Developments in the automobile industry also played a role in global trade dynamics Automobile exports from the 14 biggest car-producing countries fell by 31 per-cent in 2018 when measured in units Controlling for differences in unit values across exporters IMF estimates suggest that the contraction in car exports directly sub-tracted 012 percentage point from global trade volumes
Gross output Exports
Sources CEIC Haver Analytics Japan Automobile Manufacturers Association National statistics offices Spanish Association of Automobile and Truck Manufacturers (ANFAC) Statista Society of Motor Manufacturers and Traders United Nations Conference on Trade and Development World Input-Output Database and IMF staff calculationsNote EU4 = France Germany Italy Spain
Figure 111 Global Vehicle Industry Share of Total 2018(Percent)
China
United States
Mexico
Canada
EU4
Japan
South Korea
Brazil
United Kingdom
India
Russia
Rest of theworld
0 105 15 20 25 30
Box 11 The Global Automobile Industry Recent Developments and Implications for the Global Outlook
35
C H A P T E R 1 G LO b a L P R O s P E C Ts a N D P O L I C I E s
International Monetary Fund | October 2019
in 2018 (following a positive contribution of 003 percent in 2017) In addition the sectorrsquos extensive value-chain linkages imply that the overall effects may be larger once the impact on trade in car partsmdashfor which volume data are not yet available for a sufficiently large number of countriesmdashand other intermediate goods used in car pro-duction is considered A global input-output framework based on Bems Johnson and Yi (2011) suggests that the sector may have subtracted as much as 05 percentage point from global trade in 2018 once these spillover effects are factored in For reference the growth of all global exports of goods and services was 38 percent points in 2018 (down from 54 percent growth in 2017)
Several factors help explain the sectorrsquos performance bull Vehicle demand in China was weighed down
by higher taxes and tighter financial condi-tions Tax breaks have been used in China to encourage vehicle ownership In late 2015 the purchase tax on small and medium vehicles was lowered to 5 percent from 10 per-cent and subsequently increased to 75 percent in 2017 and to 10 percent in 2018 (Figure 114 panel 2) According to industry analysts the lower tax rates in 2016ndash17 brought sales forward by 2ndash7 million units (about 20 percent of total pro-duction) which then reduced sales in 2018ndash191
1Mian and Sufi (2012) document similar intertemporal reallocation in the United States during the ldquoCash for Clunkersrdquo program of 2009
Tighter regulations on peer-to-peer lending also weighed on demand while tariff increases on US car imports and decreases on car imports from other countries may have led consumers to take a precautionary stance
bull The rollout of new emission tests in Europe disrupted car production and trade In September 2018 a new euro-area-wide emission test (known as WLTP) went into effect The large number of models requiring certification led to bottle-necks at testing agencies and several automakers had to adjust production schedules to avoid unwanted inventory accumulation Other devel-opments weighing on activity included falling demand from emerging markets (most notably Turkey) and the United Kingdom and accelera-tion of the shift out of diesel into gasoline and alternative-fuel vehicles
bull Car demand in the United States held up in 2018 despite tighter financial conditions (and the higher steel and aluminum tariffs) Although higher interest rates on car financing throughout 2017ndash18 and tighter lending standards weighed on demand provisions for vehicle depreciation in the Tax Cuts and Jobs Act provided support In addition although higher tariffs on steel and aluminum added an estimated $240 to the production cost of an average car in the United States in 2018 (Schultz and others 2019) it is unclear how much of that was passed on to final consumers
Value added(22)
Own sectorintermediate consumption
(32)
Intermediateconsumption
(46)
Electronics(4)
Metals(10)
Rubber andplastics
(4)
Chemicals(1) Agriculture and mining
(0)
Services(17)
Utilities andconstruction
(2)
Other manufacturing(8)
Sources World Input-Output Database and IMF staff calculations
Figure 112 Global Vehicle Industry Structure of Production 2014
Box 11 (continued)
36
W O R L D E C O N O M I C O U T L O O K G LO b a L M a N U FaC T U R I N G D OW N T U R N R Is I N G T R a D E b a R R I E R s
International Monetary Fund | October 2019
The outlook for the industry remains conservative Some analysts (such as IHS Markit) anticipate a 4 per-cent contraction in light vehicle production in 2019 and flat growth in 2020 (01 percent) In China higher tariffs on light vehicle imports from the United States (set to take effect in December 2019) increasing market
Production (million units)Gross output (billions of USdollars right scale)
ChinaCanadaItalySouth KoreaIndia
United StatesGermanySpainBrazilRussia
MexicoFranceJapanUnited KingdomRest of the world
World
Figure 113 Global Vehicle Production
110 55
50
45
40
30
35
25
15
20
10
100
90
80
70
60
50
40
30
6543210
ndash1ndash2ndash3ndash4
2000
2013 14 15 16 17 18
02 04 06 08 10 12 14 16 18
1 Global Vehicle Production and Gross Output
2 Global Vehicle Industry Volumes(Contribution to percent change)
Sources International Organization of Motor Vehicle Manufacturers national statistics offices World Input-Output Database and IMF staff calculations
Tax rate (percent right scale)Sales (12-month percent change)
Year-over-year percent change (right scale)Units (past 12 months millions)
0
100
200
300
400
500
600
0 10 20 30 40 50 60 70
Global average
United States
United KingdomSpain
KoreaMexico
Japan
India
Germany
France
China Brazil
Pass
enge
r car
s pe
r 10
00 in
habi
tant
s
GDP per capita (thousand US dollars)
40
45
50
55
60
65
ndash10
ndash5
0
5
10
15
20
2011 12 13 14 15 16 17 18 Jun19
ndash20
ndash10
0
10
20
30
40
50
60
70
0
2
4
6
8
10
12
14
2008 10 12 14 16 18 19
Sources Economist Intelligence Unit Haver Analytics International Organization of Motor Vehicle Manufacturers and IMF staff calculations1Dashed line indicates logarithmic trend
Figure 114 World Passenger Vehicle Sales and Usage
3 Passenger Cars and GDP per Capita1
2 China Tax Purchase Rate and PassengerVehicle Sales
1 World Passenger Vehicle Sales andRegistrations
Box 11 (continued)Box 11 (continued)
37
C H A P T E R 1 G LO b a L P R O s P E C Ts a N D P O L I C I E s
International Monetary Fund | October 2019
saturation (Figure 114 panel 3) a young vehicle fleet and lower subsidies on purchases of electric vehicles are likely to continue to hold back demand the introduc-tion of a new emission standard in mid-2019 could also disrupt production The outlook for Europe is affected by falling demand for diesel-powered vehicles continued Brexit-related uncertainty and emission tests set for late 2019 Elsewhere easier financial conditions should provide support especially in the United States and large emerging markets but ongoing discussions around Section 232 tariffs on US imports from the European Union and Japan could weigh on activity in the near term
More fundamentally efforts to decarbonize are set to shape the medium-term outlook A significant ramp-up of investment in the production of electric and other alternative-fuel vehicles is expected in the medium term particularly in Europe However the supply chains for electric vehicles are several orders of magnitude shorter than those for fuel-powered vehicles Furthermore entry-level prices remain higher than for fuel-powered cars which could limit demand uptake Accordingly automakers are facing challenges that mean they will have to make changes to business models above and beyond those required by techno-logical reconfiguration
Box 11 (continued)
38
W O R L D E C O N O M I C O U T L O O K G LO b a L M a N U FaC T U R I N G D OW N T U R N R Is I N G T R a D E b a R R I E R s
International Monetary Fund | October 2019
Financial flows to and from advanced economies have been much weaker since the global financial crisis (Figure 121) In particular portfolio debt flows have weakened reflecting a combination of factors large government debt asset purchases by central banks increased fragmentation in euro area debt markets and much-reduced accumulation of reserves by emerging market and developing econo-mies Other investment flows have also fallen sharply as global banks reduced the size of their balance sheets after dramatic expansion of their cross-border activities during the precrisis boom But until the end of 2017 foreign direct investment (FDI) flows had actually increased slightly relative to the precrisis period averaging more than 3 percent of GDP annu-ally (more than $18 trillion)
The data for 2018 show a different picture FDI abroad by advanced economies as well as inward FDI came to a virtual standstill This box looks at the factors behind this large decline as well as the implica-tions for emerging market and developing economies Does this decline in FDI point to increased fragmen-tation This box argues that it does not and that most of the decline in FDI reflects purely financial opera-tions by large multinational corporations including in response to changes in US tax law
Specifically a significant policy development affecting FDI in 2018 was the 2017 US Tax Cuts and Jobs Act which generally eliminated taxes on repa-triated earnings by US multinationals1 In response to the law US multinational corporations repatriated accumulated prior earnings of their foreign affiliates During 2011ndash17 these multinationals on average reinvested in their overseas affiliates about $300 billion a year in earnings on FDI (about two-thirds of their total overseas earnings) but in 2018 they repatriated $230 billion In other words the dividends paid to parent companies by overseas affiliates exceeded these affiliatesrsquo earnings by $230 billion (Figure 122 panel 1 blue bars) This repatriated amount exceeded new FDI abroad and hence total FDI abroad by
The author of this box is Gian Maria Milesi-Ferretti1Earnings by foreign affiliates can be repatriated to the parent
company in the form of dividends or reinvested in the foreign affiliate Both types of earnings are reflected as primary income in the current account and reinvested earnings are counted as new FDI abroad (a financial outflow) Under the previous tax system US companies would typically retain most of their earnings abroad
US corporations was negative in 2018 (Figure 122 panel 1 black line)
Where did this repatriation of earnings origi-nate As documented by the US Bureau of Eco-nomic Analysis and as discussed in Setser (2019) it originated primarily in a few financial centers with dividends paid out of Bermuda the Netherlands and Ireland accounting for about $500 billionmdashalmost three times more than the income reported by US affiliates in these locations The evidence also suggests that the repatriated assets were invested primarily from overseas in US financial instruments (Smolyansky Suarez and Tabova 2019) Hence the repatriation of earnings would reduce FDI abroad and correspondingly reduce claims of nonresidents
Foreign direct investment Portfolio equityPortfolio debt Other investmentFinancial derivatives ReservesTotal
Figure 121 Advanced Economies Financial Flows(Percent of GDP)
ndash10
ndash5
0
5
10
15
20
25
30
1999 2002 04 06 08 10 12 14 16 18
1 Outflows
ndash10
ndash5
0
5
10
15
20
25
30
1999 2002 04 06 08 10 12 14 16 18
Source IMF staff calculations
2 Inflows
Box 12 The Decline in World Foreign Direct Investment in 2018
39
C H A P T E R 1 G LO b a L P R O s P E C Ts a N D P O L I C I E s
International Monetary Fund | October 2019
on the US economy (for instance in the form of portfolio investment in debt securities) given that overseas affiliates of US multinational corpora-tions are residents of the country where they are established
But the decline in US FDI abroad by itself explains only part of the $15 trillion reduction in advanced economiesrsquo FDI abroad between 2017 and 2018 The remainder comes mostly from the euro area in particular from Luxembourg and the Netherlands where FDI abroad fell from $340 bil-lion in 2017 to ndash$730 billion in 2018 In these countries the lionrsquos share of FDI reflects financial operations of special purpose entities These multina-tional corporation affiliates are pass-through entities with little or no employment or value added whose financial balance sheets are composed primarily of cross-border assets and liabilities They are estab-lished to (1) access capital markets or sophisticated financial services (2) isolate owner(s) from finan-cial risk (3) reduce regulatory and tax burdens or (4) safeguard the confidentiality of their transactions and owner(s)2
Statistics published by the Organisation for Eco-nomic Co-operation and Development suggest that FDI abroad by advanced economy special purpose entitiesmdashmostly domiciled in Luxembourg and the Netherlandsmdashdeclined from $240 billion in 2017 to ndash$740 billion in 2018 and hence accounts for more than 90 percent of the decline in FDI flows Panel 2 of Figure 122 shows the pattern of special purpose entitiesrsquo investment in advanced economies since 2005 highlighting the large decline in 2018 as well as the symmetry between the behavior of assets and liabilities3 The decline in FDI positions by special purpose entities is also the main factor explaining the sharp reduction in inward FDI for advanced economies highlighted in panel 2 of Figure 121 Panel 3 of Figure 122 highlights the contributions of the United States and of special purpose entities to the decline in advanced econo-miesrsquo FDI abroad
2See IMF (2018) for a discussion of the nature of special pur-pose entities and the recording of their activities in the balance of payments
3Not all countries report FDI transactions and holdings by special purpose entities separately hence the estimates in the figure understate to some extent their role
FDI abroadInward FDI
SPENon-SPE excluding United StatesUnited States
Reinvestment of earningsEquity other than reinvestment of earningsDebtTotal
ndash3
ndash2
ndash1
0
1
2
3
4
1999 2002 04 06 08 10 12 14 16 18
ndash2
ndash1
0
1
2
3
2005 08 10 12 14 16 18
ndash2
ndash1
0
1
2
3
4
5
2005 08 10 12 14 16 18
Sources Organisation for Economic Co-operation and Development US Bureau of Economic Analysis and IMF staff calculationsNote FDI = foreign direct investment SPE = special purpose entity
1 US FDI Abroad
3 FDI Abroad Advanced Economies 2005ndash18
2 FDI Flows by Special Purpose EntitiesAdvanced Economies
Figure 122 Foreign Direct Investment Flows(Percent of GDP)
Box 12 (continued)
40
W O R L D E C O N O M I C O U T L O O K G LO b a L M a N U FaC T U R I N G D OW N T U R N R Is I N G T R a D E b a R R I E R s
International Monetary Fund | October 2019
As noted in DNB (2019) and BCL (2019) these transactions reflect mostly operations by US-based multinationals seeking to simplify their international group structure by liquidating intermediate hold-ings also in relation to the US tax reform of 2017 Similarly SNB (2019) notes that the US tax reform led foreign-controlled finance and holding companies domiciled in Switzerland to reduce their balance sheets On the liability side inward FDI was nega-tive nonresident parent companies withdrew equity capital from companies in Switzerland Other factors are also likely to have been at play including ongo-ing broader tax reform initiatives such as the Base Erosion and Profit Shifting initiative and the Euro-pean Unionrsquos Anti-Tax Avoidance Directives 1 and 2
Figure 123 depicts the pattern of capital flows to and from the largest emerging market economies Inflows in 2018 were weaker than in 2017 but FDI inflows fell only slightly in relation to GDP and this decline is entirely accounted for by another large reduction in FDI positions by special purpose entities in Hungary The picture for financial outflows also shows some decline in 2018 including in FDI The largest component of this decline is again the reduc-tion in FDI by special purpose entities in Hungary coupled with some reduction in FDI abroad by China which is the largest overseas investor among emerging market economies On net emerging market econo-mies remain FDI destinations and their FDI liabilities exceed their assets
In sum the sharp decline in global FDI flows in 2018 seems to be explained almost entirely by multinational corporationsrsquo financial operations with no meaningful aggregate impact on emerging market economies These developments further underscore how FDI transactions and positions recorded in the balance of payments are often unrelated to greenfield investment or mergers and acquisitions but rather reflect tax and regulatory optimization strategies by
large multinational corporations (see for instance Lane and Milesi-Ferretti 2018 and Damgaard and Elkjaer 2017) Efforts under way to enhance data collection on the activity of special purpose entities should help clarify the nature of FDI flows and positions
Foreign direct investment Portfolio equityPortfolio debt Other investmentFinancial derivatives ReservesTotal
Figure 123 Emerging Markets Financial Flows(Percent of GDP)
1 Outflows
2 Inflows
ndash4ndash2
02468
10121416
1999 2002 04 06 08 10 12 14 16 18
Source IMF staff calculations
ndash2
0
2
4
6
8
10
12
1999 2002 04 06 08 10 12 14 16 18
Box 12 (continued)
41
C H A P T E R 1 G LO b a L P R O s P E C Ts a N D P O L I C I E s
International Monetary Fund | October 2019
The global forecast rests on the following key assumptions on policies financial conditions and commodity prices bull Tariffs The tariffs imposed and announced by the
United States as of August 2019 and retaliatory measures by trading partners are factored into the baseline forecast For US actions besides tariffs on solar panels washing machines aluminum and steel announced in the first half of 2018 these include a 25 percent tariff on $50 billion in imports from China (July and August 2018) rising to 30 percent in October 2019 tariffs on an additional $200 bil-lion in imports from China (September 2018 at 10 percent until May 2019 25 percent from May through September 2019 and 30 percent there-after) and the August 2019 announcement of a further 10 percent tariff on the remaining $325 bil-lion of imports from China (subsequently increased to 15 percent for a subset of the list beginning in September 2019 and the remainder beginning in December 2019) Chinarsquos retaliation included a 25 percent tariff on $50 billion of imports from the United States (July and August 2018) tariffs of 5ndash10 percent on $60 billion of imports from the United States (September 2018) and additional tariffs of 5ndash10 percent on $75 billion of imports from the United States (effective September and December 2019) Following the May and August 2019 announcements the average US tariff on imports from China will rise to just over 24 percent by December 2019 (compared with about 12frac14 percent assumed in the April 2019 World Economic Outlook (WEO)) while the average Chinese tariff on imports from the United States will increase to about 26 percent (compared with about 16frac12 per-cent assumed in the April 2019 WEO)
bull Fiscal policy Fiscal policy in 2019 is projected to be expansionary both in advanced economies
(Canada Germany Hong Kong SAR Korea Spain United States) and emerging market economies (China Turkey) It is assumed to be neutral across advanced economies in 2020mdashas opposed to contractionary as assumed in the April 2019 WEOmdashgiven that the unwinding of the US tax stimulus will be more than offset by spending increases in a new budget deal It is expected to be contractionary in emerging market economies given that stimulus in China is assumed to unwind to some extent (Figure 131)
bull Monetary policy Compared with the April 2019 WEO monetary policy of major central banks is assumed to be more accommodative over the fore-cast horizon The US federal funds rate is expected to be in the 175ndash2 percent range through 2023 rising to 2ndash225 percent in 2024 Policy rates are assumed to remain below zero in the euro area and Japan through 2024
bull Commodity prices Based on oil futures contracts average oil prices are projected at $618 in 2019 declining to $579 in 2020 (compared with $5916 and $5902 respectively in the April 2019 WEO) Oil prices are expected to decline to about $55 a barrel by 2023 (lower than in the April 2019 WEO forecast) consistent with subdued medium-term demand prospects (Figure 132) Metal prices are expected to increase by 43 percent year over year in 2019 before declining by 62 percent in 2020 (compared with a decrease of 6 percent and a further decline of 08 percent in the April 2019 WEO assumptions) Price forecasts of most major agricultural commodities have been revised down for 2019 Food prices are projected to decline by 34 percent year over year in 2019 before increas-ing by 28 percent in 2020 (compared with the projected decrease of 26 percent and increase of 17 percent in the April 2019 WEO)
Box 13 Global Growth Forecast Assumptions on Policies Financial Conditions and Commodity Prices
42
W O R L D E C O N O M I C O U T L O O K G LO b a L M a N U FaC T U R I N G D OW N T U R N R Is I N G T R a D E b a R R I E R s
International Monetary Fund | October 2019
2015ndash16 (cumulative)2017ndash18 (cumulative)
2015ndash16 (cumulative)2017ndash18 (cumulative)
2019ndash20 (average Sep2019 commodity prices)
2019ndash20 (average Sep2019 commodity prices)
110
105
100
95
90
85
80
75
DZA RUS MYS AUS BRA IDNSAU
USA TUR DEU POL ESP IND THAKORPAKJPNCHNITAFRAEGY
KAZ NGA COL CAN MEX ARG
0
30
20
10
ndash10
ndash20
ndash30
ndash40
10
5
0
ndash5
1 Commodity and Oil Prices(Index 2018 = 100)
2 Terms-of-Trade Windfall Gains and Losses forCommodity Exporters1
3 Terms-of-Trade Windfall Gains and Losses forCommodity Importers1
Sources IMF Primary Commodity Price System and IMF staff estimatesNote Data labels use International Organization for Standardization (ISO) country codes1Gains (losses) for 2019ndash20 are simple averages of annual incremental gains (losses) for 2019 and 2020 The windfall is an estimate of the change in disposable income arising from commodity price changes The windfall gain in year t for a country exporting x US dollars of commodity A and importing m US dollars of commodity B in year t ndash 1 is defined as (Δpt
Axt ndash 1 ndash ΔptBmt ndash 1) Yt ndash 1 in which Δpt
A and Δpt
B are the percentage changes in the prices of A and B between year t ndash 1 and year t and Y is GDP in year t ndash 1 in US dollars See also Gruss (2014)
2018 19 20 21 22 23 24
Food
Metals
Average petroleum spot price
Figure 132 Commodity Price Assumptions and Terms-of-Trade Windfall Gains and Losses(Percent of GDP unless noted otherwise)
2015 2016 20172018 2019 2020
April 2019 WEO
2015 2016 20172018 2019 2020
April 2019 WEO
Figure 131 Forecast Assumptions Fiscal Indicators(Percent of GDP)
1 Change in the Structural Primary Fiscal Balance
2 Change in the Structural Primary Fiscal Balance
Advancedeconomies
Emerging market anddeveloping economies
United States Japan1 FranceGermany
UnitedKingdom
GreeceIreland
ItalyPortugal
Spain
ndash15
ndash10
ndash05
00
05
ndash15
ndash10
ndash05
00
05
10
15
Source IMF staff estimatesNote WEO = World Economic Outlook1Japanrsquos latest figures reflect comprehensive methodological revisions adopted in December 2016
Box 13 (continued)
43
C H A P T E R 1 G LO b a L P R O s P E C Ts a N D P O L I C I E s
International Monetary Fund | October 2019
According to conventional business cycle theory the economy fluctuates symmetrically around a certain level of potential output Consistent with this view estimates of potential output are generally obtained by fitting a smooth trend through output removing busi-ness cycle fluctuations These techniques imply that several advanced economies are now operating close to or above potential facing inflation risks Nonetheless inflation has been remarkably subdued in recent years raising questions about the state of the business cycle and suggesting that potential output could be higher than currently estimated
The sluggish behavior of inflation has renewed inter-est in alternative interpretations of the business cycle One prominent hypothesis is that economic fluctua-tions may behave in line with the ldquoplucking theoryrdquo originally proposed by Friedman (1964 1993) According to this view the economy suffers occasional contractions that reduce the level of output below potential as illustrated in Figure 141 In Friedmanrsquos words ldquooutput is viewed as bumping along the ceiling of maximum feasible output except that every now and then it is plucked down by a cyclical contractionrdquo
Dupraz Nakamura and Steinsson (2019) shows that business cycle dynamics consistent with the pluck-ing theory can occur when wages are sticky downward but can freely adjust upward In this case negative shocks pluck the economy below potential while positive shocks are absorbed through higher prices Accordingly potential output should be estimated not by smoothing out economic fluctuations but by inter-polating historical peaks of the business cycle There-fore current estimation techniques may significantly underestimate potential output and provide premature alarms about the risk of overheating
Conventional estimates of potential output can be too conservative even if wages are also sticky upward provided downward nominal rigidities are more severe Building on this idea Abbritti and Fahr (2013) provides a model in which asymmetric wage rigidities generate economic contractions below poten-tial that are more severe than economic expansions above it Aiyar and Voigts (2019) points out that this leads on average to negative output gaps and that when conventional filtering techniques are applied to the model-generated data they underestimate potential output by generating output gaps centered around zero
The author of this box is Damiano Sandri
To test the validity of the plucking theory the busi-ness cycle can be analyzed for particular asymmetries As shown in Figure 141 if output is temporarily plucked down by occasional contractions the severity of an economic downturn should predict the strength of the subsequent economic expansion By contrast the amplitude of economic expansions should have no bearing on the depth of subsequent contractions
Dupraz Nakamura and Steinsson (2019) performs a similar test looking at the behavior of the unem-ployment rate in the United States1 Consistent with the plucking theory the study finds that increases in the unemployment rate during economic down-turns tend to be followed by reductions of a similar size (Figure 142 panel 1) Declines in unemploy-ment during economic expansions are however not
1The method requires identifying peaks and troughs in seasonally adjusted monthly unemployment rates A point in the unemployment series u t qualifies as a trough if it satis-fies the following criterion Take the first month in which the unemployment rate increases by 15 percent above u t If up to that month the unemployment rate never falls below u t then u t is an unemployment trough A symmetric procedure is used to identify unemployment peaks
Output Potential output
Source IMF staff
Figure 141 An Illustration of the PluckingTheory
Outp
ut
Time
Contraction
Expansion
Box 14 The Plucking Theory of the Business Cycle
44
W O R L D E C O N O M I C O U T L O O K G LO b a L M a N U FaC T U R I N G D OW N T U R N R Is I N G T R a D E b a R R I E R s
International Monetary Fund | October 2019
correlated with subsequent unemployment increases (Figure 142 panel 2)
How well does the plucking theory fit the data for other economies Unemployment dynamics in other Group of Twenty advanced economies reveal similar behavior Panel 3 of Figure 142 displays the pooled data2 It shows that increases in unemployment during economic contractions are followed by proportional unemployment declines during subsequent recoveries However the relationship is marginally weaker than in the United States and the regression coefficient equal to 052 indicates that increases in the unemployment rate are only partially reversed during subsequent economic expansions reflecting a trend increase in structural unemployment Consistent with the pluck-ing theory there is no significant relationship between unemployment declines and subsequent increases (Figure 142 panel 4)
In sum unemployment dynamics in major advanced economies display patterns that appear consistent with theories that generate asymmetric business cycle fluctua-tions while increases in unemployment are at least par-tially reversed declines in unemployment are not More research on the robustness of these asymmetric dynamics and the mechanisms behind them is warranted
The implications of the plucking theory for mac-roeconomic policy are not trivial For example the insight that conventional filtering techniques under-estimate potential output could be used to argue that countries have a stronger structurally adjusted fiscal position (and a smaller fiscal consolidation need) than generally assessed However the plucking theory also implies that economies operate below potential on average Therefore a proper assessment of fiscal sus-tainability should not be based on a measure of poten-tial output consistent with the plucking theory but on the lower expected output path Regarding monetary policy the plucking theory implies a non-linear Philips curve with prices being slow to decline in a downturn because of downward nominal rigidities Monetary policy may therefore want to rely more on measures of economic slack to calibrate the appropriate level of stimulus withdrawing accommodation only when inflationary pressures are clearly materializing
2Data is pooled across the other advanced economies given that they display much fewer observations for the analysis than in the case of the United States This is for two reasons First the unemployment rate series in the United States starts in the late 1940s while data for the other countries tend to be available beginning in the 1970s Second the US unemployment rate involves much more regular swings while it follows more slow-moving trends in other countries
Figure 142 Unemployment Dynamics inAdvanced Economies(Percentage points)
Sources Haver Analytics and IMF staff calculationsNote p lt 001 p lt 005
1 Unemployment Increases and SubsequentDeclines in the United States
2 Unemployment Declines and SubsequentIncreases in the United States
3 Unemployment Increases and SubsequentDeclines in Other Advanced Economies
4 Unemployment Declines and SubsequentIncreases in Other Advanced Economies
1
2
3
4
5
6
7
1 2 3 4 5 6 7
Unem
ploy
men
t dec
lines
dur
ing
subs
eque
nt e
cono
mic
exp
ansi
ons
Unem
ploy
men
t inc
reas
es d
urin
gsu
bseq
uent
eco
nom
ic c
ontra
ctio
ns
Unemployment increases during economic contractions
1
2
3
4
5
6
7
1 2 3 4 5 6 7
Unemployment declines during economic expansions
123456789
1 2 3 4 5 6 7 8 9
Unem
ploy
men
t dec
lines
dur
ing
subs
eque
nt e
cono
mic
exp
ansi
ons
Unemployment increases during economic contractions
123456789
1 2 3 4 5 6 7 8 9
Unem
ploy
men
t inc
reas
es d
urin
gsu
bseq
uent
eco
nom
ic c
ontra
ctio
ns
Unemployment declines during economic expansions
y = ndash04 + x 109
y = ndash17 + x 052
Box 14 (continued)
45International Monetary Fund | October 2019
S P E C I A L F E AT U R E CO M M O D I T y Ma R K E T D E v E LO P M E N Ts a N D F O R E C a s Ts
Energy pricesmdashespecially for coal and natural gasmdashhave seen a broad-based decline since the release of the April 2019 World Economic Outlook (WEO) After a temporary rebound in April led by positive market momentum and supply cuts oil prices have retrenched following record-high US production growth and weaker economic growth prospects especially in emerging mar-kets In response to declining oil prices Organization for the Petroleum Exporting Countries (OPEC) and non-OPEC oil exporters (including Russia) agreed to extend their production cuts until March 2020 While supply concerns caused iron ore and nickel prices to rally most base metal prices declined following continued trade tensions and fears of a global economic slowdown Agricultural prices decreased slightly as an increase in meat prices caused by disease outbreaks was more than offset by price declines of other foods This special feature includes an in-depth analysis of precious metals
The IMFrsquos primary commodity price index declined by 55 percent between February 2019 and August 2019 the reference periods for the April 2019 and current WEO respectively (Figure 1SF1 panel 1) Energy prices drove that decline falling by 131 per-cent food prices decreased by 12 percent and base metal prices decreased by 09 percent driven by con-tinued trade tensions and fears of a global economic slowdown only partially offset by the supply-driven price rally in the iron ore and nickel markets Oil prices rebounded sharply at the beginning of the year surpassing $71 a barrel in April1 driven by positive momentum in financial markets supply cuts and declining US crude oil stockpiles Since then how-ever oil prices have retrenched substantially due to record-high production growth in the United States and subdued global economic growth (especially in emerging markets) In response to the price decline OPEC and non-OPEC oil exporters (including Russia) in July agreed to extend their December 2018 production cuts to the end of the first quarter of 2020 Coal and natural gas prices decreased amid
The authors of this special feature are Christian Bogmans Lama Kiyasseh Akito Matsumoto Andrea Pescatori (team leader) and Julia Xueliang Wan with research assistance from Lama Kiyasseh Claire Mengyi Li and Julia Xueliang Wang
1Oil price in this document refers to the IMF average petroleum spot price which is based on UK Brent Dubai Fateh and West Texas Intermediate equally weighted unless specified otherwise
a decline in industrial activity and power generation across regions
Oil Prices in a Narrow Range amid Energy Pricesrsquo Decline and Heightened Uncertainty
Oil prices have been relatively stable trading within a narrow range this year despite heightened geopolitical uncertainty In April they surpassed $71 their highest for 2019 and hit their recent bottom of $55 in August before rebounding back above $60 in September Initially prices were pushed higher by the recovery of financial conditions as well as outages in Venezuela and US tensions with Iran But in late spring a weaker global economy raised concern about the strength of global oil demand which was amplified by a buildup of US crude oil stockpiles
Supply outages and geopolitical tensions however masked the oil demand weakness and so temporarily supported prices Venezuela suffered production loss after a power outage in March and Russian oil exports were partially halted in May because of pipeline con-tamination Although these outages were temporary they helped balance the market resulting in lower US inventories in early spring In addition in May pre-viously issued US waivers to eight major importers of Iranian crude oil were not extended Moreover geopo-litical tensions in the Middle East rose because of sev-eral attacks on Saudi oil infrastructures and oil tankers near the Strait of Hormuz given that about 20 percent of global crude oil trade passes through the Strait the fear of a conflict in that area drives up precautionary oil demand and insurance costs On September 14 an attack on two key oil facilities in Saudi Arabia knocked out 57 million barrels per day of production for a few days (that is about half of Saudi Arabiarsquos total pro-duction or 5 percent of global oil production) raising initially the fear of disruptions in the physical crude oil market and further escalating tensions Further support for oil prices came from OPEC and non-OPEC oil exporters (including Russia) which on July 1 2019 agreed to extend their crude oil production cuts beyond their initial six-month period for an additional nine months until March 2020 by 08 million barrels a day (mbd) and 04 mbd respectively
On the demand side weaker global economic fundamentals have contributed to lower prices
Special Feature Commodity Market Developments and Forecasts
46
W O R L D E C O N O M I C O U T L O O K G LO b a L M a N U FaC T U R I N G D OW N T U R N R Is I N G T R a D E b a R R I E R s
International Monetary Fund | October 2019
The IMFrsquos October downward revision of the global growth forecastmdashby 03 percent to 30 percent and by 02 percent to 34 percent for 2019 and 2020 respec-tively from its April forecastmdashillustrates a slowdown in global activity driven in particular by emerging markets and the euro area In line with this slowdown the International Energy Agency revised its oil demand growth forecast as of September for this year down to 11 mbd from 14 mbd in February
In the natural gas market spot prices have been declining in recent months amid increased produc-tion and higher stock levels due to lower global power demand Coal prices have decreased in tandem because of declining power generation Further downward pressure followed last yearrsquos record retirement of US coal-fired power capacity Its replacement by cheaper gas-fired power plants as part of a global trend has lowered the share of coal in US power generation Despite the ongoing decarbonization of the power sector in the United States and the rest of the world however global greenhouse gas emissions increased again in 2018 following strong global growth (see Box 1SF1)
As of late September 2019 oil futures contracts indicate that Brent prices will gradually decline to $55 over the next five years (Figure 1SF1 panel 2) Base-line assumptions also based on futures prices suggest average annual prices of $618 a barrel in 2019mdasha decrease of 96 percent from the 2018 averagemdashand $579 a barrel in 2020 for the IMFrsquos average petroleum spot prices Despite the weaker demand outlook risks are tilted to the upside in the near term but balanced in the medium term (Figure 1SF1 panel 3) Upside risks to prices in the short term include ongoing geopolitical events in the Middle East disrupting oil supply and contributing to rising insurance and ship-ping costs of oil cargoes Downside risks include higher US production and exports thanks to new Permian pipelines coming online noncompliance among OPEC and non-OPEC members and a downturn in petrochemical demand Further a rise in trade tensions and other risks to global growth could decelerate global activity and reduce oil demand in the medium term
Metal Prices MixedBase metal prices declined slightly by 09 percent
between February 2019 and August 2019 as continued trade policy uncertainty and fears of a global economic slowdownmdashespecially in Chinamdashwere only partially offset by supply-driven price increases in iron ore
Aluminum CopperIron ore Nickel
Futures68 percent confidence interval86 percent confidence interval95 percent confidence interval
April 2018 WEO April 2019 WEOOctober 2018 WEO October 2019 WEO
All commodities EnergyFood Metals
Sources Bloomberg Finance LP IMF Primary Commodity Price System Thomson Reuters Datastream and IMF staff estimatesNote WEO = World Economic Outlook1WEO futures prices are baseline assumptions for each WEO and are derived from futures prices October 2019 WEO prices are based on September 17 2019 closing2Derived from prices of futures options on September 17 2019
50
100
150
200
250
300
0Jan2016
Jan17
Jan18
Jan19
Jan20
Jan21
0
40
80
120
160
200
2013 14 15 16 17 18 19 20 21 22
50
100
150
200
250
300
350
2005 06 07 08 09 10 11 12 13 14 15 16 17 18
Figure 1SF1 Commodity Market Developments
1 Commodity Price Indices(2016 = 100)
30
40
50
60
70
80
90
Dec 2017 Dec 18 Dec 19 Dec 20 Dec 21 Dec 22 Dec 23
2 Brent Futures Curves1
(US dollars a barrel expiration dates on x-axis)
3 Brent Price Prospects2
(US dollars a barrel)
4 Metal Price Indices(Jan 1 2016 = 100)
47International Monetary Fund | October 2019
S P E C I A L F E AT U R E CO M M O D I T y Ma R K E T D E v E LO P M E N Ts a N D F O R E C a s Ts
and nickel Precious metal prices rose reflecting in part increased expectations of monetary easing in the United States and a flight to safety amid trade tensions
Iron ore prices increased 67 percent between February 2019 and August 2019 Widespread disruptionsmdashincluding the Vale dam collapse in Brazil and tropical cyclone Veronica in Australiamdashcoupled with record-high steel output in China pushed iron ore prices to five-year highs during the first half of 2019 However the normalization of previously disrupted operations and escalating trade tensions between the United States and China triggered a sharp correction in August partially offsetting the gains since the beginning of the year The price of nickel a key input for stainless steel and batteries in electric vehicles gained 241 percent between February 2019 and August 2019 on supply concerns as Indonesia the worldrsquos largest nickel pro-ducer introduced a complete ban on exports of raw nickel ore beginning in January 2020
Other base metal prices suffered from a weaker global economy however Copper prices declined 94 percent on global trade uncertainty despite recent production cuts in the Republic of Congo a labor dispute in Chuquicamata (Chile) and increasing extraction costs in Indonesiarsquos Grasberg mine The price of aluminum fell by 66 percent because of overcapacity in China and weakening demand from the vehicle market there The price of zinc which is used mainly to galvanize steel decreased 16 percent from February to August 2019 as steel demand prospects deteriorated The price of cobalt continued its downward trend and declined by 61 percent reflecting a supply glut after production was ramped up in the Democratic Republic of the Congo
The IMF annual base metals price index is projected to increase by 43 percent in 2019 (relative to its average in 2018) and decrease by 62 percent in 2020 Major downside risks to the outlook include prolonged trade negotiations and a further slowdown of industrial activity globally Upside risks are supply disruptions and more stringent environmental regulations in major metal producing countries
Meat Prices Higher Following Animal Disease Outbreaks
The IMFrsquos food and beverage price index has decreased slightly by 13 percent as price declines of cereals vegetables vegetable oils and sugar overwhelmed a large 132 percent increase in the meat index
Following the rapid spread of African swine fever across China (the worldrsquos largest producer and con-sumer of pork) and other parts of Southeast Asia prices of pork jumped by 428 percent News of disease outbreaks and animal culling have raised uncer-tainty regarding Chinese pork supplies in the near future The outbreak has also led to tighter supplies and higher prices in Europe and the United States as domestic producers increased exports to China In the wake of the crisis prices of some other animal proteins surged too with beef for example rising by 83 percent
Record rainfall in the Midwest of the United States delayed corn and soybean-planting in May and June introducing a high weather premium into grain mar-kets This premium then left the markets between late July and end of August however as US corn acreage and yields surpassed expectations Strong global pro-duction also weighed on corn prices which ultimately decreased by 36 percent between February and August Soybeans experienced a net loss of 59 percent as trade tensions and the African swine fever outbreak in China continued to depress animal feed demand
Cocoa prices decreased by 27 percent following favorable weather conditions in west Africa during July and August Palm oil prices declined by 26 percent given that inventories are expected to increase and global demand in 2019ndash20 may shrink for the first time in two decades following environmental concerns in some importing countries and rising competition from other vegetable oils
Food prices are projected to decrease by 34 percent a year in 2019 mainly because of higher prices in the first half of 2018 and then increase by 28 percent in 2020 Weather conditions have been unusual in recent months and additional weather disruptions remain an upside risk to the forecast On August 9 2019 the US National Oceanic and Atmospheric Administration announced that El Nintildeo climate conditions that started last September are now officially over A resolution of the trade conflict between the United Statesmdashthe worldrsquos largest food exportermdashand China remains the largest source of upside potential for prices
Precious MetalsWhat determines fluctuations in the prices of
precious metals What are they used for primarily Are gold and other precious metals the ultimate haven and hedging instruments against the loss of monetary
48
W O R L D E C O N O M I C O U T L O O K G LO b a L M a N U FaC T U R I N G D OW N T U R N R Is I N G T R a D E b a R R I E R s
International Monetary Fund | October 2019
discipline or is their role as a store of value overstated This section tries to answer these questions by offering a brief historical overview then investigating the basic characteristics of precious metals including the geo-graphical distribution of their production and finally through an econometric analysis to test some possible answers to these questions
Coinage Money and Precious Metals A Brief Historical Overview
Since ancient times luster ductility rarity and remarkable chemical stability have conferred high value on precious metals (that is gold and silver and later platinum and palladium which share similar physical properties)2 The first use of gold and silver for orna-ments rituals and to signal social status dates to pre-historic times and was widespread across cultures and civilizations (Green 2007) The combination of these unique characteristics made precious metals excellent stores of value and probably was crucial in fostering the introduction of coinsmdasha fundamental innovation in the history of money and a transition in the develop-ment of civilization itself (Mundell 2002) Coinage in turn inextricably connected precious metals to money and currencies for centuries3
Thanks also to their density gold and silver coins were strongly favored as medium of exchange relative to other metals (such as copper) especially for (sizable) international transactions As a result
2Gold and silver belong to the seven metals of antiquity (with copper tin lead iron and mercury) Today 86 metals are known The first European reference to platinum appears in 1557 in the writings of the Italian humanist Giulio Cesare della Scala Only at the end of 18th century however did platinum gain appreciation as a precious metal Palladium was discovered by William Hyde Wollaston in 1802 (curiously named after the asteroid 2 Pallas) and has been used as a precious metal in jewelry since 1939 as an alternative to platinum in alloys called ldquowhite goldrdquo (The naturally white color of palladium does not require rhodium plating) Other precious metals in addition to those analyzed include the platinum group metals ruthe-nium rhodium osmium and iridium which are however not widely traded
3The introduction of coinage is still shrouded in mystery but it seems likely that the first coin (the electrum a mix of gold and silver) was minted in Lydia around 600 BCE and it rapidly spread throughout the Mediterranean area The Lydian electrum coins were overvalued yielding profit or seigniorage to the issuer This overvaluation indicates that the issuing state must have been strong enough to enforce a monopoly of coinage inhibiting entry by means of drastic prohibitions (Mundell 2002)
some gold and silver coins minted by reliable entities gained wide international acceptance (for example gold florins and ducats in the Middle Ages and silver pesos in modern times)mdashfacilitating and stimulating trade across kingdoms and civilizations (Vilar 1976)4
Mixed metallic standards in which government or central bank notes are convertible into metal coins at a fixed price were a natural evolution to overcome some of the obvious limitations of pure coin stan-dards (Officer 2008) After centuries of widespread bimetallism in which the goldndashsilver ratio is given by the mint price in the third quarter of the 19th century following the lead of Britain monometallic gold standards prevailed across the major economic powers of that timemdashpossibly stimulating global trade5 As silver was demonetized across the world silver prices declined substantially especially after the 1873 Coinage Act (also known as the ldquoCrime of rsquo73rdquo Friedman 1990) Hence after thousands of years of relative stability the silverndashgold price ratio became volatile and shot up from 161 in the mid-1800s to almost 1001 in subsequent decades (Figure 1SF2 panel 2)6
The stability of gold purchasing power was quite remarkablemdashwith the exception of the world wars and the Great Depressionmdashuntil the suspension of dollar-gold convertibility in 1971 which two years
4By 500 BCE after Darius conquered Lydia Persia embraced coinage (opting for a bimetallic monetary standard) and struck massive quantities of Persian sigloi (a silver coin) which became the international currency of its time along with two other Anatolian coins (that is the gold coins of Lampsacus and the electrum coins of Cyzicus) (Mundell 2002) After the Roman aureum in the middle ages the gold Florentine florins and Venetian ducats became accepted across Europe while the silver peso (also known as the ldquopiece of eightrdquo) minted in the Spanish Empire was the interna-tional currency of modern times the antecedent of the US dollar and was legal tender in the United States until the Coinage Act of 1857 (Vilar 1976)
5Some studies have found that the rise of the classical gold standard between 1870 and 1913 could account for 20 percent of the increase in global trade between 1880 and 1910mdashstrongly supporting the idea that commodity money regime coordination and currency unions were an important catalyst for 19th century globalization (Lopez-Cordova and Meissner 2003)
6Silver was demonetized first in the United Kingdom in 1819 later during the 1870s in Germany France the Scandina-vian Union the Netherlands Austria Russia and in the Latin Monetary Union (Belgium Italy and Switzerland) and in the United States with the 1973 Coinage Act By the late 1870s China and India were the only major countries effectively on a silver standard
49International Monetary Fund | October 2019
S P E C I A L F E AT U R E CO M M O D I T y Ma R K E T D E v E LO P M E N Ts a N D F O R E C a s Ts
later led to the collapse of the system inaugurating a new era of fluctuating gold prices and indefinitely sev-ering the link between precious metals and currencies (Figure 1SF2)
Even today in a world of fiat currencies the legacy of gold-currency convertibility is visible as official holdings of goldmdashmostly held by central banks and international institutions such as the IMF and the Bank for International Settlementsmdashstill represent a large share of the total stock of the precious metals of official reserves and sometimes even of a countryrsquos public debt (Table 1SF1)
The next section investigates the current role of precious metals in the global economy looking at their production volumes and values (sizable for various countries) and their usage
Basic Facts about Precious Metals
The Production of Precious Metals and Its Geographical Distribution
The production of precious metals especially plat-inum and palladium is concentrated in a few places The global flow of production for gold was about 3260 metric tons in 2018 equivalent to about $134 billion The top five producers (China Australia Russia United States Canada) make up more than 40 percent of production The value of gold production is bigger than copper and dwarfs other precious metals Global pro-duction of silver palladium and platinum was $13 bil-lion $9 billion and $4 billion in 2018 respectively Their production however is much more concentrated for example the two largest silver producers (Mexico and Peru) represent almost 40 percent of global pro-duction Similarly Russia and South Africa account for three-quarters of global palladium production while South Africa alone accounts for more than two-thirds of global platinum production (Table 1SF2)
Taken as a group total production and reserves of precious metals represent a nonnegligible share of GDP (exports) for various countries (Figure 1SF3) especially for medium and small low-income countries (for exam-ple Burkina Faso Ghana Mali Suriname) Fluctuations in prices may thus induce significant income and wealth effects on a wide variety of countries
The mining of precious metals is relatively inelastic to prices as a price boom in the mid-2000s showed (Erb and Harvey 2013) Precious metal production ratios exhibit no clear trend over a long period and the goldndashsilver ratio was surprisingly barely affected by the American silver production boom of the 16th and 17th centuries (Table 1SF3)7 In addition silverndashgold production and price ratios have shown no obvious relationship in the past decade suggesting that the relative supply of precious metals has not been a significant source of price fluctuations
The Use of Precious Metals
Demand for precious metals can be classified as follows industrial jewelry and investment and net official purchases by central banks and
7Interestingly while the production volume of precious metals has increased about 500 times since 1500 global GDP and population have increased 50 and 15 times respectively (Malanima 2009) Over the same period the purchasing power of gold and silver has not declined (Erb and Harvey 2013)
World War IGold Reserve ActCoinage Act 1873Goldsilver
Great DepressionBretton WoodsGold sale moratoriumGold
Silver
000
001
002
003
004
005
006
007
008
009
1850 60 70 80 90 1900 10 20 30 40 50 60 70 80 90 2000 18
0
20
40
60
80
100
120
1850 60 70 80 90 1900 10 20 30 40 50 60 70 80 90 2000 18
Figure 1SF2 Gold and Silver Prices
Sources Measuringworthcom Minneapolis Federal Reserve and IMF staff calculationsNote USD = US dollars
2 UK GoldndashSilver Price(Ratio)
1 Historical Real Prices(USDounce)
50
W O R L D E C O N O M I C O U T L O O K G LO b a L M a N U FaC T U R I N G D OW N T U R N R Is I N G T R a D E b a R R I E R s
International Monetary Fund | October 2019
Table 1SF1 Official Gold Reserves
TonsValue
($ billions)Percent of Reserves
Percent of Public Debt
1970 1980 1990 2000 2010 2019 2019United States 9839 8221 8146 8137 8133 8133 332 75 2Germany 3537 2960 2960 3469 3407 3368 137 70 6International Monetary Fund 3856 3217 3217 3217 2934 2814 115 ndash NAItaly 2565 2074 2074 2452 2452 2452 100 66 4France 3139 2546 2546 3025 2435 2436 99 61 4Russian Federation ndash ndash ndash 343 710 2183 88 19 39China ndash 398 395 395 1054 1900 77 2 1Switzerland 2427 2590 2590 2538 1040 1040 42 5 15Japan 473 754 754 754 765 765 31 2 0India 216 267 333 358 558 613 25 65 5Netherlands 1588 1367 1367 912 612 612 25 6 1European Central Bank ndash ndash ndash 747 501 505 21 28 NATaiwan Province of China 73 98 421 421 424 424 17 4 8Portugal 802 689 492 607 383 383 16 60 5Kazakhstan ndash ndash ndash 56 67 367 15 56 40Uzbekistan ndash ndash ndash ndash ndash 355 14 53 136Saudi Arabia 106 142 143 143 323 323 13 3 9United Kingdom 1198 586 589 563 310 310 13 8 1Turkey 113 117 127 ndash ndash 296 12 14 5Lebanon 255 287 287 287 287 287 12 23 14Sources IMF International Financial Statistics World Gold Council and IMF staff calculationsNote 2019 values are as of March
Table 1SF2 Precious Metals Production 2016ndash18
Gold Value ($ billions)Cumulative World Share (Percent) Silver Value ($ billions)
Cumulative World Share (Percent)
China 131 11 Mexico 31 21Australia 93 18 Peru 23 37Russia 85 26 China 17 48Kazakhstan 84 32 Chile 07 53United States 74 39 Russia 07 58Ghana 74 45 Poland 07 63Peru 62 50 Australia 07 67Canada 62 55 Bolivia 07 72Brazil 56 59 Kazakhstan 06 76Papua New Guinea 47 63 Argentina 06 80South Africa 45 67 United States 05 84Mexico 42 71 Other Countries 24 100Other Countries 356 100 World 148World 1213
Palladium Value ($ billions)Cumulative World Share (Percent) Platinum Value ($ billions)
Cumulative World Share (Percent)
Russia 22 39 South Africa 39 70South Africa 21 75 Russia 07 82Canada 05 83 Zimbabwe 04 89United States 04 90 Canada 03 95Zimbabwe 03 95 United States 01 97Other Countries 03 100 Other Countries 02 100World 58 World 56Sources IMF Primary Commodity Price System United States Geological Survey and IMF staff calculationsNote Three-year average (2016ndash18) of both prices and production
51International Monetary Fund | October 2019
S P E C I A L F E AT U R E CO M M O D I T y Ma R K E T D E v E LO P M E N Ts a N D F O R E C a s Ts
international organizations More than half of newly mined gold is used in jewelry (Figure 1SF4) Silver instead has various industrial applications which account for half of silver consumption while only 25 percent of silver demand is for jewelry Investment demand for gold and silver (in the form of coins and bars or holdings in exchange-traded funds) varies significantly as it is more sensitive to prices8 Industrial use is more important for plati-num and especially palladiummdashwhich are used in catalytic converters by the car industry
Official sector gold holdings are large accounting for about 30 percent of the global stock of gold Their sale can disrupt the market and therefore has been limited to 400 metric tons a year9 The declining role of gold in the balance sheets of central banks in advanced economies however has been more than offset by a recent surge in emerging market gold reserves (Table 1SF1) The next section will take a financial investment perspective on precious metals by looking at them as an asset class analyzing their major price determinants and paying attention to their safe haven and hedging properties during market turmoil and against high inflation
Price Properties of Precious Metals
Precious metals can be considered an asset class of their own Their returns show a high correlation among themselves especially gold silver and platinum consistent with their respective ranking in industrial use (Figure 1SF5) At monthly frequencies gold and silver have the highest correlation 072 while palladium and gold have the lowest at 033 At lower frequencies pal-ladium prices are more related to industrial metals (such as copper) than to gold but the highest correlation for palladium is still with its close substitute platinum Movements in global industrial production have how-ever minor implications for precious metal prices even for palladium and platinum (Table 1SF5)
The relationship between precious metals and infla-tion throughout history has changed with the mone-tary system in place In historical metallic regimes in
8The exchange-traded fund GLD holds 20 percent of total stock scattered in warehouses across the world Scrap metal is another significant price-sensitive source of supply which for gold is almost half of mining production
9The central bank moratorium on gold sales in September 1999 led the price of gold to rise by 25 percent within a month There have since been three further agreements in 2004 2009 and 2014 limiting the amount of gold that signatories can sell in any one year
SUR
GUY
BFA
MLI
PNG
ZWE
GIN
MRT UZB
GHA
COD
ZAF
PER
TZA
TJK
BOL
NIC
CIV
DOM
LAO
ZAF
SUR
PNG
BFA
MRT
MNG MLI
ZWE
UZB
KGZ
ZAF
GHA
CAF
GUY
PER
GIN
GHA
TJK
LBR
SEN
05
1015202530354045
0
100
200
300
400
500
600
700
01020304050607080
SUR
MLI
BFA
GHA
KGZ
TZA
GUY
SDN
ZWE
BDI
BOL
PER
DOM
MRT
UGA
SEN
ZAF
MNG
NAM
EGY
Figure 1SF3 Macro Relevance of Precious Metals(Percent)
SUR
GUY
BFA
GHA
KGZ
MLI
MRT
MNG BO
L
ZWE
PER
NAM
ZAF
TZA
NIC
CIV
DOM
SEN
UGA
SDN
0
10
20
30
40
Sources IMF Primary Commodity Price System SampP Global Market Intelligence Thomson Reuters Datastream UN COMTRADE United States Geological Survey World Bank World Development Indicators and IMF staff calculationsNote Data labels use International Organization for Standardization (ISO) country codes
3 Production Share of GDP
2 Net Export Share of Total Exports
4 Reserves Share of GDP
1 Net Export Share of GDP
52
W O R L D E C O N O M I C O U T L O O K G LO b a L M a N U FaC T U R I N G D OW N T U R N R Is I N G T R a D E b a R R I E R s
International Monetary Fund | October 2019
which a currency was pegged to metals such as under the Bretton Woods system an increase in price was associated with a decline in the real price of metals (Figure 1SF6) This result is however reversed in contemporary fiat currency regimes
Bekaert and Wang (2010) proposes testing whether an asset is a good inflation hedge by simply regressing its nominal return on inflation arguing that if the regression slope (inflation beta) is 1 then the asset is
a good inflation hedge Averages of precious metalsrsquo inflation betas calculated across a broad set of countries during 1978ndash201910 are below 1 at monthly frequen-cies but get close to 1 as the horizon increases espe-cially for gold and silver (Table 1SF4) However the regression fit is usually modest and betas vary substan-tially across countries (see Online Annex Table 1SF1) suggesting that precious metals including gold and sil-ver are not a reliable and robust inflation hedge11 This result however is not that surprising given that the volatility of precious metal prices increased substan-tially after the end of the Bretton Woods agreements even for gold It does however suggest that gold prices peaked in 1980 and 2012 two periods during which there was fear justified or not of a globally widespread wave of high inflation12 This observation would call
10Executive Order 6102 issued in 1933 prohibited hoarding of gold coins gold bullion and gold certificates in the continental United States The limitation on gold private ownership in the United States was repealed in 1974 leading to a resumption of gold bullion trading in spot and futures markets in 1975
11A similar conclusion is obtained when testing for the presence of a unit root in the real price of precious metals over a long time span Most of the tests are inconclusive suggesting that metal prices are not an obvious inflation hedge In fact even though long-term real returns are close to zero fluctuations in the real price of precious metals can be very persistent especially in local currency
12In early 1980 US consumer price inflation peaked at almost 15 percent By 2012 many central banks around the world had embarked on quantitative easing the Federal Reserve balance sheet doubled in size while consumer price inflation in the United States had peaked at almost 4 percent in the previous year Bekaert and Wang (2010) argues that the ldquorecent crisis has made market observers and economists wonder whether inflation will rear its ugly head again in years to come Central banks across the world have injected substantial amounts of liquidity in the financial system and public debt has surged everywhere It is not hard to imagine that inflationary pressures may resurface with a vengeance once the econ-omy reboundsrdquo In both episodes however concerns were probably overplayed given that inflation declined in the subsequent years (in most advanced economies)
Table 1SF3 Relative Rarity(Production ratios of volume)
American Silver Production Boom
Early 1500s 1500s 1600s 1700s 1800s 1900ndash10 1995ndash99 2000ndash04 2005ndash09 2010ndash14 2015ndash18Silver (volume in
metric tons)47 233 373 570 2223 5655 16260 19280 21120 24920 26775
Silver to Platinum 104 102 100 132 144Silver to
Palladium119 105 104 126 124
Silver to Gold 81 327 408 300 119 102 70 76 88 91 85Silver to Copper 00014 00014 00014 00015 00013GoldndashSilver
Price Ratio110 113 135 150 192 357 648 642 579 569 754
Sources Broadberry and Gupta (2006) United States Geological Survey Vilar (1976) and IMF staff calculationsNote Historical production ratios are century averages
InvestmentIndustrial use
JewelryOfficial sector
Figure 1SF4 Share of Total Demand
ndash20
0
20
40
60
80
100
Gold Silver Platinum Palladium
Sources 2018 World Silver Survey PGM Market Report and World Gold CouncilNote Investment includes coins bars and exchange traded fundsrsquo inventory changes for silver jewelry includes silverware for platinum and palladium industrial use includes autocatalysts 2015ndash17 averages
104
ndash59
59234
297
1038
636
52476
21305
243
523
(Percent)
53International Monetary Fund | October 2019
S P E C I A L F E AT U R E CO M M O D I T y Ma R K E T D E v E LO P M E N Ts a N D F O R E C a s Ts
for testing precious metalsrsquo ability to hedge against tail events such as the collapse of major fiat currency systemsmdasha daunting task however given that that has never happened
A more viable alternative is to regress precious metal prices on a measure of inflation risk (such as past inflation volatility or inflation forecast dispersion) and a set of control variables (Table 1SF5) Results of the analysis support the view that precious metal prices react to inflation concerns The analysis uses monthly data starting in 1978 and controlling for the exchange rate (traditionally an important determinant) Treasury yields (a proxy for carrying costs) mean reversion and expected and surprise inflation An increase in inflation uncertainty by one standard deviation tends within a month to raise the price of gold by 08 percent and silver by 16 percent A decline in inflation uncertainty can explain half of the observed gold price decline of the 1990s and one-third of the price rise after 2008
The role of inflation uncertainty is instead posi-tive but not significant for platinum and palladium yet irrelevant for copper Interestingly because of dollar invoicing an appreciation of the US dollar has a simi-lar strong negative effect on all metals tested including copper What is more surprising is a coefficient above
Gold SilverPlatinum PalladiumCopper Oil
00
02
04
06
08
10
Gold Silver Platinum Palladium
00
02
04
06
08
10
Gold Silver Platinum Palladium
1 Correlations between Monthly Returns
2 Correlations between Annual Returns
Figure 1SF5 Correlation Precious Metals Copper and Oil
Sources IMF Primary Commodity Price System and IMF staff calculationsNote Sample period of gold silver copper and oil is from 1970M1 to 2019M5 Platinum starts in 1976 Palladium starts in 1987
Sources Measuringworthcom Minneapolis Federal Reserve and IMF staff calculationsNote A regression of annual real gold price change (silver) on US consumer price index inflation shows a negative coefficient before 1973 but positive thereafter
ndash04
ndash02
00
02
04
06
08
ndash04
ndash02
00
02
06
04
08
ndash010 ndash005 000 005 010 015 020 025 030ndash015
ndash010 ndash005 000 005 010 015 020 025 030ndash015
ndash010 ndash005 000 005 010 015 020 025 030ndash015
ndash04
ndash02
02
00
04
06
08
ndash010 ndash005 000 005 010 015 020 025 030ndash015
4 PostndashBretton Woods Silver
y = 17359x ndash 00588R 2 = 00372
1 PrendashBretton Woods Gold
y = ndash05x ndash 00002R 2 = 01917
3 PostndashBretton Woods Gold
2 PrendashBretton Woods Silver
y = 04843x ndash 00049R 2 = 00599
y = 18369x ndash 00392R 2 = 00762
ndash04
ndash02
00
02
06
04
08
Figure 1SF6 Precious Metals versus Consumer Price Index Inflation
54
W O R L D E C O N O M I C O U T L O O K G LO b a L M a N U FaC T U R I N G D OW N T U R N R Is I N G T R a D E b a R R I E R s
International Monetary Fund | October 2019
unity suggesting that metal prices are excessively sensi-tive to the US dollar13
In addition to tail events in the monetary sphere precious metals have been considered safe assets during sharp movements in economic and pol-icy uncertainty as proxied by stock price changes Table 1SF6 shows that gold and (to a lesser extent)
13Capie Mills and Wood (2005) and Sjaastad (2008) examine the hedge property of gold with respect to changes of the US dollar and show that dollar exchange rates and gold prices are inversely related This result has also been found for oil prices (Kilian and Zhou 2019)
silver returns do not correlate during days of high stock market swings the top 30 stock market booms are associated with a stable gold price on average while the top 30 stock market declines are associated with an average slight increase in gold prices (there is still-sizable uncertainty around the average reaction) This safe haven propertymdashwhich stands out for gold and to a lesser extent silver but is not present for platinum nor especially palladiummdashis shared by the US dollar and Treasury notes typical safe haven assets It is not shared by other base metals Finally cryptocurrencies which have some similarities to gold
Table 1SF4 World Average Inflation BetasHorizon Gold Silver Platinum Palladium1 Month 042 048 044 0406 Months 077 081 077 06612 Months 090 089 082 0615 Years 105 105 089 072
Sources IMF International Financial Statistics IMF Primary Commodity Price System Newey and West (1987) and IMF staff calculations Note The betas reported are weighted averages across all countries (weight = the inverse of the NeweyndashWest standard errors) For each country betas come from regressions between log difference of 1-month 6-month 12-month and 5-year nominal precious metal prices in local currency and inflation correspond-ing to the same horizon
Table 1SF5 Determinants of One-Month Return on Precious Metals(1)
Gold(2)
Silver(3)
Platinum(4)
Palladium(5)
CopperIndustrial Production 0095
(026)ndash0018
(ndash003)0487
(094)1049
(143)1993
(379)Inflation Surprise 2583
(224)2690
(132)3117
(241)0407
(022)1297
(106)Lag of Inflation Expectation 0406
(086)ndash0086
(ndash010)ndash0128
(ndash024)ndash2235
(ndash329)ndash0062
(ndash015)Oil Price ndash0001
(ndash074)0002
(114)0002
(159)000292
(201)000371
(398)US Treasury Bill ndash17210
(ndash187)5885
(031)0061
(001)6004(215)
ndash5640(ndash074)
Lag of US Treasury Bill 12330(134)
ndash10760(ndash059)
ndash2681(ndash032)
ndash53170(ndash186)
4101(052)
Lag of Precious Metal Real Price ndash00163(ndash331)
ndash00341(ndash343)
ndash00286(ndash306)
ndash0012(ndash124)
ndash0013(ndash169)
Exchange Rate ndash1219(ndash693)
ndash1437(ndash417)
ndash1456(ndash619)
ndash0561(ndash168)
ndash1365(ndash499)
Inflation Volatility 0909(234)
2373(28)
0821(155)
1327(162)
0254(057)
Constant 00293(262)
ndash00792(ndash328)
00654(322)
00456(202)
0049(185)
Sample Start Date 1980m1 1980m1 1980m1 1987m2 1980m1Sample End Date 2018m12 2018m12 2018m12 2018m12 2018m12R2 018 015 021 015 026
Sources Consensus Economics Forecast IMF Primary Commodity Price System Thomson Reuters Datastream University of Michigan Survey of Consumers and IMF staff calculations Note Variables are in logarithmic scale Industrial Production and Oil Price are in log difference Lag of Precious Metal Real Price = real price of dependent variable in US dollars Exchange Rate = exchange rate constructed to be orthogonal to other independent variables using nominal effective exchange rate Inflation Volatility = rolling standard deviation of inflation over 36-month window t statistics in parenthesesp lt 005 p lt 001 p lt 0001
55International Monetary Fund | October 2019
S P E C I A L F E AT U R E CO M M O D I T y Ma R K E T D E v E LO P M E N Ts a N D F O R E C a s Ts
and silver do not appear to be safe havens during stock market routs1415 Moreover unlike gold and silver they do not have intrinsic value
Conclusions
Precious metals are macrorelevant (more so for some low-income countries) and have relevant industrial use especially platinum and palladiummdasheven though their
14Cryptocurrency prices proxied by Bitcoin are calculated for 2011ndash19
15As is true of gold and silver the supply of some cryptocurren-cies is limited Cryptocurrencies also appeal to users and investors because of their decentralized nature and anonymity
price is only mildly affected by global activity Gold and silver can function as inflation hedges but this property should not be overstated especially when changes in inflation are modest Instead given their historical role in monetary systems and purchasing power stability gold and silver seem to have been buoyed at times by the (possibly irrational) fear of a collapse of major fiat currency systems The safe haven properties of precious metals have probably been more apparent during some (but not all) major economic and policy shocks proxied by stock market swings that triggered or reversed inves-tor flight to safetymdashwith gold standing out as a safe asset much like US Treasury notes Crypto assets do not seem to share this property so far
Table 1SF6 Asset Returns Associated with Largest Single-Day Changes in the SampP 500 Index(Percent change)
SampP 500 Gold Silver Platinum Palladium US dollar 10Y Yield Metals Bitcoin
Top 3053 00 ndash02 01 07 ndash03 49 05 12
(4355) (ndash111) (ndash2509) (ndash1216) (ndash1237) (ndash0803) (ndash29112) (ndash1723) (ndash1217)
Top 5047 ndash04 ndash06 02 03 ndash02 53 04 09
(3849) (ndash1307) (ndash2506) (ndash0917) (ndash1522) (ndash0605) (ndash25128) (ndash1421) (ndash0825)
Top 10039 ndash03 ndash04 03 03 ndash01 56 06 00
(3142) (ndash0705) (ndash1607) (ndash0715) (ndash0814) (ndash0605) (ndash09122) (ndash0418) (ndash3909)
Bottom 30ndash60 06 02 ndash05 ndash09 03 ndash92 ndash27 ndash03
(ndash69ndash48) (ndash0818) (ndash0407) (ndash1509) (ndash213) (ndash0208) (ndash177ndash3) (ndash4ndash18) (ndash2541)
Bottom 50ndash52 05 01 ndash04 ndash10 01 ndash91 ndash20 ndash26
(ndash6ndash39) (ndash0818) (ndash0606) (ndash1611) (ndash2209) (ndash0508) (ndash142ndash34) (ndash38ndash04) (ndash4342)
Bottom 100ndash42 03 00 ndash04 ndash09 01 ndash75 ndash15 ndash14
(ndash46ndash31) (ndash0612) (ndash111) (ndash1411) (ndash2108) (ndash0507) (ndash117ndash36) (ndash27ndash01) (ndash437)Sources Thomson Reuters Datastream and IMF staff calculationsNote Numbers represent asset returns (percent change) associated with large changes in the SampP 500 For example Top 30 and Bottom 30 refer to the average percent change of the 30 largest single-day increases and decreases respectively of the SampP 500 Data for all asset returns are sorted based on SampP 500 10Y Yield is the daily basis point difference on 10-year US bond yields For all other indicators data are daily growth rates For Bitcoin the time period is August 18 2011 to August 19 2019 Metals is the IMF base metals index For all other indicators the time interval is January 1 1998 to August 19 2019 Bitcoin numbers are adjusted by multiplying by the ratio of the SampP 500 movements over the aforementioned time intervals Data in the parenthesis are the interquartile range
56
W O R L D E C O N O M I C O U T L O O K G LO b a L M a N U FaC T U R I N G D OW N T U R N R Is I N G T R a D E b a R R I E R s
International Monetary Fund | October 2019
To slow the pace of climate change carbon emis-sions need to be reduced But how have emissions changed over the past decade And which countries are driving those changes Although global carbon emis-sions were flat between 2014 and 2016 they alarm-ingly rebounded in 2017 and 2018 (Figure 1SF11)
China has been a key driver of emission growth since the turn of the century but its impact has diminished in recent years as economic reforms have picked up pace India and other emerging markets instead are partially filling the gap In 2018 emissions decreased in all Group of Seven economies besides the United States whose emissions increased because of a resurgence of industrial production and bad weather (see BP 2019)
The authors of this box are Christian Bogmans Akito Matsu-moto and Andrea Pescatori
It is possible to decompose total emissions E as a product of carbon intensity c (carbon emissions per unit of energy) energy intensity e (energy per unit of GDP) GDP per capita y and human population P (Kaya and Yokobori 1997)
E = E _____ Energy Energy _____ GDP GDP ____ P P = c e y P
The contribution of income growth to the growth of carbon emissions is larger on average and more cyclical than that of population growth (Figure 1SF12) Declining energy intensity has consistently helped reduce emission growth but in 2018 its contribution was lower possibly because of a cyclical pickup in global industrial production In 2018 decar-bonization was the most important mitigation force as wind solar and natural gas slowly replaced coal as the energy source of choice in the power sectors of all major emitters
G7 excluding US Rest of the worldUnited States WorldChina World IP growthIndia
Sources British Petroleum International Energy Agency and IMF staff calculationsNote G7 = Group of Seven IP = industrial production
ndash10
ndash8
ndash6
ndash4
ndash2
0
2
4
6
8
10
12
14
16
2008 09 10 11 12 13 14 15 16 17 18
Figure 1SF11 Contribution to World Emissions by Location(Percent change)
Emissions Carbon intensityEnergy intensity GDP per capitaPopulation
Sources British Petroleum International Energy Agency World Bank World Development Indicators and IMF staff calculations
2008 09 10 11 12 13 14 15 16 17 18
Figure 1SF12 Contribution to World Emissions by Source(Percent change)
ndash4
ndash2
0
2
4
6
Box 1SF1 Whatrsquos Happening with Global Carbon Emissions
57
C H A P T E R 1 G LO b a L P R O s P E C Ts a N D P O L I C I E s
International Monetary Fund | October 2019
Annex Table 111 European Economies Real GDP Consumer Prices Current Account Balance and Unemployment(Annual percent change unless noted otherwise)
Real GDP Consumer Prices1 Current Account Balance2 Unemployment3
Projections Projections Projections Projections2018 2019 2020 2018 2019 2020 2018 2019 2020 2018 2019 2020
Europe 23 14 18 33 32 28 25 25 22
Advanced Europe 19 12 15 19 14 15 27 27 26 71 67 66Euro Area45 19 12 14 18 12 14 29 28 27 82 77 75
Germany 15 05 12 19 15 17 73 70 66 34 32 33France 17 12 13 21 12 13 ndash06 ndash05 ndash05 91 86 84Italy 09 00 05 12 07 10 25 29 29 106 103 103Spain 26 22 18 17 07 10 09 09 10 153 139 132
Netherlands 26 18 16 16 25 16 109 98 95 38 33 33Belgium 14 12 13 23 15 13 ndash13 ndash11 ndash08 60 55 55Austria 27 16 17 21 15 19 23 16 18 49 51 50Ireland 83 43 35 07 12 15 106 108 96 58 55 52Portugal 24 19 16 12 09 12 ndash06 ndash06 ndash07 70 61 56
Greece 19 20 22 08 06 09 ndash35 ndash30 ndash33 193 178 168Finland 17 12 15 12 12 13 ndash16 ndash07 ndash05 74 65 64Slovak Republic 41 26 27 25 26 21 ndash25 ndash25 ndash17 66 60 59Lithuania 35 34 27 25 23 22 16 11 11 61 61 60Slovenia 41 29 29 17 18 19 57 42 41 51 45 45
Luxembourg 26 26 28 20 17 17 47 45 45 50 52 52Latvia 48 28 28 26 30 26 ndash10 ndash18 ndash21 74 65 67Estonia 48 32 29 34 25 24 17 07 03 54 47 47Cyprus 39 31 29 08 07 16 ndash70 ndash78 ndash75 84 70 60Malta 68 51 43 17 17 18 98 76 62 37 38 40
United Kingdom 14 12 14 25 18 19 ndash39 ndash35 ndash37 41 38 38Switzerland 28 08 13 09 06 06 102 96 98 25 28 28Sweden 23 09 15 20 17 15 17 29 27 63 65 67Czech Republic 30 25 26 22 26 23 03 ndash01 ndash02 22 22 23Norway 13 19 24 28 23 19 81 69 72 39 36 35
Denmark 15 17 19 07 13 15 57 55 52 50 50 50Iceland 48 08 16 27 28 25 28 31 16 27 33 36San Marino 11 08 07 15 13 15 04 04 02 80 81 81
Emerging and Developing Europe6 31 18 25 62 68 56 17 16 06 Russia 23 11 19 29 47 35 68 57 39 48 46 48Turkey 28 02 30 163 157 126 ndash35 ndash06 ndash09 110 138 137Poland 51 40 31 16 24 35 ndash06 ndash09 ndash11 38 38 38Romania 41 40 35 46 42 33 ndash45 ndash55 ndash52 42 43 46Ukraine7 33 30 30 109 87 59 ndash34 ndash28 ndash35 90 87 82
Hungary 49 46 33 28 34 34 ndash05 ndash09 ndash06 37 35 34Belarus 30 15 03 49 54 48 ndash04 ndash09 ndash34 04 05 09Bulgaria5 31 37 32 26 25 23 46 32 25 53 49 48Serbia 43 35 40 20 22 19 ndash52 ndash58 ndash51 133 131 128Croatia 26 30 27 15 10 12 25 17 10 99 90 80
Note Data for some countries are based on fiscal years Please refer to Table F in the Statistical Appendix for a list of economies with exceptional reporting periods1Movements in consumer prices are shown as annual averages Year-end to year-end changes can be found in Tables A6 and A7 in the Statistical Appendix2Percent of GDP3Percent National definitions of unemployment may differ4Current account position corrected for reporting discrepancies in intra-area transactions5Based on Eurostatrsquos harmonized index of consumer prices except for Slovenia6Includes Albania Bosnia and Herzegovina Kosovo Moldova Montenegro and North Macedonia7See country-specific note for Ukraine in the ldquoCountry Notesrdquo section of the Statistical Appendix
58
W O R L D E C O N O M I C O U T L O O K G LO b a L M a N U FaC T U R I N G D OW N T U R N R Is I N G T R a D E b a R R I E R s
International Monetary Fund | October 2019
Annex Table 112 Asian and Pacific Economies Real GDP Consumer Prices Current Account Balance and Unemployment(Annual percent change unless noted otherwise)
Real GDP Consumer Prices1 Current Account Balance2 Unemployment3
Projections Projections Projections Projections2018 2019 2020 2018 2019 2020 2018 2019 2020 2018 2019 2020
Asia 55 50 51 24 24 26 13 15 13
Advanced Asia 18 13 13 13 10 13 40 39 36 32 32 32Japan 08 09 05 10 10 13 35 33 33 24 24 24Korea 27 20 22 15 05 09 44 32 29 38 40 42Australia 27 17 23 20 16 18 ndash21 ndash03 ndash17 53 51 51Taiwan Province of China 26 20 19 15 08 11 122 114 108 37 38 38Singapore 31 05 10 04 07 10 179 165 166 21 22 22
Hong Kong SAR 30 03 15 24 30 26 43 55 51 28 29 30New Zealand 28 25 27 16 14 19 ndash38 ndash41 ndash43 43 43 45Macao SAR 47 ndash13 ndash11 30 24 27 352 357 353 18 18 18
Emerging and Developing Asia 64 59 60 26 27 30 ndash01 04 02 China 66 61 58 21 23 24 04 10 09 38 38 38India4 68 61 70 34 34 41 ndash21 ndash20 ndash23
ASEAN-5 52 48 49 28 24 26 02 04 01 Indonesia 52 50 51 32 32 33 ndash30 ndash29 ndash27 53 52 50Thailand 41 29 30 11 09 09 64 60 54 12 12 12Malaysia 47 45 44 10 10 21 21 31 19 33 34 34Philippines 62 57 62 52 25 23 ndash26 ndash20 ndash23 53 52 51Vietnam 71 65 65 35 36 37 24 22 19 22 22 22
Other Emerging and Developing Asia5 63 63 62 50 53 53 ndash31 ndash28 ndash29
MemorandumEmerging Asia6 64 59 60 25 26 29 00 05 03 Note Data for some countries are based on fiscal years Please refer to Table F in the Statistical Appendix for a list of economies with exceptional reporting periods1Movements in consumer prices are shown as annual averages Year-end to year-end changes can be found in Tables A6 and A7 in the Statistical Appendix2Percent of GDP3Percent National definitions of unemployment may differ4See country-specific note for India in the ldquoCountry Notesrdquo section of the Statistical Appendix5Other Emerging and Developing Asia comprises Bangladesh Bhutan Brunei Darussalam Cambodia Fiji Kiribati Lao PDR Maldives Marshall Islands Micronesia Mongolia Myanmar Nauru Nepal Palau Papua New Guinea Samoa Solomon Islands Sri Lanka Timor-Leste Tonga Tuvalu and Vanuatu6Emerging Asia comprises the ASEAN-5 (Indonesia Malaysia Philippines Thailand Vietnam) economies China and India
59
C H A P T E R 1 G LO b a L P R O s P E C Ts a N D P O L I C I E s
International Monetary Fund | October 2019
Annex Table 113 Western Hemisphere Economies Real GDP Consumer Prices Current Account Balance and Unemployment(Annual percent change unless noted otherwise)
Real GDP Consumer Prices1 Current Account Balance2 Unemployment3
Projections Projections Projections Projections2018 2019 2020 2018 2019 2020 2018 2019 2020 2018 2019 2020
North America 27 21 20 27 20 23 ndash24 ndash24 ndash24 United States 29 24 21 24 18 23 ndash24 ndash25 ndash25 39 37 35Canada 19 15 18 22 20 20 ndash26 ndash19 ndash17 58 58 60Mexico 20 04 13 49 38 31 ndash18 ndash12 ndash16 33 34 34Puerto Rico4 ndash49 ndash11 ndash07 13 ndash01 10 92 92 94
South America5 04 ndash02 18 71 92 86 ndash18 ndash16 ndash14 Brazil 11 09 20 37 38 35 ndash08 ndash12 ndash10 123 118 108Argentina ndash25 ndash31 ndash13 343 544 510 ndash53 ndash12 03 92 106 101Colombia 26 34 36 32 36 37 ndash40 ndash42 ndash40 97 97 95Chile 40 25 30 23 22 28 ndash31 ndash35 ndash29 70 69 69Peru 40 26 36 13 22 19 ndash16 ndash19 ndash20 67 67 67
Venezuela ndash180 ndash350 ndash100 653741 200000 500000 64 70 15 350 472 505Ecuador 14 ndash05 05 ndash02 04 12 ndash14 01 07 37 43 47Paraguay 37 10 40 40 35 37 05 ndash01 13 56 61 59Bolivia 42 39 38 23 17 31 ndash49 ndash50 ndash41 35 40 40Uruguay 16 04 23 76 76 72 ndash06 ndash17 ndash30 84 86 81
Central America6 26 27 34 26 27 30 ndash32 ndash27 ndash26
Caribbean7 47 33 37 37 28 44 ndash16 ndash18 ndash22
MemorandumLatin America and the Caribbean8 10 02 18 62 72 67 ndash19 ndash16 ndash15 Eastern Caribbean Currency Union9 40 36 34 13 15 20 ndash84 ndash79 ndash77 Note Data for some countries are based on fiscal years Please refer to Table F in the Statistical Appendix for a list of economies with exceptional reporting periods1Movements in consumer prices are shown as annual averages Aggregates exclude Venezuela Year-end to year-end changes can be found in Tables A6 and A7 in the Statisti-cal Appendix2Percent of GDP3Percent National definitions of unemployment may differ4Puerto Rico is a territory of the United States but its statistical data are maintained on a separate and independent basis5Includes Guyana and Suriname See country-specific notes for Argentina and Venezuela in the ldquoCountry Notesrdquo section of the Statistical Appendix6Central America comprises Belize Costa Rica El Salvador Guatemala Honduras Nicaragua and Panama7The Caribbean comprises Antigua and Barbuda Aruba The Bahamas Barbados Dominica Dominican Republic Grenada Haiti Jamaica St Kitts and Nevis St Lucia St Vincent and the Grenadines and Trinidad and Tobago8Latin America and the Caribbean comprises Mexico and economies from the Caribbean Central America and South America See country-specific notes for Argentina and Venezuela in the ldquoCountry Notesrdquo section of the Statistical Appendix9Eastern Caribbean Currency Union comprises Antigua and Barbuda Dominica Grenada St Kitts and Nevis St Lucia and St Vincent and the Grenadines as well as Anguilla and Montserrat which are not IMF members
60
W O R L D E C O N O M I C O U T L O O K G LO b a L M a N U FaC T U R I N G D OW N T U R N R Is I N G T R a D E b a R R I E R s
International Monetary Fund | October 2019
Annex Table 114 Middle East and Central Asia Economies Real GDP Consumer Prices Current Account Balance and Unemployment(Annual percent change unless noted otherwise)
Real GDP Consumer Prices1 Current Account Balance2 Unemployment3
Projections Projections Projections Projections2018 2019 2020 2018 2019 2020 2018 2019 2020 2018 2019 2020
Middle East and Central Asia 19 09 29 99 82 91 27 ndash04 ndash14
Oil Exporters4 06 ndash07 23 85 69 80 59 16 01 Saudi Arabia 24 02 22 25 ndash11 22 92 44 15 60 Iran ndash48 ndash95 00 305 357 310 41 ndash27 ndash34 145 168 174United Arab Emirates 17 16 25 31 ndash15 12 91 90 71 Iraq ndash06 34 47 04 ndash03 10 69 ndash35 ndash37 Algeria 14 26 24 43 20 41 ndash96 ndash126 ndash119 117 125 133
Kazakhstan 41 38 39 60 53 52 00 ndash12 ndash15 49 49 49Qatar 15 20 28 02 ndash04 22 87 60 41 Kuwait 12 06 31 06 15 22 144 82 68 13 13 13Oman 18 00 37 09 08 18 ndash55 ndash72 ndash80 Azerbaijan 10 27 21 23 28 30 129 97 100 50 50 50Turkmenistan 62 63 60 132 134 130 57 ndash06 ndash30
Oil Importers5 44 38 39 127 107 113 ndash66 ndash60 ndash53 Egypt 53 55 59 209 139 100 ndash24 ndash31 ndash28 109 86 79Pakistan 55 33 24 39 73 130 ndash63 ndash46 ndash26 61 61 62Morocco 30 27 37 19 06 11 ndash54 ndash45 ndash38 98 92 89Uzbekistan 51 55 60 175 147 141 ndash71 ndash65 ndash56 Sudan ndash22 ndash26 ndash15 633 504 621 ndash136 ndash74 ndash125 195 221 210
Tunisia 25 15 24 73 66 54 ndash111 ndash104 ndash94 154 Jordan 19 22 24 45 20 25 ndash70 ndash70 ndash62 183 Lebanon 02 02 09 61 31 26 ndash256 ndash264 ndash263 Afghanistan 27 30 35 06 26 45 91 20 02 Georgia 47 46 48 26 42 38 ndash77 ndash59 ndash58 127
Tajikistan 73 50 45 38 74 71 ndash50 ndash58 ndash58 Armenia 52 60 48 25 17 25 ndash94 ndash74 ndash74 182 177 175Kyrgyz Republic 35 38 34 15 13 50 ndash87 ndash100 ndash83 66 66 66
MemorandumCaucasus and Central Asia 42 44 44 83 76 76 03 ndash13 ndash17 Middle East North Africa Afghanistan and
Pakistan 16 05 27 101 83 93 29 ndash03 ndash14 Middle East and North Africa 11 01 27 110 84 89 38 01 ndash13 Israel6 34 31 31 08 10 13 27 24 25 40 40 40Maghreb7 30 14 27 43 23 37 ndash73 ndash86 ndash91 Mashreq8 48 50 54 188 125 91 ndash67 ndash69 ndash62 Note Data for some countries are based on fiscal years Please refer to Table F in the Statistical Appendix for a list of economies with exceptional reporting periods1Movements in consumer prices are shown as annual averages Year-end to year-end changes can be found in Tables A6 and A7 in the Statistical Appendix2Percent of GDP3Percent National definitions of unemployment may differ4Includes Bahrain Libya and Yemen5Includes Djibouti Mauritania and Somalia Excludes Syria because of the uncertain political situation6Israel which is not a member of the economic region is included for reasons of geography but is not included in the regional aggregates7The Maghreb comprises Algeria Libya Mauritania Morocco and Tunisia8The Mashreq comprises Egypt Jordan and Lebanon Syria is excluded because of the uncertain political situation
61
C H A P T E R 1 G LO b a L P R O s P E C Ts a N D P O L I C I E s
International Monetary Fund | October 2019
Annex Table 115 Sub-Saharan African Economies Real GDP Consumer Prices Current Account Balance and Unemployment(Annual percent change unless noted otherwise)
Real GDP Consumer Prices1 Current Account Balance2 Unemployment3
Projections Projections Projections Projections2018 2019 2020 2018 2019 2020 2018 2019 2020 2018 2019 2020
Sub-Saharan Africa 32 32 36 85 84 80 ndash27 ndash36 ndash38
Oil Exporters4 13 20 24 130 114 114 19 ndash01 ndash03 Nigeria 19 23 25 121 113 117 13 ndash02 ndash01 226 Angola ndash12 ndash03 12 196 172 150 61 09 ndash07 Gabon 08 29 34 48 30 30 ndash24 01 09 Republic of Congo 16 40 28 12 15 18 67 68 53 Chad 24 23 54 40 30 30 ndash34 ndash64 ndash61
Middle-Income Countries5 28 28 29 46 46 52 ndash36 ndash36 ndash39 South Africa 08 07 11 46 44 52 ndash35 ndash31 ndash36 271 279 284Ghana 63 75 56 98 93 92 ndash31 ndash36 ndash38 Cocircte drsquoIvoire 74 75 73 04 10 20 ndash47 ndash38 ndash38 Cameroon 41 40 42 11 21 22 ndash37 ndash37 ndash35 Zambia 37 20 17 70 99 100 ndash26 ndash36 ndash34 Senegal 67 60 68 05 10 15 ndash88 ndash85 ndash111
Low-Income Countries6 62 53 59 76 92 74 ndash70 ndash79 ndash80 Ethiopia 77 74 72 138 146 127 ndash65 ndash60 ndash53 Kenya 63 56 60 47 56 53 ndash50 ndash47 ndash46 Tanzania 70 52 57 35 36 42 ndash37 ndash41 ndash36 Uganda 61 62 62 26 32 38 ndash89 ndash115 ndash105 Democratic Republic of the Congo 58 43 39 293 55 50 ndash46 ndash34 ndash42 Mali 47 50 50 17 02 13 ndash38 ndash55 ndash55 Madagascar 52 52 53 73 67 63 08 ndash16 ndash27
MemorandumSub-Saharan Africa Excluding
South Sudan 32 32 36 82 83 80 ndash27 ndash36 ndash38 Note Data for some countries are based on fiscal years Please refer to Table F in the Statistical Appendix for a list of economies with exceptional reporting periods1Movements in consumer prices are shown as annual averages Year-end to year-end changes can be found in Table A7 in the Statistical Appendix2Percent of GDP3Percent National definitions of unemployment may differ4Includes Equatorial Guinea and South Sudan5Includes Botswana Cabo Verde Eswatini Lesotho Mauritius Namibia and Seychelles6Includes Benin Burkina Faso Burundi the Central African Republic Comoros Eritrea The Gambia Guinea Guinea-Bissau Liberia Malawi Mali Mozambique Niger Rwanda Satildeo Tomeacute and Priacutencipe Sierra Leone Togo and Zimbabwe
62
W O R L D E C O N O M I C O U T L O O K G LO b a L M a N U FaC T U R I N G D OW N T U R N R Is I N G T R a D E b a R R I E R s
International Monetary Fund | October 2019
Annex Table 116 Summary of World Real per Capita Output(Annual percent change in international currency at purchasing power parity)
Average Projections2001ndash10 2011 2012 2013 2014 2015 2016 2017 2018 2019 2020 2024
World 24 30 20 22 23 21 21 25 24 18 23 25
Advanced Economies 11 12 07 09 16 18 12 20 18 13 13 12United States 08 08 15 11 18 22 09 17 23 18 15 11Euro Area1 08 13 ndash12 ndash05 12 18 16 24 18 10 13 12
Germany 10 39 02 02 18 09 14 21 12 05 12 13France 06 17 ndash02 01 04 07 08 20 16 11 10 11Italy ndash02 02 ndash32 ndash23 ndash03 09 13 18 10 02 07 09Spain 08 ndash14 ndash30 ndash13 17 38 32 30 25 17 14 12
Japan 06 ndash03 17 22 05 13 06 21 10 11 08 10United Kingdom 10 08 08 14 22 15 10 12 08 06 09 11Canada 08 21 07 13 18 ndash01 01 17 05 03 08 08Other Advanced Economies2 27 25 13 17 21 14 16 22 19 09 12 17
Emerging Market and Developing Economies 46 48 36 36 32 28 31 33 32 25 33 35
Emerging and Developing Asia 72 67 59 59 58 57 57 56 55 50 51 51China 99 90 74 73 67 64 61 62 62 58 55 53India3 59 52 41 50 60 66 68 58 54 47 56 59ASEAN-54 37 31 47 37 33 36 38 42 41 37 38 42
Emerging and Developing Europe 44 56 27 27 16 04 16 37 29 16 24 24Russia 51 50 35 15 ndash11 ndash24 01 16 23 11 19 20
Latin America and the Caribbean 19 34 17 17 02 ndash09 ndash18 02 01 ndash09 11 19Brazil 25 31 10 21 ndash03 ndash44 ndash41 03 03 02 14 17Mexico 02 24 24 02 17 22 18 11 10 ndash06 04 16
Middle East and Central Asia 22 37 09 04 05 04 28 ndash02 ndash01 ndash12 10 14Saudi Arabia 03 68 25 ndash01 25 17 ndash06 ndash33 00 ndash18 02 05
Sub-Saharan Africa 29 25 15 24 24 04 ndash13 03 06 06 09 15Nigeria 61 21 15 26 35 00 ndash42 ndash18 ndash07 ndash03 ndash01 01South Africa 21 17 07 09 03 ndash03 ndash11 ndash01 ndash07 ndash09 ndash04 02
MemorandumEuropean Union 12 16 ndash06 00 16 21 18 25 20 13 15 14Low-Income Developing Countries 38 36 17 36 37 19 12 24 28 27 29 32Middle East and North Africa 19 61 03 ndash03 ndash02 00 31 ndash11 ndash11 ndash21 08 08
Note Data for some countries are based on fiscal years Please refer to Table F in the Statistical Appendix for a list of economies with exceptional reporting periods1Data calculated as the sum of individual euro area countries2Excludes the G7 (Canada France Germany Italy Japan United Kingdom United States) and euro area countries3See country-specific note for India in the ldquoCountry Notesrdquo section of the Statistical Appendix4Indonesia Malaysia Philippines Thailand Vietnam
63
C H A P T E R 1 G LO b a L P R O s P E C Ts a N D P O L I C I E s
International Monetary Fund | October 2019
ReferencesAbbritti Mirko and Stephan Fahr 2013 ldquoDownward Wage
Rigidity and Business Cycle Asymmetriesrdquo Journal of Monetary Economics 60 871ndash86
Adrian Tobias and Maurice Obstfeld 2017 ldquoWhy Inter-national Financial Cooperation Remains Essentialrdquo IMF Blog March 23
Aiyar Shekhar and Simon Voigts 2019 ldquoThe Negative Mean Output Gaprdquo IMF Working Paper 19183 International Monetary Fund Washington DC
Baker Scott R Nicholas Bloom and Steven J Davis 2016 ldquoMeasuring Economic Policy Uncertaintyrdquo Quarterly Journal of Economics 131 (4) 1593ndash636
Banque Centrale du Luxembourg (BCL) 2019 Bulletin 2019 (2)
Bekaert Geert and Xiaozheng Wang 2010 ldquoInflation Risk and the Inflation Risk Premiumrdquo Economic Policy 25 (64) 755ndash806
Bems Rudolf Robert C Johnson and Key-Mu Yi 2011 ldquoVertical Linkages and the Collapse of Global Traderdquo American Economic Review Papers and Proceedings 101 (3) 308ndash12
British Petroleum (BP) 2019 ldquoStatistical Review of World Energyrdquo https www bp com content dam bp business -sites en global corporate pdfs energy -economics statistical -review bp -stats -review -2019 -full -report pdf
Broadberry Stephen and Bishnupriya Gupta 2006 ldquoThe Early Modern Great Divergence Wages Prices and Economic Development in Europe and Asia 1500ndash1800rdquo The Economic History Review 59 (1) 2ndash31
Caldara Dario and Matteo Iacoviello 2018 ldquoMeasuring Geo-political Riskrdquo International Finance Discussion Papers 1222 Board of Governors of the Federal Reserve System
Caliendo Lorenzo Robert C Feenstra John Romalis and Alan Taylor 2017 ldquoTariff Reductions Entry and Welfare Theory and Evidence for the Last Two Decadesrdquo NBER Working Paper 21768 National Bureau of Economic Research Cambridge MA
Capie Forrest Terence Mills and Geoffrey Wood 2005 ldquoGold as a Hedge against the Dollarrdquo Journal of International Financial Markets 15 (4) 343ndash52
Damgaard Jannick and Thomas Elkjaer 2017 ldquoThe Global FDI Network Searching for Ultimate Investorsrdquo IMF Working Paper 17258 International Monetary Fund Washington DC
De Nederlandsche Bank (DNB) 2019 ldquoStatistical News Release Current Account Surplus Contracts in First Quarterrdquo https www dnb nl en news news -and -archive Statistischnieuws2019 dnb384751 jsp
Dupraz Steacutephane Emi Nakamura and Joacuten Steinsson 2019 ldquoA Plucking Model of Business Cyclerdquo mimeo
Erb Claude and Campbell Harvey 2013 ldquoThe Golden Dilemmardquo NBER Working Paper 18706 National Bureau of Economic Research Cambridge MA
European Central Bank (ECB) 2019 ldquoWhat the Matur-ing Tech Cycle Signals for the Global Economyrdquo ECB Economic Bulletin 32019 https www ecb europa eu pub economic -bulletin focus 2019 html ecb ebbox201903 _01~4e6e0fcef6 en html
Friedman Milton 1964 ldquoMonetary Studies of the National Bureaurdquo In The National Bureau Enters Its 45th Year 44th Annual Report 7ndash25 http www nber org nberhistory annualreports html
mdashmdashmdash 1990 ldquoBimetallism Revisitedrdquo Journal of Economic Perspectives 4 (4) 85ndash104
mdashmdashmdash 1993 ldquoThe Plucking Model of Business Fluctuations Revisitedrdquo Economic Inquiry 31 171ndash77
Green Timothy 2007 The Ages of Gold Mines Markets Merchants and Goldsmiths from Egypt to Troy Rome to Byzantium and Venice to the Space Age GFMS Limited
Gruss Bertrand 2014 ldquoAfter the BoommdashCommodity Prices and Economic Growth in Latin America and the Caribbeanrdquo IMF Working Paper 14154 International Monetary Fund Washington DC
International Monetary Fund (IMF) 2018 ldquoFinal Report of the Task Force on Special Purpose Entitiesrdquo IMF Com-mittee on Balance of Payments Statistics (BOCPOM) BOPCOM-1803 (https www imf org external pubs ft bop 2018 pdf 18 -03 pdf )
mdashmdashmdash 2019 ldquoFiscal Policies for Paris Climate StrategiesmdashFrom Principle to Practicerdquo Policy Paper 19010
Kaya Yoichi and Keiichi Yokobori eds 1997 Environment Energy and Economy Strategies for Sustainability Tokyo United Nations University Press
Kilian Lutz and Xiaoqing Zhou 2019 ldquoOil Prices Exchange Rates and Interest Ratesrdquo Manuscript University of Michigan Michigan https drive google com file d 1SAz _WsNhsHJ5OCxi12HcFyhDYfUjzyw6 view
Lane Philip and Gian Maria Milesi Ferretti 2018 ldquoThe External Wealth of Nations Revisited International Financial Integration in the Aftermath of the Global Financial Crisisrdquo IMF Economic Review 66 (1) 189ndash222
Lopez-Cordova Ernesto and Christopher Meissner 2003 ldquoThe Globalization of Trade and Democracy 1870ndash2000rdquo NBER Working Paper 11117 National Bureau of Economic Research Cambridge MA
Malanima Paolo 2009 Pre-Modern European Economy One Thousand Years (10thndash19th Centuries) Boston Brill
Mian Atif and Amir Sufi 2012 ldquoThe Effects of Fiscal Stimu-lus Evidence from the 2009 Cash for Clunkers Programrdquo Quarterly Journal of Economics 127 (3) 1107ndash142
Mundell Robert A 2002 ldquoThe Birth of Coinagerdquo Columbia University Department of Economics Discussion Paper Series 0102ndash08 New York NY
Newey Whitney and Kenneth West 1987 ldquoA Simple Positive Semi-Definite Heteroskedasticity and Autocorrelation Consistent Covariance Matrixrdquo Econometrica 55 (3) 703ndash08
64
W O R L D E C O N O M I C O U T L O O K G LO b a L M a N U FaC T U R I N G D OW N T U R N R Is I N G T R a D E b a R R I E R s
International Monetary Fund | October 2019
Nieuwenhuis Paul and Peter Wells eds 2015 The Global Automotive Industry John Wiley and Sons
Officer Lawrence 2008 ldquoGold Standardrdquo In The New Palgrave Dictionary of Economics 2501ndash507
Schultz M K Dziczek Y Chen and B Swiechi 2019 US Consumer amp Economic Impacts of US Automotive Trade Policies Center for Automotive Research Ann Arbor Michigan
Setser Brad 2019 ldquo$500 Billion in Dividends Out of the Double Irish with a Dutch Twist (with a Bit of Help from Bermuda)rdquo Blog Council of Foreign Relations August 12
Sjaastad Larry H 2008 ldquoThe Price of Gold and the Exchange Rates Once Againrdquo Resources Policy 33 118ndash24
Smolyansky Michael Gustavo Suarez and Alexandra Tabova 2019 ldquoUS Corporationsrsquo Repatriation of Offshore Profits
Evidence from 2018rdquo FEDS Notes Board of Governors of the Federal Reserve System Washington DC August 6 https doi org 10 17016 2380 -7172 2396
Swiss National Bank (SNB) 2019 ldquoSwiss Balance of Payments and International Investment Position Q4 2018 and Review of the Year 2018rdquo https www snb ch en mmr reference pre _20190325 source pre _20190325 en pdf
Timmer Marcel P Erik Dietzenbacher Bart Los Robert Stehrer and Gaaitzen J de Vries 2015 ldquoAn Illustrated User Guide to the World Input-Output Database The Case of Global Automotive Productionrdquo Review of International Economics 23 (3) 575ndash605
Vilar Pierre 1976 A History of Gold and Money 1450ndash1920 Translated by Judith White London New Left Books
International Monetary Fund | October 2019 65
Subnationalmdashwithin-countrymdashregional disparities in real output employment and productivity in advanced econo-mies have attracted greater interest in recent years against a backdrop of growing social and political tensions Regional disparities in the average advanced economy have risen since the late 1980s reflecting gains from economic concentration in some regions and relative stagnation in others On average lagging regions have worse health outcomes lower labor productivity and greater employ-ment shares in agriculture and industry sectors than other within-country regions Moreover adjustment in lagging regions is slower with adverse shocks having longer-lived negative effects on economic performance Although much discussed trade shocksmdashin particular greater import competition in external marketsmdashdo not appear to drive the differences in labor market performance between lagging and other regions on average By contrast tech-nology shocksmdashproxied by declines in the relative costs of machinery and equipment capital goodsmdashraise unemploy-ment in regions that are more vulnerable to automation with more exposed lagging regions particularly hurt National policies that reduce distortions and encourage more flexible and open markets while providing a robust social safety net can facilitate regional adjustment to adverse shocks dampening rises in unemployment Place-based policies targeted at lagging regions may also play a role but they must be carefully calibrated to ensure they help rather than hinder beneficial adjustment
IntroductionDisparities in economic activity across subnational
regions in the average advanced economy have been gradually creeping upward since the late 1980s undoing some of the marked decline over the previous three decades and mirroring trends in overall income inequality in many advanced economies (Figure 21
The authors of this chapter are John Bluedorn (co-lead) Zsoacuteka Koacuteczaacuten (co-lead) Weicheng Lian Natalija Novta and Yannick Timmer with support from Christopher Johns Evgenia Pugacheva Adrian Robles Villamil and Yuan Zeng The chapter also benefited from discussions with Philip Engler Antonio Spilimbergo and Jiaxiong Yao and from comments from internal seminar participants
panel 1)12 Real GDP per capita in the advanced economy region at the 90th percentile is now on average 70 percent higher than that in the region at the 10th percentile Such a wide disparity means that within-country regional differences in economic activity in a number of advanced economies are larger than the average differences between peer countries (Figure 22) By contrast average subnational regional (simply regional hereafter) disparities in emerging market economies have trended down since 2010 after rising from the early 2000s (Figure 21 panel 3) On average though they remain about double those in advanced economies In parallel the average speed of regional convergence in advanced economies has slowed to less than one-half percent per year while picking up to more than 1 percent in emerging market economies (Figure 21 panels 2 and 4)
Slowing regional convergence and rising dispari-ties in some advanced economies alongside regional labor market and productivity developments have attracted much interest in recent years in part because of evidence that poor regional performance within a country can fuel discontent and political polarization erode social trust and threaten national cohesion3
1For evidence on trends in overall income inequality in advanced economies see Dabla-Norris and others (2015) the October 2017 Fiscal Monitor and Nolan Richiardi and Valenzuela (2019) among others Immervoll and Richardson (2011) argues that declining fiscal redistribution accounts for some of this rise
2Subnational regions are the TL2 regions as defined in OECD (2018) unless otherwise indicated These are typically the first-level administrative units within a country corresponding roughly to US states or German Laumlnder Consequently the geographic extents of TL2 regions are not homogenous across or within countries Alterna-tive geographic aggregates (for example higher resolution areal or metropolitan aggregates or different administrative classifications) may generate different findings Subnational regional real GDP per capita is purchasing power parity (PPP) adjusted for cross-country comparability although not adjusted for within-country regional price differences Box 21 discusses some of the issues with measur-ing regional real GDP per capita and its link to welfare
3See Algan and Cahuc (2014) and Guriev (2018) on social trust regional performance and rising political polarization Looking at Europe Winkler (2019) presents evidence that regional income inequality engenders greater political polarization in regions Rajan (2019) argues that lack of attention to peripheral regions is fostering despair and a backlash destabilizing societies
CLOSER TOGETHER OR FURTHER APART WITHIN-COUNTRY REGIONAL DISPARITIES AND ADJUSTMENT IN ADVANCED ECONOMIES2CH
APTE
R
W O R L D E C O N O M I C O U T L O O K G LO b a L M a N U FaC T U R I N G D OW N T U R N R Is I N G T R a D E b a R R I E R s
66 International Monetary Fund | October 2019
More generally a recurring theme in the latest eco-nomic research is that local conditions play an essential role in shaping individual opportunities and social mobilitymdashin other words place can be primal4
Aside from their political and social ramifica-tions are disparities in regional economic activity a macroeconomic concern To be sure increases in
4For example see Chetty and Hendren (2018a 2018b) on how place-of-birth has profound and long-lasting effects on an individualrsquos lifetime economic opportunities even accounting for family background and other influences Durlauf and Seshadri (2018) argues that causation flows from economic inequality to lower social mobility rather than the reverse Drawing on other evidence from the United States Chetty Hendren and Katz (2016) contends that geographic mobility is a key means by which social mobilitymdashimproved lifetime incomes and opportunitiesmdashcan be achieved See also Conolly Corak and Haeck (2019) for similar analyses and evidence from Canada
Subnational regional disparities in the average advanced economy have risen over the past three decades while regional convergence has slowed Disparities in emerging market economies are typically larger but have been coming down while within-country average convergence has picked up
Figure 21 Subnational Regional Disparities and Convergence over Time
20
25
30
35
40
45
1980 90 2000 10 16
ndash05
00
05
10
15
20
1970 80 90 2000 10 1612
14
16
18
20
22
1950 60 70 80 90 2000 10 16
ndash05
00
05
10
15
20
2000 04 08 12 16
Average 9010 Ratio of RegionalReal GDP per Capita
(Ratio)
Average Speed of RegionalConvergence
(Percent)
1 Advanced Economies 2 Advanced Economies
3 Emerging MarketEconomies
4 Emerging MarketEconomies
Sources Gennaioli and others (2014) Organisation for Economic Co-operation and Development Regional Database and IMF staff calculationsNote The regional 9010 ratio for a country is defined as real GDP per capita in the region at the 90th percentile of the countryrsquos regional real GDP per capita distribution over that of the region at the 10th percentile The solid line in panels 1 and 3 shows the year fixed effects from a regression of regional 9010 ratios from the indicated sample on year fixed effects and country fixed effects to account for entry and exit during the period and level differences in the 9010 regional GDP ratios Blue shaded areas indicate the associated 90 percent confidence interval Panels 2 and 4 show the coefficient on initial log real GDP per capita from a cross-sectional regression of average real purchasing power parity GDP per capita growth on initial log real GDP per capita estimated over 20-year rolling windows (plotted at the last year of the window) The regression includes country fixed effects so it indicates average within-country regional convergence The coefficient is expressed in annualized terms indicating the average annual speed of convergence See Online Annex 21 for the country samples
Many advanced economies have larger within-country regional disparities than exist between advanced economies
04
08
12
00
16
Sources Organisation for Economic Co-operation and Development Regional Database and IMF staff calculationsNote The figure plots the kernel density of the country-level regional 9010 ratio across advanced economies (the ratio of real GDP per capita PPP-adjusted of the 90th percentile subnational region to the 10th percentile subnational region calculated for each country) The vertical line indicates the national 9010 ratio within the same group of advanced economies (that is the ratio of real GDP per capita PPP-adjusted of the country at the 90th percentile to the country at the 10th percentile) Selected countriesrsquo positions in the distribution are indicated by their International Organization for Standardization (ISO) codes and corresponding regional 9010 value in parentheses See Online Annex 21 for the country sample PPP = purchasing power parity
Regional 9010 ratio of real GDP per capita
Figure 22 Distribution of Subnational Regional Disparities in Advanced Economies(Density 2013)
10 14 18 22 26 30 34 38
9010 ratio for AEs(USASlovak Republic)
CZE (276) SVK (362)
CAN (209)
ITA (201)
USA (170)
CHAPTER 2 C LO s E R TO G E T H E R O R F U RT H E R a Pa RT W I T H I N - CO U N T Ry R E G I O N a L D I s Pa R I T I E s a N D a DJ U s TM E N T I N a DVa N C E D E CO N O M I E s
67International Monetary Fund | October 2019
disparities between regions of a country can be a normal feature of growth Increasing specialization and agglomerationmdashthe phenomenon in which the increasing spatial density of economic activity makes trade and exchange more efficientmdashcan boost produc-tivity and lead to a greater concentration of economic activity in some regions within a country causing them to pull away from others5 Growth in core regions can nonetheless eventually spread outward to peripheral regions generating catch-up6
However persistently large or increasing regional disparities can also be a sign that some regions are not adjusting to changing economic circumstances and are falling behind Failure to adjust to adverse shocksmdashcontributing to high regional unemployment and per-sistent shortfalls in productivitymdashcould reflect barriers to labor and capital moving to regions and firms where their returns would be higher Indeed long-term unem-ployment rates tend to be higher in worse-performing regions within advanced economies suggesting some persistent inefficiencies may be at work (Figure 23)
Consistent with the notion that regional disparities can drive social and political discontent lagging regions in advanced economiesmdashthose failing to converge toward richer regions of the same country over the past couple of decadesmdashtend to do worse than other regions on average on key measures of well-being including health human capital and labor market outcomes (Figure 24)7 The age profiles of populations in lagging regions may explain part of their overall lower employ-ment ratemdashlagging regions have significantly lower
5The underlying impetus for these dynamics may be simple geography (less costly access to trading partners and inputs) natural resource booms or the persistent effects of historical factors See Krugman (1991) Davis and Weinstein (2002) Duranton and Puga (2004) Moretti (2011) and Nunn (2014) for further discussion of these mechanisms and drivers
6See Coe Kelly and Yeung (2007) and WB (2009) for evidence on these spillovers
7Specifically lagging regions are defined as those whose real GDP per capita in 2000 was below the countryrsquos regional median and whose growth was slower than the countryrsquos average from 2000ndash16 Similar patterns for human capital and labor market outcomes also hold if lagging regions are defined by predetermined criteria such as below median initial real GDP per capita and initial service sector employment share Nunn Parsons and Shambaugh (2018) finds that US counties that had initially low human capital were less diversified in production and were more dependent on manufacturing had worse health income and labor market outcomes It is important to note that the findings for lagging regions hold on average it is possible for a given region to differ from that average behavior Moreover due to data availability constraints as noted the classification is based on real GDP per capita data from 2000ndash16 See Online Annex 21 for further details All annexes are available at wwwimforgenPublicationsWEO
prime age (ages 25ndash54) population shares and skew significantly younger (under age 25) than other regions But these demographic characteristics are not the com-plete story for lagging regions as seen by their higher overall unemployment rate and higher youth inactivity rate (share of youth not in employment education or training) on average Given the importance of employment status for life satisfaction independent of its effect on income improving regional labor market performance can generate welfare gains beyond those that can be achieved through income redistribution8
Motivated by these considerations and taking into account the greater recent rise in disparities in advanced economies alongside data availability constraints this chapter examines regional disparities and labor market adjustment in advanced economies with a focus on the
8See Clark and Oswald (1994) Gruumln Hauser and Rhein (2010) and Clark (2018) among others for evidence on the positive link between employment and happiness independent of income and job quality
0
1
2
3
4
5
6
7
Long
-ter
m u
nem
ploy
men
t rat
e (p
erce
nt)
Regional long-term unemployment rates tend to be higher where economic activity per person is lower suggesting the existence of greater inefficiencies in lagging regions
100 102 104 106 108 110 112Log real GDP per capita
Figure 23 Subnational Regional Unemployment and Economic Activity in Advanced Economies 1999ndash2016
Sources Organisation for Economic Co-operation and Development Regional Database and IMF staff calculationsNote The figure illustrates the regression slope for the relationship between regional long-term unemployment rates and log regional real GDP per capita after controlling for country-year fixed effects Dots show the binned underlying data from the regression based on the method from Chetty Friedman and Rockoff (2014) See Online Annex 21 for the country sample
W O R L D E C O N O M I C O U T L O O K G LO b a L M a N U FaC T U R I N G D OW N T U R N R Is I N G T R a D E b a R R I E R s
68 International Monetary Fund | October 2019
characteristics and dynamics of lagging regions since 2000 It also explores whether differences in national policies related to labor and product market functioning influence regional disparities and adjustment Specifi-cally the chapter investigates the following questions bull How different are advanced economies in the extent
of their regional disparities in economic activity How do regional differences in sectoral production account for variation in labor productivity across regions within countries How do lagging regions compare with other regions in their sectoral mix of employment and productivity How effective have lagging regions been in responding to trends in the sectoral reallocation of labor
bull What are the regional labor market effects of local labor demand shocksmdashin particular trade and technology shocksmdashin advanced economies Is adjustment to these shocks in lagging regions different from that in other regions
bull Do national policies and distortions play a role in regional disparities and adjustment in advanced economies
The chapterrsquos main findings are the following bull The extent of regional disparities differs markedly
across advanced economiesmdashwith the 9010 ratios for regional real GDP per capita ranging from about 13 to more than 3 Underlying these disparities are regional differences in sectoral labor productivities and the sectoral employment mix with lagging regions on average being systematically less produc-tive and more specialized in agriculture and industry
o Intrinsic sectoral productivity differences across regions tend to drive most regional labor produc-tivity differences within a country But for lagging regions the employment mix matters more than it does for other regions
o Even controlling for differences in trends across countries lagging regionsrsquo employment is more concentrated in agriculture (suggesting that some are more rural) and industry and less in services Moreover labor productivity across sectors is sys-tematically lower in lagging regions than in others
o From the early 2000s to the mid-2010s one-third of the increase in the overall labor productivity gap between lagging and other regions appears to have reflected relatively ineffective sectoral labor market adjustment in lagging regions with the rest attributed to growing sectoral productivity differences
ndash2
ndash1
0
1
2
3
4
5
Depe
nden
cy ra
tio
Loss
of l
ife e
xpec
tanc
y (y
ears
)
Infa
nt m
orta
lity
(per
10
00 li
ve b
irths
)
Yout
h (1
5ndash24
) sha
re o
f WAP
Prim
e (2
5ndash54
) sha
re o
f WAP
Olde
r (55
ndash64)
sha
re o
f WAP
Belo
w-t
ertia
ry e
duca
tion
shar
e of
labo
r for
ce
Terti
ary
unde
r-en
rollm
ent
None
mpl
oym
ent r
ate
Labo
r for
ce n
onpa
rtici
patio
n ra
te
Unem
ploy
men
t rat
e
Long
-ter
m u
nem
ploy
men
t rat
e
Yout
h un
empl
oym
ent r
ate
NEET
rate
Demographics and health Labor marketEducation andhuman capital
Sources Organisation for Economic Co-operation and Development Regional Database and IMF staff calculationsNote Bars show the difference in lagging regions versus other regions for each of the variables Results are based on regressions of each variable on an indicator for whether a region is lagging or not controlling for country-year fixed effects and with standard errors clustered at the country-year level Solid bars indicate that the estimated coefficient on the lagging indicator is statistically significant at the 10 percent level Variables are defined so that positive estimated coefficients indicate worse performance by lagging regions Tertiary under-enrollment is the difference in the percent of population enrolled in tertiary education in other regions versus lagging regions The nonemployment rate is defined as 100 minus the employment rate (in percent) The labor force nonparticipation rate is defined as 100 minus the labor force participation rate of the working-age (ages 15ndash64) population (in percent) The unemployment rate is the share of the working-age labor force that is unemployed The long-term unemployment rate is the share of the working-age labor force that has been unemployed for one year or more The youth unemployment rate is the share of the youth (ages 15ndash24) labor force that is unemployed The NEET rate is the percent of the youth population that is not in education employment or training Lagging regions are defined as those with real GDP per capita below their country median in 2000 and with average growth below the countryrsquos average over 2000ndash16 NEET = not in education employment or training WAP = working-age population See Online Annex 21 for the country sample
Figure 24 Demographics Health Human Capital and Labor Market Outcomes in Advanced Economies Lagging versus Other Regions(Percentage point difference unless otherwise noted)
Lagging regions tend to have worse health education and labor market outcomesthan other regions
CHAPTER 2 C LO s E R TO G E T H E R O R F U RT H E R a Pa RT W I T H I N - CO U N T Ry R E G I O N a L D I s Pa R I T I E s a N D a DJ U s TM E N T I N a DVa N C E D E CO N O M I E s
69International Monetary Fund | October 2019
bull Adverse trade and technology shocks affect more exposed regional labor markets but only technology shocks tend to have lasting effects with even larger unemployment rises for vulnerable lagging regions on average
o Increases in import competition in external markets associated with the rise of Chinarsquos pro-ductivity do not have marked effects on regional unemployment although labor force participation falls in the near term but quickly abates Condi-tions in lagging regions do not look very different from other regions after such shocks
o By contrast differences in vulnerability to automa-tion across regions translate into noticeable differ-ences in labor market responses to capital goods prices When machinery and equipment prices fall more vulnerable regions see more persistent rises in unemployment and declines in labor force participa-tion than do less vulnerable regions More vulnerable lagging regions have even larger rises in unemploy-ment rates Out-migration from more vulnerable lagging regions also appears to drop suggesting that adjustment to technology shocks through labor mobility may be weaker in lagging regions that are more vulnerable to automation pressures
bull National structural policies that encourage more open and flexible markets are associated with improved regional adjustment to shocks and a lower dispersion of firmsrsquo efficiencies in allocating capital which may narrow regional disparities
o Less stringent employment protection regulations and less generous unemployment benefits are associated with milder unemployment effects of trade and technology shocks
o National policies that encourage more open and flexible product markets are associated with lower variability in firmsrsquo capital allocative efficiencies which is associated with lower regional disparities
This chapter documents patterns and associa-tions between regional disparities and adjustment and national policies in advanced economies This is intended to help inform debate and discussion complementing the vast literature examining regional differences on a country-by-country basis9 Much of
9For a selection of work examining or leveraging regional eco-nomic differences in specific countries see for example Kaufman Swagel and Dunaway (2003) and Breau and Saillant (2016) on Canadian provincial differences Bande Fernaacutendez and Montuenga (2008) IMF (2018) and Liu (2018) on Spanish regional differences
the chapterrsquos analysis focuses on the relatively short period since 2000 for which broad cross-country regional data are available enabling a look at labor market adjustment but precluding study of longer-term regional development dynamics Furthermore regions in the analysis are typically defined as countriesrsquo first-level administrative units which are economically and politically meaningful within countries and for which good data coverage is available (see also footnote 2) However this means that regions as diverse in size as Texas and Rhode Island in the United States are pooled together despite the very different potential extents of their within-region markets for adjustment Although the analysis attempts to account for this diversity through the inclusion of a variety of controls alternative levels of geographic aggregation could gen-erate different findings Robustness checks are under-taken to confirm that the stylized facts and analysis results hold excluding capital-intensive resource-rich regions Finally given that national policies may be affected by many different variables their estimated effects on regional adjustment should be interpreted as associational rather than causal
Although regional differences in economic activity and labor market outcomes are substan-tial within advanced economies analysis of overall household-level inequality in disposable incomes at the country-level suggests that its regional component is small (Figure 25 see also Box 21 for a discussion of the measurement of regional economic activity and welfare)10 For the subset of advanced economies and years since 2008 for which the decomposition can be calculated the regional component of household disposable income inequality ranges from less than 1 percent in Austria to about 15 percent in Italy This means that for advanced economies further reducing differences in average disposable income across regions would typically have only moderate effects on income inequality in a country However there are some important exceptions If for example average regional differences were eliminated in Italy its income inequal-ity could drop to levels seen in the early 1990s which
Felice (2011) Giordano and others (2015) and Boeri and others (2019) on Italian regional differences
10See Shorrocks and Wan (2005) Novotnyacute (2007) and Cowell (2011) which come to broadly similar conclusions with alter-native personal income concepts and multiple decomposable income inequality metrics A similar finding holds using pretax and pretransfer household income Note that household disposable income differs from GDP in that it incorporates factor income flows tofrom elsewhere and the effects of fiscal redistribution
W O R L D E C O N O M I C O U T L O O K G LO b a L M a N U FaC T U R I N G D OW N T U R N R Is I N G T R a D E b a R R I E R s
70 International Monetary Fund | October 2019
were the lowest since the 1970s11 But as discussed above reducing regional disparities and improving performance in economic activity and employment can have important consequences beyond current income Moreover some evidence indicates that countries with larger regional disparities may experience lower long-term growth (Che and Spilimbergo 2012)
The chapter begins with a brief discussion of how to think about regional development and adjustment The subsequent section presents evidence on patterns
11Based on the historical path of Italyrsquos Gini coefficient from Atkinson and others (2017) and the assumption that the Gini would decline in proportion to the decline in the mean log deviation or generalized entropy index (Theilrsquos L which is a decomposable income inequality measure) if the regional component were eliminated
of regional disparities in advanced economies and how lagging regions differ from others Then the regional responses to local labor demand shocks arising from trade and technology shocks are examined focusing on how lagging regions differ and how national labor market policies may influence regional adjustment The chapter then presents some evidence on labor mobility and the effects of national policies on regional disparities in the effectiveness of factor reallocation Finally a sum-mary and concluding thoughts consider the potential implications for policies including place-based policies
Regional Development and Adjustment A Primer
As in the large body of literature on the drivers of cross-country economic differences the causes of persistent regional disparities within countries are hotly debated12 However unlike countries regions within a country are typically subject to the same overarching institutional structure (both political and economic) and common national policies with free exchange of goods and services and no legal impediments to the move-ments of capital and labor across the country13 Under perfectly competitive output and input markets and no market frictions (such as barriers to cross-regional factor movements) capital and labor would flow within and across regions to equalize marginal returns of capital and
12The development accounting framework (Caselli 2005 Hsieh and Klenow 2010) is often used to organize the potential drivers of regional differences within a country into proximate (physical capital labor and human capital and total factor productivity) and other intermediate and ultimate determinants (such as policies culture institutions geography climate luck) Based on the analysis of global samples Acemoglu and Dell (2010) and Gennaioli and others (2013 2014) argue for the critical importance of human capital for development Lessmann and Seidel (2017) also points to the importance of mobility and trade openness for regional development Hsieh and Moretti (2019) contends that economies arising from regional agglomeration are substantial and that regional zoning restrictions lowered US aggregate output growth by one-third from the 1960s through the 2000s Rodriacuteguez-Pose and Storper (2019) pushes back against Hsieh and Morettirsquos (2019) contention arguing that housing price differences across regions are not the primary drivers of regional migration Rodriacuteguez-Pose and Ketterer (forthcoming) asserts that regional differences in governance quality within-country lead to persistent differences in regional development and performance See also OECD (2016b 2018) for further analysis and evidence on broad patterns and drivers of persistent regional disparities across a wide range of countries
13There are exceptionsmdashoften in federal statesmdashwhere free exchange and movement within countries are inhibited For exam-ple Canadian provinces and territories differ in their standards and regulations for some goods and services de facto restricting interpro-vincial trade (Alvarez Krznar and Tombe 2019)
Within regionsBetween regions
OverallGini
DNK
SVK
FIN
CZE
CHE
AUT
DEU
FRA
CAN
AUS
ESP
IRL
GRC
ITA
GBR
EST
USA
ISR
00
01
02
03
04
Sources Luxembourg Income Study and IMF staff calculationsNote The overall index shown is the generalized entropy index also known as Theilrsquos L or the mean log deviation index of inequality The income measure used is equivalized household disposable income (household income after tax and transfers transformed to account for household size differences) by country in the latest available year after 2008 The height of the bar indicates the overall level of the income inequality index which is then decomposed into two components (1) inequality attributable to average income differences across regions (the between component) and (2) inequality attributable to income differences across households within regions after adjusting for average regional income differences (the within component) The Gini index of income inequality is also shown for comparison as a more familiar inequality measure (but that is not decomposable) Data labels use International Organization for Standardization (ISO) country codes
The regional component of income inequality in most advanced economies is relatively small accounting for only about 5 percent of overall country inequality on average
Figure 25 Inequality in Household Disposable Income within Advanced Economies(Indexes)
CHAPTER 2 C LO s E R TO G E T H E R O R F U RT H E R a Pa RT W I T H I N - CO U N T Ry R E G I O N a L D I s Pa R I T I E s a N D a DJ U s TM E N T I N a DVa N C E D E CO N O M I E s
71International Monetary Fund | October 2019
labor within a country even if differences in regional total factor productivity were persistent For instance workers would move to regions with the highest returns to labor and hence wages pushing down wages in the destination region over time At the same time lower labor supply in source regions where wages are relatively low would in turn help raise wage rates there facilitating convergence of labor productivities
Nonetheless such an efficient allocation of factors across regions can be consistent with differences in regional real GDP per capita if for example labor is differentiated by skill level14 In practice though markets may be neither perfectly competitive nor friction-free across regions leading to diminished efficiency misallocation of factors across regions and hampered adjustment to shocks Labor mobility may be constrained or evident only among the highly skilled leading to more persistent regional unemploy-ment in response to adverse shocks15
The propensities for economic activity to cluster in space (agglomeration economies) and for productivity to rise with the density of skilled workers (human capital externalities) can also generate divergence if differences in production costs and the concentration of skills across regions are large enough16 Although these fea-tures may suggest the presence of market failures (that is inefficient barriers to regions growing even more concentrated) their implications for optimal policies are ambiguous17 Overall social welfare could actually be larger if lagging regions were given help to create their own virtuous cycles of growing agglomeration econo-mies rather than be depopulated through population shifts to leading regions Given these ambiguities and
14For example if labor and human capital are differentiated (such as high skilllow skill) then total factor productivity differences may entail differences in the human capital composition of the workforce affecting output per worker If technology differs across regions this may also lead to differences in output per worker across regions even if marginal returns to factors are equalized
15See Kim (2008) and Duranton and Venables (2018) for evi-dence and arguments
16See Krugman and Venables (1995) Fujita Krugman and Venables (1999) and Gennaioli and others (2013) on how increas-ing returns from agglomeration economies and human capital externalities can manifest in spatial economic models
17See Austin Glaeser and Summers (2018) for further discussion of the ambiguous implications of agglomeration economies As noted earlier Hsieh and Moretti (2019) argues that housing and zoning restrictions present substantial barriers to beneficial agglomeration in the United States lowering welfare and increasing spatial wage disper-sion However Giannone (2018) suggests that the bulk of the increase in spatial wage dispersion in the United States over the past 40 years is due to skill-biased technological change rather than agglomeration
the more general difficulty of quantifying the relative importance of efficient versus inefficient allocation in driving regional disparities the chapter focuses on lag-ging regions and their characteristics and adjustment
Patterns of Regional Disparities in Advanced Economies
The extent of regional disparities in economic activity varies widely across advanced economies (Figure 26) For example Japanrsquos regional differences are relatively narrow with real GDP per capita of the region at the 90th percentile only about 30 percent higher than
FRA
JPN
CHE
KOR
GBR
GRC
FIN
NZL
PRT
USA
SWE
NLD
ESP
AUT
DEU
DNK
NOR
ITA
AUS
CAN
CZE
SVK
AE c
ount
ry le
vel0
50
100
150
200
250
300
350
The extent of regional disparities differs widely across advanced economies
Sources Organisation for Economic Co-operation and Development (OECD) Regional Database and IMF staff calculationsNote P10(50 90) indicates the 10(50 90)th percentile of the regional real GDP per capita (purchasing power parity-adjusted) distribution within the country Countries are sorted by the ratio of the within-country 90th percentile to the 10th percentile of regional real GDP per capita Regional medians (P50) by country are normalized to 100 with other percentiles and the maximum and minimum shown relative to the median by country Underlying regions are OECD territorial level 2 entities The sample includes 22 advanced economies (all countries with four or more regions) The AE country level shows the corresponding quantiles calculated over the country-level sample of advanced economies AE = advanced economies Data labels use International Organization for Standardization (ISO) country codes
Figure 26 Subnational Regional Disparities in Real GDP per Capita(Ratio to regional median times 100 2013)
Min P10 P90 Max
W O R L D E C O N O M I C O U T L O O K G LO b a L M a N U FaC T U R I N G D OW N T U R N R Is I N G T R a D E b a R R I E R s
72 International Monetary Fund | October 2019
that of the 10th percentile region France has a similar 9010 ratio but with a notable better-performing outlier region (centered on the capital Paris) that has about double the real GDP per capita of the median French region The United States has a 9010 ratio which is about average for advanced economies but it also shows greater dispersion in the tails of the distribu-tion with even more extreme regional outcomes than average (the District of Columbiarsquos regional real GDP per capita is more than three times that of the median US region while Mississippirsquos is about one-third lower than the median) Among the advanced economies with larger regional differences are Canada and Italy with 9010 ratios at about 2
Regional labor productivitymdashoutput per workermdashis closely related to regional real GDP per capita A shift-share analysis of regional labor productivity provides insights into the relative importance of differences in sectoral labor productivities sectoral employment shares and the allocation of workers to more or less productive sectors in accounting for regional dis-parities within a country (Figure 27)18 For most advanced economies the bulk of regional variation in labor productivity appears to be due to sectoral labor productivity differences across regions rather than the sectoral employment mixmdashin other words intrinsic sectoral productivity differences across regions tend to be the most important However Greece Italy Korea and Portugal are notable examples in which other components explain the overall regional variation In these cases simply reallocating regional employment across sectors (holding sectoral productivity differences constant) could substantially lower regional variability in labor productivity
The greater presence of lagging regions does not appear to be systematically related to differences in the drivers of regional variation across countries About 20 percent of regions in advanced economies are clas-sified as lagging with the distribution differing across countries That said analysis suggests that the sectoral employment mix has been more influential in driving regional differences for lagging regions compared to others consistent with the view that labor markets in lagging regions may be reallocating employment across sectors less effectively than other regions19
18For the variance decomposition of the shift-share analysis there is an additional fourth term equal to the sum of the covariances across the three components described here See Esteban (2000) and Online Annex 23 for further details on the calculation
19See Online Annex 23 for further details
Lagging regions also have significantly lower labor productivities across sectors than do other regions (Figure 28 panel 1) These range from about 5 percent less in public services to about 15 percent less in industry and finance and professional services This lower productivity for lagging regions could reflect a mix of poorer characteristics such as lower human capitalmdashsomething highlighted as essential in much work on regional development including Acemoglu and Dell 2010 and Gennaioli and others 2013 2014mdashand less efficient labor allocation across sectors It may also reflect poorer quality of complements to labor in lagging regions such as connective infrastructure which has been identified as important in development in some
Productivity differential Sectoral employment mixAllocative Covariance
GRC
ITA
NOR
FRA
GBR
PRT
AUT
FIN
NZL
NLD
CZE
ESP
DNK
USA
KOR
CAN
SWE
AUS
ndash10
ndash05
00
05
10
15
20
Sources Organisation for Economic Co-operation and Development (OECD) Regional Database and IMF staff calculationsNote The figure illustrates the shift-share analysis and variance decomposition for regional differences by country from Esteban (2000) sorted according to the share of the overall average regional variance explained by regional productivity differentials across sectors For further details see Online Annex 23 The sample includes 18 advanced economies (all countries with five or more regions at the OECD territorial level 2) from 2003ndash14 For all countries the 10-sector ISIC Revision 4 classification of the OECD regional database is used (see Online Annex 21 for details) Bars sum up to 1 (overall average regional variance by country) Data labels use International Organization for Standardization (ISO) country codes
Figure 27 Shift-Share Variance Decomposition by Country 2003ndash14(Share of overall average regional variance)
For most advanced economies much of the regional variation in labor productivity can be attributed to differences in sector productivity across regions
CHAPTER 2 C LO s E R TO G E T H E R O R F U RT H E R a Pa RT W I T H I N - CO U N T Ry R E G I O N a L D I s Pa R I T I E s a N D a DJ U s TM E N T I N a DVa N C E D E CO N O M I E s
73International Monetary Fund | October 2019
studies (Allen and Arkolakis 2014 Donaldson and Hornbeck 2016) Box 22 presents evidence that local climate also plays a role and that climate change may exacerbate differences in productivity between lagging and other regions in advanced economies
In addition to being less productive lagging regions on average are also significantly likelier to have employment more concentrated in agriculture and industry than in services including the high productivity growth service sectors of information technology and communications and finance (Figure 28 panel 2) In other words lagging regions on average tend to be more rural and have employment more reliant on sectors with lower potential for productivity growth20
A simple counterfactual exercise supports the view that sectoral labor allocation plays an important role in the relative performance of regions (Figure 29) In advanced economies from 2002 to 2014 the average labor productivity of lagging regions as a percentage of the labor productivity of other regions declined by about 5 percent reflecting the evolution of both sectoral labor productivities and employment shares If only sectoral labor productivity changes were oper-ative with no change in employment shares the ratio would still have declined but by about one-third less than it did In other words rather than mitigating the relative decline in overall labor productivity for lagging regions the shift in sectoral labor allocation appears to have exacerbated it
Regional Labor Market Adjustment in Advanced Economies
To get a better sense of how differences in regional performance may reflect differences in shocks and responses to shocks the chapter investigates the effects of adverse local labor demand shocks on regional unemployment and migration21 If sectoral
20See Chapter 3 of the April 2018 World Economic Outlook (WEO) for how structural change in advanced economies and the (in)ability to shift into highly productive service sectors may impact inequality
21There has been a host of work in this vein inspired by Blanchard and Katzrsquos (1992) early work on US regional labor market dynamics and convergence Decressin and Fataacutes (1995) contrasts US and European regional dynamics finding less of a common com-ponent for employment and less migration in response to shocks in Europe More recently Dao Furceri and Loungani (2017) updates the analysis by Blanchard and Katz (1992) for the United States with improved and more recent data finding that labor mobility has declined
1 Labor Productivity(Percent difference)
2 Employment Share(Percentage point difference)
Sources Organisation for Economic Co-operation and Development Regional Database and IMF staff calculationsNote Lagging regions in a country are defined as those with real GDP per capita below the countryrsquos regional median in 2000 and with average growth below the countryrsquos average over 2000ndash16 Panel 1 shows the estimated difference in sectoral labor productivity in lagging versus other regions All models control for country-year fixed effects with standard errors clustered at the country-year level Solid bars indicate statistical significance at the 10 percent level while hollow bars do not Panel 2 shows the estimated difference in sectoral employment shares between lagging and other regions High productivity service sectors are finance and insurance information technology and communications and real estate All other service sectors are low-productivity service sectors See Online Annex 21 for the country sample
Lagging regions tend to have lower labor productivity across sectors and higher shares of employment in agriculture and industry sectors with lower shares of employment in services
Figure 28 Sectoral Labor Productivity and Employment Shares Lagging versus Other Regions
ndash20
10
ndash15
ndash10
ndash5
0
5
Indu
stry
Cons
truct
ion
Agric
ultu
re
Trad
e
Info
rmat
ion
tech
nolo
gyan
d co
mm
unic
atio
ns
Fina
nce
and
insu
ranc
e
Real
est
ate
Prof
essi
onal
ser
vice
s
Publ
ic s
ervi
ces
Othe
r ser
vice
s
ndash3
2
ndash2
ndash1
0
1
Agric
ultu
re
Indu
stry
Cons
truct
ion
Low
-pro
duct
ivity
ser
vice
s
High
pro
duct
ivity
ser
vice
s
W O R L D E C O N O M I C O U T L O O K G LO b a L M a N U FaC T U R I N G D OW N T U R N R Is I N G T R a D E b a R R I E R s
74 International Monetary Fund | October 2019
labor reallocation in a region functions effectively regional unemployment and participation should be largely shielded from adverse shocks while migration flows and within-region sectoral employment shifts to absorb them The critical insight that regional differences in the preexisting sectoral employment mix translate into regional differences in exposure to external shocks enables region-level shocks to be constructed22 Two particular types of local labor demand shocks are considered They attempt to
22First conceptualized and used by Bartik (1991) this insight for the construction of plausibly exogenous regional shocks based on preexisting regional differences in exposure to aggregate drivers was then popularized in the field of regional development and adjustment by Blanchard and Katz (1992) and for trade by Topalova (2010) Goldsmith-Pinkham Sorkin and Swift (2019) presents a critical evaluation of these kind of instruments
capture some of the much-discussed drivers of trade and technology23
bull A shock from increased import competition in external markets that is associated with the rise of Chinarsquos pro-ductivity (Autor Dorn and Hanson 2013a 2013b)24
bull A shock based on the interaction between a regionrsquos vulnerability to automation and the costs of machin-ery and equipment capital goods (building upon Autor and Dorn 2013 Chapter 3 of the April 2017 WEO Das and Hilgenstock 2018 and Lian and others 2019)
In general the findings point to regional labor markets having sluggish adjustment and reallocation in response to negative shocks in advanced economies25 Moreover even though the incidence of these shocks is actually somewhat lower for lagging than other regions (see Online Annex 25) some evidence detailed below suggests that lagging regions do suffer more in response to some shocks
Shocks from increasing import competition in exter-nal markets from Chinarsquos economic rise do not have marked average effects on regional unemployment in a broad sample of advanced economies although they do tend to reduce labor force participation after one year but this quickly abates (Figure 210) The responses of
23For recent work on the roles of trade and technology in driving disparities and other trends see Jaumotte Lall and Papageorgiou (2013) Karabarbounis and Neiman (2014) Dabla-Norris and others (2015) Autor Dorn and Hanson (2015) Helpman (2016) Abdih and Danninger (2017) Dao and others (2017) and Chapter 2 of the April 2018 WEO among others
24Although the trade shock associated with Chinarsquos rising produc-tivity has been well studied it is by no means the only trade shock for advanced economies In general advanced economies have faced increasing competition as emerging market economies have become more productive and engaged in international markets
25See Online Annex 25 for further details on the construction of the shocks and the regression model specification and estimation The dynamic responses of regional unemployment and labor force participation rates and inward and outward migration are estimated using the local projection method (Jordagrave 2005) controlling for lagged regional real GDP per capita lagged regional population density (helping to capture the degree of urbanization) lagged country real GDP per capita and region-specific and year fixed effects Although the analysis controls for many regional character-istics through region-specific fixed effects (capturing time-invariant characteristics of regions including geography and membership in a federation) and lagged regional real GDP per capita (proxying for many aspects of regional development) unobserved time-varying regional variables such as the extent of cross-regional fiscal redistri-bution may also impact adjustment and reallocation The findings therefore represent the average effects of the shocks within the sample given the existing distribution of unobservables Changes in the distribution of unobservables could entail changes in the effects of the shocks
The overall productivity difference between lagging and other regions has grown with about one-third due to poor allocation of labor across sectors and the rest to worsening sectoral productivity differences
Figure 29 Labor Productivity Lagging versus Other Regions(Ratio)
Sources Organisation for Economic Co-operation and Development Regional Database IMF staff calculationsNote Bars show the average country ratio of labor productivity (defined as real gross value-added per worker) in lagging regions to that of other regions in 2002 and 2014 across advanced economies In the counterfactual scenario sectoral employment shares are held constant at their 2002 levels while sectoral productivities are set at their realized values Lagging regions in a country are defined as those with real GDP per capita below the countryrsquos regional median in 2000 and with average growth below the countryrsquos average over 2000ndash16 See Online Annex 21 for the country sample and Online Annex 24 for further details on the calculation
080
085
081
082
083
084
2002 14 counterfactual 14
CHAPTER 2 C LO s E R TO G E T H E R O R F U RT H E R a Pa RT W I T H I N - CO U N T Ry R E G I O N a L D I s Pa R I T I E s a N D a DJ U s TM E N T I N a DVa N C E D E CO N O M I E s
75International Monetary Fund | October 2019
lagging regions do not look very different from those of other regions This stands in contrast to recent literature examining more highly localized labor markets in spe-cific countries For example Autor Dorn and Hanson (2013a) finds significant adverse local effects on employ-ment for the United States from a similarly defined shock Applying a similar approach over a similar period Dauth Findeisen and Suedekum (2014) estimates an overall positive net employment effect of the rise in trade
for Germany These studies suggest that the regional effects of trade may vary across countries However the results presented here are not inconsistent with these studies given that they reflect the average regional effect within countries for the group of advanced economies rather than country-specific responses Moreover the analysis here is undertaken at a higher level of regional aggregation and over a later period (post-1999)
By contrast adverse shocks to local labor demand arising from technological change have noticeable and persistent effects on labor markets (Figure 211) Although there is little sign of an impact effect unem-ployment rates in regions more vulnerable to automa-tion rise steadily over the following four yearsmdasha pattern consistent with a gradual substitution of capital for labor The absence of much change in gross migration flows over the near term indicates that labor mobility across regions is low after automation shocks For lagging regions that are more vulnerable to automation the rise in unemployment rates is even larger and statis-tically significantly different from that of other regions Moreover unlike other regions more vulnerable lagging regions see a persistent and statistically significant drop in out-migration after an automation shock suggest-ing that workers in these regions may find it harder to move than if they were in other regions Box 23 studies the regional effects of automotive manufacturing plant closures which may ultimately be driven by trade or technology shocks finding similarly persistent increases in unemployment which tend to be worse in regions where gross migration flows are lower
Can national labor market policies and distortions inhibit regional labor market adjustment They might if they contribute to more rigid regional labor markets leading adverse shocks to have more long-lived effects on unemployment and participation26 The following discussion examines how the calibration of two national labor market policiesmdashthe stringency of employment protection regulations and the gener-osity of unemployment insurance schemesmdashinfluence regional labor market responses to local shocks More stringent employment protection regulation will tend to reduce job destruction dampening the likelihood of layoffs but also job creation and the hiring rate as employers recognize that new hires come with the potential cost of more sluggish adjustment in
26An example of a national structural policy that alters the func-tioning of regional labor markets is presented in Boeri and others (2019) which compares the regional effects of Italyrsquos and Germanyrsquos national collective bargaining systems
Average region90 percent confidence bandsLagging region
Figure 210 Regional Effects of Import Competition Shocks
ndash06
3 In-Migration(Percent)
0 1 2ndash6
ndash4
ndash2
0
2
4
6
8
10
Years after shockYears after shock3 0 1 2 3 44
ndash6
ndash4
ndash2
0
2
4
6
8
10
ndash04
ndash02
00
4 Out-Migration(Percent)
2 Labor ForceParticipation Rate(Percentage points)
1 Unemployment Rate(Percentage points)
02
04
06
0 1 2 3 0 1 2 3 44Years after shockYears after shock
ndash02
ndash01
00
01
02
03
04
Source IMF staff estimationsNote The blue and red solid lines plot the impulse responses of the indicated variable to a one standard deviation import competition shock defined as the growth of Chinese imports per worker in external markets weighted by the lagged regional employment mix Impulse responses are estimated using the local projection method of Jordagrave (2005) Horizon 0 is the year of the shock Lagging regions in a country are defined as those with real GDP per capita below the countryrsquos regional median in 2000 and with average growth below the countryrsquos average over 2000ndash16 See Online Annex 21 for the country sample and Online Annex 25 for further details about the shock definition and econometric specification
Greater competition in external markets tends to raise unemployment in the near term for exposed regions with little difference between lagging and other regions But this rise unwinds as regions adjust relatively quickly
W O R L D E C O N O M I C O U T L O O K G LO b a L M a N U FaC T U R I N G D OW N T U R N R Is I N G T R a D E b a R R I E R s
76 International Monetary Fund | October 2019
downturns Whether unemployment rises in response to adverse shocks depends on which of these two forces dominates which is theoretically ambiguous (Pissarides 2001) Unemployment insurance provides security against income shocks from job loss but can also impact the dynamics of unemployment through its impacts on an individualrsquos job search efforts and job quality with reemployment (Chetty 2008 Tatsiramos and van Ours 2014 Schmieder von Wachter and Bender 2016)
Analysis suggests that national policies do matter for regional labor market adjustmentmdashthey may exacerbate or dampen adverse unemployment effects although their impact varies across outcomes and shocks (Figure 212) Moreover the findings should be interpreted as associational given that national policies are only considered one-by-one rather than jointly That means that the change in regional responses associated with national employment protection and unemployment benefits policies may incorporate the influence of correlated national policies that are not included in the analysis
More stringent national employment protection is associated with greater regional unemployment effects from import competition and automation shocks Automation shocks are also associated with higher unemployment in the near term where benefits are greater suggesting that the incentive effects of greater benefits do make unemployment more persistent although the difference vanishes at longer horizons Responses to import competition shocks meanwhile show little difference between more versus less generous unemployment benefit regimes The overall takeaway from these findings is that national policies that encourage more flexible labor markets may ease adjustment and reallocation in regional labor markets improving their resilience to shocks
Regional Labor Mobility and Factor Allocation Individual and Firm-Level Evidence
As noted regional adjustment to shocks depends on the effectiveness of factor reallocationmdashthe ability of capital and labor to move across sectors firms and space toward their most productive use Where factor mobility within and across regions is hampered or reallocation ineffective negative shocks may have prolonged effects contributing to poorer performance in some regions and exacerbating disparities within a country This section examines differences in labor mobility between lagging regions and others the characteristics of regional migrants and the differences across regions in the efficiency with which firms allo-cate capitalmdashthe sensitivity of their investments to the marginal returns to capital
Lagging regions on average have lower gross migra-tion flows (inward or outward) than other regions This suggests that their labor reallocation mecha-nisms are less powerful given that lagging regions are actually less likely than other regions to experience
Average region90 percent confidence bandsLagging region
Figure 211 Regional Effects of Automation Shocks
1 Unemployment Rate(Percentage points)
ndash3
ndash2
ndash1
0
1
2
ndash03
ndash02
ndash01
00
01
022 Labor ForceParticipation Rate(Percentage points)
4 Out-Migration(Percent)
3 In-Migration(Percent)
0 1 2Years after shock Years after shock
3 0 1 2 3 44ndash3
ndash2
ndash1
0
1
2
0 1 2Years after shockYears after shock
3 0 1 2 3 44ndash02
00
02
04
06
08
Source IMF staff estimationsNote The blue and red solid lines plot the impulse responses of the indicated variable to an automation shock defined as a one standard deviation decline in machinery and equipment capital price growth for a region that experiences a one standard deviation rise in its vulnerability to automation (Autor and Dorn 2013 Lian and others 2019) Horizon 0 is the year of the shock Lagging regions in a country are defined as those with real GDP per capita below the countryrsquos regional median in 2000 and with average growth below the countryrsquos average over 2000ndash16 See Online Annex 21 for the country sample and Online Annex 25 for further details about the shock definition and econometric specification
Falling machinery and equipment prices tend to raise unemployment in regions where production is more vulnerable to automation with exposed lagging regions hurt even more Out-migration stalls or drops for more exposed lagging regions
CHAPTER 2 C LO s E R TO G E T H E R O R F U RT H E R a Pa RT W I T H I N - CO U N T Ry R E G I O N a L D I s Pa R I T I E s a N D a DJ U s TM E N T I N a DVa N C E D E CO N O M I E s
77International Monetary Fund | October 2019
shocks (Figure 213 panel 1)27 The better educated (either upper secondary or tertiary education) or employed are more likely to move within countries (Figure 213 panels 2 and 3) Those facts are consistent with migration being more constrained in lagging regions where unemployment tends to be higher and education and skills lower
For another perspective on factor allocation across regions within a country differences in firmsrsquo alloca-tive efficiency across regions of a country are analyzed Allocative efficiency is measured at the firm level by the responsiveness of their investment (capital growth) to the firmrsquos marginal return on an additional unit of capital (captured by the marginal revenue product of capital) after accounting for a host of region-sector-country-year differences These firm-level estimates are then mapped to the region-country-sector-year enabling the construction of their distribution across regions by country sector and year Analysis shows that greater variability in firmsrsquo allocative efficiency across regions within a countrymdashas captured by the ratio of the standard deviation to the mean allocative efficiency by country-sector-yearmdashis correlated with greater regional disparities in economic activity In essence when regional differences in firmsrsquo responsiveness to marginal returns to capital are large the spread in regional performance also tends to be wider28
As with regional adjustment dynamics national-level structural policies and distortions may affect the vari-ability in firmsrsquo allocative efficiencies across regions of a country by creating incentives for more or less efficient firm choices The analysis indicates that national policies that support greater flexibility and openness in product markets are associated with lower variability of firmsrsquo allocative efficiency across regions of a country (Figure 214) In particular countries with less strin-gent product market regulation (related to the level of protection for incumbent firms) lower administrative costs for starting a business and greater trade open-ness are all associated with lower variability in capital allocative efficiency across regions These associations might reflect the selective effects of more competitive and contestable markets on firms pushing allocative efficiency across regions closer together and of the beneficial effects of greater flexibility for factors to be reallocated by individual firms and also across firms
27See Online Annex 25 for further details on the incidence of import competition from China and automation shocks for lagging versus other regions
28See Online Annex 26 for further details on the construction of the measure The ratio of the standard deviation to the mean of a distribution is also known as the coefficient of variation
Less stringent EPLMore stringent EPL
Lower UBHigher UB
Employment Protection Legislation
Regional adjustment to adverse trade and technology shocks tends to be faster in countries with policies supporting more flexible labor markets
Figure 212 Regional Effects of Trade and Technology Shocks Conditional on National Policies(Percentage points)
Source IMF staff estimationsNote Years after impact on x-axis Less (more) stringentlow (high) = 25th (75th) percentile of the indicated variable EPL = Index of employment protection legislation UB = gross replacement rate of unemployment benefits Dashed lines indicate the 90 percent confidence bands See Figures 210 and 211 for definitions of the import competition and automation shocks See Online Annex 25 for detailed definitions of import competition and automation shocks and Online Annex 21 for country samples
Unemployment Benefits
1 Import Competition Shock
2 Automation Shock
4 Automation Shock
3 Import Competition Shock
ndash08
ndash04
00
04
08
12
ndash04
ndash02
00
02
04
06
08
ndash04
ndash02
00
02
04
ndash20ndash15ndash10ndash05
0005101520
ndash04
ndash02
00
02
04
06
08
ndash03
ndash02
ndash01
00
01
02
ndash04
ndash02
00
02
04
06
08
ndash04
ndash02
00
02
04
06
08
0 1 2 3 4 0 1 2 3 4
0 1 2 3 4 0 1 2 3 4
0 1 2 3 4 0 1 2 3 4
0 1 2 3 4 0 1 2 3 4
Unemployment Rate
Unemployment Rate
Unemployment Rate
Unemployment Rate Labor ForceParticipation Rate
Labor ForceParticipation Rate
Labor ForceParticipation Rate
Labor ForceParticipation Rate
W O R L D E C O N O M I C O U T L O O K G LO b a L M a N U FaC T U R I N G D OW N T U R N R Is I N G T R a D E b a R R I E R s
78 International Monetary Fund | October 2019
Summary and Policy ImplicationsThe regional dimension of economic performance
has generated much interest in recent years reflecting the perception that increasing regional differences in growth and employment opportunities in advanced economies are stoking social unease and distrust as some regions and peoples are left behind The chapter shows that while there is a grain of truth in these contentions the size and scope of regional disparities differs markedly across economies Regional disparities are closely associated with differences in the sectoral composition of employment and levels of sectoral pro-ductivity Lagging regions of a country are more likely to have lower labor productivity across sectors and to be more concentrated in agriculture and industry than in services (and particularly high productivity growth service sectors such as information technology
Other regionsLagging regions
1 Migration into and out of Lagging and Other Regions(Percent of population)
00 05 10 15 20
Migration out (young)
Migration in (young)
Migration out
Migration in
Gross migration flows tend to be smaller in lagging regions The better educated and employed are more likely to migrate within a country
Figure 213 Subnational Regional Migration and Labor Mobility
Sources Organisation for Economic Co-operation and Development Regional Database European Union (EU) Labor Force Survey and IMF staff calculationsNote Panel 1 shows migration into and out of lagging regions versus other regions between 2000ndash16 defined as gross inflows and outflows of migrants divided by the population in the previous period in the region Lagging regions in a country are defined as those with real GDP per capita below country regional median in 2000 and with average growth below the countryrsquos average over 2000ndash16 Panel 2 plots the share of the population who moved within the past year by education level based on individual worker level data from the EU Labor Force Survey between 2000ndash16 Lower secondary education indicates educational attainment less than 9 years upper secondary education between 9 and 12 years and tertiary education greater than 12 years Panel 3 plots the share of the population who moved within the past year by employment status based on individual worker level data from the EU Labor Force Survey between 2000ndash16 See Online Annex 21 for the country sample
Up to lower secondaryeducation
Inactive Unemployed Employed
Upper secondaryeducation
Tertiary education0
2
4
6
8
10
12
14
16 2 Share of Population Moving within Countries by EducationalAttainment(Percent)
0
2
4
6
8
10
12 3 Share of Population Moving within Countries by EmploymentStatus in the Preceding Year(Percent)
ndash010
ndash008
ndash006
ndash004
ndash002
000
Less stringent productmarket regulation
Tradeopenness
Ease of startingbusiness
Chan
ge in
coe
ffici
ent o
f var
iatio
n of
regi
onal
capi
tal a
lloca
tive
effic
ienc
y
The regional dispersion of firmsrsquo allocative efficiencymdashthe responsiveness of their investment to capital returnsmdashtends to be lower in countries where national policies support more open markets
Source IMF staff calculationsNote Bars show the associated average change in the coefficient of variation of regional capital allocative efficiency calculated by country-sector-year for a one standard deviation change in the indicated structural policy variable All effects shown are statistically significant at the 10 percent level Regression controls for country-sector and sector-year fixed effects with standard errors clustered at the country-year level See Online Annex 21 for the country sample and Online Annex 26 for further details on the econometric methods
Figure 214 Effects of National Structural Policies on Subnational Regional Dispersion of Capital Allocative Efficiency(Response to one standard deviation increase in indicated policy variable)
CHAPTER 2 C LO s E R TO G E T H E R O R F U RT H E R a Pa RT W I T H I N - CO U N T Ry R E G I O N a L D I s Pa R I T I E s a N D a DJ U s TM E N T I N a DVa N C E D E CO N O M I E s
79International Monetary Fund | October 2019
and communications) They also tend to have smaller populations of prime-age workers than other regions which may contribute further to their poorer productivity performance (Feyrer 2007 Adler and others 2017)
Regional adjustment to adverse local labor demand shocks generally takes time and is associated with higher unemployment reflecting frictions in shift-ing production and employment across sectors and labor mobility Lagging regions do not appear more likely to be hit by these shocks but they do appear to suffer more in response to somemdashin particular shocks related to differences in exposure to technological changesmdashsuggesting that adjustment mechanisms in lagging regions may be more obstructed than in other regions
How might policies reduce these disparities and promote improved regional adjustment The analyses here and in earlier literature suggest several possible actions As noted earlier the consensus is that human capital plays a pivotal role in driving regional develop-ment Boosting educational and training quality and opportunities where there are gaps as well as introduc-ing more broad-based educational reforms to improve learning outcomes and adapt to the changing world of work would disproportionately benefit lagging regions (see also Coady and Dizioli 2017 and WB 2018 2019a) Similarly deploying more active labor market policies to create jobs retrain the displaced and find new job matches for the unemployed could also help lift lagging regions and ease adjustment However the design of active labor market policies matters enormously for their success They must be carefully tailored to address the labor market failures specific to a regionrsquos context and assessed and improved regularly (Card Kluve and Weber 2018)
National labor and product market policies and distortions also affect regional adjustment and factor reallocation (Dabla-Norris and others 2015 Boeri and others 2019) Evidence presented here suggests that the appropriate calibration of employment protection regulations and unemployment insurance regimes can
facilitate regional labor market adjustment damp-ening the unemployment effects of adverse shocks Greater flexibility can also be helpfully accompanied by stronger retraining and other forms of job assis-tance to help ensure displaced workers achieve any necessary reskilling and reemployment rapidly (Aiyar and others 2019)29 Product markets that are more openmdashthrough lower barriers to entry and greater trade opennessmdashare associated with lower variability in the capital allocative efficiencies of firms across the regions of a country which is in turn associated with lower regional disparities More competitive markets within a country are associated with greater efficiency in the reallocation of capital both in and across regions
Although not a focus of the analysis here owing to data constraints spatially targeted place-based fiscal policies and investments may also help lagging regions but only when need is spatially concentrated and individual-level targeting has been less effective (Box 24 explores place-based policies and offers more in-depth discussion) There is evidence that greater fiscal decentralization which effectively enables more spatially differentiated policies may also help reduce regional disparities (Lessmann 2009 Kappeler and others 2013 Bloumlchliger Bartolini and Stossberg 2016) Austin Glaeser and Summers (2018) argues that explicit spatial targeting may also be justified if some regions are more sensitive to fiscal interven-tions than othersmdashfor example if an area has greater labor market slack because local demand conditions are depressed However place-based policies must be carefully designed to ensure that beneficial adjust-ment is encouraged rather than resisted (Kline and Moretti 2014) and to avoid interfering with the continued success of leading regions (Barca McCann and Rodriacuteguez-Pose 2012 Pike Rodriacuteguez-Pose and Tomaney 2017 Rodriacuteguez-Pose 2018)
29For example see the Danish model of ldquoflexicurityrdquo which accompanies great flexibility in hiring and firing with retraining job matching and unemployment benefits that are subject to strong monitoring and conditionality (OECD 2016a)
W O R L D E C O N O M I C O U T L O O K G LO b a L M a N U FaC T U R I N G D OW N T U R N R Is I N G T R a D E b a R R I E R s
80 International Monetary Fund | October 2019
Although real GDP per capita has many shortcom-ings as a measure of individual well-being and social welfare it remains a touchstone in much economic analysis and cross-country comparisons1 Recent research suggests that it is also still useful as a broad metric for cross-country comparisons finding it highly correlated for a large set of indicators based on various aspects of human welfare (including subjec-tive well-being mortality inequality and leisure)2 However in the case of within-country regional comparisons two issues arise that can complicate the welfare interpretation of patterns of real GDP per capitamdashregional price or cost-of-living differences and the effects on personal income of fiscal redistribution and income flows to and from elsewhere
Although real GDP per capita is typically corrected for average cross-country differences in cost-of-living (purchasing power parity adjustments) regional differences in the cost-of-living are often not fully reflected in regional real GDP per capita measures largely because regional price indexes are not broadly available3 Gennaioli and others (2014) attempts to correct for this for a subset of countries in its global data set using housing cost differences as a proxy for the cost of living The study finds that although the size of regional disparities fell they remained substantial Gbohoui Lam and Lledo (2019) undertakes a similar calculation using more recent data As shown in Figure 211 it also finds that regional disparities (as captured by the ratio of real GDP per capita in the 75th to the 25th percentile region within-country) narrowed with the correction but remained significant with the ratio going from 134 to 126 on average Hence although regional price differences are part of the picture they do not account for all regional disparities in economic activity
Real GDP per capita is a measure of real output or economic activity occurring within a territory
The author of this box is John Bluedorn with contributions from William Gbohoui W Raphael Lam and Victor Lledo
1See Fleurbaey (2009) Coyle (2015) Feldstein (2017) and Stiglitz Fitoussi and Durand (2018) among others
2See Stevenson and Wolfers (2008) and Jones and Klenow (2016) for evidence
3See Feenstra Inklaar and Timmer (2015) for a discussion of the purchasing power parity adjustment of GDP measures and OECD (2018) for details on the construction in the OECD Regional Database
over a given period (UN 2009) It is not a measure of an individualrsquos or householdrsquos income available for their consumption and investment which would be a more direct measure of welfare This is more properly captured by disposable incomemdashthe sum of labor compensation and investment income after taxes and transfers4 Given that disposable income incorporates income streams from elsewhere such as capital income from geographically diversified port-folios it can better capture interregional risk sharing and result in narrower regional disparities5 Fiscal
4See OECD (2013 2018) for further details on disposable income and its construction and availability at the region-level
5Asdrubali Soslashrensen and Yosha (1996) leverages this fact to estimate the extent of interregional risk-sharing within the United States
Before price adjustmentsAfter price adjustments
Figure 211 Subnational Regional Disparities Before and after Regional Price Adjustment(Ratio for the interquartile range of real GDP per capita across subnational regions by country during 2010ndash14)
Source Gbohoui Lam and Lledo (2019)Note Constructed from Organisation for Economic Co-operation and Development Regional Database Gennaioli and others (2014) and Luxembourg Income Study for available years The price adjustment is based on the housing deflator Data labels use International Organization for Standardization (ISO) country codes
10
12
14
16
18
20
IRL
DEU
CAN
ITA
FIN
AUS
GRC
NLD
AUT
DNK
ESP
USA
SWE
CZE
FRA
GBR
Aver
age
Box 21 Measuring Subnational Regional Economic Activity and Welfare
CHAPTER 2 C LO s E R TO G E T H E R O R F U RT H E R a Pa RT W I T H I N - CO U N T Ry R E G I O N a L D I s Pa R I T I E s a N D a DJ U s TM E N T I N a DVa N C E D E CO N O M I E s
81International Monetary Fund | October 2019
redistribution through taxes and transfers within and across regions can provide a further channel for narrowing income differences across regions6 For the limited countries and years for which data on regional disposable income per capita are available regional differences are smaller than they are as mea-sured by real GDP per capita differences but again can be substantial (OECD 2018) For example the top income regions in the United States had average
6See Obstfeld and Peri (1998) and Boadway and Shah (2007) for a discussion of the role of fiscal redistribution in facilitating adjustment
disposable income per capita more than 50 percent higher than the national average
With its wider availability across time and countries regional real GDP per capita remains the best measure for assessing the extent and evolution of regional differences in economic activity However recognizing its drawbacks as a measure of welfare and motivated by the extensive evidence on the pivotal role of employment in individualrsquos life satisfaction the chapterrsquos analysis focuses more on regional labor market outcomes and adjustment paralleling some of the latest research (Austin Glaeser and Summers 2018)
Box 21 (continued)
W O R L D E C O N O M I C O U T L O O K G LO b a L M a N U FaC T U R I N G D OW N T U R N R Is I N G T R a D E b a R R I E R s
82 International Monetary Fund | October 2019
Climate change may further exacerbate subnational regional disparities in many advanced economies by the end of the 21st century This conclusion is based on two findings First estimates of the effect of temperature increases on sectoral labor productivitymdashagriculture industry and servicesmdashat the subnational level indicate that agriculture and industry are likely to suffer even in advanced economies Second because lagging regions tend to specialize in agriculture and industry (see Figure 29) the negative effect of global warming on labor productivity may be larger in lagging regions therefore pushing them to fall behind even more by the end of the 21st century1
Analysis at the country-level presented in Chapter 3 of the October 2017 World Economic Outlook already establishes that a 10degC increase in temperature lowers labor productivity in heat-exposed industries (mostly agriculture and industry) while there is no negative effect on non-heat-exposed industries (mostly services)2 It also shows little adaptation to climate change except in advanced economies Because the analysis in this box focuses only on the advanced economies which have already invested in climate adaptation any negative effects uncovered here are likely to be at the lower bound of estimates in a global sample
In general temperature has a nonlinear effect on economic activitymdashin very cold regions warming may bring economic benefits Beyond a certain ldquooptimalrdquo level temperature increases hurt economic output and labor productivity However there is significant heterogeneity in the relationship between temperature and labor productivity across sectors as Figure 221 demonstrates3 For example for a median lagging region which has an average annual temperature of 12degC in this sample an increase in temperature by 1degC would reduce labor productivity in the agriculture and industry sectors and have no effect on the service
The author of this box is Natalija Novta1See also the October 2019 Fiscal Monitor for analysis
examining how climate change mitigation policies may differ-entially impact regions within a country depending on their industry mix
2Heat-exposed industries include forestry fishing and hunting construction mining transportation utilities and manufacturing following the classification by Graff Zivin and Neidell (2014)
3Based on the estimates in Figure 221 the optimal tempera-ture is about 14degC for the service sector but only 5degC and 9degC for industry and agriculture sectors respectively
sector In contrast because the median non-lagging region is at 105degC an increase in average annual tem-perature by 1degC would raise productivity in the service sector lower it in the industry sector and have no statistically significant effect on the agriculture sector
Services Industry Agriculture
Figure 221 Marginal Effect of 1degC Increase in Temperature on Sectoral LaborProductivity
Sources Organisation for Economic Co-operation and Development (OECD) Regional Database University of East Anglia Climate Research Unit and IMF staff calculationsNote The figure shows the contemporaneous effect of a 1degC increase in temperature on sectoral labor productivity Because temperature has a nonlinear effect its marginal effect is shown at each level of regional average annual temperature The baseline specification mirrors that of Chapter 3 of the October 2017 World Economic Outlook but is reestimated in a sample of subnational regions within advanced economies with a population of at least a quarter million The industry sector includes industry manufacturing and construction from the OECD classification (ISIC Revision 4) Sectoral labor productivity is defined as sectoral gross value added divided by the number of employees in that sector The dependent variable is the growth of sectoral labor productivity and it is regressed on average annual population-weighted temperature temperature squared precipitation and precipitation squared controlling for one-year lags of all the climate variables a lag of the dependent variable and subnational regional fixed effects The solid lines show the point estimates for each sector and the dashed lines show 90 percent confidence intervals Standard errors are clustered at the level of subnational regions
ndash20
ndash15
ndash10
ndash5
0
5
10
15
0 2 4 6 8 10 12 14 16 18 20 22
Perc
ent c
hang
e in
labo
r pro
duct
ivity
Temperature
Box 22 Climate Change and Subnational Regional Disparities
CHAPTER 2 C LO s E R TO G E T H E R O R F U RT H E R a Pa RT W I T H I N - CO U N T Ry R E G I O N a L D I s Pa R I T I E s a N D a DJ U s TM E N T I N a DVa N C E D E CO N O M I E s
83International Monetary Fund | October 2019
Given these findings it is not surprising that lagging (warmer) regions might be expected to fall further behind in the coming decades In the early 2000s labor productivity in lagging regions was on average at about 85 percent of that in other regions (Figure 29) Under an unmitigated climate change scenario (Representative Concentration Pathway (RCP) 85)4 labor productivity in lagging regions could fall by about 2ndash3 percentage points in Italy Spain and the United States by 2100 (Figure 222) This is similar to the decline in relative labor produc-tivity of the lagging regions between 2002 and 2014 (Figure 29) Under a milder scenario which assumes emissions peaking around 2050 (RCP 45) the decline in labor productivity of lagging regions would be smaller at about 15 percentage points
Historical weather patterns may have already contributed to some regions falling behind An increase in a regionrsquos average annual temperature by 1degC increases the probability of being lagging by about 2 percentage points or about 10 percent relative to the baseline likelihood of about 20 percent even after controlling for country-year fixed effects This means that a hypothetical move from the coolest to the warmest region within a country which have a median temperature difference of about 55degC is associated with about an 11 percentage point higher chance of being lagging
Finally it is important to note that even though climate change is a relatively slow process it is very persistent and its negative effects have historically been extremely hard to eliminate Therefore even the seemingly small absolute effects demonstrated here should be a cause for concern especially because they appear in the context of advanced economies that are relatively well-adapted and tend to have temperate climates
4As constructed by the Intergovernmental Panel on Climate Change
RCP 45RCP 85
Figure 222 Change in Labor Productivity of Lagging versus Other Regions Due to Projected Temperature Increases between 2005 and 2100(Percentage points)
Sources National Aeronautics and Space Administration temperature projections for scenarios RCP 45 and 85 Organisation for Economic Co-operation and Development Regional Database and IMF staff calculationsNote To construct the figure the following procedure is followed first for 2005 the ratio of labor productivity in lagging regions relative to other regions is calculated as the weighted average of labor productivities in agriculture industry and services second the mean projected temperature increases for 2005ndash2100 under RCP scenarios 45 and 85 and the estimated sectoral labor productivitiesare used to project sectoral labor productivity at the level of subnational regions in 2100 under each of the two RCP scenarios and finally the difference between the projected labor productivity of lagging regions (relative to others) in 2100 and actual labor productivity of lagging regions (relative to others) in 2005 is calculated Representative Concentration Pathways (RCP) are scenarios of greenhouse gas concentrations constructed by the Intergovernmental Panel on Climate Change (IPCC 2014) RCP 45 is an intermediate scenario which assumes emissions peaking around 2050 and declining thereafter RCP 85 is an unmitigated scenario in which emissions continue to rise throughout the 21st century
ndash30 ndash25 ndash20 ndash15 ndash10 ndash05 00
Netherlands
United Kingdom
Germany
Canada
Sweden
Italy
Spain
United States
Box 22 (continued)
W O R L D E C O N O M I C O U T L O O K G LO b a L M a N U FaC T U R I N G D OW N T U R N R Is I N G T R a D E b a R R I E R s
84 International Monetary Fund | October 2019
The declining share of manufacturing jobs in overall employment over the past decades has attracted atten-tion in recent years due to concerns that manufac-turing might play a role as a catalyst for productivity growth and income convergence and be a source of well-paid jobs for less-skilled workers (Chapter 3 of the April 2018 World Economic Outlook presents in-depth analysis of this contention) Factory closures have accompanied this trend with job losses some-times concentrated in particular regions within coun-tries A large literature exists on the local labor market impacts of factory closures with most early studies focused on closures affecting heavy industry such as coal steel and shipbuilding1 In more recent years the effects of automotive manufacturing plant closures have become the focus of more studies although most examine the effects for a single country or of a specific closure2
With these in mind this box looks at the impact of automotive manufacturing plant closuresmdashevents caused by forces originating outside the immediate regionmdashon the regional labor markets for a sample of six advanced economies for which historical data on automotive factory closures are available3 The box compares unemployment rates in regions that experienced car factory closures during 2000ndash16 and in regions in the same country that did not experience such shocks If regions of a country were adept at real-locating labor and capital they could absorb shocks including permanent shocks and show no persistent effects on local activity and employment and little difference between the two groups of regions
The analysis suggests that regions that experienced car factory closures typically had bigger increases in unemployment rates after the closures than comparator regions in the same countries with the difference being statistically significant Regressing regional unemployment rates on a dummy variable
The author of this box is Zsoacuteka Koacuteczaacuten1See Martin and Rowthorn (1986) Pinch and Mason (1991)
Hinde (1994) Kirkham and Watts (1998) Tomaney Pike and Cornford (1999) Shutt Henderson and Kumi-Ampofo (2003) and Henderson and Shutt (2004) among others
2See Chapain and Murie (2008) Ryan and Campo (2013) Bailey and others (2014) and Stanford (2017) for recent examples
3The sample of countries includes Australia Canada Germany Italy the United Kingdom and the United States covering 2000ndash16 Over the period 30 closures were recorded in these countries
for whether the region experienced at least one plant closure points to significant and persistent effects even after controlling for differences between regionsrsquo employment shares in industry initial real GDP per capita population density and dependency ratios (Figure 231 full sample) Unemployment rates in regions with car factory closures increase for three years after the shock as the initial impact of the closure is magnified by local spillover effects to other sectors4
Out-migration is expected to be a key adjustment mechanism after automotive factory closures if other local employment options are insufficient
4See Goldstein (2017) for vivid descriptions of such effects
Full sample High migration Low migration
Figure 231 Associations between Automotive Manufacturing Plant Closures and Unemployment Rates(Percentage point change in unemployment rate)
Sources Organisation for Economic Co-operation and Development Regional Database and IMF staff calculationsNote The figure shows coefficient estimates from regressions of the unemployment rate on a dummy variable for whether the region experienced at least one plant closure controlling for initial GDP per capita population density share of employment in industry and the dependency ratio Solid bars indicate statistical significance at the 10 percent level while hollow bars do not High and low migration refer to gross migration flows split at the sample median
ndash10
30
ndash05
00
05
10
15
20
25
ndash1 0 1 2 3 4 5Years beforeafter plant closures
Box 23 The Persistent Effects of Local Shocks The Case of Automotive Manufacturing Plant Closures
CHAPTER 2 C LO s E R TO G E T H E R O R F U RT H E R a Pa RT W I T H I N - CO U N T Ry R E G I O N a L D I s Pa R I T I E s a N D a DJ U s TM E N T I N a DVa N C E D E CO N O M I E s
85International Monetary Fund | October 2019
To examine the role of migration the regressions in this study are repeated separately for regions with high and low gross migration flows The persistent unem-ployment effects are driven by regions with low gross migration flows The negative effects of closures are not statistically significant in regions with high gross migration flows (Figure 231 high and low migration subsamples) The highly persistent effects of perma-nent automotive factory closures are consistent with adjustment being stuck in some regions particularly
those where mobility is low potentially due to the more constrained and selective nature of migration5 Endogenous local demand effects and expectations about the future development of a place hit by factory closures could further reinforce the effects of such local shocks exacerbating regional disparities within countries
5See Kim (2008) and Duranton and Venables (2018) for discussions of the nature of mobile labor
Box 23 (continued)
W O R L D E C O N O M I C O U T L O O K G LO b a L M a N U FaC T U R I N G D OW N T U R N R Is I N G T R a D E b a R R I E R s
86 International Monetary Fund | October 2019
Policymakers deploy a variety of tools to reduce economic inequality including fiscal redistribution through taxes and transfers and growth-friendly poli-cies to improve education health care infrastructure and affordable housing (October 2017 Fiscal Monitor) Most national policies have been spatially blind targeting individuals based on their circumstances and characteristics regardless of their residency Examples of such policy measures include national disability and unemployment payments in the United States and unemployment benefits in France and Spain which are targeted to individuals in need or who are unemployed irrespective of their location However persistent and growing regional economic disparities in some countries have increased interest in place-based or spatially targeted fiscal policies as a further way to tackle inequality
Place-based policies intend to promote regional equity and inclusive growth and to insure against region-specific shocks (Kim and Dougherty 2018) Examples of such policies include the European Unionrsquos Regional Development Funds that support naturally disadvantaged (remote less-developed or disaster-stricken) subnational regions Canadarsquos Regional Development Agencies which provide support to diversify regional economies and foster community development and US enterprise zones
The authors of this box are William Gbohoui W Raphael Lam and Victor Lledo
which provide tax credits to generate new jobs and investment As shown in Table 241 spatially targeted interventions can differ according to their proximate objectives spatial coverage and fiscal instruments The decision on what to use will depend on the nature of the underlying regional issues
Place-based policies can boost the success of existing fiscal policies in reducing inequality if (1) the intended recipients such as low-income households or the unemployed are geographically concentrated and (2) traditional nationwide means-testing approaches have limited coverage are less progressive or are diffi-cult to enforce (Coady Grosh and Hoddinott 2004 October 2017 Fiscal Monitor)1 Place-based policies may also have merit if fiscal interventions are expected to have stronger impacts on the disadvantaged in cer-tain regions for example in the case of hiring incen-tives that might be more effective in creating jobs and growth in regions with higher unemployment rates (Austin Glaeser and Summers 2018) Place-based policies should ensure that interventions facilitate convergence and sectoral reallocation in response to shocks rather than create new barriers But policy-makers should also be mindful that such policies may raise horizontal equity concerns as individuals with
1Limited coverage refers to the fact that in most countries only a portion of the households that meet the criteria to receive a transfer (for example means-tested) actually receive the trans-fer Coverage is calculated as the percent of eligible households that in fact receive the transfer
Table 241 Examples of Place-Based PoliciesAims Instruments Country Programs CoverageEnterprise zones attract firms to create jobs and invest
Tax incentives on investment job creation and corporate income taxes streamlined regulations
US Federal Empowerment Zones
Zones and communities within the region
Cluster promotion agglomeration of high-tech firms and research institutions
Tax incentives public research and development spending grants
Francersquos Local Productive System ldquoHigh-tech Offensiverdquo programs in Bavaria Germany
Region at large communities within the region
Relocation programs Compensate people to liverelocate in selected regions
Tax exemptions on personal income tax grants and transfers
US low-income housing tax credit Spainrsquos income tax credits for unemployed that relocate for jobs Canadian Northern Economic Development initiative to retain youth in northern regions
Low-income neighborhoods
Sources Neumark and Simpson (2014) WB (2009) and IMF staff estimates
Box 24 Place-Based Policies Rethinking Fiscal Policies to Tackle Inequalities within Countries
CHAPTER 2 C LO s E R TO G E T H E R O R F U RT H E R a Pa RT W I T H I N - CO U N T Ry R E G I O N a L D I s Pa R I T I E s a N D a DJ U s TM E N T I N a DVa N C E D E CO N O M I E s
87International Monetary Fund | October 2019
the same status but living in different regions may receive different treatment
Drawing on individual household income surveys for a selected sample of countries illustrative simu-lations suggest that combining spatial targeting with conventional means-testing programs could improve the effectiveness of fiscal redistributionmdashas captured by the size of the decline in income inequalitymdashby 7ndash10 percent without increasing fiscal costs (see Figure 241 and Gbohoui Lam and Lledo 2019 for further details) For example because France and the United Kingdom have highly progressive social safety nets and are successful at reaching a high percentage of households eligible for transfers the potential gains from spatial targeting are relatively small (at about 7ndash8 percent) But improvements are larger (about 10 percent) in the United States where poorer house-holds are more concentrated in lagging regions and a higher percentage of eligible households end up not receiving transfers (that is coverage is worse)
When designing and implementing place-based policies it is important to assign responsibili-ties to the appropriate level of government The choice should be sensitive to intergovernmental fiscal arrangements within a country (for exam-ple a unitary or federal state) and the associated revenue-raising capacity and scope for intergovern-mental transfers As a general principle the central government should take the lead on overall policy design and monitoring given that it can account for possible externalities and spillovers across states and provinces Subnational governments could be more involved in the implementation as they are more attuned to local needs and preferences For exam-ple in federal or highly decentralized countries such as the United States subnational governments have greater autonomy to determine income and property tax rates and spending on education and health care
Conventional means-testedSpatially targeted means-testedImprovement from spatial targeting (as percent ofconventional means-tested transfers right scale)
Figure 241 Effects of Fiscal Redistribution by Conventional versus Spatially Targeted Means-Tested Transfers(Reduction in Gini points unless otherwise noted)
Sources Luxembourg Income Study and IMF staff calculationsNote The figure is based on an illustrative exercise that compares conventional (spatially blind) means-tested transfers with spatially targeted means-testing Conventional means-tested transfers have limited coverage that is some percentage of eligible households do not receive the transfer (see October 2017 Fiscal Monitor) Spatially targeted means-testing can enhance the coverage at the same fiscal cost The fiscal redistribution effect is defined as the difference in nationwide income inequality (Gini coefficient) before and after taxes and transfers and is calculated separately for conventional and spatially targeted means-tested transfers The improvement is calculated as the difference in Gini reduction expressed as a percentage of the fiscal redistribution under conventional means-tested transfers
00
16
04
08
12
France United Kingdom United States0
2
4
6
8
10
Box 24 (continued)
W O R L D E C O N O M I C O U T L O O K G LO b a L M a N U FaC T U R I N G D OW N T U R N R Is I N G T R a D E b a R R I E R s
88 International Monetary Fund | October 2019
ReferencesAbdih Yasser and Stephan Danninger 2017 ldquoWhat Explains
the Decline of the US Labor Share of Income An Analysis of State and Industry Level Datardquo IMF Working Paper 17167 International Monetary Fund Washington DC
Acemoglu Daron and Melissa Dell 2010 ldquoProductivity Differences between and within Countriesrdquo American Economic Journal Macroeconomics 2 (1) 169ndash88
Adler Gustavo Romain Duval Davide Furceri Sinem Kiliccedil Ccedilelik and Marcos Poplawski-Ribeiro 2017 ldquoGone with the Headwinds Global Productivityrdquo IMF Staff Discussion Note 1704 International Monetary Fund Washington DC
Aiyar Shekhar John Bluedorn Romain Duval Davide Furceri Daniel Garcia-Macia Yi Ji Davide Malacrino Haonan Qu Jesse Siminitz and Aleksandra Zdzienicka 2019 ldquoStrength-ening the Euro Area The Role of National Structural Reforms in Enhancing Resiliencerdquo IMF Staff Discussion Note 1905 International Monetary Fund Washington DC
Algan Yann and Pierre Cahuc 2014 ldquoTrust Growth and Well-Being New Evidence and Policy Implicationsrdquo Chapter 2 in Handbook of Economic Growth 2 edited by Philippe Aghion and Steven N Durlauf 49ndash120 North Holland Elsevier
Allen Treb and Costas Arkolakis 2014 ldquoTrade and the Topog-raphy of the Spatial Economyrdquo Quarterly Journal of Economics 129 (3) 1085ndash140
Alvarez Jorge Ivo Krznar and Trevor Tombe 2019 ldquoInter-nal Trade in Canada Case for Liberalizationrdquo IMF Working Paper 19158 International Monetary Fund Washington DC
Asdrubali Pierfederico Bent E Soslashrensen and Oved Yosha 1996 ldquoChannels of Interstate Risk Sharing United States 1963ndash1990rdquo Quarterly Journal of Economics 111 (4) 1081ndash110
Atkinson Tony Joe Hasell Salvatore Morelli and Max Roser 2017 The Chartbook of Economic Inequality Institute for New Economic Thinking Oxford United Kingdom
Austin Benjamin Edward Glaeser and Lawrence H Summers 2018 ldquoJobs for the Heartland Place-Based Policies in 21st Century Americardquo Brooking Papers on Economic Activity Spring 151ndash255
Autor David H and David Dorn 2013 ldquoThe Growth of Low-Skill Service Jobs and the Polarization of the US Labor Marketrdquo American Economic Review 103 (5) 1553ndash597
Autor David H David Dorn and Gordon H Hanson 2013a ldquoThe China Syndrome Local Labor Market Effects of Import Competition in the United Statesrdquo American Economic Review 103 (6) 2121ndash168
mdashmdashmdash 2013b ldquoThe Geography of Trade and Technology Shocks in the United Statesrdquo American Economic Review 103 (3) 220ndash25
mdashmdashmdash 2015 ldquoUntangling Trade and Technology Evidence from Local Labour Marketsrdquo Economic Journal 125 (584) 621ndash46
Bailey David Gill Bentley Alex de Ruyter and Stephen Hall 2014 ldquoPlant Closures and Taskforce Responses An Analysis of the Impact of and Policy Response to MG Rover in Birminghamrdquo Regional Studies Regional Science 1 (1) 60ndash78
Bande Roberto Melchor Fernaacutendez and Victor Montuenga 2008 ldquoRegional Unemployment in Spain Disparities Business Cycle and Wage Settingrdquo Labour Economics 15 (5) 885ndash914
Barca Fabrizio Philip McCann and Andreacutes Rodriacuteguez-Pose 2012 ldquoThe Case for Regional Development Intervention Place-Based versus Place-Neutral Approachesrdquo Journal of Regional Science 52 (1) 134ndash52
Bartik Timothy J 1991 ldquoWho Benefits from State and Local Economic Development Policiesrdquo W E Upjohn Institute for Employment Research Kalamazoo MI
Blanchard Olivier Jean and Lawrence F Katz 1992 ldquoRegional Evolutionsrdquo Brookings Papers on Economic Activity 1 1ndash75
Bloumlchliger Hansjorg David Bartolini and Sibylle Stossberg 2016 ldquoDoes Fiscal Decentralisation Foster Regional Conver-gencerdquo OECD Economic Policy Paper 17 Organisation for Economic Co-operation and Development Paris
Boadway Robin and Anwar Shah eds 2007 Intergovernmental Fiscal Transfers Principles and Practice Public Sector Governance and Accountability Series World Bank Group Washington DC
Boeri Tito Andrea Ichino Enrico Moretti and Johanna Posch 2019 ldquoWage Equalization and Regional Misallocation Evidence from Italian and German Provincesrdquo NBER Working Paper 25612 National Bureau of Economic Research Cambridge MA
Breau Seacutebastien and Richard Saillant 2016 ldquoRegional Income Disparities in Canada Exploring the Geographical Dimensions of an Old Debaterdquo Regional Studies Regional Science 3 (1) 463ndash81
Card David Jochen Kluve and Andrea Weber 2018 ldquoWhat Works A Meta Analysis of Recent Active Labor Market Program Evaluationsrdquo Journal of the European Economic Association 16 (3) 894ndash931
Caselli Francesco 2005 ldquoAccounting for Cross-Country Income Differencesrdquo Chapter 9 in Handbook of Economic Growth 1a edited by Philippe Aghion and Steven N Durlauf Old Holland Elsevier 679ndash741
Chapain Caroline and Alan Murie 2008 ldquoThe Impact of Factory Closure on Local Communities and Economies The Case of the MG Rover Longbridge Closure in Birminghamrdquo Policy Studies 29 (3) 305ndash17
Che Natasha X and Antonio Spilimbergo 2012 ldquoStructural Reforms and Regional Convergencerdquo IMF Working Paper 12106 International Monetary Fund Washington DC
Chetty Raj 2008 ldquoMoral Hazard versus Liquidity and Optimal Unemployment Insurancerdquo Journal of Political Economy 116 (2) 173ndash234
Chetty Raj John N Friedman and Jonah E Rockoff 2014 ldquoMeasuring the Impacts of Teachers II Teacher Value-Added and Student Outcomes in Adulthoodrdquo American Economic Review 104 (9) 2633ndash79
CHAPTER 2 C LO s E R TO G E T H E R O R F U RT H E R a Pa RT W I T H I N - CO U N T Ry R E G I O N a L D I s Pa R I T I E s a N D a DJ U s TM E N T I N a DVa N C E D E CO N O M I E s
89International Monetary Fund | October 2019
Chetty Raj and Nathaniel Hendren 2018a ldquoThe Impacts of Neighborhoods on Intergenerational Mobility I Childhood Exposure Effectsrdquo Quarterly Journal of Economics 133 (3) 1107ndash62
mdashmdashmdash 2018b ldquoThe Impacts of Neighborhoods on Intergenera-tional Mobility II County-Level Estimatesrdquo Quarterly Journal of Economics 133 (3) 1163ndash228
Chetty Raj Nathaniel Hendren and Lawrence F Katz 2016 ldquoThe Effects of Exposure to Better Neighborhoods on Children New Evidence from the Moving to Opportunity Experimentrdquo American Economic Review 106 (4) 855ndash902
Clark Andrew E 2018 ldquoFour Decades of the Economics of Happiness Where Nextrdquo Review of Income and Wealth 64 (2) 245ndash69
Clark Andrew E and Andrew J Oswald 1994 ldquoUnhappiness and Unemploymentrdquo Economic Journal 104 (424) 648ndash59
Coady David and Allan Dizioli 2017 ldquoIncome Inequality and Education Revisited Persistence Endogeneity and Heterogeneityrdquo IMF Working Paper 17126 International Monetary Fund Washington DC
Coady David Margaret Grosh and John Hoddinott 2004 Targeting of Transfers in Developing Countries Review of Lessons and Experience Washington DC World Bank Group
Coe Neil M Philip F Kelly and Henry W C Yeung 2007 Economic Geography A Contemporary Introduction Oxford Blackwell Publishing
Conolly Marie Miles Corak and Catherine Haeck 2019 ldquoIntergenerational Mobility between and within Canada and the United Statesrdquo Journal of Labor Economics 37 (S2) S595ndashS641
Cowell Frank 2011 Measuring Inequality Third edition Oxford Oxford University Press
Coyle Diane 2015 GDP A Brief but Affectionate History Revised and expanded edition Princeton NJ Princeton University Press
Dabla-Norris Era Kalpana Kochhar Nujin Suphaphiphat Frantisek Ricka and Evridiki Tsounta 2015 ldquoCauses and Consequences of Income Inequality A Global Perspectiverdquo IMF Staff Discussion Note 1513 International Monetary Fund Washington DC
Dao Mai Chi Mitali Das Zsoacuteka Koacuteczaacuten and Weicheng Lian 2017 ldquoWhy Is Labor Receiving a Smaller Share of Global Income Theory and Empirical Evidencerdquo IMF Working Paper 17169 International Monetary Fund Washington DC
Dao Mai Davide Furceri and Prakash Loungani 2017 ldquoRegional Labor Market Adjustment in the United States Trend and Cyclerdquo Review of Economics and Statistics 99 (2) 243ndash57
Das Mitali and Benjamin Hilgenstock 2018 ldquoThe Exposure to Routinization Labor Market Implications for Developed and Developing Economiesrdquo IMF Working Paper 18135 International Monetary Fund Washington DC
Dauth Wolfgang Sebastian Findeisen and Jens Suedekum 2014 ldquoThe Rise of the East and the Far East German Labor
Markets and Trade Integrationrdquo Journal of the European Economic Association 12 (6) 1643ndash75
Davis Donald R and David E Weinstein 2002 ldquoBones Bombs and Break Points The Geography of Economic Activityrdquo American Economic Review 92 (5) 1269ndash89
Decressin Joumlrg and Antonio Fataacutes 1995 ldquoRegional Labor Market Dynamics in Europerdquo European Economic Review 39 1627ndash55
Diacuteez Federico Jiayue Fan and Carolina Villegas-Saacutenchez 2018 ldquoGlobal Declining Competitionrdquo IMF Working Paper 1982 International Monetary Fund Washington DC
Donaldson Dave and Richard Hornbeck 2016 ldquoRailroads and American Economic Growth A lsquoMarket Accessrsquo Approachrdquo Quarterly Journal of Economics 131 (2) 799ndash858
Duranton Gilles and Diego Puga 2004 ldquoMicro-Foundations of Urban Agglomeration Economiesrdquo Chapter 48 in Hand-book of Regional and Urban Economics 4 edited by J Vernon Henderson and Jacques-Franccedilois Thisse North Holland Elsevier 2063ndash3073
Duranton Gilles and Anthony J Venables 2018 ldquoPlace-Based Policies for Developmentrdquo NBER Working Paper 24562 National Bureau of Economic Research Cambridge MA
Durlauf Steven N and Ananth Seshadri 2018 ldquoUnderstanding the Great Gatsby Curverdquo Chapter 4 in NBER Macroeconomics Annual 2017 32 edited by Martin Eichenbaum and Jonathan A Parker Cambridge MA National Bureau of Economic Research 333ndash93
Esteban J 2000 ldquoRegional Convergence in Europe and the Industry Mix A Shift-Share Analysisrdquo Regional Science and Urban Economics 30 (3) 353ndash64
Feenstra Robert C Robert Inklaar and Marcel P Timmer 2015 ldquoThe Next Generation of the Penn World Tablerdquo American Economic Review 105 (10) 3150ndash82
Feldstein Martin 2017 ldquoUnderestimating the Real Growth of GDP Personal Income and Productivityrdquo Journal of Economic Perspectives 31 (2) 145ndash64
Felice Emanuele 2011 ldquoRegional Value Added in Italy 1891ndash2001 and the Foundation of a Long-Term Picturerdquo Economic History Review 64 (3) 929ndash50
Feyrer James 2007 ldquoDemographics and Productivityrdquo Review of Economics and Statistics 89 (1) 100ndash09
Fleurbaey Marc 2009 ldquoBeyond GDP The Quest for a Measure of Social Welfarerdquo Journal of Economic Literature 47 (4) 1029ndash75
Fujita Masahisa Paul Krugman and Anthony J Venables 1999 The Spatial Economy Cities Regions and International Trade Cambridge MA MIT Press
Gal Peter 2013 ldquoMeasuring Total Factor Productivity at the Firm Level Using OECD-ORBISrdquo OECD Economics Department Working Paper 1049 Organisation for Economic Co-operation and Development Paris
Gandhi Amit Salvador Navarro and David Rivers 2018 ldquoOn the Identification of Gross Output Production Functionsrdquo University of Western Ontario Centre for Human Capital and Productivity Working Papers London Ontario Canada
W O R L D E C O N O M I C O U T L O O K G LO b a L M a N U FaC T U R I N G D OW N T U R N R Is I N G T R a D E b a R R I E R s
90 International Monetary Fund | October 2019
Gbohoui William W Raphael Lam and Victor Lledo 2019 ldquoThe Great Divide Regional Inequality and Fiscal Policyrdquo IMF Working Paper 1988 International Monetary Fund Washington DC
Gennaioli Nicola Rafael La Porta Florencio Lopez-de-Silanes and Andrei Schleifer 2013 ldquoHuman Capital and Regional Developmentrdquo Quarterly Journal of Economics February 128 (1) 105ndash64
mdashmdashmdash 2014 ldquoGrowth in Regionsrdquo Journal of Economic Growth 19 (3) 259ndash309
Giannone Elisa 2018 ldquoSkill-Biased Technical Change and Regional Convergencerdquo 2017 Meeting Papers 190 Society for Economic Dynamics Stonybrook NY
Giordano Raffaela Sergi Lanau Pietro Tommasino and Petia Topalova 2015 ldquoDoes Public Sector Inefficiency Constrain Firm Productivity Evidence from Italian Provincesrdquo IMF Working Paper 15168 International Monetary Fund Washington DC
Goldsmith-Pinkham Paul Isaac Sorkin and Henry Swift 2019 ldquoBartik Instruments What When Why and Howrdquo NBER Working Paper 24408 National Bureau of Economic Research Cambridge MA
Goldstein Amy 2017 Janesville An American Story New York Simon and Schuster
Gopinath Gita Şebnem Kalemli-Oumlzcan Loukas Karabarbounis and Carolina Villegas-Saacutenchez 2017 ldquoCapital Allocation and Productivity in South Europerdquo Quarterly Journal of Economics 132 (4) 1915ndash967
Graff Zivin Joshua and Matthew Neidell 2014 ldquoTemperature and the Allocation of Time Implications for Climate Changerdquo Journal of Labor Economics 32 (1) 1ndash26
Gruumln Carola Wolfgang Hauser and Thomas Rhein 2010 ldquoIs Any Job Better than No Job Life Satisfaction and Re-employmentrdquo Journal of Labor Research 31 (3) 285ndash306
Guriev Sergei 2018 ldquoEconomic Drivers of Populismrdquo American Economic Review Papers and Proceedings 108 200ndash03
Harris I Philip D Jones Timothy J Osborn and David H Lister 2014 ldquoUpdated High-Resolution Grids of Monthly Climatic Observationsmdashthe CRU TS310 Datasetrdquo Interna-tional Journal of Climatology 34 (3) 623 ndash42 Version 32401
Helpman Elhanan 2016 ldquoGlobalization and Wage Inequalityrdquo NBER Working Paper 22944 National Bureau of Economic Research Cambridge MA
Henderson Roger and John Shutt 2004 ldquoResponding to a Coalfield Closure Old Issues for a New Regional Develop-ment Agencyrdquo Local Economy 19 (1) 25ndash37
Hinde Kevin 1994 ldquoLabor Market Experiences Following Plant Closures Sunderlandrsquos Shipyard Workersrdquo Regional Studies 28 (7) 713ndash24
Hsieh Chang-Tai and Peter J Klenow 2010 ldquoDevelopment Accountingrdquo American Economic Journal Macroeconomics 2 (1) 207ndash23
Hsieh Chang-Tai and Enrico Moretti 2019 ldquoHousing Constraints and Spatial Misallocationrdquo American Economic Journal Macroeconomics 11 (2) 1ndash39
Immervoll Herwig and Linda Richardson 2011 ldquoRedistribution Policy and Inequality Reduction in OECD Countries What Has Changed in Two Decadesrdquo OECD Social Employment and Migration Working Paper 122 Organisation for Economic Co-operation and Development Paris
Intergovernmental Panel on Climate Change (IPCC) 2014 ldquoClimate Change 2014 Impacts Adaptation and Vulnera-bility Part A Global and Sectoral Aspectsrdquo Contribution of Working Group II to the Fifth Assessment Report of the Inter-governmental Panel on Climate Change Cambridge University Press Cambridge United Kingdom and New York
International Monetary Fund (IMF) 2018 ldquoSpain Selected Issuesrdquo IMF Country Report 18331 Washington DC
Jakubik Adam and Victor Stolzenburg 2018 ldquoThe lsquoChina Shockrsquo Revisited Insights from Value Added Trade Flowsrdquo WTO Staff Working Paper ERSD-2018ndash10
Jaumotte Florence Subir Lall and Chris Papageorgiou 2013 ldquoRising Income Inequality Technology or Trade and Financial Globalizationrdquo IMF Economic Review 61 (2) 271ndash309
Jones Charles I and Peter J Klenow 2016 ldquoBeyond GDP Welfare across Countries and Timerdquo American Economic Review 106 (9) 2426ndash57
Jordagrave Ogravescar 2005 ldquoEstimation and Inference of Impulse Responses by Local Projectionsrdquo American Economic Review 95 (1) 161ndash82
Kalemli-Oumlzcan Şebnem Bent Sorensen Carolina Villegas- Saacutenchez Vadym Volosovych and Sevcan Yesiltas 2015 ldquoHow to Construct Nationally Representative Firm Level Data from the ORBIS Global Databaserdquo NBER Working Paper 21558 National Bureau of Economic Research Cambridge MA
Kappeler Andreas Albert Soleacute-Olleacute Andreas Stephan and Timo Vaumllilauml 2013 ldquoDoes Fiscal Decentralization Foster Regional Investment in Productive Infrastructurerdquo European Journal of Political Economy 31 15ndash25
Karabarbounis Loukas and Brent Neiman 2014 ldquoThe Global Decline of the Labor Sharerdquo Quarterly Journal of Economics 129 (1) 61ndash103
Kaufman Martin Phillip Swagel and Steven Dunaway 2003 ldquoRegional Convergence and the Role of Federal Transfers in Canadardquo IMF Working Paper 0397 International Monetary Fund Washington DC
Kim Junghun and Sean Dougherty eds 2018 Fiscal Decentralisation and Inclusive Growth OECD Fiscal Federalism Studies OECD Publishing ParisKIPF Seoul
Kim Sukkoo 2008 ldquoSpatial Inequality and Economic Development Theories Facts and Policiesrdquo Commission on Growth and Development Working Paper 16 World Bank Group Washington DC
Kirkham Janet D and Hugh D Watts 1998 ldquoMulti-Locational Manufacturing Organisations and Plant Closures in Urban Areasrdquo Urban Studies 35 (9) 1559ndash75
CHAPTER 2 C LO s E R TO G E T H E R O R F U RT H E R a Pa RT W I T H I N - CO U N T Ry R E G I O N a L D I s Pa R I T I E s a N D a DJ U s TM E N T I N a DVa N C E D E CO N O M I E s
91International Monetary Fund | October 2019
Klein Goldewijk Kees Arthur Beusen Jonathan Doelman and Elke Stehfest 2017 ldquoAnthropogenic Land-Use Estimates for the Holocene ndash HYDE 32rdquo Earth System Science Data 9 924ndash53
Kline Patrick and Enrico Moretti 2014 ldquoPeople Places and Public Policy Some Simple Welfare Economics of Local Economic Development Programsrdquo Annual Review of Economics 6 (1) 629ndash62
Krugman Paul 1991 ldquoIncreasing Returns and Economic Geographyrdquo Journal of Political Economy 99 (3) 483ndash99
Krugman Paul and Anthony J Venables 1995 ldquoGlobalization and the Inequality of Nationsrdquo Quarterly Journal of Economics 110 (4) 857ndash80
Lessmann Christian 2009 ldquoFiscal Decentralization and Regional Disparity Evidence from Cross-Section and Panel Datardquo Environment and Planning A Economy and Space 41(10) 2455ndash73
Lessmann Christian and Andreacute Seidel 2017 ldquoRegional Inequality Convergence and its Determinants A View from Outer Spacerdquo European Economic Review 92 110ndash32
Lian Weicheng Natalija Novta Evgenia Pugacheva Yannick Timmer and Petia B Topalova 2019 ldquoThe Price of Capital Goods A Driver of Investment under Threatrdquo IMF Working Paper 19134 International Monetary Fund Washington DC
Liu Lucy Qian 2018 ldquoRegional Labor Mobility in Spainrdquo IMF Working Paper 18282 International Monetary Fund Washington DC
Luxembourg Income Study (LIS) Database Multiple years http www lisdatacenter org (multiple countries) Luxembourg
Martin Ron and Bob Rowthorn 1986 The Geography of De-Industrialisation London Macmillan
Moretti Enrico 2011 ldquoLocal Labor Marketsrdquo Chapter 14 in Handbook of Labor Economics 4b edited by David Card and Orley Ashenfelter North Holland Elsevier 1237ndash313
Neumark David and Helen Simpson 2015 ldquoPlace-Based Policiesrdquo Chapter 18 in Handbook of Regional and Urban Economics 5 edited by Gilles Duranton J Vernon Henderson and William C Strange North Holland Elsevier 1197ndash287
Nolan Brian Matteo G Richiardi and Luis Valenzuela 2019 ldquoThe Drivers of Income Inequality in Rich Countriesrdquo Journal of Economic Surveys early view 1ndash40
Novotnyacute Josef 2007 ldquoOn the Measurement of Regional Inequality Does Spatial Dimension of Income Inequality Matterrdquo Annals of Regional Science 41 (3) 563ndash80
Nunn Nathan 2014 ldquoHistorical Developmentrdquo Chapter 7 in Handbook of Economic Growth 2 edited by Philippe Aghion and Steven N Durlauf North Holland Elsevier 347ndash402
Nunn Ryan Jana Parsons and Jay Shambaugh 2018 ldquoThe Geography of Prosperityrdquo In Place-Based Policies for Shared Economic Growth edited by Jay Shambaugh and Ryan Nunn Washington DC Hamilton Project Brookings Institution
Obstfeld Maurice and Giovanni Peri 1998 ldquoRegional Non- Adjustment and Fiscal Policyrdquo Economic Policy 13 (26) 205ndash59
Organisation for Economic Co-operation and Development (OECD) 2013 Understanding National Accounts Second edition Paris OECD Publishing
mdashmdashmdash 2016a Back to Work Denmark Improving the Re-Employment Prospects of Displaced Workers Paris OECD Publishing
mdashmdashmdash 2016b OECD Regional Outlook 2016 Productive Regions for Inclusive Societies Paris OECD Publishing
mdashmdashmdash 2018 OECD Regions and Cities at a Glance 2018 Paris OECD Publishing
Pike Andy Andreacutes Rodriacuteguez-Pose and John Tomaney 2017 Local and Regional Development Second edition New York Routledge
Pinch Steven and Colin Mason 1991 ldquoRedundancy in an Expanding Labour Market A Case-Study of Displaced Workers from Two Manufacturing Plants in Southamptonrdquo Urban Studies 28 (5) 735ndash57
Pissarides Christopher A 2001 ldquoEmployment Protectionrdquo Labour Economics 8 (2) 131ndash59
Rajan Raghuram 2019 The Third Pillar How Markets and the State Leave the Community Behind New York Penguin Press
Rodriacuteguez-Pose Andreacutes 2018 ldquoThe Revenge of the Places that Donrsquot Matter (and What to Do About it)rdquo Cambridge Journal of Regions Economy and Society 11 (1) 189ndash209
Rodriacuteguez-Pose Andreacutes and Tobias Ketterer Forthcoming ldquoInstitutional Change and the Development of Lagging Regions in Europerdquo Regional Studies
Rodriacuteguez-Pose Andreacutes and Michael Storper 2019 ldquoHousing Urban Growth and Inequalities The Limits to Deregulation and Upzoning in Reducing Economic and Spatial Inequalityrdquo CEPR Discussion Paper DP 13713 Center for Economic Policy Research Washington DC
Ryan Brent D and Daniel Campo 2013 ldquoAutopiarsquos End The Decline and Fall of Detroitrsquos Automotive Manufacturing Landscaperdquo Journal of Planning History 12 (2) 95ndash132
Schmieder Johannes F Till von Wachter and Stefan Bender 2016 ldquoThe Effect of Unemployment Benefits and Nonemployment Durations on Wagesrdquo American Economic Review 106 (3) 739ndash77
Shorrocks Anthony 1980 ldquoThe Class of Additively Decomposable Inequality Measuresrdquo Econometrica 48 (3) 613ndash25
Shorrocks Anthony and Guanghua Wan 2005 ldquoSpatial Decomposition of Inequalityrdquo Journal of Economic Geography 5 (1) 59ndash81
Shutt John Roger Henderson and Felix Kumi-Ampofo 2003 ldquoResponding to a Regional Economic Crisis An Impact and Regeneration Assessment of the Selby Coalfield Closure on the Yorkshire and Humber Regionrdquo Paper delivered to the Regional Studies Association International Conference Pisa Italy April 2003
W O R L D E C O N O M I C O U T L O O K G LO b a L M a N U FaC T U R I N G D OW N T U R N R Is I N G T R a D E b a R R I E R s
92 International Monetary Fund | October 2019
Stanford Jim 2017 ldquoWhen an Auto Industry Disappears Australiarsquos Experience and Lessons for Canadardquo Canadian Public Policy 43 (S1) S57ndashS74
Stevenson Betsey and Justin Wolfers 2008 ldquoEconomic Growth and Subjective Well-Being Reassessing the Easterlin Paradoxrdquo Brookings Papers on Economy Activity 2008 (1) 1ndash102
Stiglitz Joseph E Jean-Paul Fitoussi and Martine Durand 2018 Beyond GDP Measuring What Counts for Economic and Social Performance Paris OECD Publishing
Tatsiramos Konstantinos and Jan C van Ours 2014 ldquoLabor Market Effects of Unemployment Insurance Designrdquo Journal of Economic Surveys 28 (2) 284ndash311
Timmer Marcel P Erik Dietzenbacher Bart Los Robert Stehrer and Gaaitzen J de Vries 2015 ldquoAn Illustrated User Guide to the World InputndashOutput Database The Case of Global Automotive Productionrdquo Review of International Economics 23 (3) 575ndash605
Tomaney John Andy Pike and James Cornford 1999 ldquoPlant Closure and the Local Economy The Case of Swan Hunter on Tynesiderdquo Regional Studies 33 (5) 401ndash11
Topalova Petia 2010 ldquoFactor Immobility and Regional Impacts of Trade Liberalization Evidence on Poverty from Indiardquo American Economic Journal Applied Economics 2 (4) 1ndash41
United Nations (UN) 2009 System of National Accounts 2008 New York United Nations
Winkler Hernan 2019 ldquoThe Effect of Income Inequality on Political Polarization Evidence from European Regions 2002ndash2014rdquo Economics and Politics 31 (2) 137ndash62
World Bank (WB) 2009 World Development Report 2009 Reshaping Economic Geography Washington DC
mdashmdashmdash 2018 World Development Report 2018 Learning to Realize Educationrsquos Promise Washington DC
mdashmdashmdash 2019a World Development Report 2019 The Changing Nature of Work Washington DC
mdashmdashmdash 2019b Doing Business Database Washington DC
93International Monetary Fund | October 2019
The pace of structural reforms in emerging market and developing economies was strong during the 1990s but it has slowed since the early 2000s Using a newly constructed database on structural reforms this chapter finds that a reform push in such areas as governance domestic and external finance trade and labor and product markets could deliver sizable output gains in the medium term A major and comprehensive reform package might double the speed of convergence of the average emerging market and developing economy to the living standards of advanced economies raising annual GDP growth by about 1 percentage point for some time At the same time reforms take several years to deliver and some of themmdasheasing job protection reg-ulation and liberalizing domestic financemdashmay entail greater short-term costs when carried out in bad times these are best implemented under favorable economic conditions and early in authoritiesrsquo electoral mandate Reform gains also tend to be larger when governance and access to creditmdashtwo binding constraints on growthmdashare strong and where labor market informality is highermdashbecause reforms help reduce it These findings underscore the importance of carefully tailoring reforms to country circumstances to maximize their benefits
IntroductionEmerging market and developing economies have
enjoyed good growth over the past two decades Living standards have been converging toward those in advanced economies at a fast pace in the aggregate However for many countries the speed of income convergence remains modest The typical (median) emerging market has been closing its (purchasing- power-parity-adjusted) income per capita gap with the
The authors of this chapter are Gabriele Ciminelli Romain Duval (co-lead) Davide Furceri (co-lead) Guzman Gonzalez-Torres Fernandez Joao Jalles Giovanni Melina and Cian Ruane with con-tributions from Zidong An Hites Ahir Jun Ge Yi Ji and Qiaoqiao Zhang and supported by Luisa Calixto Grey Ramos and Ariana Tayebi Funding from the UK Department of International Develop-ment (DFID) is gratefully acknowledged The views expressed in this chapter do not necessarily represent those of DFID
United States by about 13 percent a year since the 2008 financial crisis while the equivalent speed for a typical low-income developing country is 07 percent (Figure 31) At these rates it would take more than 50 years for a typical emerging market economy and 90 years for a typical low-income developing country to close half of their current gaps in living standards Furthermore convergence has been highly heteroge-neous while some countries have been converging fast (mostly Asian economies and during the 2000s some commodity producers) others have stagnated ormdashin the case of almost a quarter of economiesmdasheven diverged For the latter disasters (crises wars disease outbreaks extreme climatic events) played a role in some cases but there is also broader concern about weak underlying trends in income per capita growth
Subdued and uneven growth concerns about policies and growth prospects in advanced economiesmdasha key driver of growth in emerging market and develop-ing economies (April 2017 World Economic Outlook (WEO)) waning chances of a new commodity price boom and shrinking macroeconomicmdashprimarily fiscal policy (April 2019 Fiscal Monitor)mdashspace have revived emerging market and developing economy policymak-ersrsquo interest in structural reforms There is also a sense that reform efforts waned after the liberalization wave that followed the economic crises of the 1990s leaving much scope for improving the functioning of (financial labor product) markets and for improving the quality of other government-influenced drivers of economic growthmdashsuch as education health care and infrastruc-ture In some areas such as for example labor markets automation and globalization put existing regulations that protect jobs rather than workers under pressure further strengthening the case for reform
At the same time broad uncertainty surrounds the potential scope for and gains to be reaped from struc-tural reforms in emerging market and developing econ-omies Individual countriesrsquo experience with reforms have been mixed1 Some prominent reformers over one
1Zettelmeyer (2006) provides an overview of reform experiences in Latin America and a comprehensive discussion of existing explana-tions for why gains may have undershot expectations
REIGNITING GROWTH IN LOW-INCOME AND EMERGING MARKET ECONOMIES WHAT ROLE CAN STRUCTURAL REFORMS PLAY3CH
APTE
R
94
W O R L D E C O N O M I C O U T L O O K G LO b a L M a N U FaC T U R I N G D OW N T U R N R Is I N G T R a D E b a R R I E R s
International Monetary Fund | October 2019
particular decade such as Sri Lanka during 1988ndash97 or Colombia Egypt and Romania during 1998ndash2007 have seen their per capita incomes converge fast toward that of the United States (and other advanced econo-mies) during the subsequent decade (Figure 32) But other major reformers such as Argentina Mexico and the Philippines during 1988ndash97 and Nigeria during 1998ndash2007 failed to converge over the subsequent decade In some cases such as Mexico this could reflect disappointing payoffs from reforms because of pervasive microeconomic distortions that have encouraged informality (Levy 2018) In other cases it may be that reform gains were negated by adverse events such as macroeconomic shocks or misguided policies Examples include the exchange rate overvalu-ation and the collapse of the currency board in the
EMs LIDCs
ndash6
ndash4
ndash2
0
2
4
6
1978ndash87 1988ndash97 1998ndash2007 2008ndash17
The average speed of convergence to living standards in advanced economies has been rather modest among EMDEs
Sources Penn World Tables and IMF staff calculationsNote For each country the speed of convergence for each decade is computed as the ratio between average annual real per capita GDP growth relative to the United States and the percent difference between the US real per capita GDP and that of each country at the beginning of each decade at purchasing power parity The horizontal line inside each box represents the median the upper and lower edges of each box show the top and bottom quartiles respectively and the top and bottom markers denote the maximum and the minimum respectively EMs = emerging markets EMDEs = emerging market and developing economies LIDCs = low-income developing countries
Figure 31 Speed of Income-per-Capita Convergence in Emerging Markets and Low-Income Developing Countries(Percent)
Reform intensity Speed of convergence Median of EMDEs
2 Egypt1 Colombia
1998ndash2007 1998ndash20072008ndash17 2008ndash1700
05
10
15
20
25
30
00
05
10
15
20
4 Sri Lanka3 Romania
5 Argentina
1998ndash2007 1988ndash972008ndash17 1998ndash200700
05
10
15
20
25
30
00051015202530354045
6 Mexico
1988ndash97 1988ndash971998ndash2007 1998ndash200700
05
10
15
20
25
35
30
ndash20
00
20
40
60
7 Nigeria 8 Philippines
1998ndash2007 1988ndash972008ndash17 1998ndash2007ndash20
ndash10
00
10
20
30
40
ndash10
ndash05
00
05
10
15
20
25
Sources Alesina and others (forthcoming) Penn World Tables and IMF staff calculationsNote For each country the speed of convergence for each decade is computed as the ratio between average annual real per capita purchasing power parity GDP growth relative to the United States and the percent difference between the US real per capita GDP and that of each country at the beginning of each decade Reform intensity is computed as the average annual change in each decade (multiplied by 100) of the average reform index The average reform index is computed as the arithmetic average of indicators capturing liberalizations in five areas domestic finance external finance trade product market and labor market The index ranges from 0 to 1 with higher values denoting greater liberalization EMDEs = emerging market and developing economies
Figure 32 Reform Intensity and Speed of Income-per-Capita Convergence in Selected Economies(Percent)
Some top reformers have enjoyed strong subsequent income growth and convergence while others have not
95
C H A P T E R 3 R E I G N I T I N G G R OW T H I N LOW - I N CO M E a N D E M E R G I N G Ma R K E T E CO N O M I E s W H aT R O L E C a N s T R U C T U R a L R E F O R M s P L ay
International Monetary Fund | October 2019
early 2000s in Argentinamdashwhich also led to a reversal of earlier reforms the 2016 recession driven by the decline in global oil prices delayed policy adjustment and oil production disruptions in Nigeria and the hit from the 1997 Asian crisis in the Philippines which then recovered quickly and grew rapidly beginning in the early 2000s Macroeconomic shocks can entail persistent or even permanent income losses (Cerra and Saxena 2008) especially when their impact is amplified by specific macroeconomic and structural vulnerabilities (for example high public debt mostly denominated in foreign currency or an unsustainable exchange rate peg) This underscores the importancemdashand difficultymdashof disentangling the effects of reforms from those of other drivers of economic growth such as macroeconomic shocks and policies
Mixed experience with past reforms could also reflect a given reformrsquos different effects across countries depending on their specific characteristics In particu-lar reforms may pay off only if strong core institutions are in place (Acemoglu Johnson and Robinson 2005) Key among these may be laws and institutions that deliver strong governance for example reducing bor-der or behind-the-border barriers to competition may not lead to much new firm entry innovation and pro-ductivity growth if property rights are not well defined and enforced or incumbent domestic firms continue to benefit from tacit government support More broadly given the many market imperfections in most emerg-ing market and developing economies addressing one may not necessarily help the economy if other market distortions are not remedied (Hausmann Rodrik and Velasco 2005) For example opening up the capital account may trigger fickle and poorly allocated capital inflows if the domestic financial system is insufficiently developed regulated and supervised to mediate these inflows safely and so weakens the benefits from capital flow liberalization Likewise raising female labor sup-ply through support for childcare or stronger legal pro-tections against discrimination may not fully translate into formal employment gains if labor market institu-tions such as stringent job protection legislation for formal workers make firms less willing to hire This points to the need to uncover some of the important factors that may account for cross-country differences in the impact of reforms
A more practical difficulty in assessing the case for structural reforms is the lack of recent comprehensive data and analysis Although information on structural policies is up to date for selected areas (for example
governance or the cost of doing business as assessed in Kaufmann Kraay and Mastruzzi 2010 and WB 2019) and for a broader range of areas for a few larger emerging market economies (for example OECD 2018) compre-hensive cross-country time-series information is lacking Partly reflecting these data limitations there has also been little recent cross-country evidence regarding the growth impact of past reforms with some exceptions including earlier IMF work based on indicators con-structed in the late 2000s (Christiansen Schindler and Tressel 2013 Prati Onorato and Papageorgiou 2013)
To assess the macroeconomic effects of structural reforms this chapter builds on a new IMF reform data set covering regulations for many emerging market economies and low-income developing countries during 1973ndash2014 in five areas (Alesina and others forthcoming) trade (tariffs) domestic finance (credit and interest rate controls entry barriers public ownership quality of supervision in the domestic financial system) external finance (capital account openness encompassing regulations governing international transactions) labor market regulation (stringency of job protection legis-lation) and product market regulation (stringency of regulations and public ownership in two large network industriesmdashnamely electricity and telecommunications) These new data are supplemented by the World Gov-ernance Indicators (Kaufmann Kraay and Mastruzzi 2010)2 The growth impact of regulatory changes in each of the six areas is then explored through empirical analy-sis supplemented by model-based analysis that provides alternative quantification of the impact of reforms and sheds light on the channels through which they affect the economy including the role of informality Specifically the chapter tackles the following questions bull How has structural reform progress evolved over
the past couple of decades Has the pace of reform slowed in emerging market and developing econo-mies in recent years What is the remaining scope for reform and how does it vary across regulatory areas and countries
bull What are the short- to medium-term effects of reforms on economic activity To what extent could such reforms speed up the convergence of emerg-ing market economies and low-income developing countries to living standards in advanced economies
2While the database covers 90 economies around the world the analysis in this chapter excludes those classified as advanced economies at the beginning of the sample as such it covers the 41 current emerging markets seven former emerging markets and 20 low-income developing countries
96
W O R L D E C O N O M I C O U T L O O K G LO b a L M a N U FaC T U R I N G D OW N T U R N R Is I N G T R a D E b a R R I E R s
International Monetary Fund | October 2019
bull What are the channels through which reforms affect the economy For example do reforms affect primarily productivity or employment How do they affect informality which is often associated with poor firm productivity
bull When should reforms be implemented Do they pay off less or more in bad times
bull Do the effects of reforms vary across economies and if so why Are there particular reforms that could magnify the gains from others More broadly should reforms be implemented as packages or should policymakers focus on the most binding constraint(s) to growth and if so which one(s)
In addressing these questions the chapter reaches the following conclusions bull After the major liberalization waves of the late
1980s and the 1990s reform in emerging market and developing economies slowed in the 2000s Although this reflects in part gradual narrowing of the scope for further deregulation there is still ample room for a renewed reform push particularly in low-income developing countriesmdashnotably across sub-Saharan Africa and to a lesser extent in the Middle East and North Africa and Asia and Pacific regions
bull Reforms can yield sizable payoffs in the medium term even though gains vary across different types of regulations For the average emerging market and developing economy empirical analysis sug-gests that major simultaneous reforms across all six areas considered in this chapter could raise output by more than 7 percent over a six-year period This would increase annual GDP growth by more than 1 percentage point and double the average current speed of income-per-capita convergence to advanced economy levels from about 1 percent to more than 2 percent Model-based analysis points to output gains about twice as large in the longer term
bull Reducing informality which helps boost firmsrsquo productivity and capital investment is one import-ant channel through which reforms raise output Given that reforms facilitate formalization they tend to pay off more in countries where informality is higher all else equal to start with
bull However reforms generally take time to deliver It typically takes at least three years for significant pos-itive effects on output to materialize although some reformsmdashsuch as product market deregulationmdashpay off more quickly Possibly reflecting this delay the
political cost of reformmdashin the executive powerrsquos electoral prospectsmdashis lowest when measures are enacted early in the governmentrsquos political mandate
bull The timing of reform mattersmdashsome reforms are best implemented in good times In normal times the reforms studied in this chapter are not found to entail short-term macroeconomic costs However when macroeconomic conditions are weak easing job protection legislation or deregulating domes-tic finance does not pay off and may even lower employment and output in the short term possibly because stimulating labor or credit supply fails to elicit much response when the demand for labor or credit is depressed
bull Getting reform packaging and sequencing right can also make a difference Reforms typically deliver larger gains in countries where governance is stron-ger This means that strengthening governance can support economic growth and income convergence not just directly by incentivizing more productive formal firms to invest and recruit but also indirectly by magnifying the payoff from reforms in other areas Therefore there are advantages to combining trade financial labor and product market reforms with or implementing them after concrete actions to improve governance Such concrete actions include streamlined and transparent public spending and tax administration procedures and stronger pro-tection and enforcement of property and contractual rights for example Reforms that incentivize formal firms to growmdashsuch as lower administrative burdens or easier labor regulationsmdashalso tend to work better when there is better access to credit which makes it possible for firms to expand This underscores the importance of domestic finance liberalization supported by a strong regulatory and supervisory framework More broadly identifying binding constraints on growth and specific reform comple-mentarities is key
Three other important issues that go beyond the scope of this analysis should be borne in mind when considering prioritizing and designing reforms First this chapter considers reforms essentially aimed at improving the functioning of (financial labor product) markets It ignores others that seek instead to directly facilitate the accumulation of productive factorsmdashphysical and human capital and labor Key reforms in this regard involve improving education and health systems public infrastructure spending
97
C H A P T E R 3 R E I G N I T I N G G R OW T H I N LOW - I N CO M E a N D E M E R G I N G Ma R K E T E CO N O M I E s W H aT R O L E C a N s T R U C T U R a L R E F O R M s P L ay
International Monetary Fund | October 2019
frameworks and laws and regulations that obstruct womenrsquos participation in the labor force Second in the long term reforms could entail larger gains than found here by (1) enabling economies to be not just more efficient but also more innovative leading to more persistent effects on economic growth and (2) enhancing the reforming economiesrsquo resilience to and thereby alleviating permanent output losses from economic and financial crises (Aiyar and others 2019) Third policymakers should factor in and implement up-front complementary reforms to mitigate any adverse effects of reforms on income distribution Absent any redistribution through the tax-benefit system some of the reforms considered in this chapter might yield highly uneven gains across the population (Fabrizio and others 2017 Furceri Loungani and Ostry forthcoming) Tackling inequality issues is an important policy objective but it also matters for the ultimate impact of reform on economic growth (Ostry Berg and Kothari 2018) The poor have fewer oppor-tunities for education and less financial access and therefore are less likely to reap the benefits of market reform More fundamentally reforms whose gains are captured only by a small fraction of society risk losing support and stalling or being undone down the road (Alesina and others forthcoming)
The next section examines reform patterns in emerging market and developing economies over the past four decades It also identifies remaining scope for reform and existing differences across geographic regions and countries The subsequent section analyzes the effects of reforms on growth and the channels through which they materialize After that the investi-gation turns to the drivers of differences in the effects of reforms across countries and over time In partic-ular it looks at whether the effects of reforms vary depending on business conditions and explores reform complementarities The final section discusses the main takeaways and policy implications
Structural Policy and Reform Patterns in Emerging Market and Developing Economies
This chapter relies on a new IMF database on economic regulations that identifies structural poli-cies and reforms in trade (tariffs) domestic finance (regulation and supervision) external finance (capital account openness) labor market regulation (job pro-tection legislation) and product market regulation (in electricity and telecommunications two large network
industries) in 90 advanced and emerging market and developing economiesmdashof which 48 are current and former emerging markets and 20 are low-income developing countriesmdashduring 1973ndash2014 (see Online Annex 31 for details about the indicators and coun-try coverage) The database was compiled through a systematic reading and coding of policy actions docu-mented in various sources including national laws and regulations as well as in IMF staff reports (for more details see Alesina and others forthcoming) While the indices capture the stringency of regulations in each area they need not imply that all such regulations are unwarranted indeed whether full deregulation is optimal depends on individual countriesrsquo circum-stances and the availability of alternative policy tools to meet governmentsrsquo policy objectivesmdashas discussed in IMF (2012) regarding capital account liberalization for example These data on market regulations and reforms are complemented by a composite indicator of the quality of governance (political stability govern-ment effectiveness strength of rule of law control of corruption) based on the Worldwide Governance Indicators (WGIs)3 All indices are normalized to vary continuously between 0 and 1 with 0 indicating the most restrictive regulations in a given policy area and 1 indicating the most unrestricted For the governance indicator higher scores denote stronger governance frameworks
These indicators have several limitations First the new IMF data capture de jure regulations As such they may not always fully capture de facto changes in intended outcomesmdasheven though indicator scores in domestic finance external finance and trade correlate rather well with related outcomes such as the share of credit in GDP financial openness and trade openness (see Online Annex 31) Second indicator scores are comparable across time and countries within each indi-vidual policy area but they are not comparable across different policy areas4 Therefore while useful to study broad reform trends the overall reform index con-structed as a simple average of the five IMF indicators should be interpreted with caution Third the WGIs
3The analysis in the chapter uses a composite governance indicator rather than all its individual components because the latter are highly correlated Empirical analysis based on each indicator considered in isolation yields qualitatively similar findings
4For instance if a country has a higher score in the area of domestic finance than in product market regulation it cannot be concluded that the country has a more liberalized financial than product market
98
W O R L D E C O N O M I C O U T L O O K G LO b a L M a N U FaC T U R I N G D OW N T U R N R Is I N G T R a D E b a R R I E R s
International Monetary Fund | October 2019
are perception indices summarizing the views of many businesses citizens and expert survey respondents on the quality of governance in a country the quality of underlying data can vary across countries and data sources5 Therefore individual country rankings based on these indicators should be avoided Fourth the scope of reforms studied in this chapter is limited to the six areas mentioned earlier which relate mainly to the functioning of markets There are however several other important reforms that could facilitate the accu-mulation of capital and labor such as improving edu-cation and health care systems strengthening public infrastructure spending frameworks or changing laws and regulations that obstruct womenrsquos participation in the labor force Finally within each reform area the scope of regulations covered by the corresponding indicator is also limited For example the indicator for product market regulations focuses on two important network industriesmdashthat is electricity and telecom-municationsmdashbut it does not cover other industries or broader administrative burdens on companies Likewise the domestic finance indicator captures regulations in the banking system but does not cover nonbank financial institutions
After the major liberalization waves in the late 1980s andmdashmost importantmdashthe 1990s the pace of structural reform slowed in emerging market and developing economies in the late 2000s especially in low-income developing countries (Figure 33) This was the result of some stabilization of policy in (domestic and external) finance trade and prod-uct markets after the significant deregulation of the previous decades Deregulation included phasing out of credit and interest rate controls in banking sectors liberalization of foreign capital inflows and outflows external tariff reductions including from multilat-eral trade liberalization rounds and reduced entry barriers as well as privatization in network industries (Figure 34) In turn stabilization during the 2000s in part reflects a gradual narrowing of the scope for further reforms but also waning reform efforts nota-bly in the sub-Saharan Africa and Middle East and North Africa regions Labor market regulation differs from other areas it has been far more stable for the average emerging market and developing economy without any noticeable deregulation trend since the
5WGIs do not reflect the official views of the World Bank and are not used by the World Bank Group to allocate resources
1970smdashand roughly in line with the experience in advanced economies (Chapter 3 of the April 2016 WEO) This may be because labor market regulations importantly aim to protect workers from the risk of income lossmdasheven though this may be best pursued by shifting from stringent employment protection legislation which is the dimension considered in this chapter toward unemployment insurance (Duval and Loungani 2019) Finally over the past two decades there has been no noticeable improvement in gover-nance in the average emerging market and developing economy6
6Figure 34 does not report the evolution of the governance indica-tor because the WGIs are not comparable across different time periods given that they are normalized to keep the world average constant over time However based on the underlying data sources there seems to be little evidence of a systematic improvement in governance over time (https info worldbank org governance wgi home)
AEs EMs LIDCs
Regulatory convergence has stalled in the past decade especially in low-income developing economies
Sources Alesina and others forthcoming and IMF staff calculationsNote The average reform index is computed as the arithmetic average of indicators capturing liberalizations in five areas domestic finance external finance trade product market and labor market It excludes the governance indicator due to its lower time coverage The index ranges from 0 to 1 with higher values denoting greater liberalization AEs = advanced economies EMs = emerging markets LIDCs = low-income developing countries
Figure 33 Overall Reform Trends(Scale 0ndash1 higher score indicates greater liberalization)
00
10
01
02
03
04
05
06
07
08
09
1973 80 90 2000 10 14
99
C H A P T E R 3 R E I G N I T I N G G R OW T H I N LOW - I N CO M E a N D E M E R G I N G Ma R K E T E CO N O M I E s W H aT R O L E C a N s T R U C T U R a L R E F O R M s P L ay
International Monetary Fund | October 2019
Reforms have been generally more far-reaching in emerging markets than in low-income developing countries over the past few decades Exceptions include international trademdashwidespread international trade liberalization has led to tariff convergence toward low levels around the worldmdashand labor lawsmdashthere is no evidence of a trend toward labor market deregulation and in fact there has even been tightening in recent years In product markets and in domestic and external finance regulation was strict for both the average emerging market economy and low-income developing country until the 1990s but since then liberalization has sped up particularly in emerging markets These average patterns mask considerable heterogeneity how-ever Among both emerging markets and low-income developing countries some economies have undergone far-reaching liberalization while others have maintained stringent restrictions most strikingly on international capital flows (external finance) For example since the early 1990s emerging market economies that have substantially improved their structural indicator scores include among others Estonia and Latvia (domestic finance) Peru and Romania (external finance) Chile and Colombia (product markets) China and Egypt (labor markets) and South Africa and Uruguay (inter-national trade) Among low-income countries exam-ples of major reformers over the same period include Madagascar and Tanzania (domestic finance) Kenya and Uganda (external finance) Nicaragua and Senegal (product markets) Cameroon and Cocircte drsquoIvoire (labor markets) and Bolivia and Ghana (international trade) A few emerging market economies have achieved significant improvements in governance (Albania and Georgia for example) as have some low-income developing countries (Cameroon and Ethiopia for example)
Broad differences in reform trends have also been observed across and within regions Overall reform efforts have been greater among emerging market and developing economies in Europe and in the Latin America and Caribbean region than across sub-Saharan Africa and to a lesser extent the Middle East and North Africa and Asia and Pacific regions (Figure 35) The European integration process after the collapse of the Soviet Union played a key role for Europe while for Latin American emerging market and developing economies the crises of the 1980s and 1990s were contributing factors Again there have been wide dif-ferences across countries in these reform trends Within
EMs LIDCs
Sources Alesina and others (forthcoming) and IMF staff calculationsNote The horizontal line inside each box represents the median the upper and lower edges of each box show the top and bottom quartiles respectively and the top and bottom markers denote the maximum and the minimum respectively EMs = emerging markets LIDCs = low-income developing countries
00
02
04
06
08
10 1 Domestic Finance
1973ndash75 81ndash85 91ndash95 01ndash05 11ndash1476ndash80 86ndash90 1996ndash2000 06ndash10
00
02
04
06
08
10 2 External Finance
1973ndash75 81ndash85 91ndash95 01ndash05 11ndash1476ndash80 86ndash90 1996ndash2000 06ndash10
00
02
04
06
08
10 3 Trade
1973ndash75 81ndash85 91ndash95 01ndash05 11ndash1476ndash80 86ndash90 1996ndash2000 06ndash10
00
02
04
06
08
10 4 Product Market
1973ndash75 81ndash85 91ndash95 01ndash05 11ndash1476ndash80 86ndash90 1996ndash2000 06ndash10
00
02
04
06
08
10 5 Labor Market
1973ndash75 81ndash85 91ndash95 01ndash05 11ndash1476ndash80 86ndash90 1996ndash2000 06ndash10
Figure 34 Reform Trends by Area(Scale 0ndash1 higher score indicates greater liberalization)
Reform trends have been heterogenous across areas with deregulation mostly taking place in trade finance and product markets
100
W O R L D E C O N O M I C O U T L O O K G LO b a L M a N U FaC T U R I N G D OW N T U R N R Is I N G T R a D E b a R R I E R s
International Monetary Fund | October 2019
each broad geographic region significant reformers across the five market regulation areas over the past decades have included among others China and the Philippines (Asia) Bulgaria and Hungary (Europe) Argentina and Peru (Latin America) Egypt and Jordan (Middle East and North Africa) and South Africa and Uganda (sub-Saharan Africa)
Past reforms have not exhausted the scope for deregulation which remains sizable in most emerging market and developing economies and particularly in low-income developing countries Except for labor market regulationmdashan area in which many advanced economies also could benefit from employment protection legislation reform (Chapter 3 of the April 2016 WEO)mdashemerging market and developing economies retain significantly more restrictive market regulations than advanced economies they also lag on governance (Figure 36) Regarding international
Asia-Pacific Europe MENAP SSA LAC
00
01
02
03
04
05
06
07
08
09
10
1973 80 90 2000 10 14
Reforms have been on average more far-reaching in Europe and the Latin America and the Caribbean region than they have been in the Middle East and North Africa Asia-Pacific and sub-Saharan Africa regions
Sources Alesina and others (forthcoming) and IMF staff calculationsNote Each region includes only EMDEs The average reform index is computed as the arithmetic average of indicators capturing liberalizations in five areas domestic finance external finance trade product market and labor market It excludes the governance indicator due to its lower time coverage EMDEs = emerging market and developing economies LAC = Latin America and the Caribbean MENAP = Middle East North Africa Afghanistan and Pakistan SSA = sub-Saharan Africa
Figure 35 Overall Reform Trends across DifferentGeographical Regions(Scale 0ndash1 higher score indicates greater liberalization)
There remains ample scope for further reforms in most areas across emergingmarket and low-income developing economies
Figure 36 Regulatory Indices by Country Income Groups(Scale 0ndash1 higher score indicates greater liberalization)
Sources Alesina and others (forthcoming) and IMF staff calculationsNote Bars represent the 2014 value of each index (2013 for the governance index) The horizontal line inside each box represents the median the upper and lower edges of each box show the top and bottom quartiles respectively and the top and bottom markers denote the maximum and the minimum respectively AEs = advanced economies EMs = emerging markets LIDCs = low-income developing countries
1 Domestic Finance
4 Product Market
00
02
04
06
08
10
00
02
04
06
08
10
00
02
04
06
08
10
00
02
04
06
08
10
00
02
04
06
08
10
00
02
04
06
08
10
2 External Finance
3 Trade
5 Labor Market 6 Governance
AEs EMs LIDCs AEs EMs LIDCs
AEs EMs LIDCs AEs EMs LIDCs
AEs EMs LIDCs AEs EMs LIDCs
101
C H A P T E R 3 R E I G N I T I N G G R OW T H I N LOW - I N CO M E a N D E M E R G I N G Ma R K E T E CO N O M I E s W H aT R O L E C a N s T R U C T U R a L R E F O R M s P L ay
International Monetary Fund | October 2019
trade over and above cutting remaining tariffs much room exists for reducing nontariff barriers to trade which are not captured by the indicator considered here7 Overall the Middle East and North Africa Asia and the Pacific and to a greater extent sub-Saharan Africa on average have the most room for reforms although there are broad differences across countries within each region (Figure 37)
The Macroeconomic Effects of Reforms in Emerging Market and Developing Economies
This section quantifies the macroeconomic effects of reforms focusing on average effects in the average emerging market and developing economy Three complementary approaches are followed The first is country time-series empirical analysis of the short- to medium-term response of key macroeconomic outcomesmdashprimarily output but also investment and employmentmdashto reforms in each of the six areas con-sidered in the chapter Special care is taken to control for other drivers of output growth that may obscure the actual impact of reforms (omitted variable bias) and to address the impact that expected growth may have on decisions to undertake reform itself (reverse causality)8 Second to provide additional insight into
7Although they can differ in nature nontariff barriers to trade tend to be pervasive in both advanced and emerging market econ-omies and in low-income developing countries (see for example Ederington and Ruta 2016)
8The statistical method follows the approach proposed by Jordagrave (2005) The baseline specifications control for past economic growth and past reforms as well as country and time-fixed effects A possible concern regarding the analysis is that the probability of structural reform is influenced not only by past economic growth and the occurrence of recessions but also by contemporaneous economic developments and expectations of future growth However this is unlikely to be a major issue given long lags associated with the implementation of structural reforms and that information about future growth is likely to be largely embedded in past economic activity Most important controlling for expectations of current and future growth delivers very similar results to and not different with statistical signif-icance from those reported in this chapter Similar results for the medium-term effects are also obtained when controlling for current economic growth Another possible concern regarding the analysis is that the results may suffer from omitted variable bias as reforms may occur across different areas at the same time or because they are undertaken within the context of broader macroeconomic stabilization packages However including all the reforms simultaneously in the estimated equation and controlling for macroeconomic policies aimed at reducing inflation and pub-lic debt does not substantially alter the magnitude and statistical significance of the results See the discussion later in the chapter and in Online Annex 32 for details
Asia-Pacific Europe MENAP SSA LAC
The scope for further reforms is largest in the Middle East and North Africa and sub-Saharan Africa regions although there is also wide cross-country heterogeneity within each geographical region
Figure 37 Regulatory Indices by Geographical Regions(Scale 0ndash1 higher score indicates greater liberalization)
Sources Alesina and others (forthcoming) and IMF staff calculationsNote Each region includes only EMDEs Bars represent the 2014 value of each index (2013 for the governance index) The horizontal line inside each box represents the median the upper and lower edges of each box show the top and bottom quartiles respectively and the top and bottom markers denote the maximum and the minimum respectively LAC = Latin America and the Caribbean MENAP = Middle East North Africa Afghanistan and Pakistan SSA = sub-Saharan Africa
1 Domestic Finance
00
02
04
06
08
10
00
02
04
06
08
10
Euro
pe
MEN
AP SSA
LAC
2 External Finance
Asia
-Pacific
Euro
pe
MEN
AP SSA
LAC
Asia
-Pacific
3 Trade
00
02
04
06
08
10
00
02
04
06
08
10
Euro
pe
MEN
AP SSA
LAC
4 Product Market
Asia
-Pacific
Euro
pe
MEN
AP SSA
LAC
Asia
-Pacific
5 Labor Market
00
02
04
06
08
10
00
02
04
06
08
10
Euro
pe
MEN
AP SSA
LAC
6 Governance
Asia
-Pacific
Euro
pe
MEN
AP SSA
LAC
Asia
-Pacific
102
W O R L D E C O N O M I C O U T L O O K G LO b a L M a N U FaC T U R I N G D OW N T U R N R Is I N G T R a D E b a R R I E R s
International Monetary Fund | October 2019
the channels through which reforms affect economic activity and to deal with some of the limitations of the country time-series approach industry-level empirical analysis is carried out This analysis exploits the fact that reforms benefit some industries more than othersmdashfor example job protection reform that makes it easier for firms to hire and lay off workers is expected to offer more benefit for industries that typically need high job turnover The third approach adopted to analyze the effects of reforms and shed light on transmission channelsmdashthe role of informality in particularmdashis to use a model that captures key regula-tions and other features of a ldquotypicalrdquo emerging market and developing economy
Country-Level Results
Major historical reforms have had sizable average positive effects on output over the medium term ( Figure 38)9 In normal times the reforms studied in this chapter do not appear to entail short-term macro-economic costs However with some exceptions such as product market deregulation which pays off rather quickly it takes some timemdashtypically at least three yearsmdashfor reform gains to become economically and statistically significant In addition wide confidence bands around point estimates are indicative of signif-icant cross-country differences in the effects of past reforms Some important aspects of this heterogeneity are explored in the next section
The quantitative effects vary across historical major reforms10
bull For domestic finance (Figure 38 panel 1) a major liberalization eventmdashfor example a reform of the size that took place in Egypt in 1992mdashleads to a statistically significant increase in output of about 2 percent on average six years after reform implementation11 Estimates suggest that domestic finance liberalization also increases investment and employment although to a smaller extent The weak impact on investment is
9Major historical reforms correspond to those associated with a change in the relevant indicator above two standard deviations of the distribution (of annual changes in the relevant indicator across the whole sample)
10As stressed earlier the magnitudes of historical reforms are not comparable across different policy areas
11The reform in Egypt involved easing bank entry restrictions and improving banking supervision and regulation
consistent with existing literature that fails to find an unambiguous positive relationship between domestic finance reforms and the quantity of savings and investment (for example Bandiera and others 2000) In contrast the main channel at play seems to be that of an improvement in the
ndash1
0
1
2
3
0 1 2 3 4 5 6ndash1
0
1
2
ndash1 0 1 2 3 4 5 6
ndash1
ndash1
ndash1
0
1
2
3
ndash10 1 2 3 4 5 6
0
2
4
6
0 1 2 3 4 5 6ndash1
0
1
2
ndash1 0 1 2 3 4 5 6
ndash2
0
2
4
6
ndash1 0 1 2 3 4 5 6
1 Domestic Finance
4 Product Market3 Trade
2 External Finance
6 Governance5 Labor Market(Effect on employment)
Empirical estimates point to sizable average effects of reforms that materialize only gradually
Figure 38 Average Effects of Reforms(Percent effect on output unless noted otherwise)
Source IMF staff calculationsNote x-axes in years t = 0 is the year of the shock The lines denote the response to a major historical reform (two standard deviations) The shaded areas denote 90 percent confidence bands
103
C H A P T E R 3 R E I G N I T I N G G R OW T H I N LOW - I N CO M E a N D E M E R G I N G Ma R K E T E CO N O M I E s W H aT R O L E C a N s T R U C T U R a L R E F O R M s P L ay
International Monetary Fund | October 2019
allocative efficiency of financial markets (see for example Abiad Oomes and Ueda 2008)12
bull For external finance (Figure 38 panel 2) a major liberalizationmdashof the type carried out by Romania in 2003 for examplemdashis found to lead to a statistically significant increase in the output level of more than 1 percent six years after the reform13 Estimates also suggest that one of the channels underpinning this increase is higher investment In contrast external finance reforms do not have a large or statistically significant effect on employment (see for example Furceri Loungani and Ostry forthcoming) This implies that the positive output impact of liberaliza-tion largely reflects increases in labor productivity14
bull For international trade (Figure 38 panel 3) a large tariff cutmdashfor example similar to that in Kenya in 1994mdashis estimated to increase output by an average of about 1 percent six years later Labor productivity which rises by about 14 percent after six years is the key transmission channel in line with extensive literature on the productivity gains from trade lib-eralization (for example Ahn and others 2019 and references therein) These aggregate effects on real activity bolster the traditional view against protec-tionism (Furceri and others 2018)
bull In product markets (Figure 38 panel 4) major deregulationmdashsuch as for example the adoption of the Law on Regulators of Public Utilities in Latvia in 2001mdashleads to a statistically significant increase in output of about 1 percent three years after the reform This is a remarkable effect considering that the analysis is restricted to deregulation in only two key network industries namely electricity and telecommunications The gains from broader reforms across a wider range of protected industries would therefore be expected to be larger Further estimates suggest that product market deregulation increases employment and investment as well as productivity in the medium term
12Furthermore the increase in output is larger than the increase in employment which implies an increase in labor productivity At a six-year horizon the productivity increase amounts to 14 percent and the effect is statistically significant
13The reform in Romania included the liberalization of capital movements related to the performance of insurance contracts and other capital flows with significant influence on the real economy such as lifting restrictions concerning the access of nonresidents to bank deposits
14This is in line with recent cross-country studies finding that financial openness affects growth primarily through higher produc-tivity (Bonfiglioli 2008 Bekaert and others 2011)
bull In labor markets (Figure 38 panel 5) a major easing of job protection legislationmdashalong the lines of the labor code revisions in Kazakhstan in 2000 which facilitated dismissal procedures and lowered severance paymdashis found to increase employment by almost 1 percent on average in the medium term Also investment is positively impacted possibly reflecting higher (marginal) returns on capital as employment rises and profitability increases However the short- to medium-term output and productivity effects of job protection deregulation are not found to be statistically significant at conventional levels (Duval and Furceri 2018 has a similar finding for advanced economies)
bull As regards governance (Figure 38 panel 6) an improvement of a magnitude similar to that achieved by Ghana when it adopted its anti-corruption laws in 2006 for example increases output by about 2 percent after six years15 The main transmission channel is investment (IMF 2018) although the reform also has a (smaller) positive and statistically significant effect on employ-ment and labor productivity
Summarizing the results of the empirical analysis suggest that a very ambitious and comprehensive reform agenda involving simultaneous major reforms across all six areas consideredmdashthat is summing up the effects of each individual reform and abstracting from possible complementarities between them which are explored in the next sectionmdashmight raise output in the average emerging market and developing economy by more than 7 percent over a six-year period16 This would raise annual GDP growth more than 1 percentage point and double the current speed of income-per-capita conver-gence to advanced economy levels from about 1 percent to more than 2 percent An even larger increase in annual GDP growth exceeding 125 and 2 percentage points in the average emerging market economy and low-income developing country respectively would be possible under an even more ambitious scenario in
15The index is computed as the arithmetic average of six WGIs (see Online Annex 31 for details)
16Summing up the effects of each individual reform implicitly assumes that reforms do not entail major complementaritymdashwhich would imply a larger gain from a package than from the sum of each individual reform undertaken in isolationmdashor substitutability As discussed in detail in the next section while not all reforms are complementary some of them are As a result the potential gain from a comprehensive reform package may be even larger than reported here
104
W O R L D E C O N O M I C O U T L O O K G LO b a L M a N U FaC T U R I N G D OW N T U R N R Is I N G T R a D E b a R R I E R s
International Monetary Fund | October 2019
which all emerging market and developing economies align their policies in each area with those of the cur-rently most liberalized emerging market economies
Sector-Level Results
As a robustness check for the economy-wide results and to shed further light on transmission channels country-industry-level analysis explores how reforms affect within-country differences in the response of output between industries17 For domestic and external finance the empirical approach follows the method-ology proposed by Rajan and Zingales (1998) which assesses the long-term effect of financial depth on industry growth according to differences in external finance dependence across industries18 For labor market reforms the approach follows Duval Furceri and Jalles (2019) which examines the effect of job protection deregulation on industry-level employment in advanced economies depending on differences in ldquonaturalrdquo layoff rates across industriesmdashthat is the nat-ural propensity of firms in a given industry to adjust their workforce to idiosyncratic shocks19
The industry-level analysis confirms the findings of the aggregate country-level analysis for domes-tic and external finance reforms The difference in medium-term output effects of major domestic finance liberalization between industries with high and low dependence on external finance (at the 75th and
17The analysis focuses on the manufacturing sector and explores the differential effects of reforms across different industries using an unbalanced panel of 19 manufacturing industries at the 2-digit level in 66 emerging market and developing economies from 1973 to 2014 Like the country-level analysis the industry-level analysis also relies on the local projection method but reforms are identified at the industry level by interacting the (country-level) reform variable with relevant industry-specific characteristics that capture each industryrsquos exposure to reform The main advantage of this approach is that it is less prone to endogeneity concerns and thereby to enhance the causal interpretation of the chapterrsquos findings (see Online Annex 32 for technical details)
18Following Rajan and Zingales (1998) the degree of dependence on external finance in each industry is measured as the median across all US firms in each industry of the ratio of total capital expendi-tures minus current cash flows to total capital expenditures
19The measure of ldquonaturalrdquo industry-specific layoff rates is the ratio of the number of workers dismissed for business reasons to total employment in the United States following the methodology proposed by Micco and Pageacutes (2006) and Bassanini Nunziata and Venn (2009) Data on laid-off workers and employed individuals come from the US Current Population Survey covering 2003ndash07 Because of the quasi absence of employment protection legisla-tion the United States provides the closest empirical example of a frictionless labor market and as a result its industries can be seen as exhibiting ldquonaturalrdquo layoff rates
25th percentiles of the cross-industry distribution of external financial dependence) is estimated to be about 6 percentage points (Figure 39 panel 1) Compara-ble results are obtained for external finance reforms ( Figure 39 panel 2)mdasheven though the magnitude and the precision of the point estimates decline in the medium term For labor market reforms the analysis does not find a statistically significant difference on average in the impact of deregulation between indus-tries with high turnover and low turnover However as discussed in the next section this insignificant effect masks considerable heterogeneity depending on whether the reform was undertaken in good or bad times
ndash5
0
5
10
15
ndash1 0 1 2 3 4 5
ndash5
0
5
10
15
ndash1 0 1 2 3 4 5
1 Domestic Finance
2 External Finance
Financial reforms have stronger effects in industries with greater dependence on external sources of financing
Figure 39 Industry-Level Effect of Domestic and External Finance Reforms on Output(Percent)
Source IMF staff calculationsNote x-axes in years t = 0 is the year of the shock The shock represents a major historical reform (two standard deviations) the lines denote the differential impact in percent between the sector at the 75th percentile of the degree of dependence on external finance versus the sector at the 25th percentile the shaded areas denote 90 percent confidence bands External finance dependence in each industry is measured as the median across all US firms in each industry of the ratio of total capital expenditures minus the current cash flow to total capital expenditure
105
C H A P T E R 3 R E I G N I T I N G G R OW T H I N LOW - I N CO M E a N D E M E R G I N G Ma R K E T E CO N O M I E s W H aT R O L E C a N s T R U C T U R a L R E F O R M s P L ay
International Monetary Fund | October 2019
Model-Based Results
The empirical estimates are complemented by use of a structural general equilibrium model that brings three key benefits for assessments of reform impacts20 First it allows for quantification of reform gains over a longer horizon than considered in the empirical analysismdashthe medium to long term once the effects of reforms on the economy fully play out Second while the effects of historical reforms may have varied depending on the quality of their implementation and other prevailing circumstances that might not be fully controlled for in the empirical setup model-based analysis is by design free of such limitations Third it sheds light on the transmission channels of reforms This is because the model captures several key features of many emerging market and developing economiesmdashtheir large informal sectors (La Porta and Shleifer 2008 2014) financial constraints on firm growth (Midrigan and Xu 2014) large sunk costs of registering in the formal sector (Djankov and others 2002) employment protection laws that raise formal sector labor costs (Alesina and others forthcoming) and weak governance that acts as a tax on the output of formal sector firms (Mauro 1995 IMF 2018)21 Another important model feature is that the formal sector is both more capital intensive and more productive than the informal sector and only firms in the formal sector have access to external finance (La Porta and Shleifer 2008 2014)
The model-based analysis points to three key chan-nels through which reforms can increase output they facilitate entry from the informal sector to the formal sector incentivize formal firms to invest and grow and can reduce misallocation of resources between formal firms22 In particular product market and
20The model is an extension of Midrigan and Xu (2014) Online Annex 33 provides a technical description of the model
21It is important to note that data limitations mean that the costs of governance are simply modeled as a fraction of formal sector out-put that is lost (potentially due to corruption and weak rule of law) The model therefore abstracts from many other channels through which governance can affect GDP including through informal firms (see Online Annex 33 for further discussion)
22The model is calibrated to account for the distortions created by regulations studied in the empirical analysis such as productivity differentials between sectors and financial market distortions based on the observed values of key variables such as the private sector debt-to-GDP ratio and the share of employment in the informal sec-tor across a large set of emerging market and developing economies between 2013 and 2018 The size of reforms considered in the analy-sis is designed to be as comparable as possible to the size of reforms presented in the empirical analysis The results are qualitatively robust to and quantitatively stable across alternative calibrations (see Online Annex 33 for further details)
financial market reforms make it easier for infor-mal firms to enter the formal sectormdashthe former by reducing entry costs and the latter by enabling firms to finance such costs Formalization in turn leads to capital deepening higher aggregate productivity and increased output23 Improving governance or easing job protection legislation increases the profitability of formal sector firms directly this encourages them to grow increasing investment and reallocating resources from the less productive informal sector Domestic finance reforms have qualitatively similar effects given that they relax credit constraints on formal sec-tor firms and so enable them to grow rapidly to their optimal size24
The reforms are found to yield largermdashtwice as large on averagemdashoutput gains in the long term than those estimated in the empirical analysis for the medium term (Figure 310)25 Two key factors help explain the higher long-term gains predicted by the model First firm formalization and capital accumulation typically take place over a longer horizon than is considered in the empirical analysis Second the model represents an ideal reform scenario while average empirical estimates also reflect cases of imperfect reform implementation These effects are those for an average emerging market and developing economy given that the model is calibrated to match a large set of average microeco-nomic and macroeconomic characteristics across a large sample of emerging market and developing economies
23The productivity gain from doing business in the formal sector is consistent with the large gap in value added per worker between informal and formal firms reported in La Porta and Shleifer (2008 2014) Drivers of this gap may include among others better access to intermediate inputs (Amiti and Konings 2007) access to export markets (De Loecker 2007) and higher-skilled workers (Ulyssea 2018) Aggregate capital deepening follows from the formal sectorrsquos greater access to credit markets and capital intensity Martin Nataraj and Harrison (2017) finds that product market deregulation in India between 2000 and 2007 led to increases in district-level capital as well as in output and employment
24By contrast resource misallocation across formal firms does not constitute an important source of output gains from these reforms in the model compared with the gains from formalization and increased investment This is partly because restricted access to credit is the only regulation that affects different formal firms differentlymdashand therefore the only one that generates misallocationmdashin this version of the model (see Online Annex 33 for details)
25Reforms simulated with the model are designed to be com-parable in magnitude to those considered in the empirical section (see Online Annex 33 for details) These are large reforms in prac-tice for example the size of the domestic finance reform considered in Figure 310 would enable Mexican firms to increase their leverage raising the corporate sector debt-to-GDP ratio to the level observed in Poland
106
W O R L D E C O N O M I C O U T L O O K G LO b a L M a N U FaC T U R I N G D OW N T U R N R Is I N G T R a D E b a R R I E R s
International Monetary Fund | October 2019
Accounting for Differences across CountriesWhile past reforms have delivered sizable average gains
wide confidence intervals around these estimated impacts point to substantial differences across countries So do the mixed experiences of past reformers even within given regions For example reforms in Latin American economies during the 1980s and 1990s were followed by growth spurts in some cases (such as Chile) but not
in others (such as Argentina or Mexico) Likewise while most reforming countries in central and eastern Europe converged fast to advanced economiesrsquo living standards after the collapse of the Soviet Union in the early 1990s most reforming economies of the Commonwealth of Independent States did not
This section investigates some of the drivers of that heterogeneity by asking the following question Which country characteristics tend to be associated with larger gains from reforms In doing so it highlights the influence of business conditions at the time of reform andmdashfocusing more on longer-term effectsmdashthe importance of informality and interactions across reform areas26
Role of Business Conditions
Prevailing business conditions may affect an econ-omyrsquos short- to medium-term response to reforms in certain areas For example liberalizing credit supply may not elicit much credit and output growth when demand for credit is weak as would be the case in a depressed economy Likewise easing job protection legislation in a recession may not induce firms to recruit but instead incentivize them to lay off work-ers so further reducing aggregate employment and output in the short term (Cacciatore and others 2016) The role of business conditions is explored empirically using state-dependent regressions in which the state of the economy at the time of reform is captured by a smooth-transition function of the GDP growth rate (Auerbach and Gorodnichenko 2012) or alternatively by a dummy variable for crisis27
Although the effects of most reforms do not appear to differ significantly whether passed in good or bad times domestic finance liberalization appears to pay off far more when implemented in an expansionary
26Another open question is whether reform priorities should differ according to the level of development including between emerging market economies and low-income developing countries While there is generally a strong case for tailoring reform priorities along these lines no evidence could be found that the effects of reforms considered in this chapter vary systematically depending on the level of income per capita or across country income groups Likewise a comprehensive analysis of interactions across reforms performed by conditioning the impact of reform in one area on the regulatory stance in other areas did not provide systematic evidence of comple-mentarity (or substitutability) between reforms One exception is the importance of strong governance for other reformsrsquo payoffs which is discussed below
27For technical details see Online Annex 32
Model-based analysis generally predicts larger output gains in the long term than those found in the empirical analysis for the medium term
Figure 310 Output Gains from Major Historical ReformsModel-Based versus Empirical Estimates(Percent of GDP)
Source IMF staff calculationsNote Bars represent the percent increase in aggregate output from a reduction in the corresponding friction at the benchmark calibration The size of the reforms is designed to be in line with a major reform in the reform indices (∆Reform ∆Targeted Moment = (2σ∆Reform Index σReform Index ) middot σTargeted Moment ) For example in the case of domestic finance reform the parameter representing the financial friction is changed such that the credit-to-GDP ratio shifts across the distribution (of the credit-to-GDP ratios across countries) the same way the domestic finance regulation indicator does across the distribution (of this indicator across countries) after a major reform in the empirical analysis1ldquoGovernancerdquo is modeled as a reduction in an implicit tax on formal firmsrsquo revenue While conventional this modeling choice ignores other potential gains from strengthening governance such as lower costs of doing business in the informal sector lower operational uncertainty and reduced misallocation across firms in the formal sectormdashto the extent that these might suffer to different degrees from poor governance
0
2
4
6
Model Empirics0
1
2
3
Model Empirics
0
2
4
6
Model Empirics0
2
4
6
8
Model Empirics
1 Domestic Finance 2 Labor Market
3 Product Market 4 Governance1
107
C H A P T E R 3 R E I G N I T I N G G R OW T H I N LOW - I N CO M E a N D E M E R G I N G Ma R K E T E CO N O M I E s W H aT R O L E C a N s T R U C T U R a L R E F O R M s P L ay
International Monetary Fund | October 2019
phase of the business cycle (Figure 311 panels 1 and 2) Under very strong business conditions the estimated impact of reform on output is found to be three times larger than it would be in normal times consistent with a stronger response of credit demand to credit supply deregulation during an economic boom By contrast point estimates suggest that financial liberalization can be contractionary if passed when economic conditions are weak although this negative effect is not statistically distinguishable from zero One interpretation of this result is that increasing compe-tition in the financial sector at a time of weak credit demand may push certain financial intermediaries out of business further weakening the economy
Likewise job protection deregulation appears to deliver short-term gains in good times but not in bad times (Figure 311 panels 3 and 4) This is in line with previous IMF evidence for advanced economies (Duval and Furceri 2018 Duval Furceri and Jalles 2019) and reflects the fact that when it is easier to hire and fire workers firms tend to increase primarily hires when they face strong demand for their goods and servicesmdashwhile they tend to increase primarily layoffs when facing weak demand Job protection deregulation when implemented during strong economic conditions is estimated to raise employment three times as much as when enacted in normal times If undertaken during a financial crisis it may even be contractionary although the estimated negative effect is not statisti-cally distinguishable from zero Industry-level results are consistent with these country-level estimates (Figure 311 panels 5 and 6) When the labor mar-ket is liberalized in good times employment rises significantly in industries with high natural layoff ratesmdashthat is those where stringent job protection legislation is likely to be more bindingmdashrelative to those with low layoff rates The reverse holds when the reform is implemented during bad times employment in industries with high layoff rates falls more than in industries with low layoff rates These results suggest that accompanying macroeconomic policies that boost aggregate demand could magnify the effects of certain structural reforms28
28For example further analysis not reported here suggests that labor market reforms are more effective at raising output when implemented together with expansionary fiscal policy This is in line with previous IMF analysis for advanced economies (Chapter 3 of the April 2016 WEO Duval Furceri and Jalles 2019)
ndash1
ndash1
ndash1
Some reforms do not pay off when undertaken in bad times
Figure 311 Effects of Reforms The Role of Macroeconomic Conditions(Percent)
Source IMF staff calculationsNote x-axes in years t = 0 is the year of the shock Red lines denote the percent response to a major historical reform (two standard deviations) Shaded areas denote 90 percent confidence bands Blue lines represent the unconditional result
1 Weak EconomicConditions
2 Strong EconomicConditions
5 Weak EconomicConditions
6 Strong EconomicConditions
3 Crisis 4 No Crisis
0 1 2 3 4 50 1 2 3 4 5
ndash1 0 1 2 3 4 5ndash20
ndash15
ndash10
ndash5
0
5
ndash1 0 1 2 3 4 5
0
1
2
3
ndash1 0 1 2 3 4 5
0
2
4
6
8
10
12
14
ndash2
ndash5
ndash4
ndash3
ndash2
ndash1
0
1
2
0 1 2 3 4 5
ndash2
0
2
4
6
8
10
ndash5
ndash4
ndash3
ndash2
ndash1
0
1
2
3
Effect of Domestic Finance Reforms on Output
Effect of Labor Market Reforms on Employment
Effect of Labor Market Reforms on Sectoral Employment
108
W O R L D E C O N O M I C O U T L O O K G LO b a L M a N U FaC T U R I N G D OW N T U R N R Is I N G T R a D E b a R R I E R s
International Monetary Fund | October 2019
Role of Informality
The role of individual country characteristics for the impact of reform is investigated using both empirical and model-based analyses On the empirical side the chapter uses a flexible approach to explore sources of parameter heterogeneity across units (countries) the Bayesian hierarchical empirical model along the lines of Boz Gopinath and Plagborg-Moslashller (2017) This method makes it possible to estimate flexibly the country-specific impact of each reform conditional on observed individual country characteristics such as the weight of the informal sector in the economy (see Online Annex 32 for technical details)29 On the model side the impact of a given reform is simulated under alternative sets of regulations and characteris-tics such as under low versus high barriers to entry in the formal sectormdashthat is under high versus low informality30
Among the many possible country characteristics that could shape the impact of reforms informality appears particularly important Empirical find-ings suggest that in most areas (domestic finance product and labor market regulations governance) reforms have larger effects when informality is high ( Figure 312 panels 1ndash4) At a five-year horizon the gain from reform is typically twice as large in a country with a high degree of informality (at the 75th percentile of the cross-country distribution of informality rates) as in a country with low infor-mality (at the 25th percentile of the distribution) Model-based analysis also points to larger reform gains in an economy with a higher initial level of informality (such as India) than in one with lower informality (such as South Africa or Panama) as shown in Figure 313
Reforms tend to pay off more when informality is higher because one of the effects of reforms is precisely
29The main advantage of this approach over the more conven-tional use of multiplicative interactions is that it does not impose any functional form on the interaction between the country characteristic of interest (for example the level of informality) and the reform coefficient but instead uses a nonparametric specification for the distribution of the coefficient conditional on the country characteristic
30In the model the size of the informal sector is determined by all the structural features of the economy including regulations Here the lower-informality economy is one in which entry costs into the formal sector are lower than in the baseline casemdashthey are set equal to the 25th percentile of the cross-country distribution of entry costs The higher-informality economy is the baseline economy
to reduce informality which in turn benefits the econ-omy This channel is generally more powerful when informality is high to start with For example cut-ting barriers to entry in the formal sector or explicit (labor) and implicit (corruption) taxes on formal firms induces some informal firms to become formal In turn formalization boosts output by increasing productivity and capital accumulation for example becoming formal can help firms invest by enhancing their access to credit and improve their productivity by giving them access to better intermediate inputs or export markets Empirical analysis confirms that this formalization channel is important Applying the local projection method to study the impact on informal-ity of a change in the average regulation indicator (across the areas studied in this chapter) suggests
Gains from past reforms have been larger in economies with higher informality
Figure 312 Effects of Reforms on Output The Role of Informality(Percent)
Source IMF staff calculationsNote Bars denote the five-year-ahead output response to a major historical reform (two standard deviations) Low (high) informality refers to a level of informality equal to the 25th (75th) percentile of the distribution of the informality index
00
05
10
15
0
1
2
3
4
Lowinformality
Medianinformality
Highinformality
Lowinformality
Medianinformality
Highinformality
Lowinformality
Medianinformality
Highinformality
Lowinformality
Medianinformality
Highinformality
1 Domestic Finance 2 Product Market
3 Labor Market 4 Governance
0
2
1
3
4
5
00
05
10
15
20
109
C H A P T E R 3 R E I G N I T I N G G R OW T H I N LOW - I N CO M E a N D E M E R G I N G Ma R K E T E CO N O M I E s W H aT R O L E C a N s T R U C T U R a L R E F O R M s P L ay
International Monetary Fund | October 2019
that a major broad-based reform is associated with a statistically significant decrease in informality of about 1 percentage point at a five-year horizon (Figure 314) This is consistent with evidence reported in microeco-nomic studies31
31See McCaig and Pavcnik (2018) for the effects of liberalizations in Vietnam Martin Nataraj and Harrison (2017) for the same in India and Paz (2014) for the same in Brazil Benhassine and others (2018) provides experimental evidence on the impact of formalization reforms in Benin Kaplan Piedra and Seira (2011) and Bruhn (2011) study
Reform Complementarities
Reforms do not always entail complementarity (or substitutability) in the sense that a package combining multiple reforms does not necessarily yield a larger (or smaller) gain than the sum of the effects of each reform taken in isolation This is confirmed by rather inconclusive empirical analysis (using the Bayesian pro-cedure mentioned earlier) of whether countries reaped larger gains from a given reform when they had already deregulated other areas in general reforms are not found to have widely different effects across different countries with different regulations Model analysis confirms that reforms need not always be complemen-tary and it also explains why For example as reforms
the impact of deregulation on firmsrsquo market entry in Mexico How-ever Mexicorsquos experience highlights the variation in the response of informality across reform areas and its dependence on reform design Despite major macroeconomic reforms during the 1990s informality has since risen considerably (Levy 2018) coinciding with slow pro-ductivity growth Levy (2008) argues that this increase in informality resulted from the introduction of new policies (such as changes in the relative benefits provided by contributory and noncontributory social insurance programs among others) in the early 2000s that disincentiv-ized firms and workers to formalize
Model simulations imply that economies with larger informal sectors benefit somewhat more from reforms
Figure 313 Model-Implied Gains from Reforms The Role of Informality(Percent)
0
1
2
3
4
5
0
2
4
6
0
2
4
6
8
Lowerinformality
Higherinformality
Lowerinformality
Lowerinformality
Higherinformality
Higherinformality
Lowerinformality
Higherinformality
00
05
10
15
20
25
1 Domestic Finance 2 Labor Market
3 Product Market 4 Governance1
Source IMF staff calculationsNote Bars represent the percent increase in aggregate output from a reduction in the corresponding friction at either the lower informality or higher informality benchmark calibration The higher informality calibration is the benchmark calibration for the median economy The lower informality calibration is constructed by reducing the entry regulation friction to its 25th percentile in the data The size of the reforms is designed to be in line with a two-standard-deviation change in the reform indices1ldquoGovernancerdquo is modeled as a reduction in an implicit tax on formal firmsrsquo revenue While conventional this modeling choice ignores other potential gains from strengthening governance such as lower costs of doing business in the informal sector lower operational uncertainty and reduced misallocation across firms in the formal sectormdashto the extent that these might suffer to different degrees from poor governance
A major reform across the areas covered in the empirical analysis is associated with a subsequent reduction in informality
Figure 314 Effect of Reforms on Informality(Percent)
Source IMF staff calculationsNote x-axis in years t = 0 is the year of the shock The lines denote the response of the informality indicator to an average reform of size two standard deviations The shaded areas denote 90 percent confidence bands
ndash25
ndash20
ndash15
ndash10
ndash05
00
ndash1 0 1 2 3 4 5
110
W O R L D E C O N O M I C O U T L O O K G LO b a L M a N U FaC T U R I N G D OW N T U R N R Is I N G T R a D E b a R R I E R s
International Monetary Fund | October 2019
are implemented informality falls reducing the scope for further declines in informality and thereby damp-ening potential gains from other reforms
However policymakers can exploit specific reform complementarities notably by prioritizing improve-ments in governance This may in part help explain the success in income convergence of some eastern Euro-pean countries such as Estonia Latvia and Romania that joined the European Union and have carried out major reforms alongside improvements in governance since the 1990s Bearing in mind the limitations of governance indicators mentioned above the empirical
analysis indicates that the impact of past reforms was most often larger in countries where the quality of gov-ernance was higher while reforms yielded considerably smaller gains where governance was weaker (Figure 315 panel 4) The quality of governance matters particularly for the impact of product market deregulation such reforms failed to pay off where governance was poor but delivered larger gains where governance was strong This is consistent with the view that reduced entry barriers in product markets foster new firm entry and push incum-bent firms to be more efficient and innovative only if all firms are treated equally which is easier to achieve when the rule of law is strong and property rights are strictly enforced By the same token strong governance can magnify the gains from other pro-competition reforms in finance or international trade
Complementarities also exist between reforms that incentivize firms to grow and reforms that enable them to do so Key among the growth-enabling reforms is domes-tic finance liberalization which by improving access to credit can magnify the gains from reforms in other areas As an illustration model-based analysis highlights the complementarity between reforms that liberalize labor markets and financial markets simultaneouslymdashas for example Bolivia did in 198532 Labor market reform improves the profitability of the formal sector inducing formal firms to expand and informal ones to formalize Given that entrepreneurs need to finance their entry into the formal sector and their capital investment improv-ing access to credit through liberalization of domestic financemdashalongside strengthened financial sector super-vision33mdashamplifies the investment and output effects of labor market reform (Figure 316)34
Summary and Policy ImplicationsKey findings of this chapter make a strong case for
a renewed structural reform push in emerging market and developing economies for two main reasons First even after the major liberalization wave of the 1990s much scope generally remains for further reforms in
32In 1985 Bolivia removed directed credit by the government and liberalized interest rate controls In addition Supreme Decrees 7072 9190 and 17610 were repealed reestablishing the right of employers to dismiss workers according to previously existing provisions
33While not captured by the model used here sound supervision is key to alleviating risks of a buildup in financial sector vulner-abilities following domestic finance liberalization (Johnston and Sundararajan 1999)
34See Online Annex 33 for further technical details
Stronger governance magnifies the impact of reforms
Figure 315 Effects of Reforms on Output The Role of Governance(Percent)
00
05
10
15
0
1
2
3
0
1
2
3
4
Wea
kgo
vern
ance
Med
ian
gove
rnan
ce
Stro
nggo
vern
ance
Wea
kgo
vern
ance
Med
ian
gove
rnan
ce
Stro
nggo
vern
ance
Wea
kgo
vern
ance
Med
ian
gove
rnan
ce
Stro
nggo
vern
ance
Wea
kgo
vern
ance
Med
ian
gove
rnan
ce
Stro
nggo
vern
ance
0
1
2
3
4
1 Domestic Finance 2 External Finance
3 Trade 4 Product Market
Sources IMF reform data set and IMF staff calculationsNote Bars denote the five-year-ahead output response to a major historical reform (two standard deviations) Weak (strong) governance refers to a level of governance equal to the 25th (75th) percentile of the distribution of the governance index
111
C H A P T E R 3 R E I G N I T I N G G R OW T H I N LOW - I N CO M E a N D E M E R G I N G Ma R K E T E CO N O M I E s W H aT R O L E C a N s T R U C T U R a L R E F O R M s P L ay
International Monetary Fund | October 2019
the areas covered in this chapter domestic and external finance international trade labor and product market regulations and governance This holds true particu-larly for low-income developing countriesmdashnotably across sub-Saharan Africa and to a lesser extent in the Middle East and North Africa and Asia and Pacific regions Second the reforms studied in this chapter are not found to entail short-term macroeconomic costsmdashexcept for some of them when implemented in bad timesmdashand they can yield sizable output and employ-ment gains in the medium to long term for a typical emerging market and developing economy major simultaneous reforms across the areas listed above could raise annual economic growth by about 1 percentage point over five to 10 years doubling the current speed of income-per-capita convergence to advanced econ-omy levels over the next decade In countries where informality is comparatively high reform gains could be even larger all else equal In addition these esti-mates do not factor in further potential gains from other growth-oriented policies not covered in this chapter such as improving education and health care
systems public infrastructure spending frameworks and laws and regulations that impede womenrsquos labor force participation
At the same time reform in one area has different effects across economies depending on their exist-ing regulations in other areas and prevailing business conditions at the time of reform This suggests that getting reform packaging sequencing and prioritizing right is key to maximizing payoffs Concrete actions to improve governance and facilitate access to credit by firms are often an important step to remove bind-ing constraints on growth and amplify reform gains In countries where economic conditions are weak priority should also be given to reformsmdashsuch as cutting barriers to international trade or firm entry in domestic nonmanufacturing industriesmdashwhose gains do not depend on prevailing economic conditions Reforms such as easing job protection legislation and deregulating the domestic financial sector that do not pay off in bad times would be best enacted with a credible provision that they will take effect later when economic conditions are stronger If it is not possi-ble to delay when they take effect (for labor market reforms) reforms can be grandfatheredmdashthat is new rules would apply only to new beneficiariesmdashalthough this comes at the cost of delaying the full gains from reform In addition job protection deregulation should be accompanied by some strengthening of social safety nets (Duval and Loungani 2019) In countries with credible medium-term fiscal frameworks and available fiscal space countercyclical fiscal policy could also alleviate short-term costs of reforms
Reform strategies should also internalize political economy considerations Even if reforms deliver a net gain for society as a whole they often produce hard-to-perceive gains that are spread broadly across the population while losses are more visible and concen-trated on small but sometimes powerful population groups (Olson 1971) Experience with past reforms highlights the need for careful design and prioritiza-tion ownership good communication and transpar-ency to ensure broad-based support
There are also three more specific lessons from the past First given that reforms take time to deliver government should act swiftly following an electoral victory to implement them during their political ldquohoneymoonrdquo period This strategy will mitigate potential political costs (Box 31) Second reforms are best implemented when economic conditions are
Packaging labor market reform with domestic finance deregulation entails complementarities and amplifies aggregate output gains
Figure 316 Gain from Packaging Domestic Finance and Labor Market Reforms(Additional percent gain from packaging reforms)
Source IMF staff calculationsNote Bars represent the difference between the impact from a package combining both reforms and the sum of the impacts from each reform in isolation in percent
0
2
4
6
8
10
12
14
Output Investment
112
W O R L D E C O N O M I C O U T L O O K G LO b a L M a N U FaC T U R I N G D OW N T U R N R Is I N G T R a D E b a R R I E R s
International Monetary Fund | October 2019
W O R L D E C O N O M I C O U T L O O K G LO b a L M a N U FaC T U R I N G D OW N T U R N R Is I N G T R a D E b a R R I E R s
favorablemdashthat is governments should ldquofix the roof while the sun is shiningrdquo In bad times because voters are often unable to disentangle the effect of reform from that of poor economic conditions reforms tend to be electorally costly During recessions macro-economic policy supportmdashwhere feasiblemdashmay reduce the political costs of reform Third policy-makers should factor in and implement up-front
complementary reforms to mitigate any adverse effects of reforms on income distribution Strong social safety nets and active labor market programs that help workers move across jobs can help in this regard given that reforms often lead simultaneously to new job creation and destruction Reforms whose gains are captured only by a small fraction of society risk losing support and could stall or be undone down the road
113
C H A P T E R 3 R E I G N I T I N G G R OW T H I N LOW - I N CO M E a N D E M E R G I N G Ma R K E T E CO N O M I E s W H aT R O L E C a N s T R U C T U R a L R E F O R M s P L ay
International Monetary Fund | October 2019
While the evidence presented in this chapter speaks strongly in favor of the economic benefits of struc-tural reforms their political benefits are much less clear which has long been perceived as an obstacle to reform One problem is that even if reforms deliver a net gain for society as whole they often produce hard-to-perceive gains spread broadly across the population and more visible losses that are concentrated on small but sometimes powerful population groups (Olson 1971) For example cutting barriers to entry in a network industrymdashsuch as electricity or telecommuni-cations both of which are considered in this chaptermdashtypically yields diffuse gains to consumers in the form of lower prices or better products while incumbent firms and workers may lose much from the entry of new competitors and reduced profits In these circum-stances politicians may hold back on reforms for fear they will be penalized at the ballot box by vocal losers from reform
This box examines empirically whether fears of a political cost of reform are supported by historical experience Specifically it asks whether structural reforms lead to electoral losses or gains and whether the timing of reform in the electoral cycle and the state of the economy matter for subsequent electoral outcomes
To examine these issues the analysis maps a new data set on electoral outcomes with the new reform data set presented in the chapter and estimates the effect of reforms on the change in the vote share of the incumbent party or coalition in the following elec-tion1 This dependent variable is especially useful in assessing the magnitude of electoral penalties or gains from reforms A leader of the executive might remain in office but with a much-reduced majority or might be forced into a coalition government
The key independent variable used in the analysis is the unweighted average of all the reform indices2
This box was prepared by Davide Furceri and largely draws from Ciminelli and others (forthcoming) and Alesina and others (forthcoming)
1The electoral database in this study covers an unbalanced sample of democratic elections from 1973 (or the first year in which the country is characterized as a democratic regime) to 2014 for 66 advanced and developing economies
2See Alesina and others (forthcoming) for additional details including estimates for each individual reform indicator sepa-rately The baseline specification includes the following set of con-trol variables (1) average GDP growth during the electoral term (2) a developed country dummy (taking value 1 for continuous
The results of the analysis suggest that reforms entail electoral costs only when implemented in the year before an election in this case a major broad-based reform (defined in the rest of the chapter as a major change across all regulatory areas simultaneously) is associated with a decrease in the vote share of the coalition of about 3 percentage points This effect is economically significant and is roughly equivalent to a 17 percentage point reduction in the likelihood of the incumbent leader of the coalition being reelected (Figure 311) In contrast reforms earlier in an incumbentrsquos term do not appear to affect election pros-pects These results are suggestive of myopic behavior of the electorate and are also consistent with empirical evidence in this chapter that the economic gains from reforms take time to materialize
These average results mask considerable differences across reformers depending on whether measures were implemented in good or bad times (Figure 312) Reforms are not found to entail political costs when undertaken under strong economic conditions but they tend to be politically costly when enacted in peri-ods of weak economic activity possibly because they lead to larger distributional costs (Alesina and others forthcoming) and voters fail to disentangle the effects of reform from those of poor economic conditions Because reforms have been predominantly undertaken under weak economic conditions (Box 32) their average impact on the vote share is also estimated to be negative (Figure 312)
These results hint at two ways reform strategies can helpfully internalize political-economy consider-ations and maximize chances of political success First because reforms take time to deliver governments should act swiftly following an electoral victory to implement reforms during their political ldquohoneymoonrdquo period Second reforms are best implemented when economies are performing well
Organisation for Economic Co-operation and Development membership since 1963 and 0 otherwise) (3) a dummy variable for new democracies (taking value 1 for the first four elections after a year in which the country considered gets a negative Polity score on the ndash10 to 10 scale and 0 otherwise) (4) a dummy variable for a majoritarian political system (taking value 1 for countries with an electoral system that awards seats in winner-takes-all fashion in geographically based districts according to the Database of Political Institutions and 0 otherwise) (5) the initial average level of regulation across the areas considered and (6) the level of the vote share in the previous election See Online Annex 33 for further details on the empirical methodology
Box 31 The Political Effects of Structural Reforms
114
W O R L D E C O N O M I C O U T L O O K G LO b a L M a N U FaC T U R I N G D OW N T U R N R Is I N G T R a D E b a R R I E R s
International Monetary Fund | October 2019
1 Vote Share
ndash20
ndash15
ndash10
ndash5
0
5
ndash35
ndash30
ndash25
ndash20
ndash15
ndash10
ndash05
00
05
Year of election Rest of term
Year of election Rest of term
2 Probability of Reelection
Figure 311 The Effect of Reform onElectoral Outcomes(Percentage points)
Source IMF staff calculationsNote The bars denote the effect of a major reform eventmdashdefined as a change in the broad regulation indicator of two standard deviations (of the sample distribution of annual changes in the regulation indicator)mdashon electoral outcomes and denote statistical significance at the 5 percent and 1 percent confidence levels respectively
ndash7
ndash6
ndash5
ndash4
ndash3
ndash2
ndash1
0
1
2
Average Weakeconomicconditions
Strongeconomicconditions
Source IMF staff calculationsNote The bars denote the effect of a major reform eventmdashdefined as a change in the broad regulation indicator of two standard deviations (of the sample distribution of annual changes in the regulation indicator)mdashon electoral outcomes denotes statistical significance at the 1 percent confidence level
Figure 312 The Effect of Reform on Vote Share The Role of Economic Conditions(Percentage points)
Box 31 (continued)Box 31 (continued)
115
C H A P T E R 3 R E I G N I T I N G G R OW T H I N LOW - I N CO M E a N D E M E R G I N G Ma R K E T E CO N O M I E s W H aT R O L E C a N s T R U C T U R a L R E F O R M s P L ay
International Monetary Fund | October 2019
A broad range of political and economic factors can explain why and when reforms (do not) happen one of these which is particularly significant is the presence of a crisis Political factors may include government ideology the type of political system (presidential versus parliamentary) the degree of political fragmentation and the strength of democratic institutions (Ciminelli and others forthcoming and references therein) Economic factors may include prevailing business conditions in particular Crises can act as turning points and catalyze popular support for reform by increasing the cost of and the support of incumbent workers and firms (ldquoinsidersrdquo) for maintaining the status quo At the same time crises may lead to increased parliamentary fragmentation which could weaken reform efforts (Mian Sufi and Trebbi 2014)
The relationship between crisis and reform may depend on whether the crisis is economic or finan-cial and it may also differ across regulatory areas A collapse in domestic demand may lower opposition to trade liberalization from industries that usually rely on domestic demand (Lora and Olivera 2005) Similarly periods of high unemployment may increase pressure on governments to enact reforms that ease labor mar-ket regulation in the hope of boosting employment (Duval Furceri and Miethe 2018) By contrast a financial crisis after a period of deregulation could lead governments to reregulate the financial sector and the economy (Mian Sufi and Trebbi 2014 Gokmen and others 2017)
This box examines empirically the role of crises in fostering reforms using a vector autoregression (VAR) framework This approach has two main advantages over a static framework First it allows investigation of the possibility that crises lead to reforms with long lags an issue neglected in the empirical literature Second it makes it possible to account for feedback effects between changes in regulation in different areas The set of structural reforms considered in the analysis is the same as in the rest of the chapter As for
This box was prepared by Gabriele Ciminelli and draws largely from Ciminelli and others (forthcoming)
crises both economic recessions (defined as periods of negative real GDP growth) and systemic banking crises (defined in Laeven and Valencia 2008 2012) are investigated
Two VARs (one for eachmdasheconomic or financialmdashtype of crisis) are estimated according to the fol-lowing model
X it = A 0 + sum l=1 4 A l X itminusl + τ t + γ i + ε it (321)
in which the subscripts i and t refer to country and time X it is a seven-variable vector containing the crisis dummy considered and the six structural reform indicators (in first differences) A 0 is a vector of constant terms A l is the vector of parameters to be estimated τ t and γ i refer respectively to time- and country-fixed effects and ε it is the error term Four lags of the dependent variables are included The responses of reforms to crises are obtained using a Cholesky decomposition with the crisis dummy ordered first the implicit assumption is that the occur-rence of a crisis in year t does not depend on reforms implemented in the same year1
The results suggest that economic and banking crises have different effects on structural reforms ( Figure 321) Economic recessions foster trade liberalization and to a lesser extent labor market and financial deregulation over the medium term These results are supportive of the ldquocrisis-induces-reformrdquo hypothesis and consistent with the findings of Lora and Olivera (2004) and Duval Furceri and Miethe (2018) They suggest that governments respond to weaker external demand and higher unemployment by opening up to trade and liberalizing the labor market to foster employment By contrast banking crises are found to foster tighter regulation in the domestic finance and capital account areas These effects are rather large and can be interpreted as an attempt by governments to control or mitigate perceived sources of financial instability
1The ordering of the (reform) variables ldquobelowrdquo the crisis dummy does not alter the results (for a formal derivation see Christiano Eichenbaum and Evans 1999)
Box 32 The Impact of Crises on Structural Reforms
116
W O R L D E C O N O M I C O U T L O O K G LO b a L M a N U FaC T U R I N G D OW N T U R N R Is I N G T R a D E b a R R I E R s
International Monetary Fund | October 2019
Two years Four years Six years
1 Banking Crisis
Trad
e
Capi
tal
acco
untndash005
ndash004
ndash003
ndash002
ndash001
000
001
002
003
ndash005
ndash004
ndash003
ndash002
ndash001
000
001
002
003
Dom
estic
finance
Prod
uct
mar
ket
Labo
rm
arke
t
Gove
rnan
ce
2 Recession
Trad
e
Capi
tal
acco
unt
Dom
estic
finance
Prod
uct
mar
ket
Labo
rm
arke
t
Gove
rnan
ce
Source IMF staff calculationsNote The figure reports the effects of banking crises (panel 1) and economic recessions (panel 2) on structural reforms over two- four- and six-year horizons Each indicator ranges from 0 to 1 Bars with denote statistical significance at least at 10 percent Bars without denote statistically insignificant results Standard errors are computed via Monte Carlo simulations with 1000 repetitions
Figure 321 The Effect of Crises on Structural Reforms(Reform indicator units)
Box 32 (continued)
117
C H A P T E R 3 R E I G N I T I N G G R OW T H I N LOW - I N CO M E a N D E M E R G I N G Ma R K E T E CO N O M I E s W H aT R O L E C a N s T R U C T U R a L R E F O R M s P L ay
International Monetary Fund | October 2019
ReferencesAbiad Abdul Enrica Detragiache and Thierry Tressel 2010 ldquoA
New Database of Financial Reformsrdquo IMF Working Paper 08266 International Monetary Fund Washington DC
Abiad Abdul Nienke Oomes and Kenichi Ueda 2008 ldquoThe Quality Effect Does Financial Liberalization Improve the Allocation of Capitalrdquo Journal of Development Economics 87 (2) 270ndash82
Acemoglu Daron Simon Johnson and James Robinson 2005 ldquoInstitutions as a Fundamental Cause of Long-Run Growthrdquo In Handbook of Economic Growth 1A edited by Philippe Aghion and Steven Durlauf Amsterdam Elsevier
Ahn Jaebin Era Dabla-Norris Romain Duval Bingjie Hu and Lamin Njie 2019 ldquoReassessing the Productivity Gains from Trade Liberalizationrdquo Review of International Economics 27 (1) 130ndash54
Aiyar Shekhar John Bluedorn Romain Duval Davide Furceri Daniel Garcia-Macia Yi Ji Davide Malacrino Haonan Qu Jesse Siminitz and Aleksandra Zdzienicka 2019 ldquoStrength-ening the Euro Area The Role of National Reforms in Enhancing Resiliencerdquo IMF Staff Discussion Note 1905 International Monetary Fund Washington DC
Alesina Alberto Davide Furceri Jonathan Ostry Chris Papageorgiou and Dennis Quinn Forthcoming ldquoStruc-tural Reforms and Electoral Outcomes Evidence from a New Database of Regulatory Stances and Policy Changesrdquo IMF Working Paper International Monetary Fund Washington DC
Amiti Mary and Jozef Konings 2007 ldquoTrade Liberalization Intermediate Inputs and Productivityrdquo American Economic Review 97 (5) 1611ndash38
Atkeson Andrew and Patrick J Kehoe 2007 ldquoModeling the Transition to a New Economy Lessons from Two Technologi-cal Revolutionsrdquo American Economic Review 97 (1) 64ndash88
Auerbach Alan and Youri Gorodnichenko 2012 ldquoMeasuring the Output Responses to Fiscal Policyrdquo American Economic Journal Economic Policy 4 (2) 1ndash27
Bandiera Oriana Gerard Caprio Patrick Honohan and Fabio Schiantarelli 2000 ldquoDoes Financial Reform Raise or Reduce Savingrdquo Review of Economics and Statistics 82 (2) 239ndash63
Bassanini Andrea Luca Nunziata and Danielle Venn 2009 ldquoJob Protection Legislation and Productivity Growth in OECD Countriesrdquo Economic Policy 24 (58) 349ndash402
Basu Susanto and John G Fernald 1997 ldquoReturns to Scale in US Production Estimates and Implicationsrdquo Journal of Political Economy 105 (2) 249ndash83
Bekaert Geert Campbell Harvey Christian Lundblad and Stephan Siegel 2011 ldquoWhat Segments Equity Mar-ketsrdquo Review of Financial Studies 24 (12) 3841ndash90
Benhassine Najy David McKenzie Victor Pouliquen and Massimiliano Santini 2018 ldquoDoes Inducing Informal Firms to Formalize Make Sense Experimental Evidence from Beninrdquo Journal of Public Economics 157 1ndash14
Bonfiglioli Alessandra 2008 ldquoFinancial Integration Produc-tivity and Capital Accumulationrdquo Journal of International Economics 76 (2) 337ndash55
Botero Juan C Simeon Djankov Rafael La Porta Florencio Lopez-de-Silanes and Andrei Shleifer 2004 ldquoThe Regulation of Laborrdquo Quarterly Journal of Economics 119 (4) 1339ndash82
Boz Emine Gita Gopinath and Mikkel Plagborg-Moslashller 2017 ldquoGlobal Trade and the Dollarrdquo IMF Working Paper 17239 International Monetary Fund Washington DC
Bruhn Miriam 2011 ldquoLicense to Sell The Effect of Business Registration Reform on Entrepreneurial Activity in Mexicordquo Review of Economics and Statistics 93 (1) 382ndash86
Buera Francisco J and Yongseok Shin 2017 ldquoProduc-tivity Growth and Capital Flows The Dynamics of Reformsrdquo American Economic Journal Macroeconomics 9 (3) 147ndash85
Cacciatore Matteo Romain Duval Giuseppe Fiori and Fabio Ghironi 2016 ldquoMarket Reforms in the Time of Imbalancerdquo Journal of Economic Dynamics and Control 72 69ndash93
Cerra Valerie and Sweta Saxena 2008 ldquoGrowth Dynamics The Myth of Economic Recoveryrdquo American Economic Review 102 (7) 3774ndash77
Christiano Lawrence J Martin Eichenbaum and Charles L Evans 1999 ldquoMonetary Policy Shocks What Have We Learned and to What Endrdquo In Handbook of Macroeconomics 1 (1) edited by John B Taylor and Michael Woodford 65ndash148 Amsterdam Elsevier
Christiansen Lone Martin Schindler and Thierry Tressel 2013 ldquoGrowth and Structural Reforms A New Assessmentrdquo Journal of International Economics 89 (2) 347ndash56
Ciminelli Gabriele Davide Furceri Jun Ge Jonathan D Ostry and Chris Papageorgiou Forthcoming ldquoThe Political Costs of Reforms Fear or Realityrdquo IMF Staff Discussion Note International Monetary Fund Washington DC
De Loecker Jan 2007 ldquoDo Exports Generate Higher Productivity Evidence from Sloveniardquo Journal of International Economics 73 (1) 69ndash98
Djankov Simeon Rafael La Porta Florencio Lopez-de-Silanes and Andrei Shleifer 2002 ldquoThe Regulation of Entryrdquo Quarterly Journal of Economics 117 (1) 1ndash37
Duval Romain and Davide Furceri 2018 ldquoThe Effects of Labor and Product Market Reforms The Role of Macro-economic Conditions and Policiesrdquo IMF Economic Review 66 (1) 31ndash69
Duval Romain Davide Furceri and Joao Jalles 2019 ldquoJob Protection Deregulation in Good and Bad Timesrdquo Oxford Economic Papers (July 21)
Duval Romain Davide Furceri and Jakob Miethe 2018 ldquoThe Needle in the Haystack What Drives Labor and Product Market Reforms in Advanced Countriesrdquo IMF Working Paper 18101 International Monetary Fund Washington DC
Duval Romain and Prakash Loungani 2019 ldquo Designing Labor Market Institutions in Emerging Market and Developing
118
W O R L D E C O N O M I C O U T L O O K G LO b a L M a N U FaC T U R I N G D OW N T U R N R Is I N G T R a D E b a R R I E R s
International Monetary Fund | October 2019
Economies Evidence and Policy Optionsrdquo IMF Staff Discussion Note 1904 International Monetary Fund Washington DC
Ebell Monique and Christian Haefke 2009 ldquoProduct Market Deregulation and the US Employment Miraclerdquo Review of Economic Dynamics 12 (3) 479ndash504
Ederington Josh and Michele Ruta 2016 ldquoNon-Tariff Measures and the World Trading Systemrdquo World Bank Policy Research Paper 7661 World Bank Washington DC
Fabrizio Stefania Davide Furceri Rodrigo Garcia-Verdu Bin G Li Sandra V Lizarazo Ruiz Marina Mendes Tavares Futoshi Narita and Adrian Peralta-Alva 2017 ldquoMacro-Structural Policies and Income Inequality in Low-Income Developing Countriesrdquo IMF Staff Discussion Note 1701 International Monetary Fund Washington DC
Furceri Davide Swarnali Hannan Jonathan Ostry and Andrew Rose 2018 ldquoMacroeconomic Consequences of Tariffsrdquo NBER Working Paper 25402 National Bureau of Economic Research Cambridge MA
Furceri Davide Prakash Loungani and Jonanthan Ostry Forthcoming ldquoThe Aggregate and Distributional Effects of Financial Globalization Evidence from Macro and Sectoral Datardquo Journal of Money Credit and Banking
Gokmen Gunes Massimiliano G Onorato Tommaso Nannicini and Chris Papageorgiou 2017 ldquoPolicies in Hard Times Assessing the Impact of Financial Crises on Structural Reformsrdquo IGIER Working Paper 605 Innocenzo Gasparini Institute for Economic Research Bocconi University Milan
Granger Clive and Timo Teraumlsvirta 1993 Modelling Nonlinear Economic Relationships New York Oxford University Press
Hausmann Ricardo Dani Rodrik and Andres Velasco 2005 ldquoGrowth Diagnosticsrdquo John F Kennedy School of Government Harvard University Cambridge MA
Hsieh Chang-Tai and Peter J Klenow 2009 ldquoMisallocation and Manufacturing TFP in China and Indiardquo Quarterly Journal of Economics 124 (4) 1403ndash48
International Monetary Fund (IMF) 2012 ldquoThe Liberalization of Management of Capital Flows An Institutional Viewrdquo IMF Policy Paper Washington DC
mdashmdashmdash 2018 ldquoReview of 1997 Guidance Note on GovernancemdashA Proposed Framework for Enhanced Fund Engagementrdquo IMF Policy Paper 18142 Washington DC
Johnston R Barry and V Sundararajan 1999 Sequencing Financial Sector Reforms Washington DC International Monetary Fund
Jordagrave Ogravescar 2005 ldquoEstimation and Inference of Impulse Responses by Local Projectionsrdquo American Economic Review 95 (1) 161ndash82
Kaplan David S Eduardo Piedra and Enrique Seira 2011 ldquoEntry Regulation and Business Start-Ups Evidence from Mexicordquo Journal of Public Economics 95 (11ndash12) 1501ndash15
Kaufmann Daniel Aart Kraay and Massimo Mastruzzi 2010 ldquoThe Worldwide Governance Indicators Methodology and Analytical Issuesrdquo World Bank Policy Research Working Paper 5430 World Bank Washington DC
Laeven Luc and Fabian Valencia 2008 ldquoSystemic Banking Crises A New Databaserdquo IMF Working Paper 08224 Inter-national Monetary Fund Washington DC
mdashmdashmdash 2012 ldquoSystemic Banking Crises An Updaterdquo IMF Working Paper 12163 International Monetary Fund Washington DC
La Porta Rafael and Andrei Shleifer 2008 ldquoThe Unofficial Economy and Economic Developmentrdquo NBER Work-ing Paper 1452 National Bureau of Economic Research Cambridge MA
mdashmdashmdash 2014 ldquoInformality and Developmentrdquo Journal of Economic Perspectives 28 (3) 109ndash26
Levy Santiago 2008 Good Intentions Bad Outcomes Washing-ton DC Brookings Institution
mdashmdashmdash 2018 Unrewarded Efforts The Elusive Quest for Prosperity in Mexico Washington DC Inter-American Development Bank
Lora Eduardo and Mauricio Olivera 2004 ldquoWhat Makes Reforms Likely Political Economy Determinants of Reforms in Latin Americardquo Journal of Applied Economics 7 (1) 99ndash135
mdashmdashmdash 2005 ldquoThe Electoral Consequences of the Washington Consensusrdquo Economiacutea 5 (2) 1ndash61
Martin Leslie A Shanthi Nataraj and Ann E Harrison 2017 ldquoIn with the Big Out with the Small Removing Small-Scale Reservations in Indiardquo American Economic Review 107 (2) 354ndash86
Mauro Paulo 1995 ldquoCorruption and Growthrdquo Quarterly Journal of Economics 110 (3) 681ndash712
McCaig Brian and Nina Pavcnik 2018 ldquoExport Markets and Labor Allocation in a Low-Income Countryrdquo American Economic Review 108 (7) 1899ndash941
Mian Atif Amir Sufi and Francesco Trebbi 2014 ldquoResolving Debt Overhang Political Constraints in the Aftermath of Financial Crisesrdquo American Economic Journal Macroeconomics 6 (2) 1ndash28
Micco Alejandro and Carmen Pageacutes 2006 ldquoThe Economic Effects of Employment Protection Evidence from Interna-tional Industry-Level Datardquo IZA Discussion Paper 2433 Institute of Labor Economics Bonn
Midrigan Virgiliu and Daniel Yi Xu 2014 ldquoFinance and Misallocation Evidence from Plant-Level Datardquo American Economic Review 104 (2) 422ndash58
Olson Mancur 1971 The Logic of Collective Action Public Goods and the Theory of Groups Cambridge MA Harvard University Press
Organisation for Economic Co-operation and Develop-ment (OECD) 2018 Economic Policy Reforms Going for Growth Paris
Ostry Jonathan Andrew Berg and Siddharth Kothari 2018 ldquoGrowth Equity Trade-Offs in Structural Reformsrdquo IMF Working Paper 185 International Monetary Fund Washington DC
Ostry Jonathan David Alessandro Prati and Antonio Spilim-bergo 2009 ldquoStructural Reforms and Economic Performance
119
C H A P T E R 3 R E I G N I T I N G G R OW T H I N LOW - I N CO M E a N D E M E R G I N G Ma R K E T E CO N O M I E s W H aT R O L E C a N s T R U C T U R a L R E F O R M s P L ay
International Monetary Fund | October 2019
in Advanced and Developing Countriesrdquo IMF Occasional Paper 268 International Monetary Fund Washington DC
Paz Lourenccedilo S 2014 ldquoThe Impacts of Trade Liberalization on Informal Labor Markets A Theoretical and Empirical Evalua-tion of the Brazilian Caserdquo Journal of International Economics 92 (2) 330ndash48
Prati Alessandro Massimiliano Gaetano Onorato and Chris Papageorgiou 2013 ldquoWhich Reforms Work and under Which Institutional Environment Evidence from a New Data Set on Structural Reformsrdquo Review of Economics and Statistics 95 (3) 946ndash68
Quinn Dennis 1997 ldquoThe Correlates of Change in Interna-tional Financial Regulationrdquo American Political Science Review 91 (3) 531ndash51
Quinn Dennis P and A Maria Toyoda 2008 ldquoDoes Capital Account Liberalization Lead to Economic Growthrdquo Review of Financial Studies 21 (3) 1403ndash49
Rajan Raghuram and Luigi Zingales 1998 ldquoFinancial Dependence and Growthrdquo American Economic Review 88 (3) 559ndash86
Ulyssea Gabriel 2018 ldquoFirms Informality and Development Theory and Evidence from Brazilrdquo American Economic Review 108 (8) 2015ndash47
World Bank (WB) 2019 Doing Business Training for Reform Washington DC World Bank
Zettelmeyer Jeromin 2006 ldquoGrowth and Reforms in Latin America A Survey of Facts and Argumentsrdquo IMF Working Paper 06210 International Monetary Fund Washington DC
International Monetary Fund | October 2019 121
STATISTICAL APPENDIX
T he Statistical Appendix presents histori-cal data as well as projections It comprises seven sections Assumptions Whatrsquos New Data and Conventions Country Notes
Classification of Countries Key Data Documentation and Statistical Tables
The assumptions underlying the estimates and pro-jections for 2019ndash20 and the medium-term scenario for 2021ndash24 are summarized in the first section The second section presents a brief description of the changes to the database and statistical tables since the April 2019 World Economic Outlook (WEO) The third section provides a general description of the data and the conventions used for calculating country group composites The fourth section summarizes selected key information for each country The fifth section summarizes the classification of countries in the vari-ous groups presented in the WEO The sixth section provides information on methods and reporting stan-dards for the member countriesrsquo national account and government finance indicators included in the report
The last and main section comprises the statistical tables (Statistical Appendix A is included here Statistical Appendix B is available online at wwwimf orgenPublicationsWEO)
Data in these tables have been compiled on the basis of information available through September 30 2019 The figures for 2019 and beyond are shown with the same degree of precision as the historical figures solely for convenience because they are projections the same degree of accuracy is not to be inferred
AssumptionsReal effective exchange rates for the advanced economies
are assumed to remain constant at their average levels measured during the period July 26 to August 23 2019 For 2019 and 2020 these assumptions imply average US dollarndashspecial drawing right (SDR) conversion rates of 1382 and 1377 US dollarndasheuro conversion rates of 1123 and 1120 and yenndashUS dollar conversion rates of 1082 and 1045 respectively
It is assumed that the price of oil will average $6178 a barrel in 2019 and $5794 a barrel in 2020
Established policies of national authorities are assumed to be maintained The more specific policy assumptions underlying the projections for selected economies are described in Box A1
With regard to interest rates it is assumed that the London interbank offered rate (LIBOR) on six-month US dollar deposits will average 23 percent in 2019 and 20 percent in 2020 that three-month euro depos-its will average ndash04 percent in 2019 and ndash06 percent in 2020 and that six-month yen deposits will average 00 percent in 2019 and ndash01 percent in 2020
As a reminder in regard to the introduction of the euro on December 31 1998 the Council of the European Union decided that effective January 1 1999 the irrevocably fixed conversion rates between the euro and currencies of the member countries adopting the euro are as described in Box 54 of the October 1998 WEO See Box 54 of the October 1998 WEO for details on how the conversion rates were established
1 euro = 137603 Austrian schillings = 403399 Belgian francs = 0585274 Cyprus pound1
= 195583 Deutsche marks = 156466 Estonian krooni2
= 594573 Finnish markkaa = 655957 French francs = 340750 Greek drachmas3
= 0787564 Irish pound = 193627 Italian lire = 0702804 Latvian lat4
= 345280 Lithuanian litas5
= 403399 Luxembourg francs = 042930 Maltese lira1
= 220371 Netherlands guilders = 200482 Portuguese escudos = 301260 Slovak koruna6
= 239640 Slovenian tolars7
= 166386 Spanish pesetas1Established on January 1 20082Established on January 1 20113Established on January 1 20014Established on January 1 20145Established on January 1 20156Established on January 1 20097Established on January 1 2007
W O R L D E C O N O M I C O U T L O O K G LO B A L M A N U FAC T U R I N G D OW N T U R N R IS I N G T R A D E B A R R I E R S
122 International Monetary Fund | October 2019
Whatrsquos Newbull Mauritania redenominated its currency in
January 2018 by replacing 10 old Mauritanian ouguiya (MRO) with 1 new Mauritanian ouguiya (MRU) Local currency data for Mauritania are expressed in the new currency beginning with the October 2019 WEO database
bull Satildeo Tomeacute and Priacutencipe redenominated its currency in January 2018 by replacing 1000 old Satildeo Tomeacute and Priacutencipe dobra (STD) with 1 new Satildeo Tomeacute and Priacutencipe dobra (STN) Local currency data for Satildeo Tomeacute and Priacutencipe are expressed in the new currency beginning with the October 2019 WEO database
bull Beginning with the October 2019 WEO the regional group Commonwealth of Independent States (CIS) is discontinued Four of the CIS econo-mies (Belarus Moldova Russia and Ukraine) are added to the regional group Emerging and Devel-oping Europe The remaining eight economiesmdashArmenia Azerbaijan Georgia Kazakhstan Kyrgyz Republic Tajikistan Turkmenistan and Uzbekistan which comprise the regional subgroup Caucasus and Central Asia (CCA)mdashare combined with Middle East North Africa Afghanistan and Pakistan (MENAP) to form the new regional group Middle East and Central Asia (MECA)
Data and ConventionsData and projections for 194 economies form the
statistical basis of the WEO database The data are maintained jointly by the IMFrsquos Research Department and regional departments with the latter regularly updating country projections based on consistent global assumptions
Although national statistical agencies are the ultimate providers of historical data and definitions international organizations are also involved in statisti-cal issues with the objective of harmonizing meth-odologies for the compilation of national statistics including analytical frameworks concepts definitions classifications and valuation procedures used in the production of economic statistics The WEO database reflects information from both national source agencies and international organizations
Most countriesrsquo macroeconomic data presented in the WEO conform broadly to the 2008 version of the System of National Accounts (SNA) The IMFrsquos sector statistical
standardsmdashthe sixth edition of the Balance of Payments and International Investment Position Manual (BPM6) the Monetary and Financial Statistics Manual and Compilation Guide (MFSMCG) and the Government Finance Statistics Manual 2014 (GFSM 2014)mdashhave been or are being aligned with the SNA 2008 These standards reflect the IMFrsquos special interest in countriesrsquo external positions financial sector stability and public sector fiscal positions The process of adapting country data to the new standards begins in earnest when the manuals are released However full concordance with the manuals is ultimately dependent on the provision by national statistical compilers of revised country data hence the WEO estimates are only partially adapted to these manuals Nonetheless for many countries the impact on major balances and aggregates of conversion to the updated standards will be small Many other countries have partially adopted the latest standards and will continue implementation over a period of years1
The fiscal gross and net debt data reported in the WEO are drawn from official data sources and IMF staff estimates While attempts are made to align gross and net debt data with the definitions in the GFSM as a result of data limitations or specific country circum-stances these data can sometimes deviate from the formal definitions Although every effort is made to ensure the WEO data are relevant and internationally comparable differences in both sectoral and instru-ment coverage mean that the data are not universally comparable As more information becomes available changes in either data sources or instrument cover-age can give rise to data revisions that can sometimes be substantial For clarification on the deviations in sectoral or instrument coverage please refer to the metadata for the online WEO database
Composite data for country groups in the WEO are either sums or weighted averages of data for individual countries Unless noted otherwise multiyear averages of growth rates are expressed as compound annual rates of change2 Arithmetically weighted averages are used
1 Many countries are implementing the SNA 2008 or European System of National and Regional Accounts (ESA) 2010 and a few countries use versions of the SNA older than that from 1993 A similar adoption pattern is expected for the BPM6 and GFSM 2014 Please refer to Table G which lists the statistical standards adhered to by each country
2 Averages for real GDP and its components employment inflation factor productivity GDP per capita trade and commodity prices are calculated based on the compound annual rate of change except in the case of the unemployment rate which is based on the simple arithmetic average
S TAT I S T I C A L A P P E N D I X
International Monetary Fund | October 2019 123
for all data for the emerging market and developing economies groupmdashexcept data on inflation and money growth for which geometric averages are used The following conventions apply
Country group composites for exchange rates interest rates and growth rates of monetary aggregates are weighted by GDP converted to US dollars at market exchange rates (averaged over the preceding three years) as a share of group GDP
Composites for other data relating to the domestic economy whether growth rates or ratios are weighted by GDP valued at purchasing power parity as a share of total world or group GDP3 Annual inflation rates are simple percentage changes from the previous years except in the case of emerging market and developing economies for which the rates are based on logarithmic differences
Composites for real GDP per capita in purchasing power parity terms are sums of individual country data after conversion to the international dollar in the years indicated
Unless noted otherwise composites for all sectors for the euro area are corrected for reporting discrepan-cies in intra-area transactions Unadjusted annual GDP data are used for the euro area and for the majority of individual countries except for Cyprus Ireland Portugal and Spain which report calendar-adjusted data For data prior to 1999 data aggregations apply 1995 European currency unit exchange rates
Composites for fiscal data are sums of individual country data after conversion to US dollars at the average market exchange rates in the years indicated
Composite unemployment rates and employment growth are weighted by labor force as a share of group labor force
Composites relating to external sector statistics are sums of individual country data after conversion to US dollars at the average market exchange rates in the years indicated for balance of payments data and at end-of-year market exchange rates for debt denominated in currencies other than US dollars
Composites of changes in foreign trade volumes and prices however are arithmetic averages of
3 See ldquoRevised Purchasing Power Parity Weightsrdquo in the July 2014 WEO Update for a summary of the revised purchasing-power-parity-based weights as well as Box A2 of the April 2004 WEO and Annex IV of the May 1993 WEO See also Anne-Marie Gulde and Marianne Schulze-Ghattas ldquoPurchasing Power Parity Based Weights for the World Economic Outlookrdquo in Staff Studies for the World Economic Outlook (Washington DC International Monetary Fund December 1993) 106ndash23
percent changes for individual countries weighted by the US dollar value of exports or imports as a share of total world or group exports or imports (in the preceding year)
Unless noted otherwise group composites are computed if 90 percent or more of the share of group weights is represented
Data refer to calendar years except in the case of a few countries that use fiscal years Table F lists the economies with exceptional reporting periods for national accounts and government finance data for each country
For some countries the figures for 2018 and earlier are based on estimates rather than actual outturns Table G lists the latest actual outturns for the indicators in the national accounts prices government finance and balance of payments indicators for each country
Country NotesThe consumer price data for Argentina before
December 2013 reflect the consumer price index (CPI) for the Greater Buenos Aires Area (CPI-GBA) while from December 2013 to October 2015 the data reflect the national CPI (IPCNu) The government that took office in December 2015 discontinued the IPCNu stating that it was flawed and released a new CPI for the Greater Buenos Aires Area on June 15 2016 (a new national CPI has been disseminated starting in June 2017) At its November 9 2016 meeting the IMF Executive Board considered the new CPI series to be in line with international standards and lifted the declara-tion of censure issued in 2013 Given the differences in geographical coverage weights sampling and method-ology of these series the average CPI inflation for 2014 2015 and 2016 and end-of-period inflation for 2015 and 2016 are not reported in the October 2019 WEO
Argentinarsquos authorities discontinued the publication of labor market data in December 2015 and released new series starting in the second quarter of 2016
The fiscal series for the Dominican Republic have the following coverage public debt debt service and the cyclically adjustedstructural balances are for the con-solidated public sector (which includes central govern-ment rest of the nonfinancial public sector and the central bank) and the remaining fiscal series are for the central government
Indiarsquos real GDP growth rates are calculated as per national accounts for 1998 to 2011 with base year 200405 and thereafter with base year 201112
W O R L D E C O N O M I C O U T L O O K G LO B A L M A N U FAC T U R I N G D OW N T U R N R IS I N G T R A D E B A R R I E R S
124 International Monetary Fund | October 2019
Against the backdrop of a civil war and weak capacity the reliability of Libyarsquos data especially medium-term projections is low
Data for Syria are excluded from 2011 onward because of the uncertain political situation
Trinidad and Tobagorsquos growth estimates for 2018 are based on full-year energy sector data from the Ministry of Energy and Ministry of Finance prelimi-nary national accounts data for the first three quarters of the year from the Central Statistical Office and staff projections for fourth-quarter nonenergy output based on available information Growth projections from 2019 are unchanged from the April 2019 WEO in the absence of updates to published national accounts data
Ukrainersquos revised national accounts data are available beginning in 2000 and exclude Crimea and Sevastopol from 2010
Starting from October 2018 Uruguayrsquos public pen-sion system has been receiving transfers in the context of a new law that compensates persons affected by the creation of the mixed pension system These funds are recorded as revenues consistent with the IMFrsquos meth-odology Therefore data and projections for 2018ndash22 are affected by these transfers which amounted to 13 percent of GDP in 2018 and are projected to be 12 percent of GDP in 2019 09 percent of GDP in 2020 04 percent of GDP in 2021 02 percent of GDP in 2022 and zero percent of GDP thereafter Please see IMF Country Report 1964 for further details The disclaimer about the public pension system applies only to the revenues and net lendingborrowing series
The coverage of the fiscal data for Uruguay was changed from consolidated public sector (CPS) to nonfinancial public sector (NFPS) with the October 2019 WEO In Uruguay NFPS coverage includes central government local government social security funds nonfinancial public corporations and Banco de Seguros del Estado Historical data were also revised accordingly Under this narrower fiscal perimetermdashwhich excludes the central bankmdashassets and liabilities held by the NFPS where the counterpart is the central bank are not netted out in debt figures In this context capitalization bonds issued in the past by the government to the central bank are now part of the NFPS debt Gross and net debt estimates for the period 2008ndash11 are preliminary
Projecting the economic outlook in Venezuela including assessing past and current economic
developments as the basis for the projections is complicated by the lack of discussions with the authorities (the last Article IV consultation took place in 2004) incomplete understanding of the reported data and difficulties in interpreting certain reported economic indicators given economic developments The fiscal accounts include the budgetary central government social security FOGADE (insurance deposit institution) and a sample of public enterprises including Petroacuteleos de Venezuela SA (PDVSA) and data for 2018 are IMF staff estimates The effects of hyperinflation and the paucity of reported data mean that the IMF staffrsquos estimated macroeconomic indica-tors need to be interpreted with caution For example nominal GDP is estimated assuming the GDP deflator rises in line with the IMF staffrsquos estimated average inflation Public external debt in relation to GDP is estimated using the IMF staffrsquos estimate of the average exchange rate for the year Wide uncertainty surrounds these projections Venezuelarsquos consumer prices are excluded from all WEO group composites
Classification of CountriesSummary of the Country Classification
The country classification in the WEO divides the world into two major groups advanced economies and emerging market and developing economies4 This classification is not based on strict criteria economic or otherwise and it has evolved over time The objective is to facilitate analysis by providing a reasonably meaningful method of organizing data Table A provides an overview of the country classification showing the number of countries in each group by region and summarizing some key indicators of their relative size (GDP valued at purchasing power parity total exports of goods and services and population)
Some countries remain outside the country classification and therefore are not included in the analysis Cuba and the Democratic Peoplersquos Republic of Korea are examples of countries that are not IMF members and their economies therefore are not monitored by the IMF
4 As used here the terms ldquocountryrdquo and ldquoeconomyrdquo do not always refer to a territorial entity that is a state as understood by interna-tional law and practice Some territorial entities included here are not states although their statistical data are maintained on a separate and independent basis
S TAT I S T I C A L A P P E N D I X
International Monetary Fund | October 2019 125
General Features and Composition of Groups in the World Economic Outlook ClassificationAdvanced Economies
The 39 advanced economies are listed in Table B The seven largest in terms of GDP based on market exchange ratesmdashthe United States Japan Germany France Italy the United Kingdom and Canadamdashconstitute the subgroup of major advanced econo-mies often referred to as the Group of Seven (G7) The members of the euro area are also distinguished as a subgroup Composite data shown in the tables for the euro area cover the current members for all years even though the membership has increased over time
Table C lists the member countries of the European Union not all of which are classified as advanced economies in the WEO
Emerging Market and Developing Economies
The group of emerging market and developing econ-omies (155) includes all those that are not classified as advanced economies
The regional breakdowns of emerging market and developing economies are emerging and developing Asia emerging and developing Europe (sometimes also referred to as ldquocentral and eastern Europerdquo) Latin America and the Caribbean (LAC) Middle East and Central Asia (MECA which comprises the regional subgroups Middle East North Africa Afghanistan and Pakistan and Caucasus and Central Asia) and sub-Saharan Africa (SSA)
Emerging market and developing economies are also classified according to analytical criteria The analytical criteria reflect the composition of export earnings and a distinction between net creditor and net debtor economies The detailed composition of emerging market and developing economies in the regional and analytical groups is shown in Tables D and E
The analytical criterion source of export earnings dis-tinguishes between the categories fuel (Standard Inter-national Trade Classification [SITC] 3) and nonfuel and then focuses on nonfuel primary products (SITCs 0 1 2 4 and 68) Economies are categorized into one of these groups if their main source of export earn-ings exceeded 50 percent of total exports on average between 2014 and 2018
The financial criteria focus on net creditor economies net debtor economies heavily indebted poor countries (HIPCs) and low-income developing countries (LIDCs) Economies are categorized as net debtors when their latest net international investment position where available was less than zero or their current account balance accumulations from 1972 (or earliest available data) to 2018 were negative Net debtor economies are further differentiated on the basis of experience with debt servicing5
The HIPC group comprises the countries that are or have been considered by the IMF and the World Bank for participation in their debt initiative known as the HIPC Initiative which aims to reduce the external debt burdens of all the eligible HIPCs to a ldquosustainablerdquo level in a reasonably short period of time6 Many of these countries have already benefited from debt relief and have graduated from the initiative
The LIDCs are countries that have per capita income levels below a certain threshold (set at $2700 in 2016 as measured by the World Bankrsquos Atlas method) structural features consistent with limited development and structural transformation and external financial linkages insufficiently close for them to be widely seen as emerging market economies
5 During 2014ndash18 25 economies incurred external payments arrears or entered into official or commercial bank debt-rescheduling agreements This group is referred to as economies with arrears andor rescheduling during 2014ndash18
6 See David Andrews Anthony R Boote Syed S Rizavi and Sukwinder Singh ldquoDebt Relief for Low-Income Countries The Enhanced HIPC Initiativerdquo IMF Pamphlet Series 51 (Washington DC International Monetary Fund November 1999)
W O R L D E C O N O M I C O U T L O O K G LO B A L M A N U FAC T U R I N G D OW N T U R N R IS I N G T R A D E B A R R I E R S
126 International Monetary Fund | October 2019
Table A Classification by World Economic Outlook Groups and Their Shares in Aggregate GDP Exports of Goods and Services and Population 20181
(Percent of total for group or world)
GDPExports of Goods
and Services Population
Number of Economies
Advanced Economies World
Advanced Economies World
Advanced Economies World
Advanced Economies 39 1000 408 1000 630 1000 143United States 372 152 160 101 306 44Euro Area 19 279 114 420 265 317 45
Germany 79 32 119 75 78 11France 54 22 58 36 61 09Italy 43 18 42 27 57 08Spain 34 14 31 20 43 06
Japan 101 41 59 37 118 17United Kingdom 55 22 54 34 62 09Canada 33 14 35 22 35 05Other Advanced Economies 16 159 65 272 171 161 23
MemorandumMajor Advanced Economies 7 737 301 527 332 716 102
Emerging Market and Developing Economies World
Emerging Market and Developing Economies World
Emerging Market and Developing Economies World
Emerging Market and Developing Economies 155 1000 592 1000 370 1000 857Regional GroupsEmerging and Developing Asia 30 562 332 486 180 563 482
China 315 187 288 107 218 187India 131 77 59 22 208 179ASEAN-5 5 94 55 123 46 88 76
Emerging and Developing Europe 16 121 72 165 61 59 51Russia 53 31 55 20 23 20
Latin America and the Caribbean 33 126 75 137 51 97 84Brazil 42 25 30 11 33 28Mexico 32 19 52 19 19 17
Middle East and Central Asia 31 139 82 166 62 123 106Saudi Arabia 23 14 34 13 05 04
Sub-Saharan Africa 45 52 30 46 17 157 135Nigeria 15 09 07 03 31 26South Africa 10 06 12 04 09 08
Analytical Groups2
By Source of Export EarningsFuel 27 171 101 221 82 116 100Nonfuel 127 829 490 779 288 884 757
Of Which Primary Products 35 51 30 52 19 90 77By External Financing SourceNet Debtor Economies 122 517 306 497 184 684 586Net Debtor Economies by Debt-
Servicing ExperienceEconomies with Arrears andor
Rescheduling during 2014ndash18 25 34 20 28 10 58 49Other GroupsHeavily Indebted Poor Countries 39 25 15 20 07 118 101Low-Income Developing Countries 59 73 43 70 26 230 198
1The GDP shares are based on the purchasing-power-parity valuation of economiesrsquo GDP The number of economies comprising each group reflects those for which data are included in the group aggregates2Syria is omitted from the source of export earnings and South Sudan and Syria are omitted from the net external position group composites because of insufficient data
S TAT I S T I C A L A P P E N D I X
International Monetary Fund | October 2019 127
Table B Advanced Economies by SubgroupMajor Currency AreasUnited StatesEuro AreaJapanEuro AreaAustria Greece NetherlandsBelgium Ireland PortugalCyprus Italy Slovak RepublicEstonia Latvia SloveniaFinland Lithuania SpainFrance LuxembourgGermany MaltaMajor Advanced EconomiesCanada Italy United StatesFrance JapanGermany United KingdomOther Advanced EconomiesAustralia Korea SingaporeCzech Republic Macao SAR2 SwedenDenmark New Zealand SwitzerlandHong Kong SAR1 Norway Taiwan Province of ChinaIceland Puerto RicoIsrael San Marino
1On July 1 1997 Hong Kong was returned to the Peoplersquos Republic of China and became a Special Administrative Region of China2On December 20 1999 Macao was returned to the Peoplersquos Republic of China and became a Special Administrative Region of China
Table C European UnionAustria Germany PolandBelgium Greece PortugalBulgaria Hungary RomaniaCroatia Ireland Slovak RepublicCyprus Italy SloveniaCzech Republic Latvia SpainDenmark Lithuania SwedenEstonia Luxembourg United KingdomFinland MaltaFrance Netherlands
W O R L D E C O N O M I C O U T L O O K G LO B A L M A N U FAC T U R I N G D OW N T U R N R IS I N G T R A D E B A R R I E R S
128 International Monetary Fund | October 2019
Table D Emerging Market and Developing Economies by Region and Main Source of Export EarningsFuel Nonfuel Primary Products
Emerging and Developing Asia
Brunei Darussalam Kiribati
Timor-Leste Lao PDR
Marshall Islands
Papua New Guinea
Solomon Islands
Tuvalu
Emerging and Developing Europe
Russia
Latin America and the Caribbean
Ecuador Argentina
Trinidad and Tobago Bolivia
Venezuela Chile
Guyana
Paraguay
Peru
Suriname
Uruguay
Middle East and Central Asia
Algeria Afghanistan
Azerbaijan Mauritania
Bahrain Somalia
Iran Sudan
Iraq Tajikistan
Kazakhstan Uzbekistan
Kuwait
Libya
Oman
Qatar
Saudi Arabia
Turkmenistan
United Arab Emirates
Yemen
Sub-Saharan Africa
Angola Burkina Faso
Chad Burundi
Republic of Congo Central African Republic
Equatorial Guinea Democratic Republic of the Congo
Gabon Cocircte drsquoIvoire
Nigeria Eritrea
South Sudan Guinea
Guinea-Bissau
Liberia
Malawi
Mali
Sierra Leone
South Africa
Zambia
Zimbabwe
S TAT I S T I C A L A P P E N D I X
International Monetary Fund | October 2019 129
Table E Emerging Market and Developing Economies by Region Net External Position and Status as Heavily Indebted Poor Countries and Low-Income Developing Countries
Net External Position1
Heavily Indebted Poor Countries2
Low-Income Developing Countries
Emerging and Developing Asia
Bangladesh
Bhutan
Brunei Darussalam bull
Cambodia
China bull
Fiji
India
Indonesia
Kiribati bull
Lao PDR
Malaysia
Maldives
Marshall Islands
Micronesia bull
Mongolia
Myanmar
Nauru
Nepal bull
Palau bull
Papua New Guinea
Philippines
Samoa
Solomon Islands
Sri Lanka
Thailand
Timor-Leste bull
Tonga
Tuvalu bull
Vanuatu
Vietnam
Emerging and Developing Europe
Albania
Belarus
Bosnia and Herzegovina
Bulgaria
Croatia
Hungary
Kosovo
Moldova
Montenegro
Net External Position1
Heavily Indebted Poor Countries2
Low-Income Developing Countries
North Macedonia
Poland
Romania
Russia bull
Serbia
Turkey
Ukraine
Latin America and the Caribbean
Antigua and Barbuda
Argentina bull
Aruba
The Bahamas
Barbados
Belize
Bolivia bull
Brazil
Chile
Colombia
Costa Rica
Dominica bull
Dominican Republic
Ecuador
El Salvador
Grenada
Guatemala
Guyana bull
Haiti bull
Honduras bull
Jamaica
Mexico
Nicaragua bull
Panama
Paraguay
Peru
St Kitts and Nevis
St Lucia
St Vincent and the Grenadines
Suriname
Trinidad and Tobago bull
Uruguay
Venezuela bull
W O R L D E C O N O M I C O U T L O O K G LO B A L M A N U FAC T U R I N G D OW N T U R N R IS I N G T R A D E B A R R I E R S
130 International Monetary Fund | October 2019
Net External Position1
Heavily Indebted Poor Countries2
Low-Income Developing Countries
Middle East and Central Asia
Afghanistan bull bull
Algeria bull
Armenia
Azerbaijan bull
Bahrain bull
Djibouti
Egypt
Georgia
Iran bull
Iraq bull
Jordan
Kazakhstan
Kuwait bull
Kyrgyz Republic
Lebanon
Libya bull
Mauritania bull
Morocco
Oman
Pakistan
Qatar bull
Saudi Arabia bull
Somalia
Sudan
Syria3
Tajikistan
Tunisia
Turkmenistan
United Arab Emirates bull
Uzbekistan bull
Yemen
Sub-Saharan Africa
Angola
Benin bull
Botswana bull
Burkina Faso bull
Burundi bull
Cabo Verde
Net External Position1
Heavily Indebted Poor Countries2
Low-Income Developing Countries
Cameroon bull
Central African Republic bull
Chad bull
Comoros bull
Democratic Republic of the Congo bull
Republic of Congo bull
Cocircte drsquoIvoire bull
Equatorial Guinea bull
Eritrea
Eswatini bull
Ethiopia bull
Gabon bull
The Gambia bull
Ghana bull
Guinea bull
Guinea-Bissau bull
Kenya
Lesotho
Liberia bull
Madagascar bull
Malawi bull
Mali bull
Mauritius bull
Mozambique bull
Namibia
Niger bull
Nigeria
Rwanda bull
Satildeo Tomeacute and Priacutencipe bull
Senegal bull
Seychelles
Sierra Leone bull
South Africa bull
South Sudan3
Tanzania bull
Togo bull
Uganda bull
Zambia bull
Zimbabwe 1Dot (star) indicates that the country is a net creditor (net debtor)2Dot instead of star indicates that the country has reached the completion point which allows it to receive the full debt relief committed to at the decision point3South Sudan and Syria are omitted from the net external position group composite for lack of a fully developed database
Table E Emerging Market and Developing Economies by Region Net External Position and Status as Heavily Indebted Poor Countries and Low-Income Developing Countries (continued)
S TAT I S T I C A L A P P E N D I X
International Monetary Fund | October 2019 131
Table F Economies with Exceptional Reporting Periods1
National Accounts Government Finance
The Bahamas JulJunBarbados AprMarBhutan JulJun JulJunBotswana AprMarDominica JulJunEgypt JulJun JulJunEswatini AprMarEthiopia JulJun JulJunHaiti OctSep OctSepHong Kong SAR AprMarIndia AprMar AprMarIran AprMar AprMarJamaica AprMarLesotho AprMar AprMarMalawi JulJunMarshall Islands OctSep OctSepMauritius JulJunMicronesia OctSep OctSepMyanmar OctSep OctSepNamibia AprMarNauru JulJun JulJunNepal AugJul AugJulPakistan JulJun JulJunPalau OctSep OctSepPuerto Rico JulJun JulJunSt Lucia AprMarSamoa JulJun JulJunSingapore AprMarThailand OctSepTrinidad and Tobago OctSep
1Unless noted otherwise all data refer to calendar years
W O R L D E C O N O M I C O U T L O O K G LO B A L M A N U FAC T U R I N G D OW N T U R N R IS I N G T R A D E B A R R I E R S
132 International Monetary Fund | October 2019
Table G Key Data Documentation
Country Currency
National Accounts Prices (CPI)
Historical Data Source1
Latest Actual Annual Data Base Year2
System of National Accounts
Use of Chain-Weighted
Methodology3Historical Data
Source1
Latest Actual
Annual Data
Afghanistan Afghan afghani NSO 2018 200203 SNA 1993 NSO 2018
Albania Albanian lek IMF staff 2018 1996 ESA 2010 From 1996 NSO 2018
Algeria Algerian dinar NSO 2018 2001 SNA 1993 From 2005 NSO 2018
Angola Angolan kwanza NSO and MEP 2018 2002 ESA 1995 NSO 2018
Antigua and Barbuda
Eastern Caribbean dollar
CB 2017 20066 SNA 1993 NSO 2018
Argentina Argentine peso NSO 2018 2004 SNA 2008 NSO 2018
Armenia Armenian dram NSO 2018 2005 SNA 2008 NSO 2018
Aruba Aruban Florin NSO 2017 2000 SNA 1993 From 2000 NSO 2018
Australia Australian dollar NSO 2018 201516 SNA 2008 From 1980 NSO 2018
Austria Euro NSO 2018 2010 ESA 2010 From 1995 NSO 2018
Azerbaijan Azerbaijan manat NSO 2018 2005 SNA 1993 From 1994 NSO 2018
The Bahamas Bahamian dollar NSO 2018 2012 SNA 1993 NSO 2018
Bahrain Bahrain dinar NSO 2018 2010 SNA 2008 NSO 2018
Bangladesh Bangladesh taka NSO 2018 200506 SNA 1993 NSO 2018
Barbados Barbados dollar NSO and CB 2018 2010 SNA 1993 NSO 2018
Belarus Belarusian ruble NSO 2018 2014 SNA 2008 From 2005 NSO 2018
Belgium Euro CB 2018 2016 ESA 2010 From 1995 CB 2018
Belize Belize dollar NSO 2018 2000 SNA 1993 NSO 2018
Benin CFA franc NSO 2018 2015 SNA 1993 NSO 2018
Bhutan Bhutanese ngultrum
NSO 201718 2000016 SNA 1993 CB 201718
Bolivia Bolivian boliviano NSO 2017 1990 SNA 2008 NSO 2018
Bosnia and Herzegovina
Bosnian convertible marka
NSO 2018 2010 ESA 2010 From 2000 NSO 2018
Botswana Botswana pula NSO 2018 2006 SNA 1993 NSO 2018
Brazil Brazilian real NSO 2018 1995 SNA 2008 NSO 2018
Brunei Darussalam Brunei dollar NSO and GAD 2018 2010 SNA 1993 NSO and GAD 2018
Bulgaria Bulgarian lev NSO 2018 2010 ESA 2010 From 1996 NSO 2018
Burkina Faso CFA franc NSO and MEP 2018 1999 SNA 1993 NSO 2018
Burundi Burundi franc NSO 2015 2005 SNA 1993 NSO 2017
Cabo Verde Cabo Verdean escudo
NSO 2018 2007 SNA 2008 From 2011 NSO 2018
Cambodia Cambodian riel NSO 2018 2000 SNA 1993 NSO 2018
Cameroon CFA franc NSO 2017 2005 SNA 2008 NSO 2018
Canada Canadian dollar NSO 2018 2012 SNA 2008 From 1980 NSO 2018
Central African Republic
CFA franc NSO 2017 2005 SNA 1993 NSO 2018
Chad CFA franc CB 2017 2005 SNA 1993 NSO 2017
Chile Chilean peso CB 2018 20136 SNA 2008 From 2003 NSO 2018
China Chinese yuan NSO 2018 2015 SNA 2008 NSO 2018
Colombia Colombian peso NSO 2018 2015 SNA 1993 From 2005 NSO 2018
Comoros Comorian franc MEP 2016 2007 From 2007 NSO 2018
Democratic Republic of the Congo
Congolese franc NSO 2018 2005 SNA 1993 CB 2018
Republic of Congo CFA franc NSO 2017 1990 SNA 1993 NSO 2018
Costa Rica Costa Rican coloacuten CB 2018 2012 SNA 2008 CB 2018
S TAT I S T I C A L A P P E N D I X
International Monetary Fund | October 2019 133
Table G Key Data Documentation (continued)
Country
Government Finance Balance of Payments
Historical Data Source1
Latest Actual Annual Data
Statistics Manual in
Use at SourceSubsectors Coverage4
Accounting Practice5
Historical Data Source1
Latest Actual Annual Data
Statistics Manual
in Use at Source
Afghanistan MoF 2018 2001 CG C NSO MoF and CB 2018 BPM 6
Albania IMF staff 2018 1986 CGLGSSMPC NFPC
CB 2018 BPM 6
Algeria MoF 2018 1986 CG C CB 2018 BPM 6
Angola MoF 2018 2001 CGLG CB 2018 BPM 6
Antigua and Barbuda
MoF 2018 2001 CG C CB 2016 BPM 6
Argentina MEP 2018 1986 CGSGSS C NSO 2018 BPM 6
Armenia MoF 2018 2001 CG C CB 2018 BPM 6
Aruba MoF 2018 2001 CG Mixed CB 2017 BPM 5
Australia MoF 201718 2014 CGSGLGTG A NSO 2018 BPM 6
Austria NSO 2018 2001 CGSGLGSS A CB 2018 BPM 6
Azerbaijan MoF 2018 CG C CB 2018 BPM 6
The Bahamas MoF 201718 2001 CG C CB 2018 BPM 5
Bahrain MoF 2018 2001 CG C CB 2018 BPM 6
Bangladesh MoF 2018 CG C CB 2018 BPM 6
Barbados MoF 201819 1986 BCG C CB 2018 BPM 5
Belarus MoF 2018 2001 CGLGSS C CB 2018 BPM 6
Belgium CB 2018 ESA 2010 CGSGLGSS A CB 2018 BPM 6
Belize MoF 2018 1986 CGMPC Mixed CB 2018 BPM 6
Benin MoF 2018 1986 CG C CB 2017 BPM 6
Bhutan MoF 201718 1986 CG C CB 201718 BPM 6
Bolivia MoF 2017 2001 CGLGSSNMPC NFPC
C CB 2017 BPM 6
Bosnia and Herzegovina
MoF 2018 2001 CGSGLGSS Mixed CB 2018 BPM 6
Botswana MoF 201819 1986 CG C CB 2018 BPM 6
Brazil MoF 2018 2001 CGSGLGSS MPCNFPC
C CB 2018 BPM 6
Brunei Darussalam MoF 2018 CG BCG C NSO MEP and GAD 2018 BPM 6
Bulgaria MoF 2018 2001 CGLGSS C CB 2018 BPM 6
Burkina Faso MoF 2018 2001 CG CB CB 2017 BPM 6
Burundi MoF 2015 2001 CG A CB 2016 BPM 6
Cabo Verde MoF 2018 2001 CG A NSO 2018 BPM 6
Cambodia MoF 2018 1986 CGLG Mixed CB 2018 BPM 5
Cameroon MoF 2017 2001 CGNFPC C MoF 2017 BPM 6
Canada MoF 2018 2001 CGSGLGSSother A NSO 2018 BPM 6
Central African Republic
MoF 2018 2001 CG C CB 2017 BPM 5
Chad MoF 2017 1986 CGNFPC C CB 2015 BPM 6
Chile MoF 2018 2001 CGLG A CB 2018 BPM 6
China MoF 2018 CGLG C GAD 2018 BPM 6
Colombia MoF 2018 2001 CGSGLGSS CB and NSO 2018 BPM 6
Comoros MoF 2018 1986 CG Mixed CB and IMF staff 2018 BPM 5
Democratic Republic of the Congo
MoF 2018 2001 CGLG A CB 2018 BPM 5
Republic of Congo MoF 2018 2001 CG A CB 2017 BPM 6
Costa Rica MoF and CB 2018 1986 CG C CB 2018 BPM 6
W O R L D E C O N O M I C O U T L O O K G LO B A L M A N U FAC T U R I N G D OW N T U R N R IS I N G T R A D E B A R R I E R S
134 International Monetary Fund | October 2019
Table G Key Data Documentation (continued)
Country Currency
National Accounts Prices (CPI)
Historical Data Source1
Latest Actual Annual Data Base Year2
System of National Accounts
Use of Chain-Weighted
Methodology3Historical Data
Source1
Latest Actual
Annual Data
Cocircte drsquoIvoire CFA franc NSO 2016 2009 SNA 1993 NSO 2017
Croatia Croatian kuna NSO 2018 2010 ESA 2010 NSO 2018
Cyprus Euro NSO 2018 2010 ESA 2010 From 1995 NSO 2018
Czech Republic Czech koruna NSO 2018 2010 ESA 2010 From 1995 NSO 2018
Denmark Danish krone NSO 2018 2010 ESA 2010 From 1980 NSO 2018
Djibouti Djibouti franc NSO 2018 2013 SNA 1993 NSO 2018
Dominica Eastern Caribbean dollar
NSO 2017 2006 SNA 1993 NSO 2016
Dominican Republic Dominican peso CB 2018 2007 SNA 2008 From 2007 CB 2018
Ecuador US dollar CB 2018 2007 SNA 1993 NSO and CB 2018
Egypt Egyptian pound MEP 201718 201112 SNA 2008 NSO 201718
El Salvador US dollar CB 2018 2014 SNA 2008 NSO 2018
Equatorial Guinea CFA franc MEP and CB 2017 2006 SNA 1993 MEP 2018
Eritrea Eritrean nakfa IMF staff 2018 2011 SNA 1993 NSO 2018
Estonia Euro NSO 2018 2015 ESA 2010 From 2010 NSO 2018
Eswatini Swazi lilangeni NSO 2017 2011 SNA 1993 NSO 2018
Ethiopia Ethiopian birr NSO 201718 201516 SNA 1993 NSO 2018
Fiji Fijian dollar NSO 2018 2014 SNA 1993 NSO 2018
Finland Euro NSO 2018 2010 ESA 2010 From 1980 NSO 2018
France Euro NSO 2018 2014 ESA 2010 From 1980 NSO 2018
Gabon CFA franc MoF 2018 2001 SNA 1993 NSO 2018
The Gambia Gambian dalasi NSO 2018 2013 SNA 1993 NSO 2018
Georgia Georgian lari NSO 2018 2010 SNA 1993 From 1996 NSO 2018
Germany Euro NSO 2018 2015 ESA 2010 From 1991 NSO 2018
Ghana Ghanaian cedi NSO 2018 2013 SNA 1993 NSO 2018
Greece Euro NSO 2018 2010 ESA 2010 From 1995 NSO 2018
Grenada Eastern Caribbean dollar
NSO 2018 2006 SNA 1993 NSO 2018
Guatemala Guatemalan quetzal
CB 2018 2001 SNA 1993 From 2001 NSO 2018
Guinea Guinean franc NSO 2018 2010 SNA 1993 NSO 2018
Guinea-Bissau CFA franc NSO 2018 2005 SNA 1993 NSO 2018
Guyana Guyanese dollar NSO 2017 20066 SNA 1993 NSO 2018
Haiti Haitian gourde NSO 201718 198687 SNA 1993 NSO 201718
Honduras Honduran lempira CB 2017 2000 SNA 1993 CB 2018
Hong Kong SAR Hong Kong dollar NSO 2018 2017 SNA 2008 From 1980 NSO 2018
Hungary Hungarian forint NSO 2018 2005 ESA 2010 From 2005 IEO 2018
Iceland Icelandic kroacutena NSO 2018 2005 ESA 2010 From 1990 NSO 2018
India Indian rupee NSO 201718 201112 SNA 2008 NSO 201718
Indonesia Indonesian rupiah NSO 2018 2010 SNA 2008 NSO 2018
Iran Iranian rial CB 201718 201112 SNA 1993 CB 201718
Iraq Iraqi dinar NSO 2017 2007 SNA 196893 NSO 2017
Ireland Euro NSO 2018 2017 ESA 2010 From 1995 NSO 2018
Israel New Israeli shekel NSO 2018 2015 SNA 2008 From 1995 NSO 2018
Italy Euro NSO 2018 2010 ESA 2010 From 1980 NSO 2018
Jamaica Jamaican dollar NSO 2018 2007 SNA 1993 NSO 2018
S TAT I S T I C A L A P P E N D I X
International Monetary Fund | October 2019 135
Table G Key Data Documentation (continued)
Country
Government Finance Balance of Payments
Historical Data Source1
Latest Actual Annual Data
Statistics Manual in
Use at SourceSubsectors Coverage4
Accounting Practice5
Historical Data Source1
Latest Actual Annual Data
Statistics Manual
in Use at Source
Cocircte drsquoIvoire MoF 2018 1986 CG A CB 2017 BPM 6
Croatia MoF 2018 2001 CGLG A CB 2018 BPM 6
Cyprus NSO 2018 ESA 2010 CGLGSS A CB 2018 BPM 6
Czech Republic MoF 2018 2001 CGLGSS A NSO 2018 BPM 6
Denmark NSO 2018 2001 CGLGSS A NSO 2018 BPM 6
Djibouti MoF 2018 2001 CG A CB 2018 BPM 5
Dominica MoF 201819 1986 CG C CB 2018 BPM 6
Dominican Republic MoF 2018 2014 CGLGSSNMPC A CB 2018 BPM 6
Ecuador CB and MoF 2018 1986 CGSGLGSSNFPC Mixed CB 2018 BPM 6
Egypt MoF 201718 2001 CGLGSSMPC C CB 201718 BPM 5
El Salvador MoF and CB 2018 1986 CGLGSS C CB 2018 BPM 6
Equatorial Guinea MoF and MEP 2017 1986 CG C CB 2017 BPM 5
Eritrea MoF 2018 2001 CG C CB 2018 BPM 5
Estonia MoF 2018 19862001 CGLGSS C CB 2018 BPM 6
Eswatini MoF 201819 2001 CG A CB 2018 BPM 6
Ethiopia MoF 201718 1986 CGSGLGNFPC C CB 201718 BPM 5
Fiji MoF 2018 1986 CG C CB 2018 BPM 6
Finland MoF 2018 2001 CGLGSS A NSO 2018 BPM 6
France NSO 2018 2001 CGLGSS A CB 2018 BPM 6
Gabon IMF staff 2018 2001 CG A CB 2018 BPM 5
The Gambia MoF 2018 1986 CG C CB and IMF staff 2018 BPM 5
Georgia MoF 2017 2001 CGLG C NSO and CB 2018 BPM 6
Germany NSO 2018 2001 CGSGLGSS A CB 2018 BPM 6
Ghana MoF 2018 2001 CG C CB 2018 BPM 5
Greece NSO 2018 2014 CGLGSS A CB 2018 BPM 6
Grenada MoF 2018 2014 CG CB CB 2018 BPM 6
Guatemala MoF 2018 2001 CG C CB 2018 BPM 6
Guinea MoF 2018 2001 CG C CB and MEP 2018 BPM 6
Guinea-Bissau MoF 2018 2001 CG A CB 2018 BPM 6
Guyana MoF 2018 1986 CGSSNFPC C CB 2018 BPM 6
Haiti MoF 201718 2001 CG C CB 201718 BPM 5
Honduras MoF 2018 2014 CGLGSSother Mixed CB 2018 BPM 6
Hong Kong SAR NSO 201819 2001 CG C NSO 2018 BPM 6
Hungary MEP and NSO 2018 ESA 2010 CGLGSSNMPC A CB 2018 BPM 6
Iceland NSO 2018 2001 CGLGSS A CB 2018 BPM 6
India MoF and IMF staff 201718 1986 CGSG C CB 201718 BPM 6
Indonesia MoF 2018 2001 CGLG C CB 2018 BPM 6
Iran MoF 201718 2001 CG C CB 201718 BPM 5
Iraq MoF 2017 2001 CG C CB 2017 BPM 6
Ireland MoF and NSO 2018 2001 CGLGSS A NSO 2018 BPM 6
Israel MoF and NSO 2017 2014 CGLGSS NSO 2018 BPM 6
Italy NSO 2018 2001 CGLGSS A NSO 2018 BPM 6
Jamaica MoF 201819 1986 CG C CB 201718 BPM 5
W O R L D E C O N O M I C O U T L O O K G LO B A L M A N U FAC T U R I N G D OW N T U R N R IS I N G T R A D E B A R R I E R S
136 International Monetary Fund | October 2019
Table G Key Data Documentation (continued)
Country Currency
National Accounts Prices (CPI)
Historical Data Source1
Latest Actual Annual Data Base Year2
System of National Accounts
Use of Chain-Weighted
Methodology3Historical Data
Source1
Latest Actual
Annual Data
Japan Japanese yen GAD 2018 2011 SNA 2008 From 1980 GAD 2018
Jordan Jordanian dinar NSO 2018 2016 SNA 2008 NSO 2018
Kazakhstan Kazakhstani tenge NSO 2018 2007 SNA 1993 From 1994 CB 2018
Kenya Kenyan shilling NSO 2018 2009 SNA 2008 NSO 2018
Kiribati Australian dollar NSO 2017 2006 SNA 2008 IMF staff 2017
Korea South Korean won CB 2018 2015 SNA 2008 From 1980 NSO 2018
Kosovo Euro NSO 2018 2016 ESA 2010 NSO 2018
Kuwait Kuwaiti dinar MEP and NSO 2017 2010 SNA 1993 NSO and MEP 2018
Kyrgyz Republic Kyrgyz som NSO 2018 2005 SNA 1993 NSO 2018
Lao PDR Lao kip NSO 2018 2012 SNA 1993 NSO 2018
Latvia Euro NSO 2018 2010 ESA 2010 From 1995 NSO 2018
Lebanon Lebanese pound NSO 2017 2010 SNA 2008 From 2010 NSO 201718
Lesotho Lesotho loti NSO 201617 201213 SNA 2008 NSO 2018
Liberia US dollar CB 2018 1992 SNA 1993 CB 2018
Libya Libyan dinar MEP 2017 2007 SNA 1993 NSO 2017
Lithuania Euro NSO 2018 2010 ESA 2010 From 2005 NSO 2018
Luxembourg Euro NSO 2018 2010 ESA 2010 From 1995 NSO 2018
Macao SAR Macanese pataca NSO 2018 2017 SNA 2008 From 2001 NSO 2018
Madagascar Malagasy ariary NSO 2017 2000 SNA 1968 NSO 2018
Malawi Malawian kwacha NSO 2011 2010 SNA 2008 NSO 2018
Malaysia Malaysian ringgit NSO 2018 2015 SNA 2008 NSO 2018
Maldives Maldivian rufiyaa MoF and NSO 2018 2014 SNA 1993 CB 2018
Mali CFA franc NSO 2018 1999 SNA 1993 NSO 2018
Malta Euro NSO 2018 2010 ESA 2010 From 2000 NSO 2018
Marshall Islands US dollar NSO 201617 200304 SNA 1993 NSO 201617
Mauritania New Mauritanian ouguiya
NSO 2014 2004 SNA 1993 NSO 2017
Mauritius Mauritian rupee NSO 2018 2006 SNA 1993 From 1999 NSO 2018
Mexico Mexican peso NSO 2018 2013 SNA 2008 NSO 2018
Micronesia US dollar NSO 201718 200304 SNA 1993 NSO 201718
Moldova Moldovan leu NSO 2018 1995 SNA 2008 NSO 2018
Mongolia Mongolian toumlgroumlg NSO 2016 2010 SNA 1993 NSO 201617
Montenegro Euro NSO 2018 2006 ESA 2010 NSO 2018
Morocco Moroccan dirham NSO 2018 2007 SNA 1993 From 1998 NSO 2018
Mozambique Mozambican metical
NSO 2018 2009 SNA 1993 2008
NSO 2018
Myanmar Myanmar kyat MEP 201718 201011 NSO 201718
Namibia Namibian dollar NSO 2018 2000 SNA 1993 NSO 2018
Nauru Australian dollar 201718 200607 SNA 1993 NSO 201617
Nepal Nepalese rupee NSO 201819 200001 SNA 1993 CB 201718
Netherlands Euro NSO 2018 2015 ESA 2010 From 1980 NSO 2018
New Zealand New Zealand dollar NSO 2018 200910 SNA 2008 From 1987 NSO 2018
Nicaragua Nicaraguan coacuterdoba
CB 2018 2006 SNA 1993 From 1994 CB 2018
Niger CFA franc NSO 2018 2000 SNA 1993 NSO 2018
Nigeria Nigerian naira NSO 2018 2010 SNA 2008 NSO 2018
North Macedonia Macedonian denar NSO 2018 2005 ESA 2010 NSO 2018
Norway Norwegian krone NSO 2018 2017 ESA 2010 From 1980 NSO 2018
S TAT I S T I C A L A P P E N D I X
International Monetary Fund | October 2019 137
Table G Key Data Documentation (continued)
Country
Government Finance Balance of Payments
Historical Data Source1
Latest Actual Annual Data
Statistics Manual in
Use at SourceSubsectors Coverage4
Accounting Practice5
Historical Data Source1
Latest Actual Annual Data
Statistics Manual
in Use at Source
Japan GAD 2017 2014 CGLGSS A MoF 2018 BPM 6
Jordan MoF 2018 2001 CGNFPC C CB 2018 BPM 6
Kazakhstan NSO 2018 2001 CGLG A CB 2018 BPM 6
Kenya MoF 2018 2001 CG C CB 2018 BPM 6
Kiribati MoF 2017 1986 CG C NSO 2017 BPM 6
Korea MoF 2017 2001 CGSS C CB 2018 BPM 6
Kosovo MoF 2018 CGLG C CB 2018 BPM 6
Kuwait MoF 2017 1986 CG Mixed CB 2017 BPM 6
Kyrgyz Republic MoF 2018 CGLGSS C CB 2018 BPM 5
Lao PDR MoF 2017 2001 CG C CB 2017 BPM 5
Latvia MoF 2018 ESA 2010 CGLGSS C CB 2018 BPM 6
Lebanon MoF 2017 2001 CG Mixed CB and IMF staff 2017 BPM 5
Lesotho MoF 201718 2001 CGLG C CB 201718 BPM 5
Liberia MoF 2018 2001 CG A CB 2018 BPM 5
Libya MoF 2018 1986 CGSGLG C CB 2017 BPM 5
Lithuania MoF 2018 2014 CGLGSS A CB 2018 BPM 6
Luxembourg MoF 2018 2001 CGLGSS A NSO 2018 BPM 6
Macao SAR MoF 2017 2014 CGSS C NSO 2017 BPM 6
Madagascar MoF 2018 1986 CGLG C CB 2018 BPM 5
Malawi MoF 201718 1986 CG C NSO and GAD 2017 BPM 6
Malaysia MoF 2018 2001 CGSGLG C NSO 2018 BPM 6
Maldives MoF 2018 1986 CG C CB 2018 BPM 6
Mali MoF 2018 2001 CG Mixed CB 2018 BPM 6
Malta NSO 2018 2001 CGSS A NSO 2018 BPM 6
Marshall Islands MoF 201617 2001 CGLGSS A NSO 201617 BPM 6
Mauritania MoF 2017 1986 CG C CB 2016 BPM 5
Mauritius MoF 201718 2001 CGLGNFPC C CB 2018 BPM 6
Mexico MoF 2018 2014 CGSSNMPCNFPC C CB 2018 BPM 6
Micronesia MoF 201718 2001 CGSGLGSS NSO 201718 BPM 5
Moldova MoF 2018 1986 CGLG C CB 2018 BPM 6
Mongolia MoF 201718 2001 CGSGLGSS C CB 2016 BPM 6
Montenegro MoF 2018 19862001 CGLGSS C CB 2018 BPM 6
Morocco MEP 2018 2001 CG A GAD 2018 BPM 6
Mozambique MoF 2018 2001 CGSG Mixed CB 2018 BPM 6
Myanmar MoF 201718 2014 CGNFPC C IMF staff 201718 BPM 6
Namibia MoF 201819 2001 CG C CB 2018 BPM 6
Nauru MoF 201617 2001 CG Mixed IMF staff 201617 BPM 6
Nepal MoF 201718 2001 CG C CB 201718 BPM 5
Netherlands MoF 2018 2001 CGLGSS A CB 2018 BPM 6
New Zealand MoF 201718 2001 CG LG A NSO 2018 BPM 6
Nicaragua MoF 2018 1986 CGLGSS C IMF staff 2018 BPM 6
Niger MoF 2017 1986 CG A CB 2018 BPM 6
Nigeria MoF 2018 2001 CGSGLG C CB 2018 BPM 6
North Macedonia MoF 2018 1986 CGSGSS C CB 2018 BPM 6
Norway NSO and MoF 2018 2014 CGLGSS A NSO 2017 BPM 6
W O R L D E C O N O M I C O U T L O O K G LO B A L M A N U FAC T U R I N G D OW N T U R N R IS I N G T R A D E B A R R I E R S
138 International Monetary Fund | October 2019
Table G Key Data Documentation (continued)
Country Currency
National Accounts Prices (CPI)
Historical Data Source1
Latest Actual Annual Data Base Year2
System of National Accounts
Use of Chain-Weighted
Methodology3Historical Data
Source1
Latest Actual
Annual Data
Oman Omani rial NSO 2018 2010 SNA 1993 NSO 2018
Pakistan Pakistan rupee NSO 201718 2005066 NSO 201718
Palau US dollar MoF 201718 201415 SNA 1993 MoF 201718
Panama US dollar NSO 2018 2007 SNA 1993 From 2007 NSO 2018
Papua New Guinea Papua New Guinea kina
NSO and MoF 2015 2013 SNA 1993 NSO 2015
Paraguay Paraguayan guaraniacute
CB 2018 2014 SNA 2008 CB 2018
Peru Peruvian nuevo sol CB 2018 2007 SNA 1993 CB 2018
Philippines Philippine peso NSO 2018 2000 SNA 2008 NSO 2018
Poland Polish zloty NSO 2018 2010 ESA 2010 From 1995 NSO 2018
Portugal Euro NSO 2018 2016 ESA 2010 From 1980 NSO 2018
Puerto Rico US dollar NSO 201718 1954 SNA 1968 NSO 201718
Qatar Qatari riyal NSO and MEP 2018 2013 SNA 1993 NSO and MEP 2018
Romania Romanian leu NSO 2018 2010 ESA 2010 From 2000 NSO 2018
Russia Russian ruble NSO 2018 2016 SNA 2008 From 1995 NSO 2018
Rwanda Rwandan franc NSO 2018 2014 SNA 2008 NSO 2018
Samoa Samoan tala NSO 201718 200910 SNA 1993 NSO 201718
San Marino Euro NSO 2017 2007 NSO 2017
Satildeo Tomeacute and Priacutencipe
Satildeo Tomeacute and Priacutencipe dobra
NSO 2017 2008 SNA 1993 NSO 2017
Saudi Arabia Saudi riyal NSO 2018 2010 SNA 1993 NSO 2018
Senegal CFA franc NSO 2018 2014 SNA 1993 NSO 2018
Serbia Serbian dinar NSO 2018 2010 ESA 2010 From 2010 NSO 2018
Seychelles Seychelles rupee NSO 2017 2006 SNA 1993 NSO 2018
Sierra Leone Sierra Leonean leone
NSO 2017 2006 SNA 1993 From 2010 NSO 2017
Singapore Singapore dollar NSO 2018 2015 SNA 2008 From 2015 NSO 2018
Slovak Republic Euro NSO 2018 2010 ESA 2010 From 1997 NSO 2018
Slovenia Euro NSO 2018 2010 ESA 2010 From 2000 NSO 2018
Solomon Islands Solomon Islands dollar
CB 2018 2004 SNA 1993 NSO 2018
Somalia US dollar CB 2018 2013 SNA 1993 CB 2018
South Africa South African rand NSO 2018 2010 SNA 2008 NSO 2018
South Sudan South Sudanese pound
NSO 2017 2010 SNA 1993 NSO 2018
Spain Euro NSO 2018 2010 ESA 2010 From 1995 NSO 2018
Sri Lanka Sri Lankan rupee NSO 2018 2010 SNA 1993 NSO 2018
St Kitts and Nevis Eastern Caribbean dollar
NSO 2018 2006 SNA 1993 NSO 2018
St Lucia Eastern Caribbean dollar
NSO 2018 2006 SNA 1993 NSO 2018
St Vincent and the Grenadines
Eastern Caribbean dollar
NSO 2018 20066 SNA 1993 NSO 2018
Sudan Sudanese pound NSO 2016 1982 SNA 1968 NSO 2018
Suriname Surinamese dollar NSO 2017 2007 SNA 1993 NSO 2018
S TAT I S T I C A L A P P E N D I X
International Monetary Fund | October 2019 139
Table G Key Data Documentation (continued)
Country
Government Finance Balance of Payments
Historical Data Source1
Latest Actual Annual Data
Statistics Manual in
Use at SourceSubsectors Coverage4
Accounting Practice5
Historical Data Source1
Latest Actual Annual Data
Statistics Manual
in Use at Source
Oman MoF 2018 2001 CG C CB 2018 BPM 5
Pakistan MoF 201718 1986 CGSGLG C CB 201718 BPM 6
Palau MoF 201718 2001 CG MoF 201718 BPM 6
Panama MoF 2018 1986 CGSGLGSSNFPC C NSO 2018 BPM 6
Papua New Guinea MoF 2015 1986 CG C CB 2015 BPM 5
Paraguay MoF 2018 2001 CGSGLGSSMPC NFPC
C CB 2018 BPM 6
Peru CB and MoF 2018 2001 CGSGLGSS Mixed CB 2018 BPM 5
Philippines MoF 2018 2001 CGLGSS C CB 2018 BPM 6
Poland MoF and NSO 2018 ESA 2010 CGLGSS A CB 2018 BPM 6
Portugal NSO 2018 2001 CGLGSS A CB 2018 BPM 6
Puerto Rico MEP 201516 2001 A
Qatar MoF 2018 1986 CG C CB and IMF staff 2018 BPM 5
Romania MoF 2018 2001 CGLGSS C CB 2018 BPM 6
Russia MoF 2018 2001 CGSGSS Mixed CB 2018 BPM 6
Rwanda MoF 2018 1986 CGLG Mixed CB 2018 BPM 6
Samoa MoF 201718 2001 CG A CB 201718 BPM 6
San Marino MoF 2017 CG Other 2017
Satildeo Tomeacute and Priacutencipe
MoF and Customs 2018 2001 CG C CB 2017 BPM 6
Saudi Arabia MoF 2018 2014 CG C CB 2018 BPM 6
Senegal MoF 2018 2001 CG C CB and IMF staff 2018 BPM 6
Serbia MoF 2018 19862001 CGSGLGSSother C CB 2018 BPM 6
Seychelles MoF 2018 1986 CGSS C CB 2016 BPM 6
Sierra Leone MoF 2018 1986 CG C CB 2017 BPM 5
Singapore MoF and NSO 201819 2014 CG C NSO 2018 BPM 6
Slovak Republic NSO 2018 2001 CGLGSS A CB 2018 BPM 6
Slovenia MoF 2018 1986 CGSGLGSS C NSO 2018 BPM 6
Solomon Islands MoF 2017 1986 CG C CB 2018 BPM 6
Somalia MoF 2018 2001 CG C CB 2018 BPM 5
South Africa MoF 2018 2001 CGSGSS C CB 2018 BPM 6
South Sudan MoF and MEP 2018 CG C MoF NSO and MEP 2018 BPM 6
Spain MoF and NSO 2018 ESA 2010 CGSGLGSS A CB 2018 BPM 6
Sri Lanka MoF 2018 2001 CG C CB 2018 BPM 6
St Kitts and Nevis MoF 2018 1986 CG SG C CB 2018 BPM 6
St Lucia MoF 201718 1986 CG C CB 2018 BPM 6
St Vincent and the Grenadines
MoF 2018 1986 CG C CB 2017 BPM 6
Sudan MoF 2018 2001 CG Mixed CB 2018 BPM 6
Suriname MoF 2017 1986 CG Mixed CB 2017 BPM 5
W O R L D E C O N O M I C O U T L O O K G LO B A L M A N U FAC T U R I N G D OW N T U R N R IS I N G T R A D E B A R R I E R S
140 International Monetary Fund | October 2019
Table G Key Data Documentation (continued)
Country Currency
National Accounts Prices (CPI)
Historical Data Source1
Latest Actual Annual Data Base Year2
System of National Accounts
Use of Chain-Weighted
Methodology3Historical Data
Source1
Latest Actual
Annual Data
Sweden Swedish krona NSO 2018 2018 ESA 2010 From 1993 NSO 2018
Switzerland Swiss franc NSO 2017 2010 ESA 2010 From 1980 NSO 2018
Syria Syrian pound NSO 2010 2000 SNA 1993 NSO 2011
Taiwan Province of China
New Taiwan dollar NSO 2018 2011 SNA 2008 NSO 2018
Tajikistan Tajik somoni NSO 2017 1995 SNA 1993 NSO 2017
Tanzania Tanzanian shilling NSO 2018 2015 SNA 2008 NSO 2018
Thailand Thai baht MEP 2018 2002 SNA 1993 From 1993 MEP 2018
Timor-Leste US dollar MoF 2017 20156 SNA 2008 NSO 2018
Togo CFA franc NSO 2016 2007 SNA 1993 NSO 2018
Tonga Tongan parsquoanga CB 2018 2010 SNA 1993 CB 2018
Trinidad and Tobago Trinidad and Tobago dollar
NSO 2017 2012 SNA 1993 NSO 2018
Tunisia Tunisian dinar NSO 2017 2010 SNA 1993 From 2009 NSO 2016
Turkey Turkish lira NSO 2018 2009 ESA 2010 From 2009 NSO 2018
Turkmenistan New Turkmen manat
NSO 2017 2008 SNA 1993 From 2000 NSO 2017
Tuvalu Australian dollar PFTAC advisors 2015 2005 SNA 1993 NSO 2018
Uganda Ugandan shilling NSO 2018 2010 SNA 1993 CB 201819
Ukraine Ukrainian hryvnia NSO 2018 2010 SNA 2008 From 2005 NSO 2018
United Arab Emirates
UAE dirham NSO 2017 2010 SNA 2008 NSO 2018
United Kingdom British pound NSO 2018 2016 ESA 2010 From 1980 NSO 2018
United States US dollar NSO 2018 2012 SNA 2008 From 1980 NSO 2018
Uruguay Uruguayan peso CB 2018 2005 SNA 1993 NSO 2018
Uzbekistan Uzbek sum NSO 2018 2015 SNA 1993 NSO and IMF staff
2018
Vanuatu Vanuatu vatu NSO 2017 2006 SNA 1993 NSO 2017
Venezuela Venezuelan boliacutevar soberano
CB 2018 1997 SNA 2008 CB 2018
Vietnam Vietnamese dong NSO 2018 2010 SNA 1993 NSO 2018
Yemen Yemeni rial IMF staff 2017 1990 SNA 1993 NSOCB and IMF staff
2017
Zambia Zambian kwacha NSO 2017 2010 SNA 2008 NSO 2018
Zimbabwe RTGS dollar NSO 2015 2012 NSO 2018
S TAT I S T I C A L A P P E N D I X
International Monetary Fund | October 2019 141
Table G Key Data Documentation (continued)
Country
Government Finance Balance of Payments
Historical Data Source1
Latest Actual Annual Data
Statistics Manual in
Use at SourceSubsectors Coverage4
Accounting Practice5
Historical Data Source1
Latest Actual Annual Data
Statistics Manual
in Use at Source
Sweden MoF 2018 2001 CGLGSS A NSO 2018 BPM 6
Switzerland MoF 2017 2001 CGSGLGSS A CB 2018 BPM 6
Syria MoF 2009 1986 CG C CB 2009 BPM 5
Taiwan Province of China
MoF 2018 2001 CGLGSS C CB 2018 BPM 6
Tajikistan MoF 2017 1986 CGLGSS C CB 2016 BPM 6
Tanzania MoF 2018 1986 CGLG C CB 2018 BPM 5
Thailand MoF 201718 2001 CGBCGLGSS A CB 2018 BPM 6
Timor-Leste MoF 2017 2001 CG C CB 2017 BPM 6
Togo MoF 2018 2001 CG C CB 2017 BPM 6
Tonga MoF 2017 2014 CG C CB and NSO 2018 BPM 6
Trinidad and Tobago MoF 201718 1986 CG C CB 2018 BPM 6
Tunisia MoF 2016 1986 CG C CB 2018 BPM 5
Turkey MoF 2018 2001 CGLGSSother A CB 2018 BPM 6
Turkmenistan MoF 2017 1986 CGLG C NSO and IMF staff 2015 BPM 6
Tuvalu MoF 2018 CG Mixed IMF staff 2012 BPM 6
Uganda MoF 2018 2001 CG C CB 2018 BPM 6
Ukraine MoF 2018 2001 CGLGSS C CB 2018 BPM 6
United Arab Emirates
MoF 2017 2001 CGBCGSGSS C CB 2017 BPM 5
United Kingdom NSO 2018 2001 CGLG A NSO 2018 BPM 6
United States MEP 2018 2014 CGSGLG A NSO 2018 BPM 6
Uruguay MoF 2018 1986 CGLGSSNFPC NMPC
C CB 2018 BPM 6
Uzbekistan MoF 2018 2014 CGSGLGSS C MEP 2018 BPM 6
Vanuatu MoF 2017 2001 CG C CB 2017 BPM 6
Venezuela MoF 2017 2001 BCGNFPC C CB 2018 BPM 5
Vietnam MoF 2017 2001 CGSGLG C CB 2018 BPM 5
Yemen MoF 2017 2001 CGLG C IMF staff 2017 BPM 5
Zambia MoF 2017 1986 CG C CB 2017 BPM 6
Zimbabwe MoF 2017 1986 CG C CB and MoF 2017 BPM 6
Note BPM = Balance of Payments Manual CPI = consumer price index ESA = European System of National Accounts SNA = System of National Accounts1CB = central bank Customs = Customs Authority GAD = General Administration Department IEO = international economic organization MEP = Ministry of Economy Planning Commerce andor Development MoF = Ministry of Finance andor Treasury NSO = National Statistics Office PFTAC = Pacific Financial Technical Assistance Centre2National accounts base year is the period with which other periods are compared and the period for which prices appear in the denominators of the price relationships used to calculate the index3Use of chain-weighted methodology allows countries to measure GDP growth more accurately by reducing or eliminating the downward biases in volume series built on index numbers that average volume components using weights from a year in the moderately distant past4BCG = budgetary central government CG = central government EUA = extrabudgetary unitsaccounts LG = local government MPC = monetary public corporation including central bank NFPC = nonfinancial public corporation NMPC = nonmonetary financial public corporation SG = state government SS = social security fund TG = territorial governments5Accounting standard A = accrual accounting C = cash accounting CB = commitments basis accounting Mixed = combination of accrual and cash accounting6Base year is not equal to 100 because the nominal GDP is not measured in the same way as real GDP or the data are seasonally adjusted
W O R L D E C O N O M I C O U T L O O K G LO B A L M A N U FAC T U R I N G D OW N T U R N R IS I N G T R A D E B A R R I E R S
142 International Monetary Fund | October 2019
Fiscal Policy Assumptions
The short-term fiscal policy assumptions used in the World Economic Outlook (WEO) are normally based on officially announced budgets adjusted for differences between the national authorities and the IMF staff regarding macroeconomic assumptions and projected fiscal outturns When no official budget has been announced projections incorporate policy mea-sures that are judged likely to be implemented The medium-term fiscal projections are similarly based on a judgment about the most likely path of policies For cases in which the IMF staff has insufficient informa-tion to assess the authoritiesrsquo budget intentions and prospects for policy implementation an unchanged structural primary balance is assumed unless indicated otherwise Specific assumptions used in regard to some of the advanced economies follow (See also Tables B5 to B9 in the online section of the Statistical Appendix for data on fiscal net lendingborrowing and structural balances)1
Argentina Fiscal projections are based on the avail-able information regarding budget outturn and budget plans for the federal and provincial governments fiscal measures announced by the authorities and the IMF staffrsquos macroeconomic projections
Australia Fiscal projections are based on data from the Australian Bureau of Statistics the fiscal year 201920 budgets of the commonwealth and states and the IMF staffrsquos estimates and projections
Austria Fiscal projections are based on data from Statistics Austria the authoritiesrsquo projections and the IMF staffrsquos estimates and projections
Belgium Projections are based on the 2019ndash22 Stability Programme and other available information
1 The output gap is actual minus potential output as a percentage of potential output Structural balances are expressed as a percentage of potential output The structural balance is the actual net lendingborrowing minus the effects of cyclical output from potential output corrected for one-time and other factors such as asset and commodity prices and output composition effects Changes in the structural balance consequently include effects of temporary fiscal measures the impact of fluctuations in interest rates and debt-service costs and other noncyclical fluctuations in net lendingborrowing The computations of structural balances are based on the IMF staffrsquos estimates of potential GDP and revenue and expenditure elasticities (See Annex I of the October 1993 WEO) Net debt is calculated as gross debt minus financial assets corresponding to debt instru-ments Estimates of the output gap and of the structural balance are subject to significant margins of uncertainty
on the authoritiesrsquo fiscal plans with adjustments for the IMF staffrsquos assumptions
Brazil Fiscal projections for 2019 take into account the deficit target approved in the budget law
Canada Projections use the baseline forecasts in the 2019 federal budget and the latest provincial budget updates as available The IMF staff makes some adjust-ments to these forecasts including for differences in macroeconomic projections The IMF staffrsquos forecast also incorporates the most recent data releases from Sta-tistics Canadarsquos Canadian System of National Economic Accounts including federal provincial and territorial budgetary outturns through the first quarter of 2019
Chile Projections are based on the authoritiesrsquo budget projections adjusted to reflect the IMF staffrsquos projections for GDP and copper prices
China Fiscal expansion is expected for 2019 due to a series of tax reforms and expenditure measures in response to the economic slowdown
Denmark Estimates for 2018 are aligned with the latest official budget numbers adjusted where appro-priate for the IMF staffrsquos macroeconomic assumptions For 2019 the projections incorporate key features of the medium-term fiscal plan as embodied in the authoritiesrsquo Convergence Programme 2019 submitted to the European Union
France Projections for 2019 and beyond are based on the measures of the 2018 budget law the multiyear law for 2018ndash22 and the 2019 budget law adjusted for differences in assumptions on macroeconomic and financial variables and revenue projections Historical fiscal data reflect the May 2019 revisions and update of the historical fiscal accounts debt data and national accounts
Germany The IMF staffrsquos projections for 2019 and beyond are based on the 2019 Stability Program and data updates from the national statistical agency adjusted for the differences in the IMF staffrsquos mac-roeconomic framework and assumptions concerning revenue elasticities The estimate of gross debt includes portfolios of impaired assets and noncore business transferred to institutions that are winding up as well as other financial sector and EU support operations
Greece Greecersquos general government primary balance estimate for 2018 is based on the April 2019 Excessive Deficit Procedure release by Eurostat Historical data since 2010 reflect adjustments in line with the primary balance definition under the enhanced surveillance framework for Greece
Box A1 Economic Policy Assumptions Underlying the Projections for Selected Economies
S TAT I S T I C A L A P P E N D I X
International Monetary Fund | October 2019 143
Hong Kong Special Administrative Region Projections are based on the authoritiesrsquo medium-term fiscal projec-tions on expenditures
Hungary Fiscal projections include the IMF staffrsquos projections of the macroeconomic framework and of the impact of recent legislative measures as well as fis-cal policy plans announced in the 2018 budget
India Historical data are based on budgetary execu-tion data Projections are based on available information on the authoritiesrsquo fiscal plans with adjustments for the IMF staffrsquos assumptions Subnational data are incorpo-rated with a lag of up to one year general government data are thus finalized well after central government data IMF and Indian presentations differ particularly regarding disinvestment and license-auction proceeds net versus gross recording of revenues in certain minor categories and some public-sector lending
Indonesia IMF projections are based on moderate tax policy and administration reforms and a gradual increase in social and capital spending over the medium term in line with fiscal space
Ireland Fiscal projections are based on the countryrsquos Budget 2019
Israel Historical data are based on government finance statistics data prepared by the Central Bureau of Statistics The medium-term fiscal projections are not in line with medium-term fiscal targets consistent with long experience of revisions to those targets
Italy The IMF staffrsquos estimates and projections are informed by the fiscal plans included in the govern-mentrsquos 2019 budget and April 2019 Economic and Financial Document The IMF staff assumes that the automatic value-added tax hikes for future years will be canceled
Japan The projections reflect the consumption tax rate increase in October 2019 the mitigating measures included in the FY2019 budget and tax reform and other fiscal measures already announced by the government
Korea The medium-term forecast incorporates the medium-term path for public spending announced by the government
Mexico Fiscal projections for 2019 are broadly in line with the approved budget projections for 2020 onward assume compliance with rules established in the Fiscal Responsibility Law
Netherlands Fiscal projections for 2019ndash24 are based on the authoritiesrsquo Bureau for Economic Policy Analysis budget projections after differences in
macroeconomic assumptions are adjusted for Histori-cal data were revised following the June 2014 Central Bureau of Statistics release of revised macro data because of the adoption of the European System of National and Regional Accounts (ESA 2010) and the revisions of data sources
New Zealand Fiscal projections are based on the fis-cal year 201920 budget and the IMF staffrsquos estimates
Portugal The projections for the current year are based on the authoritiesrsquo approved budget adjusted to reflect the IMF staffrsquos macroeconomic forecast Projections thereafter are based on the assumption of unchanged policies
Puerto Rico Fiscal projections are based on the Puerto Rico Fiscal and Economic Growth Plans (FEGPs) which were prepared in October 2018 and are certified by the Oversight Board In line with this planrsquos assumptions IMF projections assume federal aid for rebuilding after Hurricane Maria which devastated the island in September 2017 The projections also assume revenue losses from the following elimination of federal funding for the Affordable Care Act start-ing in 2020 for Puerto Rico elimination of federal tax incentives starting in 2018 that had neutralized the effects of Puerto Ricorsquos Act 154 on foreign firms and the effects of the Tax Cuts and Jobs Act which reduce the tax advantage of US firms producing in Puerto Rico Given sizable policy uncertainty some FEGP and IMF assumptions may differ in particu-lar those relating to the effects of the corporate tax reform tax compliance and tax adjustments (fees and rates) reduction of subsidies and expenses freez-ing of payroll operational costs and improvement of mobility reduction of expenses and increased health care efficiency On the expenditure side measures include extension of Act 66 which freezes much government spending through 2020 reduction of operating costs decreases in government subsidies and spending cuts in education Although IMF policy assumptions are similar to those in the FEGP scenario with full measures the IMFrsquos projections of fiscal revenues expenditures and balance are different from the FEGPsrsquo This stems from two main differences in methodologies first while IMF projections are on an accrual basis the FEGPsrsquo are on a cash basis Second the IMF and FEGPs make very different macroeco-nomic assumptions
Russia Projections for 2019ndash24 are based on the new oil price rule with adjustments by the IMF staff
Box A1 (continued)
W O R L D E C O N O M I C O U T L O O K G LO B A L M A N U FAC T U R I N G D OW N T U R N R IS I N G T R A D E B A R R I E R S
144 International Monetary Fund | October 2019
Saudi Arabia The IMF staff baseline projections of total government revenues except exported oil revenues are based on IMF staff understanding of government policies as announced in the 2019 Budget and Fiscal Balance Program 2019 Update Exported oil revenues are based on WEO baseline oil prices and the assumption that Saudi Arabia will overperform the Organization of Petroleum Exporting Countries+ agreement Expenditure projections take the 2019 budget and the Fiscal Balance Program 2019 Update as a starting point and reflect IMF staff estimates of the latest changes in policies and economic developments
Singapore For fiscal year 2019 projections are based on budget numbers For the rest of the projection period the IMF staff assumes unchanged policies
South Africa Fiscal assumptions are based on the 2019 Budget Review and the special appropriation of July 2019 for Eskom Nontax revenue excludes transactions in financial assets and liabilities as they involve primarily revenues associated with realized exchange rate valuation gains from the holding of for-eign currency deposits sale of assets and conceptually similar items
Spain For 2019 projections assume expenditures under the 2018 budget extension scenario and already legislated measures including pension and public wage increases and the IMF staffrsquos projection of revenues For 2020 and beyond fiscal projections are IMF staff projections which assume an unchanged structural primary balance
Sweden Fiscal projections take into account the authoritiesrsquo projections based on the 2019 Spring Bud-get The impact of cyclical developments on the fiscal accounts is calculated using the 2014 Organisation for Economic Co-operation and Developmentrsquos elasticity to take into account output and employment gaps
Switzerland The projections assume that fiscal policy is adjusted as necessary to keep fiscal balances in line with the requirements of Switzerlandrsquos fiscal rules
Turkey The fiscal projections assume a more nega-tive primary and overall balance than envisaged in the authoritiesrsquo New Economic Program 2019ndash21 based partly on recent weak growth and fiscal out-turns and partly on definitional differences the basis for the projections in the WEO and Fiscal Monitor is the IMF-defined fiscal balance which excludes some revenue and expenditure items that are included in the authoritiesrsquo headline balance
United Kingdom Fiscal projections are based on the UKrsquos Spring Statement 2019 with expenditure projections based on the budgeted nominal values but adjusted to account for the Spending Round 2019 and with revenue projections adjusted for differences between the IMF staffrsquos forecasts of macroeconomic vari-ables (such as GDP growth and inflation) and the fore-casts of these variables assumed in the authoritiesrsquo fiscal projections The IMF staffrsquos data exclude public sector banks and the effect of transferring assets from the Royal Mail Pension Plan to the public sector in April 2012 Real government consumption and investment are part of the real GDP path which according to the IMF staff may or may not be the same as projected by the UK Office for Budget Responsibility Fiscal year GDP is different from current year GDP The fiscal accounts are presented in terms of fiscal year Projections do not take into account revisions to the accounting (including on student loans) implemented on September 24 2019
United States Fiscal projections are based on the August 2019 Congressional Budget Office baseline adjusted for the IMF staffrsquos policy and macroeconomic assumptions Projections incorporate the effects of tax reform (the Tax Cuts and Jobs Act signed into law at the end of 2017) the Bipartisan Budget Act of 2018 passed in February 2018 and the Bipartisan Budget Act of 2019 passed in July 2019 Finally fiscal projections are adjusted to reflect the IMF staffrsquos forecasts for key macroeconomic and financial variables and different accounting treatment of financial sector support and of defined-benefit pension plans and are converted to a general government basis Data is compiled using SNA 2008 when translated into government finance statistics this is in accordance with the Government Finance Statistics Manual 2014 Because of data limitations most series begin in 2001
Monetary Policy AssumptionsMonetary policy assumptions are based on the
established policy framework in each country In most cases this implies a nonaccommodative stance over the business cycle official interest rates will increase when economic indicators suggest that infla-tion will rise above its acceptable rate or range they will decrease when indicators suggest inflation will not exceed the acceptable rate or range that output growth is below its potential rate and that the margin of slack in the economy is significant On this basis the London interbank offered rate on six-month US
Box A1 (continued)
S TAT I S T I C A L A P P E N D I X
International Monetary Fund | October 2019 145
dollar deposits is assumed to average 23 percent in 2019 and 20 percent in 2020 (see Table 11) The rate on three-month euro deposits is assumed to average ndash04 percent in 2019 and ndash06 percent in 2020 The interest rate on six-month Japanese yen depos-its is assumed to average 00 percent in 2019 and ndash01 percent in 2020
Argentina Monetary policy assumptions are con-sistent with the current monetary policy framework which targets zero base money growth in seasonally adjusted terms
Australia Monetary policy assumptions are in line with market expectations
Brazil Monetary policy assumptions are consistent with gradual convergence of inflation toward the middle of the target range
Canada Monetary policy assumptions are based on the IMF staffrsquos analysis
China Monetary policy is expected to remain on hold
Denmark Monetary policy is to maintain the peg to the euro
Euro area Monetary policy assumptions for euro area member countries are in line with market expectations
Hong Kong Special Administrative Region The IMF staff assumes that the currency board system will remain intact
India Monetary policy projections are consistent with achieving the Reserve Bank of Indiarsquos inflation target over the medium term
Indonesia Monetary policy assumptions are in line with the maintenance of inflation within the central bankrsquos targeted band
Japan Monetary policy assumptions are in line with market expectations
Korea The projections assume no change in the policy rate in 2019ndash20
Mexico Monetary policy assumptions are consistent with attaining the inflation target
Russia Monetary projections assume that the Central Bank of Russia is moving toward a neutral monetary policy stance
Saudi Arabia Monetary policy projections are based on the continuation of the exchange rate peg to the US dollar
Singapore Broad money is projected to grow in line with the projected growth in nominal GDP
South Africa Monetary policy will be moderately accommodative
Sweden Monetary projections are in line with Riksbank projections
Switzerland The projections assume no change in the policy rate in 2019ndash20
Turkey The outlook for monetary and financial con-ditions assumes further monetary policy easing in 2019
United Kingdom The short-term interest rate path is based on market interest rate expectations
United States The IMF staff expects the Federal Open Market Committee to continue to adjust the federal funds target rate in line with the broader macroeconomic outlook
Box A1 (continued)
W O R L D E C O N O M I C O U T L O O K G LO B A L M A N U FAC T U R I N G D OW N T U R N R IS I N G T R A D E B A R R I E R S
146 International Monetary Fund | October 2019
List of Tables
Output
A1 Summary of World Output A2 Advanced Economies Real GDP and Total Domestic DemandA3 Advanced Economies Components of Real GDP A4 Emerging Market and Developing Economies Real GDP
Inflation
A5 Summary of Inflation A6 Advanced Economies Consumer Prices A7 Emerging Market and Developing Economies Consumer Prices
Financial Policies
A8 Major Advanced Economies General Government Fiscal Balances and Debt
Foreign Trade
A9 Summary of World Trade Volumes and Prices
Current Account Transactions
A10 Summary of Current Account Balances A11 Advanced Economies Balance on Current Account A12 Emerging Market and Developing Economies Balance on Current Account
Balance of Payments and External Financing
A13 Summary of Financial Account Balances
Flow of Funds
A14 Summary of Net Lending and Borrowing
Medium-Term Baseline Scenario
A15 Summary of World Medium-Term Baseline Scenario
S TAT I S T I C A L A P P E N D I X
International Monetary Fund | October 2019 147
Table A1 Summary of World Output1(Annual percent change)
Average Projections2001ndash10 2011 2012 2013 2014 2015 2016 2017 2018 2019 2020 2024
World 39 43 35 35 36 35 34 38 36 30 34 36Advanced Economies 17 17 12 14 21 23 17 25 23 17 17 16United States 17 16 22 18 25 29 16 24 29 24 21 16Euro Area 12 16 ndash09 ndash03 14 21 19 25 19 12 14 13Japan 06 ndash01 15 20 04 12 06 19 08 09 05 05Other Advanced Economies2 28 30 20 24 29 21 21 27 22 15 18 21Emerging Market and Developing Economies 62 64 54 51 47 43 46 48 45 39 46 48
Regional GroupsEmerging and Developing Asia 85 79 70 69 68 68 67 66 64 59 60 60Emerging and Developing Europe 44 58 30 31 19 08 18 39 31 18 25 25Latin America and the Caribbean 32 46 29 29 13 03 ndash06 12 10 02 18 27Middle East and Central Asia 53 46 49 30 31 26 50 23 19 09 29 33Sub-Saharan Africa 59 53 47 52 51 31 14 30 32 32 36 42Analytical Groups
By Source of Export EarningsFuel 55 52 50 26 22 03 22 09 08 ndash03 20 21Nonfuel 64 67 54 57 53 52 51 56 53 47 50 53
Of Which Primary Products 42 49 25 41 22 29 17 28 18 12 24 35By External Financing SourceNet Debtor Economies 51 53 44 47 45 41 41 48 46 40 46 51Net Debtor Economies by
Debt-Servicing ExperienceEconomies with Arrears andor
Rescheduling during 2014ndash18 50 25 19 30 20 04 23 28 34 34 40 48Other GroupsEuropean Union 16 18 ndash04 03 19 25 21 28 22 15 16 15Low-Income Developing Countries 65 53 47 60 60 45 36 47 50 50 51 55Middle East and North Africa 50 44 49 24 27 24 54 18 11 01 27 29
MemorandumMedian Growth RateAdvanced Economies 22 19 10 14 25 22 24 30 27 18 18 17Emerging Market and Developing Economies 46 47 42 41 38 33 32 35 35 32 35 35Low-Income Developing Countries 53 60 51 52 54 39 42 45 40 50 50 48Output per Capita3
Advanced Economies 11 12 07 09 16 18 12 20 18 13 13 12Emerging Market and Developing Economies 46 48 36 36 32 28 31 33 32 25 33 35Low-Income Developing Countries 38 36 17 36 37 19 12 24 28 27 29 32World Growth Rate Based on Market
Exchange Rates 26 31 25 26 28 28 26 32 31 25 27 29Value of World Output (billions of US dollars)At Market Exchange Rates 49881 73312 74690 76842 78944 74779 75824 80262 84930 86599 90520 111569At Purchasing Power Parities 70721 95143 100020 105216 110903 115799 120832 127703 135436 141860 149534 1861561Real GDP2Excludes the United States euro area countries and Japan3Output per capita is in international currency at purchasing power parity
W O R L D E C O N O M I C O U T L O O K G L O B A L M A N U F A C T U R I N G D O W N T U R N R I S I N G T R A D E B A R R I E R S
148 International Monetary Fund | October 2019
Table A2 Advanced Economies Real GDP and Total Domestic Demand1
(Annual percent change)Fourth Quarter2
Average Projections Projections2001ndash10 2011 2012 2013 2014 2015 2016 2017 2018 2019 2020 2024 2018Q4 2019Q4 2020Q4
Real GDPAdvanced Economies 17 17 12 14 21 23 17 25 23 17 17 16 18 16 18United States 17 16 22 18 25 29 16 24 29 24 21 16 25 24 20Euro Area 12 16 ndash09 ndash03 14 21 19 25 19 12 14 13 12 10 18
Germany 09 39 04 04 22 17 22 25 15 05 12 12 06 04 13France 13 22 03 06 10 11 11 23 17 12 13 14 12 10 13Italy 03 06 ndash28 ndash17 01 09 11 17 09 00 05 06 00 02 10Spain 22 ndash10 ndash29 ndash17 14 36 32 30 26 22 18 16 23 20 18Netherlands 14 15 ndash10 ndash01 14 20 22 29 26 18 16 15 21 17 18Belgium 16 18 02 02 13 17 15 17 14 12 13 14 12 12 14Austria 15 29 07 00 07 11 20 26 27 16 17 16 22 13 20Ireland 28 03 02 14 85 251 37 81 83 43 35 27 37 34 44Portugal 07 ndash17 ndash41 ndash09 08 18 20 35 24 19 16 15 20 18 17Greece 18 ndash91 ndash73 ndash32 07 ndash04 ndash02 15 19 20 22 09 15 30 14Finland 17 26 ndash14 ndash08 ndash06 05 28 30 17 12 15 13 08 17 14Slovak Republic 49 28 17 15 28 42 31 32 41 26 27 25 37 22 27Lithuania 43 60 38 35 35 20 24 41 35 34 27 23 37 23 16Slovenia 27 09 ndash26 ndash10 28 22 31 48 41 29 29 21 30 31 28Luxembourg 27 25 ndash04 37 43 39 24 15 26 26 28 26 17 33 21Latvia 38 64 40 24 19 30 21 46 48 28 28 30 53 33 24Estonia 34 74 31 13 30 18 26 57 48 32 29 28 50 21 34Cyprus 33 04 ndash29 ndash58 ndash13 20 48 45 39 31 29 25 38 38 14Malta 20 13 28 46 87 108 57 67 68 51 43 32 71 69 18
Japan 06 ndash01 15 20 04 12 06 19 08 09 05 05 03 03 12United Kingdom 16 16 14 20 29 23 18 18 14 12 14 15 14 10 16Korea 47 37 24 32 32 28 29 32 27 20 22 29 30 19 19Canada 19 31 18 23 29 07 11 30 19 15 18 17 16 18 17Australia 31 28 39 21 26 25 28 24 27 17 23 26 22 20 24Taiwan Province of China 42 38 21 22 40 08 15 31 26 20 19 20 18 20 17Singapore 58 63 44 48 39 29 30 37 31 05 10 25 14 08 12Switzerland 18 18 10 19 25 13 17 19 28 08 13 16 15 11 16Sweden 22 31 ndash06 11 27 44 24 24 23 09 15 20 23 00 24Hong Kong SAR 41 48 17 31 28 24 22 38 30 03 15 29 12 05 28Czech Republic 32 18 ndash08 ndash05 27 53 25 44 30 25 26 25 27 22 30Norway 16 10 27 10 20 20 11 23 13 19 24 17 16 32 09Israel 32 51 24 43 38 23 40 36 34 31 31 30 29 30 34Denmark 08 13 02 09 16 23 24 23 15 17 19 15 26 15 19New Zealand 27 19 25 22 31 40 42 26 28 25 27 25 25 21 34Puerto Rico 07 ndash04 00 ndash03 ndash12 ndash10 ndash13 ndash27 ndash49 ndash11 ndash07 ndash08 Macao SAR 217 92 112 ndash12 ndash216 ndash09 97 47 ndash13 ndash11 03 Iceland 26 19 13 41 21 47 66 44 48 08 16 19 31 22 15San Marino ndash83 ndash70 ndash08 ndash07 25 25 06 11 08 07 05 MemorandumMajor Advanced Economies 13 16 14 14 20 22 15 23 21 16 16 14 16 15 17
Real Total Domestic DemandAdvanced Economies 16 15 08 11 21 26 20 25 22 18 18 16 21 17 18United States 17 15 22 16 27 36 19 26 31 26 22 15 29 24 20Euro Area 11 08 ndash24 ndash05 14 24 24 21 15 13 15 14 18 14 14
Germany 03 33 ndash09 11 17 16 30 24 21 13 17 13 21 08 14France 15 21 ndash04 07 15 15 15 23 10 13 13 15 06 16 14Italy 05 ndash06 ndash56 ndash26 02 15 15 15 10 ndash03 04 08 01 06 ndash03Spain 23 ndash31 ndash51 ndash32 20 40 24 30 30 18 17 14 26 18 15
Japan 02 07 23 24 04 08 00 14 05 12 08 04 08 ndash01 17United Kingdom 17 ndash02 18 21 32 23 24 14 16 11 16 15 20 ndash05 32Canada 29 34 20 22 17 ndash01 07 39 18 08 13 19 03 11 17Other Advanced Economies3 30 33 19 16 28 24 28 35 24 15 19 25 18 22 17MemorandumMajor Advanced Economies 13 14 11 14 20 24 17 23 22 18 17 13 20 15 18
1In this and other tables when countries are not listed alphabetically they are ordered on the basis of economic size2From the fourth quarter of the preceding year3Excludes the Group of Seven (Canada France Germany Italy Japan United Kingdom United States) and euro area countries
S TAT I S T I C A L A P P E N D I X
International Monetary Fund | October 2019 149
Table A3 Advanced Economies Components of Real GDP(Annual percent change)
Averages Projections2001ndash10 2011ndash20 2011 2012 2013 2014 2015 2016 2017 2018 2019 2020
Private Consumer ExpenditureAdvanced Economies 18 18 12 09 11 19 25 22 22 21 18 17United States 21 25 19 15 15 30 37 27 26 30 25 22Euro Area 11 08 01 ndash12 ndash07 09 19 20 16 14 12 13
Germany 04 14 19 15 04 11 19 23 13 13 14 13France 18 09 06 ndash04 05 08 15 18 14 09 11 13Italy 05 00 00 ndash40 ndash24 02 19 13 15 06 03 04Spain 20 06 ndash24 ndash35 ndash31 15 30 29 25 23 15 15
Japan 09 05 ndash04 20 24 ndash09 ndash02 ndash01 11 03 06 02United Kingdom 18 17 ndash07 15 18 20 26 31 21 17 16 14Canada 31 23 23 19 26 26 23 22 35 21 16 16Other Advanced Economies1 30 25 30 21 22 25 28 25 28 26 19 23MemorandumMajor Advanced Economies 16 17 12 11 12 18 25 21 21 20 18 16
Public ConsumptionAdvanced Economies 22 11 ndash06 00 ndash01 06 18 19 12 17 21 21United States 21 03 ndash30 ndash15 ndash19 ndash08 18 18 06 17 22 22Euro Area 19 09 ndash01 ndash03 04 08 13 18 15 11 12 13
Germany 14 20 10 13 14 17 28 41 24 14 20 18France 16 12 11 16 15 13 10 14 15 08 08 06Italy 10 ndash05 ndash18 ndash14 ndash03 ndash07 ndash06 01 03 02 ndash09 04Spain 47 02 ndash03 ndash47 ndash21 ndash03 20 10 19 21 16 11
Japan 15 13 19 17 15 05 15 14 03 08 17 18United Kingdom 26 12 01 12 ndash02 22 14 08 ndash02 04 28 39Canada 25 12 13 07 ndash08 06 14 18 21 29 07 11Other Advanced Economies1 31 29 18 24 28 27 28 31 31 35 38 31MemorandumMajor Advanced Economies 19 08 ndash11 ndash02 ndash05 01 16 18 08 13 18 20
Gross Fixed Capital FormationAdvanced Economies 05 27 32 26 17 35 32 22 40 26 18 22United States 00 38 46 69 36 51 32 19 37 41 25 27Euro Area 04 17 15 ndash33 ndash24 15 50 40 35 23 31 26
Germany ndash03 26 74 ndash02 ndash13 32 18 38 25 35 31 25France 12 17 20 02 ndash08 00 10 27 47 28 23 22Italy 01 ndash03 ndash19 ndash93 ndash66 ndash23 21 35 43 34 28 22Spain 12 10 ndash69 ndash86 ndash34 47 67 29 48 53 29 27
Japan ndash22 21 17 35 49 31 16 ndash03 30 12 13 09United Kingdom 03 24 26 21 34 72 34 23 35 02 ndash06 06Canada 38 07 46 49 14 23 ndash52 ndash43 30 12 ndash14 12Other Advanced Economies1 28 24 43 30 24 24 21 29 57 07 ndash07 15MemorandumMajor Advanced Economies 00 28 37 37 22 38 23 17 35 31 20 21
W O R L D E C O N O M I C O U T L O O K G L O B A L M A N U F A C T U R I N G D O W N T U R N R I S I N G T R A D E B A R R I E R S
150 International Monetary Fund | October 2019
Averages Projections2001ndash10 2011ndash20 2011 2012 2013 2014 2015 2016 2017 2018 2019 2020
Final Domestic DemandAdvanced Economies 16 18 13 11 11 20 26 22 24 21 18 19United States 17 24 16 20 13 28 33 24 25 30 25 23Euro Area 11 11 04 ndash14 ndash08 10 24 24 20 15 16 16
Germany 04 18 28 11 02 17 21 30 18 18 19 17France 16 12 10 02 05 08 13 19 21 13 13 14Italy 05 ndash02 ndash08 ndash45 ndash28 ndash04 14 14 18 10 05 08Spain 23 06 ndash30 ndash48 ndash30 18 36 25 29 29 18 17
Japan 02 10 05 23 28 02 06 01 14 06 11 08United Kingdom 17 17 00 16 17 29 25 25 19 12 14 17Canada 31 17 26 24 16 21 03 06 31 21 07 15Other Advanced Economies1 29 25 31 24 24 25 26 28 33 22 15 22MemorandumMajor Advanced Economies 13 18 13 14 11 20 23 20 22 21 19 18
Stock Building2
Advanced Economies 00 00 02 ndash03 00 01 01 ndash02 01 01 00 ndash01United States 00 00 ndash01 02 02 ndash01 03 ndash06 00 01 01 ndash02Euro Area 00 00 04 ndash10 03 04 00 00 01 00 ndash03 ndash01
Germany ndash01 ndash01 04 ndash18 08 00 ndash04 01 05 03 ndash05 00France ndash01 01 11 ndash06 02 07 03 ndash04 02 ndash03 00 00Italy 00 ndash01 02 ndash11 02 06 01 01 ndash03 ndash01 ndash08 ndash03Spain 00 00 ndash01 ndash02 ndash03 02 05 ndash01 01 01 00 00
Japan 00 00 02 00 ndash04 01 03 ndash01 00 01 00 00United Kingdom 00 00 ndash02 02 02 07 ndash02 ndash01 ndash06 04 ndash03 ndash01Canada ndash01 01 07 ndash03 05 ndash04 ndash04 00 08 ndash02 01 ndash01Other Advanced Economies1 00 ndash01 02 ndash04 ndash07 02 ndash01 00 02 02 01 ndash03MemorandumMajor Advanced Economies 00 00 02 ndash02 02 01 01 ndash03 01 01 ndash01 ndash01
Foreign Balance2
Advanced Economies 01 00 03 04 02 00 ndash03 ndash02 00 00 ndash01 ndash01United States 00 ndash02 00 00 02 ndash03 ndash08 ndash03 ndash03 ndash03 ndash03 ndash01Euro Area 01 03 09 15 03 01 ndash02 ndash04 05 05 ndash01 ndash01
Germany 05 01 08 12 ndash05 07 03 ndash06 02 ndash05 ndash07 ndash03France ndash02 00 01 07 ndash01 ndash05 ndash04 ndash04 ndash01 07 00 ndash02Italy ndash02 04 12 28 08 ndash01 ndash05 ndash04 02 ndash01 03 01Spain ndash02 06 21 22 15 ndash05 ndash03 08 01 ndash03 04 02
Japan 03 ndash01 ndash09 ndash08 ndash04 00 03 06 05 00 ndash01 ndash02United Kingdom ndash01 ndash01 15 ndash04 ndash05 ndash04 ndash03 ndash07 05 ndash02 00 ndash02Canada ndash11 02 ndash03 ndash04 01 12 09 04 ndash11 00 07 04Other Advanced Economies1 06 02 06 05 07 04 00 ndash01 ndash05 03 03 01MemorandumMajor Advanced Economies 00 ndash01 01 02 00 ndash01 ndash04 ndash02 00 ndash02 ndash02 ndash01
1Excludes the Group of Seven (Canada France Germany Italy Japan United Kingdom United States) and euro area countries2Changes expressed as percent of GDP in the preceding period
Table A3 Advanced Economies Components of Real GDP (continued)(Annual percent change)
S TAT I S T I C A L A P P E N D I X
International Monetary Fund | October 2019 151
Table A4 Emerging Market and Developing Economies Real GDP(Annual percent change)
Average Projections2001ndash10 2011 2012 2013 2014 2015 2016 2017 2018 2019 2020 2024
Emerging and Developing Asia 85 79 70 69 68 68 67 66 64 59 60 60Bangladesh 58 65 63 60 63 68 72 76 79 78 74 73Bhutan 84 97 64 36 40 62 74 63 46 55 72 64Brunei Darussalam 14 37 09 ndash21 ndash25 ndash04 ndash25 13 01 18 47 21Cambodia 80 71 73 74 71 70 69 70 75 70 68 65China 105 95 79 78 73 69 67 68 66 61 58 55Fiji 13 27 14 47 56 47 25 54 35 27 30 32India1 75 66 55 64 74 80 82 72 68 61 70 73Indonesia 54 62 60 56 50 49 50 51 52 50 51 53Kiribati 07 16 47 42 ndash07 104 51 03 23 23 23 18Lao PDR 72 80 78 80 76 73 70 68 63 64 65 68Malaysia 46 53 55 47 60 50 44 57 47 45 44 49Maldives 65 84 24 73 73 29 73 69 75 65 60 55Marshall Islands 20 11 32 28 ndash07 ndash06 18 45 26 24 23 12Micronesia 02 33 ndash20 ndash39 ndash22 50 07 24 12 14 08 06Mongolia 63 173 123 116 79 24 12 53 69 65 54 50Myanmar 107 55 65 79 82 75 52 63 68 62 63 64Nauru 108 104 310 272 34 30 ndash55 ndash15 15 07 20Nepal 40 34 48 41 60 33 06 82 67 71 63 50Palau 03 49 18 ndash14 44 101 08 ndash35 17 03 18 20Papua New Guinea 37 11 47 38 135 95 41 27 ndash11 50 26 35Philippines 48 37 67 71 61 61 69 67 62 57 62 65Samoa 25 56 04 ndash19 12 17 72 27 09 34 44 22Solomon Islands 34 132 46 30 23 25 32 37 39 27 29 29Sri Lanka 51 84 91 34 50 50 45 34 32 27 35 48Thailand 46 08 72 27 10 31 34 40 41 29 30 36Timor-Leste2 43 67 57 24 47 35 51 ndash35 ndash02 45 50 48Tonga 12 20 ndash11 ndash06 27 36 47 27 15 35 37 20Tuvalu 09 79 ndash38 46 13 91 30 32 43 41 44 27Vanuatu 29 12 18 20 23 02 35 44 32 38 31 29Vietnam 68 62 52 54 60 67 62 68 71 65 65 65Emerging and Developing Europe 44 58 30 31 19 08 18 39 31 18 25 25Albania 56 25 14 10 18 22 33 38 41 30 40 40Belarus 74 55 17 10 17 ndash38 ndash25 25 30 15 03 ndash04Bosnia and Herzegovina 39 09 ndash07 24 11 31 32 31 36 28 26 30Bulgaria 46 19 00 05 18 35 39 38 31 37 32 28Croatia 25 ndash03 ndash23 ndash05 ndash01 24 35 29 26 30 27 20Hungary 20 17 ndash16 21 42 35 23 41 49 46 33 22Kosovo 46 44 28 34 12 41 41 42 38 42 40 40Moldova 51 58 ndash06 90 50 ndash03 44 47 40 35 38 38Montenegro 33 32 ndash27 35 18 34 29 47 49 30 25 29North Macedonia 30 23 ndash05 29 36 39 28 02 27 32 34 35Poland 39 50 16 14 33 38 31 49 51 40 31 25Romania 42 20 21 35 34 39 48 70 41 40 35 30Russia 48 51 37 18 07 ndash23 03 16 23 11 19 18Serbia 50 20 ndash07 29 ndash16 18 33 20 43 35 40 40Turkey 40 111 48 85 52 61 32 75 28 02 30 35Ukraine1 39 55 02 00 ndash66 ndash98 24 25 33 30 30 33Latin America and the Caribbean 32 46 29 29 13 03 ndash06 12 10 02 18 27Antigua and Barbuda 14 ndash20 34 ndash06 38 38 55 31 74 40 33 20Argentina 34 60 ndash10 24 ndash25 27 ndash21 27 ndash25 ndash31 ndash13 32Aruba ndash08 35 ndash14 42 09 ndash04 05 23 12 07 10 11The Bahamas 07 06 31 ndash30 07 06 04 01 16 09 ndash06 16Barbados 07 ndash07 ndash04 ndash14 ndash01 24 25 05 ndash06 ndash01 06 18Belize 39 22 29 09 37 34 ndash06 14 30 27 21 17Bolivia 38 52 51 68 55 49 43 42 42 39 38 37Brazil 37 40 19 30 05 ndash36 ndash33 11 11 09 20 23Chile 42 61 53 40 18 23 17 13 40 25 30 32Colombia 40 74 39 46 47 30 21 14 26 34 36 37
W O R L D E C O N O M I C O U T L O O K G L O B A L M A N U F A C T U R I N G D O W N T U R N R I S I N G T R A D E B A R R I E R S
152 International Monetary Fund | October 2019
Average Projections2001ndash10 2011 2012 2013 2014 2015 2016 2017 2018 2019 2020 2024
Latin America and the Caribbean (continued) 32 46 29 29 13 03 ndash06 12 10 02 18 27
Costa Rica 43 43 48 23 35 36 42 34 26 20 25 35Dominica 24 ndash02 ndash11 ndash06 44 ndash26 25 ndash95 05 94 49 15Dominican Republic 46 31 27 49 71 69 67 47 70 50 52 50Ecuador 41 79 56 49 38 01 ndash12 24 14 ndash05 05 25El Salvador 16 38 28 22 17 24 25 23 25 25 23 22Grenada 18 08 ndash12 24 73 64 37 44 42 31 27 30Guatemala 33 42 30 37 42 41 31 28 31 34 35 35Guyana 24 54 50 50 39 31 34 21 41 44 856 32Haiti 01 55 29 42 28 12 15 12 15 01 12 15Honduras 41 38 41 28 31 38 38 49 37 34 35 39Jamaica 06 14 ndash05 02 06 09 15 07 16 11 10 22Mexico 15 37 36 14 28 33 29 21 20 04 13 24Nicaragua 29 63 65 49 48 48 46 47 ndash38 ndash50 ndash08 15Panama 59 113 98 69 51 57 50 53 37 43 55 55Paraguay 37 42 ndash05 84 49 31 43 50 37 10 40 39Peru 56 65 60 58 24 33 40 25 40 26 36 38St Kitts and Nevis 22 32 ndash44 64 72 16 18 09 46 35 35 27St Lucia 20 41 ndash04 ndash20 13 02 32 26 09 15 32 15St Vincent and the Grenadines 26 02 13 25 02 08 08 07 20 23 23 23Suriname 50 58 27 29 03 ndash34 ndash56 17 20 22 25 26Trinidad and Tobago1 57 ndash02 ndash07 20 ndash10 18 ndash65 ndash19 03 00 15 17Uruguay 32 52 35 46 32 04 17 26 16 04 23 24Venezuela 31 42 56 13 ndash39 ndash62 ndash170 ndash157 ndash180 ndash350 ndash100 Middle East and Central Asia 53 46 49 30 31 26 50 23 19 09 29 33Afghanistan 65 140 57 27 10 22 27 27 30 35 55Algeria 39 28 34 28 38 37 32 13 14 26 24 08Armenia 81 47 71 33 36 33 02 75 52 60 48 45Azerbaijan 144 ndash16 22 58 28 10 ndash31 02 10 27 21 24Bahrain 54 20 37 54 44 29 35 38 18 20 21 30Djibouti 35 73 48 50 71 77 69 51 55 60 60 60Egypt 49 18 22 33 29 44 43 41 53 55 59 60Georgia 63 72 64 34 46 29 28 48 47 46 48 52Iran 47 31 ndash77 ndash03 32 ndash16 125 37 ndash48 ndash95 00 11Iraq 121 75 139 76 07 25 152 ndash25 ndash06 34 47 21Jordan 60 26 27 28 31 24 20 21 19 22 24 30Kazakhstan 83 74 48 60 42 12 11 41 41 38 39 35Kuwait 46 96 66 12 05 06 29 ndash35 12 06 31 29Kyrgyz Republic 40 60 ndash01 109 40 39 43 47 35 38 34 34Lebanon 57 09 27 26 19 04 16 06 02 02 09 27Libya1 18 ndash667 1247 ndash368 ndash530 ndash130 ndash74 640 179 ndash191 00 00Mauritania 49 47 58 61 56 04 18 31 36 66 59 58Morocco 49 52 30 45 27 45 11 42 30 27 37 45Oman 30 26 91 51 14 47 49 03 18 00 37 16Pakistan 45 36 38 37 41 41 46 52 55 33 24 50Qatar 131 134 47 44 40 37 21 16 15 20 28 28Saudi Arabia 34 100 54 27 37 41 17 ndash07 24 02 22 25Somalia 12 19 24 35 29 14 28 29 32 35Sudan3 51 ndash28 ndash170 20 47 19 29 17 ndash22 ndash26 ndash15 14Syria4 45 Tajikistan 80 74 75 74 67 60 69 71 73 50 45 40Tunisia 42 ndash19 40 29 30 12 13 18 25 15 24 44Turkmenistan 132 147 111 102 103 65 62 65 62 63 60 58United Arab Emirates 39 69 45 51 44 51 30 05 17 16 25 25Uzbekistan 69 83 82 80 72 74 61 45 51 55 60 60Yemen 43 ndash127 24 48 ndash02 ndash280 ndash94 ndash51 08 21 20 36
Table A4 Emerging Market and Developing Economies Real GDP (continued)(Annual percent change)
S TAT I S T I C A L A P P E N D I X
International Monetary Fund | October 2019 153
Average Projections2001ndash10 2011 2012 2013 2014 2015 2016 2017 2018 2019 2020 2024
Sub-Saharan Africa 59 53 47 52 51 31 14 30 32 32 36 42Angola 88 35 85 50 48 09 ndash26 ndash02 ndash12 ndash03 12 38Benin 39 30 48 72 64 18 33 57 67 66 67 67Botswana 41 60 45 113 41 ndash17 43 29 45 35 43 39Burkina Faso 59 66 65 58 43 39 59 63 68 60 60 60Burundi 37 40 44 59 45 ndash40 ndash10 00 01 04 05 05Cabo Verde 54 40 11 08 06 10 47 37 51 50 50 50Cameroon 39 41 45 54 59 57 46 35 41 40 42 54Central African Republic 24 42 51 ndash364 01 43 47 45 38 45 50 50Chad 98 01 88 58 69 18 ndash56 ndash24 24 23 54 37Comoros 31 41 32 45 21 11 26 30 30 13 42 35Democratic Republic of the Congo 47 69 71 85 95 69 24 37 58 43 39 46Republic of Congo 47 34 38 33 68 26 ndash28 ndash18 16 40 28 23Cocircte drsquoIvoire 11 ndash49 109 93 88 88 80 77 74 75 73 64Equatorial Guinea 152 65 83 ndash41 04 ndash91 ndash88 ndash47 ndash57 ndash46 ndash50 ndash28Eritrea 13 257 19 ndash105 309 ndash206 74 ndash96 122 31 39 48Eswatini 35 22 54 39 09 23 13 20 24 13 05 05Ethiopia 85 114 87 99 103 104 80 101 77 74 72 65Gabon 14 71 53 55 44 39 21 05 08 29 34 45The Gambia 35 ndash81 52 29 ndash14 41 19 48 65 65 64 48Ghana 58 174 90 79 29 22 34 81 63 75 56 51Guinea 31 56 59 39 37 38 108 100 58 59 60 50Guinea-Bissau 25 81 ndash17 33 10 61 63 59 38 46 49 53Kenya 42 61 46 59 54 57 59 49 63 56 60 59Lesotho 39 67 49 22 27 21 27 05 28 28 ndash02 13Liberia 20 77 84 88 07 00 ndash16 25 12 04 16 37Madagascar 26 14 30 22 33 31 42 43 52 52 53 48Malawi 49 49 19 52 57 29 23 40 32 45 51 65Mali 58 32 ndash08 23 71 62 58 54 47 50 50 48Mauritius 40 41 35 34 37 36 38 38 38 37 38 40Mozambique 82 71 72 71 74 66 38 37 33 18 60 115Namibia 40 51 51 56 64 61 11 ndash09 ndash01 ndash02 16 30Niger 54 22 118 53 75 43 49 49 65 63 60 68Nigeria 89 49 43 54 63 27 ndash16 08 19 23 25 26Rwanda 82 80 86 47 62 89 60 61 86 78 81 75Satildeo Tomeacute and Priacutencipe 52 44 31 48 65 38 42 39 27 27 35 45Senegal 40 15 51 28 66 64 64 71 67 60 68 80Seychelles 20 54 37 60 45 49 45 43 41 35 33 36Sierra Leone 89 63 152 207 46 ndash205 64 38 35 50 47 47South Africa 35 33 22 25 18 12 04 14 08 07 11 18South Sudan ndash524 293 29 ndash02 ndash167 ndash55 ndash11 79 82 47Tanzania 66 79 51 68 67 62 69 68 70 52 57 65Togo 22 64 65 61 59 57 56 44 49 51 53 54Uganda 79 68 22 47 46 57 23 50 61 62 62 101Zambia 74 56 76 51 47 29 38 35 37 20 17 15Zimbabwe5 ndash39 142 167 20 24 18 07 47 35 ndash71 27 221See country-specific notes for India Libya Trinidad and Tobago and Ukraine in the ldquoCountry Notesrdquo section of the Statistical Appendix2In this table only the data for Timor-Leste are based on non-oil GDP3Data for 2011 exclude South Sudan after July 9 Data for 2012 and onward pertain to the current Sudan4Data for Syria are excluded for 2011 onward owing to the uncertain political situation5The Zimbabwe dollar ceased circulating in early 2009 Data are based on IMF staff estimates of price and exchange rate developments in US dollars IMF staff estimates of US dollar values may differ from authoritiesrsquo estimates Real GDP is in constant 2009 prices
Table A4 Emerging Market and Developing Economies Real GDP (continued)(Annual percent change)
W O R L D E C O N O M I C O U T L O O K G L O B A L M A N U F A C T U R I N G D O W N T U R N R I S I N G T R A D E B A R R I E R S
154 International Monetary Fund | October 2019
Table A5 Summary of Inflation(Percent)
Average Projections2001ndash10 2011 2012 2013 2014 2015 2016 2017 2018 2019 2020 2024
GDP DeflatorsAdvanced Economies 17 14 13 13 15 12 10 14 16 15 16 18United States 21 21 19 18 19 10 10 19 24 18 20 20Euro Area 19 11 13 12 09 13 08 09 13 15 16 19Japan ndash11 ndash17 ndash08 ndash03 17 21 03 ndash02 ndash01 07 10 09Other Advanced Economies1 21 19 12 15 13 11 13 20 15 14 12 19
Consumer PricesAdvanced Economies 20 27 20 14 14 03 08 17 20 15 18 20United States 24 31 21 15 16 01 13 21 24 18 23 23Euro Area2 21 27 25 13 04 02 02 15 18 12 14 18Japan ndash03 ndash03 ndash01 03 28 08 ndash01 05 10 10 13 13Other Advanced Economies1 21 33 21 17 15 05 09 18 19 14 16 20Emerging Market and Developing Economies3 66 71 58 55 47 47 43 43 48 47 48 43
Regional GroupsEmerging and Developing Asia 43 65 46 46 34 27 28 24 26 27 30 33Emerging and Developing Europe 115 79 62 56 65 105 55 54 62 68 56 53Latin America and the Caribbean 58 52 46 46 49 55 56 60 62 72 67 43Middle East and Central Asia 72 92 94 88 66 55 55 67 99 82 91 71Sub-Saharan Africa 99 93 92 65 64 69 108 109 85 84 80 66Analytical Groups
By Source of Export EarningsFuel 97 86 80 81 64 86 71 54 70 65 68 62Nonfuel 57 67 53 49 43 38 37 40 43 44 44 39
Of Which Primary Products4 65 69 69 65 70 52 61 111 134 165 156 88By External Financing SourceNet Debtor Economies 74 76 69 62 56 54 51 55 54 51 51 45Net Debtor Economies by
Debt-Servicing ExperienceEconomies with Arrears andor
Rescheduling during 2014ndash18 100 103 80 68 101 143 112 184 175 140 117 83Other GroupsEuropean Union 24 31 26 15 05 01 02 17 19 15 17 20Low-Income Developing Countries 97 119 97 80 72 69 91 97 91 88 88 73Middle East and North Africa 69 87 97 94 65 56 52 67 110 84 89 78
MemorandumMedian Inflation RateAdvanced Economies 22 32 26 14 07 01 06 16 17 15 16 20Emerging Market and Developing Economies3 52 55 46 38 31 27 27 33 30 29 32 301Excludes the United States euro area countries and Japan2Based on Eurostatrsquos harmonized index of consumer prices3Excludes Venezuela but includes Argentina from 2017 onward See country-specific notes for Venezuela and Argentina in the ldquoCountry Notesrdquo section of the Statistical Appendix4Includes Argentina from 2017 onward See country-specific note for Argentina in the ldquoCountry Notesrdquo section of the Statistical Appendix
S TAT I S T I C A L A P P E N D I X
International Monetary Fund | October 2019 155
Table A6 Advanced Economies Consumer Prices1
(Annual percent change)End of Period2
Average Projections Projections2001ndash10 2011 2012 2013 2014 2015 2016 2017 2018 2019 2020 2024 2018 2019 2020
Advanced Economies 20 27 20 14 14 03 08 17 20 15 18 20 16 17 17United States 24 31 21 15 16 01 13 21 24 18 23 23 19 22 24Euro Area3 21 27 25 13 04 02 02 15 18 12 14 18 15 13 13
Germany 16 25 22 16 08 07 04 17 19 15 17 21 18 18 17France 19 23 22 10 06 01 03 12 21 12 13 17 20 10 14Italy 22 29 33 12 02 01 ndash01 13 12 07 10 15 12 07 10Spain 28 32 24 14 ndash02 ndash05 ndash02 20 17 07 10 18 12 07 11Netherlands 21 25 28 26 03 02 01 13 16 25 16 20 18 21 17Belgium 21 34 26 12 05 06 18 22 23 15 13 18 22 11 13Austria 19 35 26 21 15 08 10 22 21 15 19 20 17 16 19Ireland 22 12 19 05 03 00 ndash02 03 07 12 15 20 08 14 15Portugal 25 36 28 04 ndash02 05 06 16 12 09 12 17 06 43 ndash31Greece 34 31 10 ndash09 ndash14 ndash11 00 11 08 06 09 18 06 09 09Finland 17 33 32 22 12 ndash02 04 08 12 12 13 18 13 11 13Slovak Republic 41 41 37 15 ndash01 ndash03 ndash05 14 25 26 21 20 19 24 20Lithuania 30 41 32 12 02 ndash07 07 37 25 23 22 22 18 24 22Slovenia 42 18 26 18 02 ndash05 ndash01 14 17 18 19 20 14 22 19Luxembourg 26 37 29 17 07 01 00 21 20 17 17 19 19 20 16Latvia 54 42 23 00 07 02 01 29 26 30 26 22 25 21 23Estonia 42 51 42 32 05 01 08 37 34 25 24 21 33 25 24Cyprus 24 35 31 04 ndash03 ndash15 ndash12 07 08 07 16 20 11 12 13Malta 24 25 32 10 08 12 09 13 17 17 18 20 12 20 19
Japan ndash03 ndash03 ndash01 03 28 08 ndash01 05 10 10 13 13 08 16 02United Kingdom 21 45 28 26 15 00 07 27 25 18 19 20 23 16 21Korea 32 40 22 13 13 07 10 19 15 05 09 20 13 07 09Canada 20 29 15 09 19 11 14 16 22 20 20 20 21 22 19Australia 30 34 17 25 25 15 13 20 20 16 18 25 18 18 17Taiwan Province of China 09 14 16 10 13 ndash06 10 11 15 08 11 14 ndash01 08 11Singapore 16 52 46 24 10 ndash05 ndash05 06 04 07 10 15 05 07 11Switzerland 09 02 ndash07 ndash02 00 ndash11 ndash04 05 09 06 06 10 07 03 09Sweden 19 14 09 04 02 07 11 19 20 17 15 19 22 16 14Hong Kong SAR 04 53 41 43 44 30 24 15 24 30 26 25 24 30 26Czech Republic 25 19 33 14 04 03 07 25 22 26 23 20 20 23 20Norway 20 13 07 21 20 22 36 19 28 23 19 20 35 19 19Israel 21 35 17 15 05 ndash06 ndash05 02 08 10 13 20 08 11 18Denmark 20 27 24 05 04 02 00 11 07 13 15 20 07 12 14New Zealand 26 41 10 11 12 03 06 19 16 14 19 20 19 15 20Puerto Rico 27 29 13 11 06 ndash08 ndash03 18 13 ndash01 10 12 06 ndash01 10Macao SAR 58 61 55 60 46 24 12 30 24 27 30 29 24 27Iceland 62 40 52 39 20 16 17 18 27 28 25 25 37 26 26San Marino 20 28 16 11 01 06 10 15 13 15 17 15 13 15Memorandum Major Advanced Economies 18 26 19 13 15 03 08 18 21 16 19 20 17 18 181Movements in consumer prices are shown as annual averages2Monthly year-over-year changes and for several countries on a quarterly basis3Based on Eurostatrsquos harmonized index of consumer prices
W O R L D E C O N O M I C O U T L O O K G L O B A L M A N U F A C T U R I N G D O W N T U R N R I S I N G T R A D E B A R R I E R S
156 International Monetary Fund | October 2019
Table A7 Emerging Market and Developing Economies Consumer Prices1
(Annual percent change)End of Period2
Average Projections Projections2001ndash10 2011 2012 2013 2014 2015 2016 2017 2018 2019 2020 2024 2018 2019 2020
Emerging and Developing Asia 43 65 46 46 34 27 28 24 26 27 30 33 23 28 30Bangladesh 63 115 62 75 70 62 57 56 56 55 55 55 55 55 55Bhutan 46 73 93 113 95 76 76 55 35 36 42 45 32 31 39Brunei Darussalam 05 01 01 04 ndash02 ndash04 ndash07 ndash02 01 01 02 02 00 01 02Cambodia 51 55 29 30 39 12 30 29 24 22 25 30 16 23 25China 21 54 26 26 20 14 20 16 21 23 24 30 19 22 24Fiji 37 73 34 29 05 14 39 34 41 35 30 30 49 35 30India 65 95 100 94 58 49 45 36 34 34 41 40 25 39 41Indonesia 86 53 40 64 64 64 35 38 32 32 33 30 31 34 31Kiribati 31 15 ndash30 ndash15 21 06 19 04 19 17 24 26 14 17 22Lao PDR 76 76 43 64 41 13 18 07 20 31 33 31 15 29 31Malaysia 22 32 17 21 31 21 21 38 10 10 21 23 02 19 21Maldives 40 113 109 38 21 19 08 23 14 15 23 20 05 21 24Marshall Islands 54 43 19 11 ndash22 ndash15 00 08 06 18 21 08 06 18Micronesia 32 41 63 23 07 00 ndash09 01 15 18 20 20 15 18 20Mongolia 88 77 150 86 129 59 05 46 76 90 83 71 97 84 81Myanmar 195 68 04 58 51 73 91 46 59 78 67 55 86 72 68Nauru ndash34 03 ndash11 03 98 82 51 05 25 23 20 34 15 22Nepal 61 96 83 99 90 72 99 45 42 45 61 53 46 62 60Palau 26 26 54 28 40 22 ndash13 09 16 22 20 20 14 22 20Papua New Guinea 65 44 45 50 52 60 67 49 52 39 44 48 48 35 48Philippines 52 48 30 26 36 07 13 29 52 25 23 30 51 16 30Samoa 57 29 62 ndash02 ndash12 19 01 13 37 29 27 28 58 40 29Solomon Islands 85 74 59 54 52 ndash06 05 05 27 04 22 43 32 32 35Sri Lanka 97 67 75 69 28 22 40 66 43 41 45 50 28 42 46Thailand 26 38 30 22 19 ndash09 02 07 11 09 09 20 04 13 12Timor-Leste 45 132 109 95 08 06 ndash15 05 23 25 31 40 21 28 35Tonga 77 63 11 21 12 ndash11 26 74 29 38 39 25 48 28 49Tuvalu 29 05 14 20 11 31 35 41 21 21 32 20 23 21 32Vanuatu 29 09 13 15 08 25 08 31 29 20 22 26 26 26 22Vietnam 77 187 91 66 41 06 27 35 35 36 37 40 30 37 38Emerging and Developing Europe 115 79 62 56 65 105 55 54 62 68 56 53 74 60 55Albania 30 34 20 19 16 19 13 20 20 18 20 30 18 18 22Belarus 201 532 592 183 181 135 118 60 49 54 48 40 56 50 45Bosnia and Herzegovina 28 40 21 ndash01 ndash09 ndash10 ndash16 08 14 11 14 19 16 12 14Bulgaria3 60 34 24 04 ndash16 ndash11 ndash13 12 26 25 23 22 23 25 22Croatia 28 23 34 22 ndash02 ndash05 ndash11 11 15 10 12 15 09 12 13Hungary 56 39 57 17 ndash02 ndash01 04 24 28 34 34 30 27 32 34Kosovo 28 73 25 18 04 ndash05 03 15 11 28 15 20 29 16 17Moldova 95 76 46 46 51 96 64 66 31 49 57 50 09 75 50Montenegro 73 35 41 22 ndash07 15 ndash03 24 26 11 19 19 17 23 16North Macedonia 21 39 33 28 ndash03 ndash03 ndash02 14 15 13 17 22 08 14 18Poland 28 43 37 09 00 ndash09 ndash06 20 16 24 35 28 11 33 35Romania 121 58 33 40 11 ndash06 ndash16 13 46 42 33 25 33 45 35Russia 125 84 51 68 78 155 70 37 29 47 35 40 43 38 37Serbia 147 111 73 77 21 14 11 31 20 22 19 30 20 20 22Turkey 175 65 89 75 89 77 78 111 163 157 126 110 203 135 120Ukraine4 111 80 06 ndash03 121 487 139 144 109 87 59 50 98 70 56Latin America and the Caribbean5 58 52 46 46 49 55 56 60 62 72 67 43 71 73 60Antigua and Barbuda 22 35 34 11 11 10 ndash05 24 12 16 20 20 17 20 20Argentina4 95 98 100 106 257 343 544 510 170 476 573 392Aruba 33 44 06 ndash24 04 05 ndash09 ndash05 36 30 20 22 46 18 27The Bahamas 23 31 19 04 12 19 ndash03 16 22 18 26 22 20 28 24Barbados 41 94 45 18 18 ndash11 15 44 37 19 18 23 06 14 23Belize 25 17 12 05 12 ndash09 07 11 03 12 16 20 ndash01 24 08Bolivia 46 99 45 57 58 41 36 28 23 17 31 50 15 23 40Brazil 66 66 54 62 63 90 87 34 37 38 35 35 37 36 39Chile 32 33 30 18 47 43 38 22 23 22 28 30 21 26 29Colombia 56 34 32 20 29 50 75 43 32 36 37 30 32 39 31
S TAT I S T I C A L A P P E N D I X
International Monetary Fund | October 2019 157
Table A7 Emerging Market and Developing Economies Consumer Prices1 (continued)(Annual percent change)
End of Period2
Average Projections Projections2001ndash10 2011 2012 2013 2014 2015 2016 2017 2018 2019 2020 2024 2018 2019 2020
Latin America and the Caribbean (continued)5 58 52 46 46 49 55 56 60 62 72 67 43 71 73 60
Costa Rica 103 49 45 52 45 08 00 16 22 27 31 30 20 32 30Dominica 22 11 14 00 08 ndash09 00 06 14 16 18 20 14 18 18Dominican Republic 121 85 37 48 30 08 16 33 36 18 41 40 12 30 40Ecuador 81 45 51 27 36 40 17 04 ndash02 04 12 11 03 05 11El Salvador 34 51 17 08 11 ndash07 06 10 11 09 11 10 04 14 12Grenada 30 30 24 00 ndash10 ndash06 17 09 08 10 16 19 14 10 19Guatemala 68 62 38 43 34 24 44 44 38 42 42 43 23 38 39Guyana 59 44 24 19 07 ndash09 08 19 13 21 33 28 16 27 35Haiti 140 74 68 68 39 75 134 147 129 176 171 59 133 197 150Honduras 76 68 52 52 61 32 27 39 43 44 42 40 42 44 42Jamaica 118 75 69 94 83 37 23 44 37 36 46 50 24 47 45Mexico 47 34 41 38 40 27 28 60 49 38 31 30 48 32 30Nicaragua 83 81 72 71 60 40 35 39 50 56 42 50 39 70 42Panama 26 59 57 40 26 01 07 09 08 00 15 20 02 08 18Paraguay 78 83 37 27 50 31 41 36 40 35 37 37 32 37 37Peru 24 34 37 28 32 35 36 28 13 22 19 20 22 19 20St Kitts and Nevis 33 58 08 11 02 ndash23 ndash03 00 ndash02 06 20 20 ndash07 20 20St Lucia 26 28 42 15 35 ndash10 ndash31 01 20 21 23 20 22 21 22St Vincent and the
Grenadines 29 32 26 08 02 ndash17 ndash02 22 23 14 20 20 14 20 20Suriname 131 177 50 19 34 69 555 220 69 55 58 48 54 71 48Trinidad and Tobago 70 51 93 52 57 47 31 19 10 09 15 26 10 09 15Uruguay 87 81 81 86 89 87 96 62 76 76 72 70 80 75 70Venezuela 4 220 261 211 406 622 1217 2549 4381 653741 200000 500000 1300602 200000 500000Middle East and
Central Asia 72 92 94 88 66 55 55 67 99 82 91 71 111 79 89Afghanistan 118 64 74 47 ndash07 44 50 06 26 45 50 08 45 45Algeria 36 45 89 33 29 48 64 56 43 20 41 87 27 39 32Armenia 44 77 25 58 30 37 ndash14 10 25 17 25 41 19 15 33Azerbaijan 74 78 10 24 14 40 124 128 23 28 30 35 23 28 30Bahrain 18 ndash04 28 33 27 18 28 14 21 14 28 22 19 20 28Djibouti 37 52 42 11 13 ndash08 27 06 01 22 20 20 20 20 20Egypt 79 111 86 69 101 110 102 235 209 139 100 71 144 94 87Georgia 66 85 ndash09 ndash05 31 40 21 60 26 42 38 30 15 54 30Iran 147 215 306 347 156 119 91 96 305 357 310 250 475 311 300Iraq 56 61 19 22 14 05 01 04 ndash03 10 20 ndash01 03 12Jordan 40 42 45 48 29 ndash09 ndash08 33 45 20 25 25 36 25 25Kazakhstan 86 84 51 58 67 67 146 74 60 53 52 40 53 57 47Kuwait 32 49 32 27 31 37 35 15 06 15 22 25 04 18 30Kyrgyz Republic 74 166 28 66 75 65 04 32 15 13 50 50 05 40 51Lebanon 26 50 66 48 18 ndash37 ndash08 45 61 31 26 24 40 34 24Libya4 04 159 61 26 24 98 259 285 93 42 89 65 ndash45 120 65Mauritania 65 57 49 41 38 05 15 23 31 30 34 40 32 28 40Morocco 18 09 13 19 04 15 16 08 19 06 11 20 01 06 11Oman 29 40 29 12 10 01 11 16 09 08 18 25 09 08 18Pakistan 81 137 110 74 86 45 29 41 39 73 130 50 52 89 118Qatar 51 20 18 32 34 18 27 04 02 ndash04 22 20 Saudi Arabia 21 38 29 35 22 13 20 ndash09 25 ndash11 22 21 23 ndash11 22Somalia 32 40 30Sudan6 108 181 356 365 369 169 178 324 633 504 621 747 729 569 669Syria7 57 Tajikistan 135 124 58 50 61 58 59 73 38 74 71 65 54 70 68Tunisia 33 32 46 53 46 44 36 53 73 66 54 40 75 59 55Turkmenistan 72 53 53 68 60 74 36 80 132 134 130 60 72 90 80United Arab Emirates 55 09 07 11 23 41 16 20 31 ndash15 12 21 31 ndash15 12Uzbekistan 145 124 119 117 91 85 88 139 175 147 141 76 143 156 124Yemen 109 195 99 110 82 220 213 304 276 147 355 50 143 150 363
W O R L D E C O N O M I C O U T L O O K G L O B A L M A N U F A C T U R I N G D O W N T U R N R I S I N G T R A D E B A R R I E R S
158 International Monetary Fund | October 2019
Table A7 Emerging Market and Developing Economies Consumer Prices1 (continued)(Annual percent change)
End of Period2
Average Projections Projections2001ndash10 2011 2012 2013 2014 2015 2016 2017 2018 2019 2020 2024 2018 2019 2020
Sub-Saharan Africa 99 93 92 65 64 69 108 109 85 84 80 66 79 90 74Angola 424 135 103 88 73 92 307 298 196 172 150 60 186 170 120Benin 31 27 67 10 ndash11 02 ndash08 18 08 ndash03 10 20 ndash01 05 11Botswana 86 85 75 59 44 31 28 33 32 30 35 40 35 27 35Burkina Faso 28 28 38 05 ndash03 09 ndash02 04 20 11 14 20 03 20 20Burundi 89 96 182 79 44 56 55 166 12 73 90 90 53 90 90Cabo Verde 24 45 25 15 ndash02 01 ndash14 08 13 12 16 18 10 10 16Cameroon 26 29 24 21 19 27 09 06 11 21 22 20 20 23 22Central African Republic 33 12 59 66 116 45 46 45 16 30 26 25 46 30 25Chad 32 20 75 02 17 48 ndash16 ndash09 40 30 30 42 44 91 ndash64Comoros 42 22 59 04 00 09 08 01 17 32 14 19 09 48 06Democratic Republic of the Congo 368 149 09 09 12 07 32 358 293 55 50 50 72 55 50Republic of Congo 29 18 50 46 09 32 32 04 12 15 18 30 09 19 25Cocircte drsquoIvoire 29 49 13 26 04 12 07 07 04 10 20 20 11 10 20Equatorial Guinea 56 48 34 32 43 17 14 07 13 09 17 20 26 16 17Eritrea 180 59 48 59 100 285 ndash56 ndash133 ndash144 ndash276 00 20 ndash293 ndash01 00Eswatini 71 61 89 56 57 50 78 62 48 28 40 70 53 23 44Ethiopia 111 332 241 81 74 96 66 107 138 146 127 80 106 145 100Gabon 12 13 27 05 45 ndash01 21 27 48 30 30 25 63 30 30The Gambia 70 48 46 52 63 68 72 80 65 69 65 50 64 70 60Ghana 159 77 71 117 155 172 175 124 98 93 92 80 94 93 90Guinea 160 214 152 119 97 82 82 89 98 89 83 78 99 86 81Guinea-Bissau 23 51 21 08 ndash10 15 15 11 14 ndash26 13 25 59 15 ndash14Kenya 70 140 94 57 69 66 63 80 47 56 53 50 57 62 62Lesotho 70 60 55 50 46 43 62 45 47 59 57 55 52 60 53Liberia 100 85 68 76 99 77 88 124 235 222 205 135 285 206 190Madagascar 102 95 57 58 61 74 67 83 73 67 63 50 61 64 60Malawi 81 76 213 283 238 219 217 115 92 88 84 50 99 86 78Mali 27 31 53 ndash24 27 14 ndash18 18 17 02 13 19 10 10 15Mauritius 57 65 39 35 32 13 10 37 32 09 23 33 18 20 27Mozambique 110 112 26 43 26 36 199 151 39 56 76 55 35 85 65Namibia 71 50 67 56 53 34 67 61 43 48 55 55 51 48 55Niger 25 29 05 23 ndash09 10 02 02 27 ndash13 22 20 16 04 20Nigeria 129 108 122 85 80 90 157 165 121 113 117 110 114 117 117Rwanda 79 57 63 42 18 25 57 48 14 35 50 50 11 50 50Satildeo Tomeacute and Priacutencipe 162 143 106 81 70 52 54 57 79 88 89 30 90 78 100Senegal 21 34 14 07 ndash11 01 08 13 05 10 15 15 13 20 15Seychelles 76 26 71 43 14 40 ndash10 29 37 20 18 30 34 23 19Sierra Leone 83 68 66 55 46 67 109 182 169 157 130 83 175 140 120South Africa 59 50 56 58 61 46 63 53 46 44 52 53 49 47 53South Sudan 451 00 17 528 3798 1879 835 245 169 80 401 359 108Tanzania 66 127 160 79 61 56 52 53 35 36 42 50 33 41 43Togo 26 36 26 18 02 18 09 ndash02 09 14 20 20 20 17 22Uganda 64 150 127 49 31 54 55 56 26 32 38 50 22 35 39Zambia 154 87 66 70 78 101 179 66 70 99 100 80 79 120 80Zimbabwe8 ndash56 35 37 16 ndash02 ndash24 ndash16 09 106 1618 497 30 421 1829 941Movements in consumer prices are shown as annual averages2Monthly year-over-year changes and for several countries on a quarterly basis3Based on Eurostatrsquos harmonized index of consumer prices4See country-specific notes for Argentina Libya Ukraine and Venezuela in the ldquoCountry Notesrdquo section of the Statistical Appendix5Excludes Venezuela but includes Argentina from 2017 onward See country-specific notes for Venezuela and Argentina in the ldquoCountry Notesrdquo section of the Statistical Appendix6Data for 2011 exclude South Sudan after July 9 Data for 2012 and onward pertain to the current Sudan7Data for Syria are excluded for 2011 onward owing to the uncertain political situation8The Zimbabwe dollar ceased circulating in early 2009 Data are based on IMF staff estimates of price and exchange rate developments in US dollars IMF staff estimates of US dollar values may differ from authoritiesrsquo estimates
S TAT I S T I C A L A P P E N D I X
International Monetary Fund | October 2019 159
Table A8 Major Advanced Economies General Government Fiscal Balances and Debt1(Percent of GDP unless noted otherwise)
Average Projections2001ndash10 2013 2014 2015 2016 2017 2018 2019 2020 2024
Major Advanced EconomiesNet LendingBorrowing ndash46 ndash43 ndash36 ndash30 ndash32 ndash31 ndash36 ndash38 ndash36 ndash33Output Gap2 ndash04 ndash18 ndash12 ndash06 ndash05 02 08 08 09 08Structural Balance2 ndash43 ndash38 ndash32 ndash29 ndash32 ndash33 ndash38 ndash41 ndash40 ndash36
United StatesNet LendingBorrowing3 ndash52 ndash46 ndash40 ndash36 ndash43 ndash45 ndash57 ndash56 ndash55 ndash51Output Gap2 ndash04 ndash19 ndash11 00 00 06 15 18 20 15Structural Balance2 ndash47 ndash45 ndash38 ndash36 ndash44 ndash48 ndash60 ndash63 ndash63 ndash57Net Debt 478 808 804 803 816 816 800 809 839 944Gross Debt 683 1048 1044 1047 1068 1060 1043 1062 1080 1158Euro AreaNet LendingBorrowing ndash30 ndash31 ndash25 ndash20 ndash16 ndash10 ndash05 ndash09 ndash09 ndash08Output Gap2 04 ndash29 ndash25 ndash20 ndash13 ndash03 03 01 00 00Structural Balance2 ndash32 ndash12 ndash09 ndash08 ndash07 ndash07 ndash06 ndash07 ndash09 ndash08Net Debt 565 751 754 742 738 718 700 689 676 627Gross Debt 706 919 921 902 895 873 854 839 823 761
GermanyNet LendingBorrowing ndash26 00 06 09 12 12 19 11 10 10Output Gap2 ndash02 ndash08 ndash03 ndash03 01 09 11 04 01 00Structural Balance2 ndash22 06 12 12 13 11 14 09 10 10Net Debt 543 586 550 521 493 456 427 401 378 299Gross Debt 665 786 756 720 691 652 617 586 557 456FranceNet LendingBorrowing ndash38 ndash41 ndash39 ndash36 ndash35 ndash28 ndash25 ndash33 ndash24 ndash26Output Gap2 ndash01 ndash11 ndash10 ndash09 ndash10 ndash01 03 02 01 00Structural Balance2 ndash38 ndash34 ndash33 ndash30 ndash28 ndash26 ndash25 ndash24 ndash25 ndash26Net Debt 591 830 855 864 892 895 895 904 904 889Gross Debt 683 934 949 956 980 984 984 993 992 978ItalyNet LendingBorrowing ndash34 ndash29 ndash30 ndash26 ndash25 ndash24 ndash21 ndash20 ndash25 ndash26Output Gap2 00 ndash41 ndash41 ndash34 ndash27 ndash14 ndash09 ndash10 ndash08 ndash01Structural Balance2 ndash40 ndash06 ndash11 ndash07 ndash14 ndash17 ndash18 ndash15 ndash21 ndash26Net Debt 957 1165 1187 1194 1190 1192 1202 1213 1220 1232Gross Debt 1042 1290 1318 1316 1314 1314 1322 1332 1337 1340
JapanNet LendingBorrowing ndash64 ndash79 ndash56 ndash38 ndash37 ndash32 ndash32 ndash30 ndash22 ndash20Output Gap2 ndash16 ndash17 ndash20 ndash15 ndash17 ndash05 ndash05 ndash02 ndash02 01Structural Balance2 ndash60 ndash75 ndash55 ndash43 ndash41 ndash34 ndash31 ndash29 ndash21 ndash20Net Debt 999 1464 1485 1478 1526 1511 1532 1538 1537 1536Gross Debt4 1759 2325 2361 2316 2363 2350 2371 2377 2376 2376United KingdomNet LendingBorrowing ndash41 ndash53 ndash53 ndash42 ndash29 ndash18 ndash14 ndash14 ndash15 ndash10Output Gap2 06 ndash17 ndash05 00 01 03 01 ndash01 ndash01 00Structural Balance2 ndash45 ndash40 ndash47 ndash41 ndash29 ndash20 ndash15 ndash13 ndash14 ndash11Net Debt 404 768 788 793 788 775 775 761 754 739Gross Debt 454 852 870 879 879 871 868 856 848 833CanadaNet LendingBorrowing ndash02 ndash15 02 ndash01 ndash04 ndash03 ndash04 ndash07 ndash07 ndash04Output Gap2 ndash03 ndash08 ndash03 ndash17 ndash21 ndash06 ndash04 ndash06 01 01Structural Balance2 ndash01 ndash11 01 08 07 00 ndash02 ndash05 ndash08 ndash04Net Debt5 297 298 286 285 288 276 268 264 257 221Gross Debt 745 862 857 913 918 901 899 875 850 746
Note The methodology and specific assumptions for each country are discussed in Box A1 The country group composites for fiscal data are calculated as the sum of the US dollar values for the relevant individual countries1Debt data refer to the end of the year and are not always comparable across countries Gross and net debt levels reported by national statistical agencies for countries that have adopted the System of National Accounts 2008 (Australia Canada Hong Kong SAR United States) are adjusted to exclude unfunded pension liabilities of government employeesrsquo defined-benefit pension plans Fiscal data for the aggregated major advanced economies and the United States start in 2001 and the average for the aggregate and the United States is therefore for the period 2001ndash072Percent of potential GDP3Figures reported by the national statistical agency are adjusted to exclude items related to the accrual-basis accounting of government employeesrsquo defined-benefit pension plans4Nonconsolidated basis5Includes equity shares
W O R L D E C O N O M I C O U T L O O K G L O B A L M A N U F A C T U R I N G D O W N T U R N R I S I N G T R A D E B A R R I E R S
160 International Monetary Fund | October 2019
Table A9 Summary of World Trade Volumes and Prices(Annual percent change)
Averages Projections2001ndash10 2011ndash20 2011 2012 2013 2014 2015 2016 2017 2018 2019 2020
Trade in Goods and ServicesWorld Trade1
Volume 50 36 70 31 36 39 28 23 57 36 11 32Price Deflator
In US Dollars 39 ndash05 111 ndash18 ndash07 ndash18 ndash132 ndash41 42 55 ndash16 ndash03In SDRs 24 06 73 12 01 ndash17 ndash58 ndash34 44 33 08 01
Volume of TradeExports
Advanced Economies 39 33 62 29 32 40 38 18 47 31 09 25Emerging Market and Developing Economies 82 41 79 35 47 33 14 30 73 39 19 41
ImportsAdvanced Economies 35 33 54 17 26 39 48 26 47 30 12 27Emerging Market and Developing Economies 92 44 106 54 51 43 ndash09 18 75 51 07 43
Terms of TradeAdvanced Economies ndash01 01 ndash15 ndash07 10 03 18 12 ndash02 ndash07 00 ndash01Emerging Market and Developing Economies 10 ndash03 36 07 ndash06 ndash06 ndash42 ndash16 08 15 ndash13 ndash11
Trade in GoodsWorld Trade1
Volume 50 35 75 29 33 30 22 21 58 37 09 33Price Deflator
In US Dollars 39 ndash07 122 ndash19 ndash13 ndash24 ndash144 ndash48 48 59 ndash18 ndash07In SDRs 23 03 84 11 ndash05 ndash23 ndash71 ndash42 50 37 06 ndash03
World Trade Prices in US Dollars2
Manufactures 19 ndash02 43 23 ndash28 ndash04 ndash31 ndash51 ndash03 19 14 ndash02Oil 108 ndash31 317 09 ndash09 ndash75 ndash472 ndash157 233 294 ndash96 ndash62Nonfuel Primary Commodities 89 ndash10 200 ndash78 ndash54 ndash54 ndash171 ndash10 64 16 09 17
Food 56 ndash03 188 ndash38 07 ndash14 ndash168 00 39 ndash06 ndash34 28Beverages 84 ndash18 241 ndash181 ndash137 201 ndash72 ndash31 ndash47 ndash82 ndash51 62Agricultural Raw Materials 59 ndash26 243 ndash205 ndash44 ndash75 ndash115 00 52 19 ndash57 ndash19Metal 145 ndash37 127 ndash178 ndash39 ndash122 ndash273 ndash53 222 66 43 ndash62
World Trade Prices in SDRs2
Manufactures 04 08 08 54 ndash20 ndash04 52 ndash45 ndash01 ndash02 39 02Oil 92 ndash21 272 40 ndash01 ndash75 ndash427 ndash151 236 267 ndash74 ndash59Nonfuel Primary Commodities 74 00 159 ndash49 ndash47 ndash54 ndash100 ndash04 67 ndash05 33 21
Food 40 07 148 ndash08 15 ndash13 ndash97 07 42 ndash26 ndash11 32Beverages 68 ndash08 200 ndash156 ndash130 201 07 ndash25 ndash45 ndash101 ndash28 66Agricultural Raw Materials 43 ndash16 201 ndash181 ndash37 ndash75 ndash40 06 55 ndash02 ndash35 ndash16Metal 129 ndash27 89 ndash153 ndash31 ndash121 ndash211 ndash47 225 44 68 ndash59
World Trade Prices in Euros2
Manufactures ndash17 15 ndash06 108 ndash59 ndash05 161 ndash49 ndash23 ndash26 67 00Oil 69 ndash14 255 92 ndash41 ndash76 ndash368 ndash154 208 237 ndash49 ndash60Nonfuel Primary Commodities 51 07 144 ndash02 ndash85 ndash55 ndash07 ndash08 43 ndash28 61 20
Food 18 14 132 42 ndash26 ndash14 ndash04 03 18 ndash49 16 31Beverages 45 ndash01 184 ndash114 ndash164 200 111 ndash28 ndash66 ndash122 ndash01 65Agricultural Raw Materials 21 ndash10 185 ndash140 ndash75 ndash76 59 03 31 ndash26 ndash08 ndash17Metal 104 ndash21 74 ndash110 ndash70 ndash122 ndash129 ndash50 197 19 97 ndash60
S TAT I S T I C A L A P P E N D I X
International Monetary Fund | October 2019 161
Table A9 Summary of World Trade Volumes and Prices (continued)(Annual percent change)
Averages Projections2001ndash10 2011ndash20 2011 2012 2013 2014 2015 2016 2017 2018 2019 2020
Trade in GoodsVolume of TradeExports
Advanced Economies 38 31 64 27 26 32 32 15 47 31 06 26Emerging Market and Developing Economies 80 39 80 39 47 27 11 29 70 38 15 39
Fuel Exporters 48 17 59 27 21 ndash04 31 12 14 03 ndash26 30Nonfuel Exporters 93 46 88 44 58 39 04 33 84 47 27 42
ImportsAdvanced Economies 35 31 60 11 23 34 38 22 50 35 10 28Emerging Market and Developing Economies 93 43 114 52 47 27 ndash07 22 78 50 04 47
Fuel Exporters 110 17 119 85 36 10 ndash71 ndash55 50 ndash17 02 32Nonfuel Exporters 89 48 113 44 50 30 07 38 84 62 04 49
Price Deflators in SDRsExports
Advanced Economies 17 02 61 ndash05 04 ndash19 ndash65 ndash21 43 29 00 ndash03Emerging Market and Developing Economies 43 05 131 30 ndash13 ndash31 ndash89 ndash72 66 49 08 ndash10
Fuel Exporters 77 ndash10 254 43 ndash26 ndash69 ndash300 ndash127 170 157 ndash32 ndash51Nonfuel Exporters 30 09 82 25 ndash07 ndash15 ndash08 ndash57 40 21 19 00
ImportsAdvanced Economies 17 02 81 06 ndash06 ndash20 ndash80 ndash35 44 37 00 ndash01Emerging Market and Developing Economies 31 07 82 24 ndash08 ndash27 ndash47 ndash56 55 37 23 ndash01
Fuel Exporters 37 09 62 29 02 ndash24 ndash34 ndash33 36 15 31 05Nonfuel Exporters 30 07 86 23 ndash10 ndash27 ndash49 ndash61 59 41 21 ndash02
Terms of TradeAdvanced Economies ndash01 00 ndash18 ndash10 10 01 17 14 ndash01 ndash08 00 ndash02Emerging Market and Developing Economies 12 ndash02 45 06 ndash05 ndash04 ndash44 ndash17 10 12 ndash15 ndash09
Regional GroupsEmerging and Developing Asia ndash13 05 ndash27 15 11 24 85 00 ndash34 ndash22 01 03Emerging and Developing Europe 21 ndash06 113 15 ndash31 ndash06 ndash109 ndash60 29 45 ndash27 ndash10Middle East and Central Asia 23 ndash09 51 ndash18 ndash11 ndash25 ndash88 08 35 ndash05 ndash14 ndash13Latin America and the Caribbean 32 ndash16 128 02 ndash01 ndash44 ndash248 ndash55 104 105 ndash46 ndash46Sub-Saharan Africa 39 ndash07 128 ndash13 ndash24 ndash28 ndash146 ndash03 66 40 ndash43 ndash20Analytical Groups
By Source of Export EarningsFuel 39 ndash19 181 14 ndash27 ndash46 ndash275 ndash97 129 140 ndash61 ndash56Nonfuel 00 02 ndash04 02 03 13 43 04 ndash18 ndash19 ndash02 02
MemorandumWorld Exports in Billions of US DollarsGoods and Services 13477 23161 22315 22608 23319 23752 21096 20713 22801 24882 24739 25381Goods 10661 17992 17928 18129 18542 18632 16197 15737 17439 19106 18898 19312Average Oil Price3 108 ndash31 317 09 ndash09 ndash75 ndash472 ndash157 233 294 ndash96 ndash62
In US Dollars a Barrel 5425 7439 10405 10501 10407 9625 5079 4284 5281 6833 6178 5794Export Unit Value of Manufactures4 19 ndash02 43 23 ndash28 ndash04 ndash31 ndash51 ndash03 19 14 ndash021Average of annual percent change for world exports and imports2As represented respectively by the export unit value index for manufactures of the advanced economies and accounting for 83 percent of the advanced economiesrsquo trade (export of goods) weights the average of UK Brent Dubai Fateh and West Texas Intermediate crude oil prices and the average of world market prices for nonfuel primary commodities weighted by their 2014ndash16 shares in world commodity imports3Percent change of average of UK Brent Dubai Fateh and West Texas Intermediate crude oil prices4Percent change for manufactures exported by the advanced economies
W O R L D E C O N O M I C O U T L O O K G L O B A L M A N U F A C T U R I N G D O W N T U R N R I S I N G T R A D E B A R R I E R S
162 International Monetary Fund | October 2019
Table A10 Summary of Current Account Balances(Billions of US dollars)
Projections2011 2012 2013 2014 2015 2016 2017 2018 2019 2020 2024
Advanced Economies ndash387 253 2039 2254 2697 3377 4115 3623 3049 2522 2614United States ndash4457 ndash4268 ndash3488 ndash3652 ndash4078 ndash4283 ndash4396 ndash4910 ndash5395 ndash5691 ndash5865Euro Area ndash124 1735 3007 3404 3131 3703 4097 3966 3766 3689 3441
Germany 2329 2516 2447 2800 2884 2938 2958 2895 2691 2610 2703France ndash246 ndash259 ndash143 ndash273 ndash90 ndash115 ndash187 ndash162 ndash137 ndash137 ndash142Italy ndash683 ndash70 210 411 246 475 507 520 570 588 464Spain ndash474 ndash31 207 149 139 279 243 132 128 150 176
Japan 1298 597 459 368 1364 1979 2020 1753 1721 1805 2286United Kingdom ndash516 ndash1009 ndash1419 ndash1496 ndash1424 ndash1393 ndash881 ndash1091 ndash947 ndash996 ndash1154Canada ndash496 ndash657 ndash593 ndash432 ndash552 ndash489 ndash463 ndash452 ndash325 ndash302 ndash364Other Advanced Economies1 2646 2741 3421 3572 3598 3431 3285 3592 3496 3264 3392Emerging Market and Developing Economies 3766 3432 1701 1730 ndash603 ndash813 126 19 ndash144 ndash1348 ndash3832
Regional GroupsEmerging and Developing Asia 980 1206 988 2293 3094 2269 1752 ndash201 826 476 ndash702Emerging and Developing Europe ndash387 ndash277 ndash633 ndash127 309 ndash144 ndash237 637 604 232 ndash74Latin America and the Caribbean ndash1102 ndash1465 ndash1694 ndash1832 ndash1705 ndash977 ndash788 ndash992 ndash809 ndash819 ndash1226Middle East and Central Asia 4361 4233 3404 2025 ndash1373 ndash1399 ndash239 1014 ndash149 ndash547 ndash1078Sub-Saharan Africa ndash86 ndash266 ndash364 ndash629 ndash927 ndash563 ndash362 ndash438 ndash616 ndash690 ndash752Analytical Groups
By Source of Export EarningsFuel 6198 5962 4651 3112 ndash763 ndash737 849 2979 1455 687 165Nonfuel ndash2431 ndash2530 ndash2950 ndash1382 160 ndash76 ndash723 ndash2960 ndash1599 ndash2035 ndash3997
Of Which Primary Products ndash281 ndash613 ndash832 ndash538 ndash661 ndash414 ndash574 ndash727 ndash514 ndash499 ndash652By External Financing SourceNet Debtor Economies ndash3278 ndash4073 ndash3819 ndash3499 ndash3187 ndash2261 ndash2419 ndash2918 ndash2924 ndash3322 ndash4631Net Debtor Economies by
Debt-Servicing ExperienceEconomies with Arrears andor
Rescheduling during 2014ndash18 ndash183 ndash347 ndash394 ndash334 ndash522 ndash494 ndash354 ndash241 ndash339 ndash403 ndash419MemorandumWorld 3380 3685 3740 3984 2094 2563 4241 3642 2905 1174 ndash1219European Union 752 2063 2772 2887 2828 3232 4126 3839 3726 3584 3192Low-Income Developing Countries ndash218 ndash311 ndash371 ndash415 ndash746 ndash374 ndash332 ndash529 ndash666 ndash749 ndash811Middle East and North Africa 4052 4130 3335 1937 ndash1203 ndash1169 ndash44 1183 28 ndash412 ndash886
S TAT I S T I C A L A P P E N D I X
International Monetary Fund | October 2019 163
Projections2011 2012 2013 2014 2015 2016 2017 2018 2019 2020 2024
Advanced Economies ndash01 01 04 05 06 07 09 07 06 05 04United States ndash29 ndash26 ndash21 ndash21 ndash22 ndash23 ndash23 ndash24 ndash25 ndash25 ndash23Euro Area ndash01 14 23 25 27 31 32 29 28 27 22
Germany 62 71 66 72 86 85 81 73 70 66 58France ndash09 ndash10 ndash05 ndash10 ndash04 ndash05 ndash07 ndash06 ndash05 ndash05 ndash04Italy ndash30 ndash03 10 19 13 25 26 25 29 29 21Spain ndash32 ndash02 15 11 12 23 18 09 09 10 10
Japan 21 10 09 08 31 40 42 35 33 33 37United Kingdom ndash20 ndash38 ndash51 ndash49 ndash49 ndash52 ndash33 ndash39 ndash35 ndash37 ndash37Canada ndash28 ndash36 ndash32 ndash24 ndash35 ndash32 ndash28 ndash26 ndash19 ndash17 ndash16Other Advanced Economies1 40 41 50 51 56 52 47 49 48 44 38Emerging Market and Developing Economies 14 12 06 06 ndash02 ndash03 00 00 00 ndash04 ndash08
Regional GroupsEmerging and Developing Asia 08 09 07 15 20 14 10 ndash01 04 02 ndash02Emerging and Developing Europe ndash09 ndash06 ndash14 ndash03 09 ndash04 ndash06 17 16 06 ndash01Latin America and the Caribbean ndash19 ndash25 ndash28 ndash31 ndash32 ndash19 ndash14 ndash19 ndash16 ndash15 ndash19Middle East and Central Asia 121 114 88 52 ndash39 ndash41 ndash07 27 ndash04 ndash14 ndash22Sub-Saharan Africa ndash06 ndash17 ndash22 ndash36 ndash60 ndash39 ndash23 ndash27 ndash36 ndash38 ndash31Analytical Groups
By Source of Export EarningsFuel 105 97 74 51 ndash15 ndash16 17 56 28 13 03Nonfuel ndash12 ndash11 ndash12 ndash06 01 00 ndash03 ndash10 ndash05 ndash06 ndash09
Of Which Primary Products ndash16 ndash33 ndash43 ndash28 ndash35 ndash23 ndash29 ndash38 ndash28 ndash26 ndash27By External Financing SourceNet Debtor Economies ndash25 ndash30 ndash27 ndash24 ndash24 ndash17 ndash17 ndash20 ndash19 ndash20 ndash21Net Debtor Economies by
Debt-Servicing ExperienceEconomies with Arrears andor
Rescheduling during 2014ndash18 ndash22 ndash39 ndash42 ndash35 ndash59 ndash57 ndash44 ndash29 ndash39 ndash43 ndash35MemorandumWorld 05 05 05 05 03 03 05 04 03 01 ndash01European Union 04 12 15 15 17 20 24 20 20 19 14Low-Income Developing Countries ndash15 ndash19 ndash21 ndash21 ndash40 ndash21 ndash18 ndash26 ndash31 ndash32 ndash25Middle East and North Africa 135 135 106 60 ndash43 ndash42 ndash02 38 01 ndash13 ndash23
Table A10 Summary of Current Account Balances (continued)(Percent of GDP)
W O R L D E C O N O M I C O U T L O O K G L O B A L M A N U F A C T U R I N G D O W N T U R N R I S I N G T R A D E B A R R I E R S
164 International Monetary Fund | October 2019
Projections2011 2012 2013 2014 2015 2016 2017 2018 2019 2020 2024
Advanced Economies ndash03 02 14 15 20 25 28 23 20 16 14United States ndash210 ndash192 ndash152 ndash154 ndash180 ndash193 ndash187 ndash196 ndash215 ndash220 ndash191Euro Area ndash04 54 88 95 96 114 116 103
Germany 138 154 144 158 183 184 170 155 147 139 119France ndash30 ndash32 ndash17 ndash31 ndash12 ndash15 ndash23 ndash18 ndash15 ndash14 ndash12Italy ndash111 ndash12 34 65 45 86 83 79 89 88 58Spain ndash110 ndash08 47 33 35 68 54 27 27 30 29
Japan 139 65 55 43 174 244 231 189 190 198 220United Kingdom ndash64 ndash126 ndash173 ndash175 ndash179 ndash185 ndash111 ndash129 ndash116 ndash126 ndash131Canada ndash91 ndash119 ndash107 ndash76 ndash112 ndash103 ndash91 ndash83 ndash59 ndash53 ndash55Other Advanced Economies1 68 68 82 86 97 94 83 84 84 77 67Emerging Market and Developing Economies 45 37 19 22 ndash07 ndash10 01 00 ndash02 ndash14 ndash32
Regional GroupsEmerging and Developing Asia 28 33 26 57 82 62 43 ndash05 18 10 ndash12Emerging and Developing Europe ndash28 ndash19 ndash43 ndash09 26 ndash13 ndash18 42 39 15 ndash04Latin America and the Caribbean ndash89 ndash115 ndash134 ndash147 ndash158 ndash93 ndash67 ndash78 ndash64 ndash63 ndash77Middle East and Central Asia 256 225 192 129 ndash102 ndash115 ndash20 66 ndash10 ndash35 ndash65Sub-Saharan Africa ndash18 ndash56 ndash76 ndash138 ndash269 ndash178 ndash99 ndash104 ndash151 ndash164 ndash142Analytical Groups
By Source of Export EarningsFuel 254 226 185 138 ndash41 ndash47 48 146 77 39 10Nonfuel ndash42 ndash42 ndash46 ndash21 03 ndash01 ndash11 ndash41 ndash22 ndash27 ndash41
Of Which Primary Products ndash57 ndash125 ndash172 ndash114 ndash164 ndash104 ndash129 ndash152 ndash108 ndash101 ndash107By External Financing SourceNet Debtor Economies ndash83 ndash101 ndash92 ndash84 ndash87 ndash62 ndash58 ndash64 ndash62 ndash68 ndash72Net Debtor Economies by
Debt-Servicing ExperienceEconomies with Arrears andor
Rescheduling during 2014ndash18 ndash59 ndash112 ndash128 ndash118 ndash240 ndash255 ndash158 ndash93 ndash127 ndash143 ndash117MemorandumWorld 15 15 16 18 10 13 18 15 12 05 ndash04European Union 10 28 36 36 39 44 52 44 43 40 30Low-Income Developing Countries ndash46 ndash65 ndash72 ndash78 ndash155 ndash78 ndash59 ndash82 ndash99 ndash102 ndash75Middle East and North Africa 271 249 213 141 ndash99 ndash107 ndash06 86 02 ndash29 ndash601Excludes the Group of Seven (Canada France Germany Italy Japan United Kingdom United States) and euro area countries
Table A10 Summary of Current Account Balances (continued)(Percent of exports of goods and services)
S TAT I S T I C A L A P P E N D I X
International Monetary Fund | October 2019 165
Table A11 Advanced Economies Balance on Current Account(Percent of GDP)
Projections2011 2012 2013 2014 2015 2016 2017 2018 2019 2020 2024
Advanced Economies ndash01 01 04 05 06 07 09 07 06 05 04United States ndash29 ndash26 ndash21 ndash21 ndash22 ndash23 ndash23 ndash24 ndash25 ndash25 ndash23Euro Area1 ndash01 14 23 25 27 31 32 29 28 27 22
Germany 62 71 66 72 86 85 81 73 70 66 58France ndash09 ndash10 ndash05 ndash10 ndash04 ndash05 ndash07 ndash06 ndash05 ndash05 ndash04Italy ndash30 ndash03 10 19 13 25 26 25 29 29 21Spain ndash32 ndash02 15 11 12 23 18 09 09 10 10Netherlands 85 102 98 82 63 81 108 109 98 95 85Belgium ndash11 ndash01 ndash03 ndash09 ndash10 ndash06 07 ndash13 ndash11 ndash08 ndash13Austria 16 15 19 25 17 25 20 23 16 18 19Ireland ndash16 ndash34 16 11 44 ndash42 05 106 108 96 57Portugal ndash60 ndash18 16 01 01 06 04 ndash06 ndash06 ndash07 ndash15Greece ndash100 ndash24 ndash26 ndash23 ndash15 ndash23 ndash24 ndash35 ndash30 ndash33 ndash45Finland ndash17 ndash23 ndash19 ndash15 ndash07 ndash07 ndash07 ndash16 ndash07 ndash05 04Slovak Republic ndash50 09 19 11 ndash17 ndash22 ndash20 ndash25 ndash25 ndash17 01Lithuania ndash46 ndash14 08 32 ndash28 ndash08 09 16 11 11 ndash08Slovenia ndash08 13 33 51 38 48 61 57 42 41 14Luxembourg 60 56 54 52 51 51 50 47 45 45 44Latvia ndash32 ndash36 ndash27 ndash17 ndash05 16 07 ndash10 ndash18 ndash21 ndash34Estonia 13 ndash19 05 08 18 20 32 17 07 03 ndash08Cyprus ndash41 ndash60 ndash49 ndash43 ndash15 ndash51 ndash84 ndash70 ndash78 ndash75 ndash50Malta ndash02 17 27 87 28 38 105 98 76 62 61
Japan 21 10 09 08 31 40 42 35 33 33 37United Kingdom ndash20 ndash38 ndash51 ndash49 ndash49 ndash52 ndash33 ndash39 ndash35 ndash37 ndash37Korea 13 38 56 56 72 65 46 44 32 29 29Canada ndash28 ndash36 ndash32 ndash24 ndash35 ndash32 ndash28 ndash26 ndash19 ndash17 ndash16Australia ndash31 ndash43 ndash34 ndash31 ndash46 ndash33 ndash26 ndash21 ndash03 ndash17 ndash19Taiwan Province of China 78 87 97 114 139 135 145 122 114 108 80Singapore 222 176 157 180 172 175 164 179 165 166 150Switzerland 78 107 116 85 112 94 67 102 96 98 98Sweden 55 55 52 45 41 38 28 17 29 27 24Hong Kong SAR 56 16 15 14 33 40 46 43 55 51 40Czech Republic ndash21 ndash16 ndash05 02 02 16 17 03 ndash01 ndash02 ndash07Norway 124 125 103 105 79 40 57 81 69 72 59Israel 21 05 29 44 50 36 27 27 24 25 25Denmark 66 63 78 89 82 79 80 57 55 52 46New Zealand ndash28 ndash39 ndash32 ndash31 ndash30 ndash22 ndash29 ndash38 ndash41 ndash43 ndash43Puerto Rico Macao SAR 409 393 402 342 253 272 331 352 357 353 298Iceland ndash51 ndash38 58 39 51 76 38 28 31 16 03San Marino ndash05 04 04 02 02Memorandum Major Advanced Economies ndash08 ndash09 ndash07 ndash06 ndash05 ndash02 ndash01 ndash04 ndash05 ndash05 ndash04Euro Area2 08 23 28 29 32 35 36 35 34 32 271Data corrected for reporting discrepancies in intra-area transactions2Data calculated as the sum of the balances of individual euro area countries
W O R L D E C O N O M I C O U T L O O K G L O B A L M A N U F A C T U R I N G D O W N T U R N R I S I N G T R A D E B A R R I E R S
166 International Monetary Fund | October 2019
Table A12 Emerging Market and Developing Economies Balance on Current Account(Percent of GDP)
Projections2011 2012 2013 2014 2015 2016 2017 2018 2019 2020 2024
Emerging and Developing Asia 08 09 07 15 20 14 10 ndash01 04 02 ndash02Bangladesh ndash10 07 12 13 19 06 ndash21 ndash27 ndash20 ndash21 ndash20Bhutan ndash298 ndash214 ndash254 ndash268 ndash272 ndash308 ndash230 ndash184 ndash125 ndash96 64Brunei Darussalam 347 298 209 319 167 129 164 79 85 120 198Cambodia ndash79 ndash85 ndash84 ndash85 ndash87 ndash84 ndash79 ndash113 ndash125 ndash123 ndash88China 18 25 15 22 27 18 16 04 10 09 04Fiji ndash47 ndash13 ndash89 ndash61 ndash38 ndash39 ndash70 ndash89 ndash73 ndash62 ndash52India ndash43 ndash48 ndash17 ndash13 ndash10 ndash06 ndash18 ndash21 ndash20 ndash23 ndash25Indonesia 02 ndash27 ndash32 ndash31 ndash20 ndash18 ndash16 ndash30 ndash29 ndash27 ndash25Kiribati ndash95 19 ndash55 311 328 108 380 362 132 24 ndash42Lao PDR ndash153 ndash213 ndash265 ndash233 ndash224 ndash110 ndash106 ndash120 ndash121 ndash120 ndash109Malaysia 107 51 34 43 30 24 28 21 31 19 09Maldives ndash148 ndash66 ndash43 ndash37 ndash75 ndash232 ndash219 ndash253 ndash204 ndash157 ndash87Marshall Islands ndash22 ndash63 ndash107 ndash17 144 97 48 51 41 32 ndash02Micronesia ndash200 ndash146 ndash116 ndash09 16 39 75 245 157 26 ndash42Mongolia ndash265 ndash274 ndash254 ndash113 ndash40 ndash63 ndash101 ndash170 ndash144 ndash124 ndash88Myanmar ndash17 ndash17 ndash06 ndash42 ndash31 ndash40 ndash65 ndash42 ndash48 ndash49 ndash46Nauru 287 357 495 252 ndash213 20 127 19 36 ndash43 ndash36Nepal ndash10 48 33 45 50 63 ndash04 ndash81 ndash83 ndash100 ndash50Palau ndash127 ndash153 ndash142 ndash179 ndash87 ndash136 ndash191 ndash166 ndash254 ndash248 ndash199Papua New Guinea ndash240 ndash361 ndash308 123 175 346 287 274 230 248 222Philippines 25 28 42 38 25 ndash04 ndash07 ndash26 ndash20 ndash23 ndash19Samoa ndash69 ndash90 ndash17 ndash81 ndash31 ndash47 ndash18 23 ndash06 ndash03 ndash12Solomon Islands ndash82 15 ndash34 ndash43 ndash30 ndash40 ndash48 ndash52 ndash71 ndash82 ndash68Sri Lanka ndash71 ndash58 ndash34 ndash25 ndash23 ndash21 ndash26 ndash32 ndash26 ndash28 ndash21Thailand 25 ndash12 ndash21 29 69 105 97 64 60 54 37Timor-Leste 391 397 424 271 66 ndash217 ndash114 ndash70 11 ndash29 ndash91Tonga ndash169 ndash123 ndash80 ndash100 ndash107 ndash66 ndash62 ndash77 ndash110 ndash132 ndash122Tuvalu ndash371 182 ndash66 29 ndash528 232 309 71 299 ndash75 11Vanuatu ndash78 ndash65 ndash33 62 ndash16 08 ndash64 34 61 ndash56 ndash37Vietnam 02 60 45 49 ndash01 29 21 24 22 19 10Emerging and Developing Europe ndash09 ndash06 ndash14 ndash03 09 ndash04 ndash06 17 16 06 ndash01Albania ndash132 ndash101 ndash93 ndash108 ndash86 ndash76 ndash75 ndash68 ndash66 ndash64 ndash62Belarus ndash82 ndash28 ndash100 ndash66 ndash33 ndash34 ndash17 ndash04 ndash09 ndash34 ndash28Bosnia and Herzegovina ndash95 ndash87 ndash53 ndash74 ndash53 ndash47 ndash47 ndash41 ndash48 ndash49 ndash48Bulgaria 03 ndash09 13 12 00 26 31 46 32 25 03Croatia ndash07 ndash01 09 20 46 25 35 25 17 10 00Hungary 04 15 36 13 24 46 23 ndash05 ndash09 ndash06 00Kosovo ndash127 ndash58 ndash34 ndash69 ndash86 ndash79 ndash64 ndash80 ndash65 ndash66 ndash72Moldova ndash101 ndash74 ndash52 ndash60 ndash60 ndash35 ndash58 ndash105 ndash91 ndash89 ndash68Montenegro ndash148 ndash153 ndash114 ndash124 ndash110 ndash162 ndash161 ndash172 ndash171 ndash149 ndash95North Macedonia ndash25 ndash32 ndash16 ndash05 ndash21 ndash31 ndash13 ndash03 ndash07 ndash12 ndash20Poland ndash52 ndash37 ndash13 ndash21 ndash06 ndash05 01 ndash06 ndash09 ndash11 ndash21Romania ndash50 ndash48 ndash11 ndash07 ndash12 ndash21 ndash32 ndash45 ndash55 ndash52 ndash44Russia 48 33 15 28 50 19 21 68 57 39 32Serbia ndash81 ndash108 ndash57 ndash56 ndash35 ndash29 ndash52 ndash52 ndash58 ndash51 ndash41Turkey ndash89 ndash55 ndash67 ndash47 ndash37 ndash38 ndash56 ndash35 ndash06 ndash09 ndash19Ukraine1 ndash63 ndash81 ndash92 ndash39 17 ndash15 ndash22 ndash34 ndash28 ndash35 ndash33Latin America and the Caribbean ndash19 ndash25 ndash28 ndash31 ndash32 ndash19 ndash14 ndash19 ndash16 ndash15 ndash19Antigua and Barbuda 03 22 ndash24 ndash88 ndash70 ndash61 ndash55 ndash47Argentina ndash10 ndash04 ndash21 ndash16 ndash27 ndash27 ndash49 ndash53 ndash12 03 ndash16Aruba ndash105 35 ndash129 ndash51 42 50 10 02 ndash18 ndash11 07The Bahamas ndash118 ndash140 ndash141 ndash174 ndash120 ndash60 ndash124 ndash121 ndash74 ndash128 ndash55Barbados ndash118 ndash85 ndash84 ndash92 ndash61 ndash43 ndash38 ndash37 ndash39 ndash35 ndash25Belize ndash11 ndash12 ndash45 ndash79 ndash98 ndash90 ndash70 ndash81 ndash70 ndash64 ndash47Bolivia 22 72 34 17 ndash58 ndash56 ndash50 ndash49 ndash50 ndash41 ndash30Brazil ndash29 ndash34 ndash32 ndash41 ndash30 ndash13 ndash04 ndash08 ndash12 ndash10 ndash16Chile ndash17 ndash39 ndash41 ndash17 ndash23 ndash16 ndash21 ndash31 ndash35 ndash29 ndash17Colombia ndash29 ndash31 ndash33 ndash52 ndash63 ndash43 ndash33 ndash40 ndash42 ndash40 ndash37
S TAT I S T I C A L A P P E N D I X
International Monetary Fund | October 2019 167
Projections2011 2012 2013 2014 2015 2016 2017 2018 2019 2020 2024
Latin America and the Caribbean (continued) ndash19 ndash25 ndash28 ndash31 ndash32 ndash19 ndash14 ndash19 ndash16 ndash15 ndash19
Costa Rica ndash53 ndash51 ndash48 ndash48 ndash35 ndash22 ndash29 ndash31 ndash24 ndash25 ndash33Dominica ndash69 ndash76 ndash89 ndash127 ndash434 ndash336 ndash258 ndash95Dominican Republic ndash75 ndash65 ndash41 ndash32 ndash18 ndash11 ndash02 ndash14 ndash13 ndash11 ndash25Ecuador ndash05 ndash02 ndash10 ndash07 ndash22 13 ndash05 ndash14 01 07 17El Salvador ndash55 ndash58 ndash69 ndash54 ndash32 ndash23 ndash19 ndash48 ndash49 ndash50 ndash53Grenada ndash116 ndash122 ndash110 ndash120 ndash112 ndash113 ndash99 ndash89Guatemala ndash34 ndash26 ndash25 ndash21 ndash02 15 16 08 06 03 ndash10Guyana ndash122 ndash113 ndash133 ndash95 ndash51 04 ndash68 ndash175 ndash227 ndash184 17Haiti ndash43 ndash57 ndash66 ndash85 ndash30 ndash09 ndash10 ndash37 ndash33 ndash32 ndash26Honduras ndash80 ndash85 ndash95 ndash69 ndash47 ndash26 ndash18 ndash42 ndash42 ndash43 ndash39Jamaica ndash122 ndash111 ndash92 ndash75 ndash31 ndash14 ndash26 ndash24 ndash25 ndash22 ndash31Mexico ndash10 ndash15 ndash25 ndash19 ndash26 ndash22 ndash17 ndash18 ndash12 ndash16 ndash20Nicaragua ndash119 ndash107 ndash109 ndash71 ndash90 ndash66 ndash49 06 23 18 ndash10Panama ndash130 ndash92 ndash90 ndash134 ndash90 ndash80 ndash79 ndash78 ndash61 ndash53 ndash55Paraguay 06 ndash09 16 ndash01 ndash04 35 31 05 ndash01 13 18Peru ndash20 ndash32 ndash51 ndash45 ndash50 ndash26 ndash12 ndash16 ndash19 ndash20 ndash18St Kitts and Nevis 01 ndash94 ndash138 ndash117 ndash74 ndash63 ndash158 ndash131St Lucia ndash03 23 ndash46 15 30 25 17 08St Vincent and the Grenadines ndash263 ndash153 ndash130 ndash120 ndash122 ndash116 ndash107 ndash90Suriname 98 33 ndash38 ndash79 ndash164 ndash54 ndash01 ndash55 ndash57 ndash58 ndash26Trinidad and Tobago 169 129 200 146 74 ndash40 50 71 24 17 24Uruguay ndash40 ndash36 ndash32 ndash09 06 08 ndash06 ndash17 ndash30 ndash18Venezuela 49 08 20 23 ndash50 ndash14 61 64 70 15 Middle East and Central Asia 121 114 88 52 ndash39 ndash41 ndash07 27 ndash04 ndash14 ndash22Afghanistan 266 109 03 58 29 84 47 91 20 02 ndash16Algeria 99 59 04 ndash44 ndash164 ndash165 ndash132 ndash96 ndash126 ndash119 ndash69Armenia ndash104 ndash100 ndash73 ndash76 ndash26 ndash23 ndash24 ndash94 ndash74 ndash74 ndash59Azerbaijan 260 214 166 139 ndash04 ndash36 41 129 97 100 76Bahrain 88 84 74 46 ndash24 ndash46 ndash45 ndash59 ndash43 ndash44 ndash41Djibouti ndash18 ndash234 ndash297 231 277 ndash10 ndash36 151 ndash03 06 26Egypt ndash25 ndash36 ndash22 ndash09 ndash37 ndash60 ndash61 ndash24 ndash31 ndash28 ndash25Georgia ndash128 ndash119 ndash59 ndash108 ndash126 ndash131 ndash88 ndash77 ndash59 ndash58 ndash53Iran 104 60 67 32 03 40 38 41 ndash27 ndash34 ndash36Iraq 109 51 11 26 ndash65 ndash83 18 69 ndash35 ndash37 ndash73Jordan ndash102 ndash150 ndash103 ndash72 ndash90 ndash94 ndash106 ndash70 ndash70 ndash62 ndash60Kazakhstan 53 11 08 28 ndash33 ndash59 ndash31 00 ndash12 ndash15 ndash09Kuwait 429 455 403 334 35 ndash46 80 144 82 68 32Kyrgyz Republic ndash77 ndash155 ndash139 ndash170 ndash159 ndash116 ndash62 ndash87 ndash100 ndash83 ndash94Lebanon ndash157 ndash252 ndash274 ndash282 ndash193 ndash231 ndash259 ndash256 ndash264 ndash263 ndash231Libya1 99 299 00 ndash784 ndash544 ndash247 79 22 ndash03 ndash116 ndash76Mauritania ndash50 ndash242 ndash220 ndash273 ndash198 ndash151 ndash144 ndash184 ndash137 ndash201 ndash71Morocco ndash76 ndash93 ndash76 ndash59 ndash21 ndash40 ndash34 ndash54 ndash45 ndash38 ndash28Oman 130 102 66 52 ndash159 ndash191 ndash156 ndash55 ndash72 ndash80 ndash91Pakistan 01 ndash21 ndash11 ndash13 ndash10 ndash17 ndash41 ndash63 ndash46 ndash26 ndash18Qatar 311 332 304 240 85 ndash55 38 87 60 41 33Saudi Arabia 236 224 181 98 ndash87 ndash37 15 92 44 15 ndash18Somalia ndash29 ndash70 ndash60 ndash94 ndash90 ndash83 ndash80 ndash77 ndash97Sudan2 ndash40 ndash128 ndash110 ndash58 ndash84 ndash76 ndash100 ndash136 ndash74 ndash125 ndash109Syria3 Tajikistan ndash63 ndash90 ndash104 ndash34 ndash61 ndash42 22 ndash50 ndash58 ndash58 ndash55Tunisia ndash84 ndash91 ndash97 ndash98 ndash97 ndash93 ndash102 ndash111 ndash104 ndash94 ndash57Turkmenistan ndash08 ndash09 ndash73 ndash61 ndash156 ndash202 ndash103 57 ndash06 ndash30 ndash74United Arab Emirates 126 197 190 135 49 37 73 91 90 71 52Uzbekistan 48 10 24 14 06 04 25 ndash71 ndash65 ndash56 ndash42Yemen ndash30 ndash17 ndash31 ndash07 ndash71 ndash32 ndash02 ndash18 ndash40 13 ndash08
Table A12 Emerging Market and Developing Economies Balance on Current Account (continued)(Percent of GDP)
W O R L D E C O N O M I C O U T L O O K G L O B A L M A N U F A C T U R I N G D O W N T U R N R I S I N G T R A D E B A R R I E R S
168 International Monetary Fund | October 2019
Projections2011 2012 2013 2014 2015 2016 2017 2018 2019 2020 2024
Sub-Saharan Africa ndash06 ndash17 ndash22 ndash36 ndash60 ndash39 ndash23 ndash27 ndash36 ndash38 ndash31Angola 117 108 61 ndash26 ndash88 ndash48 ndash05 61 09 ndash07 ndash09Benin ndash53 ndash54 ndash61 ndash72 ndash73 ndash68 ndash73 ndash60 ndash61 ndash58 ndash50Botswana 31 03 89 154 78 78 53 19 ndash30 ndash10 30Burkina Faso ndash15 ndash15 ndash113 ndash81 ndash86 ndash72 ndash73 ndash58 ndash57 ndash40 ndash37Burundi ndash144 ndash186 ndash193 ndash185 ndash177 ndash131 ndash123 ndash134 ndash126 ndash119 ndash88Cabo Verde ndash163 ndash126 ndash49 ndash91 ndash32 ndash39 ndash66 ndash45 ndash44 ndash42 ndash36Cameroon ndash25 ndash33 ndash35 ndash40 ndash38 ndash32 ndash27 ndash37 ndash37 ndash35 ndash32Central African Republic ndash68 ndash56 ndash29 ndash133 ndash91 ndash53 ndash78 ndash80 ndash41 ndash49 ndash50Chad ndash58 ndash78 ndash91 ndash89 ndash136 ndash102 ndash66 ndash34 ndash64 ndash61 ndash59Comoros ndash36 ndash32 ndash41 ndash38 ndash03 ndash43 ndash22 ndash38 ndash80 ndash74 ndash44Democratic Republic of the Congo ndash50 ndash43 ndash50 ndash47 ndash38 ndash41 ndash32 ndash46 ndash34 ndash42 ndash45Republic of Congo 139 177 138 13 ndash542 ndash635 ndash59 67 68 53 ndash21Cocircte drsquoIvoire 104 ndash12 ndash14 14 ndash06 ndash12 ndash27 ndash47 ndash38 ndash38 ndash31Equatorial Guinea ndash57 ndash11 ndash24 ndash43 ndash164 ndash130 ndash58 ndash54 ndash59 ndash62 ndash56Eritrea 134 129 23 173 208 153 238 166 113 132 29Eswatini ndash58 50 108 116 129 78 70 20 25 50 42Ethiopia ndash25 ndash71 ndash61 ndash66 ndash117 ndash94 ndash86 ndash65 ndash60 ndash53 ndash39Gabon 240 179 73 76 ndash56 ndash99 ndash44 ndash24 01 09 40The Gambia ndash74 ndash45 ndash67 ndash73 ndash99 ndash92 ndash74 ndash97 ndash94 ndash131 ndash114Ghana ndash66 ndash87 ndash90 ndash70 ndash58 ndash52 ndash34 ndash31 ndash36 ndash38 ndash20Guinea ndash184 ndash199 ndash125 ndash129 ndash129 ndash319 ndash71 ndash184 ndash207 ndash177 ndash103Guinea-Bissau ndash13 ndash84 ndash46 05 19 13 03 ndash45 ndash42 ndash37 ndash22Kenya ndash92 ndash84 ndash88 ndash104 ndash67 ndash49 ndash62 ndash50 ndash47 ndash46 ndash47Lesotho ndash134 ndash84 ndash51 ndash49 ndash40 ndash84 ndash47 ndash86 ndash146 ndash49 ndash56Liberia ndash176 ndash173 ndash217 ndash264 ndash267 ndash186 ndash234 ndash234 ndash212 ndash210 ndash147Madagascar ndash77 ndash89 ndash63 ndash03 ndash19 06 ndash05 08 ndash16 ndash27 ndash41Malawi ndash86 ndash92 ndash84 ndash82 ndash172 ndash185 ndash256 ndash153 ndash143 ndash142 ndash102Mali ndash51 ndash22 ndash29 ndash47 ndash53 ndash72 ndash73 ndash38 ndash55 ndash55 ndash66Mauritius ndash135 ndash71 ndash62 ndash54 ndash36 ndash40 ndash46 ndash58 ndash72 ndash65 ndash50Mozambique ndash253 ndash447 ndash429 ndash382 ndash403 ndash390 ndash200 ndash304 ndash580 ndash667 ndash393Namibia ndash30 ndash57 ndash40 ndash108 ndash124 ndash154 ndash50 ndash21 ndash41 ndash23 ndash45Niger ndash223 ndash147 ndash150 ndash158 ndash205 ndash155 ndash157 ndash181 ndash200 ndash227 ndash121Nigeria 26 38 37 02 ndash32 07 28 13 ndash02 ndash01 ndash02Rwanda ndash73 ndash99 ndash87 ndash118 ndash133 ndash143 ndash68 ndash78 ndash92 ndash87 ndash80Satildeo Tomeacute and Priacutencipe ndash279 ndash218 ndash145 ndash217 ndash122 ndash66 ndash132 ndash109 ndash115 ndash90 ndash65Senegal ndash65 ndash87 ndash82 ndash70 ndash56 ndash40 ndash73 ndash88 ndash85 ndash111 ndash33Seychelles ndash230 ndash211 ndash119 ndash231 ndash186 ndash206 ndash204 ndash170 ndash167 ndash170 ndash168Sierra Leone ndash650 ndash318 ndash175 ndash93 ndash155 ndash44 ndash144 ndash138 ndash123 ndash105 ndash80South Africa ndash22 ndash51 ndash58 ndash51 ndash46 ndash29 ndash25 ndash35 ndash31 ndash36 ndash47South Sudan 182 ndash159 ndash39 ndash15 ndash25 49 ndash34 ndash65 23 ndash42 ndash100Tanzania ndash110 ndash120 ndash107 ndash100 ndash79 ndash43 ndash30 ndash37 ndash41 ndash36 ndash26Togo ndash78 ndash76 ndash132 ndash100 ndash110 ndash98 ndash20 ndash49 ndash63 ndash55 ndash44Uganda ndash99 ndash67 ndash72 ndash81 ndash73 ndash34 ndash50 ndash89 ndash115 ndash105 ndash16Zambia 47 54 ndash06 21 ndash39 ndash45 ndash39 ndash26 ndash36 ndash34 ndash20Zimbabwe4 ndash172 ndash107 ndash132 ndash116 ndash76 ndash36 ndash13 ndash49 ndash05 ndash25 ndash281See country-specific notes for Libya and Ukraine in the ldquoCountry Notesrdquo section of the Statistical Appendix2Data for 2011 exclude South Sudan after July 9 Data for 2012 and onward pertain to the current Sudan3Data for Syria are excluded for 2011 onward owing to the uncertain political situation4The Zimbabwe dollar ceased circulating in early 2009 Data are based on IMF staff estimates of price and exchange rate developments in US dollars IMF staff estimates of US dollar values may differ from authoritiesrsquo estimates
Table A12 Emerging Market and Developing Economies Balance on Current Account (continued)(Percent of GDP)
S TAT I S T I C A L A P P E N D I X
International Monetary Fund | October 2019 169
Table A13 Summary of Financial Account Balances(Billions of US dollars)
Projections2011 2012 2013 2014 2015 2016 2017 2018 2019 2020
Advanced EconomiesFinancial Account Balance ndash2376 ndash1535 2300 3146 3248 4364 3947 3230 3860 2557
Direct Investment Net 3583 1168 1550 2104 ndash391 ndash2600 3221 ndash1482 149 422Portfolio Investment Net ndash11104 ndash2488 ndash5530 741 2523 5582 57 3535 4171 4719Financial Derivatives Net ndash48 ndash977 747 ndash27 ndash887 203 136 579 ndash154 ndash187Other Investment Net 1696 ndash1982 3990 ndash1025 ndash254 ndash608 ndash1911 ndash696 ndash925 ndash2965Change in Reserves 3499 2732 1531 1349 2268 1786 2443 1293 609 567United StatesFinancial Account Balance ndash5260 ndash4482 ndash4003 ndash2973 ndash3259 ndash3820 ndash3576 ndash4455 ndash4420 ndash5609
Direct Investment Net 1731 1269 1047 1357 ndash2020 ndash1761 299 ndash3368 ndash1640 ndash1591Portfolio Investment Net ndash2263 ndash4983 ndash307 ndash1149 ndash535 ndash1951 ndash2231 184 ndash2489 ndash1579Financial Derivatives Net ndash350 71 22 ndash543 ndash270 78 240 ndash207 ndash200 ndash45Other Investment Net ndash4537 ndash884 ndash4734 ndash2601 ndash371 ndash208 ndash1867 ndash1113 ndash93 ndash2394Change in Reserves 159 45 ndash31 ndash36 ndash63 21 ndash17 50 02 00
Euro AreaFinancial Account Balance ndash409 1826 4390 3376 2979 3726 4248 3301
Direct Investment Net 1249 589 135 691 1785 2068 887 423 Portfolio Investment Net ndash3834 ndash1770 ndash1685 754 1912 5098 3354 2556 Financial Derivatives Net 55 389 418 658 956 169 271 1145 Other Investment Net 1977 2428 5442 1230 ndash1792 ndash3780 ndash248 ndash1119 Change in Reserves 143 190 80 44 118 171 ndash16 295 GermanyFinancial Account Balance 1677 1943 3000 3178 2594 2868 3199 2704 2691 2610
Direct Investment Net 103 336 260 878 684 465 540 514 530 550Portfolio Investment Net ndash514 668 2096 1777 2099 2203 2245 1336 1783 1634Financial Derivatives Net 398 309 318 508 338 321 132 275 223 190Other Investment Net 1651 611 314 48 ndash503 ndash140 297 574 155 235Change in Reserves 39 17 12 ndash33 ndash24 19 ndash15 05 00 00
FranceFinancial Account Balance ndash786 ndash480 ndash192 ndash103 ndash08 ndash186 ndash350 ndash323 ndash114 ndash114
Direct Investment Net 198 194 ndash139 472 79 418 115 652 456 481Portfolio Investment Net ndash3352 ndash506 ndash793 ndash238 432 02 266 ndash59 500 600Financial Derivatives Net ndash194 ndash184 ndash223 ndash318 145 ndash176 ndash14 ndash305 ndash398 ndash525Other Investment Net 2639 ndash36 982 ndash29 ndash742 ndash454 ndash683 ndash733 ndash697 ndash695Change in Reserves ndash77 52 ndash19 10 80 25 ndash34 123 24 25
ItalyFinancial Account Balance ndash799 ndash41 290 685 391 663 581 354 587 605
Direct Investment Net 172 68 09 31 27 ndash107 37 ndash37 ndash30 ndash25Portfolio Investment Net 256 ndash224 ndash54 55 1082 1765 988 1438 105 335Financial Derivatives Net ndash101 75 40 ndash48 26 ndash33 ndash82 ndash33 ndash13 ndash04Other Investment Net ndash1139 21 275 659 ndash750 ndash950 ndash392 ndash1045 525 300Change in Reserves 13 19 20 ndash13 06 ndash13 30 31 00 00
W O R L D E C O N O M I C O U T L O O K G L O B A L M A N U F A C T U R I N G D O W N T U R N R I S I N G T R A D E B A R R I E R S
170 International Monetary Fund | October 2019
Projections2011 2012 2013 2014 2015 2016 2017 2018 2019 2020
SpainFinancial Account Balance ndash414 24 442 161 243 274 244 262 201 225
Direct Investment Net 128 ndash272 ndash246 86 284 160 191 ndash110 ndash37 ndash37Portfolio Investment Net 431 537 ndash836 ndash121 118 561 286 101 484 495Financial Derivatives Net 29 ndash107 14 17 ndash13 ndash33 ndash25 15 00 00Other Investment Net ndash1142 ndash163 1503 128 ndash201 ndash505 ndash248 231 ndash247 ndash234Change in Reserves 139 28 07 51 56 91 40 25 00 00
JapanFinancial Account Balance 1584 539 ndash43 589 1809 2668 1668 1827 1691 1768
Direct Investment Net 1178 1175 1447 1186 1333 1375 1534 1329 1451 1564Portfolio Investment Net ndash1629 288 ndash2806 ndash422 1315 2765 ndash506 915 728 649Financial Derivatives Net ndash171 67 581 340 177 ndash161 304 08 09 09Other Investment Net 434 ndash611 348 ndash601 ndash1067 ndash1254 100 ndash666 ndash608 ndash569Change in Reserves 1773 ndash379 387 85 51 ndash57 236 240 110 115
United KingdomFinancial Account Balance ndash433 ndash926 ndash1325 ndash1542 ndash1426 ndash1458 ndash1158 ndash858 ndash972 ndash1020
Direct Investment Net 534 ndash348 ndash112 ndash1761 ndash1060 ndash2195 163 ndash146 ndash08 ndash117Portfolio Investment Net ndash2155 2750 ndash2842 164 ndash2018 ndash1954 ndash1349 ndash3617 00 00Financial Derivatives Net 74 ndash658 634 312 ndash1286 293 133 177 ndash50 ndash103Other Investment Net 1034 ndash2791 918 ndash375 2616 2310 ndash192 2481 ndash1064 ndash956Change in Reserves 79 121 78 117 322 88 88 248 151 156
CanadaFinancial Account Balance ndash494 ndash627 ndash569 ndash423 ndash562 ndash495 ndash404 ndash364 ndash325 ndash302
Direct Investment Net 125 128 ndash120 13 236 339 550 74 ndash80 53Portfolio Investment Net ndash1044 ndash638 ndash271 ndash329 ndash481 ndash1186 ndash805 ndash82 ndash300 ndash278Financial Derivatives Net Other Investment Net 343 ndash134 ndash225 ndash160 ndash402 295 ndash156 ndash340 55 ndash77Change in Reserves 81 17 47 53 86 56 08 ndash15 00 00
Other Advanced Economies1
Financial Account Balance 2860 2534 3761 3431 2910 3321 3067 3247 3382 3259Direct Investment Net ndash62 ndash337 308 ndash63 ndash1012 ndash719 ndash738 ndash712 ndash553 ndash476Portfolio Investment Net 472 1500 1396 1815 3355 2640 1793 3611 3142 2737Financial Derivatives Net 311 ndash288 ndash335 ndash235 ndash129 41 ndash42 276 90 92Other Investment Net 888 ndash1100 1367 847 ndash1055 ndash144 ndash77 ndash444 417 683Change in Reserves 1251 2747 1013 1063 1759 1502 2131 516 276 223
Table A13 Summary of Financial Account Balances (continued)(Billions of US dollars)
S TAT I S T I C A L A P P E N D I X
International Monetary Fund | October 2019 171
Projections2011 2012 2013 2014 2015 2016 2017 2018 2019 2020
Emerging Market and Developing Economies
Financial Account Balance 2329 1069 265 288 ndash2728 ndash3959 ndash2391 ndash1606 215 ndash1004Direct Investment Net ndash5316 ndash4942 ndash4828 ndash4301 ndash3448 ndash2594 ndash3029 ndash3832 ndash3849 ndash4086Portfolio Investment Net ndash1343 ndash2445 ndash1502 ndash897 1233 ndash546 ndash2106 ndash1161 ndash209 ndash81Financial Derivatives Net Other Investment Net 1527 4152 756 4085 4688 3967 1108 2327 3123 2389Change in Reserves 7420 4324 5837 1264 ndash5271 ndash4710 1613 1028 1158 771
Regional GroupsEmerging and Developing AsiaFinancial Account Balance 619 134 372 1528 754 ndash245 ndash638 ndash2040 930 524
Direct Investment Net ndash2767 ndash2200 ndash2713 ndash2013 ndash1395 ndash257 ndash1033 ndash1829 ndash1786 ndash1918Portfolio Investment Net ndash579 ndash1156 ndash648 ndash1244 816 310 ndash697 ndash1013 52 358Financial Derivatives Net ndash03 15 ndash20 07 07 ndash46 23 47 ndash13 ndash09Other Investment Net ndash298 2095 ndash729 2819 4615 3568 ndash883 530 1912 1395Change in Reserves 4286 1403 4449 1933 ndash3300 ndash3822 1971 236 773 710
Emerging and Developing EuropeFinancial Account Balance ndash326 ndash259 ndash646 ndash302 632 27 ndash180 1047 711 339
Direct Investment Net ndash395 ndash377 ndash156 05 ndash259 ndash451 ndash280 ndash206 ndash128 ndash62Portfolio Investment Net ndash407 ndash929 ndash378 235 541 ndash73 ndash351 139 ndash157 ndash123Financial Derivatives Net 36 ndash17 ndash11 55 54 02 ndash23 ndash30 07 09Other Investment Net 168 548 ndash25 621 314 200 309 670 416 126Change in Reserves 272 516 ndash77 ndash1218 ndash18 350 165 474 573 389
Latin America and the CaribbeanFinancial Account Balance ndash1266 ndash1559 ndash1968 ndash1967 ndash1868 ndash971 ndash892 ndash1139 ndash806 ndash811
Direct Investment Net ndash1468 ndash1585 ndash1498 ndash1384 ndash1319 ndash1254 ndash1220 ndash1455 ndash1399 ndash1373Portfolio Investment Net ndash1044 ndash809 ndash1004 ndash1094 ndash508 ndash494 ndash419 ndash49 92 ndash130Financial Derivatives Net 55 25 18 70 12 ndash29 39 39 34 36Other Investment Net 110 221 398 48 236 595 534 189 505 553Change in Reserves 1081 589 118 393 ndash288 211 172 138 ndash37 105
Middle East and Central AsiaFinancial Account Balance 3438 2999 3058 1796 ndash1525 ndash2188 ndash311 959 ndash89 ndash461
Direct Investment Net ndash360 ndash432 ndash227 ndash426 ndash103 ndash291 ndash126 ndash46 ndash97 ndash232Portfolio Investment Net 880 730 752 1299 618 ndash122 ndash415 ndash39 ndash97 ndash63Financial Derivatives Net Other Investment Net 1350 1085 1213 686 ndash517 ndash423 1055 905 239 299Change in Reserves 1575 1617 1320 237 ndash1518 ndash1350 ndash823 141 ndash128 ndash458
Sub-Saharan AfricaFinancial Account Balance ndash136 ndash245 ndash550 ndash766 ndash721 ndash582 ndash369 ndash433 ndash531 ndash595
Direct Investment Net ndash326 ndash346 ndash235 ndash483 ndash373 ndash341 ndash370 ndash295 ndash439 ndash502Portfolio Investment Net ndash192 ndash282 ndash223 ndash93 ndash234 ndash167 ndash224 ndash199 ndash98 ndash124Financial Derivatives Net ndash17 ndash17 ndash08 ndash15 ndash04 09 03 ndash05 ndash05 ndash05Other Investment Net 197 204 ndash102 ndash89 40 27 93 32 51 17Change in Reserves 206 200 26 ndash80 ndash147 ndash100 128 37 ndash23 26
Table A13 Summary of Financial Account Balances (continued)(Billions of US dollars)
W O R L D E C O N O M I C O U T L O O K G L O B A L M A N U F A C T U R I N G D O W N T U R N R I S I N G T R A D E B A R R I E R S
172 International Monetary Fund | October 2019
Projections2011 2012 2013 2014 2015 2016 2017 2018 2019 2020
Analytical GroupsBy Source of Export Earnings
FuelFinancial Account Balance 5121 4471 3753 2269 ndash828 ndash1562 663 2782 1521 782
Direct Investment Net ndash231 ndash282 148 66 63 ndash277 224 383 235 188Portfolio Investment Net 981 414 875 1774 932 ndash123 ndash421 ndash47 ndash117 ndash49Financial Derivatives Net Other Investment Net 2437 1989 1744 1450 ndash17 301 1407 1810 1132 860Change in Reserves 1927 2336 981 ndash1076 ndash1875 ndash1464 ndash553 643 274 ndash214
NonfuelFinancial Account Balance ndash2792 ndash3402 ndash3487 ndash1982 ndash1900 ndash2397 ndash3054 ndash4389 ndash1306 ndash1785
Direct Investment Net ndash5085 ndash4660 ndash4975 ndash4367 ndash3511 ndash2318 ndash3253 ndash4215 ndash4084 ndash4275Portfolio Investment Net ndash2324 ndash2859 ndash2377 ndash2671 301 ndash423 ndash1685 ndash1114 ndash92 ndash32Financial Derivatives Net 58 ndash09 ndash24 65 ndash02 ndash64 37 58 24 32Other Investment Net ndash909 2163 ndash988 2635 4705 3666 ndash299 517 1991 1530Change in Reserves 5492 1988 4856 2340 ndash3396 ndash3247 2166 384 884 985
By External Financing SourceNet Debtor EconomiesFinancial Account Balance ndash3555 ndash4099 ndash4030 ndash3575 ndash2938 ndash2294 ndash2672 ndash2797 ndash2620 ndash3076
Direct Investment Net ndash2758 ndash2788 ndash2700 ndash2798 ndash2893 ndash2885 ndash2658 ndash3054 ndash3076 ndash3242Portfolio Investment Net ndash1863 ndash2215 ndash1783 ndash1884 ndash307 ndash542 ndash1191 ndash217 ndash720 ndash774Financial Derivatives Net Other Investment Net ndash679 ndash270 ndash295 ndash25 385 393 135 371 359 307Change in Reserves 1719 1218 742 1034 ndash106 881 1024 119 816 619
Net Debtor Economies by Debt-Servicing ExperienceEconomies with Arrears
andor Rescheduling during 2014ndash18
Financial Account Balance ndash146 ndash381 ndash365 ndash289 ndash470 ndash533 ndash348 ndash221 ndash279 ndash353Direct Investment Net ndash146 ndash166 ndash101 ndash166 ndash344 ndash237 ndash139 ndash177 ndash235 ndash282Portfolio Investment Net 10 ndash13 ndash118 ndash17 ndash12 ndash23 ndash248 ndash189 ndash94 ndash105Financial Derivatives Net Other Investment Net 44 05 ndash182 18 ndash158 ndash210 101 101 17 10Change in Reserves ndash55 ndash208 38 ndash121 47 ndash60 ndash59 48 38 30
MemorandumWorldFinancial Account Balance ndash47 ndash466 2566 3434 521 405 1556 1623 4074 1553
Note The estimates in this table are based on individual countriesrsquo national accounts and balance-of-payments statistics Country group composites are calculated as the sum of the US dollar values for the relevant individual countries Some group aggregates for the financial derivatives are not shown because of incomplete data Projections for the euro area are not available because of data constraints1Excludes the Group of Seven (Canada France Germany Italy Japan United Kingdom United States) and euro area countries
Table A13 Summary of Financial Account Balances (continued)(Billions of US dollars)
S TAT I S T I C A L A P P E N D I X
International Monetary Fund | October 2019 173
Table A14 Summary of Net Lending and Borrowing(Percent of GDP)
ProjectionsAverages Average
2001ndash10 2005ndash12 2013 2014 2015 2016 2017 2018 2019 2020 2021ndash24
Advanced EconomiesNet Lending and Borrowing ndash07 ndash06 05 05 06 07 08 06 06 05 04
Current Account Balance ndash07 ndash06 04 05 06 07 09 07 06 05 04Savings 217 215 219 226 228 223 227 226 225 224 226Investment 224 221 212 215 216 214 218 220 220 220 222
Capital Account Balance 00 00 00 00 00 00 00 ndash01 00 00 00United StatesNet Lending and Borrowing ndash44 ndash40 ndash21 ndash21 ndash22 ndash23 ndash22 ndash24 ndash25 ndash25 ndash23
Current Account Balance ndash44 ndash40 ndash21 ndash21 ndash22 ndash23 ndash23 ndash24 ndash25 ndash25 ndash24Savings 173 168 192 203 202 186 186 184 185 185 189Investment 215 208 204 208 211 204 206 210 211 211 213
Capital Account Balance 00 00 00 00 00 00 01 00 00 00 00Euro AreaNet Lending and Borrowing 01 01 25 26 29 31 31 26
Current Account Balance 00 00 23 25 27 31 32 29 28 27 23Savings 229 228 225 230 238 243 249 251 250 251 251Investment 225 222 198 201 206 209 213 216 217 218 222
Capital Account Balance 01 01 02 01 02 00 ndash02 ndash03 GermanyNet Lending and Borrowing 42 60 65 73 86 85 80 74 70 66 60
Current Account Balance 42 60 66 72 86 85 81 73 70 66 60Savings 248 263 266 276 286 287 288 291 288 287 289Investment 206 204 201 204 200 202 207 218 218 221 230
Capital Account Balance 00 00 00 01 00 01 ndash01 01 00 00 00FranceNet Lending and Borrowing 07 ndash03 ndash05 ndash10 ndash04 ndash04 ndash07 ndash05 ndash04 ndash04 ndash03
Current Account Balance 07 ndash03 ndash05 ndash10 ndash04 ndash05 ndash07 ndash06 ndash05 ndash05 ndash04Savings 230 225 218 218 223 221 226 229 228 228 226Investment 224 229 223 227 227 226 234 235 233 233 230
Capital Account Balance 00 00 00 ndash01 00 01 00 01 01 01 01ItalyNet Lending and Borrowing ndash12 ndash18 09 21 17 24 26 25 29 30 25
Current Account Balance ndash13 ndash19 10 19 13 25 26 25 29 29 24Savings 199 187 179 189 186 201 202 205 204 204 202Investment 211 207 170 170 173 176 176 180 176 175 178
Capital Account Balance 01 01 00 02 04 ndash02 00 00 01 01 01SpainNet Lending and Borrowing ndash55 ndash54 22 16 18 25 21 14 14 16 16
Current Account Balance ndash61 ndash59 15 11 12 23 18 09 09 10 11Savings 219 207 202 205 216 227 229 228 231 233 236Investment 280 265 187 195 204 204 211 219 222 223 226
Capital Account Balance 06 05 06 05 07 02 02 05 05 05 05JapanNet Lending and Borrowing 32 30 07 07 31 39 41 35 33 33 34
Current Account Balance 33 31 09 08 31 40 42 35 33 33 35Savings 274 263 241 247 271 274 281 280 279 280 281Investment 241 232 232 239 240 234 239 244 246 247 246
Capital Account Balance ndash01 ndash01 ndash01 00 ndash01 ndash01 ndash01 00 ndash01 ndash01 ndash01United KingdomNet Lending and Borrowing ndash29 ndash32 ndash52 ndash50 ndash50 ndash53 ndash34 ndash40 ndash35 ndash38 ndash38
Current Account Balance ndash29 ndash32 ndash51 ndash49 ndash49 ndash52 ndash33 ndash39 ndash35 ndash37 ndash37Savings 143 134 111 123 123 120 139 133 130 126 130Investment 172 166 162 173 172 173 172 172 164 162 167
Capital Account Balance 00 00 ndash01 ndash01 ndash01 ndash01 ndash01 ndash01 ndash01 ndash01 ndash01
W O R L D E C O N O M I C O U T L O O K G L O B A L M A N U F A C T U R I N G D O W N T U R N R I S I N G T R A D E B A R R I E R S
174 International Monetary Fund | October 2019
ProjectionsAverages Average
2001ndash10 2005ndash12 2013 2014 2015 2016 2017 2018 2019 2020 2021ndash24
CanadaNet Lending and Borrowing 04 ndash11 ndash32 ndash24 ndash35 ndash32 ndash28 ndash26 ndash19 ndash17 ndash16
Current Account Balance 05 ndash11 ndash32 ndash24 ndash35 ndash32 ndash28 ndash26 ndash19 ndash17 ndash16Savings 226 225 217 225 203 197 207 204 207 208 210Investment 221 236 249 249 238 229 235 230 226 225 226
Capital Account Balance 00 00 00 00 00 00 00 00 00 00 00Other Advanced Economies1
Net Lending and Borrowing 40 40 50 50 52 53 45 48 47 43 40Current Account Balance 40 40 50 51 56 52 47 49 48 44 40
Savings 300 305 304 306 308 303 304 303 299 294 290Investment 257 262 253 253 249 250 255 255 250 249 248
Capital Account Balance 00 00 01 ndash01 ndash04 01 ndash02 ndash01 ndash01 ndash01 ndash01Emerging Market and Developing
EconomiesNet Lending and Borrowing 25 27 07 06 ndash01 ndash02 01 01 00 ndash03 ndash06
Current Account Balance 25 26 06 06 ndash02 ndash03 00 00 00 ndash04 ndash07Savings 303 326 329 329 323 317 323 329 326 322 318Investment 281 303 325 325 327 319 325 330 327 327 326
Capital Account Balance 01 02 02 00 01 01 01 01 01 01 01Regional Groups
Emerging and Developing AsiaNet Lending and Borrowing 37 37 08 16 20 14 10 ndash01 04 02 ndash01
Current Account Balance 36 36 07 15 20 14 10 ndash01 04 02 ndash01Savings 398 431 431 436 425 410 410 404 399 392 381Investment 364 396 423 421 405 396 401 406 395 390 382
Capital Account Balance 01 01 01 00 00 00 00 00 00 00 00Emerging and Developing EuropeNet Lending and Borrowing 01 ndash05 ndash09 ndash07 16 ndash01 ndash03 22 19 09 02
Current Account Balance 02 ndash06 ndash14 ndash03 09 ndash04 ndash06 17 16 06 00Savings 229 235 228 234 246 235 242 258 252 244 241Investment 226 240 242 237 236 238 248 240 235 238 241
Capital Account Balance ndash02 01 05 ndash04 07 03 03 05 04 03 02Latin America and the CaribbeanNet Lending and Borrowing ndash01 ndash05 ndash28 ndash30 ndash32 ndash19 ndash14 ndash19 ndash15 ndash15 ndash17
Current Account Balance ndash02 ndash06 ndash28 ndash31 ndash32 ndash19 ndash14 ndash19 ndash16 ndash15 ndash17Savings 204 211 191 178 164 169 167 177 178 180 181Investment 206 216 222 215 211 185 185 196 194 195 198
Capital Account Balance 01 01 01 00 00 00 00 00 00 00 00Middle East and Central AsiaNet Lending and Borrowing 73 95 90 58 ndash36 ndash39 ndash07 28 ndash03 ndash12 ndash20
Current Account Balance 77 99 88 52 ndash39 ndash41 ndash07 27 ndash04 ndash14 ndash22Savings 343 371 351 314 237 232 276 297 273 273 271Investment 276 280 259 256 272 265 286 271 277 287 294
Capital Account Balance 01 01 00 02 00 01 01 01 01 01 01Sub-Saharan AfricaNet Lending and Borrowing 18 19 ndash18 ndash32 ndash56 ndash35 ndash19 ndash23 ndash32 ndash34 ndash30
Current Account Balance 05 05 ndash22 ndash36 ndash60 ndash39 ndash23 ndash27 ndash36 ndash38 ndash34Savings 208 217 195 193 173 180 190 180 176 176 187Investment 209 216 217 226 228 215 212 206 212 214 216
Capital Account Balance 13 14 04 04 04 04 04 04 04 04 04
Table A14 Summary of Net Lending and Borrowing (continued)(Percent of GDP)
S TAT I S T I C A L A P P E N D I X
International Monetary Fund | October 2019 175
ProjectionsAverages Average
2001ndash10 2005ndash12 2013 2014 2015 2016 2017 2018 2019 2020 2021ndash24
Analytical GroupsBy Source of Export Earnings
FuelNet Lending and Borrowing 87 100 74 47 ndash15 ndash15 17 56 28 14 04
Current Account Balance 92 104 74 51 ndash15 ndash16 17 56 28 13 04Savings 336 353 322 297 242 242 278 308 286 280 276Investment 250 253 251 247 267 245 264 250 256 265 271
Capital Account Balance ndash02 00 00 ndash07 ndash01 00 00 00 00 00 00NonfuelNet Lending and Borrowing 09 06 ndash10 ndash04 02 01 ndash02 ndash09 ndash04 ndash05 ndash08
Current Account Balance 06 04 ndash12 ndash06 01 00 ndash03 ndash10 ndash05 ndash06 ndash08Savings 294 319 330 337 339 331 332 333 332 329 325Investment 290 316 343 343 338 332 335 344 338 336 333
Capital Account Balance 02 02 02 02 02 01 01 01 01 01 01By External Financing Source
Net Debtor EconomiesNet Lending and Borrowing ndash07 ndash13 ndash24 ndash21 ndash21 ndash15 ndash15 ndash17 ndash17 ndash18 ndash20
Current Account Balance ndash10 ndash16 ndash27 ndash24 ndash24 ndash17 ndash17 ndash20 ndash19 ndash20 ndash21Savings 229 238 228 228 224 224 227 228 229 231 238Investment 241 256 254 251 248 241 244 248 248 252 258
Capital Account Balance 03 03 03 03 03 02 02 02 02 02 01Net Debtor Economies by
Debt-Servicing ExperienceEconomies with Arrears andor
Rescheduling during 2014ndash18Net Lending and Borrowing 00 ndash12 ndash40 ndash32 ndash56 ndash57 ndash42 ndash27 ndash36 ndash40 ndash36
Current Account Balance ndash04 ndash17 ndash42 ndash35 ndash59 ndash57 ndash44 ndash29 ndash39 ndash43 ndash39Savings 221 217 163 172 145 139 155 170 166 170 179Investment 232 236 205 201 205 199 204 200 207 215 219
Capital Account Balance 05 05 02 03 02 01 02 02 02 02 02MemorandumWorldNet Lending and Borrowing 01 04 06 05 03 04 05 04 04 02 00
Current Account Balance 01 03 05 05 03 03 05 04 03 01 00Savings 241 250 262 267 265 260 265 267 265 265 266Investment 240 247 255 258 260 254 260 263 262 263 266
Capital Account Balance 01 01 01 00 00 00 00 00 00 00 00
Note The estimates in this table are based on individual countriesrsquo national accounts and balance-of-payments statistics Country group composites are calculated as the sum of the US dollar values for the relevant individual countries This differs from the calculations in the April 2005 and earlier issues of the World Economic Outlook in which the composites were weighted by GDP valued at purchasing power parities as a share of total world GDP The estimates of gross national savings and investment (or gross capital formation) are from individual countriesrsquo national accounts statistics The estimates of the current account balance the capital account balance and the financial account balance (or net lendingnet borrowing) are from the balance-of-payments statistics The link between domestic transactions and transactions with the rest of the world can be expressed as accounting identities Savings (S ) minus investment (I ) is equal to the current account balance (CAB ) (S ndash I = CAB ) Also net lendingnet borrowing (NLB ) is the sum of the current account balance and the capital account balance (KAB ) (NLB = CAB + KAB ) In practice these identities do not hold exactly imbalances result from imperfections in source data and compilation as well as from asymmetries in group composition due to data availability1Excludes the Group of Seven (Canada France Germany Italy Japan United Kingdom United States) and euro area countries
Table A14 Summary of Net Lending and Borrowing (continued)(Percent of GDP)
W O R L D E C O N O M I C O U T L O O K G L O B A L M A N U F A C T U R I N G D O W N T U R N R I S I N G T R A D E B A R R I E R S
176 International Monetary Fund | October 2019
Table A15 Summary of World Medium-Term Baseline ScenarioProjections
Averages Averages2001ndash10 2011ndash20 2017 2018 2019 2020 2017ndash20 2021ndash24
World Real GDP 39 36 38 36 30 34 35 36Advanced Economies 17 19 25 23 17 17 20 16Emerging Market and Developing Economies 62 48 48 45 39 46 44 48MemorandumPotential Output
Major Advanced Economies 18 14 15 16 15 15 15 14World Trade Volume1 50 36 57 36 11 32 34 38Imports
Advanced Economies 35 33 47 30 12 27 29 31Emerging Market and Developing Economies 92 44 75 51 07 43 44 51
ExportsAdvanced Economies 39 33 47 31 09 25 28 31Emerging Market and Developing Economies 82 41 73 39 19 41 43 46
Terms of TradeAdvanced Economies ndash01 01 ndash02 ndash07 00 ndash01 ndash02 01Emerging Market and Developing Economies 10 ndash03 08 15 ndash13 ndash11 00 ndash01
World Prices in US DollarsManufactures 19 ndash02 ndash03 19 14 ndash02 07 08Oil 108 ndash31 233 294 ndash96 ndash62 78 ndash12Nonfuel Primary Commodities 89 ndash10 64 16 09 17 26 07Consumer PricesAdvanced Economies 20 15 17 20 15 18 17 19Emerging Market and Developing Economies 66 51 43 48 47 48 46 44Interest RatesReal Six-Month LIBOR2 07 ndash06 ndash04 01 05 00 01 02World Real Long-Term Interest Rate3 19 02 ndash02 ndash01 ndash03 ndash08 ndash04 ndash02Current Account BalancesAdvanced Economies ndash07 05 09 07 06 05 07 04Emerging Market and Developing Economies 25 03 00 00 00 ndash04 ndash01 ndash07Total External DebtEmerging Market and Developing Economies 304 299 307 316 310 302 309 284Debt ServiceEmerging Market and Developing Economies 90 107 99 110 109 106 106 1011Data refer to trade in goods and services2London interbank offered rate on US dollar deposits minus percent change in US GDP deflator3GDP-weighted average of 10-year (or nearest-maturity) government bond rates for Canada France Germany Italy Japan the United Kingdom and the United States
Annual Percent Change
Percent
Percent of GDP
International Monetary Fund | October 2019 177
World Economic Outlook ArchivesWorld Economic Outlook Financial Systems and Economic Cycles September 2006
World Economic Outlook Spillovers and Cycles in the Global Economy April 2007
World Economic Outlook Globalization and Inequality October 2007
World Economic Outlook Housing and the Business Cycle April 2008
World Economic Outlook Financial Stress Downturns and Recoveries October 2008
World Economic Outlook Crisis and Recovery April 2009
World Economic Outlook Sustaining the Recovery October 2009
World Economic Outlook Rebalancing Growth April 2010
World Economic Outlook Recovery Risk and Rebalancing October 2010
World Economic Outlook Tensions from the Two-Speed RecoverymdashUnemployment Commodities and Capital Flows April 2011
World Economic Outlook Slowing Growth Rising Risks September 2011
World Economic Outlook Growth Resuming Dangers Remain April 2012
World Economic Outlook Coping with High Debt and Sluggish Growth October 2012
World Economic Outlook Hopes Realities Risks April 2013
World Economic Outlook Transitions and Tensions October 2013
World Economic Outlook Recovery Strengthens Remains Uneven April 2014
World Economic Outlook Legacies Clouds Uncertainties October 2014
World Economic Outlook Uneven GrowthmdashShort- and Long-Term Factors April 2015
World Economic Outlook Adjusting to Lower Commodity Prices October 2015
World Economic Outlook Too Slow for Too Long April 2016
World Economic Outlook Subdued DemandmdashSymptoms and Remedies October 2016
World Economic Outlook Gaining Momentum April 2017
World Economic Outlook Seeking Sustainable Growth Short-Term Recovery Long-Term Challenges October 2017
World Economic Outlook Cyclical Upswing Structural Change April 2018
World Economic Outlook Challenges to Steady Growth October 2018
World Economic Outlook Growth Slowdown Precarious Recovery April 2019
World Economic Outlook Global Manufacturing Downturn Rising Trade Barriers October 2019
I MethodologymdashAggregation Modeling and ForecastingMeasuring Inequality Conceptual Methodological and Measurement Issues October 2007 Box 41New Business Cycle Indices for Latin America A Historical Reconstruction October 2007 Box 53Implications of New PPP Estimates for Measuring Global Growth April 2008 Appendix 11Measuring Output Gaps October 2008 Box 13Assessing and Communicating Risks to the Global Outlook October 2008 Appendix 11Fan Chart for Global Growth April 2009 Appendix 12Indicators for Tracking Growth October 2010 Appendix 12Inferring Potential Output from Noisy Data The Global Projection Model View October 2010 Box 13Uncoordinated Rebalancing October 2010 Box 14
WORLD ECONOMIC OUTLOOK SELECTED TOPICS
WO R L D E CO N O M I C O U T LO O K G LO B A L M A N U FAC T U R I N G D OW N T U R N R IS I N G T R A D E B A R R I E R S
178 International Monetary Fund | October 2019
World Economic Outlook Downside Scenarios April 2011 Box 12
Fiscal Balance Sheets The Significance of Nonfinancial Assets and Their Measurement October 2014 Box 33
Tariff Scenarios October 2016 Scenario Box
World Growth Projections over the Medium Term October 2016 Box 11
Global Growth Forecast Assumptions on Policies Financial Conditions and Commodity Prices April 2019 Box 12
On the Underlying Source of Changes in Capital Goods Prices A Model-Based Analysis April 2019 Box 33
Global Growth Forecast Assumptions on Policies Financial Conditions and Commodity Prices October 2019 Box 13
II Historical SurveysHistorical Perspective on Growth and the Current Account October 2008 Box 63
A Historical Perspective on International Financial Crises October 2009 Box 41
The Good the Bad and the Ugly 100 Years of Dealing with Public Debt Overhangs October 2012 Chapter 3
What Is the Effect of Recessions October 2015 Box 11
III Economic GrowthmdashSources and PatternsAsia Rising Patterns of Economic Development and Growth September 2006 Chapter 3
Japanrsquos Potential Output and Productivity Growth September 2006 Box 31
The Evolution and Impact of Corporate Governance Quality in Asia September 2006 Box 32
Decoupling the Train Spillovers and Cycles in the Global Economy April 2007 Chapter 4
Spillovers and International Business Cycle Synchronization A Broader Perspective April 2007 Box 43
The Discounting Debate October 2007 Box 17
Taxes versus Quantities under Uncertainty (Weitzman 1974) October 2007 Box 18
Experience with Emissions Trading in the European Union October 2007 Box 19
Climate Change Economic Impact and Policy Responses October 2007 Appendix 12
What Risks Do Housing Markets Pose for Global Growth October 2007 Box 21
The Changing Dynamics of the Global Business Cycle October 2007 Chapter 5
Major Economies and Fluctuations in Global Growth October 2007 Box 51
Improved Macroeconomic PerformancemdashGood Luck or Good Policies October 2007 Box 52
House Prices Corrections and Consequences October 2008 Box 12
Global Business Cycles April 2009 Box 11
How Similar Is the Current Crisis to the Great Depression April 2009 Box 31
Is Credit a Vital Ingredient for Recovery Evidence from Industry-Level Data April 2009 Box 32
From Recession to Recovery How Soon and How Strong April 2009 Chapter 3
Whatrsquos the Damage Medium-Term Output Dynamics after Financial Crises October 2009 Chapter 4
Will the Recovery Be Jobless October 2009 Box 13
Unemployment Dynamics during Recessions and Recoveries Okunrsquos Law and Beyond April 2010 Chapter 3
Does Slow Growth in Advanced Economies Necessarily Imply Slow Growth in Emerging Economies October 2010 Box 11
The Global Recovery Where Do We Stand April 2012 Box 12
How Does Uncertainty Affect Economic Performance October 2012 Box 13
Resilience in Emerging Market and Developing Economies Will It Last October 2012 Chapter 4
Jobs and Growth Canrsquot Have One without the Other October 2012 Box 41
Spillovers from Policy Uncertainty in the United States and Europe April 2013 Chapter 2 Spillover Feature
Breaking through the Frontier Can Todayrsquos Dynamic Low-Income Countries Make It April 2013 Chapter 4
What Explains the Slowdown in the BRICS October 2013 Box 12
Dancing Together Spillovers Common Shocks and the Role of Financial and Trade Linkages October 2013 Chapter 3
S E L E C T E D TO P I C S
International Monetary Fund | October 2019 179
Output Synchronicity in the Middle East North Africa Afghanistan and Pakistan and in the Caucasus and Central Asia October 2013 Box 31
Spillovers from Changes in US Monetary Policy October 2013 Box 32Saving and Economic Growth April 2014 Box 31On the Receiving End External Conditions and Emerging Market Growth before during
and after the Global Financial Crisis April 2014 Chapter 4The Impact of External Conditions on Medium-Term Growth in Emerging Market Economies April 2014 Box 41The Origins of IMF Growth Forecast Revisions since 2011 October 2014 Box 12Underlying Drivers of US Yields Matter for Spillovers October 2014 Chapter 2
Spillover FeatureIs It Time for an Infrastructure Push The Macroeconomic Effects of Public Investment October 2014 Chapter 3The Macroeconomic Effects of Scaling Up Public Investment in Developing Economies October 2014 Box 34Where Are We Headed Perspectives on Potential Output April 2015 Chapter 3Steady as She GoesmdashEstimating Sustainable Output April 2015 Box 31Macroeconomic Developments and Outlook in Low-Income Developing Countriesmdash
The Role of External Factors April 2016 Box 12Time for a Supply-Side Boost Macroeconomic Effects of Labor and Product Market
Reforms in Advanced Economies April 2016 Chapter 3Road Less Traveled Growth in Emerging Market and Developing Economies in a Complicated
External Environment April 2017 Chapter 3Growing with Flows Evidence from Industry-Level Data April 2017 Box 22Emerging Market and Developing Economy Growth Heterogeneity and Income Convergence
over the Forecast Horizon October 2017 Box 13Manufacturing Jobs Implications for Productivity and Inequality April 2018 Chapter 3Is Productivity Growth Shared in a Globalized Economy April 2018 Chapter 4Recent Dynamics of Potential Growth April 2018 Box 13Growth Outlook Advanced Economies October 2018 Box 12Growth Outlook Emerging Market and Developing Economies October 2018 Box 13The Global Recovery 10 Years after the 2008 Financial Meltdown October 2018 Chapter 2The Plucking Theory of the Business Cycle October 2019 Box 14Reigniting Growth in Low-Income and Emerging Market Economies What Role Can
Structural Reforms Play October 2019 Chapter 3
IV Inflation and Deflation and Commodity MarketsThe Boom in Nonfuel Commodity Prices Can It Last September 2006 Chapter 5International Oil Companies and National Oil Companies in a Changing Oil Sector Environment September 2006 Box 14Commodity Price Shocks Growth and Financing in Sub-Saharan Africa September 2006 Box 22Has Speculation Contributed to Higher Commodity Prices September 2006 Box 51Agricultural Trade Liberalization and Commodity Prices September 2006 Box 52Recent Developments in Commodity Markets September 2006 Appendix 21Who Is Harmed by the Surge in Food Prices October 2007 Box 11Refinery Bottlenecks October 2007 Box 15Making the Most of Biofuels October 2007 Box 16Commodity Market Developments and Prospects April 2008 Appendix 12Dollar Depreciation and Commodity Prices April 2008 Box 14Why Hasnrsquot Oil Supply Responded to Higher Prices April 2008 Box 15Oil Price Benchmarks April 2008 Box 16Globalization Commodity Prices and Developing Countries April 2008 Chapter 5The Current Commodity Price Boom in Perspective April 2008 Box 52
WO R L D E CO N O M I C O U T LO O K G LO B A L M A N U FAC T U R I N G D OW N T U R N R IS I N G T R A D E B A R R I E R S
180 International Monetary Fund | October 2019
Is Inflation Back Commodity Prices and Inflation October 2008 Chapter 3Does Financial Investment Affect Commodity Price Behavior October 2008 Box 31Fiscal Responses to Recent Commodity Price Increases An Assessment October 2008 Box 32Monetary Policy Regimes and Commodity Prices October 2008 Box 33Assessing Deflation Risks in the G3 Economies April 2009 Box 13Will Commodity Prices Rise Again When the Global Economy Recovers April 2009 Box 15Commodity Market Developments and Prospects April 2009 Appendix 11Commodity Market Developments and Prospects October 2009 Appendix 11What Do Options Markets Tell Us about Commodity Price Prospects October 2009 Box 16What Explains the Rise in Food Price Volatility October 2009 Box 17How Unusual Is the Current Commodity Price Recovery April 2010 Box 12Commodity Futures Price Curves and Cyclical Market Adjustment April 2010 Box 13Commodity Market Developments and Prospects October 2010 Appendix 11Dismal Prospects for the Real Estate Sector October 2010 Box 12Have Metals Become More Scarce and What Does Scarcity Mean for Prices October 2010 Box 15Commodity Market Developments and Prospects April 2011 Appendix 12Oil Scarcity Growth and Global Imbalances April 2011 Chapter 3Life Cycle Constraints on Global Oil Production April 2011 Box 31Unconventional Natural Gas A Game Changer April 2011 Box 32Short-Term Effects of Oil Shocks on Economic Activity April 2011 Box 33Low-Frequency Filtering for Extracting Business Cycle Trends April 2011 Appendix 31The Energy and Oil Empirical Models April 2011 Appendix 32Commodity Market Developments and Prospects September 2011 Appendix 11Financial Investment Speculation and Commodity Prices September 2011 Box 14Target What You Can Hit Commodity Price Swings and Monetary Policy September 2011 Chapter 3Commodity Market Review April 2012 Chapter 1
Special FeatureCommodity Price Swings and Commodity Exporters April 2012 Chapter 4Macroeconomic Effects of Commodity Price Shocks on Low-Income Countries April 2012 Box 41Volatile Commodity Prices and the Development Challenge in Low-Income Countries April 2012 Box 42Commodity Market Review October 2012 Chapter 1
Special FeatureUnconventional Energy in the United States October 2012 Box 14Food Supply Crunch Who Is Most Vulnerable October 2012 Box 15Commodity Market Review April 2013 Chapter 1
Special FeatureThe Dog That Didnrsquot Bark Has Inflation Been Muzzled or Was It Just Sleeping April 2013 Chapter 3Does Inflation Targeting Still Make Sense with a Flatter Phillips Curve April 2013 Box 31Commodity Market Review October 2013 Chapter 1
Special FeatureEnergy Booms and the Current Account Cross-Country Experience October 2013 Box 1SF1Oil Price Drivers and the Narrowing WTI-Brent Spread October 2013 Box 1SF2Anchoring Inflation Expectations When Inflation Is Undershooting April 2014 Box 13Commodity Prices and Forecasts April 2014 Chapter 1
Special FeatureCommodity Market Developments and Forecasts with a Focus on Natural Gas October 2014 Chapter 1
in the World Economy Special FeatureCommodity Market Developments and Forecasts with a Focus on Investment April 2015 Chapter 1
in an Era of Low Oil Prices Special Feature
The Oil Price Collapse Demand or Supply April 2015 Box 11
S E L E C T E D TO P I C S
International Monetary Fund | October 2019 181
Commodity Market Developments and Forecasts with a Focus on Metals in the World Economy October 2015 Chapter 1 Special Feature
The New Frontiers of Metal Extraction The North-to-South Shift October 2015 Chapter 1 Special Feature Box 1SF1
Where Are Commodity Exporters Headed Output Growth in the Aftermath of the Commodity Boom October 2015 Chapter 2
The Not-So-Sick Patient Commodity Booms and the Dutch Disease Phenomenon October 2015 Box 21
Do Commodity Exportersrsquo Economies Overheat during Commodity Booms October 2015 Box 24
Commodity Market Developments and Forecasts with a Focus on the April 2016 Chapter 1 Energy Transition in an Era of Low Fossil Fuel Prices Special Feature
Global Disinflation in an Era of Constrained Monetary Policy October 2016 Chapter 3
Commodity Market Developments and Forecasts with a Focus on Food Security and October 2016 Chapter 1 Markets in the World Economy Special Feature
How Much Do Global Prices Matter for Food Inflation October 2016 Box 33
Commodity Market Developments and Forecasts with a Focus on the Role of Technology and April 2017 Chapter 1 Unconventional Sources in the Global Oil Market Special Feature
Commodity Market Developments and Forecasts October 2017 Chapter 1 Special Feature
Commodity Market Developments and Forecasts April 2018 Chapter 1 Special Feature
What Has Held Core Inflation Back in Advanced Economies April 2018 Box 12
The Role of Metals in the Economics of Electric Vehicles April 2018 Box 1SF1
Inflation Outlook Regions and Countries October 2018 Box 14
Commodity Market Developments and Forecasts with a Focus on Recent Trends in Energy Demand October 2018 Chapter 1 Special Feature
The Demand and Supply of Renewable Energy October 2018 Box 1SF1
Challenges for Monetary Policy in Emerging Markets as Global Financial Conditions Normalize October 2018 Chapter 3
Inflation Dynamics in a Wider Group of Emerging Market and Developing Economies October 2018 Box 31
Commodity Special Feature April 2019 Chapter 1 Special Feature
Special Feature Commodity Market Developments and Forecasts October 2019 Chapter 1 Special Feature
V Fiscal PolicyImproved Emerging Market Fiscal Performance Cyclical or Structural September 2006 Box 21
When Does Fiscal Stimulus Work April 2008 Box 21
Fiscal Policy as a Countercyclical Tool October 2008 Chapter 5
Differences in the Extent of Automatic Stabilizers and Their Relationship with Discretionary Fiscal Policy October 2008 Box 51
Why Is It So Hard to Determine the Effects of Fiscal Stimulus October 2008 Box 52
Have the US Tax Cuts Been ldquoTTTrdquo [Timely Temporary and Targeted] October 2008 Box 53
Will It Hurt Macroeconomic Effects of Fiscal Consolidation October 2010 Chapter 3
Separated at Birth The Twin Budget and Trade Balances September 2011 Chapter 4
Are We Underestimating Short-Term Fiscal Multipliers October 2012 Box 11
The Implications of High Public Debt in Advanced Economies October 2012 Box 12
The Good the Bad and the Ugly 100 Years of Dealing with Public Debt Overhangs October 2012 Chapter 3
The Great Divergence of Policies April 2013 Box 11
Public Debt Overhang and Private Sector Performance April 2013 Box 12
Is It Time for an Infrastructure Push The Macroeconomic Effects of Public Investment October 2014 Chapter 3
Improving the Efficiency of Public Investment October 2014 Box 32
WO R L D E CO N O M I C O U T LO O K G LO B A L M A N U FAC T U R I N G D OW N T U R N R IS I N G T R A D E B A R R I E R S
182 International Monetary Fund | October 2019
The Macroeconomic Effects of Scaling Up Public Investment in Developing Economies October 2014 Box 34Fiscal Institutions Rules and Public Investment October 2014 Box 35Commodity Booms and Public Investment October 2015 Box 22Cross-Border Impacts of Fiscal Policy Still Relevant October 2017 Chapter 4The Spillover Impact of US Government Spending Shocks on External Positions October 2017 Box 41Macroeconomic Impact of Corporate Tax Policy Changes April 2018 Box 15Place-Based Policies Rethinking Fiscal Policies to Tackle Inequalities within Countries October 2019 Box 24
VI Monetary Policy Financial Markets and Flow of FundsHow Do Financial Systems Affect Economic Cycles September 2006 Chapter 4Financial Leverage and Debt Deflation September 2006 Box 41Financial Linkages and Spillovers April 2007 Box 41Macroeconomic Conditions in Industrial Countries and Financial Flows to Emerging Markets April 2007 Box 42Macroeconomic Implications of Recent Market Turmoil Patterns from Previous Episodes October 2007 Box 12What Is Global Liquidity October 2007 Box 14The Changing Housing Cycle and the Implications for Monetary Policy April 2008 Chapter 3Is There a Credit Crunch April 2008 Box 11Assessing Vulnerabilities to Housing Market Corrections April 2008 Box 31Financial Stress and Economic Downturns October 2008 Chapter 4The Latest Bout of Financial Distress How Does It Change the Global Outlook October 2008 Box 11Policies to Resolve Financial System Stress and Restore Sound Financial Intermediation October 2008 Box 41How Vulnerable Are Nonfinancial Firms April 2009 Box 12The Case of Vanishing Household Wealth April 2009 Box 21Impact of Foreign Bank Ownership during Home-Grown Crises April 2009 Box 41A Financial Stress Index for Emerging Economies April 2009 Appendix 41Financial Stress in Emerging Economies Econometric Analysis April 2009 Appendix 42How Linkages Fuel the Fire April 2009 Chapter 4Lessons for Monetary Policy from Asset Price Fluctuations October 2009 Chapter 3Were Financial Markets in Emerging Economies More Resilient than in Past Crises October 2009 Box 12Risks from Real Estate Markets October 2009 Box 14Financial Conditions Indices April 2011 Appendix 11House Price Busts in Advanced Economies Repercussions for Global Financial Markets April 2011 Box 11International Spillovers and Macroeconomic Policymaking April 2011 Box 13Credit Boom-Bust Cycles Their Triggers and Policy Implications September 2011 Box 12Are Equity Price Drops Harbingers of Recession September 2011 Box 13Cross-Border Spillovers from Euro Area Bank Deleveraging April 2012 Chapter 2
Spillover FeatureThe Financial Transmission of Stress in the Global Economy October 2012 Chapter 2
Spillover FeatureThe Great Divergence of Policies April 2013 Box 11Taper Talks What to Expect When the United States Is Tightening October 2013 Box 11Credit Supply and Economic Growth April 2014 Box 11Should Advanced Economies Worry about Growth Shocks in Emerging Market Economies April 2014 Chapter 2
Spillover FeaturePerspectives on Global Real Interest Rates April 2014 Chapter 3Housing Markets across the Globe An Update October 2014 Box 11US Monetary Policy and Capital Flows to Emerging Markets April 2016 Box 22A Transparent Risk-Management Approach to Monetary Policy October 2016 Box 35
S E L E C T E D TO P I C S
International Monetary Fund | October 2019 183
Will the Revival in Capital Flows to Emerging Markets Be Sustained October 2017 Box 12The Role of Financial Sector Repair in the Speed of the Recovery October 2018 Box 23Clarity of Central Bank Communications and the Extent of Anchoring of Inflation Expectations October 2018 Box 32
VII Labor Markets Poverty and InequalityThe Globalization of Labor April 2007 Chapter 5Emigration and Trade How Do They Affect Developing Countries April 2007 Box 51Labor Market Reforms in the Euro Area and the Wage-Unemployment Trade-Off October 2007 Box 22Globalization and Inequality October 2007 Chapter 4The Dualism between Temporary and Permanent Contracts Measures Effects and Policy Issues April 2010 Box 31Short-Time Work Programs April 2010 Box 32Slow Recovery to Nowhere A Sectoral View of Labor Markets in Advanced Economies September 2011 Box 11The Labor Share in Europe and the United States during and after the Great Recession April 2012 Box 11Jobs and Growth Canrsquot Have One without the Other October 2012 Box 41Reforming Collective-Bargaining Systems to Achieve High and Stable Employment April 2016 Box 32Understanding the Downward Trend in Labor Shares April 2017 Chapter 3Labor Force Participation Rates in Advanced Economies October 2017 Box 11Recent Wage Dynamics in Advanced Economies Drivers and Implications October 2017 Chapter 2Labor Market Dynamics by Skill Level October 2017 Box 21Worker Contracts and Nominal Wage Rigidities in Europe Firm-Level Evidence October 2017 Box 22Wage and Employment Adjustment after the Global Financial Crisis Firm-Level Evidence October 2017 Box 23Labor Force Participation in Advanced Economies Drivers and Prospects April 2018 Chapter 2Youth Labor Force Participation in Emerging Market and Developing Economies versus
Advanced Economies April 2018 Box 21Storm Clouds Ahead Migration and Labor Force Participation Rates April 2018 Box 24Are Manufacturing Jobs Better Paid Worker-Level Evidence from Brazil April 2018 Box 33The Global Financial Crisis Migration and Fertility October 2018 Box 21The Employment Impact of Automation Following the Global Financial Crisis
the Case of Industrial Robots October 2018 Box 22Labor Market Dynamics in Select Advanced Economies April 2019 Box 11Worlds Apart Within-Country Regional Disparities April 2019 Box 13Closer Together or Further Apart Within-Country Regional Disparities and Adjustment in
Advanced Economies October 2019 Chapter 2Climate Change and Subnational Regional Disparities October 2019 Box 22
VIII Exchange Rate IssuesHow Emerging Market Countries May Be Affected by External Shocks September 2006 Box 13Exchange Rates and the Adjustment of External Imbalances April 2007 Chapter 3Exchange Rate Pass-Through to Trade Prices and External Adjustment April 2007 Box 33Depreciation of the US Dollar Causes and Consequences April 2008 Box 12Lessons from the Crisis On the Choice of Exchange Rate Regime April 2010 Box 11Exchange Rate Regimes and Crisis Susceptibility in Emerging Markets April 2014 Box 14Exchange Rates and Trade Flows Disconnected October 2015 Chapter 3The Relationship between Exchange Rates and Global-Value-Chain-Related Trade October 2015 Box 31Measuring Real Effective Exchange Rates and Competitiveness The Role of Global Value Chains October 2015 Box 32Labor Force Participation Rates in Advanced Economies October 2017 Box 11Recent Wage Dynamics in Advanced Economies Drivers and Implications October 2017 Chapter 2
WO R L D E CO N O M I C O U T LO O K G LO B A L M A N U FAC T U R I N G D OW N T U R N R IS I N G T R A D E B A R R I E R S
184 International Monetary Fund | October 2019
Labor Market Dynamics by Skill Level October 2017 Box 21Worker Contracts and Nominal Wage Rigidities in Europe Firm-Level Evidence October 2017 Box 22Wage and Employment Adjustment after the Global Financial Crisis Firm-Level Evidence October 2017 Box 23
IX External Payments Trade Capital Movements and Foreign DebtCapital Flows to Emerging Market Countries A Long-Term Perspective September 2006 Box 11
How Will Global Imbalances Adjust September 2006 Box 21
External Sustainability and Financial Integration April 2007 Box 31
Large and Persistent Current Account Imbalances April 2007 Box 32
Multilateral Consultation on Global Imbalances October 2007 Box 13
Managing the Macroeconomic Consequences of Large and Volatile Aid Flows October 2007 Box 23
Managing Large Capital Inflows October 2007 Chapter 3
Can Capital Controls Work October 2007 Box 31
Multilateral Consultation on Global Imbalances Progress Report April 2008 Box 13
How Does the Globalization of Trade and Finance Affect Growth Theory and Evidence April 2008 Box 51
Divergence of Current Account Balances across Emerging Economies October 2008 Chapter 6
Current Account Determinants for Oil-Exporting Countries October 2008 Box 61
Sovereign Wealth Funds Implications for Global Financial Markets October 2008 Box 62
Global Imbalances and the Financial Crisis April 2009 Box 14
Trade Finance and Global Trade New Evidence from Bank Surveys October 2009 Box 11
From Deficit to Surplus Recent Shifts in Global Current Accounts October 2009 Box 15
Getting the Balance Right Transitioning out of Sustained Current Account Surpluses April 2010 Chapter 4
Emerging Asia Responding to Capital Inflows October 2010 Box 21
Latin America-5 Riding Another Wave of Capital Inflows October 2010 Box 22
Do Financial Crises Have Lasting Effects on Trade October 2010 Chapter 4
Unwinding External Imbalances in the European Union Periphery April 2011 Box 21
International Capital Flows Reliable or Fickle April 2011 Chapter 4
External Liabilities and Crisis Tipping Points September 2011 Box 15
The Evolution of Current Account Deficits in the Euro Area April 2013 Box 13
External Rebalancing in the Euro Area October 2013 Box 13
The Yin and Yang of Capital Flow Management Balancing Capital Inflows with Capital Outflows October 2013 Chapter 4
Simulating Vulnerability to International Capital Market Conditions October 2013 Box 41
The Trade Implications of the US Shale Gas Boom October 2014 Box 1SF1
Are Global Imbalances at a Turning Point October 2014 Chapter 4
Switching Gears The 1986 External Adjustment October 2014 Box 41
A Tale of Two Adjustments East Asia and the Euro Area October 2014 Box 42
Understanding the Role of Cyclical and Structural Factors in the Global Trade Slowdown April 2015 Box 12
Small Economies Large Current Account Deficits October 2015 Box 12
Capital Flows and Financial Deepening in Developing Economies October 2015 Box 13
Dissecting the Global Trade Slowdown April 2016 Box 11
Understanding the Slowdown in Capital Flows to Emerging Markets April 2016 Chapter 2
Capital Flows to Low-Income Developing Countries April 2016 Box 21
The Potential Productivity Gains from Further Trade and Foreign Direct Investment Liberalization April 2016 Box 33
Global Trade Whatrsquos behind the Slowdown October 2016 Chapter 2
The Evolution of Emerging Market and Developing Economiesrsquo Trade Integration with Chinarsquos Final Demand April 2017 Box 23
S E L E C T E D TO P I C S
International Monetary Fund | October 2019 185
Shifts in the Global Allocation of Capital Implications for Emerging Market and Developing Economies April 2017 Box 24
Macroeconomic Adjustment in Emerging Market Commodity Exporters October 2017 Box 14Remittances and Consumption Smoothing October 2017 Box 15A Multidimensional Approach to Trade Policy Indicators April 2018 Box 16The Rise of Services Trade April 2018 Box 32Role of Foreign Aid in Improving Productivity in Low-Income Developing Countries April 2018 Box 43Global Trade Tensions October 2018 Scenario BoxThe Price of Capital Goods A Driver of Investment under Threat April 2019 Chapter 3Evidence from Big Data Capital Goods Prices across Countries April 2019 Box 32Capital Goods Tariffs and Investment Firm-Level Evidence from Colombia April 2019 Box 34The Drivers of Bilateral Trade and the Spillovers from Tariffs April 2019 Chapter 4Gross versus Value-Added Trade April 2019 Box 41Bilateral and Aggregate Trade Balances April 2019 Box 42Understanding Trade Deficit Adjustments Does Bilateral Trade Play a Special Role April 2019 Box 43The Global Macro and Micro Effects of a USndashChina Trade Dispute Insights from Three Models April 2019 Box 44A No-Deal Brexit April 2019 Scenario BoxImplications of Advanced Economies Reshoring Some Production October 2019 Scenario Box 11Trade Tensions Updated Scenario October 2019 Scenario Box 12The Decline in World Foreign Direct Investment in 2018 October 2019 Box 12
X Regional IssuesEMU 10 Years On October 2008 Box 21Vulnerabilities in Emerging Economies April 2009 Box 22East-West Linkages and Spillovers in Europe April 2012 Box 21The Evolution of Current Account Deficits in the Euro Area April 2013 Box 13Still Attached Labor Force Participation Trends in European Regions April 2018 Box 23
XI Country-Specific AnalysesWhy Is the US International Income Account Still in the Black and Will This Last September 2005 Box 12Is India Becoming an Engine for Global Growth September 2005 Box 14Saving and Investment in China September 2005 Box 21Chinarsquos GDP Revision What Does It Mean for China and the Global Economy April 2006 Box 16What Do Country Studies of the Impact of Globalization on Inequality Tell Us
Examples from Mexico China and India October 2007 Box 42Japan after the Plaza Accord April 2010 Box 41Taiwan Province of China in the Late 1980s April 2010 Box 42Did the Plaza Accord Cause Japanrsquos Lost Decades April 2011 Box 14Where Is Chinarsquos External Surplus Headed April 2012 Box 13The US Home Ownersrsquo Loan Corporation April 2012 Box 31Household Debt Restructuring in Iceland April 2012 Box 32Abenomics Risks after Early Success October 2013 Box 14Is Chinarsquos Spending Pattern Shifting (away from Commodities) April 2014 Box 12Public Investment in Japan during the Lost Decade October 2014 Box 31Japanese Exports Whatrsquos the Holdup October 2015 Box 33The Japanese Experience with Deflation October 2016 Box 32Permanently Displaced Labor Force Participation in US States and Metropolitan Areas April 2018 Box 22
WO R L D E CO N O M I C O U T LO O K G LO B A L M A N U FAC T U R I N G D OW N T U R N R IS I N G T R A D E B A R R I E R S
186 International Monetary Fund | October 2019
XII Special TopicsClimate Change and the Global Economy April 2008 Chapter 4Rising Car Ownership in Emerging Economies Implications for Climate Change April 2008 Box 41South Asia Illustrative Impact of an Abrupt Climate Shock April 2008 Box 42Macroeconomic Policies for Smoother Adjustment to Abrupt Climate Shocks April 2008 Box 43Catastrophe Insurance and Bonds New Instruments to Hedge Extreme Weather Risks April 2008 Box 44Recent Emission-Reduction Policy Initiatives April 2008 Box 45Complexities in Designing Domestic Mitigation Policies April 2008 Box 46Getting By with a Little Help from a Boom Do Commodity Windfalls Speed Up Human Development October 2015 Box 23Breaking the Deadlock Identifying the Political Economy Drivers of Structural Reforms April 2016 Box 31Can Reform Waves Turn the Tide Some Case Studies Using the Synthetic Control Method April 2016 Box 34A Global Rush for Land October 2016 Box 1SF1Conflict Growth and Migration April 2017 Box 11Tackling Measurement Challenges of Irish Economic Activity April 2017 Box 12Within-Country Trends in Income per Capita The Case of the Brazil Russia India China
and South Africa April 2017 Box 21Technological Progress and Labor Shares A Historical Overview April 2017 Box 31The Elasticity of Substitution Between Capital and Labor Concept and Estimation April 2017 Box 32Routine Tasks Automation and Economic Dislocation around the World April 2017 Box 33Adjustments to the Labor Share of Income April 2017 Box 34The Effects of Weather Shocks on Economic Activity How Can Low-Income Countries Cope October 2017 Chapter 3The Growth Impact of Tropical Cyclones October 2017 Box 31The Role of Policies in Coping with Weather Shocks A Model-Based Analysis October 2017 Box 32Strategies for Coping with Weather Shocks and Climate Change Selected Case Studies October 2017 Box 33Coping with Weather Shocks The Role of Financial Markets October 2017 Box 34Historical Climate Economic Development and the World Income Distribution October 2017 Box 35Mitigating Climate Change October 2017 Box 36Smartphones and Global Trade April 2018 Box 11Has Mismeasurement of the Digital Economy Affected Productivity Statistics April 2018 Box 14The Changing Service Content of Manufactures April 2018 Box 31Patent Data and Concepts April 2018 Box 41International Technology Sourcing and Knowledge Spillovers April 2018 Box 42Relationship between Competition Concentration and Innovation April 2018 Box 44Increasing Market Power October 2018 Box 11Sharp GDP Declines Some Stylized Facts October 2018 Box 15Predicting Recessions and Slowdowns A Daunting Task October 2018 Box 16The Rise of Corporate Market Power and Its Macroeconomic Effects April 2019 Chapter 2The Comovement between Industry Concentration and Corporate Saving April 2019 Box 21Effects of Mergers and Acquisitions on Market Power April 2019 Box 22The Price of Manufactured Low-Carbon Energy Technologies April 2019 Box 31The Global Automobile Industry Recent Developments and Implications for the Global Outlook October 2019 Box 11Whatrsquos Happening with Global Carbon Emissions October 2019 Box 1SF1Measuring Subnational Regional Economic Activity and Welfare October 2019 Box 21The Persistent Effects of Local Shocks The Case of Automotive Manufacturing Plant Closures October 2019 Box 23The Political Effects of Structural Reforms October 2019 Box 31The Impact of Crises on Structural Reforms October 2019 Box 32
International Monetary Fund | October 2019 187
Executive Directors broadly shared the assess-ment of global economic prospects and risks They observed that global growth in 2019 is expected to slow to its lowest level since the
financial crisis The slowdown reflects a notable down-turn in a number of emerging market and developing economies under stress or underperforming relative to past averages and a more broad-based weakening of industrial output amid rising tariff barriers Against this backdrop global trade has slowed to its lowest pace of expansion since 2012 Directors noted that with macroeconomic policies turning accommoda-tive in many countries growth is expected to pick up modestly in 2020
Directors observed that beyond 2020 growth is forecast to remain subdued in advanced econo-mies reflecting moderate productivity growth and slow labor force growth amid population aging In emerging market and developing economies growth is expected to increase modestly as activity strength-ens in currently underperforming countries and as strains ease among those under severe stress The projected growth pickup among these countries more than offsets the expected structural slowdown in China as its economy moves toward a more sus-tainable pace of expansion over the medium term Convergence prospects toward advanced economy income levels however remain bleak for many emerging market and developing economies due to structural bottlenecks and in some cases natural disasters high debt subdued commodity prices and civil strife
Directors observed that the global economy is in a difficult situation and the forecast is subject to considerable downside risks In the near term these include the possibility that stress fails to dissipate among a few key emerging markets and developing economies currently underperforming or experienc-ing severe strains intensifying trade and geopolitical
tensions with associated increases in uncertainty disruptions from a no-deal Brexit and a market reas-sessment of the monetary policy outlook of major central banks leading to an abrupt tightening of financial conditions Downside risks remain elevated in the medium term reflecting increased trade bar-riers a further accumulation of financial vulnerabili-ties that could amplify the next downturn and the consequences of unmitigated climate change
Considering these risks Directors noted the need for sustained multilateral cooperation including resolving trade disagreements curbing cross-border cyberattacks limiting greenhouse gas emissions and reducing global imbalances Closer multilat-eral cooperation on international taxation and the global financial regulatory reform agenda would help address vulnerabilities and broaden the gains from economic integration
Considering the prolonged weakness in activity muted inflation and downside risks to the outlook Directors welcomed the shift toward more accom-modative monetary policy in many economies While supportive of the global economy they noted that the shift toward a more dovish stance in policy may result in a further buildup of financial vulner-abilities which need to be addressed urgently with stronger macroprudential policies Directors stressed that fiscal policy can provide support to aggregate demand where the room to ease monetary policy is limited In countries where activity has weakened fiscal stimulus can be provided if fiscal space exists In countries with fiscal consolidation needs its pace could be adjusted if market conditions permit to avoid prolonged economic weakness and disinfla-tionary dynamics Low policy rates in many coun-tries and historically very low or negative long-term interest rates have reduced the cost of debt service Where debt is sustainable the freed-up resources could be used to support activity as needed and to
The following remarks were made by the Chair at the conclusion of the Executive Boardrsquos discussion of the Fiscal Monitor Global Financial Stability Report and World Economic Outlook on October 3 2019
IMF EXECUTIVE BOARD DISCUSSION OF THE OUTLOOK OCTOBER 2019
WO R L D E CO N O M I C O U T LO O K G LO B A L M A N U FAC T U R I N G D OW N T U R N R IS I N G T R A D E B A R R I E R S
188 International Monetary Fund | October 2019
adopt measures to raise potential output However in many emerging market and developing econo-mies monetary policy is not constrained In many of these countries public debt and interest-to-tax ratios have significantly increased and fiscal poli-cies should build fiscal space and be medium-term oriented Across all economies the priority is to take actions that improve inclusiveness and strengthen resilience Structural policies for more open and flexible markets and improvements in governance can ease adjustment to shocks and boost output over the medium term helping to narrow within-country income differences and encourage faster convergence across countries
Directors noted that markets expect interest rates to remain low for longer than previously antici-pated and with financial conditions easing further over the past six months this has prompted a search for yield among institutional investors with nominal return targets This financial risk-taking has boosted asset prices and led to a continued build-up in financial vulnerabilities such as lever-aged and liquidity and maturity mismatches These include rising corporate debt burdens increas-ing holdings of riskier and more illiquid assets by institutional investors and a growing reliance on external borrowing by emerging and frontier market economies Policymakers should address corporate vulnerabilities with stricter supervisory and macroprudential oversight tackle risks among institutional investors through strengthened over-sight and disclosures and implement prudent sov-ereign debt management practices and frameworks Macroprudential toolkits should be expanded as needed to address vulnerabilities outside the banking sector In economies where activity is still robust financial conditions are still easy and finan-cial vulnerabilities are high or rising policymakers should urgently tighten macroprudential policies including broad-based tools (such as countercycli-cal capital buffers) to increase financial systemsrsquo resilience In economies where macroeconomic policies are being eased but where vulnerabilities are still a concern policymakers should use a more
targeted approach to address vulnerabilities in specific sectors
Directors noted that emerging market and devel-oping economies need to enhance resilience with an appropriate mix of fiscal monetary exchange rate and macroprudential policies Many countries can strengthen institutions governance and policy frameworks to bolster their growth prospects and resilience
Directors urged low-income developing economies to enact policies aimed at lifting potential growth improving inclusiveness and combating challenges that hinder progress toward the 2030 Sustainable Development Goals Priorities include strengthen-ing monetary and macroprudential policy frame-works and ensuring that fiscal policy is in line with debt sustainability importantly through building tax capacity while protecting measures that help the vulnerable Complementarity among domestic revenues official assistance and private financing is essential for success As low-income countries are significantly impacted by climate change investing in disaster readiness and climate-smart infrastructure will be key Commodity exporters need to continue diversifying their economies through policies that improve education quality narrow infrastructure gaps enhance financial inclusion and boost private investment
Directors welcomed the call to action on climate change mitigation and the recommendations for fis-cal policy in the Fiscal Monitor Directors agreed that carbon taxation or similar pricing is a highly effective tool for reducing emissions as a part of a compre-hensive strategy including productive and equitable use of revenues and supportive measures for clean technology investment Directors also emphasized that alternative approaches such as feebates and regulations may be appropriate depending on coun-try circumstances Directors recognized that current mitigation pledges fall well short of what is needed for the Paris Agreementrsquos temperature stabilization goals and welcomed staff rsquos proposal for an interna-tional carbon price floor arrangement to scale up global mitigation ambition
Highlights from IMF Publications
BookstoreIMForg
$30 English PaperbackISBN 978-1-48432-594-0 imfbkst24708
$25 English PaperbackISBN 978-1-51355-890-5 imfbkst23550
$30 English PaperbackISBN 978-1-48433-974-9 imfbkst24306
$25 English PaperbackISBN 978-1-48435-384-4 imfbkst25145
$40 English PaperbackISBN 978-1-48437-2-142 imfbkst25402
$29 annual subscription fee Free to developing countriesEnglish ISSN 978-1-49831-651-4imfbkst26081
- 21107_Ch 00 FM_Web
- 21107_Ch 01_Web
- 21107_Ch 02_Web
- 21107_Ch 03_Web
- 21107_Ch 04_StatAppIntro_Web
- 21107_Ch 04a_WEO_StatApp_Tables_A01-A15_Web
- 21107_Ch 05_SelTopics_Web
- 21107_Ch 06_Board Discussion_Ad_Web
-