The Urban Land Institute – Charlotte District Council ...
63
Lake Norman Economic Development Corporation Exit 27 Study The Urban Land Institute – Charlotte District Council Technical Assistance Panel Report Cornelius, NC | June 2015
Transcript of The Urban Land Institute – Charlotte District Council ...

ULI View South
12/30/2009
Lake Norman Economic Development Corporation
Exit 27 Study
The Urban Land Institute – Charlotte District CouncilTechnical Assistance Panel Report
Cornelius, NC | June 2015

The Urban Land Institute – Charlotte District Council
Technical Assistance Panel Report
Lake Norman Economic DevelopmentCorporation Exit 27 Study
June 2015 | Cornelius, NC
Table of Contents
Introduction . . . . . . . . . . . . . . . . . . . . . . . . . . . . . . . . . . . . . . . . . . . . . . . . . . . . . . . . . . . . page 4• ULI – The Urban Land Institute• ULI Charlotte• Client/Sponsor
Technical Assistance Panel Program . . . . . . . . . . . . . . . . . . . . . . . . . . . . . . . . . . . . . . . . . page 5• Objective• Program Description• Acknowledgements• Stakeholder Interviews
Executive Summary . . . . . . . . . . . . . . . . . . . . . . . . . . . . . . . . . . . . . . . . . . . . . . . . . . . . . . .page 8• Overall Thoughts and Observations of the Panel• Panel Recommendations
Technical Assistance Panel Program Report . . . . . . . . . . . . . . . . . . . . . . . . . . . . . . . . . . page 10• Key Issues and Assignment• The Panel Process• Background/Profile
Key Issues . . . . . . . . . . . . . . . . . . . . . . . . . . . . . . . . . . . . . . . . . . . . . . . . . . . . . . . . . . . . . page 14• Roads/Connectivity• Economic Development• Properties/Uses
Panel Observations & Recommendations . . . . . . . . . . . . . . . . . . . . . . . . . . . . . . . . . . . . page 16• Transportation/Access• Land Use and Development
Summary & Conclusion . . . . . . . . . . . . . . . . . . . . . . . . . . . . . . . . . . . . . . . . . . . . . . . . . . page 24
Appendix . . . . . . . . . . . . . . . . . . . . . . . . . . . . . . . . . . . . . . . . . . . . . . . . . . . . . . . . . . . . . page 26• Panelist Biographical Sketches• Renderings and Photographs• Market Data
1) Page 3Exit 27 Study, Cornelius, NC, June 3-4, 2015

Introduction
ULI - The Urban Land Institute
The Urban Land Institute (ULI) was established in 1936 and has more than 34,000 members from more than 80 countries. ULI is one of America’s most respected sources of information and knowledge on urban planning, growth and development.
ULI is a nonprofit research and educational organization.
Our mission is to provide leadership in the responsible use of land and in creating and sustaining thriving communities worldwide.
To encourage an open exchange of ideas and sharing of experiences, ULI membership crosses a variety of backgrounds and professions representing the entire spectrum of land use and development disciplines in private enterprise and public service. Among the members are developers, builders, property owners, investors, architects, public officials, planners, brokers, appraisers, attorneys, engineers, financiers, academics, and students.
ULI Charlotte
ULI Charlotte is a District Council of the Urban Land Institute. The District Council offers ULI services and benefits at a regional level. The mission of ULI Charlotte is to complete the ULI experience at a local and regional level through education, research and the exchange of ideas and experiences.
One of the services provided by ULI Charlotte is the Technical Assistance Panel (TAP) program. TAP panelists are volunteer members who seek to further the objectives of ULI and make authoritative information available to those seeking knowledge regarding the long-term use of urban land.
Client/Sponsor
ULI Charlotte was engaged by the Lake Norman Economic Development Corporation (LNEDC), which is responsible for the development and implementation of the economic development strategies for the towns of Cornelius, Davidson and Huntersville. These strategies are focused on improving the quality of life for the region’s residents through the expansion of the tax base by attracting new capital investment and creating new, highly-skilled jobs for the regions residents.
Page 4 A Technical Assistance Panel Program Report

Objective
The Technical Assistance Panel (TAP) program is offered by ULI Charlotte to provide local municipalities and community-based nonprofits objective and responsible advice on land-use planning, development and redevelopment issues.
Program Description
The District Council TAP is a service offered as part of ULI’s National Advisory Services program. Since 1947, the Advisory Services program assists communities by bringing together real estate, planning and development experts to provide unbiased, pragmatic advice for addressing complex land-use planning and development issues.
The ULI Charlotte TAP program provides similar services to local governments, private developers, community development corporations, and many other organizations. Once a project is designated for a TAP, ULI Charlotte’s District Council assembles a panel of volunteers with expertise in areas that are necessary to focus on the sponsor’s particular problem or issues
Because of the District Council members’ diverse expertise, a broad array of issues can be evaluated. Members’ expertise is available on commercial retail, office, industrial, residential, and mixed land uses in a multiplicity of urban forms.
Under ideal circumstances, a TAP will focus on issues surrounding a particular site. The scope of the analysis is intended to benefit a specific site in a neighborhood or community. Analysis will typically be organized around defining site characteristics and limitations, identifying and assessing community and neighborhood goals, considering alternative land-use strategies in the context of preliminary feasibility analysis, and making recommendations for next steps.
The sponsoring organization is responsible for gathering the background information necessary to understand the project, and presenting it to the panel. TAP members typically spend a day and a half developing an understanding of the problem, coming up with recommendations, and presenting those findings and recommendations to the sponsoring organization.
Technical Assistance Panel Program
Page 5Exit 27 Study, Cornelius, NC, June 3-4, 2015

ULI Charlotte’s TAP Committee is chaired by Alysia Osborne, City of Charlotte Planning Department. The committee is responsible for the marketing, review and implementation of the Technical Assistance Panels.
TAP Panelists
Members of ULI were selected to provide a wide variety of experiences. The panelists for the Lake Norman Economic Development Corporation Exit 27 Study TAP included:
Program Support/Management
Theresa SalmenProgram Manager
District Council Executive DirectorULI Charlotte
C . Grant JacksonTechnical Writer
PrincipalGrantJax Communications
Technical Assistance Panel ProgramAcknowledgements
Committee Chair
Panel Chair
Kathleen Rose, CCIM, CREReal Estate and EconomicDevelopment Consultant
President Rose & Associates Southeast, Inc.
Panelists
Hal B . KempsonCommercial Mortgage Broker
First Vice PresidentCBRE Capital Markets
Randy E . Goddard, PETraffic Engineer
Managing PrincipalDesign Resource Group.
Keith H . MacVeanLand Use Consultant
Land Use & Zoning ConsultantMoore & VanAllen
Ed McKinneyPlanner
Interim Planning DirectorCharlotte-Mecklenburg Planning Department
Page 6 A Technical Assistance Panel Program Report

On June 3 and 4, 2015, the panel interviewed representatives of the sponsor and property owners and other stakeholders involved in the project. Invitations to stakeholders were extended and arranged through the sponsor. Of those invited, 17 individuals met with ULI panelists either in person or via conference call. Interviewees included government officials, property owners and representatives, economic development and tourism officials, business executives and community leaders. The following individuals participated in the interviews:
• SallyAshworth Executive Director Visit Lake Norman
• JoeCooke Property Owner Cooke Farms
• JimDuke Commissioner Cornelius Board of Commissioners
• JeffEdge Economic Developer Charlotte Chamber of Commerce
• BradyFinklea Consultant Kimley-Horn
• TeresaGresham Consultant Kimley-Horn
• MikeGriffin Business Executive Griffin Brothers Companies
• LeslieHardwick Economic Development Coordinator Lake Norman Economic Development Corporation
• ScottHerr Property Owners Representative M/I Homes representing Cooke Farms
• WayneHerron Planning Director Town of Cornelius
• KevinMahl Business Executive Champion Tire & Wheel/Legacy Point Properties
Stakeholder Interviews
• RyanMcDaniels Executive Director Lake Norman Economic Development Corporation
• SkipNotte Consultant Dewberry Engineering
• JamieRolewicz Business Executive Champion Tire & Wheel/Legacy Point Properties
• ThurmanRoss Commissioner Cornelius Board of Commissioners
• LauraTemple Business Executive Champion Tire & Wheel/Legacy Point Properties
• BruceTrimbur Commissioner Cornelius Board of Commissioners
• WoodyWasham Mayor Pro-Tem Town of Cornelius
• MarshallWilliamson Consultant Lincoln & Harris
• PeterZeiler Economic Developer Mecklenburg County
Page 7Exit 27 Study, Cornelius, NC, June 3-4, 2015

Executive Summary
ULI Charlotte was engaged to provide a Technical Assistance Panel (TAP) to the Lake Norman Economic Development Corporation (LNEDC) to examine land use opportunities in the Town of Cornelius related to a proposed interchange on interstate 77 at Exit 27. The panel was charged with answering four questions:
1. What is the appropriate land use to justify the interchange at Westmoreland Road and what would the density of the sites need to be?
2. Would this site support a hotel and conference center?
3. How do the current transportation plans aide in the development of the site?
4. How does this affect the adjacent land uses(s)?
On June 3 and 4, 2015, a one-and-a-half day ULI TAP was conducted with a panel of experts that consisted of real estate and land use consultants, a professional land planner, traffic engineer, and a commercial mortgage banker. The team was briefed by LNEDC and Town of Cornelius officials, toured the study area, and interviewed relevant stakeholders before discussing and developing recommendations. At the end of the second day, the panel made a brief presentation on its findings.
Overall Thoughts and Observations of the Panel
The major challenge the panel faced was determining what comes first: the land use issue or the transportation issue. The first question posed by the sponsor, LNEDC, was:
What is the appropriate land use to justify the interchange at Westmoreland Road and would the density on the sites need to be?
After the sponsor’s briefing, touring the study area and listening to stakeholders, the panel came to a pretty quick and clear understanding that the most critical issue to address was transportation. Without a plan for appropriate interstate access, the land use question could not be adequately addressed.
The sponsor requested a study of appropriate land use to justify a planned Exit 27 interchange at Westmoreland Road. However, the panelists concluded that while a new Exit 27 interchange is essential to unlocking the commercial development potential of the study area, a traditional single-point urban interchange at Westmoreland Road will not serve the best interests of all parties involved. The panel feels the Westmoreland Road interchange design and location presents a number of limitations and issues.
The panel wanted to create something better, in essence a “better mousetrap.” The panel is suggesting, as a better alternative, the creation of the Cornelius “Square” Interchange or “Counterchange.”
Page 8 A Technical Assistance Panel Program Report

Executive Summary Executive Summary
Panel Recommendations
Transportation / Access
The panel proposed the evaluation of an alternative interchange design that maximizes the economic development vision of the Town while strengthening regional connectivity and access. This interchange concept creates a square design formed by the on/off ramps and new streets that connect to a new bridge over I-77. The on/off ramps would be located as far north as possible, to maximize the distance from the Sam Furr Interchange to the south. Ramps would terminate in roundabouts that allow free-flowing access to and from the interstate while seamlessly connecting to the existing (and future) local street network. The design provides access to Westmoreland Road without concentrating traffic on this existing corridor. It also connects a new bridge with a realignment of Bailey Road creating a valuable east-west corridor.
The Cornelius “Square” Interchange or “Counterchange” could create a signature gateway to the community.
A similar design was used in 2011 in Gloucester Township, N.J., for an interchange on N.J. State Route 42, a limited access highway that runs from Philadelphia to Atlantic City (see Appendix).
Land Use and Development
Solving the transportation access issue goes directly to the concept of land use. The new interchange would present opportunities to maximize land use in the study area to meet Cornelius’ goals for creating significant economic development impact in a manner consistent with the town’s vision and goals. Based on the new interchange recommendation, the panel foresees the development of an east/west village anchored by employment with opportunities to include large office headquarters with potential
for expansion with structured parking facilities, a full-service hotel with expansion capabilities, supportive retail (restaurants, small scale retail shops, entertainment) and housing.
Office
The panel feels that with the new interchange at Exit 27, the study area could support an additional 1.2 million square feet of headquarters office space. At 200 square feet per employee this equates to 6,000 new daytime employees.
Hotel/Conference Center
The panel is confident that new office development will in turn drive demand for a desired full-service hotel and conference center with 20,000 square feet of meeting space (expandable) and 225+ sleeping rooms. But a hotel market study to test feasibility of a full-service hotel conference center for underwriting, should be undertaken.
Retail
The expansion of daytime population as a result of the panel’s recommendations will add some 6,000 employees to the current daytime population of 86,265 employees within a 15 -minute drive-time. This, together with the added visitors as a result of a hotel/conference center component, begins to make the argument for additional retail space totaling approximately 150,000 - 200,000 square feet, to include shopping, restaurants and entertainment.
Housing
Additional job growth will also result in demand for additional housing. Based upon this growth, an estimated 450-550 additional housing units could be considered. This includes a variety of housing options to serve the expanding workforce.
Page 9Exit 27 Study, Cornelius, NC, June 3-4, 2015

Key Issues and Assignment
The ULI Charlotte District Council was asked by the Lake Norman Economic Development Corporation, to study the land area around US 21/Statesville Road and Westmoreland Road in Cornelius, NC, for the development of a potential Exit 27 interchange off I-77 at Westmoreland Road. The timing of the project is critical with the expansion of I-77 by an additional two lanes on the north and south corridors set to take place in the near future. In addition, the Town of Cornelius has received bonus allocation money for the widening of US 21/Statesville Road. The road, a major north-south corridor, will be widened to four lanes.
The study area, which encompasses 339 acres within the boundaries of the Town of Cornelius, is accessible from US 21/ Statesville Road on the east and from Westmoreland Road on the west. I-77 runs through the middle of the study area.
The largest tracts of undeveloped land are south of Westmoreland Road on either side of I-77:
• FormerAugustaleeSite – This 104-acre tract is located east of I-77. Access to the site is available from Statesville Road. The site is owned by local business owners in the Town of Cornelius.
• CookeSite – This tract is approximately 81 acres. The land is located to the west of I-77. The site is landlocked, bordered largely by residential developments. The property is owned by the Cooke Family of Union, NC.
Technical Assistance Panel Report
Aerial view of the TAP study area looking south: US 21/Statesville Road andWestmoreland Road in Cornelius, NC
ULI North View
01/16/2014
Page 10 A Technical Assistance Panel Program Report

The panel was asked by Lake Norman Economic Development Corporation to address four questions:
1. What is the appropriate land use to justify the interchange at Westmoreland Road and what would the density of the sites need to be?
2. Would this site support a hotel and conference center?
3. How do the current transportation plans aide in the development of the site?
4. How does this affect the adjacent land uses(s)?
The Panel Process
Sponsor Presentation
The TAP panelists assembled at Town Hall in Cornelius on Wednesday, June 3, 2015, for a presentation by the TAP sponsor. The presentation was made by the Lake Norman Economic Development Corporation Executive Director Ryan McDaniels, Town of Cornelius Planning Director Wayne Herron, and the Lake Norman Economic Development Corporation Economic Development Coordinator Leslie Hardwick.
Tour of Study Area
Following the sponsor presentation, TAP panelists toured the 339-acre study area, including the former Augustalee and Cooke Family Sites, as well as two areas of interest – 69 acres of old farm land to the north of Westmoreland Road near the Cooke Site and 89 acres in the Bailey Road area to the southeast of the study area.
Stakeholder Interviews
On the morning of June 4, panelists met with community stakeholders including elected officials, business and property owners, tourism officials and developers.
Panel Deliberations
After a follow-up session with the TAP sponsor, the panel held an afternoon working session during which panelists reviewed the significant findings, addressed the focus areas, identified opportunities and challenges, developed recommendations and prepared a PowerPoint presentation that addressed the questions posed by the sponsor, the Lake Norman Economic Development Corporation.
Presentation
The panel presented an overview of its findings and recommendations on Thursday, June 4, in an open session to the TAP sponsor and interested stakeholders in the Cornelius Town Hall. Panelists then took questions and comments.
Report Preparation and Release
The TAP report was prepared, under the leader-ship of ULI Charlotte, and offers a summary of the activities during the program key findings and panel recommendations.
Technical Assistance Panel Report
Page 11Exit 27 Study, Cornelius, NC, June 3-4, 2015

Background/ Profile
Located just 15 minutes from Uptown Charlotte, North Carolina’s Lake Norman region is a high-growth area of North Mecklenburg County lying along Interstate 77 and encompassing the towns of Huntersville, Cornelius and Davidson. The 32,500-acre hydroelectric Lake Norman, cre-ated in the 1960’s, is a huge regional draw and has driven residential development in the area creating a live, work, play atmosphere. The Lake Norman Economic Development Corporation (LNEDC) was formed to lead development and the implementation of economic development strategy for the towns of Cornelius, Davidson and Huntersville. LNEDC is charged with developing strategies that “will result in improving the quality of life for the region’s residents through the ex-pansion of the tax base by attracting new capital investment and creating new, highly skilled jobs for the region’s residents.”
Officials acknowledge that Huntersville has become the dominant economic draw for the region, but efforts are underway to do more for Cornelius. However, those efforts are hampered by the lack of available product. Using a market-ing analogy, one stakeholder said, “We have a lot of people coming through our store, but our shelves are bare. So we need buildings, we need quality products to help market.” The study area is viewed as important for the future growth of the entire corridor, especially to the Town of Cornelius. Like the Town of Davidson, Cornelius only has one exit off the interstate and stakehold-ers feel now is the time to consider options for additional access from 1-77.
Cornelius experienced tremendous growth between 2000 and 2010, more than doubling in population from 11,969 to 24,866, according to the US Census Bureau. With growth continuing, the NC Office of State Budget and Management estimated that as of July 1, 2013, the population had grown to 27,655.
But Cornelius has experienced relatively little non-residential growth over the years. According to officials, Cornelius has a $5-billion tax base, which is good for a town of just 15 square miles, but an estimated 80% of that tax base is residen-tial. While Cornelius is an affluent town, there are limited opportunities for non-residential growth.
The lack of taxable commercial property makes the study area vitally important for non-residential growth. According to estimates, only about 600 acres of developable land remains inside the town’s boundaries. The study area accounts for more than half of that acreage.
Technical Assistance Panel Report
Page 12 A Technical Assistance Panel Program Report

Technical Assistance Panel Report
Both the former Augustalee and the Cooke Sites have been studied previously and proposed for development. There are current approved master plans for both sites (see Appendix).
The former Augustalee Site is approximately 104 acres to the east of Interstate 77 along US 21/Statesville Road, and is accessible from the inter-state. The undeveloped site was once envisioned as a $515-million development with residential, retail, office and hotel possibilities, but went into foreclosure in 2009. It was purchased by a group of businessmen who live in the region and is again being considered for development. But ac-cess via a new Exit 27 off I-77 at Westmoreland Road has always been considered key to its suc-cess. The Town of Cornelius and the new owners have engaged design consulting firm Kimley-Horn to do an Interchange Justification Report (IJR) for the proposed new exit.
The Cooke Site, approximately 81 acres to the west of I-77, has also been studied and marketed by the Cooke Family for commercial use as a
business campus but without success and the area remains undeveloped. The site is landlocked with current access through a residential area and is bordered by other existing residential areas, a park and an existing greenway. The Cooke Family is currently studying, developing and marketing the property for additional single-family residential development. The family has been told by devel-opers that without interstate access, the property is not viable for commercial development.
Interstate access is key for commercial devel-opment of both the former Augustalee and the Cooke Sites. In addition, access is also an issue for the two “areas of interest” included in the study: 69 acres of old farm land to the north of Westmoreland Road and 89 acres in the Bailey Road area to the southeast of the study area.
Site, real estate and demographic data were reviewed to inform the panel members of the dynamics of this study area (see Appendix).
Page 13Exit 27 Study, Cornelius, NC, June 3-4, 2015

Key Issues
Following a briefing by LNEDC and a tour of the study area, the panel interviewed key stakeholders during two sessions. The panelists identified several key issues with direct relevance to the questions posed for the TAP.
Roads/Connectivity
The issue of roads and connectivity was of paramount importance to nearly all the stakeholders interviewed. Key in the discussion was the creation of a new Exit 27 interchange off I-77 at Westmoreland Road. Public stakeholders were unanimous in their desire for the interchange.
The interchange was viewed by several stakeholders as not only key to accessing the former Augustalee and the Cooke Sites, but also important to opening up other potential commercial corridors, including the 89 acres in the Bailey Road Area of Interest. One stakeholder noted the “importance of getting the Bailey Road connection right.”
Stakeholders connected to the Cooke Site said that lack of access to the interstate had been cited as a reason why the site did not have great potential for commercial development. One stakeholder expressed the opinion that even with an interchange at Westmoreland Road, the site would not be attractive to commercial developers.
Economic Development
Economic developers and town officials are concerned about Cornelius’ imbalance between commercial and residential growth and the impact on the town’s tax base. Officials want to see greater commercial growth to lighten the residential tax load, as well as provide opportunities for jobs. Because of the small amount of developable land available, doing development right on both the former Augustalee and the Cooke Sites is critical. One stakeholder said, “We need to make sure we get the most bang for the buck.” Another said, “We want to create the best tax base for our community.”
An economic development stakeholder said, “We need product up here. One of the challenges we have in trying to convince companies to come up here is there is just nothing. There is land, but that land isn’t ready for development.”
Roads/ConnectivityKeyPoints:
• Create better direct access to I-77• Provide access to the Cooke and
former Augustalee Sites• Address support/objections to
interchange at Westmoreland• Consider traffic impacts on auxiliary
roads• Improve connectivity to Bailey Road• Address concerns of a super-street
network on Catawba Avenue
EconomicDevelopmentKeyPoints:
• Create product for economic developers
• Increase employment opportunities in the area
• Optimize the remaining 600 ± acres of contiguous land available in Cornelius
• Balance the town’s tax base
Page 14 A Technical Assistance Panel Program Report

Properties/Uses
Given that an estimated 80% of Cornelius’ tax base is residential, public officials are eager to maximize commercial development in the area. The town’s goal is to have live, work and play, but one official said, “We don’t have the work yet.”
The former Augustalee Site was viewed by stakeholders as the best hope for significant commercial development, but several stakeholders also would like to see commercial on the Cooke Site. Some stakeholders did express concern over the Cooke Site’s proximity to residential development, Robbins Park and a municipal greenway as well as a stream and adjacent protected wetlands.
One of the principal uses that the panel was asked to consider was whether property in the study area could support development of a hotel/convention center. Stakeholders noted that the area currently has 1,600 sleeping room in the three Lake Norman communities, but there is not a full-service conference hotel, much less a convention center. Officials say they do receive calls and requests for a full-service hotel with meeting space, and the area is seeing an increase in both occupancy and room rates.
Properties/UsesKeyPoints:
• Consider wetlands when addressing the Cooke Site
• Determine the viability of the Cooke Site for commercial uses
• Maximize commercial use• Create Class A office products• Ponder market demand for full-service
hotel and conference center• Incorporate greenway connectivity• Create a live/work community – sense
of place important• Incorporate a town center concept
Key Issues
Page 15Exit 27 Study, Cornelius, NC, June 3-4, 2015

The major challenge the panel faced was determining which comes first: the land use or transportation. The first question posed by the sponsor, LNEDC was:
“What is the appropriate land use to justify the interchange at Westmoreland Road and what would the density on the sites need to be?”
The dominate issue is how to maximize land use, which really speaks to the transportation side of the two-sided coin. The panel came to a pretty quick and clear understanding that the most critical issue to address first was transportation. Without a plan for appropriate interstate access the land use question could not be adequately addressed.
While the sponsor requested a study of appropriate land use to justify a planned Exit 27 Westmoreland single-point urban interchange (SPUI), the panel does not believe a traditional interchange at Westmoreland is the answer to maximizing land use in the study area. The panel wanted to create something better; in essence, a “better mousetrap.” The panel is suggesting the Cornelius “Square” Interchange or Counterchange.
Westmoreland Road “SPUI” Interchange
Following the sponsor’s briefing, a tour of the study area, input from stakeholders and deliberations, panelists concluded that while a new Exit 27 interchange is essential to
unlocking the commercial development potential of the study area, a traditional interchange at Westmoreland Road will not serve the best interests of all parties involved.
The panel feels the Westmoreland Road interchange design and location presents a number of limitations and issues. This interchange would:
• Impact McDowell Creek and limit the extension of the McDowell Creek Greenway north of Westmoreland Road.
• Concentrate traffic on Westmoreland Road, significantly impacting the Statesville Road/Westmoreland intersection and Washam Potts Road.
• Provide development potential only to the east, concentrated along Statesville Road south.
• Foster long-term redevelopment of existing low density commercial uses along Westmoreland Road between the interchange and Statesville Road.
Panel Observations & Recommendations
Cross section of Westmoreland Road
Transportation / Access
Page 16 A Technical Assistance Panel Program Report

Panel Observations & Recommendations
RECOMMENDATION #1: Create the Cornelius “Square” Interchange or Counterchange
The panel proposes the evaluation of an alternative interchange design that maximizes the economic development vision of the Town of Cornelius while strengthening regional connectivity and access. This interchange concept creates a square design formed by the on/off ramps and new streets that connect to a new bridge over I-77. The on/off ramps would be located as far north as possible to maximize the distance from the Sam Furr Interchange to the south. Ramps would terminate in roundabouts that allow free-flowing access to and from the
interstate while seamlessly connecting to the existing (and future) local street network. The design provides access to Westmoreland Road without concentrating traffic on this existing corridor. It also connects a new bridge with a realignment of Bailey Road, creating a valuable east-west corridor.
The Cornelius “Square” Interchange or Counterchange could create a signature gateway to the community. A similar design was used in 2011 in Gloucester Township, N.J., for an interchange on N.J. State Route 42, a limited access highway that runs from Philadelphia to Atlantic City. (See the Appendix for images)
Panel Observations & Recommendations
Rendering of the Cornelius “Square” Interchange or Counterchange(see Appendix for larger image)
Page 17Exit 27 Study, Cornelius, NC, June 3-4, 2015

Rationale:
• Creates a new vision for the develop-ments that is not hampered by present land uses along Westmoreland, creating a new and desirable address for busi-nesses.
• Differentiates the interchange from others along the North Mecklenburg/I-77 corridor.
• Incorporates better distribution of traffic for east/west access.
• Creates better east/west connectivity.• Develops a better sense of place.• Maximizes greenway and I-77 frontage.• Makes a unique statement for both sides
of the interstate.• Reduces backups on ramps on I-77.• Creates a sense of “arrival.”• Gives both the east and west ramp/
roundabouts identity.• Requires minimal right-of-way.• Requires significantly less funding than
the present STIP cost estimate.
Benefits:
Connectivity:• Provides access to Westmoreland Road
without concentrating traffic on this existing corridor.
• Provides a new east-west bridge that improves connectivity while still separated from the interchange ramps.
• Connects a new bridge with a
realignment of Bailey Road creating a valuable east-west corridor from West Catawba Avenue to Old Statesville Road that parallels Westmoreland Road.
• Connects new ramps directly to (2) north-south corridors (Statesville Road & future Northcross Drive) which maximizes traffic distribution.
Constructability&Cost:• Avoids environmental impacts to
McDowell Creek.• Does not require rebuilding the existing
Westmoreland Road Bridge, avoiding maintenance-of-traffic issues during construction and the cost of replacing an existing bridge.
• Utilizes a new, smaller bridge (no ramps, signals, turn lanes, etc.) built in a undeveloped location making it easier and less costly to construct.
• Creates a significant potential to negotiate the dedication of necessary rights-of-way (and even interchange cost) with large landowners on each side due to the impact of increased development value of the interchange.
Panel Observations & Recommendations
Page 18 A Technical Assistance Panel Program Report

Panel Observations & Recommendations
Solving the transportation access issue goes directly to the concept of land use. The new interchange would present opportunities to maximize land use in the study area to meet Cornelius’ goals for creating significant economic development impact in a manner consistent with the town’s vision and goals.
RECOMMENDATION #2: Rethink land use around new interchange
Overall, the interchange design and block structure creates a series of flexible development blocks. This block structure could be maximized and development “street-oriented” with parking (both surface lots and potential parking structures) located in the middle of the block. The resulting development form will create a uniquely walkable place with significant regional transportation access.
Benefits:
LandUse&Development:The Cornelius “Square” Interchange design opens up the development potential on both sides of the interstate with shared access to the interchange.• Ramp design integrated into development
sites allows future development to create a unique and controlled development “address.”
• Overall design allows development to be organized on a regular pattern of streets and blocks that provide vehicular access to the interchange while ensuring a walkable scale to the street design and block structure.
• New bridge and extension of Bailey Road creates a valuable multi-modal connection between the McDowell Greenway/Westmoreland Regional Park (on the west) and Caldwell Station Creek Greenway (on the east). The new bridge and Bailey Road extension should be designed with ample pedestrian and bicycle facilities that could incorporate a multi-use trail.
InterstateFrontage:• Development blocks along I-77 would
provide valuable office locations with high interstate visibility and access.
• Office development on both sides of the interstate would create a signature employment address appropriate for potential headquarter locations.
• A frontage road parallel to the interstate would provide vehicular and services access to development sites and could connect directly to potential lower-level parking structures. The new east-west bridge should be designed to allow the frontage road to pass under the bridge and maximize access to the higher intensity office uses.
Panel Observations & Recommendations
Rendering of the potential land use with the Cornelius “Square”
Interchange design(see Appendix for larger image)
Land Use and Development
Page 19Exit 27 Study, Cornelius, NC, June 3-4, 2015

Panel Observations & Recommendations
CookeSite:• Extension of Northcross Drive should be
located through the middle of the site in order to maximize access and connect with the extension of Bailey Road (via new east-west bridge).
• Development west of Northcross Drive should include a mix of single family and multi-family residential that can take advantage of the McDowell Greenway access and frontage.
• Development east of Northcross Drive should include office development that can take advantage of interstate access and visibility.
• Development at the intersection of Northcross Drive and Bailey Road extension should include a potential mixed-use retail node linking the residential and office development with retail services that can serve future residents and employees.
FormerAugustaleeSite:• Provides a central north-south street
that connects from Westmoreland Road to the interchange roundabout and the extension of Bailey Road with office development oriented along the interstate.
• Extends the interchange ramps to Statesville Road to create the site’s signature address with office and hotel development potential along the interstate, transitioning to a retail node centered on the block between the roundabout and Statesville Road.
• Allows for mixed-use development oriented along Statesville Road to include a mix of multi-family residential and commercial development that transitions to the single-family neighborhoods to the east.
BaileyRoadCorridor:• Extension of Bailey Road provides
interstate access and east-west connectivity to West Catawba Avenue, opening up development potential on Bailey Road east of Statesville Road.
• Development at Bailey Road and Statesville Road should include a mix of residential, office, and commercial uses.
• Farther east on Bailey Road development should include additional industrial and flex office uses.
Page 20 A Technical Assistance Panel Program Report

Panel Observations & Recommendations Panel Observations & Recommendations
RECOMMENDATION #3: Consider and evaluate development potential
Based on the new interchange recommendation, the panel foresees the development of an east/west village anchored by employment with the following land use opportunities:
• On the east side, a village center anchored by employment uses including: » Large office headquarters with potential
for expansion with structured parking facilities
» Full-service hotel with expansion capabilities
» Supportive retail uses (restaurants, small scale retail shops, entertainment)
» Housing multi-family, townhomes and small lot single-family
• On the west side, land uses would also include a Village Center with: » Office » Retail » Residential (single-family, multifamily)
uses (as determined by parcel configuration)
Rationale:Commercial uses on both sides of I-77 are:• Maximized• More Saleable• More Financially Feasible• Easier to Visualize and Implement
Office
The panel feels that with the new interchange at Exit 27, the study area could support an additional 1.2-million square feet of headquarters office space. At 200 square feet per employee this equates to 6,000 new daytime employees.
Considerations should include:• 3-4 story buildings• Surface parking• Flex and medical office buildings
Commercial uses on both sides of I-77 would create visibility, which would be a plus in attracting corporate users. In addition, new entrances to both the former Augustalee and Cooke Sites would allow developers to create their own entrances into the property.
More importantly, a new entrance could also accommodate additional commercial uses for the Cooke family property, unlocking its potential.
Hotel/Conference Center
The panel is confident that new office development will, in turn, drive demand for a desired full-service hotel and conference center with 20,000 square feet of meeting space (expandable) and 225+ sleeping rooms. However, a hotel market study to test feasibility of a full-service hotel conference center for underwriting, should be undertaken.
Page 21Exit 27 Study, Cornelius, NC, June 3-4, 2015

Retail
The expansion of daytime population as a result of the panel’s recommendations will add some 6,000 employees to the current daytime population of 86,265 employees within a 15-minute drive-time. This, together with the added visitors as a result of a hotel/conference center component, begins to make the argument for additional retail space totaling approximately 150,000 – 200,000 square feet, to include shopping, restaurants and entertainment.
The demand for retail is driven by population and income growth, resulting from a strong job market (office/industrial). The current population within a 15-minute drive-time of the Westmoreland/US 21 interchange, appears to offer limited opportunities for any substantial addition of retail inventory. The 2015 estimated population within this drive time is 128,626 serving 50,350 households, creating $1,985,937,670 in total retail demand. Current estimates grow this to 144,857 serving 56,945 households by 2020, a 13% increase.
The existing retail supply along the I-77 corridor, includes primary regional shopping centers at Exit 25 – both east and west -- with Birkdale Village and Northcross Shopping Center, totaling more than 1 million square feet, and local shopping centers along Catawba Avenue, including new
grocery anchored centers at Antiquity to the east and the expansion/renovation of Publix to the west. Together the current supply results in approximately $2,168,859,070 of total retail sales – which suggests a negative retail gap. However, this also indicates retail sales being driven by customers visiting or coming from outside the area. Retail vacancy in the north submarket is currently 5.5%, according to Colliers International 1st quarter 2015 report, which points to an improving trend and recovery of retail in the Lake Norman area.
Panel Observations & Recommendations
RetailKeyPoints
• 2015 estimated population within a 15-minute drive time is 128,626 for 2015 and 144,857 for 2020
• Expansion of daytime population will add an estimated 6,000 employees
• Annual retail sales are $2,168,859,070• Negative retail gap driven by oversupply
and customers coming from outside the trade area
• Vacancy in the north submarket is 5.5%• Existing supply totals over 1 million
square feet
Page 22 A Technical Assistance Panel Program Report

Panel Observations & Recommendations
Housing
Additional job growth will also result in demand for additional housing. Based upon this growth, an estimated 450-550 additional housing units could be considered. This includes a variety of housing options to serve the expanding workforce.
The primary generational cohort within the current drive-time is Millennials (18-36), which is also the primary workforce for the next decade. The next group, Generation X (37-49), includes families. Demand for housing is directly reflected in these groups’ lifestyle choices with a preference for walkable, mixed-use environments. The ULI Report: America in 2015 highlights the annual survey of views on housing, transportation and community. The report suggests that Millennials enjoy a more urban lifestyle, including rental and ownership of multifamily housing. Generation X, with growing families, enjoys an active lifestyle and prefers single family home ownership. Tapestry segmentation combines demographics with social and lifestyle issues to understand how and where people choose to live, work, shop
and recreate. The primary tapestry segments within a 15-minute drive time include Bright Young Professionals and Boomburbs, who together make up nearly 23% of the households- which includes both affluent and middle income categories. (See Appendix)
Panel Observations & Recommendations
HousingKeyPoints
• Additional job growth will result in demand for more housing
• Primary generational cohorts within 15-minute drive-time: » Millennials (18-36) the primary
workforce for the next decade » Generation X (37-49) with growing
families, who enjoy an active lifestyle and prefer single family homeownership.
Page 23Exit 27 Study, Cornelius, NC, June 3-4, 2015

The ULI Charlotte District Council was asked by Lake Norman Economic Development Corporation to study the land area around US 21/Statesville Road and Westmoreland Road in Cornelius, NC, for the development of a new Exit 27 interchange off I-77 at Westmoreland Road.
The timing of the project is critical with the expansion of I-77 by an additional two lanes on the north and south corridors, set to take place in the near future. Planning for an Exit 27 interchange at Westmoreland is already underway with land planning consultant Kimley-Horn’s Charlotte office undertaking an Interchange Justification Report. In addition, US 21/Statesville Road, a major north-south corridor, is to be widened to four lanes.
The Lake Norman Economic Development Corporation asked ULI Charlotte to answer four questions:
1. WhatistheappropriatelandusetojustifytheinterchangeatWestmorelandRoadandwhatdoesthedensityofthesitesneedtobe?
The panel believes that a traditional interchange at Westmoreland Road would not maximize the development potential of the study area. The panel recommends evaluation of a new Cornelius “Square” Interchange design. This new design, detailed
Summary & Conclusion
elsewhere in this report, would create greater accessibility, visibility and marketability for the major development sites – the Cooke and former Augustalee Sites – on both sides of the interstate, and address many traffic concerns.
NextSteps:
» The Town of Cornelius should incorporate and evaluate the Cornelius “Square” Interchange/Counterchange design as part of the current Interchange Justification Report analysis, including conceptual engineering and cost estimation.
» Coordinate and follow-up with key land owners of the former Augustalee and Cooke Sites to identify development strategies that protect the ability to incorporate the new interchange recommendation, while allowing initial development phases to occur (like residential away from the interstate).
» Consider alternative funding strategies and fiscal impact analysis. Is Tax Increment Financing (TIF) an opportunity?
The Exit 27 Study Panelists
Page 24 A Technical Assistance Panel Program Report

2. Wouldthissitesupportahotelandconferencecenter?
The panel believes that with the new interchange concept the site could support a full-service, conference center hotel. New office development will drive demand for a full-service hotel and conference center with 20,000 square feet of meeting space (expandable) and 225+ sleeping rooms.
NextStep:
» A full hotel market study should be undertaken to test the feasibility of a hotel and conference center. Financing institutions generally require an independently prepared market and financial feasibility study for the development of a new property. Companies that have done work with panelists in the past include. * TR Engel Group, LLC (Boston, MA) –
www.trengelgroup.com* CBRE Research/PKF Hospitality
Research (Atlanta, GA) – www.PKFC.com
3. Howdothecurrenttransportationplansaideinthedevelopmentofthesite?
The panel believes that the current plans for the Westmoreland Interchange really do not aide in development of the principal sites in the study area. The panel agrees with the 2014 report of The Mayors Institute on City Design that said don’t build the interchange as currently designed. The panel believes that the new interchange design can be coupled with a network of streets, including Catawba, to create a better alternative. This new design, creates greater accessibility, visibility and marketability for the major development sites and addresses many traffic concerns.
4. Howdoesthisaffecttheadjacentlanduses(s)?
The panel believes the new interchange option opens up and reestablishes the possibility for the Cooke Site to be used for commercial development. The current interchange (as currently designed) limits access for commercial use, particularly for the Cooke Site, which would otherwise be limited to predominately residential development. On the east side of the interstate, the plan creates a development package for the former Augustalee Site.
Final Observation The panel believes the new interchange could afford a significant branding opportunity for Cornelius. The plan provides the best chance to do something really exciting and visually compelling and to create significant development spaces. This is the best chance for Cornelius to get it right.
Summary & Conclusion
Page 25Exit 27 Study, Cornelius, NC, June 3-4, 2015

Page 26 A Technical Assistance Panel Program Report
AppendixTable of Contents
Panelist Biographical Sketches . . . . . . . . . . . . . . . . . . . . . . . . . . . . . . . . . . . . . . . . . . . . page 27• Kathleen Rose, CCIM, CRE• Randy E. Goddard, PE• Hal Kempson• Keith H. MacVean• Ed McKinney
Renderings and Photographs . . . . . . . . . . . . . . . . . . . . . . . . . . . . . . . . . . . . . . . . . . . . . page 29• ULI Study Area• Present Site Plans
» Former Augustalee Site Plan » Cooke Site Plan
• Proposed Cornelius “Square” Interchange or Counterchange• New Jersey Interchange (NJ Route 42 Interchange)• Potential Land Use with Cornelius “Square” Interchange Design
Market Data Reports . . . . . . . . . . . . . . . . . . . . . . . . . . . . . . . . . . . . . . . . . . . . . . . . . . . . page 35• Executive Summary• Retail Marketplace Profile• Tapestry Segmentation Reports
1)

AppendixPanelist Biographical Sketches
Kathleen Rose, CCIM, CREPresidentRose&AssociatesSoutheastInc.PanelChair
Kathleen Rose is president of Rose & Associates Southeast, Inc. in Davidson, NC, where she has combined decades of experience as a development expert and real estate analyst to build a unique
consulting practice, serving public, private and institutional clients and managing the analysis, planning and development of a wide range of real estate and economic development projects throughout the eastern United States.
Rose holds the Certified Commercial Investment Member (CCIM) designation of the Commercial Investment Real Estate Institute of the National Association of Realtors. She has served on the Institute’s faculty and as chair on a number of regional and national executive committees. She also holds the designation of Counselor of Real Estate (CRE), and is also a member of the International Economic Development Council (IEDC).
Rose serves on Advisory Services Panels for the Urban Land Institute (ULI), including the Daniel Rose Center for Public Policy and on the CRE Consulting Corp, publishing in numerous project documents. She is also a member of the International City/Council Management Association (ICMA), and its affiliate the Alliance for Innovation.
Her work in real estate, community and economic development resulted in recognition by Business Today as a top business woman in the Lake Norman region in 2010 and the Charlotte Business Journal as among the top 25 businesswomen in 2011.
Randy E . Goddard, PEManagingPrincipalDesignResourceGroup
Randy Goddard has more than 30 years of traffic engineering experience in both the public and private sectors. Goddard is a principal and manager of the traffic studio for Design Resource Group
in Charlotte, NC.
Prior to joining Design Resource Group, Goddard was the principal and office director for Kubilins Transportation Group in Charlotte. While at Kubilins he was responsible for managing the engineering staff and has overseen the completion of more than 2,900 projects. Prior to joining Kubilins, Goddard was the manager of the Land Development/Special Projects Unit with the City of Charlotte Department of Transportation (CDOT).
As a managing principal at Design Resource Group, Goddard is responsible for overall project management and quality assurance. He specializes in traffic impact analysis, parking studies, transportation facility permitting, preliminary access and driveway design (including roundabouts), driveway permitting, access evaluation, site plan review, and preliminary design of interchanges, roadways and parking structures. Goddard also regularly represents the firm’s clients at public hearings, presentations and community meetings.
In addition to being a member of the Urban Land Institute, he is also a Fellow of the Institute of Transportation Engineers (ITE) and a member of the Congress for New Urbanism (CNU). He holds a degree in civil engineering from the University of Colorado and is a registered engineer in North and South Carolina.
Appendix
Page 27Exit 27 Study, Cornelius, NC, June 3-4, 2015

Appendix
Hal KempsonFirstVicePresidentCBRE
For the past 17 years Hal Kempson has been employed in the mortgage banking industry, the last 10 with CBRE in Charlotte. He is currently first vice president at CBRE and a member of the CBRE Structured Finance Team. His responsibilities
include loan origination, negotiation and structuring of debt and equity investments. Since 1994, Kempson has originated more than $1.6 billion in construction, permanent, mezzanine, and joint venture equity.
Prior to mortgage banking, Kempson was employed by First Union and a confidential financial services client in a structured finance capacity.
A member and candidate for the CCIM designation, Kempson is a licensed real estate broker and member of the Mortgage Bankers Association. He has served as an instructor for the Charlotte Region Commercial Board of Realtors in commercial real estate finance. Kempson is Regional Development Chair for the Urban Land Institute’s Charlotte District Council.
Keith H . MacVeanLandUse&ZoningConsultantMoore&VanAllen
Keith MacVean joined the Charlotte office of Moore & Van Allen as a Land Use and Zoning Consultant in 2013. His primary role is to help clients navigate various regulatory environments associated with
entitlement and permitting processes, including rezoning efforts, subdivision compliance, land use ordinance and planning projects and transportation and master planning matters.
Before joining MVA, MacVean spent five years at King & Spalding assisting clients on entitlement, land use and real estate matters.
MacVean was employed for 24 years in the City of Charlotte Planning Department. While at the Planning Commission, he led and developed a wide variety of city and county planning initiatives. He oversaw the rezoning process and worked extensively with every aspect of the city/county zoning regulations, including the creation of new zoning districts and the development of new land use plans for the fast growing Charlotte region. He also played a significant role in the interpretation of zoning regulations and assisted internal and external groups with the resolution of a variety of issues associated with the zoning regulations. MacVean also served as interim zoning administrator for one year.
Ed McKinneyInterimPlanningDirectorCharlotte-MecklenburgPlanningDepartment
Ed McKinney is the Interim Planning Director for the City of Charlotte. McKinney is an experienced planner, urban designer and collaborator. He spent the first half of his career in the private sector building a transportation & urban
design practice with the consulting firm Glatting Jackson. That practice assisted communities in answering complex planning and transportation questions though inclusive and multi-disciplinary problem solving.
McKinney has managed and directed a range of projects: transit station area planning, corridor and downtown redevelopment, and large-scale private land development strategies. At the City of Charlotte, he currently directs a number of strategic planning initiatives including a comprehensive update of the City’s zoning ordinance.
He holds graduate degrees in architecture and city planning from the Georgia Institute of Technology and has served as an urban design studio instructor at Georgia Tech. He has an undergraduate degree in architecture from the University of Wisconsin – Milwaukee. Page 28 A Technical Assistance Panel Program Report

Renderings and PhotographsULI Study Area
Hun
ters
ville
N I-77 HyS I-77 Hy
Statesville Rd
Bailey Rd
Cat
awba
Av
West Catawba Av
Wes
tmor
elan
d R
d
Washam Potts
Rd
S Main St
N Main St
Old Statesville Rd
Wes
t Cat
awba
Av
Lege
nd ULI
Stu
dy B
ound
ary
Are
a of
Inte
rest
BAIL
EY
·
Tota
l Are
a: 6
9 A
cres
Tota
l Are
a: 3
39 A
cres
Tota
l Are
a: 8
9 A
cres

Renderings and PhotographsFormer Augustalee Site Plan

Renderings and PhotographsCooke Site Plan

Renderings and PhotographsProposed Cornelius “Square” Interchange or Counterchange

Renderings and PhotographsNew Jersey Interchange (NJ Route 42 Interchange)

Renderings and Photographs Potential Land Use with Cornelius “Square” Interchange Design

Executive SummaryCornelius - ULI TAP18336 Statesville Rd, Cornelius, North Carolina, 28031 Latitude: 35.46413Drive Times: 5, 10, 15 minute radii Longitude: -80.87102
5 minutes 10 minutes 15 minutesPopulation
2000 Population 8,207 32,694 66,7582010 Population 17,562 55,025 114,5012015 Population 19,531 61,290 128,6262020 Population 22,137 69,331 144,8572000-2010 Annual Rate 7.90% 5.34% 5.54%2010-2015 Annual Rate 2.04% 2.08% 2.24%2015-2020 Annual Rate 2.54% 2.50% 2.41%2015 Male Population 48.7% 48.9% 49.2%2015 Female Population 51.3% 51.1% 50.8%2015 Median Age 36.1 38.1 36.9
In the identified area, the current year population is 128,626. In 2010, the Census count in the area was 114,501. The rate of change since 2010 was 2.24% annually. The five-year projection for the population in the area is 144,857 representing a change of 2.41% annually from 2015 to 2020. Currently, the population is 49.2% male and 50.8% female.
Median Age
The median age in this area is 36.1, compared to U.S. median age of 37.9.Race and Ethnicity
2015 White Alone 83.3% 83.9% 80.5%2015 Black Alone 8.2% 8.0% 10.5%2015 American Indian/Alaska Native Alone 0.3% 0.3% 0.3%2015 Asian Alone 3.3% 3.2% 3.7%2015 Pacific Islander Alone 0.0% 0.0% 0.0%2015 Other Race 2.6% 2.4% 2.6%2015 Two or More Races 2.2% 2.1% 2.3%2015 Hispanic Origin (Any Race) 7.7% 7.0% 7.2%
Persons of Hispanic origin represent 7.2% of the population in the identified area compared to 17.6% of the U.S. population. Persons of Hispanic Origin may be of any race. The Diversity Index, which measures the probability that two people from the same area will be from different race/ethnic groups, is 42.7 in the identified area, compared to 63.0 for the U.S. as a whole.
Households2000 Households 3,684 13,245 25,1392010 Households 8,153 22,832 44,5852015 Total Households 9,115 25,529 50,3502020 Total Households 10,360 28,962 56,9452000-2010 Annual Rate 8.27% 5.60% 5.90%2010-2015 Annual Rate 2.15% 2.15% 2.34%2015-2020 Annual Rate 2.59% 2.56% 2.49%2015 Average Household Size 2.14 2.38 2.51
The household count in this area has changed from 44,585 in 2010 to 50,350 in the current year, a change of 2.34% annually. The five-year projection of households is 56,945, a change of 2.49% annually from the current year total. Average household size is currently 2.51, compared to 2.52 in the year 2010. The number of families in the current year is 33,397 in the specified area.
Data Note: Income is expressed in current dollarsSource: U.S. Census Bureau, Census 2010 Summary File 1. Esri forecasts for 2015 and 2020. Esri converted Census 2000 data into 2010 geography.
June 02, 2015
©2015 Esri Page 1 of 2

Executive SummaryCornelius - ULI TAP18336 Statesville Rd, Cornelius, North Carolina, 28031 Latitude: 35.46413Drive Times: 5, 10, 15 minute radii Longitude: -80.87102
5 minutes 10 minutes 15 minutesMedian Household Income
2015 Median Household Income $69,859 $79,201 $77,2702020 Median Household Income $76,661 $85,410 $83,5992015-2020 Annual Rate 1.88% 1.52% 1.59%
Average Household Income
2015 Average Household Income $86,274 $106,882 $102,6302020 Average Household Income $94,869 $118,938 $114,6922015-2020 Annual Rate 1.92% 2.16% 2.25%
Per Capita Income2015 Per Capita Income $39,206 $44,272 $40,2042020 Per Capita Income $43,283 $49,415 $45,1012015-2020 Annual Rate 2.00% 2.22% 2.33%
Households by IncomeCurrent median household income is $77,270 in the area, compared to $53,217 for all U.S. households. Median household income is projected to be $83,599 in five years, compared to $60,683 for all U.S. households
Current average household income is $102,630 in this area, compared to $74,699 for all U.S. households. Average household income is projected to be $114,692 in five years, compared to $84,910 for all U.S. households
Current per capita income is $40,204 in the area, compared to the U.S. per capita income of $28,597. The per capita income is projected to be $45,101 in five years, compared to $32,501 for all U.S. households Housing
2000 Total Housing Units 4,188 14,739 27,5222000 Owner Occupied Housing Units 2,489 9,719 19,5152000 Renter Occupied Housing Units 1,195 3,526 5,6242000 Vacant Housing Units 504 1,494 2,383
2010 Total Housing Units 8,994 25,142 48,7282010 Owner Occupied Housing Units 4,823 15,514 31,7392010 Renter Occupied Housing Units 3,330 7,318 12,8462010 Vacant Housing Units 841 2,310 4,143
2015 Total Housing Units 9,919 27,911 54,5322015 Owner Occupied Housing Units 5,086 16,682 34,3382015 Renter Occupied Housing Units 4,029 8,848 16,0122015 Vacant Housing Units 804 2,382 4,182
2020 Total Housing Units 11,081 31,296 60,9992020 Owner Occupied Housing Units 5,769 18,983 38,6712020 Renter Occupied Housing Units 4,591 9,979 18,2742020 Vacant Housing Units 721 2,334 4,054
Currently, 63.0% of the 54,532 housing units in the area are owner occupied; 29.4%, renter occupied; and 7.7% are vacant. Currently, in the U.S., 55.7% of the housing units in the area are owner occupied; 32.8% are renter occupied; and 11.6% are vacant. In 2010, there were 48,728 housing units in the area - 65.1% owner occupied, 26.4% renter occupied, and 8.5% vacant. The annual rate of change in housing units since 2010 is 5.13%. Median home value in the area is $293,847, compared to a median home value of $200,006 for the U.S. In five years, median value is projected to change by 1.81% annually to $321,439.
Data Note: Income is expressed in current dollarsSource: U.S. Census Bureau, Census 2010 Summary File 1. Esri forecasts for 2015 and 2020. Esri converted Census 2000 data into 2010 geography.
June 02, 2015
©2015 Esri Page 2 of 2

Tapestry Segmentation Area ProfileCornelius - ULI TAP18336 Statesville Rd, Cornelius, North Carolina, 28031 Latitude: 35.46413Drive Time: 5 minute radius Longitude: -80.87102
Top Twenty Tapestry Segments
2015 Households 2015 U.S. HouseholdsCumulative Cumulative
Rank Tapestry Segment Percent Percent Percent Percent Index1 Emerald City (8B) 21.2% 21.2% 1.4% 1.4% 15022 Bright Young Professionals (8C) 17.0% 38.2% 2.2% 3.6% 7723 Up and Coming Families (7A) 16.7% 54.9% 2.2% 5.8% 7594 Young and Restless (11B) 11.0% 65.9% 1.7% 7.5% 6505 Front Porches (8E) 9.3% 75.2% 1.6% 9.1% 583
Subtotal 75.2% 9.1%
6 In Style (5B) 7.2% 82.4% 2.3% 11.4% 3187 Boomburbs (1C) 6.5% 88.9% 1.5% 12.9% 4418 Exurbanites (1E) 5.1% 94.0% 2.0% 14.9% 2599 Soccer Moms (4A) 4.3% 98.3% 2.8% 17.7% 15410 Top Tier (1A) 1.7% 100.0% 1.7% 19.4% 100
Subtotal 24.8% 10.3%
11 Urban Chic (2A) 0.1% 100.1% 1.3% 20.7% 7
Subtotal 0.1% 1.3%
Total 100.0% 20.6% 485
SiteU.S.
Top Ten Tapestry Segments Site vs. U.S.Top Ten Tapestry Segments Site vs. U.S.
Emerald City (8B)
Bright Young Professionals (8C)
Up and Coming Families (7A)
Young and Restless (11B)
Front Porches (8E)
In Style (5B)
Boomburbs (1C)
Exurbanites (1E)
Soccer Moms (4A)
Top Tier (1A)
Percent of Households by Tapestry Segment20181614121086420
Data Note: This report identifies neighborhood segments in the area, and describes the socioeconomic quality of the immediate neighborhood. The index is a comparison of the percent of households or population in the area, by Tapestry segment, to the percent of households or population in the United States, by segment. An index of 100 is the US average.Source: Esri
June 02, 2015
©2015 Esri Page 1 of 18

Tapestry Segmentation Area ProfileCornelius - ULI TAP18336 Statesville Rd, Cornelius, North Carolina, 28031 Latitude: 35.46413Drive Time: 5 minute radius Longitude: -80.87102
Tapestry LifeMode Groups 2015 Households 2015 PopulationNumber Percent Index Number Percent Index
Total: 9,114 100.0% 19,531 100.0%
1. Affluent Estates 1,208 13.3% 137 2,770 14.2% 134Top Tier (1A) 157 1.7% 100 319 1.6% 88Professional Pride (1B) 0 0.0% 0 0 0.0% 0Boomburbs (1C) 590 6.5% 441 1,524 7.8% 433Savvy Suburbanites (1D) 0 0.0% 0 0 0.0% 0Exurbanites (1E) 461 5.1% 259 927 4.7% 255
2. Upscale Avenues 9 0.1% 2 20 0.1% 2Urban Chic (2A) 9 0.1% 7 20 0.1% 8Pleasantville (2B) 0 0.0% 0 0 0.0% 0Pacific Heights (2C) 0 0.0% 0 0 0.0% 0Enterprising Professionals (2D) 0 0.0% 0 0 0.0% 0
3. Uptown Individuals 0 0.0% 0 0 0.0% 0Laptops and Lattes (3A) 0 0.0% 0 0 0.0% 0Metro Renters (3B) 0 0.0% 0 0 0.0% 0Trendsetters (3C) 0 0.0% 0 0 0.0% 0
4. Family Landscapes 394 4.3% 59 1,123 5.7% 72Soccer Moms (4A) 394 4.3% 154 1,123 5.7% 182Home Improvement (4B) 0 0.0% 0 0 0.0% 0Middleburg (4C) 0 0.0% 0 0 0.0% 0
5. GenXurban 653 7.2% 62 1,073 5.5% 51Comfortable Empty Nesters (5A) ( (5A)
0 0.0% 0 0 0.0% 0In Style (5B) 653 7.2% 318 1,073 5.5% 271Parks and Rec (5C) 0 0.0% 0 0 0.0% 0Rustbelt Traditions (5D) 0 0.0% 0 0 0.0% 0Midlife Constants (5E) 0 0.0% 0 0 0.0% 0
6. Cozy Country Living 0 0.0% 0 0 0.0% 0Green Acres (6A) 0 0.0% 0 0 0.0% 0Salt of the Earth (6B) 0 0.0% 0 0 0.0% 0The Great Outdoors (6C) 0 0.0% 0 0 0.0% 0Prairie Living (6D) 0 0.0% 0 0 0.0% 0Rural Resort Dwellers (6E) 0 0.0% 0 0 0.0% 0Heartland Communities (6F) 0 0.0% 0 0 0.0% 0
7. Ethnic Enclaves 1,522 16.7% 243 3,792 19.4% 222Up and Coming Families (7A) 1,522 16.7% 759 3,792 19.4% 745Urban Villages (7B) 0 0.0% 0 0 0.0% 0American Dreamers (7C) 0 0.0% 0 0 0.0% 0Barrios Urbanos (7D) 0 0.0% 0 0 0.0% 0Valley Growers (7E) 0 0.0% 0 0 0.0% 0Southwestern Families (7F) 0 0.0% 0 0 0.0% 0
Data Note: This report identifies neighborhood segments in the area, and describes the socioeconomic quality of the immediate neighborhood. The index is a comparison of the percent of households or population in the area, by Tapestry segment, to the percent of households or population in the United States, by segment. An index of 100 is the US average.Source: Esri
June 02, 2015
©2015 Esri Page 3 of 18

Tapestry Segmentation Area ProfileCornelius - ULI TAP18336 Statesville Rd, Cornelius, North Carolina, 28031 Latitude: 35.46413Drive Time: 5 minute radius Longitude: -80.87102
Tapestry LifeMode Groups 2015 Households 2015 PopulationNumber Percent Index Number Percent Index
Total: 9,114 100.0% 19,531 100.0%
8. Middle Ground 4,327 47.5% 435 9,058 46.4% 460City Lights (8A) 0 0.0% 0 0 0.0% 0Emerald City (8B) 1,931 21.2% 1,502 3,825 19.6% 1,752Bright Young Professionals (8C) 1,547 17.0% 772 3,173 16.2% 808Downtown Melting Pot (8D) 0 0.0% 0 0 0.0% 0Front Porches (8E) 849 9.3% 583 2,060 10.5% 673Old and Newcomers (8F) 0 0.0% 0 0 0.0% 0Hardscrabble Road (8G) 0 0.0% 0 0 0.0% 0
9. Senior Styles 0 0.0% 0 0 0.0% 0Silver & Gold (9A) 0 0.0% 0 0 0.0% 0Golden Years (9B) 0 0.0% 0 0 0.0% 0The Elders (9C) 0 0.0% 0 0 0.0% 0Senior Escapes (9D) 0 0.0% 0 0 0.0% 0Retirement Communities (9E) 0 0.0% 0 0 0.0% 0Social Security Set (9F) 0 0.0% 0 0 0.0% 0
10. Rustic Outposts 0 0.0% 0 0 0.0% 0Southern Satellites (10A) 0 0.0% 0 0 0.0% 0Rooted Rural (10B) 0 0.0% 0 0 0.0% 0Diners & Miners (10C) 0 0.0% 0 0 0.0% 0Down the Road (10D) 0 0.0% 0 0 0.0% 0Rural Bypasses (10E) 0 0.0% 0 0 0.0% 0
11. Midtown Singles 1,001 11.0% 178 1,695 8.7% 154City Strivers (11A) 0 0.0% 0 0 0.0% 0Young and Restless (11B) 1,001 11.0% 650 1,695 8.7% 661Metro Fusion (11C) 0 0.0% 0 0 0.0% 0Set to Impress (11D) 0 0.0% 0 0 0.0% 0City Commons (11E) 0 0.0% 0 0 0.0% 0
12. Hometown 0 0.0% 0 0 0.0% 0Family Foundations (12A) 0 0.0% 0 0 0.0% 0Traditional Living (12B) 0 0.0% 0 0 0.0% 0Small Town Simplicity (12C) 0 0.0% 0 0 0.0% 0Modest Income Homes (12D) 0 0.0% 0 0 0.0% 0
13. Next Wave 0 0.0% 0 0 0.0% 0International Marketplace (13A) 0 0.0% 0 0 0.0% 0Las Casas (13B) 0 0.0% 0 0 0.0% 0NeWest Residents (13C) 0 0.0% 0 0 0.0% 0Fresh Ambitions (13D) 0 0.0% 0 0 0.0% 0High Rise Renters (13E) 0 0.0% 0 0 0.0% 0
14. Scholars and Patriots 0 0.0% 0 0 0.0% 0Military Proximity (14A) 0 0.0% 0 0 0.0% 0College Towns (14B) 0 0.0% 0 0 0.0% 0Dorms to Diplomas (14C) 0 0.0% 0 0 0.0% 0
Unclassified (15) 0 0.0% 0 0 0.0% 0
Data Note: This report identifies neighborhood segments in the area, and describes the socioeconomic quality of the immediate neighborhood. The index is a comparison of the percent of households or population in the area, by Tapestry segment, to the percent of households or population in the United States, by segment. An index of 100 is the US average.Source: Esri
June 02, 2015
©2015 Esri Page 4 of 18

Tapestry Segmentation Area ProfileCornelius - ULI TAP18336 Statesville Rd, Cornelius, North Carolina, 28031 Latitude: 35.46413Drive Time: 5 minute radius Longitude: -80.87102
Tapestry Urbanization Groups 2015 Households 2015 PopulationNumber Percent Index Number Percent Index
Total: 9,114 100.0% 19,531 100.0%
1. Principal Urban Center 0 0.0% 0 0 0.0% 0Laptops and Lattes (3A) 0 0.0% 0 0 0.0% 0Metro Renters (3B) 0 0.0% 0 0 0.0% 0Trendsetters (3C) 0 0.0% 0 0 0.0% 0Downtown Melting Pot (8D) 0 0.0% 0 0 0.0% 0City Strivers (11A) 0 0.0% 0 0 0.0% 0NeWest Residents (13C) 0 0.0% 0 0 0.0% 0Fresh Ambitions (13D) 0 0.0% 0 0 0.0% 0High Rise Renters (13E) 0 0.0% 0 0 0.0% 0
2. Urban Periphery 1,547 17.0% 101 3,173 16.2% 87Pacific Heights (2C) 0 0.0% 0 0 0.0% 0Rustbelt Traditions (5D) 0 0.0% 0 0 0.0% 0Urban Villages (7B) 0 0.0% 0 0 0.0% 0American Dreamers (7C) 0 0.0% 0 0 0.0% 0Barrios Urbanos (7D) 0 0.0% 0 0 0.0% 0Southwestern Families (7F) 0 0.0% 0 0 0.0% 0City Lights (8A) 0 0.0% 0 0 0.0% 0Bright Young Professionals (8C) 1,547 17.0% 772 3,173 16.2% 808Metro Fusion (11C) 0 0.0% 0 0 0.0% 0Family Foundations (12A) 0 0.0% 0 0 0.0% 0Modest Income Homes (12D) 0 0.0% 0 0 0.0% 0International Marketplace (13A) 0 0.0% 0 0 0.0% 0Las Casas (13B) 0 0.0% 0 0 0.0% 0
3. Metro Cities 4,434 48.7% 267 8,653 44.3% 284In Style (5B) 653 7.2% 318 1,073 5.5% 271Emerald City (8B) 1,931 21.2% 1,502 3,825 19.6% 1,752Front Porches (8E) 849 9.3% 583 2,060 10.5% 673Old and Newcomers (8F) 0 0.0% 0 0 0.0% 0Hardscrabble Road (8G) 0 0.0% 0 0 0.0% 0Retirement Communities (9E) 0 0.0% 0 0 0.0% 0Social Security Set (9F) 0 0.0% 0 0 0.0% 0Young and Restless (11B) 1,001 11.0% 650 1,695 8.7% 661Set to Impress (11D) 0 0.0% 0 0 0.0% 0City Commons (11E) 0 0.0% 0 0 0.0% 0Traditional Living (12B) 0 0.0% 0 0 0.0% 0College Towns (14B) 0 0.0% 0 0 0.0% 0Dorms to Diplomas (14C) 0 0.0% 0 0 0.0% 0
Data Note: This report identifies neighborhood segments in the area, and describes the socioeconomic quality of the immediate neighborhood. The index is a comparison of the percent of households or population in the area, by Tapestry segment, to the percent of households or population in the United States, by segment. An index of 100 is the US average.Source: Esri
June 02, 2015
©2015 Esri Page 5 of 18

Tapestry Segmentation Area ProfileCornelius - ULI TAP18336 Statesville Rd, Cornelius, North Carolina, 28031 Latitude: 35.46413Drive Time: 5 minute radius Longitude: -80.87102
Tapestry Urbanization Groups 2015 Households 2015 PopulationNumber Percent Index Number Percent Index
Total: 9,114 100.0% 19,531 100.0%4. Suburban Periphery 3,133 34.4% 109 7,705 39.5% 122Top Tier (1A) 157 1.7% 100 319 1.6% 88Professional Pride (1B) 0 0.0% 0 0 0.0% 0Boomburbs (1C) 590 6.5% 441 1,524 7.8% 433Savvy Suburbanites (1D) 0 0.0% 0 0 0.0% 0Exurbanites (1E) 461 5.1% 259 927 4.7% 255Urban Chic (2A) 9 0.1% 7 20 0.1% 8Pleasantville (2B) 0 0.0% 0 0 0.0% 0Enterprising Professionals (2D) 0 0.0% 0 0 0.0% 0Soccer Moms (4A) 394 4.3% 154 1,123 5.7% 182Home Improvement (4B) 0 0.0% 0 0 0.0% 0Comfortable Empty Nesters (5A) 0 0.0% 0 0 0.0% 0Parks and Rec (5C) 0 0.0% 0 0 0.0% 0Midlife Constants (5E) 0 0.0% 0 0 0.0% 0Up and Coming Families (7A) 1,522 16.7% 759 3,792 19.4% 745Silver & Gold (9A) 0 0.0% 0 0 0.0% 0Golden Years (9B) 0 0.0% 0 0 0.0% 0The Elders (9C) 0 0.0% 0 0 0.0% 0Military Proximity (14A) 0 0.0% 0 0 0.0% 0
5. Semirural 0 0.0% 0 0 0.0% 0Middleburg (4C) 0 0.0% 0 0 0.0% 0Heartland Communities (6F) 0 0.0% 0 0 0.0% 0Valley Growers (7E) 0 0.0% 0 0 0.0% 0Senior Escapes (9D) 0 0.0% 0 0 0.0% 0Down the Road (10D) 0 0.0% 0 0 0.0% 0Small Town Simplicity (12C) 0 0.0% 0 0 0.0% 0
6. Rural 0 0.0% 0 0 0.0% 0Green Acres (6A) 0 0.0% 0 0 0.0% 0Salt of the Earth (6B) 0 0.0% 0 0 0.0% 0The Great Outdoors (6C) 0 0.0% 0 0 0.0% 0Prairie Living (6D) 0 0.0% 0 0 0.0% 0Rural Resort Dwellers (6E) 0 0.0% 0 0 0.0% 0Southern Satellites (10A) 0 0.0% 0 0 0.0% 0Rooted Rural (10B) 0 0.0% 0 0 0.0% 0Diners & Miners (10C) 0 0.0% 0 0 0% 0Rural Bypasses (10E) 0 0.0% 0 0 0.0% 0
Unclassified (15) 0 0.0% 0 0 0.0% 0
Data Note: This report identifies neighborhood segments in the area, and describes the socioeconomic quality of the immediate neighborhood. The index is a comparison of the percent of households or population in the area, by Tapestry segment, to the percent of households or population in the United States, by segment. An index of 100 is the US average.Source: Esri
June 02, 2015
©2015 Esri Page 6 of 18

Tapestry Segmentation Area ProfileCornelius - ULI TAP18336 Statesville Rd, Cornelius, North Carolina, 28031 Latitude: 35.46413Drive Time: 10 minute radius Longitude: -80.87102
Top Twenty Tapestry Segments
2015 Households 2015 U.S. HouseholdsCumulative Cumulative
Rank Tapestry Segment Percent Percent Percent Percent Index1 Bright Young Professionals (8C) 12.6% 12.6% 2.2% 2.2% 5732 Boomburbs (1C) 12.4% 25.0% 1.5% 3.7% 8443 Emerald City (8B) 11.3% 36.3% 1.4% 5.1% 7994 Up and Coming Families (7A) 10.8% 47.1% 2.2% 7.3% 4905 In Style (5B) 9.5% 56.6% 2.3% 9.6% 421
Subtotal 56.6% 9.6%
6 Top Tier (1A) 8.2% 64.8% 1.7% 11.3% 4787 Soccer Moms (4A) 7.0% 71.8% 2.8% 14.1% 2488 Young and Restless (11B) 7.0% 78.8% 1.7% 15.8% 4129 Professional Pride (1B) 3.7% 82.5% 1.6% 17.4% 23310 Urban Chic (2A) 3.4% 85.9% 1.3% 18.7% 255
Subtotal 29.3% 9.1%
11 Front Porches (8E) 3.3% 89.2% 1.6% 20.3% 20812 Middleburg (4C) 3.2% 92.4% 2.8% 23.1% 11313 Exurbanites (1E) 3.0% 95.4% 2.0% 25.1% 15114 Savvy Suburbanites (1D) 1.8% 97.2% 3.0% 28.1% 5915 Southern Satellites (10A) 1.5% 98.7% 3.2% 31.3% 47
Subtotal 12.8% 12.6%
16 Green Acres (6A) 0.9% 99.6% 3.2% 34.5% 2917 Down the Road (10D) 0.6% 100.2% 1.1% 35.6% 55
Subtotal 1.5% 4.3%
Total 100.0% 35.5% 282
SiteU.S.
Top Ten Tapestry Segments Site vs. U.S.Top Ten Tapestry Segments Site vs. U.S.
Bright Young Professionals (8C)
Boomburbs (1C)
Emerald City (8B)
Up and Coming Families (7A)
In Style (5B)
Top Tier (1A)
Soccer Moms (4A)
Young and Restless (11B)
Professional Pride (1B)
Urban Chic (2A)
Percent of Households by Tapestry Segment121086420
Data Note: This report identifies neighborhood segments in the area, and describes the socioeconomic quality of the immediate neighborhood. The index is a comparison of the percent of households or population in the area, by Tapestry segment, to the percent of households or population in the United States, by segment. An index of 100 is the US average.Source: Esri
June 02, 2015
©2015 Esri Page 7 of 18

Tapestry Segmentation Area ProfileCornelius - ULI TAP18336 Statesville Rd, Cornelius, North Carolina, 28031 Latitude: 35.46413Drive Time: 10 minute radius Longitude: -80.87102
Tapestry LifeMode Groups 2015 Households 2015 PopulationNumber Percent Index Number Percent Index
Total: 25,530 100.0% 61,289 100.0%
1. Affluent Estates 7,420 29.1% 299 20,697 33.8% 318Top Tier (1A) 2,101 8.2% 478 5,935 9.7% 520Professional Pride (1B) 946 3.7% 233 2,890 4.7% 251Boomburbs (1C) 3,167 12.4% 844 9,115 14.9% 825Savvy Suburbanites (1D) 452 1.8% 59 1,124 1.8% 57Exurbanites (1E) 754 3.0% 151 1,633 2.7% 143
2. Upscale Avenues 861 3.4% 60 1,957 3.2% 55Urban Chic (2A) 861 3.4% 255 1,957 3.2% 263Pleasantville (2B) 0 0.0% 0 0 0.0% 0Pacific Heights (2C) 0 0.0% 0 0 0.0% 0Enterprising Professionals (2D) 0 0.0% 0 0 0.0% 0
3. Uptown Individuals 0 0.0% 0 0 0.0% 0Laptops and Lattes (3A) 0 0.0% 0 0 0.0% 0Metro Renters (3B) 0 0.0% 0 0 0.0% 0Trendsetters (3C) 0 0.0% 0 0 0.0% 0
4. Family Landscapes 2,591 10.1% 138 6,519 10.6% 134Soccer Moms (4A) 1,780 7.0% 248 4,541 7.4% 235Home Improvement (4B) 0 0.0% 0 0 0.0% 0Middleburg (4C) 811 3.2% 113 1,978 3.2% 110
5. GenXurban 2,417 9.5% 82 4,976 8.1% 76Comfortable Empty Nesters (5A) ( (5A)
0 0.0% 0 0 0.0% 0In Style (5B) 2,417 9.5% 421 4,976 8.1% 400Parks and Rec (5C) 0 0.0% 0 0 0.0% 0Rustbelt Traditions (5D) 0 0.0% 0 0 0.0% 0Midlife Constants (5E) 0 0.0% 0 0 0.0% 0
6. Cozy Country Living 236 0.9% 8 634 1.0% 9Green Acres (6A) 236 0.9% 29 634 1.0% 32Salt of the Earth (6B) 0 0.0% 0 0 0.0% 0The Great Outdoors (6C) 0 0.0% 0 0 0.0% 0Prairie Living (6D) 0 0.0% 0 0 0.0% 0Rural Resort Dwellers (6E) 0 0.0% 0 0 0.0% 0Heartland Communities (6F) 0 0.0% 0 0 0.0% 0
7. Ethnic Enclaves 2,750 10.8% 157 7,191 11.7% 134Up and Coming Families (7A) 2,750 10.8% 490 7,191 11.7% 450Urban Villages (7B) 0 0.0% 0 0 0.0% 0American Dreamers (7C) 0 0.0% 0 0 0.0% 0Barrios Urbanos (7D) 0 0.0% 0 0 0.0% 0Valley Growers (7E) 0 0.0% 0 0 0.0% 0Southwestern Families (7F) 0 0.0% 0 0 0.0% 0
Data Note: This report identifies neighborhood segments in the area, and describes the socioeconomic quality of the immediate neighborhood. The index is a comparison of the percent of households or population in the area, by Tapestry segment, to the percent of households or population in the United States, by segment. An index of 100 is the US average.Source: Esri
June 02, 2015
©2015 Esri Page 9 of 18

Tapestry Segmentation Area ProfileCornelius - ULI TAP18336 Statesville Rd, Cornelius, North Carolina, 28031 Latitude: 35.46413Drive Time: 10 minute radius Longitude: -80.87102
Tapestry LifeMode Groups 2015 Households 2015 PopulationNumber Percent Index Number Percent Index
Total: 25,530 100.0% 61,289 100.0%
8. Middle Ground 6,940 27.2% 249 14,928 24.4% 242City Lights (8A) 0 0.0% 0 0 0.0% 0Emerald City (8B) 2,876 11.3% 799 5,864 9.6% 856Bright Young Professionals (8C) 3,215 12.6% 573 7,004 11.4% 569Downtown Melting Pot (8D) 0 0.0% 0 0 0.0% 0Front Porches (8E) 849 3.3% 208 2,060 3.4% 214Old and Newcomers (8F) 0 0.0% 0 0 0.0% 0Hardscrabble Road (8G) 0 0.0% 0 0 0.0% 0
9. Senior Styles 0 0.0% 0 0 0.0% 0Silver & Gold (9A) 0 0.0% 0 0 0.0% 0Golden Years (9B) 0 0.0% 0 0 0.0% 0The Elders (9C) 0 0.0% 0 0 0.0% 0Senior Escapes (9D) 0 0.0% 0 0 0.0% 0Retirement Communities (9E) 0 0.0% 0 0 0.0% 0Social Security Set (9F) 0 0.0% 0 0 0.0% 0
10. Rustic Outposts 538 2.1% 25 1,288 2.1% 25Southern Satellites (10A) 378 1.5% 47 881 1.4% 45Rooted Rural (10B) 0 0.0% 0 0 0.0% 0Diners & Miners (10C) 0 0.0% 0 0 0.0% 0Down the Road (10D) 160 0.6% 55 407 0.7% 55Rural Bypasses (10E) 0 0.0% 0 0 0.0% 0
11. Midtown Singles 1,777 7.0% 113 3,099 5.1% 90City Strivers (11A) 0 0.0% 0 0 0.0% 0Young and Restless (11B) 1,777 7.0% 412 3,099 5.1% 385Metro Fusion (11C) 0 0.0% 0 0 0.0% 0Set to Impress (11D) 0 0.0% 0 0 0.0% 0City Commons (11E) 0 0.0% 0 0 0.0% 0
12. Hometown 0 0.0% 0 0 0.0% 0Family Foundations (12A) 0 0.0% 0 0 0.0% 0Traditional Living (12B) 0 0.0% 0 0 0.0% 0Small Town Simplicity (12C) 0 0.0% 0 0 0.0% 0Modest Income Homes (12D) 0 0.0% 0 0 0.0% 0
13. Next Wave 0 0.0% 0 0 0.0% 0International Marketplace (13A) 0 0.0% 0 0 0.0% 0Las Casas (13B) 0 0.0% 0 0 0.0% 0NeWest Residents (13C) 0 0.0% 0 0 0.0% 0Fresh Ambitions (13D) 0 0.0% 0 0 0.0% 0High Rise Renters (13E) 0 0.0% 0 0 0.0% 0
14. Scholars and Patriots 0 0.0% 0 0 0.0% 0Military Proximity (14A) 0 0.0% 0 0 0.0% 0College Towns (14B) 0 0.0% 0 0 0.0% 0Dorms to Diplomas (14C) 0 0.0% 0 0 0.0% 0
Unclassified (15) 0 0.0% 0 0 0.0% 0
Data Note: This report identifies neighborhood segments in the area, and describes the socioeconomic quality of the immediate neighborhood. The index is a comparison of the percent of households or population in the area, by Tapestry segment, to the percent of households or population in the United States, by segment. An index of 100 is the US average.Source: Esri
June 02, 2015
©2015 Esri Page 10 of 18

Tapestry Segmentation Area ProfileCornelius - ULI TAP18336 Statesville Rd, Cornelius, North Carolina, 28031 Latitude: 35.46413Drive Time: 10 minute radius Longitude: -80.87102
Tapestry Urbanization Groups 2015 Households 2015 PopulationNumber Percent Index Number Percent Index
Total: 25,530 100.0% 61,289 100.0%
1. Principal Urban Center 0 0.0% 0 0 0.0% 0Laptops and Lattes (3A) 0 0.0% 0 0 0.0% 0Metro Renters (3B) 0 0.0% 0 0 0.0% 0Trendsetters (3C) 0 0.0% 0 0 0.0% 0Downtown Melting Pot (8D) 0 0.0% 0 0 0.0% 0City Strivers (11A) 0 0.0% 0 0 0.0% 0NeWest Residents (13C) 0 0.0% 0 0 0.0% 0Fresh Ambitions (13D) 0 0.0% 0 0 0.0% 0High Rise Renters (13E) 0 0.0% 0 0 0.0% 0
2. Urban Periphery 3,215 12.6% 75 7,004 11.4% 61Pacific Heights (2C) 0 0.0% 0 0 0.0% 0Rustbelt Traditions (5D) 0 0.0% 0 0 0.0% 0Urban Villages (7B) 0 0.0% 0 0 0.0% 0American Dreamers (7C) 0 0.0% 0 0 0.0% 0Barrios Urbanos (7D) 0 0.0% 0 0 0.0% 0Southwestern Families (7F) 0 0.0% 0 0 0.0% 0City Lights (8A) 0 0.0% 0 0 0.0% 0Bright Young Professionals (8C) 3,215 12.6% 573 7,004 11.4% 569Metro Fusion (11C) 0 0.0% 0 0 0.0% 0Family Foundations (12A) 0 0.0% 0 0 0.0% 0Modest Income Homes (12D) 0 0.0% 0 0 0.0% 0International Marketplace (13A) 0 0.0% 0 0 0.0% 0Las Casas (13B) 0 0.0% 0 0 0.0% 0
3. Metro Cities 7,919 31.0% 170 15,999 26.1% 167In Style (5B) 2,417 9.5% 421 4,976 8.1% 400Emerald City (8B) 2,876 11.3% 799 5,864 9.6% 856Front Porches (8E) 849 3.3% 208 2,060 3.4% 214Old and Newcomers (8F) 0 0.0% 0 0 0.0% 0Hardscrabble Road (8G) 0 0.0% 0 0 0.0% 0Retirement Communities (9E) 0 0.0% 0 0 0.0% 0Social Security Set (9F) 0 0.0% 0 0 0.0% 0Young and Restless (11B) 1,777 7.0% 412 3,099 5.1% 385Set to Impress (11D) 0 0.0% 0 0 0.0% 0City Commons (11E) 0 0.0% 0 0 0.0% 0Traditional Living (12B) 0 0.0% 0 0 0.0% 0College Towns (14B) 0 0.0% 0 0 0.0% 0Dorms to Diplomas (14C) 0 0.0% 0 0 0.0% 0
Data Note: This report identifies neighborhood segments in the area, and describes the socioeconomic quality of the immediate neighborhood. The index is a comparison of the percent of households or population in the area, by Tapestry segment, to the percent of households or population in the United States, by segment. An index of 100 is the US average.Source: Esri
June 02, 2015
©2015 Esri Page 11 of 18

Tapestry Segmentation Area ProfileCornelius - ULI TAP18336 Statesville Rd, Cornelius, North Carolina, 28031 Latitude: 35.46413Drive Time: 10 minute radius Longitude: -80.87102
Tapestry Urbanization Groups 2015 Households 2015 PopulationNumber Percent Index Number Percent Index
Total: 25,530 100.0% 61,289 100.0%4. Suburban Periphery 12,811 50.2% 160 34,386 56.1% 174Top Tier (1A) 2,101 8.2% 478 5,935 9.7% 520Professional Pride (1B) 946 3.7% 233 2,890 4.7% 251Boomburbs (1C) 3,167 12.4% 844 9,115 14.9% 825Savvy Suburbanites (1D) 452 1.8% 59 1,124 1.8% 57Exurbanites (1E) 754 3.0% 151 1,633 2.7% 143Urban Chic (2A) 861 3.4% 255 1,957 3.2% 263Pleasantville (2B) 0 0.0% 0 0 0.0% 0Enterprising Professionals (2D) 0 0.0% 0 0 0.0% 0Soccer Moms (4A) 1,780 7.0% 248 4,541 7.4% 235Home Improvement (4B) 0 0.0% 0 0 0.0% 0Comfortable Empty Nesters (5A) 0 0.0% 0 0 0.0% 0Parks and Rec (5C) 0 0.0% 0 0 0.0% 0Midlife Constants (5E) 0 0.0% 0 0 0.0% 0Up and Coming Families (7A) 2,750 10.8% 490 7,191 11.7% 450Silver & Gold (9A) 0 0.0% 0 0 0.0% 0Golden Years (9B) 0 0.0% 0 0 0.0% 0The Elders (9C) 0 0.0% 0 0 0.0% 0Military Proximity (14A) 0 0.0% 0 0 0.0% 0
5. Semirural 971 3.8% 40 2,385 3.9% 42Middleburg (4C) 811 3.2% 113 1,978 3.2% 110Heartland Communities (6F) 0 0.0% 0 0 0.0% 0Valley Growers (7E) 0 0.0% 0 0 0.0% 0Senior Escapes (9D) 0 0.0% 0 0 0.0% 0Down the Road (10D) 160 0.6% 55 407 0.7% 55Small Town Simplicity (12C) 0 0.0% 0 0 0.0% 0
6. Rural 614 2.4% 14 1,515 2.5% 15Green Acres (6A) 236 0.9% 29 634 1.0% 32Salt of the Earth (6B) 0 0.0% 0 0 0.0% 0The Great Outdoors (6C) 0 0.0% 0 0 0.0% 0Prairie Living (6D) 0 0.0% 0 0 0.0% 0Rural Resort Dwellers (6E) 0 0.0% 0 0 0.0% 0Southern Satellites (10A) 378 1.5% 47 881 1.4% 45Rooted Rural (10B) 0 0.0% 0 0 0.0% 0Diners & Miners (10C) 0 0.0% 0 0 0% 0Rural Bypasses (10E) 0 0.0% 0 0 0.0% 0
Unclassified (15) 0 0.0% 0 0 0.0% 0
Data Note: This report identifies neighborhood segments in the area, and describes the socioeconomic quality of the immediate neighborhood. The index is a comparison of the percent of households or population in the area, by Tapestry segment, to the percent of households or population in the United States, by segment. An index of 100 is the US average.Source: Esri
June 02, 2015
©2015 Esri Page 12 of 18

Tapestry Segmentation Area ProfileCornelius - ULI TAP18336 Statesville Rd, Cornelius, North Carolina, 28031 Latitude: 35.46413Drive Time: 15 minute radius Longitude: -80.87102
Top Twenty Tapestry Segments
2015 Households 2015 U.S. HouseholdsCumulative Cumulative
Rank Tapestry Segment Percent Percent Percent Percent Index1 Bright Young Professionals (8C) 11.6% 11.6% 2.2% 2.2% 5272 Boomburbs (1C) 11.0% 22.6% 1.5% 3.7% 7513 Up and Coming Families (7A) 9.5% 32.1% 2.2% 5.9% 4334 Middleburg (4C) 9.1% 41.2% 2.8% 8.7% 3245 Professional Pride (1B) 9.0% 50.2% 1.6% 10.3% 564
Subtotal 50.2% 10.3%
6 Soccer Moms (4A) 8.2% 58.4% 2.8% 13.1% 2917 Emerald City (8B) 5.7% 64.1% 1.4% 14.5% 4058 In Style (5B) 4.8% 68.9% 2.3% 16.8% 2139 Savvy Suburbanites (1D) 4.3% 73.2% 3.0% 19.8% 14510 Top Tier (1A) 4.3% 77.5% 1.7% 21.5% 248
Subtotal 27.3% 11.2%
11 Young and Restless (11B) 3.5% 81.0% 1.7% 23.2% 20912 Front Porches (8E) 3.2% 84.2% 1.6% 24.8% 19713 Metro Renters (3B) 3.1% 87.3% 1.5% 26.3% 20714 Enterprising Professionals (2D) 3.0% 90.3% 1.4% 27.7% 21515 Green Acres (6A) 2.4% 92.7% 3.2% 30.9% 74
Subtotal 15.2% 9.4%
16 Urban Chic (2A) 1.8% 94.5% 1.3% 32.2% 14017 Southern Satellites (10A) 1.7% 96.2% 3.2% 35.4% 5418 Exurbanites (1E) 1.6% 97.8% 2.0% 37.4% 8419 Down the Road (10D) 1.5% 99.3% 1.1% 38.5% 13020 Traditional Living (12B) 0.6% 99.9% 2.0% 40.5% 32
Subtotal 7.2% 9.6%
Total 99.9% 40.3% 248
SiteU.S.
Top Ten Tapestry Segments Site vs. U.S.Top Ten Tapestry Segments Site vs. U.S.
Bright Young Professionals (8C)
Boomburbs (1C)
Up and Coming Families (7A)
Middleburg (4C)
Professional Pride (1B)
Soccer Moms (4A)
Emerald City (8B)
In Style (5B)
Savvy Suburbanites (1D)
Top Tier (1A)
Percent of Households by Tapestry Segment1086420
Data Note: This report identifies neighborhood segments in the area, and describes the socioeconomic quality of the immediate neighborhood. The index is a comparison of the percent of households or population in the area, by Tapestry segment, to the percent of households or population in the United States, by segment. An index of 100 is the US average.Source: Esri
June 02, 2015
©2015 Esri Page 13 of 18

Tapestry Segmentation Area ProfileCornelius - ULI TAP18336 Statesville Rd, Cornelius, North Carolina, 28031 Latitude: 35.46413Drive Time: 15 minute radius Longitude: -80.87102
Tapestry LifeMode Groups 2015 Households 2015 PopulationNumber Percent Index Number Percent Index
Total: 50,352 100.0% 128,626 100.0%
1. Affluent Estates 15,225 30.2% 311 43,973 34.2% 322Top Tier (1A) 2,153 4.3% 248 6,073 4.7% 253Professional Pride (1B) 4,509 9.0% 564 13,698 10.6% 568Boomburbs (1C) 5,557 11.0% 751 16,586 12.9% 716Savvy Suburbanites (1D) 2,180 4.3% 145 5,823 4.5% 141Exurbanites (1E) 826 1.6% 84 1,793 1.4% 75
2. Upscale Avenues 2,419 4.8% 85 7,276 5.7% 97Urban Chic (2A) 931 1.8% 140 3,613 2.8% 232Pleasantville (2B) 0 0.0% 0 0 0.0% 0Pacific Heights (2C) 0 0.0% 0 0 0.0% 0Enterprising Professionals (2D) 1,488 3.0% 215 3,663 2.8% 221
3. Uptown Individuals 1,545 3.1% 85 2,652 2.1% 79Laptops and Lattes (3A) 0 0.0% 0 0 0.0% 0Metro Renters (3B) 1,545 3.1% 207 2,652 2.1% 209Trendsetters (3C) 0 0.0% 0 0 0.0% 0
4. Family Landscapes 8,684 17.2% 235 22,724 17.7% 222Soccer Moms (4A) 4,120 8.2% 291 11,010 8.6% 271Home Improvement (4B) 0 0.0% 0 0 0.0% 0Middleburg (4C) 4,564 9.1% 324 11,714 9.1% 312
5. GenXurban 2,417 4.8% 42 4,976 3.9% 36Comfortable Empty Nesters (5A) ( (5A)
0 0.0% 0 0 0.0% 0In Style (5B) 2,417 4.8% 213 4,976 3.9% 191Parks and Rec (5C) 0 0.0% 0 0 0.0% 0Rustbelt Traditions (5D) 0 0.0% 0 0 0.0% 0Midlife Constants (5E) 0 0.0% 0 0 0.0% 0
6. Cozy Country Living 1,204 2.4% 20 3,417 2.7% 23Green Acres (6A) 1,194 2.4% 74 3,389 2.6% 80Salt of the Earth (6B) 10 0.0% 1 28 0.0% 1The Great Outdoors (6C) 0 0.0% 0 0 0.0% 0Prairie Living (6D) 0 0.0% 0 0 0.0% 0Rural Resort Dwellers (6E) 0 0.0% 0 0 0.0% 0Heartland Communities (6F) 0 0.0% 0 0 0.0% 0
7. Ethnic Enclaves 4,800 9.5% 139 12,821 10.0% 114Up and Coming Families (7A) 4,800 9.5% 433 12,821 10.0% 383Urban Villages (7B) 0 0.0% 0 0 0.0% 0American Dreamers (7C) 0 0.0% 0 0 0.0% 0Barrios Urbanos (7D) 0 0.0% 0 0 0.0% 0Valley Growers (7E) 0 0.0% 0 0 0.0% 0Southwestern Families (7F) 0 0.0% 0 0 0.0% 0
Data Note: This report identifies neighborhood segments in the area, and describes the socioeconomic quality of the immediate neighborhood. The index is a comparison of the percent of households or population in the area, by Tapestry segment, to the percent of households or population in the United States, by segment. An index of 100 is the US average.Source: Esri
June 02, 2015
©2015 Esri Page 15 of 18

Tapestry Segmentation Area ProfileCornelius - ULI TAP18336 Statesville Rd, Cornelius, North Carolina, 28031 Latitude: 35.46413Drive Time: 15 minute radius Longitude: -80.87102
Tapestry LifeMode Groups 2015 Households 2015 PopulationNumber Percent Index Number Percent Index
Total: 50,352 100.0% 128,626 100.0%
8. Middle Ground 10,337 20.5% 188 22,738 17.7% 175City Lights (8A) 0 0.0% 0 0 0.0% 0Emerald City (8B) 2,876 5.7% 405 5,864 4.6% 408Bright Young Professionals (8C) 5,841 11.6% 527 12,790 9.9% 495Downtown Melting Pot (8D) 0 0.0% 0 0 0.0% 0Front Porches (8E) 1,589 3.2% 197 4,000 3.1% 198Old and Newcomers (8F) 0 0.0% 0 0 0.0% 0Hardscrabble Road (8G) 31 0.1% 5 84 0.1% 5
9. Senior Styles 0 0.0% 0 0 0.0% 0Silver & Gold (9A) 0 0.0% 0 0 0.0% 0Golden Years (9B) 0 0.0% 0 0 0.0% 0The Elders (9C) 0 0.0% 0 0 0.0% 0Senior Escapes (9D) 0 0.0% 0 0 0.0% 0Retirement Communities (9E) 0 0.0% 0 0 0.0% 0Social Security Set (9F) 0 0.0% 0 0 0.0% 0
10. Rustic Outposts 1,604 3.2% 38 4,039 3.1% 37Southern Satellites (10A) 860 1.7% 54 2,093 1.6% 51Rooted Rural (10B) 0 0.0% 0 0 0.0% 0Diners & Miners (10C) 0 0.0% 0 0 0.0% 0Down the Road (10D) 744 1.5% 130 1,946 1.5% 126Rural Bypasses (10E) 0 0.0% 0 0 0.0% 0
11. Midtown Singles 1,777 3.5% 57 3,099 2.4% 43City Strivers (11A) 0 0.0% 0 0 0.0% 0Young and Restless (11B) 1,777 3.5% 209 3,099 2.4% 183Metro Fusion (11C) 0 0.0% 0 0 0.0% 0Set to Impress (11D) 0 0.0% 0 0 0.0% 0City Commons (11E) 0 0.0% 0 0 0.0% 0
12. Hometown 320 0.6% 10 848 0.7% 12Family Foundations (12A) 0 0.0% 0 0 0.0% 0Traditional Living (12B) 320 0.6% 32 848 0.7% 35Small Town Simplicity (12C) 0 0.0% 0 0 0.0% 0Modest Income Homes (12D) 0 0.0% 0 0 0.0% 0
13. Next Wave 20 0.0% 1 63 0.0% 1International Marketplace (13A) 0 0.0% 0 0 0.0% 0Las Casas (13B) 0 0.0% 0 0 0.0% 0NeWest Residents (13C) 20 0.0% 5 63 0.0% 5Fresh Ambitions (13D) 0 0.0% 0 0 0.0% 0High Rise Renters (13E) 0 0.0% 0 0 0.0% 0
14. Scholars and Patriots 0 0.0% 0 0 0.0% 0Military Proximity (14A) 0 0.0% 0 0 0.0% 0College Towns (14B) 0 0.0% 0 0 0.0% 0Dorms to Diplomas (14C) 0 0.0% 0 0 0.0% 0
Unclassified (15) 0 0.0% 0 0 0.0% 0
Data Note: This report identifies neighborhood segments in the area, and describes the socioeconomic quality of the immediate neighborhood. The index is a comparison of the percent of households or population in the area, by Tapestry segment, to the percent of households or population in the United States, by segment. An index of 100 is the US average.Source: Esri
June 02, 2015
©2015 Esri Page 16 of 18

Tapestry Segmentation Area ProfileCornelius - ULI TAP18336 Statesville Rd, Cornelius, North Carolina, 28031 Latitude: 35.46413Drive Time: 15 minute radius Longitude: -80.87102
Tapestry Urbanization Groups 2015 Households 2015 PopulationNumber Percent Index Number Percent Index
Total: 50,352 100.0% 128,626 100.0%
1. Principal Urban Center 1,565 3.1% 45 2,715 2.1% 33Laptops and Lattes (3A) 0 0.0% 0 0 0.0% 0Metro Renters (3B) 1,545 3.1% 207 2,652 2.1% 209Trendsetters (3C) 0 0.0% 0 0 0.0% 0Downtown Melting Pot (8D) 0 0.0% 0 0 0.0% 0City Strivers (11A) 0 0.0% 0 0 0.0% 0NeWest Residents (13C) 20 0.0% 5 63 0.0% 5Fresh Ambitions (13D) 0 0.0% 0 0 0.0% 0High Rise Renters (13E) 0 0.0% 0 0 0.0% 0
2. Urban Periphery 5,841 11.6% 69 12,790 9.9% 53Pacific Heights (2C) 0 0.0% 0 0 0.0% 0Rustbelt Traditions (5D) 0 0.0% 0 0 0.0% 0Urban Villages (7B) 0 0.0% 0 0 0.0% 0American Dreamers (7C) 0 0.0% 0 0 0.0% 0Barrios Urbanos (7D) 0 0.0% 0 0 0.0% 0Southwestern Families (7F) 0 0.0% 0 0 0.0% 0City Lights (8A) 0 0.0% 0 0 0.0% 0Bright Young Professionals (8C) 5,841 11.6% 527 12,790 9.9% 495Metro Fusion (11C) 0 0.0% 0 0 0.0% 0Family Foundations (12A) 0 0.0% 0 0 0.0% 0Modest Income Homes (12D) 0 0.0% 0 0 0.0% 0International Marketplace (13A) 0 0.0% 0 0 0.0% 0Las Casas (13B) 0 0.0% 0 0 0.0% 0
3. Metro Cities 9,010 17.9% 98 18,871 14.7% 94In Style (5B) 2,417 4.8% 213 4,976 3.9% 191Emerald City (8B) 2,876 5.7% 405 5,864 4.6% 408Front Porches (8E) 1,589 3.2% 197 4,000 3.1% 198Old and Newcomers (8F) 0 0.0% 0 0 0.0% 0Hardscrabble Road (8G) 31 0.1% 5 84 0.1% 5Retirement Communities (9E) 0 0.0% 0 0 0.0% 0Social Security Set (9F) 0 0.0% 0 0 0.0% 0Young and Restless (11B) 1,777 3.5% 209 3,099 2.4% 183Set to Impress (11D) 0 0.0% 0 0 0.0% 0City Commons (11E) 0 0.0% 0 0 0.0% 0Traditional Living (12B) 320 0.6% 32 848 0.7% 35College Towns (14B) 0 0.0% 0 0 0.0% 0Dorms to Diplomas (14C) 0 0.0% 0 0 0.0% 0
Data Note: This report identifies neighborhood segments in the area, and describes the socioeconomic quality of the immediate neighborhood. The index is a comparison of the percent of households or population in the area, by Tapestry segment, to the percent of households or population in the United States, by segment. An index of 100 is the US average.Source: Esri
June 02, 2015
©2015 Esri Page 17 of 18

Tapestry Segmentation Area ProfileCornelius - ULI TAP18336 Statesville Rd, Cornelius, North Carolina, 28031 Latitude: 35.46413Drive Time: 15 minute radius Longitude: -80.87102
Tapestry Urbanization Groups 2015 Households 2015 PopulationNumber Percent Index Number Percent Index
Total: 50,352 100.0% 128,626 100.0%4. Suburban Periphery 26,564 52.8% 168 75,080 58.4% 181Top Tier (1A) 2,153 4.3% 248 6,073 4.7% 253Professional Pride (1B) 4,509 9.0% 564 13,698 10.6% 568Boomburbs (1C) 5,557 11.0% 751 16,586 12.9% 716Savvy Suburbanites (1D) 2,180 4.3% 145 5,823 4.5% 141Exurbanites (1E) 826 1.6% 84 1,793 1.4% 75Urban Chic (2A) 931 1.8% 140 3,613 2.8% 232Pleasantville (2B) 0 0.0% 0 0 0.0% 0Enterprising Professionals (2D) 1,488 3.0% 215 3,663 2.8% 221Soccer Moms (4A) 4,120 8.2% 291 11,010 8.6% 271Home Improvement (4B) 0 0.0% 0 0 0.0% 0Comfortable Empty Nesters (5A) 0 0.0% 0 0 0.0% 0Parks and Rec (5C) 0 0.0% 0 0 0.0% 0Midlife Constants (5E) 0 0.0% 0 0 0.0% 0Up and Coming Families (7A) 4,800 9.5% 433 12,821 10.0% 383Silver & Gold (9A) 0 0.0% 0 0 0.0% 0Golden Years (9B) 0 0.0% 0 0 0.0% 0The Elders (9C) 0 0.0% 0 0 0.0% 0Military Proximity (14A) 0 0.0% 0 0 0.0% 0
5. Semirural 5,308 10.5% 112 13,660 10.6% 116Middleburg (4C) 4,564 9.1% 324 11,714 9.1% 312Heartland Communities (6F) 0 0.0% 0 0 0.0% 0Valley Growers (7E) 0 0.0% 0 0 0.0% 0Senior Escapes (9D) 0 0.0% 0 0 0.0% 0Down the Road (10D) 744 1.5% 130 1,946 1.5% 126Small Town Simplicity (12C) 0 0.0% 0 0 0.0% 0
6. Rural 2,064 4.1% 24 5,510 4.3% 25Green Acres (6A) 1,194 2.4% 74 3,389 2.6% 80Salt of the Earth (6B) 10 0.0% 1 28 0.0% 1The Great Outdoors (6C) 0 0.0% 0 0 0.0% 0Prairie Living (6D) 0 0.0% 0 0 0.0% 0Rural Resort Dwellers (6E) 0 0.0% 0 0 0.0% 0Southern Satellites (10A) 860 1.7% 54 2,093 1.6% 51Rooted Rural (10B) 0 0.0% 0 0 0.0% 0Diners & Miners (10C) 0 0.0% 0 0 0% 0Rural Bypasses (10E) 0 0.0% 0 0 0.0% 0
Unclassified (15) 0 0.0% 0 0 0.0% 0
Data Note: This report identifies neighborhood segments in the area, and describes the socioeconomic quality of the immediate neighborhood. The index is a comparison of the percent of households or population in the area, by Tapestry segment, to the percent of households or population in the United States, by segment. An index of 100 is the US average.Source: Esri
June 02, 2015
©2015 Esri Page 18 of 18

Retail MarketPlace ProfileCornelius - ULI TAP18336 Statesville Rd, Cornelius, North Carolina, 28031 Latitude: 35.46413Drive Time: 5 minute radius Longitude: -80.87102
Summary Demographics2015 Population 19,5312015 Households 9,1152015 Median Disposable Income $52,4912015 Per Capita Income $39,206
NAICS Demand Supply Retail Gap Leakage/Surplus Number ofIndustry Summary (Retail Potential) (Retail Sales) Factor Businesses
Total Retail Trade and Food & Drink 44-45,722 $307,998,379 $435,396,270 -$127,397,891 -17.1 261Total Retail Trade 44-45 $273,951,337 $381,363,677 -$107,412,340 -16.4 210Total Food & Drink 722 $34,047,042 $54,032,593 -$19,985,551 -22.7 51
NAICS Demand Supply Retail Gap Leakage/Surplus Number ofIndustry Group (Retail Potential) (Retail Sales) Factor Businesses
Motor Vehicle & Parts Dealers 441 $57,959,617 $168,469,182 -$110,509,565 -48.8 18 Automobile Dealers 4411 $50,300,533 $151,793,166 -$101,492,633 -50.2 6 Other Motor Vehicle Dealers 4412 $3,164,802 $4,380,372 -$1,215,570 -16.1 5 Auto Parts, Accessories & Tire Stores 4413 $4,494,281 $12,295,644 -$7,801,363 -46.5 7Furniture & Home Furnishings Stores 442 $6,764,834 $13,215,885 -$6,451,051 -32.3 19 Furniture Stores 4421 $3,822,492 $8,206,620 -$4,384,128 -36.4 12 Home Furnishings Stores 4422 $2,942,342 $5,009,265 -$2,066,923 -26.0 8Electronics & Appliance Stores 443 $7,861,015 $2,388,088 $5,472,927 53.4 8Bldg Materials, Garden Equip. & Supply Stores 444 $9,598,978 $13,084,542 -$3,485,564 -15.4 11 Bldg Material & Supplies Dealers 4441 $8,304,729 $11,055,584 -$2,750,855 -14.2 9 Lawn & Garden Equip & Supply Stores 4442 $1,294,249 $2,028,958 -$734,709 -22.1 2Food & Beverage Stores 445 $42,040,751 $52,375,209 -$10,334,458 -10.9 22 Grocery Stores 4451 $39,662,067 $35,551,882 $4,110,185 5.5 15 Specialty Food Stores 4452 $738,244 $766,894 -$28,650 -1.9 5 Beer, Wine & Liquor Stores 4453 $1,640,440 $16,056,432 -$14,415,992 -81.5 2Health & Personal Care Stores 446,4461 $21,907,752 $23,522,533 -$1,614,781 -3.6 17Gasoline Stations 447,4471 $29,331,370 $8,832,780 $20,498,590 53.7 3Clothing & Clothing Accessories Stores 448 $18,225,392 $45,472,212 -$27,246,820 -42.8 38 Clothing Stores 4481 $12,951,424 $43,443,730 -$30,492,306 -54.1 30 Shoe Stores 4482 $2,511,728 $1,156,800 $1,354,928 36.9 3 Jewelry, Luggage & Leather Goods Stores 4483 $2,762,240 $871,683 $1,890,557 52.0 4Sporting Goods, Hobby, Book & Music Stores 451 $6,326,367 $22,827,464 -$16,501,097 -56.6 20 Sporting Goods/Hobby/Musical Instr Stores 4511 $4,616,870 $20,597,077 -$15,980,207 -63.4 16 Book, Periodical & Music Stores 4512 $1,709,497 $2,230,387 -$520,890 -13.2 3General Merchandise Stores 452 $52,445,017 $22,680,267 $29,764,750 39.6 7 Department Stores Excluding Leased Depts. 4521 $17,949,880 $16,514,228 $1,435,652 4.2 4 Other General Merchandise Stores 4529 $34,495,137 $6,166,039 $28,329,098 69.7 4Miscellaneous Store Retailers 453 $6,817,829 $7,451,569 -$633,740 -4.4 37 Florists 4531 $256,915 $309,505 -$52,590 -9.3 2 Office Supplies, Stationery & Gift Stores 4532 $1,986,972 $3,592,996 -$1,606,024 -28.8 6 Used Merchandise Stores 4533 $921,023 $1,564,636 -$643,613 -25.9 7 Other Miscellaneous Store Retailers 4539 $3,652,919 $1,984,432 $1,668,487 29.6 22Nonstore Retailers 454 $14,672,415 $1,043,945 $13,628,470 86.7 9 Electronic Shopping & Mail-Order Houses 4541 $11,662,780 $0 $11,662,780 100.0 0 Vending Machine Operators 4542 $653,995 $450,452 $203,543 18.4 3 Direct Selling Establishments 4543 $2,355,640 $470,787 $1,884,853 66.7 6Food Services & Drinking Places 722 $34,047,042 $54,032,593 -$19,985,551 -22.7 51 Full-Service Restaurants 7221 $12,533,481 $21,531,766 -$8,998,285 -26.4 18 Limited-Service Eating Places 7222 $18,054,252 $26,202,574 -$8,148,322 -18.4 20 Special Food Services 7223 $746,807 $2,417,333 -$1,670,526 -52.8 2 Drinking Places - Alcoholic Beverages 7224 $2,712,502 $3,880,919 -$1,168,417 -17.7 11
Data Note: Supply (retail sales) estimates sales to consumers by establishments. Sales to businesses are excluded. Demand (retail potential) estimates the expected amount spent by consumers at retail establishments. Supply and demand estimates are in current dollars. The Leakage/Surplus Factor presents a snapshot of retail opportunity. This is a measure of the relationship between supply and demand that ranges from +100 (total leakage) to -100 (total surplus). A positive value represents 'leakage' of retail opportunity outside the trade area. A negative value represents a surplus of retail sales, a market where customers are drawn in from outside the trade area. The Retail Gap represents the difference between Retail Potential and Retail Sales. Esri uses the North American Industry Classification System (NAICS) to classify businesses by their primary type of economic activity. Retail establishments are classified into 27 industry groups in the Retail Trade sector, as well as four industry groups within the Food Services & Drinking Establishments subsector. For more information on the Retail MarketPlace data, please view the methodology statement at http://www.esri.com/library/whitepapers/pdfs/esri-data-retail-marketplace.pdf.Source: Esri and Dun & Bradstreet. Copyright 2015 Dun & Bradstreet, Inc. All rights reserved.
June 02, 2015
©2015 Esri Page 1 of 6

Retail MarketPlace ProfileCornelius - ULI TAP18336 Statesville Rd, Cornelius, North Carolina, 28031 Latitude: 35.46413Drive Time: 5 minute radius Longitude: -80.87102
Leakage/Surplus Factor by Industry SubsectorLeakage/Surplus Factor by Industry Subsector
Food Services & Drinking Places Nonstore Retailers
Miscellaneous Store Retailers General Merchandise Stores
Sporting Goods, Hobby, Book, and Music Stores Clothing and Clothing Accessories Stores
Gasoline Stations Health & Personal Care Stores
Food & Beverage Stores Bldg Materials, Garden Equip. & Supply Stores
Electronics & Appliance Stores Furniture & Home Furnishings Stores
Motor Vehicle & Parts Dealers
Leakage/Surplus Factor80706050403020100-10-20-30-40-50
Leakage/Surplus Factor by Industry GroupLeakage/Surplus Factor by Industry Group
Drinking Places (Alcoholic Beverages) Special Food Services
Limited-Service Eating Places Full-Service Restaurants
Direct Selling Establishments Vending Machine Operators
Electronic Shopping and Mail-Order Houses Other Miscellaneous Store Retailers
Used Merchandise Stores Office Supplies, Stationery, and Gift Stores
Florists Other General Merchandise Stores
Department Stores (Excluding Leased Depts.) Book, Periodical, and Music Stores
Jewelry, Luggage, and Leather Goods Stores
Shoe Stores Clothing Stores
Gasoline Stations Health & Personal Care Stores Beer, Wine, and Liquor Stores
Specialty Food Stores Grocery Stores
Lawn and Garden Equipment and Supplies Stores Building Material and Supplies Dealers
Electronics & Appliance Stores Home Furnishings Stores
Furniture StoresAuto Parts, Accessories, and Tire Stores
Other Motor Vehicle Dealers Automobile Dealers
Leakage/Surplus Factor100806040200-20-40-60-80
Source: Esri and Dun & Bradstreet. Copyright 2015 Dun & Bradstreet, Inc. All rights reserved.
June 02, 2015
©2015 Esri Page 2 of 6

Retail MarketPlace ProfileCornelius - ULI TAP18336 Statesville Rd, Cornelius, North Carolina, 28031 Latitude: 35.46413Drive Time: 10 minute radius Longitude: -80.87102
Summary Demographics2015 Population 61,2902015 Households 25,5292015 Median Disposable Income $57,8032015 Per Capita Income $44,272
NAICS Demand Supply Retail Gap Leakage/Surplus Number ofIndustry Summary (Retail Potential) (Retail Sales) Factor Businesses
Total Retail Trade and Food & Drink 44-45,722 $1,037,885,047 $867,887,849 $169,997,198 8.9 585Total Retail Trade 44-45 $923,085,242 $752,503,995 $170,581,247 10.2 475Total Food & Drink 722 $114,799,805 $115,383,854 -$584,049 -0.3 110
NAICS Demand Supply Retail Gap Leakage/Surplus Number ofIndustry Group (Retail Potential) (Retail Sales) Factor Businesses
Motor Vehicle & Parts Dealers 441 $195,899,531 $291,512,784 -$95,613,253 -19.6 45 Automobile Dealers 4411 $169,412,721 $257,073,415 -$87,660,694 -20.6 12 Other Motor Vehicle Dealers 4412 $11,284,557 $11,472,710 -$188,153 -0.8 14 Auto Parts, Accessories & Tire Stores 4413 $15,202,253 $22,966,659 -$7,764,406 -20.3 20Furniture & Home Furnishings Stores 442 $23,255,852 $19,027,426 $4,228,426 10.0 39 Furniture Stores 4421 $12,968,492 $10,959,197 $2,009,295 8.4 21 Home Furnishings Stores 4422 $10,287,360 $8,068,229 $2,219,131 12.1 19Electronics & Appliance Stores 443 $26,553,468 $5,288,121 $21,265,347 66.8 19Bldg Materials, Garden Equip. & Supply Stores 444 $34,430,947 $35,495,343 -$1,064,396 -1.5 32 Bldg Material & Supplies Dealers 4441 $29,791,742 $30,262,798 -$471,056 -0.8 28 Lawn & Garden Equip & Supply Stores 4442 $4,639,204 $5,232,545 -$593,341 -6.0 3Food & Beverage Stores 445 $139,708,686 $154,361,236 -$14,652,550 -5.0 63 Grocery Stores 4451 $131,688,908 $135,103,648 -$3,414,740 -1.3 41 Specialty Food Stores 4452 $2,456,670 $2,362,961 $93,709 1.9 18 Beer, Wine & Liquor Stores 4453 $5,563,108 $16,894,627 -$11,331,519 -50.5 4Health & Personal Care Stores 446,4461 $74,564,298 $61,529,447 $13,034,851 9.6 41Gasoline Stations 447,4471 $97,025,951 $18,032,726 $78,993,225 68.7 6Clothing & Clothing Accessories Stores 448 $61,574,541 $52,492,158 $9,082,383 8.0 63 Clothing Stores 4481 $43,731,030 $48,363,629 -$4,632,599 -5.0 48 Shoe Stores 4482 $8,361,137 $2,130,248 $6,230,889 59.4 6 Jewelry, Luggage & Leather Goods Stores 4483 $9,482,374 $1,998,280 $7,484,094 65.2 9Sporting Goods, Hobby, Book & Music Stores 451 $21,374,459 $32,883,054 -$11,508,595 -21.2 43 Sporting Goods/Hobby/Musical Instr Stores 4511 $15,673,723 $28,541,812 -$12,868,089 -29.1 35 Book, Periodical & Music Stores 4512 $5,700,736 $4,341,242 $1,359,494 13.5 8General Merchandise Stores 452 $175,442,551 $54,924,216 $120,518,335 52.3 13 Department Stores Excluding Leased Depts. 4521 $60,552,853 $47,388,049 $13,164,804 12.2 6 Other General Merchandise Stores 4529 $114,889,698 $7,536,167 $107,353,531 87.7 7Miscellaneous Store Retailers 453 $22,946,398 $22,254,136 $692,262 1.5 89 Florists 4531 $924,380 $404,466 $519,914 39.1 4 Office Supplies, Stationery & Gift Stores 4532 $6,733,997 $12,048,162 -$5,314,165 -28.3 22 Used Merchandise Stores 4533 $3,088,969 $3,148,824 -$59,855 -1.0 16 Other Miscellaneous Store Retailers 4539 $12,199,052 $6,652,683 $5,546,369 29.4 46Nonstore Retailers 454 $50,308,561 $4,703,348 $45,605,213 82.9 24 Electronic Shopping & Mail-Order Houses 4541 $39,516,541 $1,364,586 $38,151,955 93.3 3 Vending Machine Operators 4542 $2,174,354 $727,266 $1,447,088 49.9 6 Direct Selling Establishments 4543 $8,617,666 $2,611,496 $6,006,170 53.5 14Food Services & Drinking Places 722 $114,799,805 $115,383,854 -$584,049 -0.3 110 Full-Service Restaurants 7221 $42,110,933 $56,024,298 -$13,913,365 -14.2 40 Limited-Service Eating Places 7222 $60,643,677 $47,626,611 $13,017,066 12.0 44 Special Food Services 7223 $2,618,402 $5,404,726 -$2,786,324 -34.7 5 Drinking Places - Alcoholic Beverages 7224 $9,426,794 $6,328,220 $3,098,574 19.7 21
Data Note: Supply (retail sales) estimates sales to consumers by establishments. Sales to businesses are excluded. Demand (retail potential) estimates the expected amount spent by consumers at retail establishments. Supply and demand estimates are in current dollars. The Leakage/Surplus Factor presents a snapshot of retail opportunity. This is a measure of the relationship between supply and demand that ranges from +100 (total leakage) to -100 (total surplus). A positive value represents 'leakage' of retail opportunity outside the trade area. A negative value represents a surplus of retail sales, a market where customers are drawn in from outside the trade area. The Retail Gap represents the difference between Retail Potential and Retail Sales. Esri uses the North American Industry Classification System (NAICS) to classify businesses by their primary type of economic activity. Retail establishments are classified into 27 industry groups in the Retail Trade sector, as well as four industry groups within the Food Services & Drinking Establishments subsector. For more information on the Retail MarketPlace data, please view the methodology statement at http://www.esri.com/library/whitepapers/pdfs/esri-data-retail-marketplace.pdf.Source: Esri and Dun & Bradstreet. Copyright 2015 Dun & Bradstreet, Inc. All rights reserved.
June 02, 2015
©2015 Esri Page 3 of 6

Retail MarketPlace ProfileCornelius - ULI TAP18336 Statesville Rd, Cornelius, North Carolina, 28031 Latitude: 35.46413Drive Time: 10 minute radius Longitude: -80.87102
Leakage/Surplus Factor by Industry SubsectorLeakage/Surplus Factor by Industry Subsector
Food Services & Drinking Places Nonstore Retailers
Miscellaneous Store Retailers General Merchandise Stores
Sporting Goods, Hobby, Book, and Music Stores Clothing and Clothing Accessories Stores
Gasoline Stations Health & Personal Care Stores
Food & Beverage Stores Bldg Materials, Garden Equip. & Supply Stores
Electronics & Appliance Stores Furniture & Home Furnishings Stores
Motor Vehicle & Parts Dealers
Leakage/Surplus Factor80706050403020100-10-20
Leakage/Surplus Factor by Industry GroupLeakage/Surplus Factor by Industry Group
Drinking Places (Alcoholic Beverages) Special Food Services
Limited-Service Eating Places Full-Service Restaurants
Direct Selling Establishments Vending Machine Operators
Electronic Shopping and Mail-Order Houses Other Miscellaneous Store Retailers
Used Merchandise Stores Office Supplies, Stationery, and Gift Stores
Florists Other General Merchandise Stores
Department Stores (Excluding Leased Depts.) Book, Periodical, and Music Stores
Jewelry, Luggage, and Leather Goods Stores
Shoe Stores Clothing Stores
Gasoline Stations Health & Personal Care Stores Beer, Wine, and Liquor Stores
Specialty Food Stores Grocery Stores
Lawn and Garden Equipment and Supplies Stores Building Material and Supplies Dealers
Electronics & Appliance Stores Home Furnishings Stores
Furniture StoresAuto Parts, Accessories, and Tire Stores
Other Motor Vehicle Dealers Automobile Dealers
Leakage/Surplus Factor9080706050403020100-10-20-30-40-50
Source: Esri and Dun & Bradstreet. Copyright 2015 Dun & Bradstreet, Inc. All rights reserved.
June 02, 2015
©2015 Esri Page 4 of 6

Retail MarketPlace ProfileCornelius - ULI TAP18336 Statesville Rd, Cornelius, North Carolina, 28031 Latitude: 35.46413Drive Time: 15 minute radius Longitude: -80.87102
Summary Demographics2015 Population 128,6262015 Households 50,3502015 Median Disposable Income $56,7712015 Per Capita Income $40,204
NAICS Demand Supply Retail Gap Leakage/Surplus Number ofIndustry Summary (Retail Potential) (Retail Sales) Factor Businesses
Total Retail Trade and Food & Drink 44-45,722 $1,985,937,670 $2,168,859,070 -$182,921,400 -4.4 1,280Total Retail Trade 44-45 $1,766,594,131 $1,952,171,704 -$185,577,573 -5.0 1,056Total Food & Drink 722 $219,343,539 $216,687,366 $2,656,173 0.6 224
NAICS Demand Supply Retail Gap Leakage/Surplus Number ofIndustry Group (Retail Potential) (Retail Sales) Factor Businesses
Motor Vehicle & Parts Dealers 441 $376,332,821 $530,849,621 -$154,516,800 -17.0 115 Automobile Dealers 4411 $325,825,864 $445,950,872 -$120,125,008 -15.6 26 Other Motor Vehicle Dealers 4412 $21,553,274 $33,809,946 -$12,256,672 -22.1 39 Auto Parts, Accessories & Tire Stores 4413 $28,953,684 $51,088,803 -$22,135,119 -27.7 50Furniture & Home Furnishings Stores 442 $44,456,217 $61,363,864 -$16,907,647 -16.0 78 Furniture Stores 4421 $24,867,630 $41,435,321 -$16,567,691 -25.0 38 Home Furnishings Stores 4422 $19,588,586 $19,928,544 -$339,958 -0.9 40Electronics & Appliance Stores 443 $50,655,383 $101,782,326 -$51,126,943 -33.5 42Bldg Materials, Garden Equip. & Supply Stores 444 $64,855,438 $137,875,665 -$73,020,227 -36.0 76 Bldg Material & Supplies Dealers 4441 $55,928,890 $129,639,455 -$73,710,565 -39.7 69 Lawn & Garden Equip & Supply Stores 4442 $8,926,548 $8,236,209 $690,339 4.0 7Food & Beverage Stores 445 $267,336,729 $234,272,813 $33,063,916 6.6 116 Grocery Stores 4451 $252,051,262 $210,283,057 $41,768,205 9.0 74 Specialty Food Stores 4452 $4,703,871 $3,913,208 $790,663 9.2 36 Beer, Wine & Liquor Stores 4453 $10,581,596 $20,076,548 -$9,494,952 -31.0 7Health & Personal Care Stores 446,4461 $142,776,298 $126,020,761 $16,755,537 6.2 82Gasoline Stations 447,4471 $186,340,937 $65,950,146 $120,390,791 47.7 17Clothing & Clothing Accessories Stores 448 $117,340,557 $212,140,310 -$94,799,753 -28.8 166 Clothing Stores 4481 $83,401,853 $156,487,837 -$73,085,984 -30.5 121 Shoe Stores 4482 $15,933,963 $25,365,156 -$9,431,193 -22.8 18 Jewelry, Luggage & Leather Goods Stores 4483 $18,004,740 $30,287,317 -$12,282,577 -25.4 28Sporting Goods, Hobby, Book & Music Stores 451 $40,807,037 $78,912,985 -$38,105,948 -31.8 86 Sporting Goods/Hobby/Musical Instr Stores 4511 $29,943,276 $71,751,626 -$41,808,350 -41.1 72 Book, Periodical & Music Stores 4512 $10,863,761 $7,161,360 $3,702,401 20.5 14General Merchandise Stores 452 $335,818,353 $320,888,016 $14,930,337 2.3 30 Department Stores Excluding Leased Depts. 4521 $115,855,135 $119,425,038 -$3,569,903 -1.5 15 Other General Merchandise Stores 4529 $219,963,218 $201,462,978 $18,500,240 4.4 15Miscellaneous Store Retailers 453 $43,929,871 $64,967,001 -$21,037,130 -19.3 197 Florists 4531 $1,776,680 $1,074,183 $702,497 24.6 11 Office Supplies, Stationery & Gift Stores 4532 $12,865,567 $25,254,041 -$12,388,474 -32.5 48 Used Merchandise Stores 4533 $5,883,559 $4,642,542 $1,241,017 11.8 24 Other Miscellaneous Store Retailers 4539 $23,404,065 $33,996,236 -$10,592,171 -18.5 115Nonstore Retailers 454 $95,944,488 $17,148,197 $78,796,291 69.7 52 Electronic Shopping & Mail-Order Houses 4541 $75,440,522 $5,542,309 $69,898,213 86.3 9 Vending Machine Operators 4542 $4,162,052 $6,315,424 -$2,153,372 -20.6 13 Direct Selling Establishments 4543 $16,341,915 $5,290,464 $11,051,451 51.1 30Food Services & Drinking Places 722 $219,343,539 $216,687,366 $2,656,173 0.6 224 Full-Service Restaurants 7221 $80,460,060 $108,837,011 -$28,376,951 -15.0 84 Limited-Service Eating Places 7222 $115,943,620 $87,960,544 $27,983,076 13.7 93 Special Food Services 7223 $5,054,790 $9,715,963 -$4,661,173 -31.6 14 Drinking Places - Alcoholic Beverages 7224 $17,885,069 $10,173,848 $7,711,221 27.5 34
Data Note: Supply (retail sales) estimates sales to consumers by establishments. Sales to businesses are excluded. Demand (retail potential) estimates the expected amount spent by consumers at retail establishments. Supply and demand estimates are in current dollars. The Leakage/Surplus Factor presents a snapshot of retail opportunity. This is a measure of the relationship between supply and demand that ranges from +100 (total leakage) to -100 (total surplus). A positive value represents 'leakage' of retail opportunity outside the trade area. A negative value represents a surplus of retail sales, a market where customers are drawn in from outside the trade area. The Retail Gap represents the difference between Retail Potential and Retail Sales. Esri uses the North American Industry Classification System (NAICS) to classify businesses by their primary type of economic activity. Retail establishments are classified into 27 industry groups in the Retail Trade sector, as well as four industry groups within the Food Services & Drinking Establishments subsector. For more information on the Retail MarketPlace data, please view the methodology statement at http://www.esri.com/library/whitepapers/pdfs/esri-data-retail-marketplace.pdf.Source: Esri and Dun & Bradstreet. Copyright 2015 Dun & Bradstreet, Inc. All rights reserved.
June 02, 2015
©2015 Esri Page 5 of 6

Retail MarketPlace ProfileCornelius - ULI TAP18336 Statesville Rd, Cornelius, North Carolina, 28031 Latitude: 35.46413Drive Time: 15 minute radius Longitude: -80.87102
Leakage/Surplus Factor by Industry SubsectorLeakage/Surplus Factor by Industry Subsector
Food Services & Drinking Places Nonstore Retailers
Miscellaneous Store Retailers General Merchandise Stores
Sporting Goods, Hobby, Book, and Music Stores Clothing and Clothing Accessories Stores
Gasoline Stations Health & Personal Care Stores
Food & Beverage Stores Bldg Materials, Garden Equip. & Supply Stores
Electronics & Appliance Stores Furniture & Home Furnishings Stores
Motor Vehicle & Parts Dealers
Leakage/Surplus Factor6050403020100-10-20-30
Leakage/Surplus Factor by Industry GroupLeakage/Surplus Factor by Industry Group
Drinking Places (Alcoholic Beverages) Special Food Services
Limited-Service Eating Places Full-Service Restaurants
Direct Selling Establishments Vending Machine Operators
Electronic Shopping and Mail-Order Houses Other Miscellaneous Store Retailers
Used Merchandise Stores Office Supplies, Stationery, and Gift Stores
Florists Other General Merchandise Stores
Department Stores (Excluding Leased Depts.) Book, Periodical, and Music Stores
Jewelry, Luggage, and Leather Goods Stores
Shoe Stores Clothing Stores
Gasoline Stations Health & Personal Care Stores Beer, Wine, and Liquor Stores
Specialty Food Stores Grocery Stores
Lawn and Garden Equipment and Supplies Stores Building Material and Supplies Dealers
Electronics & Appliance Stores Home Furnishings Stores
Furniture StoresAuto Parts, Accessories, and Tire Stores
Other Motor Vehicle Dealers Automobile Dealers
Leakage/Surplus Factor80706050403020100-10-20-30
Source: Esri and Dun & Bradstreet. Copyright 2015 Dun & Bradstreet, Inc. All rights reserved.
June 02, 2015
©2015 Esri Page 6 of 6

TAPESTRYSEGMENTATION
TM
esri.com/tapestry
Households: 1,695,000
Average Household Size: 3.22
Median Age: 33.6
Median Household Income: $105,000
LifeMode Group: Affluent Estates
Boomburbs
WHO ARE WE?This is the new growth market, with a profi le similar to the original: young professionals with families that have opted to trade up to the newest housing in the suburbs. The original Boomburbs neighborhoods began growing in the 1990s and continued through the peak of the housing boom. Most of those neighborhoods are fully developed now. This is an affl uent market but with a higher proportion of mortgages. Rapid growth still distinguishes the Boomburbsneighborhoods, although the boom is more subdued now than it was 10 years ago. So is the housing market. Residents are well-educated professionals with a running starton prosperity.
OUR NEIGHBORHOOD• Growth markets are in the suburban periphery of large metropolitan areas.
• Young families are married with children (Index 221); average household size is 3.22.
• Home ownership is 84% (Index 133), with the highest rate of mortgages, 78% (Index 173).
• Primarily single-family homes, in new neighborhoods, 72% built since 2000 (Index 521).
• Median home value is $293,000 (Index 165).
• Lower housing vacancy rate at 5.3%.
• The cost of affordable new housing comes at the expense of one of the longest commutes to work, over 30 minutes average, including a disproportionate number (34.5%) commuting across county lines (Index 146).
SOCIOECONOMIC TRAITS• Well educated young professionals, 52% are college graduates (Index 185).
• Unemployment is low at 5.2% (Index 60); high labor force participation at 72% (Index 115); most households have more than two workers (Index 123).
• Longer commute times from the suburban growth corridors (Index 121) have created more home workers (Index 154).
• They are well connected: own the latest devices and understand how to use them effi ciently; biggest complaints—too many devices and too many intrusions on personal time.
• Financial planning is well under way for these professionals.
Note: The Index represents the ratio of the segment rate to the US rate multiplied by 100. Consumer preferences are estimated from data by GfK MRI.
1C
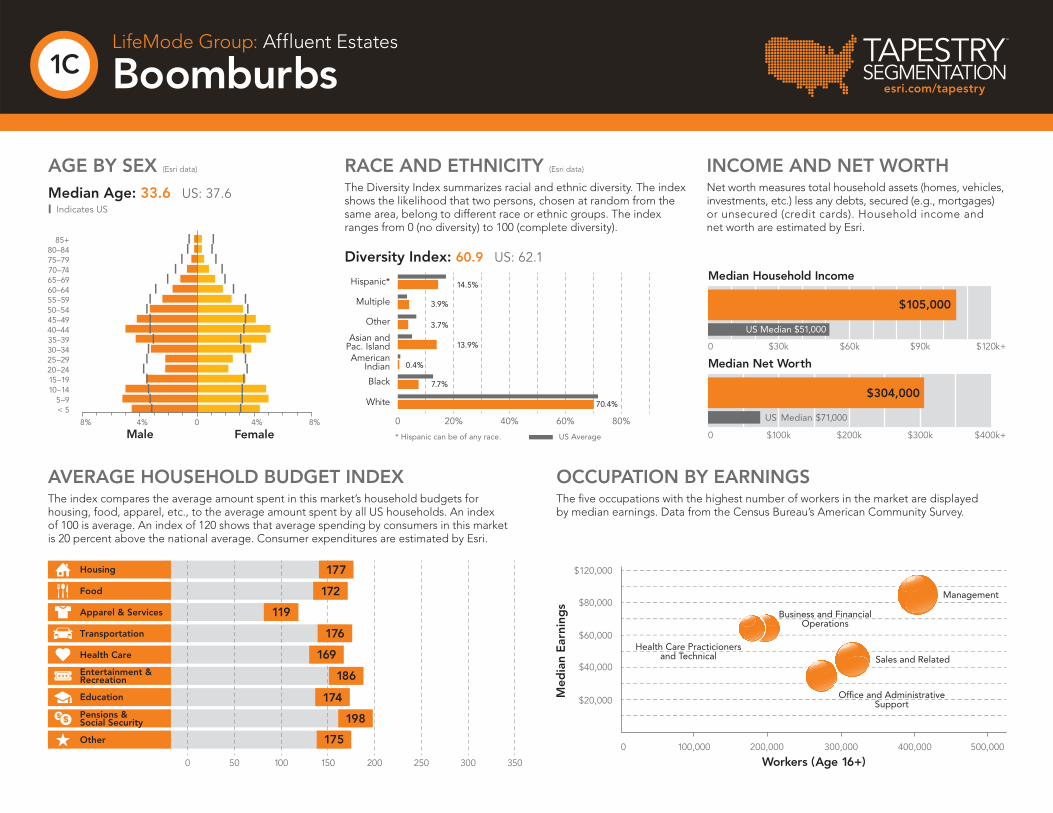
85+80–8475–7970–7465–6960–6455–5950–5445–4940–4435–3930–3425–2920–2415–1910–14
Male Female
5–9< 5
8% 4% 0 4% 8%
* Hispanic can be of any race. US Average
70.4%
7.7%
3.7%
3.9%
14.5%
0.4%
13.9%
80%60%40%20%0
White
Black
AmericanIndian
Asian andPac. Island
Other
Multiple
Hispanic*
0
$60k $90k$30k $120k+
Median Household Income
$105,000
US Median $51,000
0
0
$300k$100k $200k $400k+
Median Net Worth
$304,000
US Median $71,000
$120,000
$80,000
$60,000
$40,000
$20,000
100,0000 200,000 300,000 500,000400,000
Med
ian
Ear
ning
s
Workers (Age 16+)
Health Care Practicionersand Technical
Business and FinancialOperations
Office and AdministrativeSupport
Management
Sales and Related
3500 50 100 150 200 250 300
Housing
Food
Apparel & Services
Transportation
Health Care
Entertainment &Recreation
Education
Pensions &Social Security
Other
172
119
176
169
186
174
198
175
177
TAPESTRYSEGMENTATION
TM
esri.com/tapestry
LifeMode Group: Affluent Estates
Boomburbs
INCOME AND NET WORTHNet worth measures total household assets (homes, vehicles, investments, etc.) less any debts, secured (e.g., mortgages)or unsecured (credit cards). Household income andnet worth are estimated by Esri.
AGE BY SEX (Esri data)
Median Age: 33.6 US: 37.6| Indicates US
RACE AND ETHNICITY (Esri data)
The Diversity Index summarizes racial and ethnic diversity. The index shows the likelihood that two persons, chosen at random from the same area, belong to different race or ethnic groups. The index ranges from 0 (no diversity) to 100 (complete diversity).
Diversity Index: 60.9 US: 62.1
1C
OCCUPATION BY EARNINGSThe fi ve occupations with the highest number of workers in the market are displayedby median earnings. Data from the Census Bureau’s American Community Survey.
AVERAGE HOUSEHOLD BUDGET INDEXThe index compares the average amount spent in this market’s household budgets for housing, food, apparel, etc., to the average amount spent by all US households. An indexof 100 is average. An index of 120 shows that average spending by consumers in this marketis 20 percent above the national average. Consumer expenditures are estimated by Esri.

Population900,000 11,000,000
5,479,000
Population Growth (Annual %)-0.5% 3.0%
2.7%
Population Density (Persons per sq. mile)0 25,000
1000
859
0Wealth Index
192 350
0Socioeconomic Status Index
174 350
0Housing Affordability Index
186 350
Own84.5%
Rent15.5%
HomeOwnership
US Percentage:63.6% Own36.4% Rent
TAPESTRYSEGMENTATION
TM
esri.com/tapestry
MARKET PROFILE (Consumer preferences are estimated from data by GfK MRI)
• Boomburbs residents prefer late model imports, primarily SUVs, and also luxury cars and minivans.
• This is one of the top markets for the latest in technology, from smartphones to tablets to Internet connectable televisions.
• Style matters in the Boomburbs, from personal appearance to their homes. These consumers are still furnishing their new homes and already remodeling.
• They like to garden but more often contract for home services.
• Physical fi tness is a priority, including club memberships and home equipment.
• Leisure includes a range of activities from sports (hiking, bicycling, swimming, golf) to visits to theme parks or water parks.
• Residents are generous supporters of charitable organizations.
ESRI INDEXESEsri developed three indexes to display average household wealth, socioeconomic status,and housing affordability for the market relative to US standards.
POPULATION CHARACTERISTICSTotal population, average annual population change since Census 2010, and average density (population per square mile) are displayed for the market relative to the sizeand change among all Tapestry markets. Data estimated by Esri.
LifeMode Group: Affluent Estates
Boomburbs1C
HOUSINGMedian home value is displayed for markets that are primarilyowner occupied; average rent is shown for renter-occupied markets. Tenure and home value are estimated by Esri. Housing type and average rent are from the Census Bureau’s American Community Survey.
Typical Housing:Single Family
Median Value:$293,000US Median: $177,000

TAPESTRYSEGMENTATION
TM
esri.com/tapestry
Households: 2,613,000
Average Household Size: 2.40
Median Age: 32.2
Median Household Income: $50,000
LifeMode Group: Middle Ground
Bright Young Professionals
WHO ARE WE?Bright Young Professionals is a large market, primarily located in urban outskirts of large metropolitan areas. These communities are home to young, educated, working professionals. One out of three householders is underthe age of 35. Slightly more diverse couples dominatethis market, with more renters than homeowners. More than two-fi fths of the households live in single-family homes; over a third live in 5+ unit buildings. Labor force participation is high, generally white-collar work, with amix of food service and part-time jobs (among the college students). Median household income, median home value, and average rent are close to the US values. Residentsof this segment are physically active and up on thelatest technology.
OUR NEIGHBORHOOD• Approximately 56% of the households rent; 44% own their homes.
• Household type is primarily couples, married (or unmarried), with above average concentrations of both single-parent (Index 125) and single-person (Index 115) households.
• Multiunit buildings or row housing make up 55% of the housing stock (row housing (Index 182), buildings with 5–19 units (Index 277)); 44% built 1980–99.
• Average rent is slightly higher than the US (Index 102).
• Lower vacancy rate is at 8.9%.
SOCIOECONOMIC TRAITS• Education completed: 36% with some college or an associate’s degree, 30% with a bachelor’s degree or higher. Education in progress is 10% (Index 127).
• Unemployment rate is lower at 7.1%, and labor force participation rate of 73% is higher than the US rate.
• These consumers are up on the latest technology.
• They get most of their information from the Internet.
• Concern about the environment, impacts their purchasing decisions.
Note: The Index represents the ratio of the segment rate to the US rate multiplied by 100. Consumer preferences are estimated from data by GfK MRI.
8C

Male Female8% 4% 0 4% 8%
85+80–8475–7970–7465–6960–6455–5950–5445–4940–4435–3930–3425–2920–2415–1910–14
5–9< 5
* Hispanic can be of any race. US Average
67.1%
16.0%
6.1%
4.2%
16.6%
1.0%
5.6%
80%60%40%20%0
White
Black
AmericanIndian
Asian andPac. Island
Other
Multiple
Hispanic*
0
$60k $90k$30k $120k+
Median Household Income
$50,000
US Median $51,000
0
0
$300k$100k $200k $400k+
Median Net Worth
$28,000
US Median $71,000
$70,000
$30,000
$50,000
$10,000
0 700,000
Med
ian
Ear
ning
s
Workers (Age 16+)100,000 300,000 500,000
Sales and Related
Education, Training,and Library
Office andAdministrative Support
Management
Food Preparation andServing Related
3500 50 100 150 200 250 300
Housing
Food
Apparel & Services
Transportation
Health Care
Entertainment &Recreation
Education
Pensions &Social Security
Other
89
61
89
81
89
88
89
84
90
TAPESTRYSEGMENTATION
TM
esri.com/tapestry
LifeMode Group: Middle Ground
Bright Young Professionals
INCOME AND NET WORTHNet worth measures total household assets (homes, vehicles, investments, etc.) less any debts, secured (e.g., mortgages)or unsecured (credit cards). Household income andnet worth are estimated by Esri.
AGE BY SEX (Esri data)
Median Age: 32.2 US: 37.6| Indicates US
RACE AND ETHNICITY (Esri data)
The Diversity Index summarizes racial and ethnic diversity. The index shows the likelihood that two persons, chosen at random from the same area, belong to different race or ethnic groups. The index ranges from 0 (no diversity) to 100 (complete diversity).
Diversity Index: 65.4 US: 62.1
8C
OCCUPATION BY EARNINGSThe fi ve occupations with the highest number of workers in the market are displayedby median earnings. Data from the Census Bureau’s American Community Survey.
AVERAGE HOUSEHOLD BUDGET INDEXThe index compares the average amount spent in this market’s household budgets for housing, food, apparel, etc., to the average amount spent by all US households. An indexof 100 is average. An index of 120 shows that average spending by consumers in this marketis 20 percent above the national average. Consumer expenditures are estimated by Esri.

Population900,000 11,000,000
6,309,000
Population Growth (Annual %)-0.5% 3.0%
0.8%
Population Density (Persons per sq. mile)0 25,000
1000
731
0Wealth Index
66 350
0Socioeconomic Status Index
103 350
0Housing Affordability Index
152 350
Own44.1%
Rent55.9%
HomeOwnership
US Percentage:63.6% Own36.4% Rent
TAPESTRYSEGMENTATION
TM
esri.com/tapestry
MARKET PROFILE (Consumer preferences are estimated from data by GfK MRI)
• Own US savings bonds.
• Own newer computers (desktop, laptop, or both), iPods, and 2+ TVs.
• Go online to do banking, access YouTube or Facebook, visit blogs, and play games.
• Use cell phones to text, redeem mobile coupons, listen to music, and check for news and fi nancial information.
• Find leisure going to bars/clubs, attending concerts, going to the zoo, and renting DVDs from Redbox or Netfl ix.
• Read sports magazines and participate in a variety of sports, including backpacking, basketball, football, bowling, Pilates, weight lifting, and yoga.
• Eat out often at fast-food and family restaurants.
ESRI INDEXESEsri developed three indexes to display average household wealth, socioeconomic status,and housing affordability for the market relative to US standards.
POPULATION CHARACTERISTICSTotal population, average annual population change since Census 2010, and average density (population per square mile) are displayed for the market relative to the sizeand change among all Tapestry markets. Data estimated by Esri.
LifeMode Group: Middle Ground
Bright Young Professionals8C
HOUSINGMedian home value is displayed for markets that are primarilyowner occupied; average rent is shown for renter-occupied markets. Tenure and home value are estimated by Esri. Housing type and average rent are from the Census Bureau’s American Community Survey.
Typical Housing:Single Family;Multiunits
Average Rent:$1,000US Average: $990