
NioGold Mining Corporation - Metals News Interview with Yan Ducharme
Upload
barbara-stanleyCategory
view
214download
0
The University of Georgia
Racial Disparities in Access to Addiction Treatment Medications
Hannah K. Knudsen, Ph.D.Lori J. Ducharme, Ph.D.Paul M. Roman, Ph.D.

The University of Georgia
Racial & Ethnic Disparities in Healthcare
• Institute of Medicine’s report (2003), Unequal Treatment: Confronting Racial and Ethnic Disparities in Healthcare, documents persistent healthcare disparities in the US
• Racial and ethnic differences in the receipt of evidence-based, high-quality care for a wide range of conditions:– Cardiovascular disease– Breast cancer– HIV/AIDS– Asthma
• These differences in receipt of services have implications for long-term health & greater risk of mortality among racial/ethnic minorities

The University of Georgia
Racial & Ethnic Disparities: Mental Health &
Substance Abuse Treatment
• Evidence of disparities in behavioral healthcare
• Racial/ethnic disparities in access to specialty mental health services– Differences in receipt of psychotropic
medications, such as lower likelihood of receiving state-of-the-art medications

The University of Georgia
Conventional Explanations of Disparities
• There is a tendency of focusing on individuals as the level of analysis
• Patient-level factors– Socio-economic status & insurance coverage– Patient preferences & lack of adherence to
recommended treatment regimen– Neither explanation fully accounts for
disparities
• Physician-level factors– Indirect evidence that physician bias may
influence their decision-making

The University of Georgia
A New Lens to Studying Disparities:
The Roles of Organizations• Organizations are the site of service delivery
– Our focus is on specialty substance abuse treatment centers, not counselors in private practice or office-based physicians
• Decisions about the availability of services occurs at the level of the organization– When organizations decide to not adopt innovations,
this affects the quality of care received by clients– If organizations vary in the racial/ethnic composition
of their caseloads, these decisions about service delivery translate into disparities in access to evidence-based treatment
• This has largely been understudied

The University of Georgia
Is the racial/ethnic composition of treatment organizations’
caseloads associated with the availability of evidence-based
treatment practices?

The University of Georgia
Racial/Ethnic Disparities in Access to SSRIs
• SSRIs represent an important “front-line” pharmacotherapy for clients with co-occurring substance abuse and depression (Nunes & Levin, 2004)
• Treatment centers vary in their adoption of SSRIs– 66% of privately funded non-profits have adopted– 31% of publicly funded non-profits have adopted
• Data from the National Treatment Center Study indicates a negative association between the percentage of minority clients in centers’ caseloads and the likelihood of SSRI adoption– Lower odds of adoption in centers with a greater percentage
of minority clients– This difference persists after controlling for a range of
organizational characteristics, including access to physician services & center type (ownership & reliance on public funding)

The University of Georgia
Is the racial/ethnic composition of centers’ caseloads associated with the adoption of addiction
treatment medications?

The University of Georgia
Classifying Medication Adoption:
The Continuum of Regulations • Medications for the treatment addiction
can be grouped by regulatory hurdles to their adoption
• A continuum of regulatory intensity– More intensively regulated, where
centers/physicians must meet additional requirements: methadone, buprenorphine
– Less intensively regulated, where physicians can prescribe without additional regulatory requirements: disulfiram, naltrexone

The University of Georgia
Typology of Medication Adoption
Center Does Not Use Medications
(Reference Category)
Center Uses Only More Intensely
Regulated Medications (e.g.
methadone, buprenorphine)
Center Uses Only Less Intensely
Regulated Medications (e.g.
disulfiram, naltrexone)
Center Uses Both Types of Medications

The University of Georgia
Research Questions
• Is the racial/ethnic composition of treatment organizations’ caseloads associated with patterns of addiction treatment medication adoption?
• Does this association hold when other organizational characteristics are controlled?

The University of Georgia
Sample• Data from the National Treatment Center
Study– Community-based addiction treatment centers– Must offer a minimum of outpatient care (as defined
by ASAM)• Two nationally representative samples
– Publicly funded centers (n = 363): > 50% of revenues from government block grants/contracts
Response rate = 80%– Privately funded centers (n = 401): <50% of
revenues from government block grants/contracts Response rate = 88%
• Data collected via face-to-face interviews with administrators and/or clinical directors
• Complete data from n = 677

The University of Georgia
Measures & Methods
• Typology of Medication Adoption– No adoption (reference category)– Only more intensely regulated medications:
methadone, LAAM, and/or buprenorphine– Only less intensely regulated medications:
disulfiram and/or naltrexone– Combination of both types of medications
• Analytic technique: Multinomial Logistic Regression– Examine the log-odds of three types of
adoption relative to “no adoption”

The University of Georgia
Measures: Organizational Characteristics
• Percentage of caseload comprised of racial/ethnic minority clients
• Percentage of clients with primary opiate dependence
• Center type: – Government-owned– Publicly funded non-profit (reference category)– Privately funded non-profit – For-profit
• Organizational affiliation: – Hospital-based– Community mental health center– Freestanding (reference category)
• Size: natural log-transformed number of employees• Age: natural log-transformed years• Accreditation: center is accredited by JCAHO or CARF

The University of Georgia
Measures: Staffing & Services
• Physician Services: – Physicians on staff– Physicians on contract– No access to physicians (reference category)
• Levels of care: – Offers inpatient detox (1 = yes, 0 = no)– Offers outpatient detox (1 = yes, 0 = no)– Offers inpatient treatment program (1 = yes, 0 = no)– Offers residential treatment program (1 = yes, 0 = no)– Offers outpatient treatment (PHP, IOP, OP, 1 = yes, 0
= no)
• 12-Step Treatment Model: 1 = yes, 0 = no

The University of Georgia
Results:Racial/Ethnic Differences and Organizational Characteristics

The University of Georgia
Racial/Ethnic Composition by Center Type
45%50%
30% 30%
0%
20%
40%
60%
Gov-Ow
ned
Public
Non-
Profi
tPr
ivate N
on-P
rofit
For-P
rofit
• Mean for the total sample = 39.2%– Similar to average
reported in federal TEDS dataset
• Public sector programs reported significantly greater percentages of racial/ethnic minority clients than private sector programs

The University of Georgia
Racial/Ethnic Composition by Organizational Characteristics
• Significantly lower % racial/ethnic minority clients in:– Centers offering inpatient detox– Centers offering inpatient treatment– Accredited centers– Hospital-based centers
• Significantly greater % racial/ethnic minority clients in:– Centers with residential programs
• No differences by:– Center offers outpatient treatment or outpatient detox– Twelve-step treatment model– Availability of physicians– Center size or center age– % of opiate dependent patients

The University of Georgia
Typology of Medication Adoption
60.0%
7.1%
21.1%
11.8%
No Meds
More RegulatedMedsLess RegulatedMedsBoth Types

The University of Georgia
Multinomial Logistic Regression:Bivariate Results
• More intensely regulated medications vs. No medications– % racial/ethnic minority clients not significant
• Less intensely regulated medications vs. No medications– Significant negative association (p<.001)– A standard deviation increase in % racial/ethnic
minority clients associated with 35.4% decrease in odds of this type of medication adoption
• Both types of medications vs. No medications– Significant negative association (p<.001)– A standard deviation increase associated with 39.5%
decrease in odds of this type of medication adoption
The University of Georgia
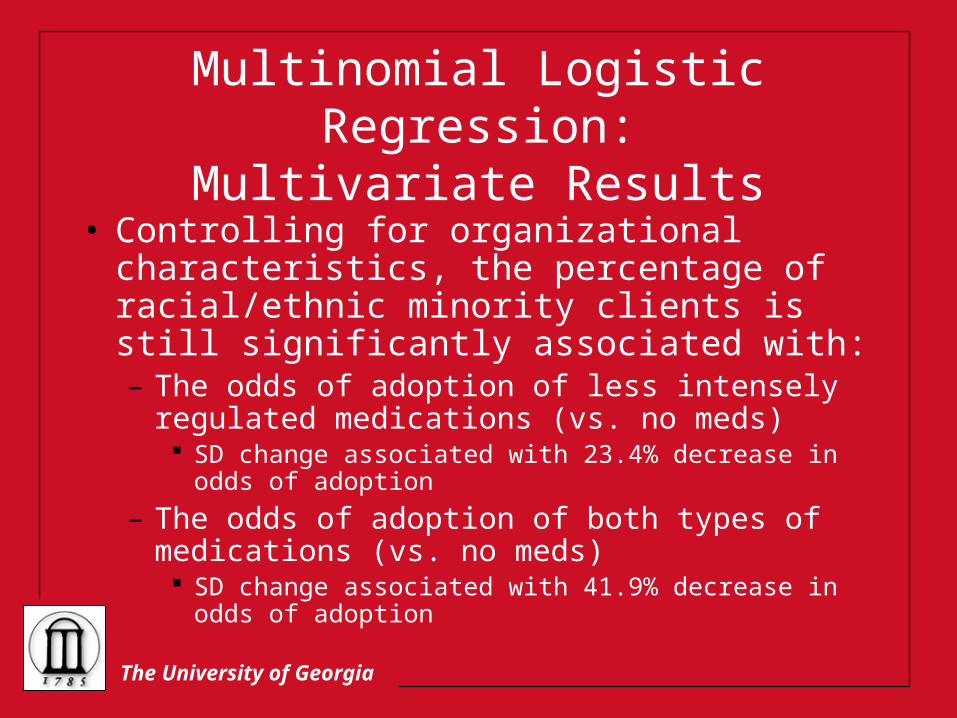
Multinomial Logistic Regression:Multivariate Results
• Controlling for organizational characteristics, the percentage of racial/ethnic minority clients is still significantly associated with:– The odds of adoption of less intensely
regulated medications (vs. no meds) SD change associated with 23.4% decrease in odds
of adoption
– The odds of adoption of both types of medications (vs. no meds) SD change associated with 41.9% decrease in odds
of adoption

The University of Georgia
Other Significant Predictors:More intensely regulated vs. No
Meds• Greater adoption in government-owned
vs. publicly funded non-profit• Center size increases odds of adoption• Presence of staff physician (vs. no
physician) increases odds of adoption• Accredited centers more likely to adopt• Centers with residential programs less
likely to adopt• Positive association between % opiate
clients and adoption
The University of Georgia
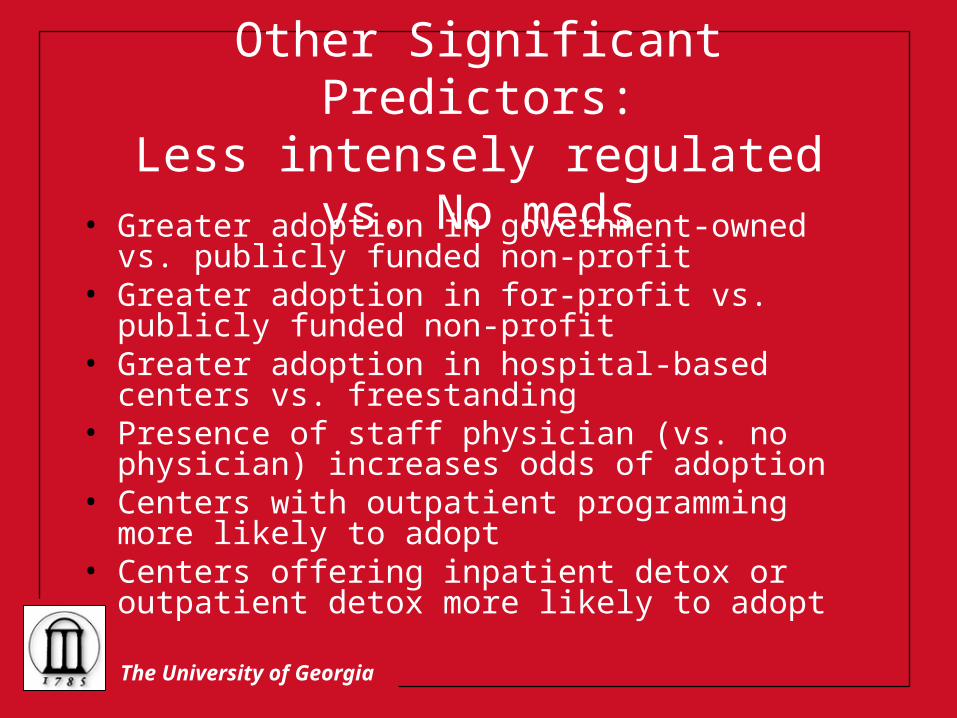
Other Significant Predictors:Less intensely regulated vs. No
meds• Greater adoption in government-owned vs.
publicly funded non-profit• Greater adoption in for-profit vs. publicly
funded non-profit• Greater adoption in hospital-based centers vs.
freestanding• Presence of staff physician (vs. no physician)
increases odds of adoption• Centers with outpatient programming more
likely to adopt• Centers offering inpatient detox or outpatient
detox more likely to adopt

The University of Georgia
Other Significant Predictors:Both types of meds vs. No meds• Center size increases odds of adoption• Presence of staff physician (vs. no physician)
increases odds of adoption• Accredited centers more likely to adopt• Hospital-based centers more likely to adopt• Twelve-step programs less likely to adopt• Centers with residential programs less likely to
adopt• Centers offering outpatient detox more likely to
adopt• Positive association between % opiate clients and
adoption
The University of Georgia
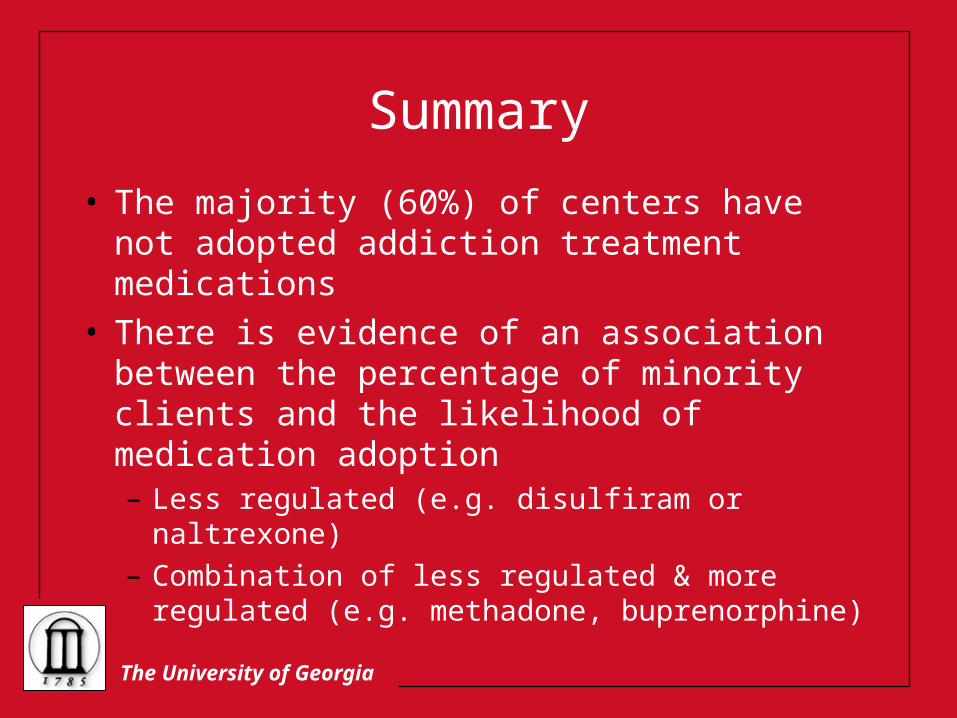
Summary
• The majority (60%) of centers have not adopted addiction treatment medications
• There is evidence of an association between the percentage of minority clients and the likelihood of medication adoption– Less regulated (e.g. disulfiram or naltrexone)– Combination of less regulated & more
regulated (e.g. methadone, buprenorphine)

The University of Georgia
Limitations
• Cross-sectional data cannot establish causality
• Lack of data on specific racial & ethnic groups– Currently collecting data from publicly funded
programs so will be able to re-examine these differences by groups
• Focus on “any use” rather than implementation– This model does not address how routinely
these medications are used

The University of Georgia
Conclusion
• Future research should continue to examine if and how disparities operate at the level of organizations
• These data suggest the need to consider whether there are additional racial and ethnic differences in access to evidence-based treatment– Psycho-social approaches– Wraparound services

The University of Georgia
The authors gratefully acknowledge the support of research funding
from the National Institute on Drug Abuse (R01-DA-14482 and R01-DA-
13110).
This presentation and other reports from the National Treatment Center
Study are available at http://www.uga.edu/ntcs