The Status and Future of the Photovoltaics ... Status and Future of the Photovoltaics...
28
The Status and Future of the Photovoltaics Industry Photovoltaics Industry David E. Carlson Chief Scientist, BP Solar Chief Scientist, BP Solar March 14, 2010
Transcript of The Status and Future of the Photovoltaics ... Status and Future of the Photovoltaics...
The Status and Future of the Photovoltaics IndustryPhotovoltaics Industry
David E. CarlsonChief Scientist, BP SolarChief Scientist, BP Solar
March 14, 2010
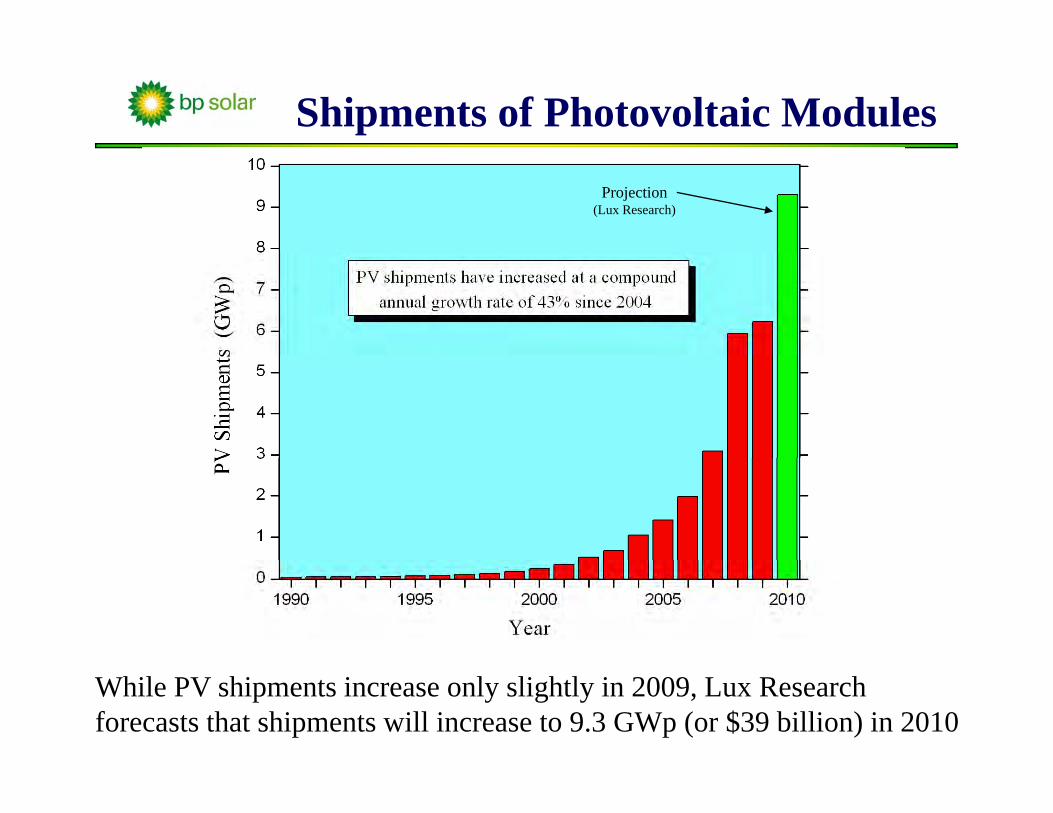
Shipments of Photovoltaic Modules
Projection (Lux Research)
While PV shipments increase only slightly in 2009, Lux Research forecasts that shipments will increase to 9.3 GWp (or $39 billion) in 2010
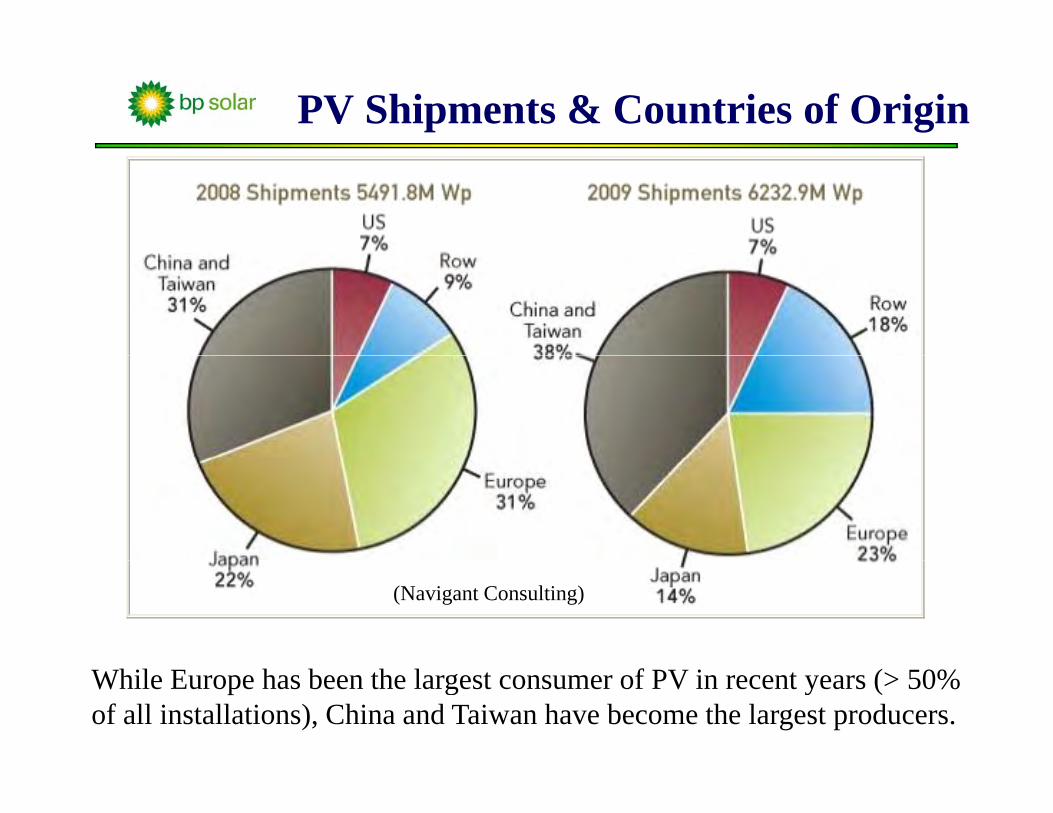
PV Shipments & Countries of Origin
(Navigant Consulting)
While Europe has been the largest consumer of PV in recent years (> 50% of all installations), China and Taiwan have become the largest producers.
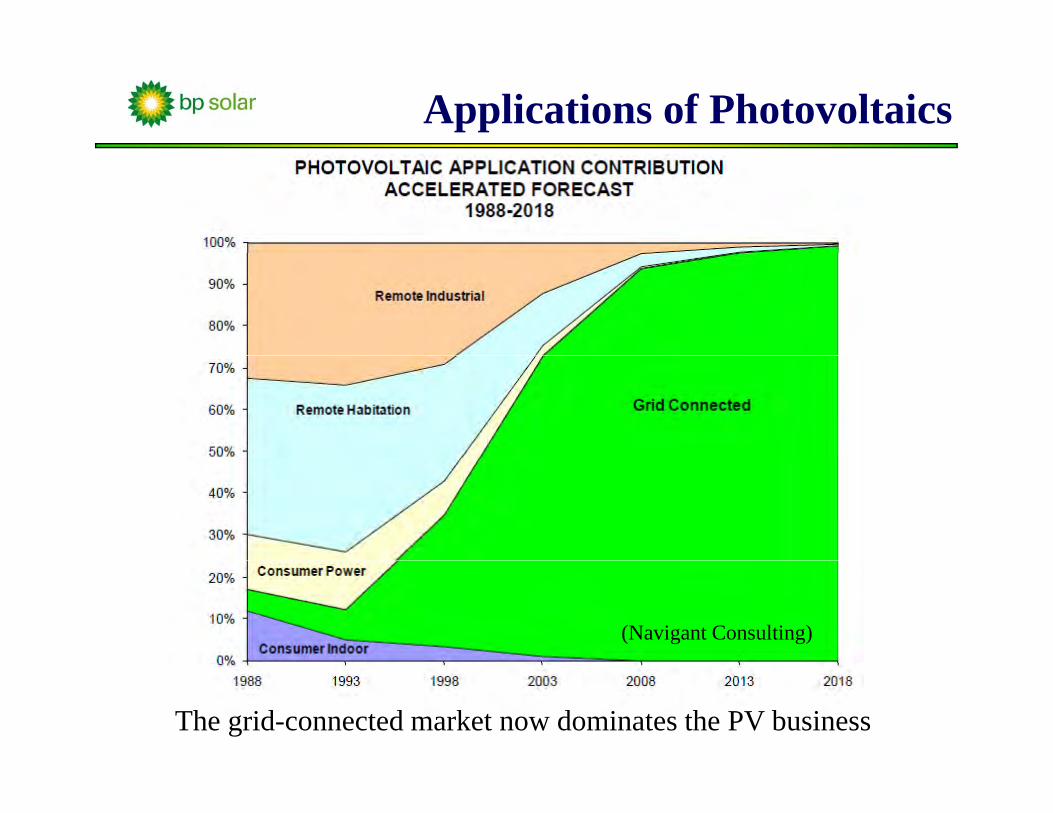
Applications of Photovoltaics
(Navigant Consulting)
The grid-connected market now dominates the PV business
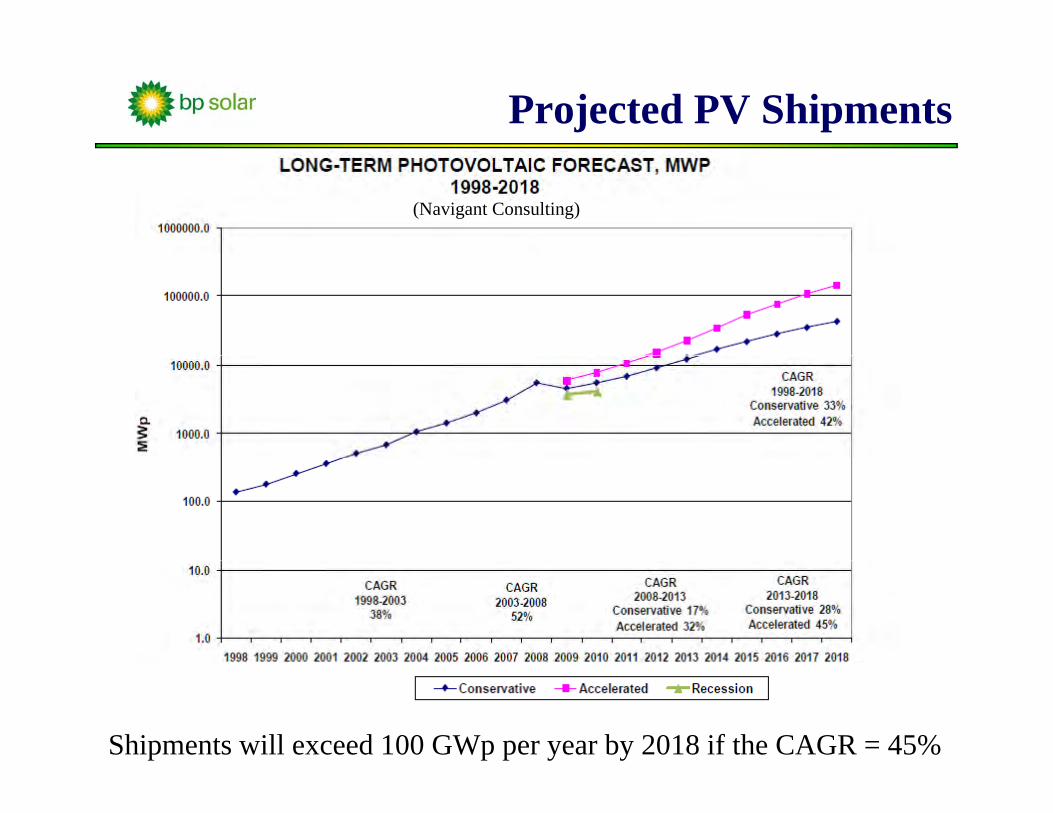
Projected PV Shipments
(Navigant Consulting)
Shipments will exceed 100 GWp per year by 2018 if the CAGR = 45%
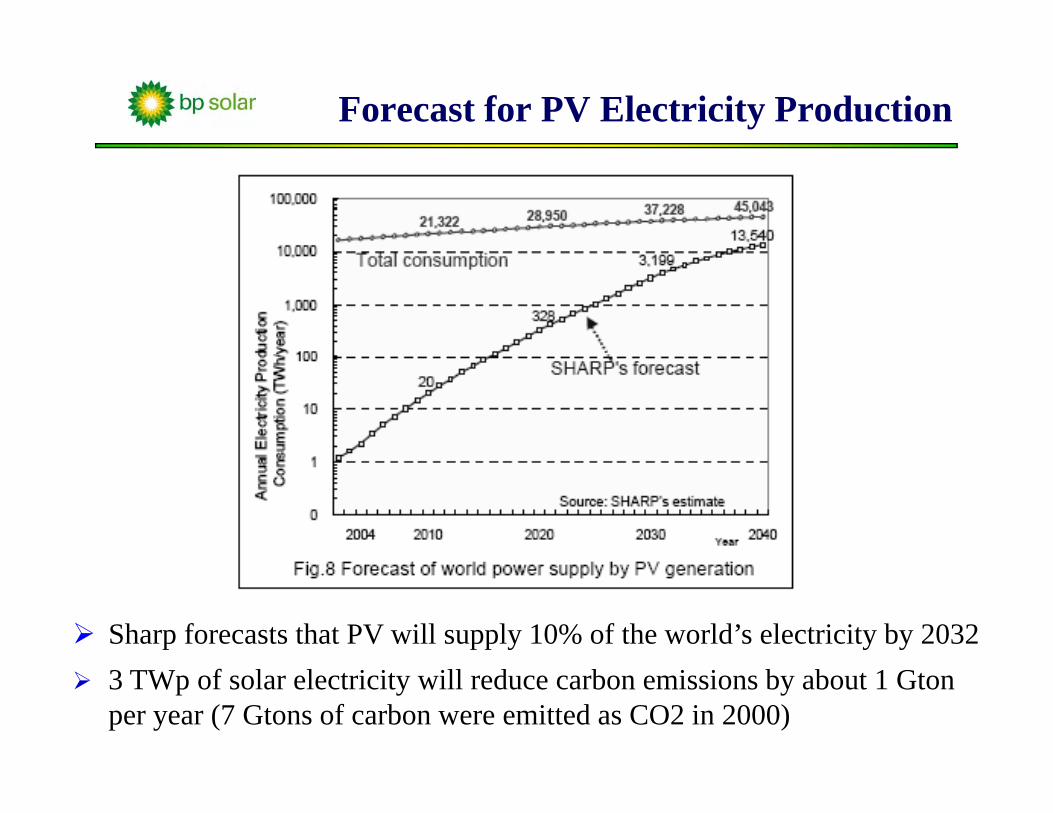
Forecast for PV Electricity Production
Sharp forecasts that PV will supply 10% of the world’s electricity by 20323 TWp of solar electricity will reduce carbon emissions by about 1 Gton per year (7 Gtons of carbon were emitted as CO2 in 2000)
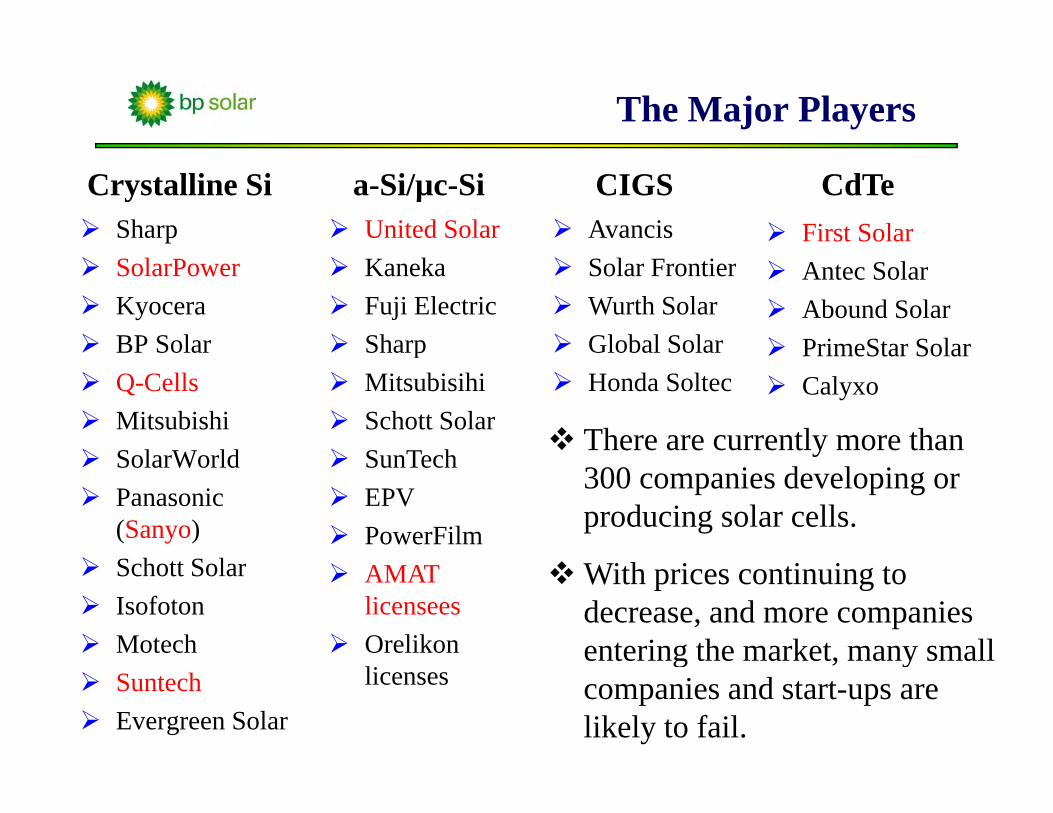
The Major Players
Sharp United Solar Avancis First Solar
Crystalline Si a-Si/µc-Si CIGS CdTe
SolarPowerKyoceraBP Solar
KanekaFuji ElectricSharp
Solar FrontierWurth SolarGlobal Solar
Antec SolarAbound SolarPrimeStar Solar
Q-CellsMitsubishiSolarWorld
pMitsubisihiSchott SolarSunTech
Honda SoltecPrimeStar SolarCalyxo
There are currently more than SolarWorldPanasonic (Sanyo)S h tt S l
SunTechEPV PowerFilm
300 companies developing or producing solar cells.
Schott SolarIsofotonMotech
AMAT licenseesOrelikon
With prices continuing to decrease, and more companies entering the market, many small
SuntechEvergreen Solar
licensesg , y
companies and start-ups are likely to fail.
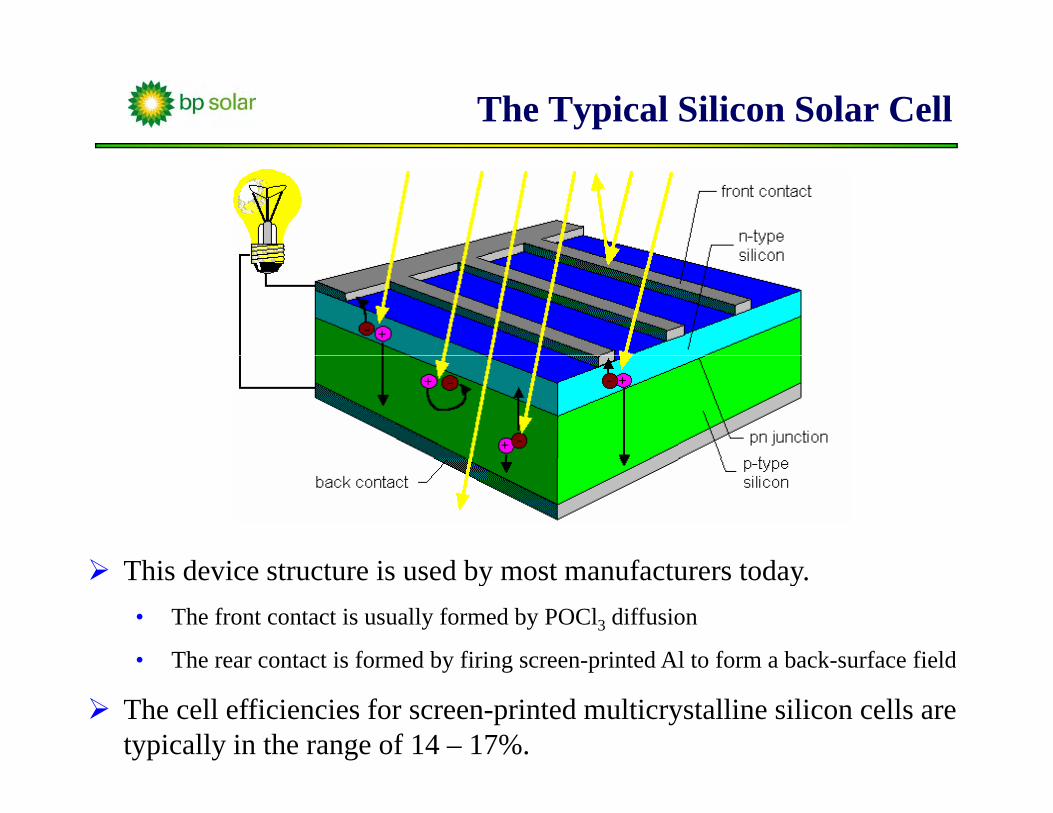
The Typical Silicon Solar Cell
hi d i i d b f dThis device structure is used by most manufacturers today.• The front contact is usually formed by POCl3 diffusion
• The rear contact is formed by firing screen-printed Al to form a back-surface fieldThe rear contact is formed by firing screen printed Al to form a back surface field
The cell efficiencies for screen-printed multicrystalline silicon cells are typically in the range of 14 – 17%.
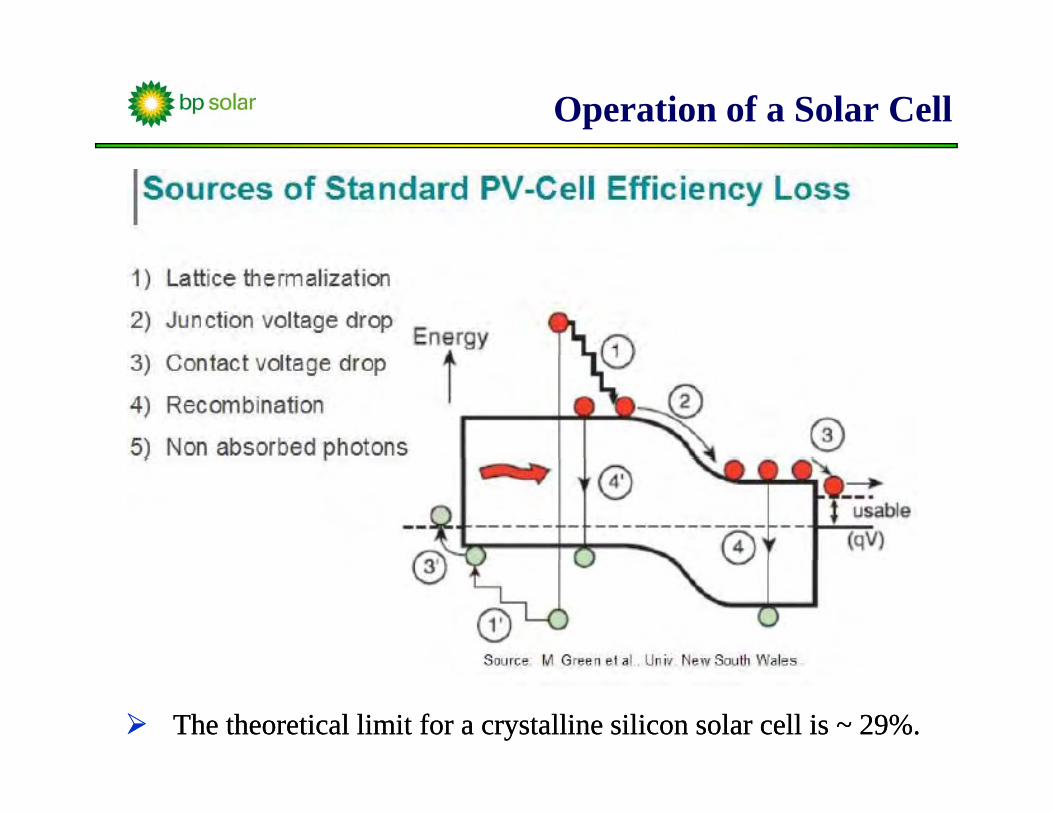
Operation of a Solar Cell
The theoretical limit for a crystalline silicon solar cell is ~ 29%.The theoretical limit for a crystalline silicon solar cell is ~ 29%.
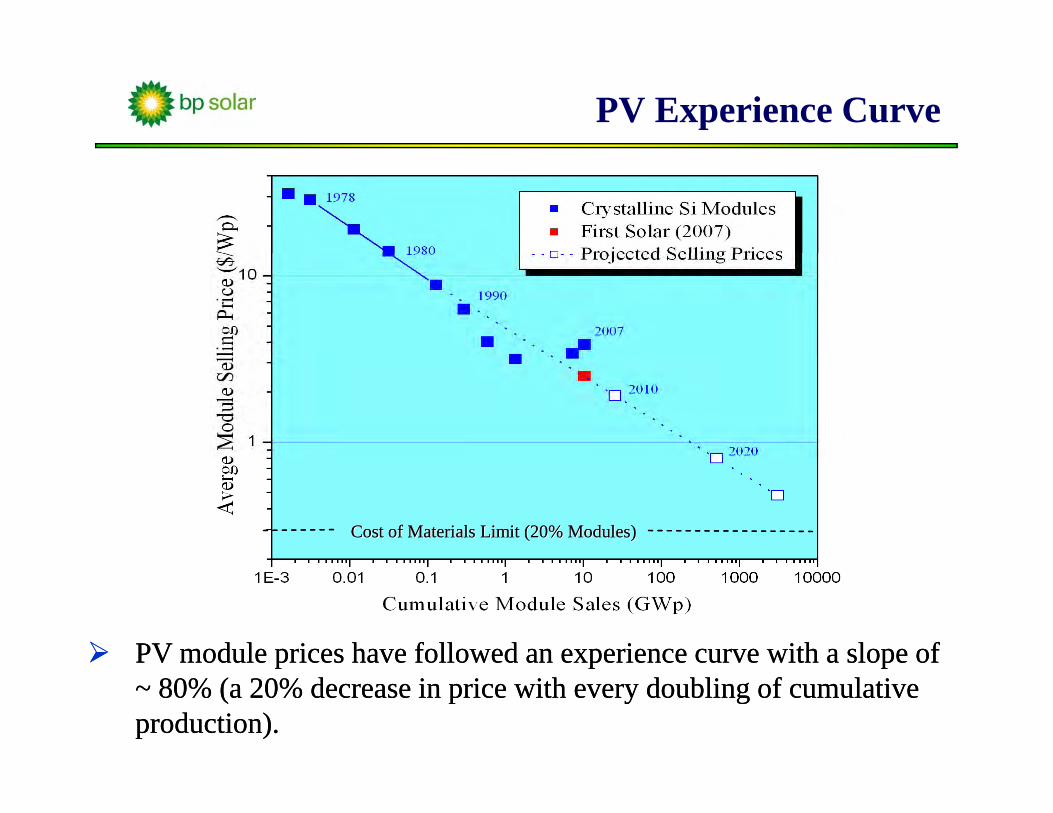
PV Experience Curve
Cost of Materials Limit (20% Modules)Cost of Materials Limit (20% Modules)Cost of Materials Limit (20% Modules)Cost of Materials Limit (20% Modules)Cost of Materials Limit (20% Modules)Cost of Materials Limit (20% Modules)
PV module prices have followed an experience curve with a slope of PV module prices have followed an experience curve with a slope of p p pp p p~ 80% (a 20% decrease in price with every doubling of cumulative ~ 80% (a 20% decrease in price with every doubling of cumulative production).production).
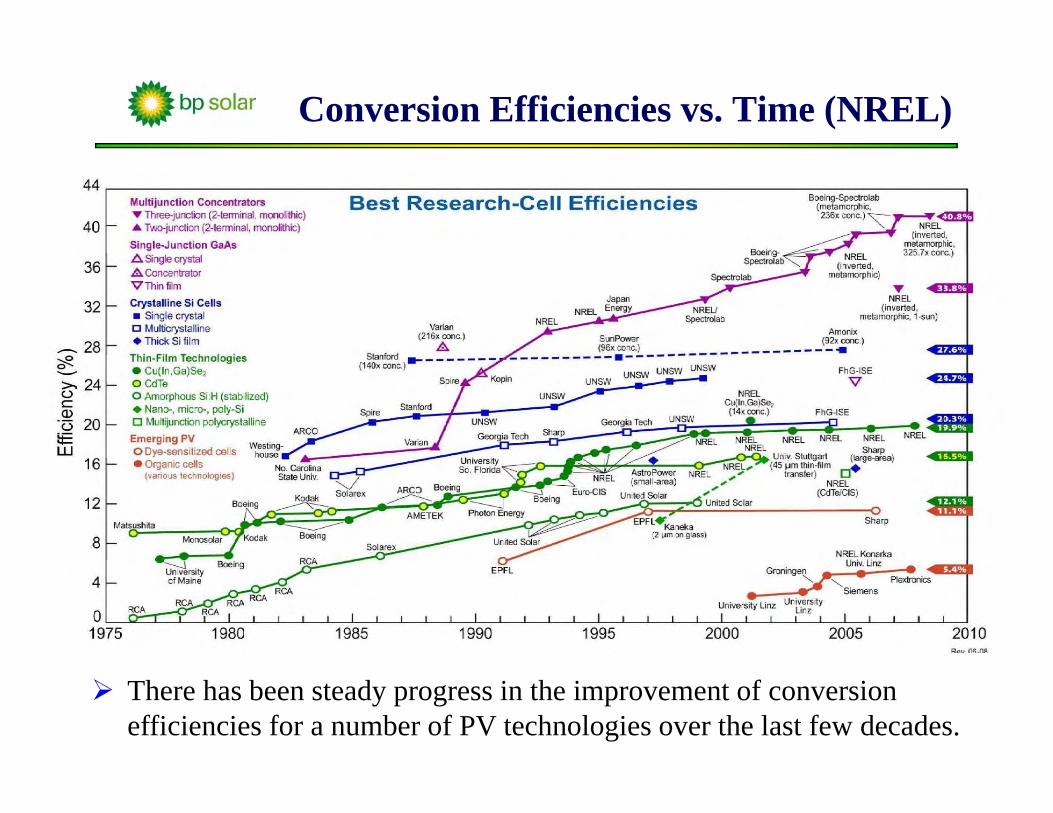
Conversion Efficiencies vs. Time (NREL)
There has been steady progress in the improvement of conversion efficiencies for a number of PV technologies over the last few decades.
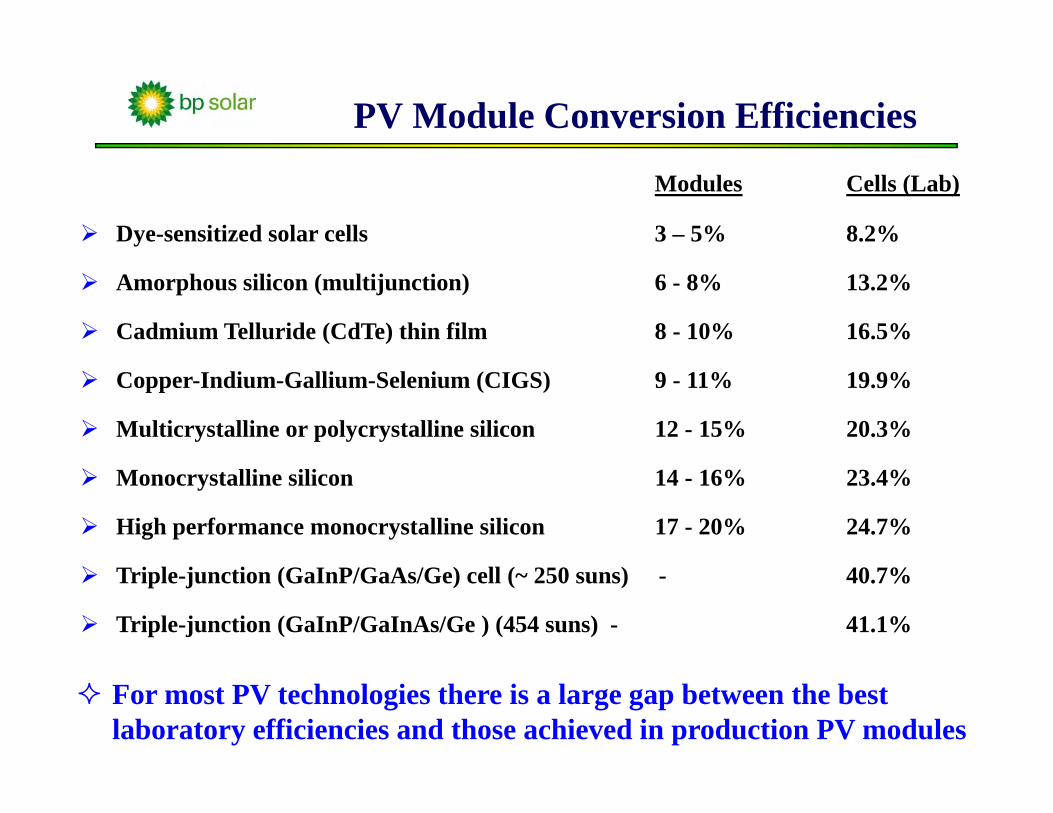
PV Module Conversion Efficiencies
Modules Cells (Lab)
Dye-sensitized solar cells 3 – 5% 8.2%
Amorphous silicon (multijunction) 6 - 8% 13.2%
Cadmium Telluride (CdTe) thin film 8 - 10% 16.5%
Copper-Indium-Gallium-Selenium (CIGS) 9 - 11% 19.9%
Multicrystalline or polycrystalline silicon 12 - 15% 20.3%
Monocrystalline silicon 14 - 16% 23.4%
High performance monocrystalline silicon 17 - 20% 24.7%
Triple-junction (GaInP/GaAs/Ge) cell (~ 250 suns) - 40.7%
Triple-junction (GaInP/GaInAs/Ge ) (454 suns) - 41.1%
For most PV technologies there is a large gap between the best laboratory efficiencies and those achieved in production PV modules
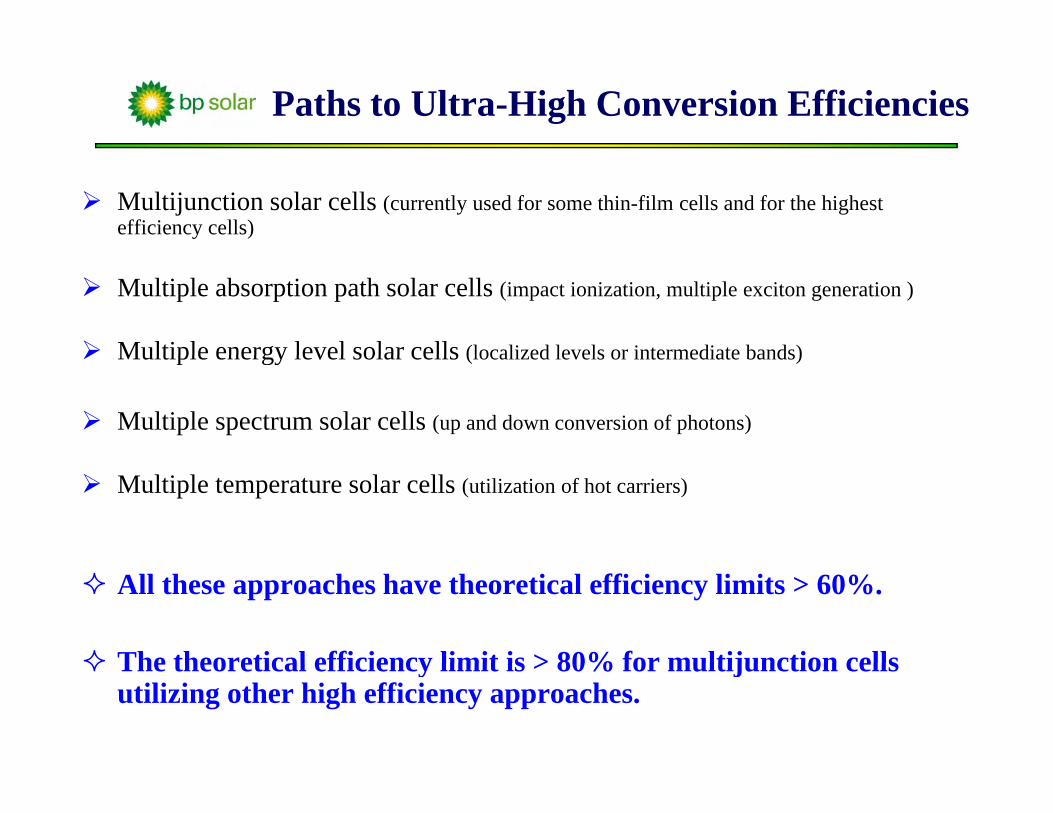
Paths to Ultra-High Conversion Efficiencies
Multijunction solar cells (currently used for some thin-film cells and for the highest efficiency cells)
Multiple absorption path solar cells (impact ionization, multiple exciton generation )
Multiple energy level solar cells (localized levels or intermediate bands)Multiple energy level solar cells (localized levels or intermediate bands)
Multiple spectrum solar cells (up and down conversion of photons)
Multiple temperature solar cells (utilization of hot carriers)
All these approaches have theoretical efficiency limits > 60%.
The theoretical efficiency limit is > 80% for multijunction cellsThe theoretical efficiency limit is > 80% for multijunction cells utilizing other high efficiency approaches.
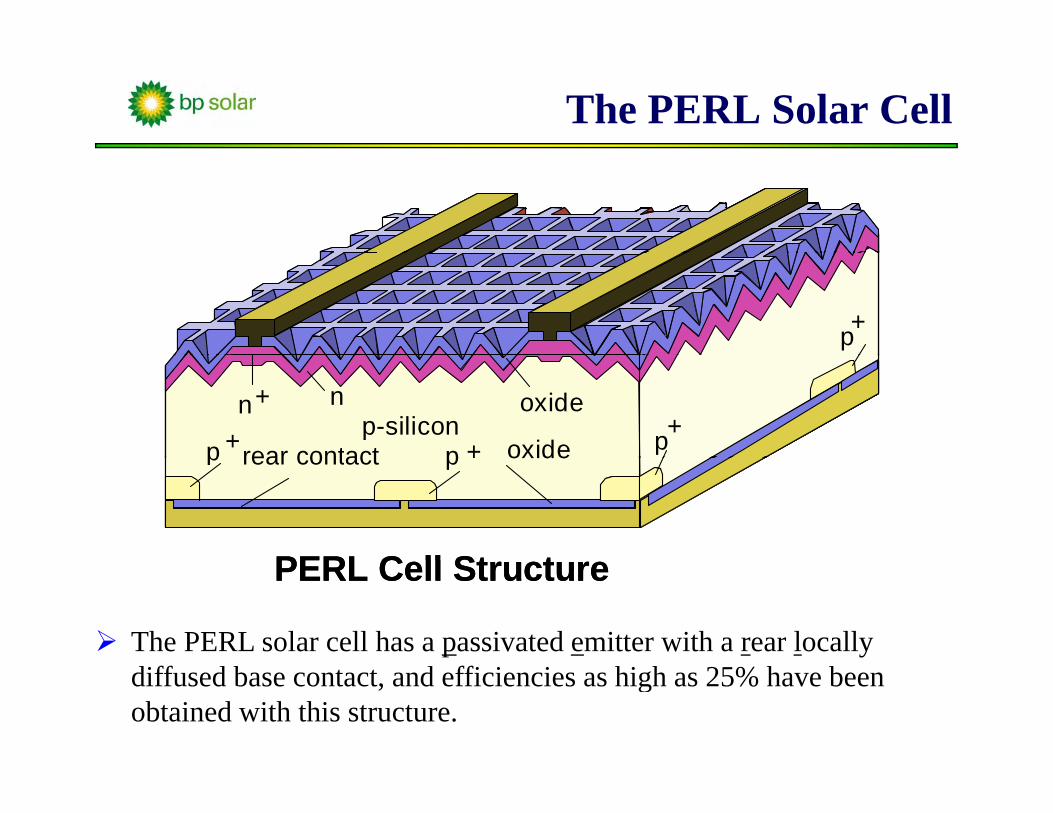
The PERL Solar Cell
p +p +
pp-silicon
n
p oxide
+p ++
n +
rear contact oxidepp-silicon
n
p oxide
+p ++
n +
rear contact oxidep prear contact oxide
PERL C ll St t
p prear contact oxide
PERL C ll St tPERL Cell StructurePERL Cell Structure
The PERL solar cell has a passivated emitter with a rear locally diffused base contact, and efficiencies as high as 25% have been obtained with this structure.
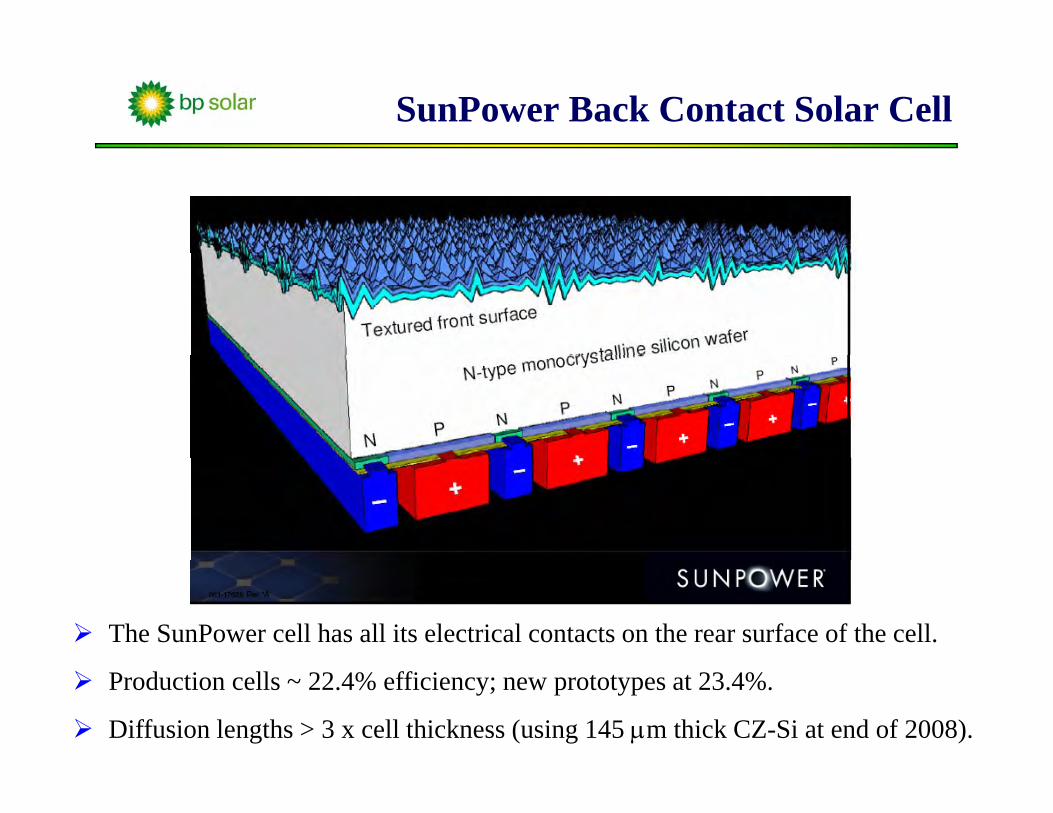
SunPower Back Contact Solar Cell
The SunPower cell has all its electrical contacts on the rear surface of the cell.
Production cells ~ 22.4% efficiency; new prototypes at 23.4%.
Diffusion lengths > 3 x cell thickness (using 145 μm thick CZ-Si at end of 2008).
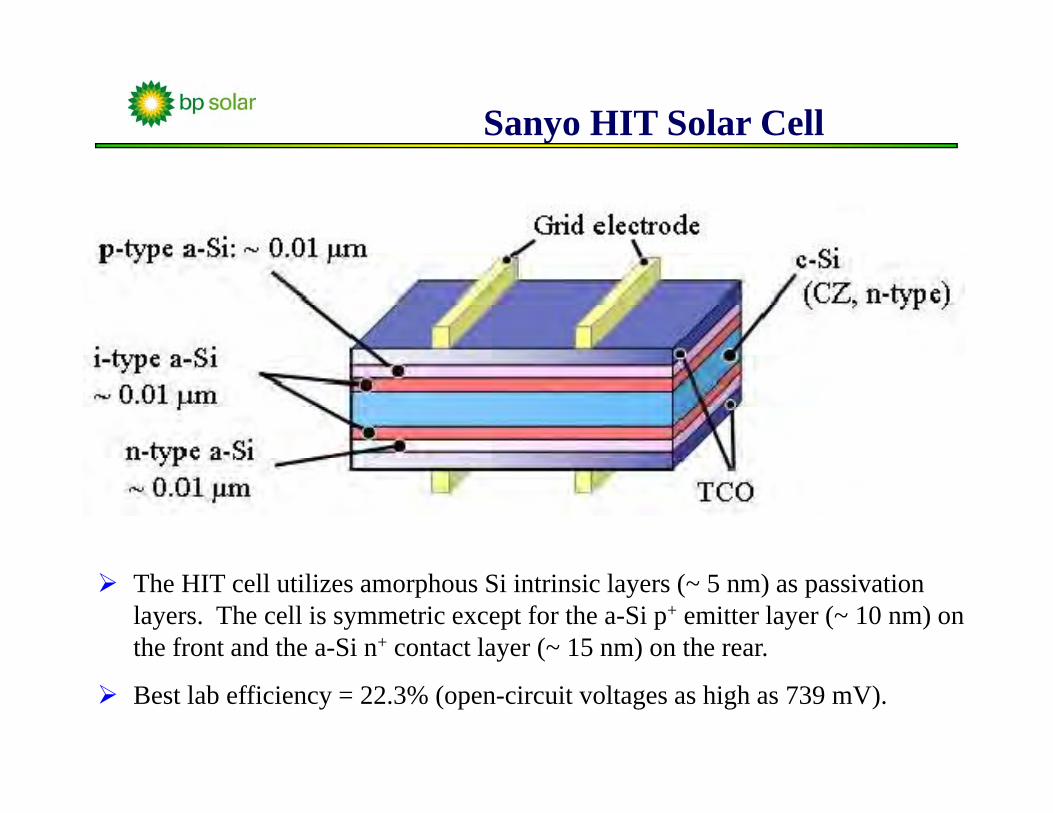
Sanyo HIT Solar Cell
The HIT cell utilizes amorphous Si intrinsic layers (~ 5 nm) as passivation layers. The cell is symmetric except for the a-Si p+ emitter layer (~ 10 nm) on the front and the a-Si n+ contact layer (~ 15 nm) on the rear.
Best lab efficiency = 22.3% (open-circuit voltages as high as 739 mV).
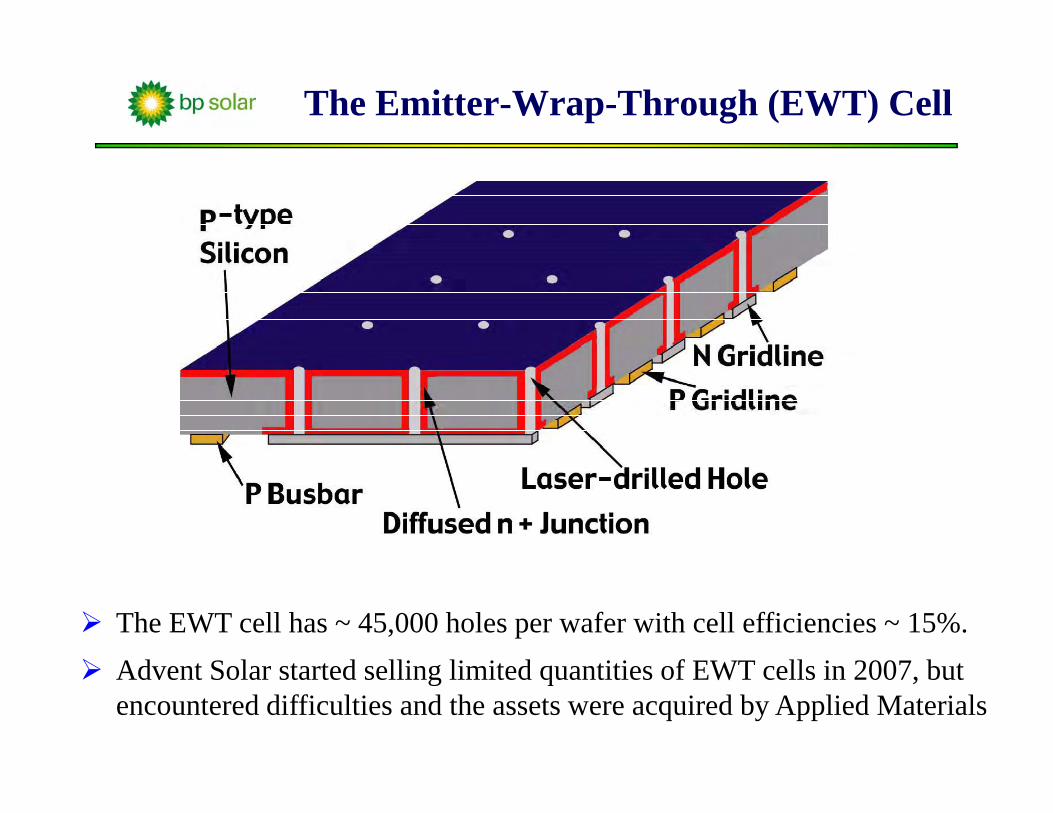
The Emitter-Wrap-Through (EWT) Cell
The EWT cell has ~ 45,000 holes per wafer with cell efficiencies ~ 15%.Ad t S l t t d lli li it d titi f EWT ll i 2007 b tAdvent Solar started selling limited quantities of EWT cells in 2007, but encountered difficulties and the assets were acquired by Applied Materials
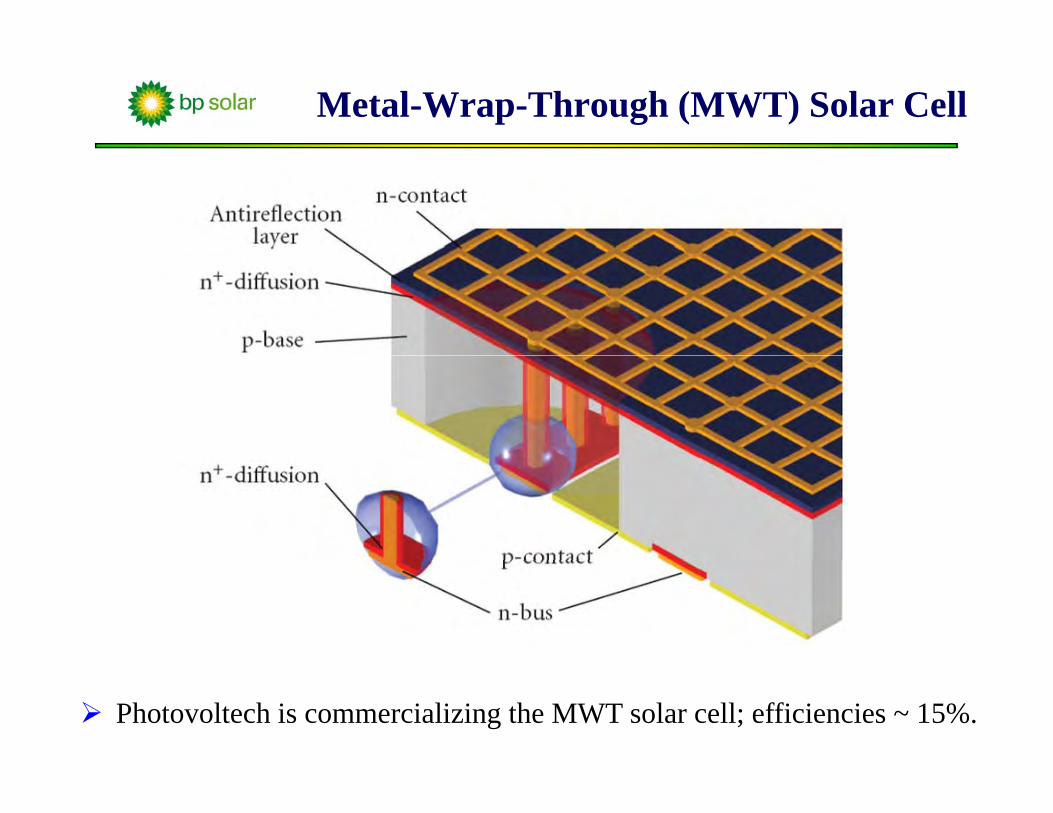
Metal-Wrap-Through (MWT) Solar Cell
Photovoltech is commercializing the MWT solar cell; efficiencies ~ 15%.
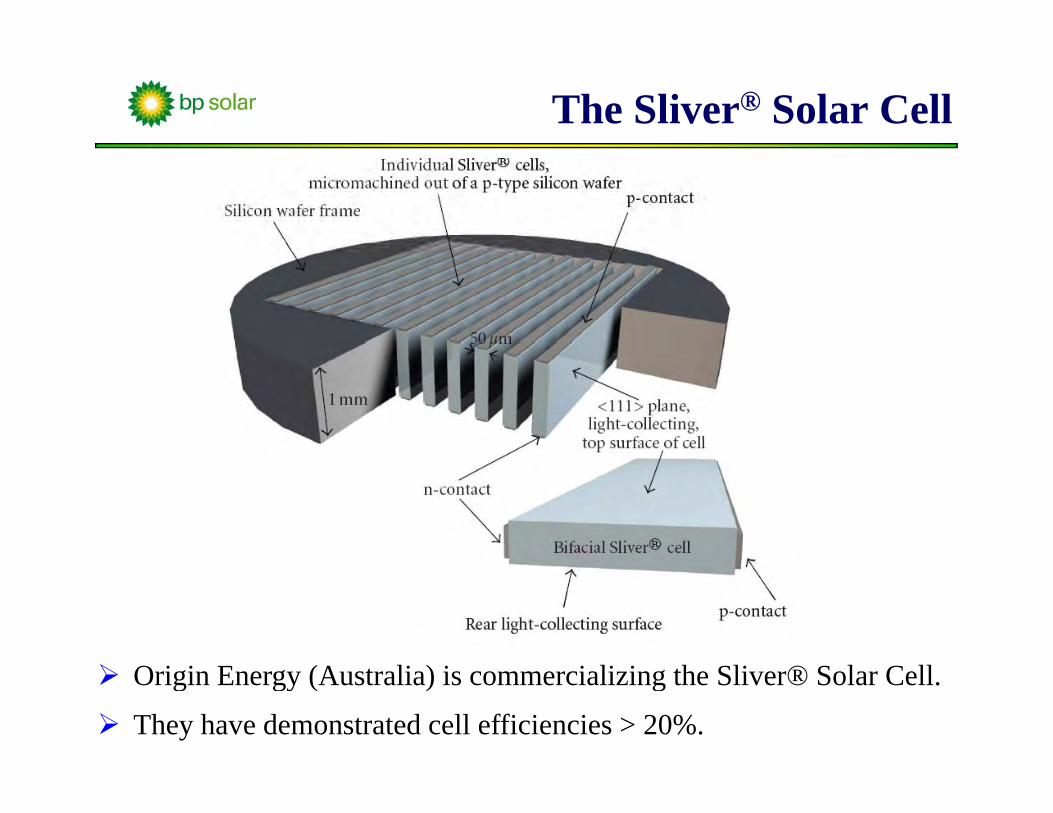
The Sliver® Solar Cell
Origin Energy (Australia) is commercializing the Sliver® Solar Cell.
They have demonstrated cell efficiencies > 20%.
Thin Film Silicon Solar Cellsec
hnol
ogy
elft
Uni
v. o
f Te
De
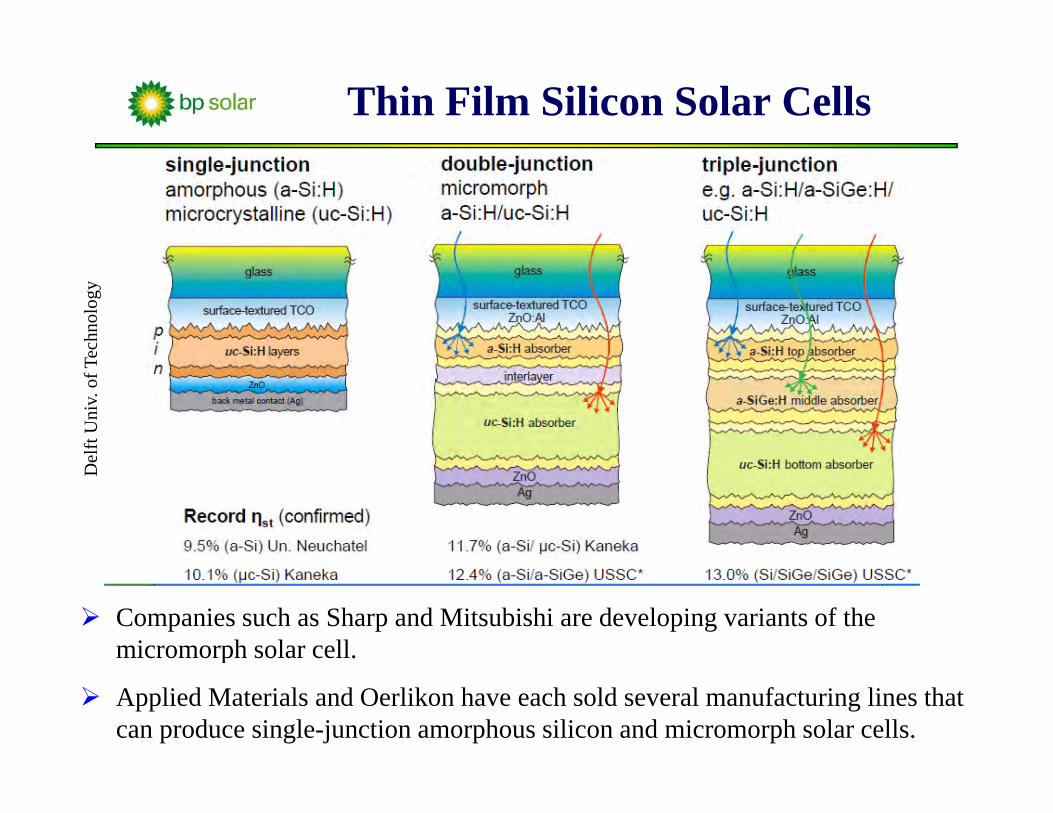
Companies such as Sharp and Mitsubishi are developing variants of the micromorph solar cell.p
Applied Materials and Oerlikon have each sold several manufacturing lines that can produce single-junction amorphous silicon and micromorph solar cells.
Cadmium Telluride Solar Cells
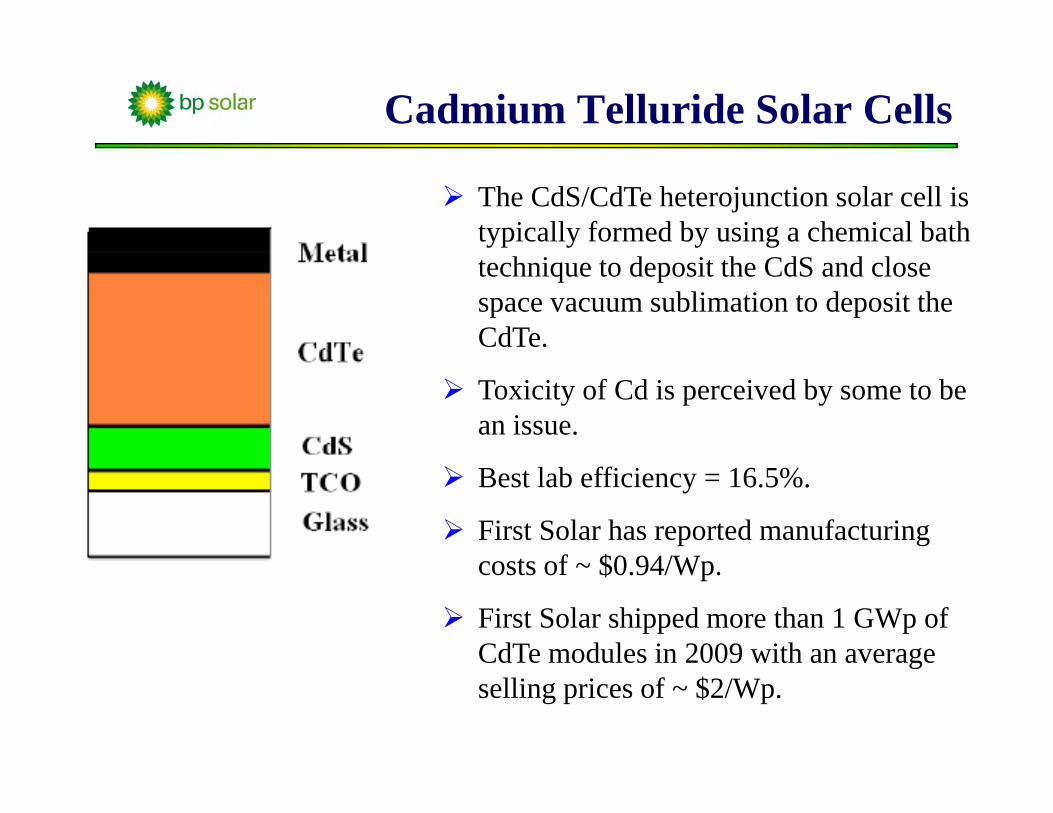
The CdS/CdTe heterojunction solar cell is typically formed by using a chemical bath technique to deposit the CdS and close space vacuum sublimation to deposit the CdTe.
Toxicity of Cd is perceived by some to be an issue.
Best lab efficiency = 16.5%.
First Solar has reported manufacturing t f $0 94/Wcosts of ~ $0.94/Wp.
First Solar shipped more than 1 GWp of CdTe modules in 2009 with an average Cd e odu es 9 w ve geselling prices of ~ $2/Wp.
Copper-Indium-Gallium-Diselenide Cell
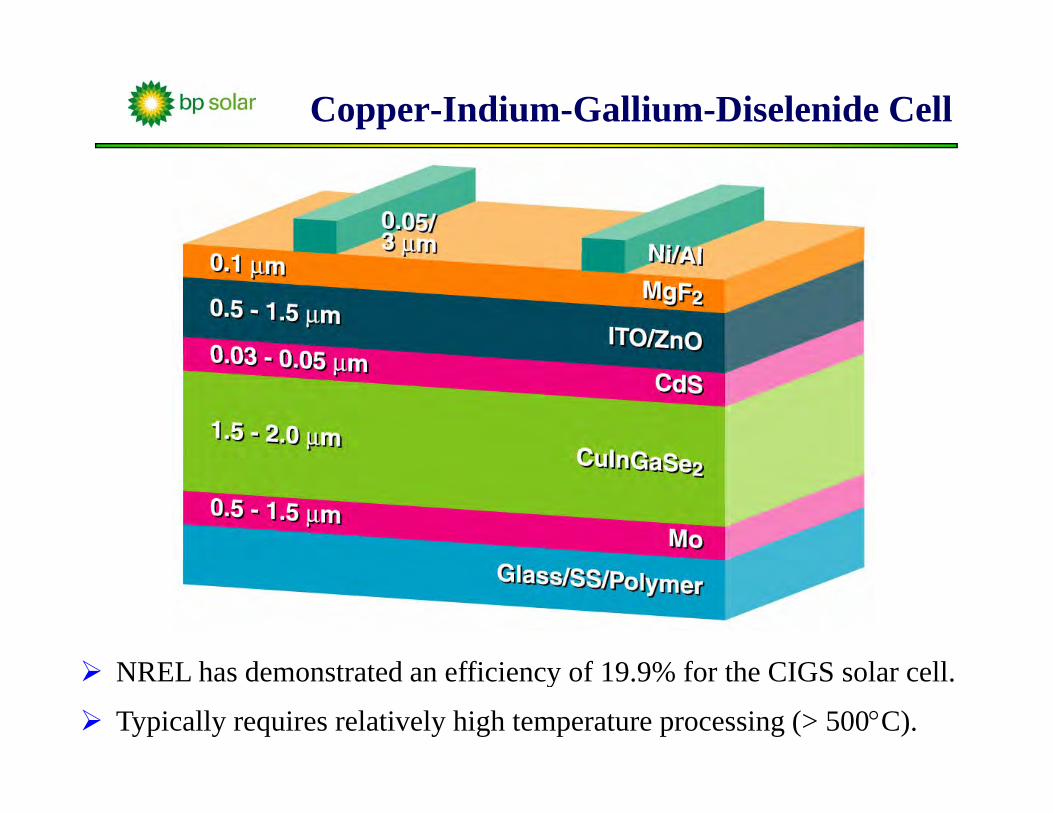
NREL h d d ffi i f 19 9% f h CIGS l llNREL has demonstrated an efficiency of 19.9% for the CIGS solar cell.
Typically requires relatively high temperature processing (> 500°C).
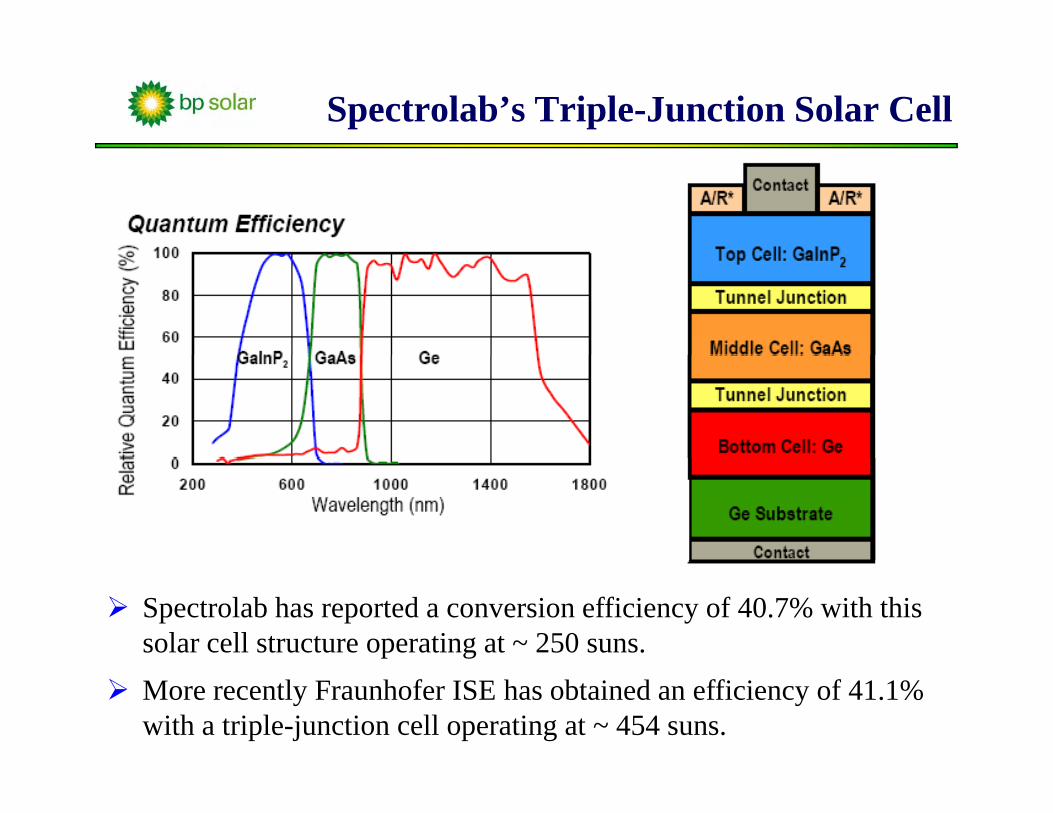
Spectrolab’s Triple-Junction Solar Cell
Spectrolab has reported a conversion efficiency of 40.7% with this solar cell structure operating at ~ 250 suns.More recently Fraunhofer ISE has obtained an efficiency of 41.1% with a triple-junction cell operating at ~ 454 suns.
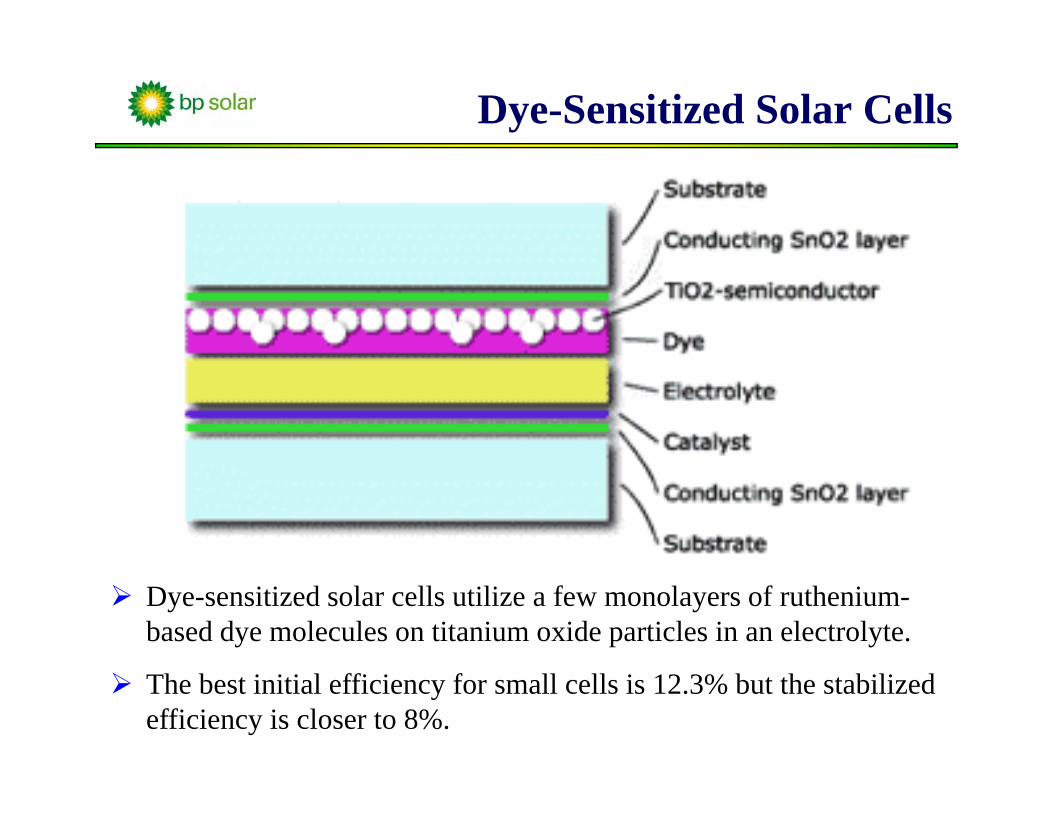
Dye-Sensitized Solar Cells
Dye-sensitized solar cells utilize a few monolayers of ruthenium-based dye molecules on titanium oxide particles in an electrolyte.
The best initial efficiency for small cells is 12.3% but the stabilized efficiency is closer to 8%.
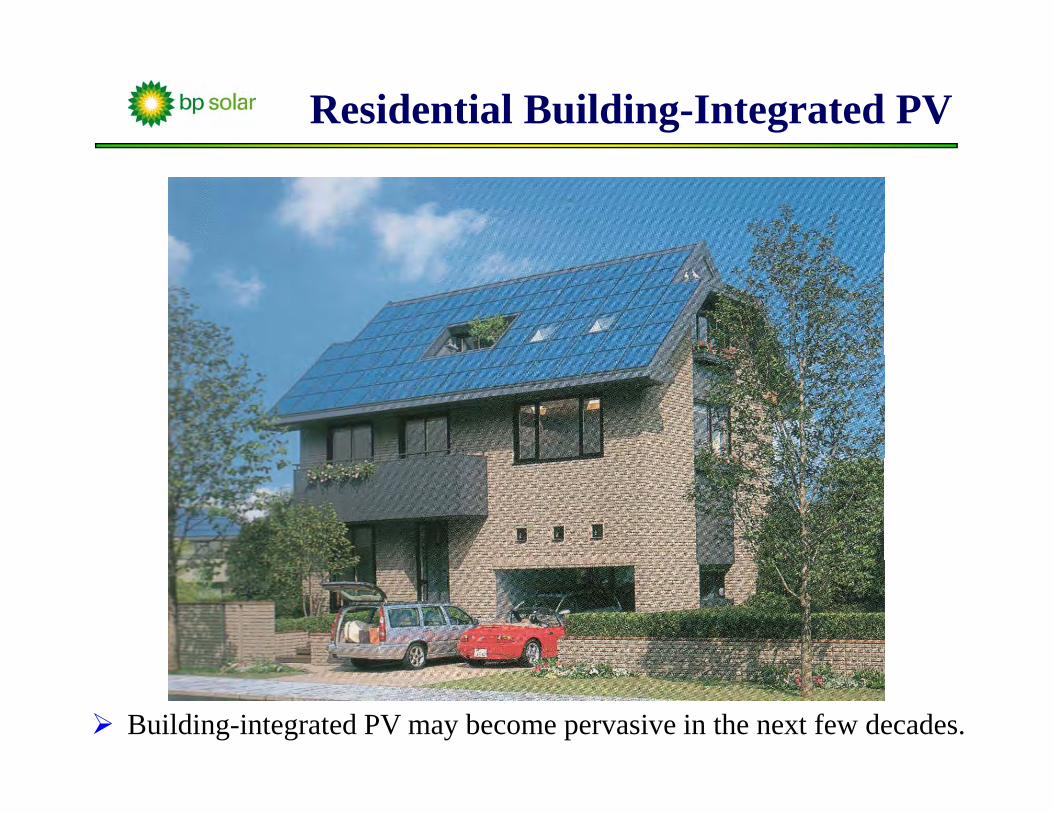
Residential Building-Integrated PV
Building-integrated PV may become pervasive in the next few decades.
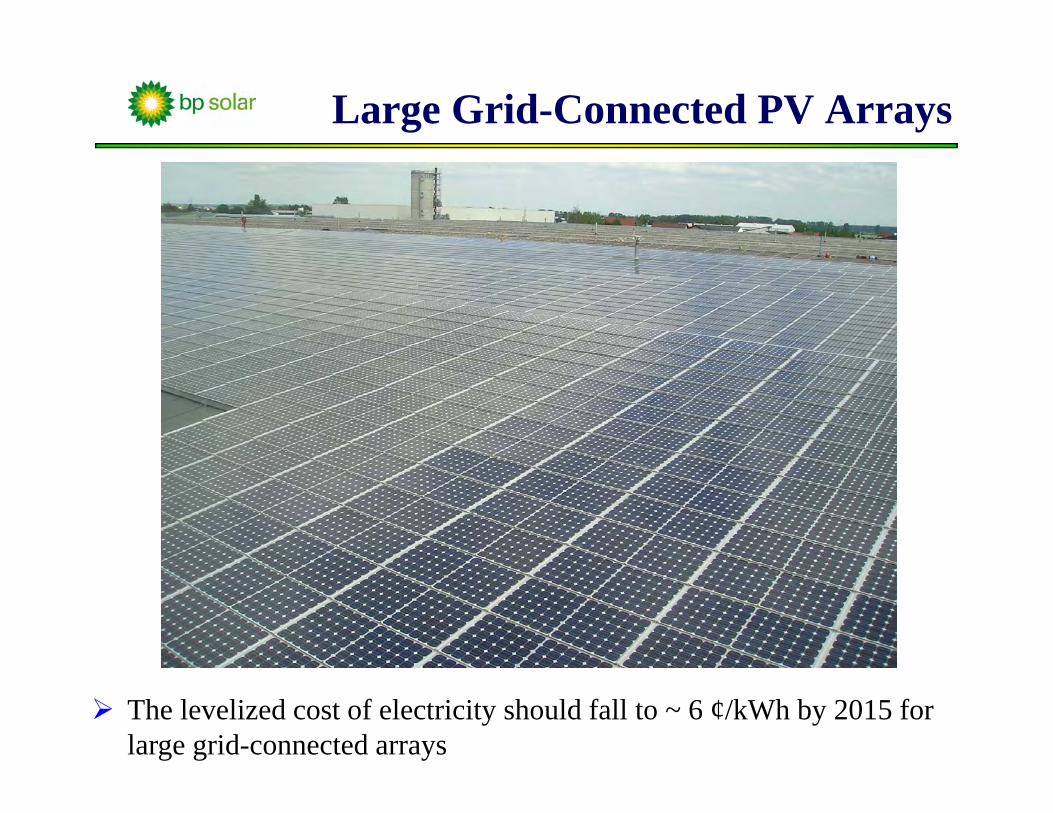
Large Grid-Connected PV Arrays
The levelized cost of electricity should fall to ~ 6 ¢/kWh by 2015 for large grid-connected arrays
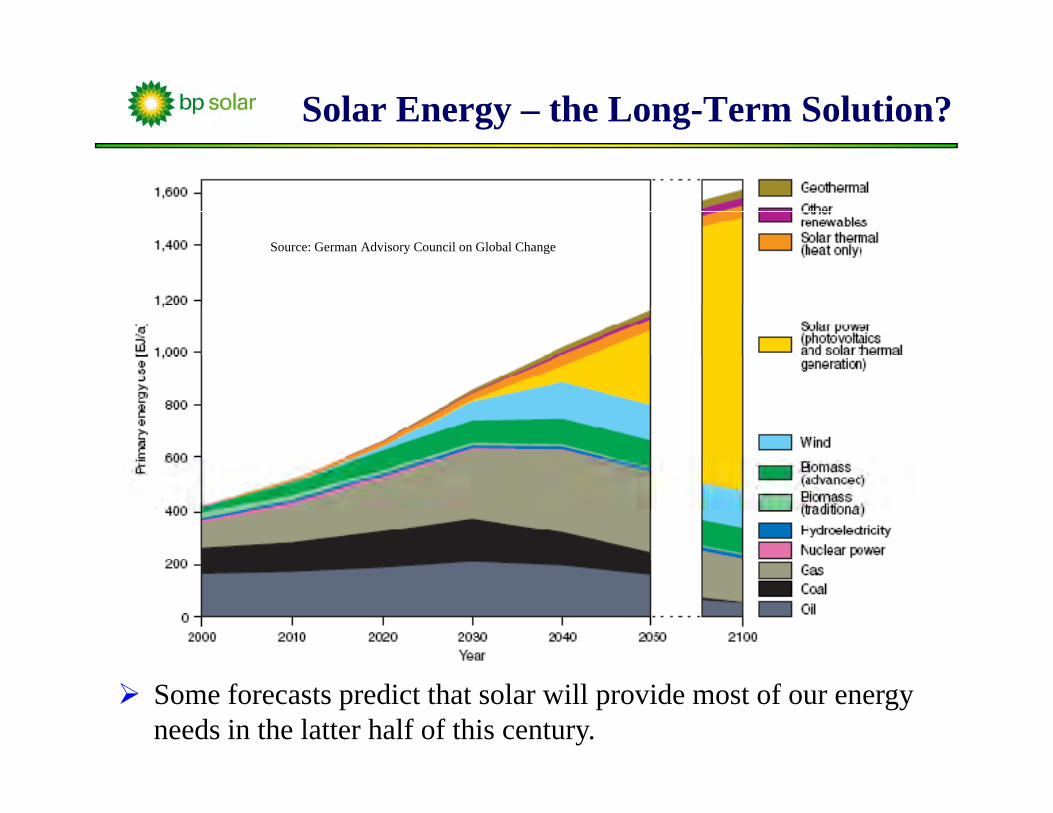
Solar Energy – the Long-Term Solution?
Source: German Advisory Council on Global Changey g
Some forecasts predict that solar will provide most of our energy needs in the latter half of this century.
Projections for the Future of PV
The levelized cost of PV electricity could fall to ~ 6 ¢/kWh by 20152015Disruptive technologies with theoretical limits of > 60% may emerge in the next few decadesgAssuming a CAGR of 35% (average over the last few decades), the cumulative PV production would be ~ 3.5 TWp by 2026.
3 TWp of solar electricity will reduce carbon emissions by about 1 Gton per year (7 Gtons of carbon were emitted as CO2in 2000)000)Thus, by about 2030 PV could be producing about 10% of the world’s electricity and start to play a major role in reducing CO i iCO2 emissions