The Statistical Supplement for the Pennsylvania Tax ... and... · Pennsylvania Department of...
33
THE STATISTICAL SUPPLEMENT FOR THE PENNSYLVANIA TAX COMPENDIUM DOP-07 (06-10) OCTOBER 2010 FISCAL YEAR 2009-10
Transcript of The Statistical Supplement for the Pennsylvania Tax ... and... · Pennsylvania Department of...
THE STATISTICAL SUPPLEMENT FORTHE PENNSYLVANIA TAX COMPENDIUM
DOP-07 (06-10)
OCTOBER 2010FISCAL YEAR 2009-10
Pennsylvania Department of Revenue
2009-10 Statistical Supplement Introduction
This publication reports statistics in conjunction with the Pennsylvania Tax Compendium and Monthly Revenue Report. Most data relate to the fiscal year ending June 30, 2010, although some tables provide historical data for comparison purposes. Unusual revenue collection patterns and numerous other effects discernible in the tables and graphs are often the result of significant tax legislation. Please consult the Pennsylvania Tax Compendium for specific tax changes. Other reports and publications available from the Bureau of Research include the Pennsylvania Tax Compendium, Personal Income Tax Statistics, Corporation Tax Statistics and the Monthly Revenue Report. These publications are available on the Department’s website. Requests for hard copies of reports, inclusion on the mailing list, or changes of address may be directed to:
PA Department of Revenue Bureau of Research 1147 Strawberry Square Harrisburg, PA 17128-1100 (717) 787-6300 website: www.revenue.state.pa.us
PageGENERAL FUNDSources of General Fund Revenues - Ten Year Comparison (Graph) 12009-10 General Fund Revenue Collections - By Month 2Ten Year General Fund Revenue Collections 3Ten Year Revenues as Percent of General Fund Total 4Ten Year General Fund Growth Rates 5Selected Transfers from the General Fund 6General Fund Refunds of Taxes 7General Fund Delinquent Tax Collections 7
CORPORATION TAXESCorporation Tax Breakdown - By Type of Payment 8History of Corporation Tax Rates 8Corporate Net Income Tax Cash Payments - By Business Type 9Capital Stock/Franchise Tax Cash Payments - By Business Type 9Corporate Net Income Tax Liability Distribution 10Capital Stock and Franchise Tax Liability Distribution 10Business Filers by Tax Year 11Insurance Premium Taxes - By Source of Tax 12
SALES AND USE TAXSales Tax Remittances - By North American Industry Classification System 13Sales Tax Remittances - By County 15Motor Vehicle Sales Tax Remittances - By County 16
PERSONAL INCOME TAX2008 Personal Income Tax - By Taxable Income Range 17Median Taxable Income - 1989 Through 2008 172008 Personal Income Tax - By County 18
INHERITANCE TAXInheritance and Estate Tax Collections - By County 19
REALTY TRANSFER TAX Realty Transfer Tax Collections - By County 20
MOTOR LICENSE FUNDSources of Motor License Fund Revenues - Ten Year Comparison (Graph) 212009-10 Motor License Fund Revenue Collections - By Month 22Ten Year Motor License Fund Revenue Collections 23Ten Year Revenues as Percent of Motor License Fund Total 24Ten Year Motor License Fund Growth Rates 25Motor License Fund Refund of Taxes 26Motor License Fund Delinquent Tax Collections 26
LOTTERY FUNDSources of Lottery Fund Revenues - Ten Year Comparison (Graph) 27Ten Year Gross Lottery Sales - By Type of Game 28Ten Year Lottery Fund Prizes and Benefits - By Type of Benefit 28
PUBLIC TRANSPORTATION ASSISTANCE FUND (PTAF) andPUBLIC TRANSPORTATION TRUST FUND (PTTF)Sources of PTAF - Five Year Comparison (Graph) 29Five Year PTAF and PTTF Receipts History 30Five Year PTAF and PTTF Growth Rates 30
Table of Contents
Pennsylvania Department of Revenue
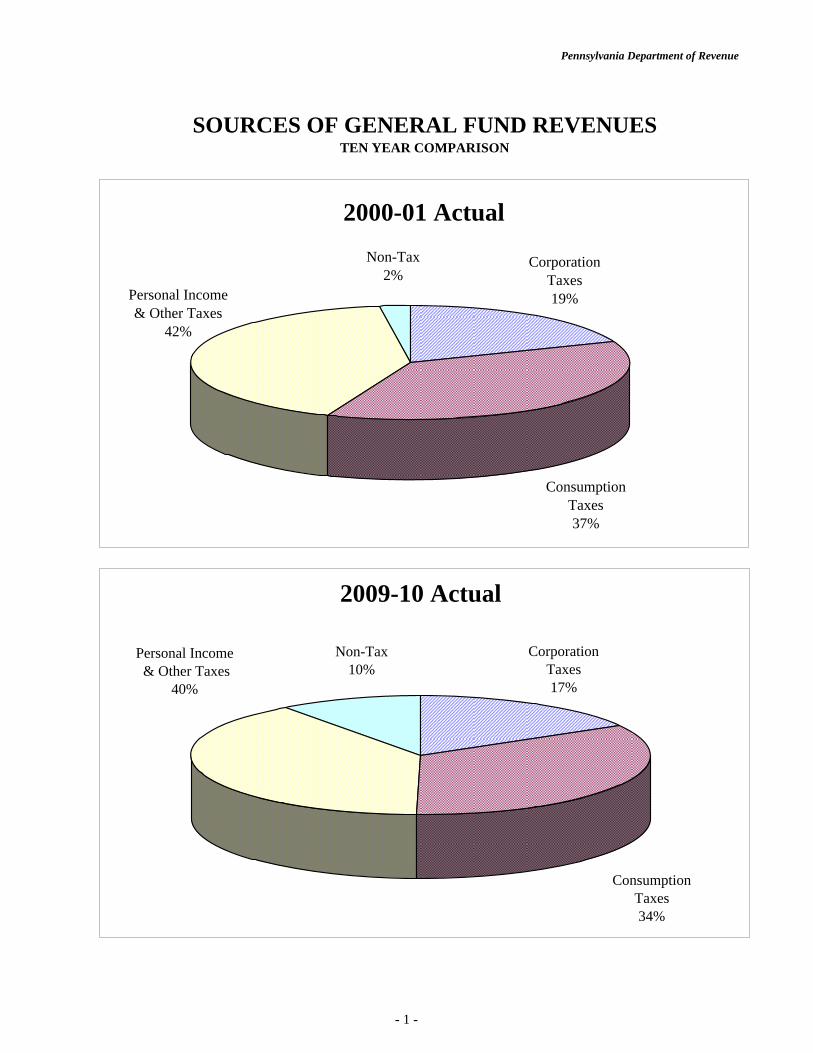
SOURCES OF GENERAL FUND REVENUESTEN YEAR COMPARISON
2000-01 Actual
Personal Income& Other Taxes
42%
ConsumptionTaxes37%
Non-Tax2%
CorporationTaxes19%
2009-10 Actual
CorporationTaxes17%
Non-Tax10%
ConsumptionTaxes34%
Personal Income & Other Taxes
40%
- 1 -
Pennsylvania Department of Revenue
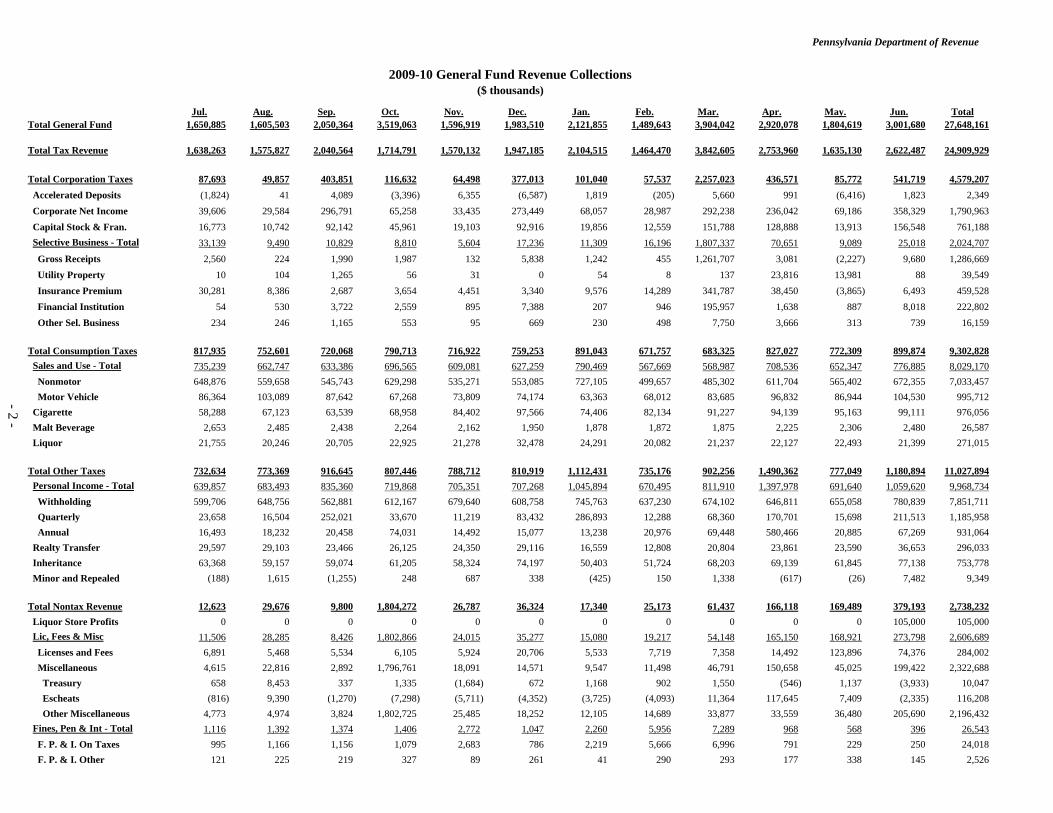
2009-10 General Fund Revenue Collections($ thousands)
Jul. Aug. Sep. Oct. Nov. Dec. Jan. Feb. Mar. Apr. May. Jun. TotalTotal General Fund 1,650,885 1,605,503 2,050,364 3,519,063 1,596,919 1,983,510 2,121,855 1,489,643 3,904,042 2,920,078 1,804,619 3,001,680 27,648,161
Total Tax Revenue 1,638,263 1,575,827 2,040,564 1,714,791 1,570,132 1,947,185 2,104,515 1,464,470 3,842,605 2,753,960 1,635,130 2,622,487 24,909,929
Total Corporation Taxes 87,693 49,857 403,851 116,632 64,498 377,013 101,040 57,537 2,257,023 436,571 85,772 541,719 4,579,207 Accelerated Deposits (1,824) 41 4,089 (3,396) 6,355 (6,587) 1,819 (205) 5,660 991 (6,416) 1,823 2,349 Corporate Net Income 39,606 29,584 296,791 65,258 33,435 273,449 68,057 28,987 292,238 236,042 69,186 358,329 1,790,963 Capital Stock & Fran. 16,773 10,742 92,142 45,961 19,103 92,916 19,856 12,559 151,788 128,888 13,913 156,548 761,188 Selective Business - Total 33,139 9,490 10,829 8,810 5,604 17,236 11,309 16,196 1,807,337 70,651 9,089 25,018 2,024,707 Gross Receipts 2,560 224 1,990 1,987 132 5,838 1,242 455 1,261,707 3,081 (2,227) 9,680 1,286,669 Utility Property 10 104 1,265 56 31 0 54 8 137 23,816 13,981 88 39,549 Insurance Premium 30,281 8,386 2,687 3,654 4,451 3,340 9,576 14,289 341,787 38,450 (3,865) 6,493 459,528 Financial Institution 54 530 3,722 2,559 895 7,388 207 946 195,957 1,638 887 8,018 222,802 Other Sel. Business 234 246 1,165 553 95 669 230 498 7,750 3,666 313 739 16,159
Total Consumption Taxes 817,935 752,601 720,068 790,713 716,922 759,253 891,043 671,757 683,325 827,027 772,309 899,874 9,302,828 Sales and Use - Total 735,239 662,747 633,386 696,565 609,081 627,259 790,469 567,669 568,987 708,536 652,347 776,885 8,029,170 Nonmotor 648,876 559,658 545,743 629,298 535,271 553,085 727,105 499,657 485,302 611,704 565,402 672,355 7,033,457 Motor Vehicle 86,364 103,089 87,642 67,268 73,809 74,174 63,363 68,012 83,685 96,832 86,944 104,530 995,712 Cigarette 58,288 67,123 63,539 68,958 84,402 97,566 74,406 82,134 91,227 94,139 95,163 99,111 976,056 Malt Beverage 2,653 2,485 2,438 2,264 2,162 1,950 1,878 1,872 1,875 2,225 2,306 2,480 26,587 Liquor 21,755 20,246 20,705 22,925 21,278 32,478 24,291 20,082 21,237 22,127 22,493 21,399 271,015
Total Other Taxes 732,634 773,369 916,645 807,446 788,712 810,919 1,112,431 735,176 902,256 1,490,362 777,049 1,180,894 11,027,894 Personal Income - Total 639,857 683,493 835,360 719,868 705,351 707,268 1,045,894 670,495 811,910 1,397,978 691,640 1,059,620 9,968,734 Withholding 599,706 648,756 562,881 612,167 679,640 608,758 745,763 637,230 674,102 646,811 655,058 780,839 7,851,711 Quarterly 23,658 16,504 252,021 33,670 11,219 83,432 286,893 12,288 68,360 170,701 15,698 211,513 1,185,958 Annual 16,493 18,232 20,458 74,031 14,492 15,077 13,238 20,976 69,448 580,466 20,885 67,269 931,064 Realty Transfer 29,597 29,103 23,466 26,125 24,350 29,116 16,559 12,808 20,804 23,861 23,590 36,653 296,033 Inheritance 63,368 59,157 59,074 61,205 58,324 74,197 50,403 51,724 68,203 69,139 61,845 77,138 753,778 Minor and Repealed (188) 1,615 (1,255) 248 687 338 (425) 150 1,338 (617) (26) 7,482 9,349
Total Nontax Revenue 12,623 29,676 9,800 1,804,272 26,787 36,324 17,340 25,173 61,437 166,118 169,489 379,193 2,738,232 Liquor Store Profits 0 0 0 0 0 0 0 0 0 0 0 105,000 105,000 Lic, Fees & Misc 11,506 28,285 8,426 1,802,866 24,015 35,277 15,080 19,217 54,148 165,150 168,921 273,798 2,606,689 Licenses and Fees 6,891 5,468 5,534 6,105 5,924 20,706 5,533 7,719 7,358 14,492 123,896 74,376 284,002 Miscellaneous 4,615 22,816 2,892 1,796,761 18,091 14,571 9,547 11,498 46,791 150,658 45,025 199,422 2,322,688 Treasury 658 8,453 337 1,335 (1,684) 672 1,168 902 1,550 (546) 1,137 (3,933) 10,047 Escheats (816) 9,390 (1,270) (7,298) (5,711) (4,352) (3,725) (4,093) 11,364 117,645 7,409 (2,335) 116,208 Other Miscellaneous 4,773 4,974 3,824 1,802,725 25,485 18,252 12,105 14,689 33,877 33,559 36,480 205,690 2,196,432 Fines, Pen & Int - Total 1,116 1,392 1,374 1,406 2,772 1,047 2,260 5,956 7,289 968 568 396 26,543 F. P. & I. On Taxes 995 1,166 1,156 1,079 2,683 786 2,219 5,666 6,996 791 229 250 24,018 F. P. & I. Other 121 225 219 327 89 261 41 290 293 177 338 145 2,526
- 2 -
Pennsylvania Department of Revenue
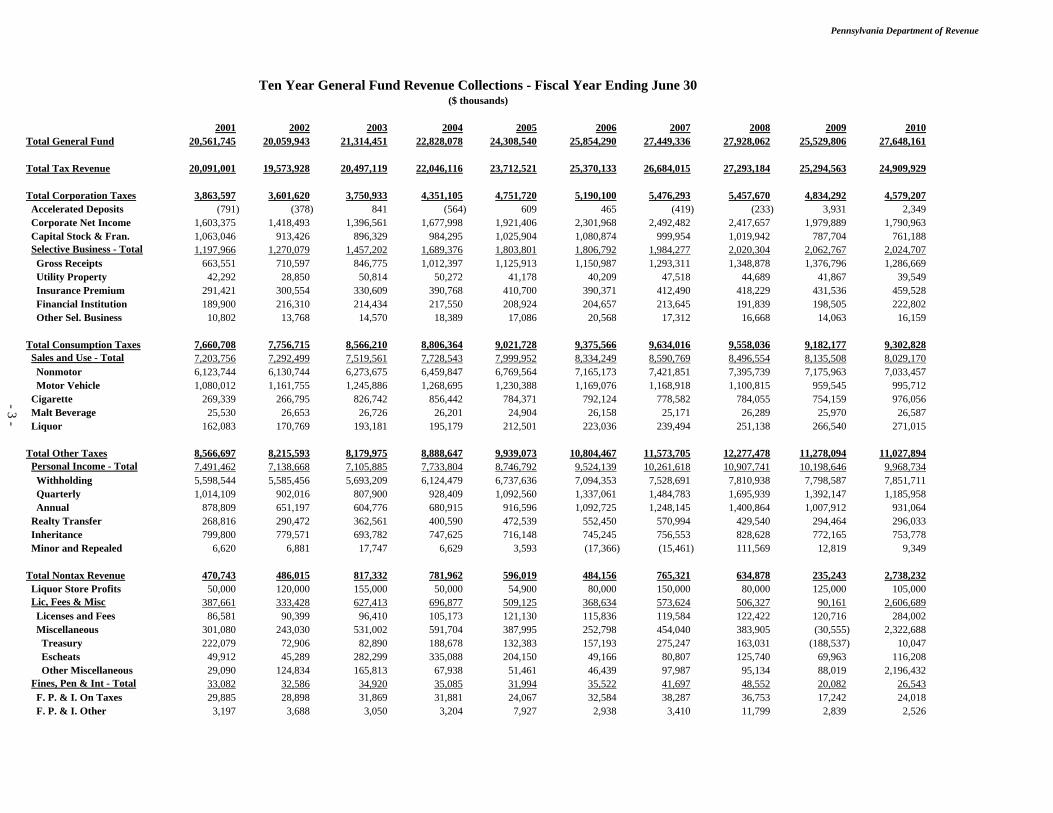
($ thousands)
2001 2002 2003 2004 2005 2006 2007 2008 2009 2010Total General Fund 20,561,745 20,059,943 21,314,451 22,828,078 24,308,540 25,854,290 27,449,336 27,928,062 25,529,806 27,648,161
Total Tax Revenue 20,091,001 19,573,928 20,497,119 22,046,116 23,712,521 25,370,133 26,684,015 27,293,184 25,294,563 24,909,929
Total Corporation Taxes 3,863,597 3,601,620 3,750,933 4,351,105 4,751,720 5,190,100 5,476,293 5,457,670 4,834,292 4,579,207 Accelerated Deposits (791) (378) 841 (564) 609 465 (419) (233) 3,931 2,349 Corporate Net Income 1,603,375 1,418,493 1,396,561 1,677,998 1,921,406 2,301,968 2,492,482 2,417,657 1,979,889 1,790,963 Capital Stock & Fran. 1,063,046 913,426 896,329 984,295 1,025,904 1,080,874 999,954 1,019,942 787,704 761,188 Selective Business - Total 1,197,966 1,270,079 1,457,202 1,689,376 1,803,801 1,806,792 1,984,277 2,020,304 2,062,767 2,024,707 Gross Receipts 663,551 710,597 846,775 1,012,397 1,125,913 1,150,987 1,293,311 1,348,878 1,376,796 1,286,669 Utility Property 42,292 28,850 50,814 50,272 41,178 40,209 47,518 44,689 41,867 39,549 Insurance Premium 291,421 300,554 330,609 390,768 410,700 390,371 412,490 418,229 431,536 459,528 Financial Institution 189,900 216,310 214,434 217,550 208,924 204,657 213,645 191,839 198,505 222,802 Other Sel. Business 10,802 13,768 14,570 18,389 17,086 20,568 17,312 16,668 14,063 16,159
Total Consumption Taxes 7,660,708 7,756,715 8,566,210 8,806,364 9,021,728 9,375,566 9,634,016 9,558,036 9,182,177 9,302,828 Sales and Use - Total 7,203,756 7,292,499 7,519,561 7,728,543 7,999,952 8,334,249 8,590,769 8,496,554 8,135,508 8,029,170 Nonmotor 6,123,744 6,130,744 6,273,675 6,459,847 6,769,564 7,165,173 7,421,851 7,395,739 7,175,963 7,033,457 Motor Vehicle 1,080,012 1,161,755 1,245,886 1,268,695 1,230,388 1,169,076 1,168,918 1,100,815 959,545 995,712 Cigarette 269,339 266,795 826,742 856,442 784,371 792,124 778,582 784,055 754,159 976,056 Malt Beverage 25,530 26,653 26,726 26,201 24,904 26,158 25,171 26,289 25,970 26,587 Liquor 162,083 170,769 193,181 195,179 212,501 223,036 239,494 251,138 266,540 271,015
Total Other Taxes 8,566,697 8,215,593 8,179,975 8,888,647 9,939,073 10,804,467 11,573,705 12,277,478 11,278,094 11,027,894 Personal Income - Total 7,491,462 7,138,668 7,105,885 7,733,804 8,746,792 9,524,139 10,261,618 10,907,741 10,198,646 9,968,734 Withholding 5,598,544 5,585,456 5,693,209 6,124,479 6,737,636 7,094,353 7,528,691 7,810,938 7,798,587 7,851,711 Quarterly 1,014,109 902,016 807,900 928,409 1,092,560 1,337,061 1,484,783 1,695,939 1,392,147 1,185,958 Annual 878,809 651,197 604,776 680,915 916,596 1,092,725 1,248,145 1,400,864 1,007,912 931,064 Realty Transfer 268,816 290,472 362,561 400,590 472,539 552,450 570,994 429,540 294,464 296,033 Inheritance 799,800 779,571 693,782 747,625 716,148 745,245 756,553 828,628 772,165 753,778 Minor and Repealed 6,620 6,881 17,747 6,629 3,593 (17,366) (15,461) 111,569 12,819 9,349
Total Nontax Revenue 470,743 486,015 817,332 781,962 596,019 484,156 765,321 634,878 235,243 2,738,232 Liquor Store Profits 50,000 120,000 155,000 50,000 54,900 80,000 150,000 80,000 125,000 105,000 Lic, Fees & Misc 387,661 333,428 627,413 696,877 509,125 368,634 573,624 506,327 90,161 2,606,689 Licenses and Fees 86,581 90,399 96,410 105,173 121,130 115,836 119,584 122,422 120,716 284,002 Miscellaneous 301,080 243,030 531,002 591,704 387,995 252,798 454,040 383,905 (30,555) 2,322,688 Treasury 222,079 72,906 82,890 188,678 132,383 157,193 275,247 163,031 (188,537) 10,047 Escheats 49,912 45,289 282,299 335,088 204,150 49,166 80,807 125,740 69,963 116,208 Other Miscellaneous 29,090 124,834 165,813 67,938 51,461 46,439 97,987 95,134 88,019 2,196,432 Fines, Pen & Int - Total 33,082 32,586 34,920 35,085 31,994 35,522 41,697 48,552 20,082 26,543 F. P. & I. On Taxes 29,885 28,898 31,869 31,881 24,067 32,584 38,287 36,753 17,242 24,018 F. P. & I. Other 3,197 3,688 3,050 3,204 7,927 2,938 3,410 11,799 2,839 2,526
Ten Year General Fund Revenue Collections - Fiscal Year Ending June 30
- 3 -
Pennsylvania Department of Revenue
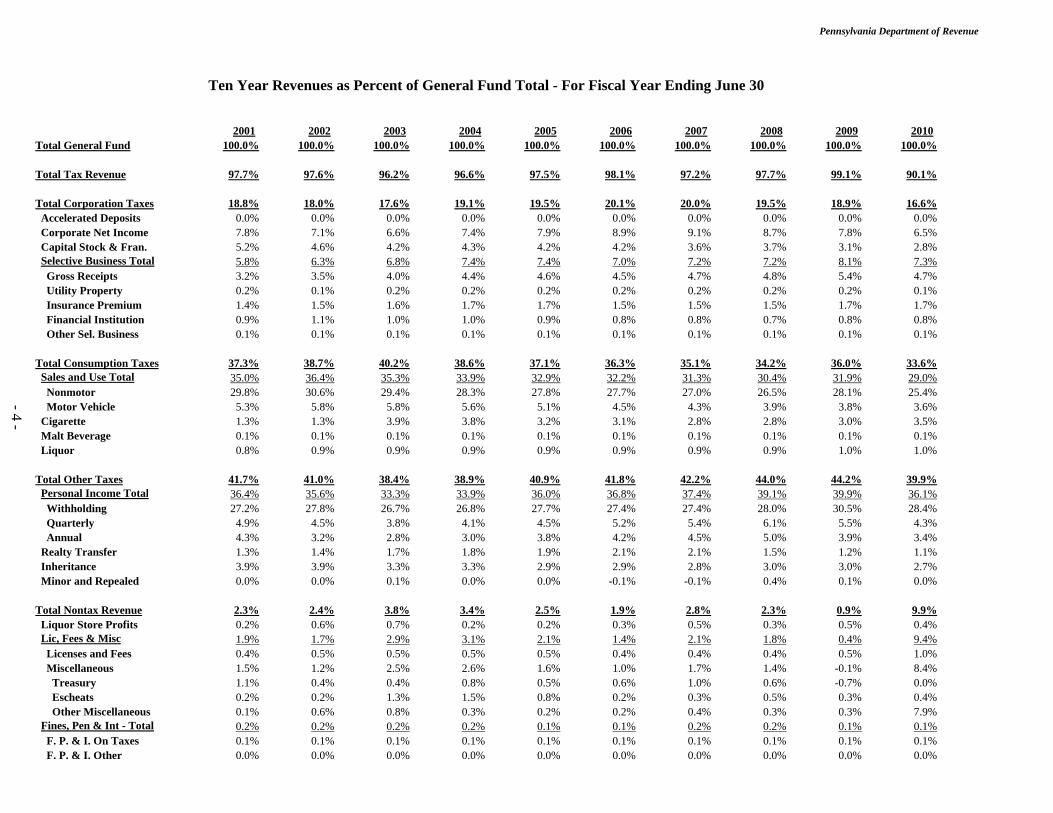
Ten Year Revenues as Percent of General Fund Total - For Fiscal Year Ending June 30
2001 2002 2003 2004 2005 2006 2007 2008 2009 2010Total General Fund 100.0% 100.0% 100.0% 100.0% 100.0% 100.0% 100.0% 100.0% 100.0% 100.0%
Total Tax Revenue 97.7% 97.6% 96.2% 96.6% 97.5% 98.1% 97.2% 97.7% 99.1% 90.1%
Total Corporation Taxes 18.8% 18.0% 17.6% 19.1% 19.5% 20.1% 20.0% 19.5% 18.9% 16.6% Accelerated Deposits 0.0% 0.0% 0.0% 0.0% 0.0% 0.0% 0.0% 0.0% 0.0% 0.0% Corporate Net Income 7.8% 7.1% 6.6% 7.4% 7.9% 8.9% 9.1% 8.7% 7.8% 6.5% Capital Stock & Fran. 5.2% 4.6% 4.2% 4.3% 4.2% 4.2% 3.6% 3.7% 3.1% 2.8% Selective Business Total 5.8% 6.3% 6.8% 7.4% 7.4% 7.0% 7.2% 7.2% 8.1% 7.3% Gross Receipts 3.2% 3.5% 4.0% 4.4% 4.6% 4.5% 4.7% 4.8% 5.4% 4.7% Utility Property 0.2% 0.1% 0.2% 0.2% 0.2% 0.2% 0.2% 0.2% 0.2% 0.1% Insurance Premium 1.4% 1.5% 1.6% 1.7% 1.7% 1.5% 1.5% 1.5% 1.7% 1.7% Financial Institution 0.9% 1.1% 1.0% 1.0% 0.9% 0.8% 0.8% 0.7% 0.8% 0.8% Other Sel. Business 0.1% 0.1% 0.1% 0.1% 0.1% 0.1% 0.1% 0.1% 0.1% 0.1%
Total Consumption Taxes 37.3% 38.7% 40.2% 38.6% 37.1% 36.3% 35.1% 34.2% 36.0% 33.6% Sales and Use Total 35.0% 36.4% 35.3% 33.9% 32.9% 32.2% 31.3% 30.4% 31.9% 29.0% Nonmotor 29.8% 30.6% 29.4% 28.3% 27.8% 27.7% 27.0% 26.5% 28.1% 25.4% Motor Vehicle 5.3% 5.8% 5.8% 5.6% 5.1% 4.5% 4.3% 3.9% 3.8% 3.6% Cigarette 1.3% 1.3% 3.9% 3.8% 3.2% 3.1% 2.8% 2.8% 3.0% 3.5% Malt Beverage 0.1% 0.1% 0.1% 0.1% 0.1% 0.1% 0.1% 0.1% 0.1% 0.1% Liquor 0.8% 0.9% 0.9% 0.9% 0.9% 0.9% 0.9% 0.9% 1.0% 1.0%
Total Other Taxes 41.7% 41.0% 38.4% 38.9% 40.9% 41.8% 42.2% 44.0% 44.2% 39.9% Personal Income Total 36.4% 35.6% 33.3% 33.9% 36.0% 36.8% 37.4% 39.1% 39.9% 36.1% Withholding 27.2% 27.8% 26.7% 26.8% 27.7% 27.4% 27.4% 28.0% 30.5% 28.4% Quarterly 4.9% 4.5% 3.8% 4.1% 4.5% 5.2% 5.4% 6.1% 5.5% 4.3% Annual 4.3% 3.2% 2.8% 3.0% 3.8% 4.2% 4.5% 5.0% 3.9% 3.4% Realty Transfer 1.3% 1.4% 1.7% 1.8% 1.9% 2.1% 2.1% 1.5% 1.2% 1.1% Inheritance 3.9% 3.9% 3.3% 3.3% 2.9% 2.9% 2.8% 3.0% 3.0% 2.7% Minor and Repealed 0.0% 0.0% 0.1% 0.0% 0.0% -0.1% -0.1% 0.4% 0.1% 0.0%
Total Nontax Revenue 2.3% 2.4% 3.8% 3.4% 2.5% 1.9% 2.8% 2.3% 0.9% 9.9% Liquor Store Profits 0.2% 0.6% 0.7% 0.2% 0.2% 0.3% 0.5% 0.3% 0.5% 0.4% Lic, Fees & Misc 1.9% 1.7% 2.9% 3.1% 2.1% 1.4% 2.1% 1.8% 0.4% 9.4% Licenses and Fees 0.4% 0.5% 0.5% 0.5% 0.5% 0.4% 0.4% 0.4% 0.5% 1.0% Miscellaneous 1.5% 1.2% 2.5% 2.6% 1.6% 1.0% 1.7% 1.4% -0.1% 8.4% Treasury 1.1% 0.4% 0.4% 0.8% 0.5% 0.6% 1.0% 0.6% -0.7% 0.0% Escheats 0.2% 0.2% 1.3% 1.5% 0.8% 0.2% 0.3% 0.5% 0.3% 0.4% Other Miscellaneous 0.1% 0.6% 0.8% 0.3% 0.2% 0.2% 0.4% 0.3% 0.3% 7.9% Fines, Pen & Int - Total 0.2% 0.2% 0.2% 0.2% 0.1% 0.1% 0.2% 0.2% 0.1% 0.1% F. P. & I. On Taxes 0.1% 0.1% 0.1% 0.1% 0.1% 0.1% 0.1% 0.1% 0.1% 0.1% F. P. & I. Other 0.0% 0.0% 0.0% 0.0% 0.0% 0.0% 0.0% 0.0% 0.0% 0.0%
- 4 -
Pennsylvania Department of Revenue
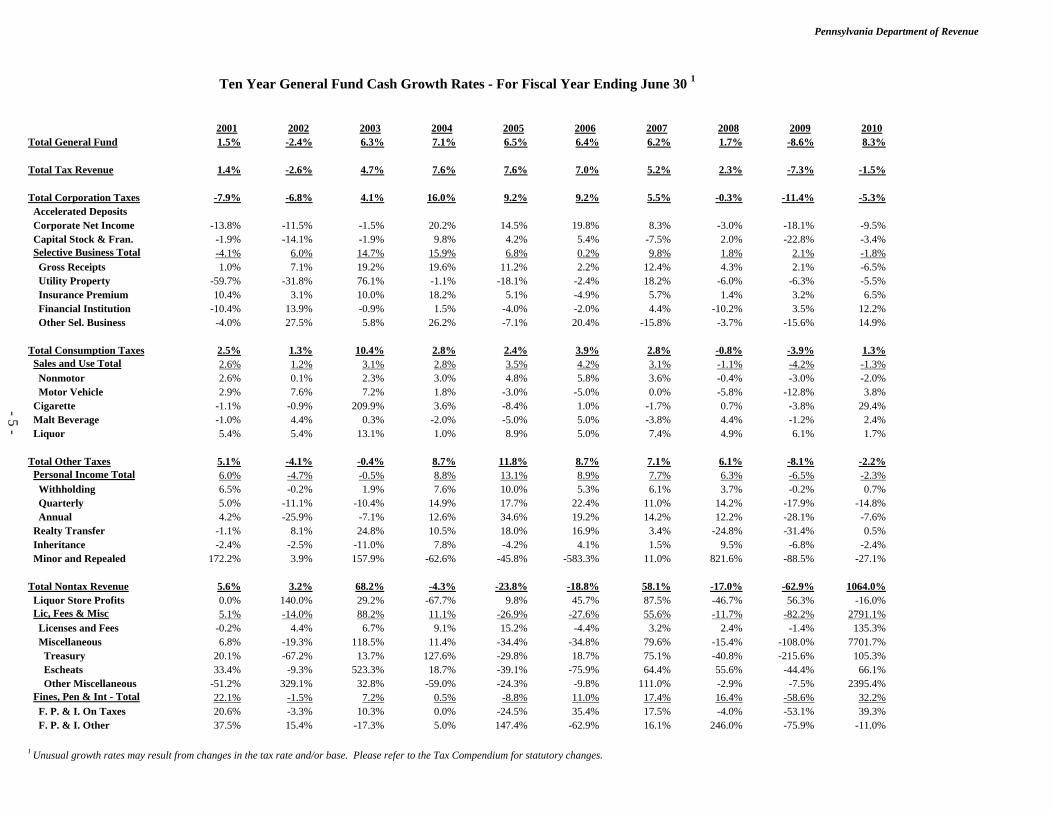
Ten Year General Fund Cash Growth Rates - For Fiscal Year Ending June 30 1
2001 2002 2003 2004 2005 2006 2007 2008 2009 2010Total General Fund 1.5% -2.4% 6.3% 7.1% 6.5% 6.4% 6.2% 1.7% -8.6% 8.3%
Total Tax Revenue 1.4% -2.6% 4.7% 7.6% 7.6% 7.0% 5.2% 2.3% -7.3% -1.5%
Total Corporation Taxes -7.9% -6.8% 4.1% 16.0% 9.2% 9.2% 5.5% -0.3% -11.4% -5.3% Accelerated Deposits Corporate Net Income -13.8% -11.5% -1.5% 20.2% 14.5% 19.8% 8.3% -3.0% -18.1% -9.5% Capital Stock & Fran. -1.9% -14.1% -1.9% 9.8% 4.2% 5.4% -7.5% 2.0% -22.8% -3.4% Selective Business Total -4.1% 6.0% 14.7% 15.9% 6.8% 0.2% 9.8% 1.8% 2.1% -1.8% Gross Receipts 1.0% 7.1% 19.2% 19.6% 11.2% 2.2% 12.4% 4.3% 2.1% -6.5% Utility Property -59.7% -31.8% 76.1% -1.1% -18.1% -2.4% 18.2% -6.0% -6.3% -5.5% Insurance Premium 10.4% 3.1% 10.0% 18.2% 5.1% -4.9% 5.7% 1.4% 3.2% 6.5% Financial Institution -10.4% 13.9% -0.9% 1.5% -4.0% -2.0% 4.4% -10.2% 3.5% 12.2% Other Sel. Business -4.0% 27.5% 5.8% 26.2% -7.1% 20.4% -15.8% -3.7% -15.6% 14.9%
Total Consumption Taxes 2.5% 1.3% 10.4% 2.8% 2.4% 3.9% 2.8% -0.8% -3.9% 1.3% Sales and Use Total 2.6% 1.2% 3.1% 2.8% 3.5% 4.2% 3.1% -1.1% -4.2% -1.3% Nonmotor 2.6% 0.1% 2.3% 3.0% 4.8% 5.8% 3.6% -0.4% -3.0% -2.0% Motor Vehicle 2.9% 7.6% 7.2% 1.8% -3.0% -5.0% 0.0% -5.8% -12.8% 3.8% Cigarette -1.1% -0.9% 209.9% 3.6% -8.4% 1.0% -1.7% 0.7% -3.8% 29.4% Malt Beverage -1.0% 4.4% 0.3% -2.0% -5.0% 5.0% -3.8% 4.4% -1.2% 2.4% Liquor 5.4% 5.4% 13.1% 1.0% 8.9% 5.0% 7.4% 4.9% 6.1% 1.7%
Total Other Taxes 5.1% -4.1% -0.4% 8.7% 11.8% 8.7% 7.1% 6.1% -8.1% -2.2% Personal Income Total 6.0% -4.7% -0.5% 8.8% 13.1% 8.9% 7.7% 6.3% -6.5% -2.3% Withholding 6.5% -0.2% 1.9% 7.6% 10.0% 5.3% 6.1% 3.7% -0.2% 0.7% Quarterly 5.0% -11.1% -10.4% 14.9% 17.7% 22.4% 11.0% 14.2% -17.9% -14.8% Annual 4.2% -25.9% -7.1% 12.6% 34.6% 19.2% 14.2% 12.2% -28.1% -7.6% Realty Transfer -1.1% 8.1% 24.8% 10.5% 18.0% 16.9% 3.4% -24.8% -31.4% 0.5% Inheritance -2.4% -2.5% -11.0% 7.8% -4.2% 4.1% 1.5% 9.5% -6.8% -2.4% Minor and Repealed 172.2% 3.9% 157.9% -62.6% -45.8% -583.3% 11.0% 821.6% -88.5% -27.1%
Total Nontax Revenue 5.6% 3.2% 68.2% -4.3% -23.8% -18.8% 58.1% -17.0% -62.9% 1064.0% Liquor Store Profits 0.0% 140.0% 29.2% -67.7% 9.8% 45.7% 87.5% -46.7% 56.3% -16.0% Lic, Fees & Misc 5.1% -14.0% 88.2% 11.1% -26.9% -27.6% 55.6% -11.7% -82.2% 2791.1% Licenses and Fees -0.2% 4.4% 6.7% 9.1% 15.2% -4.4% 3.2% 2.4% -1.4% 135.3% Miscellaneous 6.8% -19.3% 118.5% 11.4% -34.4% -34.8% 79.6% -15.4% -108.0% 7701.7% Treasury 20.1% -67.2% 13.7% 127.6% -29.8% 18.7% 75.1% -40.8% -215.6% 105.3% Escheats 33.4% -9.3% 523.3% 18.7% -39.1% -75.9% 64.4% 55.6% -44.4% 66.1% Other Miscellaneous -51.2% 329.1% 32.8% -59.0% -24.3% -9.8% 111.0% -2.9% -7.5% 2395.4% Fines, Pen & Int - Total 22.1% -1.5% 7.2% 0.5% -8.8% 11.0% 17.4% 16.4% -58.6% 32.2% F. P. & I. On Taxes 20.6% -3.3% 10.3% 0.0% -24.5% 35.4% 17.5% -4.0% -53.1% 39.3% F. P. & I. Other 37.5% 15.4% -17.3% 5.0% 147.4% -62.9% 16.1% 246.0% -75.9% -11.0%
1 Unusual growth rates may result from changes in the tax rate and/or base. Please refer to the Tax Compendium for statutory changes.
- 5 -
Pennsylvania Department of Revenue
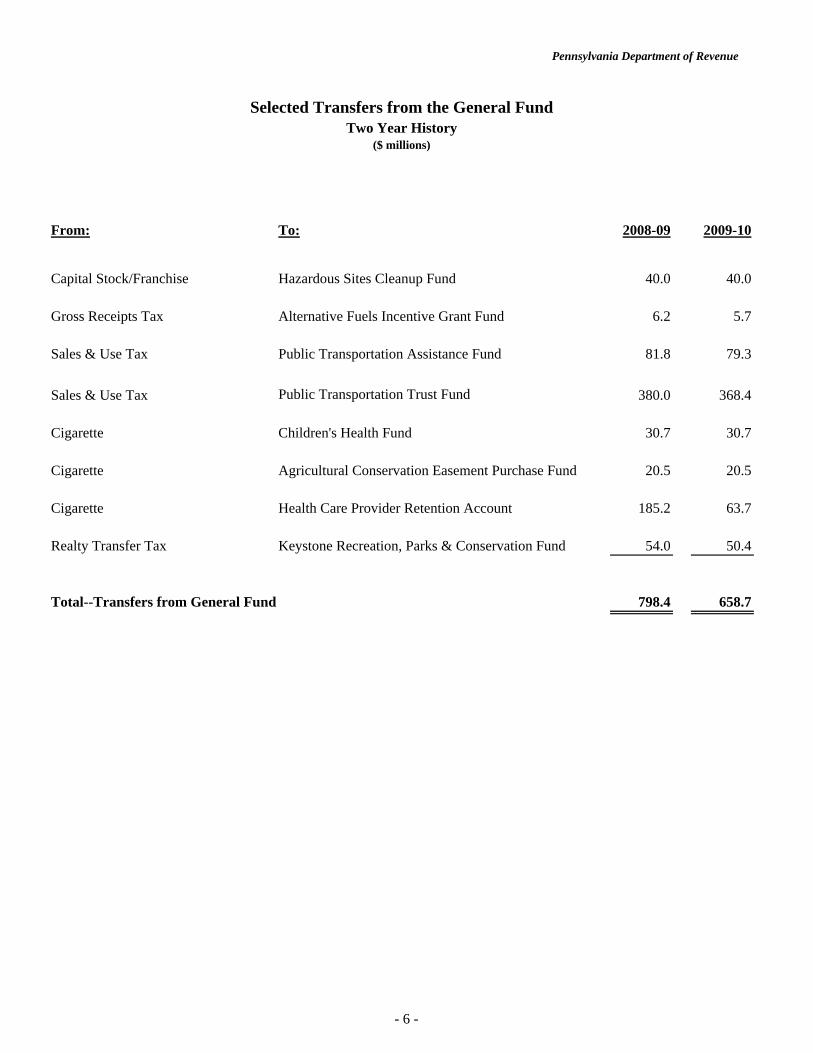
Selected Transfers from the General FundTwo Year History
($ millions)
From: To: 2008-09 2009-10
Capital Stock/Franchise Hazardous Sites Cleanup Fund 40.0 40.0
Gross Receipts Tax Alternative Fuels Incentive Grant Fund 6.2 5.7
Sales & Use Tax Public Transportation Assistance Fund 81.8 79.3
Sales & Use Tax Public Transportation Trust Fund 380.0 368.4
Cigarette Children's Health Fund 30.7 30.7
Cigarette Agricultural Conservation Easement Purchase Fund 20.5 20.5
Cigarette Health Care Provider Retention Account 185.2 63.7
Realty Transfer Tax Keystone Recreation, Parks & Conservation Fund 54.0 50.4
Total--Transfers from General Fund 798.4 658.7
- 6 -
Pennsylvania Department of Revenue
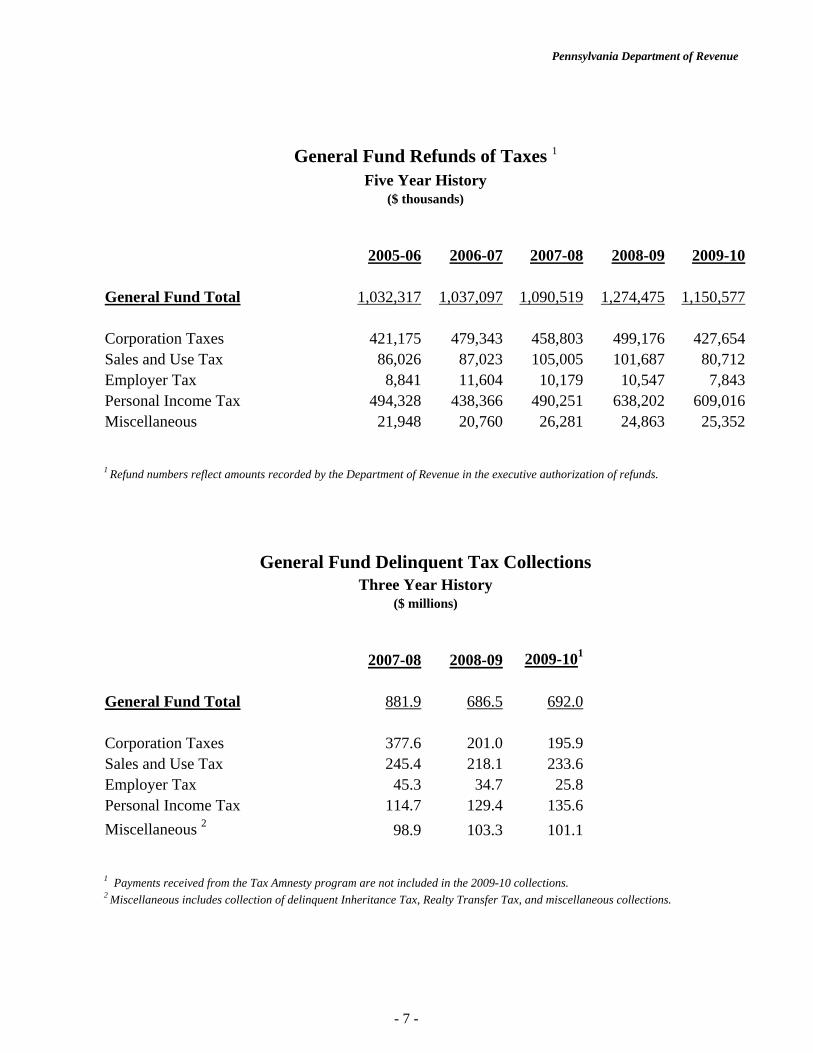
General Fund Refunds of Taxes 1
Five Year History($ thousands)
2005-06 2006-07 2007-08 2008-09 2009-10
General Fund Total 1,032,317 1,037,097 1,090,519 1,274,475 1,150,577
Corporation Taxes 421,175 479,343 458,803 499,176 427,654Sales and Use Tax 86,026 87,023 105,005 101,687 80,712Employer Tax 8,841 11,604 10,179 10,547 7,843Personal Income Tax 494,328 438,366 490,251 638,202 609,016Miscellaneous 21,948 20,760 26,281 24,863 25,352
General Fund Delinquent Tax CollectionsThree Year History
($ millions)
2007-08 2008-09 2009-101
General Fund Total 881.9 686.5 692.0
Corporation Taxes 377.6 201.0 195.9Sales and Use Tax 245.4 218.1 233.6Employer Tax 45.3 34.7 25.8Personal Income Tax 114.7 129.4 135.6Miscellaneous 2 98.9 103.3 101.1
2 Miscellaneous includes collection of delinquent Inheritance Tax, Realty Transfer Tax, and miscellaneous collections.
1 Refund numbers reflect amounts recorded by the Department of Revenue in the executive authorization of refunds.
1 Payments received from the Tax Amnesty program are not included in the 2009-10 collections.
- 7 -
Pennsylvania Department of Revenue
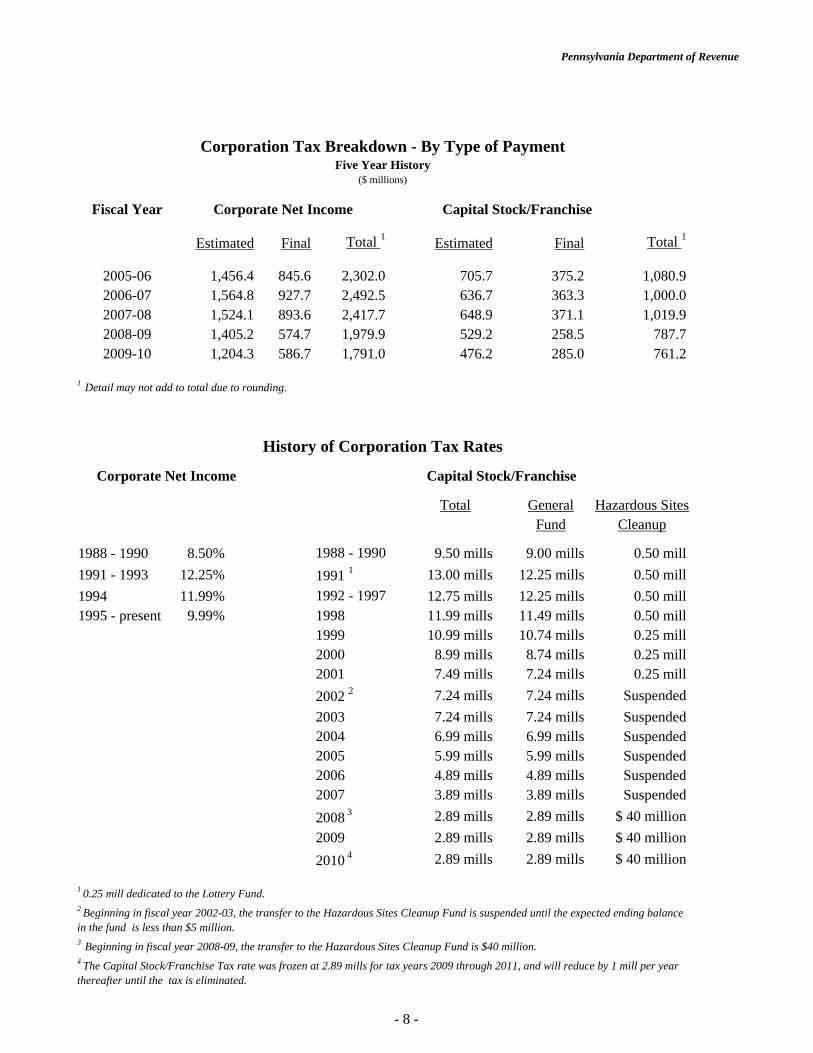
Fiscal Year
Estimated Final Total 1 Estimated Final Total 1
2005-06 1,456.4 845.6 2,302.0 705.7 375.2 1,080.92006-07 1,564.8 927.7 2,492.5 636.7 363.3 1,000.02007-08 1,524.1 893.6 2,417.7 648.9 371.1 1,019.92008-09 1,405.2 574.7 1,979.9 529.2 258.5 787.72009-10 1,204.3 586.7 1,791.0 476.2 285.0 761.2
Total General Hazardous SitesFund Cleanup
1988 - 1990 8.50% 9.50 mills 9.00 mills 0.50 mill1991 - 1993 12.25% 13.00 mills 12.25 mills 0.50 mill1994 11.99% 12.75 mills 12.25 mills 0.50 mill1995 - present 9.99% 1998 11.99 mills 11.49 mills 0.50 mill
1999 10.99 mills 10.74 mills 0.25 mill2000 8.99 mills 8.74 mills 0.25 mill2001 7.49 mills 7.24 mills 0.25 mill
7.24 mills 7.24 mills Suspended2003 7.24 mills 7.24 mills Suspended2004 6.99 mills 6.99 mills Suspended2005 5.99 mills 5.99 mills Suspended2006 4.89 mills 4.89 mills Suspended2007 3.89 mills 3.89 mills Suspended2008 3 2.89 mills 2.89 mills $ 40 million2009 2.89 mills 2.89 mills $ 40 million2010 4 2.89 mills 2.89 mills $ 40 million
1988 - 19901991 1
4 The Capital Stock/Franchise Tax rate was frozen at 2.89 mills for tax years 2009 through 2011, and will reduce by 1 mill per year thereafter until the tax is eliminated.
2002 2
1 0.25 mill dedicated to the Lottery Fund.2 Beginning in fiscal year 2002-03, the transfer to the Hazardous Sites Cleanup Fund is suspended until the expected ending balance in the fund is less than $5 million.3 Beginning in fiscal year 2008-09, the transfer to the Hazardous Sites Cleanup Fund is $40 million.
1992 - 1997
Corporation Tax Breakdown - By Type of PaymentFive Year History
($ millions)
Corporate Net Income Capital Stock/Franchise
1 Detail may not add to total due to rounding.
History of Corporation Tax Rates
Corporate Net Income Capital Stock/Franchise
- 8 -

Pennsylvania Department of Revenue
2007-08 2008-09Business TypeAgriculture, Forestry, Fishing, and Hunting 2,902 2,007 Mining 31,254 22,953 Utilities 337,215 198,228 Construction 46,121 41,233 Manufacturing 415,298 306,588 Wholesale Trade 311,679 268,542 Retail Trade 203,527 135,367 Accommodation and Foodservices 16,230 11,616 Finance and Insurance 136,042 71,887 Real Estate and Rental and Leasing 53,454 68,069 Management of Companies and Enterprises 38,102 136,702 Transportation and Warehousing 96,781 83,407 Information 235,217 156,800 Professional, Scientific, and Technical Services 81,138 81,789 Adminstrative and Support, Waste Management, and Remediation Services 84,711 75,438 Education Services 8,081 7,104 Health Care and Social Assistance 56,738 63,991 Arts, Entertainment, and Recreation 6,996 19,985 Other Services 96,001 98,866 Not Classified 160,170 129,317
TOTAL 2,417,657 1,979,889
2007-08 2008-09Business TypeAgriculture, Forestry, Fishing, and Hunting 1,621 1,632 Mining 13,845 11,818 Utilities 53,199 36,098 Construction 38,086 31,339 Manufacturing 134,818 76,858 Wholesale Trade 140,630 113,016 Retail Trade 85,431 119,915 Accommodation and Foodservices 11,368 7,756 Finance and Insurance 90,290 59,440 Real Estate and Rental and Leasing 38,744 31,637 Management of Companies and Enterprises 20,421 18,532 Transportation and Warehousing 35,233 19,328 Information 99,539 65,837 Professional, Scientific, and Technical Services 69,520 53,084 Adminstrative and Support, Waste Management, and Remediation Services 19,086 11,549 Education Services 2,681 3,282 Health Care and Social Assistance 25,985 22,735 Arts, Entertainment, and Recreation 4,434 4,394 Other Services 60,687 40,276 Not Classified 74,323 59,177
TOTAL 1,019,942 787,704
( $ thousands)
( $ thousands)
Corporate Net Income Tax Cash Payments - By Business Type (NAICS)
Capital Stock/Franchise Tax Cash Payments - By Business Type (NAICS)
- 9 -
Pennsylvania Department of Revenue
Preliminary Advance Preliminary
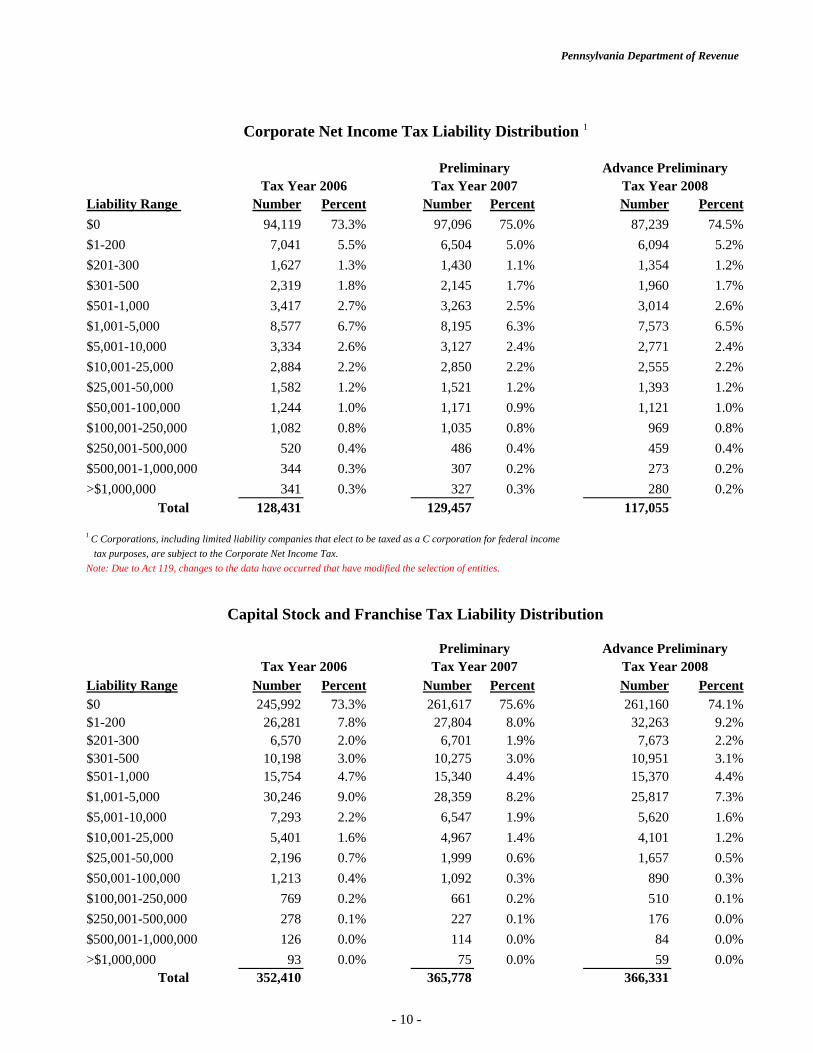
Liability Range Number Percent Number Percent Number Percent$0 94,119 73.3% 97,096 75.0% 87,239 74.5%$1-200 7,041 5.5% 6,504 5.0% 6,094 5.2%$201-300 1,627 1.3% 1,430 1.1% 1,354 1.2%$301-500 2,319 1.8% 2,145 1.7% 1,960 1.7%$501-1,000 3,417 2.7% 3,263 2.5% 3,014 2.6%$1,001-5,000 8,577 6.7% 8,195 6.3% 7,573 6.5%$5,001-10,000 3,334 2.6% 3,127 2.4% 2,771 2.4%$10,001-25,000 2,884 2.2% 2,850 2.2% 2,555 2.2%$25,001-50,000 1,582 1.2% 1,521 1.2% 1,393 1.2%$50,001-100,000 1,244 1.0% 1,171 0.9% 1,121 1.0%$100,001-250,000 1,082 0.8% 1,035 0.8% 969 0.8%$250,001-500,000 520 0.4% 486 0.4% 459 0.4%$500,001-1,000,000 344 0.3% 307 0.2% 273 0.2%>$1,000,000 341 0.3% 327 0.3% 280 0.2%
Total 128,431 129,457 117,055
Note: Due to Act 119, changes to the data have occurred that have modified the selection of entities.
Preliminary Advance Preliminary
Liability Range Number Percent Number Percent Number Percent$0 245,992 73.3% 261,617 75.6% 261,160 74.1%$1-200 26,281 7.8% 27,804 8.0% 32,263 9.2%$201-300 6,570 2.0% 6,701 1.9% 7,673 2.2%$301-500 10,198 3.0% 10,275 3.0% 10,951 3.1%$501-1,000 15,754 4.7% 15,340 4.4% 15,370 4.4%$1,001-5,000 30,246 9.0% 28,359 8.2% 25,817 7.3%$5,001-10,000 7,293 2.2% 6,547 1.9% 5,620 1.6%$10,001-25,000 5,401 1.6% 4,967 1.4% 4,101 1.2%$25,001-50,000 2,196 0.7% 1,999 0.6% 1,657 0.5%$50,001-100,000 1,213 0.4% 1,092 0.3% 890 0.3%$100,001-250,000 769 0.2% 661 0.2% 510 0.1%$250,001-500,000 278 0.1% 227 0.1% 176 0.0%$500,001-1,000,000 126 0.0% 114 0.0% 84 0.0%>$1,000,000 93 0.0% 75 0.0% 59 0.0%
Total 352,410 365,778 366,331
Corporate Net Income Tax Liability Distribution 1
1 C Corporations, including limited liability companies that elect to be taxed as a C corporation for federal income tax purposes, are subject to the Corporate Net Income Tax.
Tax Year 2006 Tax Year 2007 Tax Year 2008
Capital Stock and Franchise Tax Liability Distribution
Tax Year 2006 Tax Year 2007 Tax Year 2008
- 10 -
Pennsylvania Department of Revenue
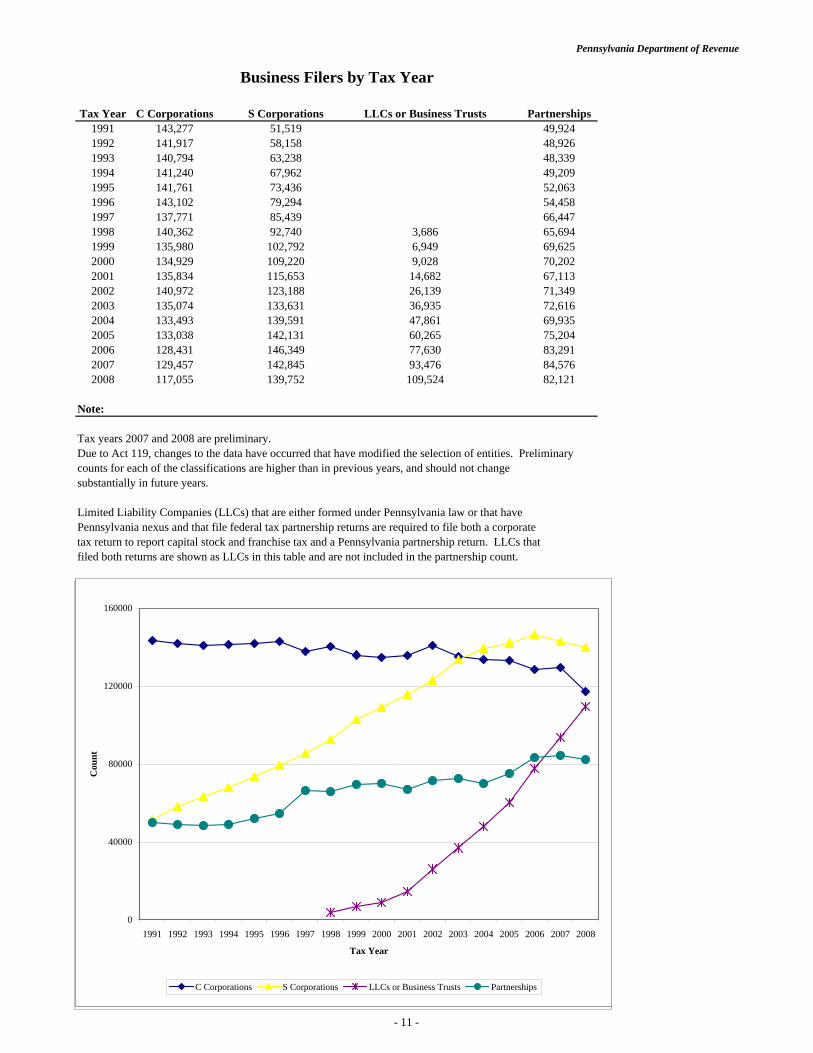
Tax Year C Corporations S Corporations LLCs or Business Trusts Partnerships1991 143,277 51,519 49,9241992 141,917 58,158 48,9261993 140,794 63,238 48,3391994 141,240 67,962 49,2091995 141,761 73,436 52,0631996 143,102 79,294 54,4581997 137,771 85,439 66,4471998 140,362 92,740 3,686 65,6941999 135,980 102,792 6,949 69,6252000 134,929 109,220 9,028 70,2022001 135,834 115,653 14,682 67,1132002 140,972 123,188 26,139 71,3492003 135,074 133,631 36,935 72,6162004 133,493 139,591 47,861 69,9352005 133,038 142,131 60,265 75,2042006 128,431 146,349 77,630 83,2912007 129,457 142,845 93,476 84,5762008 117,055 139,752 109,524 82,121
Due to Act 119, changes to the data have occurred that have modified the selection of entities. Preliminary counts for each of the classifications are higher than in previous years, and should not changesubstantially in future years.
Pennsylvania nexus and that file federal tax partnership returns are required to file both a corporate tax return to report capital stock and franchise tax and a Pennsylvania partnership return. LLCs that filed both returns are shown as LLCs in this table and are not included in the partnership count.
Business Filers by Tax Year
Limited Liability Companies (LLCs) that are either formed under Pennsylvania law or that have
Note:
Tax years 2007 and 2008 are preliminary.
0
40000
80000
120000
160000
1991 1992 1993 1994 1995 1996 1997 1998 1999 2000 2001 2002 2003 2004 2005 2006
Tax Year
Cou
nt
C Corporations S Corporations LLCs or Business Trusts Partnerships
0
40000
80000
120000
160000
1991 1992 1993 1994 1995 1996 1997 1998 1999 2000 2001 2002 2003 2004 2005 2006 2007
Tax Year
Cou
nt
C Corporations S Corporations LLCs or Business Trusts Partnerships
0
40000
80000
120000
160000
1991 1992 1993 1994 1995 1996 1997 1998 1999 2000 2001 2002 2003 2004 2005 2006 2007 2008
Tax Year
Cou
nt
C Corporations S Corporations LLCs or Business Trusts Partnerships
- 11 -
Pennsylvania Department of Revenue
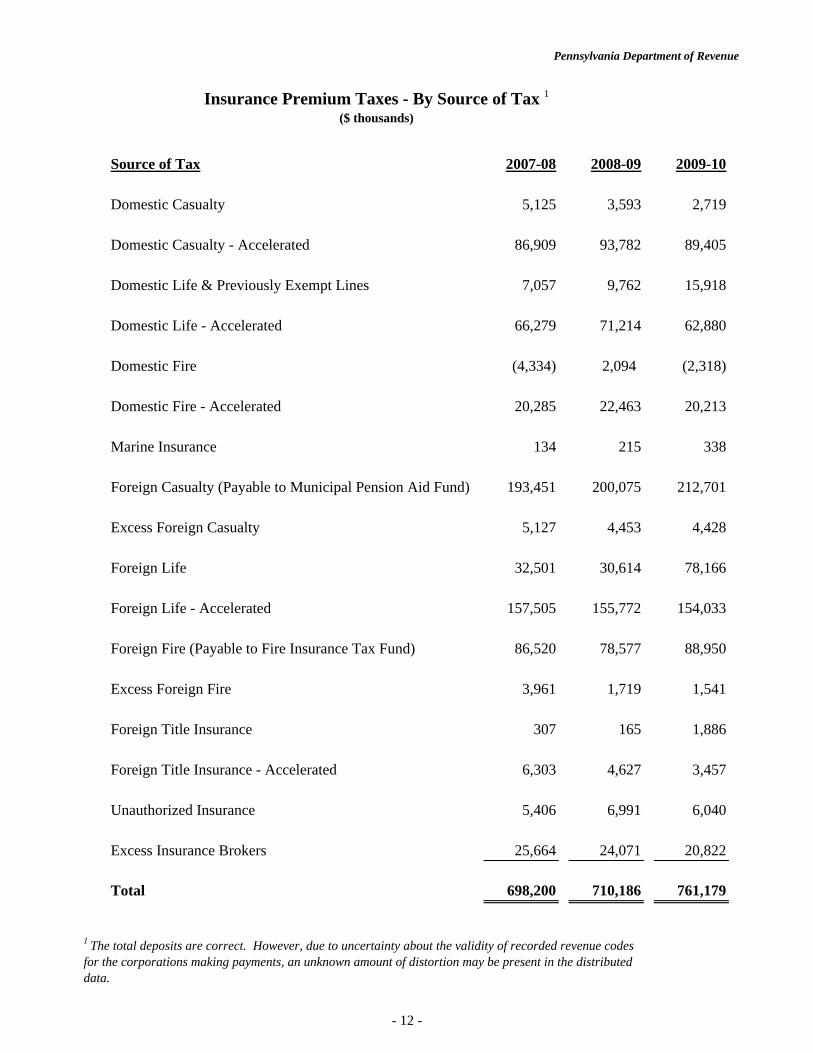
Source of Tax 2007-08 2008-09 2009-10
Domestic Casualty 5,125 3,593 2,719
Domestic Casualty - Accelerated 86,909 93,782 89,405
Domestic Life & Previously Exempt Lines 7,057 9,762 15,918
Domestic Life - Accelerated 66,279 71,214 62,880
Domestic Fire (4,334) 2,094 (2,318)
Domestic Fire - Accelerated 20,285 22,463 20,213
Marine Insurance 134 215 338
Foreign Casualty (Payable to Municipal Pension Aid Fund) 193,451 200,075 212,701
Excess Foreign Casualty 5,127 4,453 4,428
Foreign Life 32,501 30,614 78,166
Foreign Life - Accelerated 157,505 155,772 154,033
Foreign Fire (Payable to Fire Insurance Tax Fund) 86,520 78,577 88,950
Excess Foreign Fire 3,961 1,719 1,541
Foreign Title Insurance 307 165 1,886
Foreign Title Insurance - Accelerated 6,303 4,627 3,457
Unauthorized Insurance 5,406 6,991 6,040
Excess Insurance Brokers 25,664 24,071 20,822
Total 698,200 710,186 761,179
Insurance Premium Taxes - By Source of Tax 1
($ thousands)
1 The total deposits are correct. However, due to uncertainty about the validity of recorded revenue codes for the corporations making payments, an unknown amount of distortion may be present in the distributed data.
- 12 -
Pennsylvania Department of Revenue
2008-09 2009-10 PercentNAICS Business Type Remittance Remittance Change
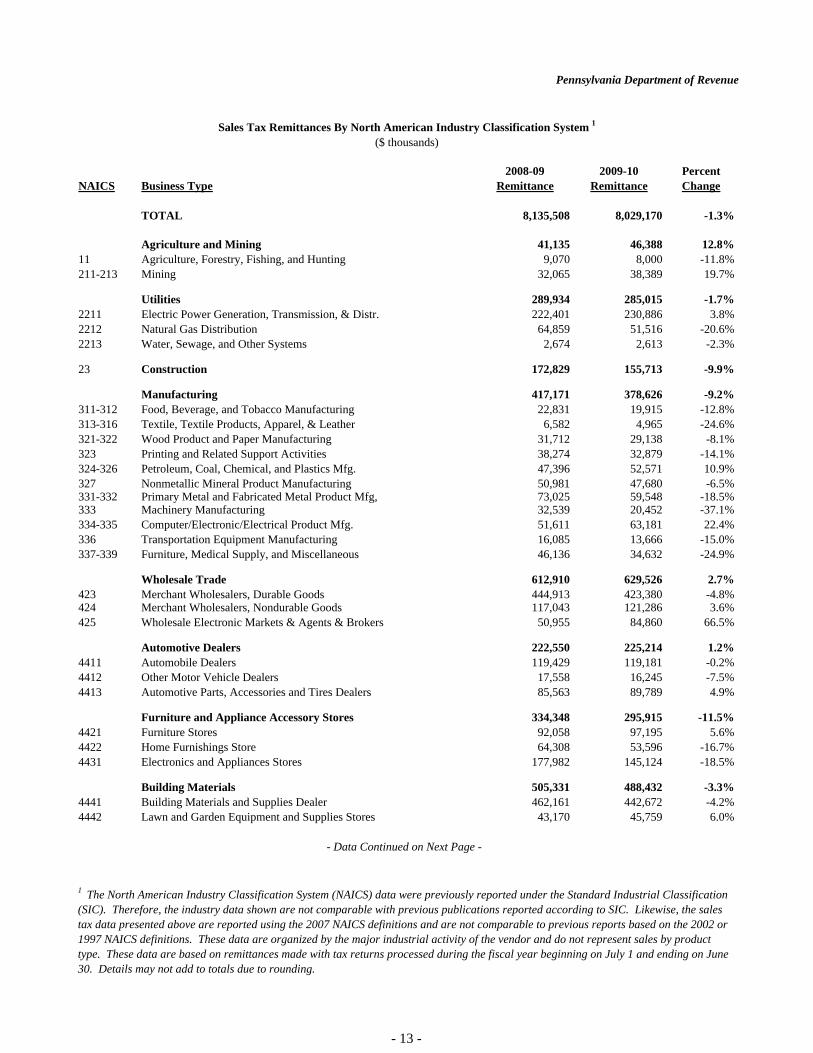
TOTAL 8,135,508 8,029,170 -1.3%
Agriculture and Mining 41,135 46,388 12.8%11 Agriculture, Forestry, Fishing, and Hunting 9,070 8,000 -11.8%211-213 Mining 32,065 38,389 19.7%
Utilities 289,934 285,015 -1.7%2211 Electric Power Generation, Transmission, & Distr. 222,401 230,886 3.8%2212 Natural Gas Distribution 64,859 51,516 -20.6%2213 Water, Sewage, and Other Systems 2,674 2,613 -2.3%
23 Construction 172,829 155,713 -9.9%
Manufacturing 417,171 378,626 -9.2%311-312 Food, Beverage, and Tobacco Manufacturing 22,831 19,915 -12.8%313-316 Textile, Textile Products, Apparel, & Leather 6,582 4,965 -24.6%321-322 Wood Product and Paper Manufacturing 31,712 29,138 -8.1%323 Printing and Related Support Activities 38,274 32,879 -14.1%324-326 Petroleum, Coal, Chemical, and Plastics Mfg. 47,396 52,571 10.9%327 Nonmetallic Mineral Product Manufacturing 50,981 47,680 -6.5%331-332 Primary Metal and Fabricated Metal Product Mfg, 73,025 59,548 -18.5%333 Machinery Manufacturing 32,539 20,452 -37.1%334-335 Computer/Electronic/Electrical Product Mfg. 51,611 63,181 22.4%336 Transportation Equipment Manufacturing 16,085 13,666 -15.0%337-339 Furniture, Medical Supply, and Miscellaneous 46,136 34,632 -24.9%
Wholesale Trade 612,910 629,526 2.7%423 Merchant Wholesalers, Durable Goods 444,913 423,380 -4.8%424 Merchant Wholesalers, Nondurable Goods 117,043 121,286 3.6%425 Wholesale Electronic Markets & Agents & Brokers 50,955 84,860 66.5%
Automotive Dealers 222,550 225,214 1.2%4411 Automobile Dealers 119,429 119,181 -0.2%4412 Other Motor Vehicle Dealers 17,558 16,245 -7.5%4413 Automotive Parts, Accessories and Tires Dealers 85,563 89,789 4.9%
Furniture and Appliance Accessory Stores 334,348 295,915 -11.5%4421 Furniture Stores 92,058 97,195 5.6%4422 Home Furnishings Store 64,308 53,596 -16.7%4431 Electronics and Appliances Stores 177,982 145,124 -18.5%
Building Materials 505,331 488,432 -3.3%4441 Building Materials and Supplies Dealer 462,161 442,672 -4.2%4442 Lawn and Garden Equipment and Supplies Stores 43,170 45,759 6.0%
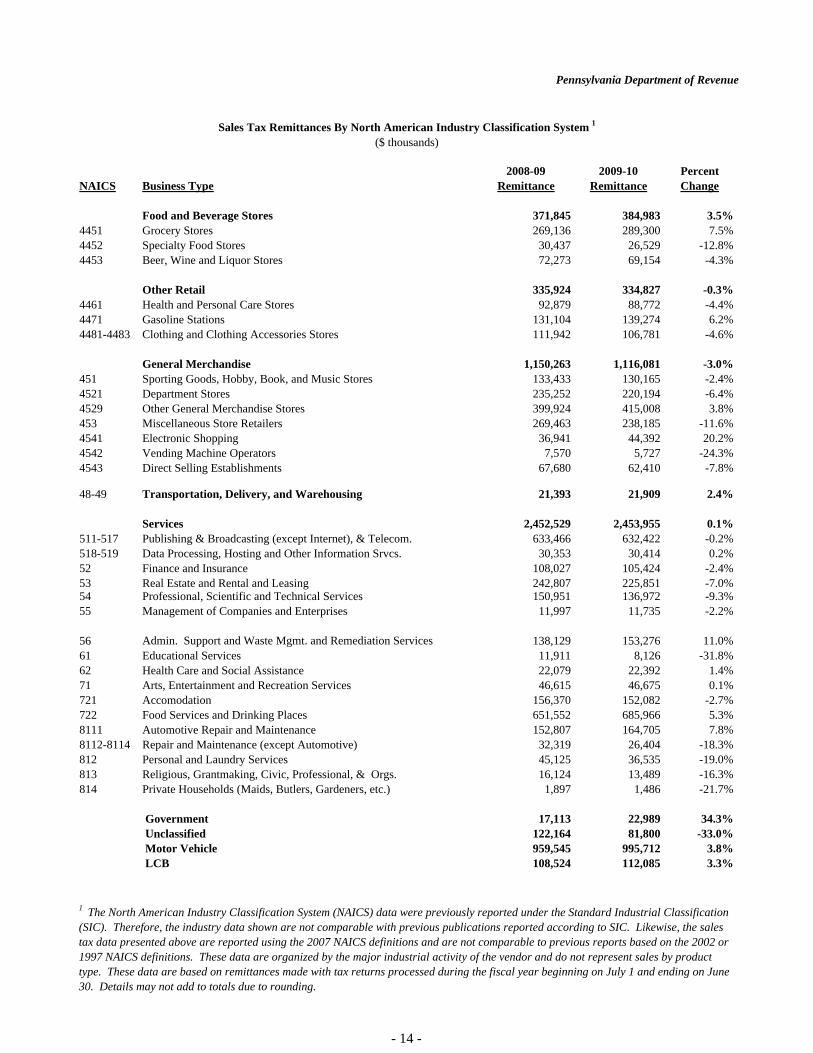
Sales Tax Remittances By North American Industry Classification System 1
($ thousands)
- Data Continued on Next Page -
1 The North American Industry Classification System (NAICS) data were previously reported under the Standard Industrial Classification (SIC). Therefore, the industry data shown are not comparable with previous publications reported according to SIC. Likewise, the sales tax data presented above are reported using the 2007 NAICS definitions and are not comparable to previous reports based on the 2002 or 1997 NAICS definitions. These data are organized by the major industrial activity of the vendor and do not represent sales by product type. These data are based on remittances made with tax returns processed during the fiscal year beginning on July 1 and ending on June 30. Details may not add to totals due to rounding.
- 13 -
Pennsylvania Department of Revenue
2008-09 2009-10 PercentNAICS Business Type Remittance Remittance Change
Food and Beverage Stores 371,845 384,983 3.5%4451 Grocery Stores 269,136 289,300 7.5%4452 Specialty Food Stores 30,437 26,529 -12.8%4453 Beer, Wine and Liquor Stores 72,273 69,154 -4.3%
Other Retail 335,924 334,827 -0.3%4461 Health and Personal Care Stores 92,879 88,772 -4.4%4471 Gasoline Stations 131,104 139,274 6.2%4481-4483 Clothing and Clothing Accessories Stores 111,942 106,781 -4.6%
General Merchandise 1,150,263 1,116,081 -3.0%451 Sporting Goods, Hobby, Book, and Music Stores 133,433 130,165 -2.4%4521 Department Stores 235,252 220,194 -6.4%4529 Other General Merchandise Stores 399,924 415,008 3.8%453 Miscellaneous Store Retailers 269,463 238,185 -11.6%4541 Electronic Shopping 36,941 44,392 20.2%4542 Vending Machine Operators 7,570 5,727 -24.3%4543 Direct Selling Establishments 67,680 62,410 -7.8%
48-49 Transportation, Delivery, and Warehousing 21,393 21,909 2.4%
Services 2,452,529 2,453,955 0.1%511-517 Publishing & Broadcasting (except Internet), & Telecom. 633,466 632,422 -0.2%518-519 Data Processing, Hosting and Other Information Srvcs. 30,353 30,414 0.2%52 Finance and Insurance 108,027 105,424 -2.4%53 Real Estate and Rental and Leasing 242,807 225,851 -7.0%54 Professional, Scientific and Technical Services 150,951 136,972 -9.3%55 Management of Companies and Enterprises 11,997 11,735 -2.2%
56 Admin. Support and Waste Mgmt. and Remediation Services 138,129 153,276 11.0%61 Educational Services 11,911 8,126 -31.8%62 Health Care and Social Assistance 22,079 22,392 1.4%71 Arts, Entertainment and Recreation Services 46,615 46,675 0.1%721 Accomodation 156,370 152,082 -2.7%722 Food Services and Drinking Places 651,552 685,966 5.3%8111 Automotive Repair and Maintenance 152,807 164,705 7.8%8112-8114 Repair and Maintenance (except Automotive) 32,319 26,404 -18.3%812 Personal and Laundry Services 45,125 36,535 -19.0%813 Religious, Grantmaking, Civic, Professional, & Orgs. 16,124 13,489 -16.3%814 Private Households (Maids, Butlers, Gardeners, etc.) 1,897 1,486 -21.7%
Government 17,113 22,989 34.3% Unclassified 122,164 81,800 -33.0% Motor Vehicle 959,545 995,712 3.8% LCB 108,524 112,085 3.3%
Sales Tax Remittances By North American Industry Classification System 1
($ thousands)
1 The North American Industry Classification System (NAICS) data were previously reported under the Standard Industrial Classification (SIC). Therefore, the industry data shown are not comparable with previous publications reported according to SIC. Likewise, the sales tax data presented above are reported using the 2007 NAICS definitions and are not comparable to previous reports based on the 2002 or 1997 NAICS definitions. These data are organized by the major industrial activity of the vendor and do not represent sales by product type. These data are based on remittances made with tax returns processed during the fiscal year beginning on July 1 and ending on June 30. Details may not add to totals due to rounding.
- 14 -
Pennsylvania Department of Revenue
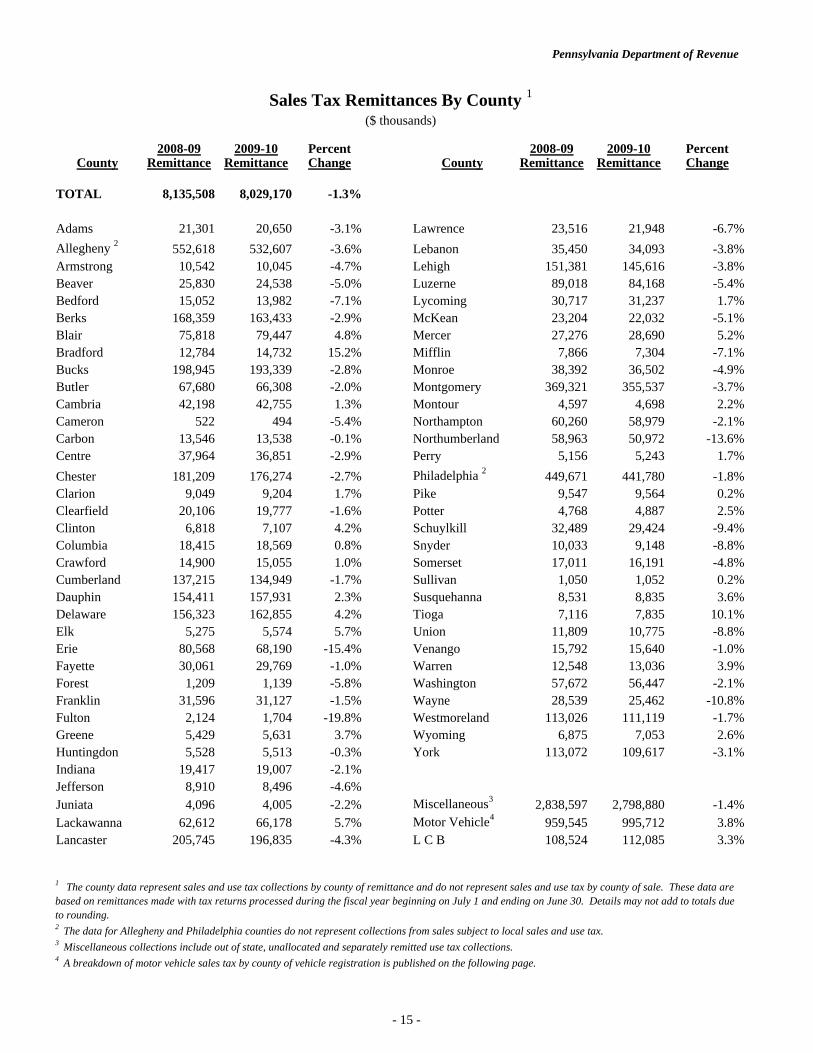
Sales Tax Remittances By County 1
($ thousands)
2008-09 2009-10 Percent 2008-09 2009-10 PercentCounty Remittance Remittance Change County Remittance Remittance Change
TOTAL 8,135,508 8,029,170 -1.3% Adams 21,301 20,650 -3.1% Lawrence 23,516 21,948 -6.7%Allegheny 2 552,618 532,607 -3.6% Lebanon 35,450 34,093 -3.8%Armstrong 10,542 10,045 -4.7% Lehigh 151,381 145,616 -3.8%Beaver 25,830 24,538 -5.0% Luzerne 89,018 84,168 -5.4%Bedford 15,052 13,982 -7.1% Lycoming 30,717 31,237 1.7%Berks 168,359 163,433 -2.9% McKean 23,204 22,032 -5.1%Blair 75,818 79,447 4.8% Mercer 27,276 28,690 5.2%Bradford 12,784 14,732 15.2% Mifflin 7,866 7,304 -7.1%Bucks 198,945 193,339 -2.8% Monroe 38,392 36,502 -4.9%Butler 67,680 66,308 -2.0% Montgomery 369,321 355,537 -3.7%Cambria 42,198 42,755 1.3% Montour 4,597 4,698 2.2%Cameron 522 494 -5.4% Northampton 60,260 58,979 -2.1%Carbon 13,546 13,538 -0.1% Northumberland 58,963 50,972 -13.6%Centre 37,964 36,851 -2.9% Perry 5,156 5,243 1.7%Chester 181,209 176,274 -2.7% Philadelphia 2 449,671 441,780 -1.8%Clarion 9,049 9,204 1.7% Pike 9,547 9,564 0.2%Clearfield 20,106 19,777 -1.6% Potter 4,768 4,887 2.5%Clinton 6,818 7,107 4.2% Schuylkill 32,489 29,424 -9.4%Columbia 18,415 18,569 0.8% Snyder 10,033 9,148 -8.8%Crawford 14,900 15,055 1.0% Somerset 17,011 16,191 -4.8%Cumberland 137,215 134,949 -1.7% Sullivan 1,050 1,052 0.2%Dauphin 154,411 157,931 2.3% Susquehanna 8,531 8,835 3.6%Delaware 156,323 162,855 4.2% Tioga 7,116 7,835 10.1%Elk 5,275 5,574 5.7% Union 11,809 10,775 -8.8%Erie 80,568 68,190 -15.4% Venango 15,792 15,640 -1.0%Fayette 30,061 29,769 -1.0% Warren 12,548 13,036 3.9%Forest 1,209 1,139 -5.8% Washington 57,672 56,447 -2.1%Franklin 31,596 31,127 -1.5% Wayne 28,539 25,462 -10.8%Fulton 2,124 1,704 -19.8% Westmoreland 113,026 111,119 -1.7%Greene 5,429 5,631 3.7% Wyoming 6,875 7,053 2.6%Huntingdon 5,528 5,513 -0.3% York 113,072 109,617 -3.1%Indiana 19,417 19,007 -2.1%Jefferson 8,910 8,496 -4.6%Juniata 4,096 4,005 -2.2% Miscellaneous3 2,838,597 2,798,880 -1.4%Lackawanna 62,612 66,178 5.7% Motor Vehicle4 959,545 995,712 3.8%Lancaster 205,745 196,835 -4.3% L C B 108,524 112,085 3.3%
1 The county data represent sales and use tax collections by county of remittance and do not represent sales and use tax by county of sale. These data are based on remittances made with tax returns processed during the fiscal year beginning on July 1 and ending on June 30. Details may not add to totals due to rounding.2 The data for Allegheny and Philadelphia counties do not represent collections from sales subject to local sales and use tax.3 Miscellaneous collections include out of state, unallocated and separately remitted use tax collections.4 A breakdown of motor vehicle sales tax by county of vehicle registration is published on the following page.
- 15 -
Pennsylvania Department of Revenue
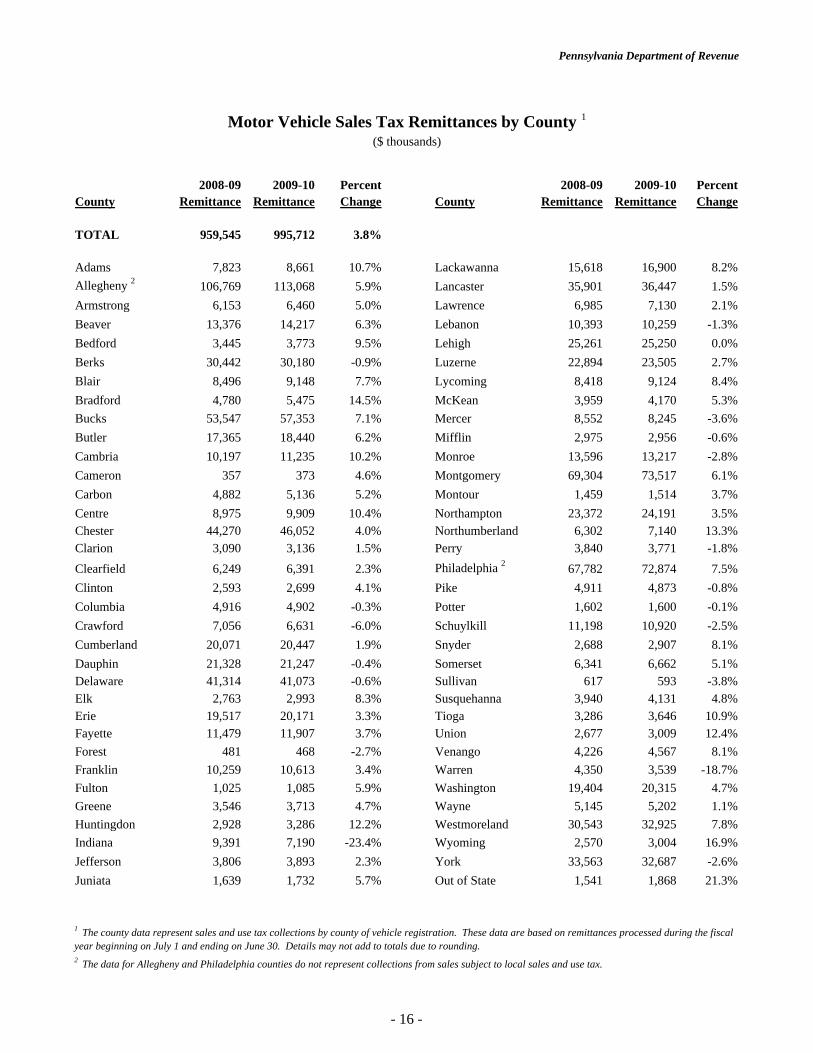
Motor Vehicle Sales Tax Remittances by County 1
($ thousands)
2008-09 2009-10 Percent 2008-09 2009-10 PercentCounty Remittance Remittance Change County Remittance Remittance Change
TOTAL 959,545 995,712 3.8% Adams 7,823 8,661 10.7% Lackawanna 15,618 16,900 8.2%Allegheny 2 106,769 113,068 5.9% Lancaster 35,901 36,447 1.5%Armstrong 6,153 6,460 5.0% Lawrence 6,985 7,130 2.1%Beaver 13,376 14,217 6.3% Lebanon 10,393 10,259 -1.3%Bedford 3,445 3,773 9.5% Lehigh 25,261 25,250 0.0%Berks 30,442 30,180 -0.9% Luzerne 22,894 23,505 2.7%Blair 8,496 9,148 7.7% Lycoming 8,418 9,124 8.4%Bradford 4,780 5,475 14.5% McKean 3,959 4,170 5.3%Bucks 53,547 57,353 7.1% Mercer 8,552 8,245 -3.6%Butler 17,365 18,440 6.2% Mifflin 2,975 2,956 -0.6%Cambria 10,197 11,235 10.2% Monroe 13,596 13,217 -2.8%Cameron 357 373 4.6% Montgomery 69,304 73,517 6.1%Carbon 4,882 5,136 5.2% Montour 1,459 1,514 3.7%Centre 8,975 9,909 10.4% Northampton 23,372 24,191 3.5%Chester 44,270 46,052 4.0% Northumberland 6,302 7,140 13.3%Clarion 3,090 3,136 1.5% Perry 3,840 3,771 -1.8%Clearfield 6,249 6,391 2.3% Philadelphia 2 67,782 72,874 7.5%Clinton 2,593 2,699 4.1% Pike 4,911 4,873 -0.8%Columbia 4,916 4,902 -0.3% Potter 1,602 1,600 -0.1%Crawford 7,056 6,631 -6.0% Schuylkill 11,198 10,920 -2.5%Cumberland 20,071 20,447 1.9% Snyder 2,688 2,907 8.1%Dauphin 21,328 21,247 -0.4% Somerset 6,341 6,662 5.1%Delaware 41,314 41,073 -0.6% Sullivan 617 593 -3.8%Elk 2,763 2,993 8.3% Susquehanna 3,940 4,131 4.8%Erie 19,517 20,171 3.3% Tioga 3,286 3,646 10.9%Fayette 11,479 11,907 3.7% Union 2,677 3,009 12.4%Forest 481 468 -2.7% Venango 4,226 4,567 8.1%Franklin 10,259 10,613 3.4% Warren 4,350 3,539 -18.7%Fulton 1,025 1,085 5.9% Washington 19,404 20,315 4.7%Greene 3,546 3,713 4.7% Wayne 5,145 5,202 1.1%Huntingdon 2,928 3,286 12.2% Westmoreland 30,543 32,925 7.8%Indiana 9,391 7,190 -23.4% Wyoming 2,570 3,004 16.9%Jefferson 3,806 3,893 2.3% York 33,563 32,687 -2.6%Juniata 1,639 1,732 5.7% Out of State 1,541 1,868 21.3%
2 The data for Allegheny and Philadelphia counties do not represent collections from sales subject to local sales and use tax.
1 The county data represent sales and use tax collections by county of vehicle registration. These data are based on remittances processed during the fiscal year beginning on July 1 and ending on June 30. Details may not add to totals due to rounding.
- 16 -
Pennsylvania Department of Revenue
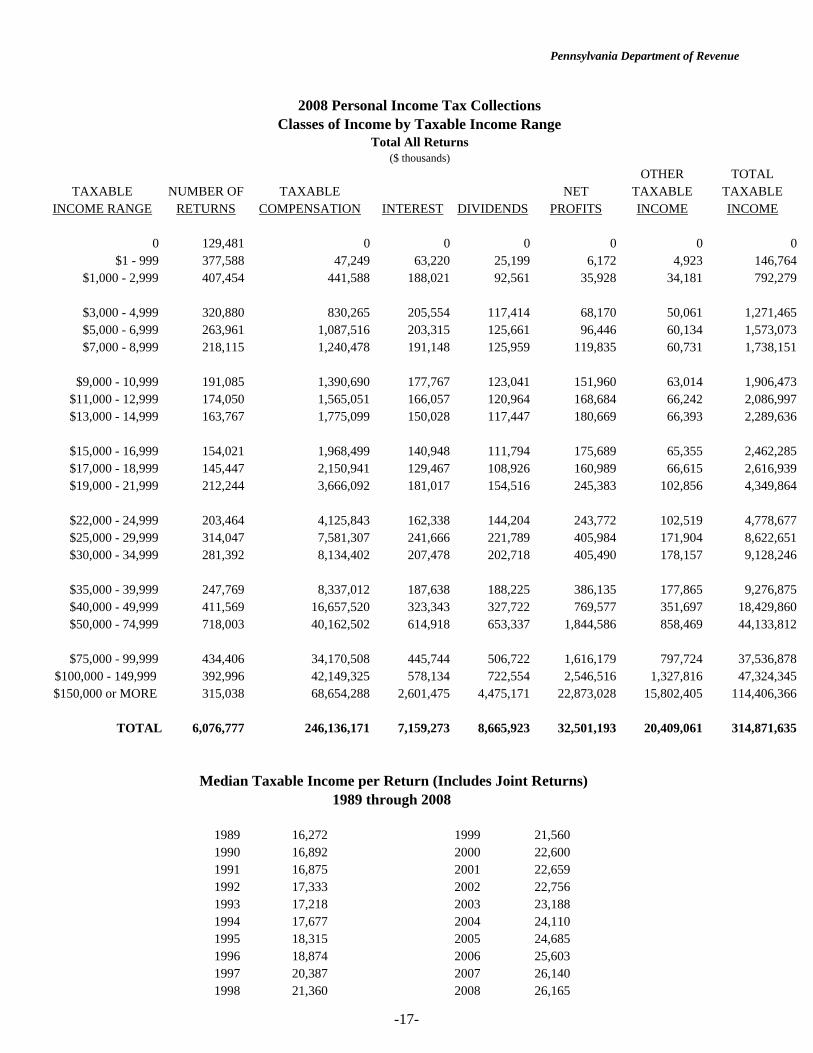
($ thousands)OTHER TOTAL
TAXABLE NUMBER OF TAXABLE NET TAXABLE TAXABLEINCOME RANGE RETURNS COMPENSATION INTEREST DIVIDENDS PROFITS INCOME INCOME
0 129,481 0 0 0 0 0 0$1 - 999 377,588 47,249 63,220 25,199 6,172 4,923 146,764
$1,000 - 2,999 407,454 441,588 188,021 92,561 35,928 34,181 792,279
$3,000 - 4,999 320,880 830,265 205,554 117,414 68,170 50,061 1,271,465$5,000 - 6,999 263,961 1,087,516 203,315 125,661 96,446 60,134 1,573,073$7,000 - 8,999 218,115 1,240,478 191,148 125,959 119,835 60,731 1,738,151
$9,000 - 10,999 191,085 1,390,690 177,767 123,041 151,960 63,014 1,906,473$11,000 - 12,999 174,050 1,565,051 166,057 120,964 168,684 66,242 2,086,997$13,000 - 14,999 163,767 1,775,099 150,028 117,447 180,669 66,393 2,289,636
$15,000 - 16,999 154,021 1,968,499 140,948 111,794 175,689 65,355 2,462,285$17,000 - 18,999 145,447 2,150,941 129,467 108,926 160,989 66,615 2,616,939$19,000 - 21,999 212,244 3,666,092 181,017 154,516 245,383 102,856 4,349,864
$22,000 - 24,999 203,464 4,125,843 162,338 144,204 243,772 102,519 4,778,677$25,000 - 29,999 314,047 7,581,307 241,666 221,789 405,984 171,904 8,622,651$30,000 - 34,999 281,392 8,134,402 207,478 202,718 405,490 178,157 9,128,246
$35,000 - 39,999 247,769 8,337,012 187,638 188,225 386,135 177,865 9,276,875$40,000 - 49,999 411,569 16,657,520 323,343 327,722 769,577 351,697 18,429,860$50,000 - 74,999 718,003 40,162,502 614,918 653,337 1,844,586 858,469 44,133,812
$75,000 - 99,999 434,406 34,170,508 445,744 506,722 1,616,179 797,724 37,536,878 $100,000 - 149,999 392,996 42,149,325 578,134 722,554 2,546,516 1,327,816 47,324,345 $150,000 or MORE 315,038 68,654,288 2,601,475 4,475,171 22,873,028 15,802,405 114,406,366
TOTAL 6,076,777 246,136,171 7,159,273 8,665,923 32,501,193 20,409,061 314,871,635
1989 16,272 1999 21,5601990 16,892 2000 22,6001991 16,875 2001 22,6591992 17,333 2002 22,7561993 17,218 2003 23,1881994 17,677 2004 24,1101995 18,315 2005 24,6851996 18,874 2006 25,6031997 20,387 2007 26,1401998 21,360 2008 26,165
Median Taxable Income per Return (Includes Joint Returns)1989 through 2008
2008 Personal Income Tax CollectionsClasses of Income by Taxable Income Range
Total All Returns
-17-
Pennsylvania Department of Revenue
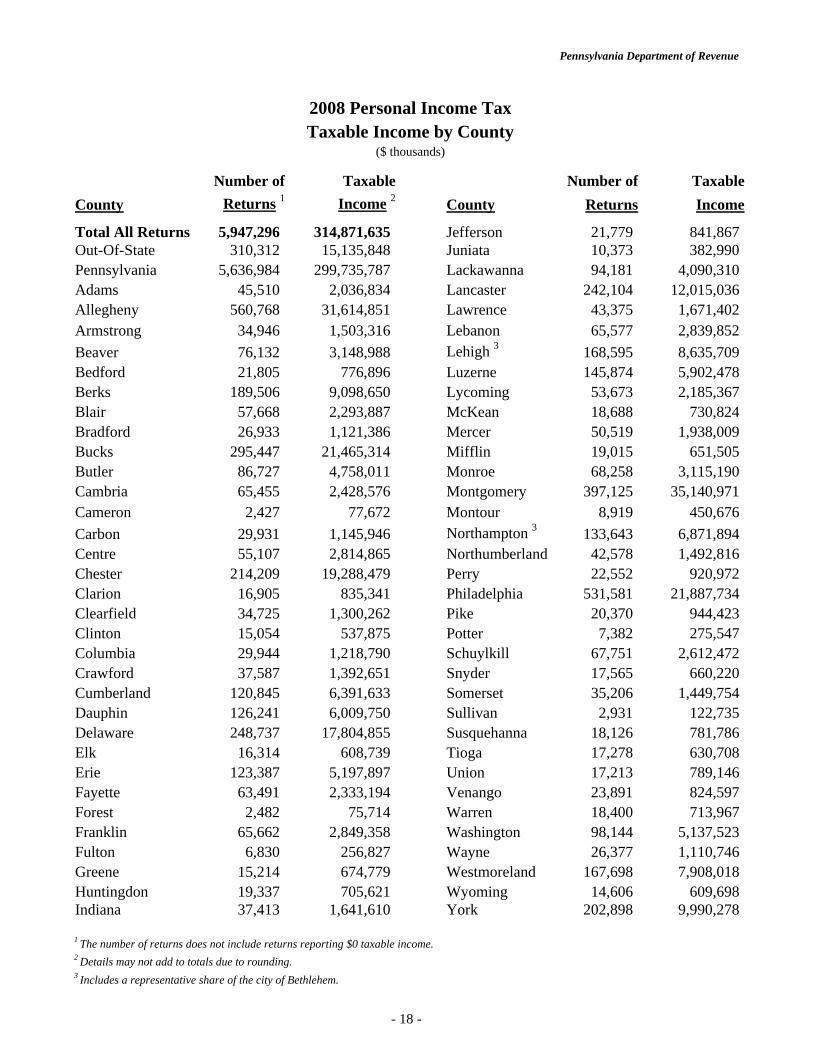
2008 Personal Income TaxTaxable Income by County
($ thousands)
Number of Taxable Number of TaxableCounty Returns 1 Income 2 County Returns Income
Total All Returns 5,947,296 314,871,635 Jefferson 21,779 841,867Out-Of-State 310,312 15,135,848 Juniata 10,373 382,990Pennsylvania 5,636,984 299,735,787 Lackawanna 94,181 4,090,310Adams 45,510 2,036,834 Lancaster 242,104 12,015,036Allegheny 560,768 31,614,851 Lawrence 43,375 1,671,402Armstrong 34,946 1,503,316 Lebanon 65,577 2,839,852Beaver 76,132 3,148,988 Lehigh 3 168,595 8,635,709Bedford 21,805 776,896 Luzerne 145,874 5,902,478Berks 189,506 9,098,650 Lycoming 53,673 2,185,367Blair 57,668 2,293,887 McKean 18,688 730,824Bradford 26,933 1,121,386 Mercer 50,519 1,938,009Bucks 295,447 21,465,314 Mifflin 19,015 651,505Butler 86,727 4,758,011 Monroe 68,258 3,115,190Cambria 65,455 2,428,576 Montgomery 397,125 35,140,971Cameron 2,427 77,672 Montour 8,919 450,676Carbon 29,931 1,145,946 Northampton 3 133,643 6,871,894Centre 55,107 2,814,865 Northumberland 42,578 1,492,816Chester 214,209 19,288,479 Perry 22,552 920,972Clarion 16,905 835,341 Philadelphia 531,581 21,887,734Clearfield 34,725 1,300,262 Pike 20,370 944,423Clinton 15,054 537,875 Potter 7,382 275,547Columbia 29,944 1,218,790 Schuylkill 67,751 2,612,472Crawford 37,587 1,392,651 Snyder 17,565 660,220Cumberland 120,845 6,391,633 Somerset 35,206 1,449,754Dauphin 126,241 6,009,750 Sullivan 2,931 122,735Delaware 248,737 17,804,855 Susquehanna 18,126 781,786Elk 16,314 608,739 Tioga 17,278 630,708Erie 123,387 5,197,897 Union 17,213 789,146Fayette 63,491 2,333,194 Venango 23,891 824,597Forest 2,482 75,714 Warren 18,400 713,967Franklin 65,662 2,849,358 Washington 98,144 5,137,523Fulton 6,830 256,827 Wayne 26,377 1,110,746Greene 15,214 674,779 Westmoreland 167,698 7,908,018Huntingdon 19,337 705,621 Wyoming 14,606 609,698Indiana 37,413 1,641,610 York 202,898 9,990,278
1 The number of returns does not include returns reporting $0 taxable income. 2 Details may not add to totals due to rounding.3 Includes a representative share of the city of Bethlehem.
- 18 -

Pennsylvania Department of Revenue
($ thousands)
2008-09 2009-10 2008-09 2009-10County Remittance Remittance Growth County Remittance Remittance Growth
Total 767,581 745,558 -2.9% Juniata 865 1,066 23.3%Lackawanna 13,580 15,574 14.7%
Adams 4,478 4,698 4.9% Lancaster 29,809 30,558 2.5%Allegheny 91,578 87,651 -4.3% Lawrence 3,429 3,135 -8.6%Armstrong 3,846 4,711 22.5% Lebanon 6,840 6,477 -5.3%Beaver 9,595 7,643 -20.3% Lehigh 17,640 21,138 19.8%Bedford 1,433 1,975 37.8% Luzerne 18,198 18,757 3.1%Berks 24,238 23,504 -3.0% Lycoming 4,838 6,264 29.5%Blair 5,374 6,304 17.3% McKean 2,596 1,375 -47.0%Bradford 2,556 1,856 -27.4% Mercer 5,565 5,477 -1.6%Bucks 41,297 38,473 -6.8% Mifflin 1,700 1,306 -23.2%Butler 10,538 9,223 -12.5% Monroe 6,417 5,069 -21.0%Cambria 6,977 7,156 2.6% Montgomery 88,302 85,117 -3.6%Cameron 165 254 54.0% Montour 983 1,112 13.1%Carbon 3,408 3,405 -0.1% Northampton 18,193 18,257 0.4%Centre 5,738 10,189 77.6% Northumberland 5,568 4,673 -16.1%Chester 40,745 38,110 -6.5% Perry 1,740 1,803 3.6%Clarion 1,399 1,480 5.8% Philadelphia 73,514 59,449 -19.1%Clearfield 4,121 3,081 -25.2% Pike 2,856 1,995 -30.1%Clinton 1,733 1,938 11.8% Potter 492 610 24.1%Columbia 3,441 2,790 -18.9% Schuylkill 6,969 7,453 6.9%Crawford 3,636 2,961 -18.5% Snyder 1,137 1,013 -10.9%Cumberland 14,097 15,749 11.7% Somerset 3,119 2,761 -11.5%Dauphin 11,306 11,947 5.7% Sullivan 408 507 24.2%Delaware 52,018 51,566 -0.9% Susquehanna 2,098 2,035 -3.0%Elk 1,935 1,518 -21.6% Tioga 1,199 1,668 39.1%Erie 15,146 10,363 -31.6% Union 2,365 1,678 -29.0%Fayette 5,864 6,458 10.1% Venango 2,623 3,016 15.0%Forest 58 301 420.5% Warren 1,635 2,959 81.0%Franklin 8,406 6,500 -22.7% Washington 11,184 11,691 4.5%Fulton 826 870 5.3% Wayne 2,310 3,631 57.2%Greene 1,224 1,190 -2.8% Westmoreland 18,898 19,941 5.5%Huntingdon 1,079 854 -20.9% Wyoming 916 1,304 42.4%Indiana 3,657 3,970 8.6% York 19,460 19,460 0.0%Jefferson 2,487 2,035 -18.2% Unclassified 2 5,737 6,506 13.4%
1 These data are not directly comparable to Treasury deposits. These data are based on remittances made by the Register of Wills for each county and processed during the fiscal year beginning on July 1 and ending on June 30.
Inheritance and Estate Tax Collections by County 1
2 The unclassified category includes out of state and unidentified Inheritance and Estate Tax collections.
- 19 -
Pennsylvania Department of Revenue
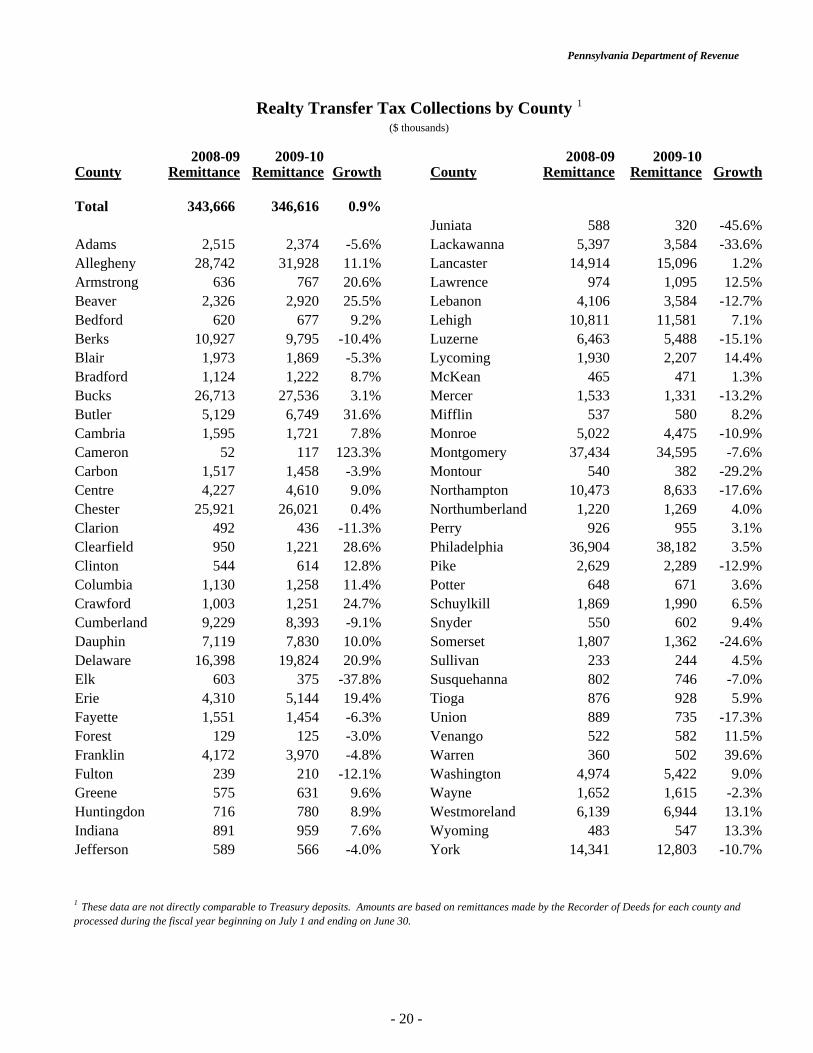
2008-09 2009-10 2008-09 2009-10County Remittance Remittance Growth County Remittance Remittance Growth
Total 343,666 346,616 0.9%Juniata 588 320 -45.6%
Adams 2,515 2,374 -5.6% Lackawanna 5,397 3,584 -33.6%Allegheny 28,742 31,928 11.1% Lancaster 14,914 15,096 1.2%Armstrong 636 767 20.6% Lawrence 974 1,095 12.5%Beaver 2,326 2,920 25.5% Lebanon 4,106 3,584 -12.7%Bedford 620 677 9.2% Lehigh 10,811 11,581 7.1%Berks 10,927 9,795 -10.4% Luzerne 6,463 5,488 -15.1%Blair 1,973 1,869 -5.3% Lycoming 1,930 2,207 14.4%Bradford 1,124 1,222 8.7% McKean 465 471 1.3%Bucks 26,713 27,536 3.1% Mercer 1,533 1,331 -13.2%Butler 5,129 6,749 31.6% Mifflin 537 580 8.2%Cambria 1,595 1,721 7.8% Monroe 5,022 4,475 -10.9%Cameron 52 117 123.3% Montgomery 37,434 34,595 -7.6%Carbon 1,517 1,458 -3.9% Montour 540 382 -29.2%Centre 4,227 4,610 9.0% Northampton 10,473 8,633 -17.6%Chester 25,921 26,021 0.4% Northumberland 1,220 1,269 4.0%Clarion 492 436 -11.3% Perry 926 955 3.1%Clearfield 950 1,221 28.6% Philadelphia 36,904 38,182 3.5%Clinton 544 614 12.8% Pike 2,629 2,289 -12.9%Columbia 1,130 1,258 11.4% Potter 648 671 3.6%Crawford 1,003 1,251 24.7% Schuylkill 1,869 1,990 6.5%Cumberland 9,229 8,393 -9.1% Snyder 550 602 9.4%Dauphin 7,119 7,830 10.0% Somerset 1,807 1,362 -24.6%Delaware 16,398 19,824 20.9% Sullivan 233 244 4.5%Elk 603 375 -37.8% Susquehanna 802 746 -7.0%Erie 4,310 5,144 19.4% Tioga 876 928 5.9%Fayette 1,551 1,454 -6.3% Union 889 735 -17.3%Forest 129 125 -3.0% Venango 522 582 11.5%Franklin 4,172 3,970 -4.8% Warren 360 502 39.6%Fulton 239 210 -12.1% Washington 4,974 5,422 9.0%Greene 575 631 9.6% Wayne 1,652 1,615 -2.3%Huntingdon 716 780 8.9% Westmoreland 6,139 6,944 13.1%Indiana 891 959 7.6% Wyoming 483 547 13.3%Jefferson 589 566 -4.0% York 14,341 12,803 -10.7%
1 These data are not directly comparable to Treasury deposits. Amounts are based on remittances made by the Recorder of Deeds for each county and processed during the fiscal year beginning on July 1 and ending on June 30.
Realty Transfer Tax Collections by County 1
($ thousands)
- 20 -
Pennsylvania Department of Revenue
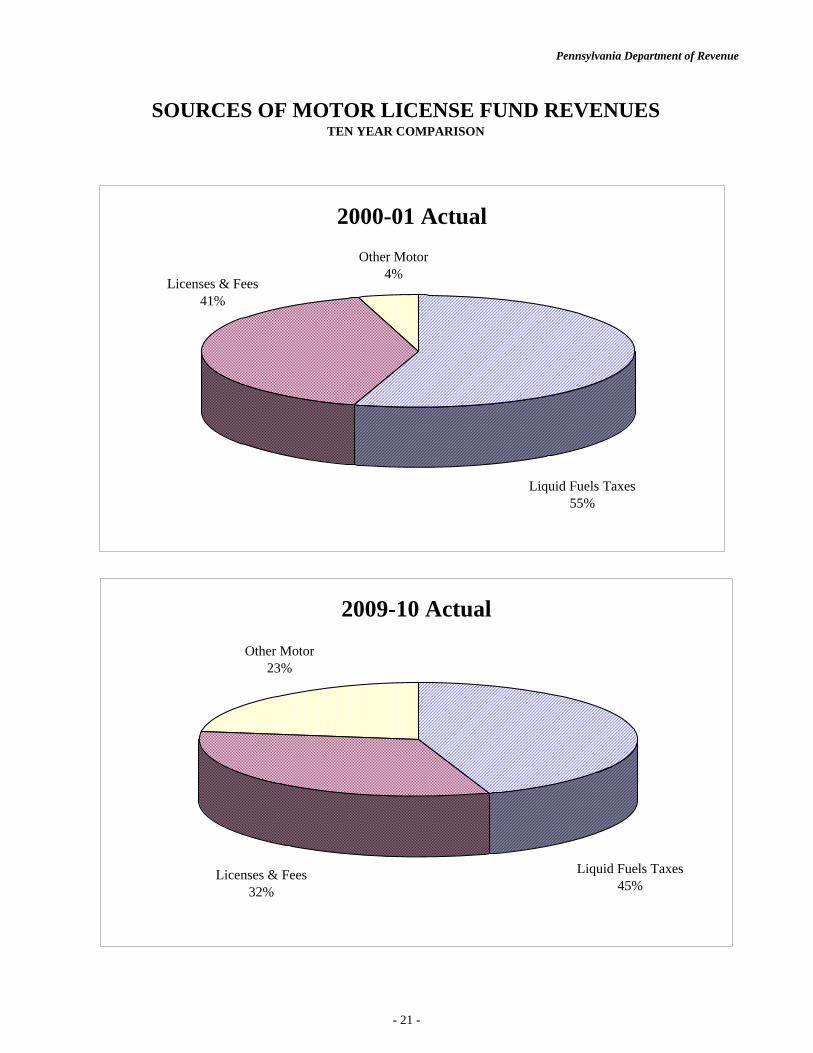
SOURCES OF MOTOR LICENSE FUND REVENUESTEN YEAR COMPARISON
2000-01 ActualOther Motor
4%
Liquid Fuels Taxes55%
Licenses & Fees41%
2009-10 ActualOther Motor
23%
Licenses & Fees32%
Liquid Fuels Taxes45%
- 21 -
Pennsylvania Department of Revenue
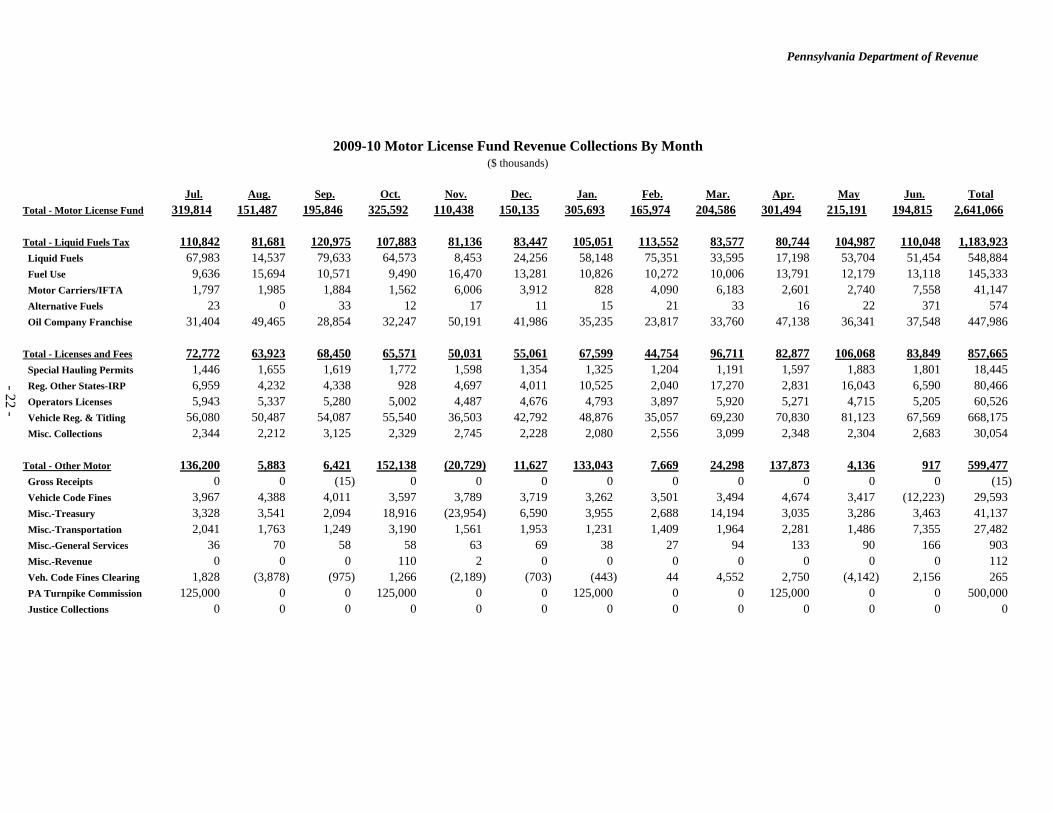
2009-10 Motor License Fund Revenue Collections By Month($ thousands)
Jul. Aug. Sep. Oct. Nov. Dec. Jan. Feb. Mar. Apr. May Jun. TotalTotal - Motor License Fund 319,814 151,487 195,846 325,592 110,438 150,135 305,693 165,974 204,586 301,494 215,191 194,815 2,641,066
Total - Liquid Fuels Tax 110,842 81,681 120,975 107,883 81,136 83,447 105,051 113,552 83,577 80,744 104,987 110,048 1,183,923 Liquid Fuels 67,983 14,537 79,633 64,573 8,453 24,256 58,148 75,351 33,595 17,198 53,704 51,454 548,884 Fuel Use 9,636 15,694 10,571 9,490 16,470 13,281 10,826 10,272 10,006 13,791 12,179 13,118 145,333 Motor Carriers/IFTA 1,797 1,985 1,884 1,562 6,006 3,912 828 4,090 6,183 2,601 2,740 7,558 41,147 Alternative Fuels 23 0 33 12 17 11 15 21 33 16 22 371 574 Oil Company Franchise 31,404 49,465 28,854 32,247 50,191 41,986 35,235 23,817 33,760 47,138 36,341 37,548 447,986
Total - Licenses and Fees 72,772 63,923 68,450 65,571 50,031 55,061 67,599 44,754 96,711 82,877 106,068 83,849 857,665 Special Hauling Permits 1,446 1,655 1,619 1,772 1,598 1,354 1,325 1,204 1,191 1,597 1,883 1,801 18,445 Reg. Other States-IRP 6,959 4,232 4,338 928 4,697 4,011 10,525 2,040 17,270 2,831 16,043 6,590 80,466 Operators Licenses 5,943 5,337 5,280 5,002 4,487 4,676 4,793 3,897 5,920 5,271 4,715 5,205 60,526 Vehicle Reg. & Titling 56,080 50,487 54,087 55,540 36,503 42,792 48,876 35,057 69,230 70,830 81,123 67,569 668,175 Misc. Collections 2,344 2,212 3,125 2,329 2,745 2,228 2,080 2,556 3,099 2,348 2,304 2,683 30,054
Total - Other Motor 136,200 5,883 6,421 152,138 (20,729) 11,627 133,043 7,669 24,298 137,873 4,136 917 599,477 Gross Receipts 0 0 (15) 0 0 0 0 0 0 0 0 0 (15) Vehicle Code Fines 3,967 4,388 4,011 3,597 3,789 3,719 3,262 3,501 3,494 4,674 3,417 (12,223) 29,593 Misc.-Treasury 3,328 3,541 2,094 18,916 (23,954) 6,590 3,955 2,688 14,194 3,035 3,286 3,463 41,137 Misc.-Transportation 2,041 1,763 1,249 3,190 1,561 1,953 1,231 1,409 1,964 2,281 1,486 7,355 27,482 Misc.-General Services 36 70 58 58 63 69 38 27 94 133 90 166 903 Misc.-Revenue 0 0 0 110 2 0 0 0 0 0 0 0 112 Veh. Code Fines Clearing 1,828 (3,878) (975) 1,266 (2,189) (703) (443) 44 4,552 2,750 (4,142) 2,156 265 PA Turnpike Commission 125,000 0 0 125,000 0 0 125,000 0 0 125,000 0 0 500,000 Justice Collections 0 0 0 0 0 0 0 0 0 0 0 0 0
- 22 -
Pennsylvania Department of Revenue
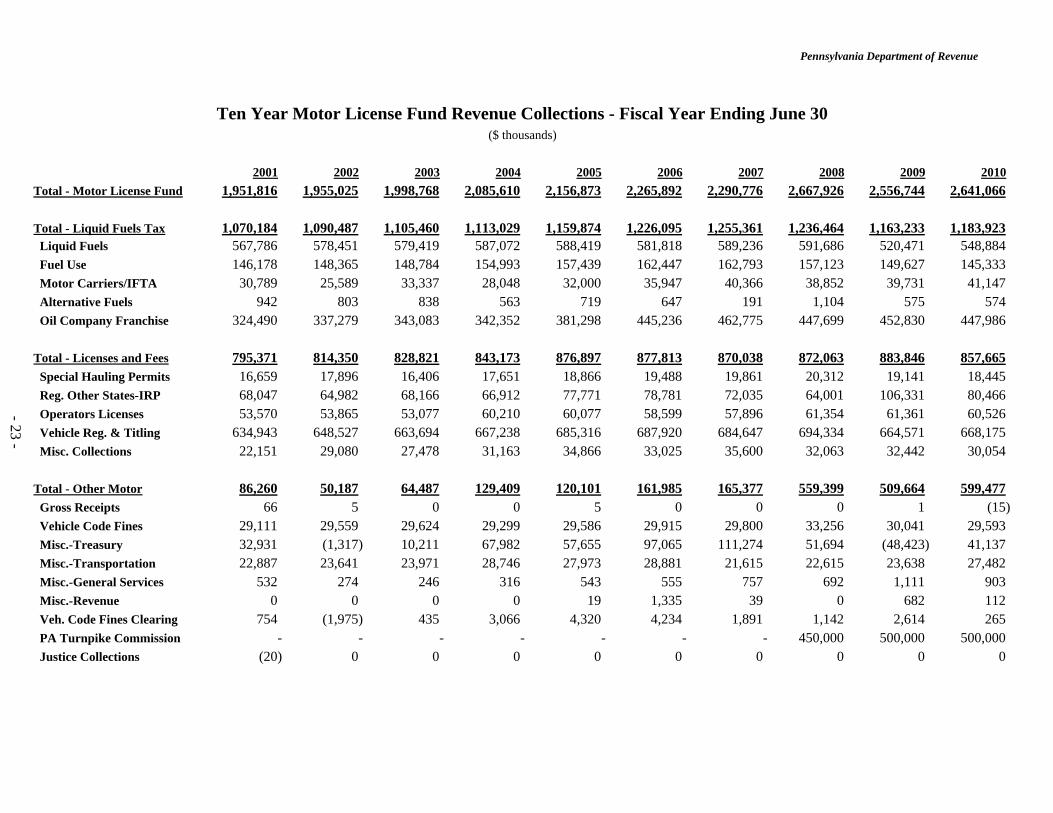
Ten Year Motor License Fund Revenue Collections - Fiscal Year Ending June 30($ thousands)
2001 2002 2003 2004 2005 2006 2007 2008 2009 2010Total - Motor License Fund 1,951,816 1,955,025 1,998,768 2,085,610 2,156,873 2,265,892 2,290,776 2,667,926 2,556,744 2,641,066
Total - Liquid Fuels Tax 1,070,184 1,090,487 1,105,460 1,113,029 1,159,874 1,226,095 1,255,361 1,236,464 1,163,233 1,183,923 Liquid Fuels 567,786 578,451 579,419 587,072 588,419 581,818 589,236 591,686 520,471 548,884 Fuel Use 146,178 148,365 148,784 154,993 157,439 162,447 162,793 157,123 149,627 145,333 Motor Carriers/IFTA 30,789 25,589 33,337 28,048 32,000 35,947 40,366 38,852 39,731 41,147 Alternative Fuels 942 803 838 563 719 647 191 1,104 575 574 Oil Company Franchise 324,490 337,279 343,083 342,352 381,298 445,236 462,775 447,699 452,830 447,986
Total - Licenses and Fees 795,371 814,350 828,821 843,173 876,897 877,813 870,038 872,063 883,846 857,665 Special Hauling Permits 16,659 17,896 16,406 17,651 18,866 19,488 19,861 20,312 19,141 18,445 Reg. Other States-IRP 68,047 64,982 68,166 66,912 77,771 78,781 72,035 64,001 106,331 80,466 Operators Licenses 53,570 53,865 53,077 60,210 60,077 58,599 57,896 61,354 61,361 60,526 Vehicle Reg. & Titling 634,943 648,527 663,694 667,238 685,316 687,920 684,647 694,334 664,571 668,175 Misc. Collections 22,151 29,080 27,478 31,163 34,866 33,025 35,600 32,063 32,442 30,054
Total - Other Motor 86,260 50,187 64,487 129,409 120,101 161,985 165,377 559,399 509,664 599,477 Gross Receipts 66 5 0 0 5 0 0 0 1 (15) Vehicle Code Fines 29,111 29,559 29,624 29,299 29,586 29,915 29,800 33,256 30,041 29,593 Misc.-Treasury 32,931 (1,317) 10,211 67,982 57,655 97,065 111,274 51,694 (48,423) 41,137 Misc.-Transportation 22,887 23,641 23,971 28,746 27,973 28,881 21,615 22,615 23,638 27,482 Misc.-General Services 532 274 246 316 543 555 757 692 1,111 903 Misc.-Revenue 0 0 0 0 19 1,335 39 0 682 112 Veh. Code Fines Clearing 754 (1,975) 435 3,066 4,320 4,234 1,891 1,142 2,614 265 PA Turnpike Commission - - - - - - - 450,000 500,000 500,000 Justice Collections (20) 0 0 0 0 0 0 0 0 0
- 23 -
Pennsylvania Department of Revenue
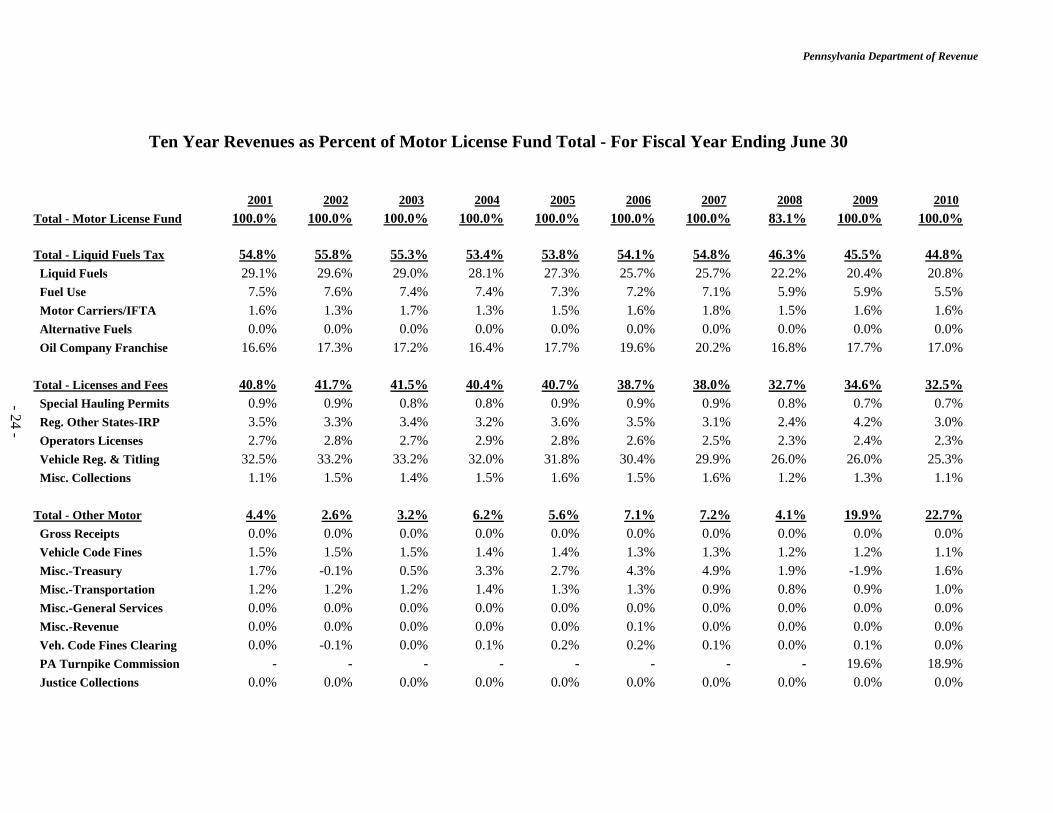
2001 2002 2003 2004 2005 2006 2007 2008 2009 2010Total - Motor License Fund 100.0% 100.0% 100.0% 100.0% 100.0% 100.0% 100.0% 83.1% 100.0% 100.0%
Total - Liquid Fuels Tax 54.8% 55.8% 55.3% 53.4% 53.8% 54.1% 54.8% 46.3% 45.5% 44.8% Liquid Fuels 29.1% 29.6% 29.0% 28.1% 27.3% 25.7% 25.7% 22.2% 20.4% 20.8% Fuel Use 7.5% 7.6% 7.4% 7.4% 7.3% 7.2% 7.1% 5.9% 5.9% 5.5% Motor Carriers/IFTA 1.6% 1.3% 1.7% 1.3% 1.5% 1.6% 1.8% 1.5% 1.6% 1.6% Alternative Fuels 0.0% 0.0% 0.0% 0.0% 0.0% 0.0% 0.0% 0.0% 0.0% 0.0% Oil Company Franchise 16.6% 17.3% 17.2% 16.4% 17.7% 19.6% 20.2% 16.8% 17.7% 17.0%
Total - Licenses and Fees 40.8% 41.7% 41.5% 40.4% 40.7% 38.7% 38.0% 32.7% 34.6% 32.5% Special Hauling Permits 0.9% 0.9% 0.8% 0.8% 0.9% 0.9% 0.9% 0.8% 0.7% 0.7% Reg. Other States-IRP 3.5% 3.3% 3.4% 3.2% 3.6% 3.5% 3.1% 2.4% 4.2% 3.0% Operators Licenses 2.7% 2.8% 2.7% 2.9% 2.8% 2.6% 2.5% 2.3% 2.4% 2.3% Vehicle Reg. & Titling 32.5% 33.2% 33.2% 32.0% 31.8% 30.4% 29.9% 26.0% 26.0% 25.3% Misc. Collections 1.1% 1.5% 1.4% 1.5% 1.6% 1.5% 1.6% 1.2% 1.3% 1.1%
Total - Other Motor 4.4% 2.6% 3.2% 6.2% 5.6% 7.1% 7.2% 4.1% 19.9% 22.7% Gross Receipts 0.0% 0.0% 0.0% 0.0% 0.0% 0.0% 0.0% 0.0% 0.0% 0.0% Vehicle Code Fines 1.5% 1.5% 1.5% 1.4% 1.4% 1.3% 1.3% 1.2% 1.2% 1.1% Misc.-Treasury 1.7% -0.1% 0.5% 3.3% 2.7% 4.3% 4.9% 1.9% -1.9% 1.6% Misc.-Transportation 1.2% 1.2% 1.2% 1.4% 1.3% 1.3% 0.9% 0.8% 0.9% 1.0% Misc.-General Services 0.0% 0.0% 0.0% 0.0% 0.0% 0.0% 0.0% 0.0% 0.0% 0.0% Misc.-Revenue 0.0% 0.0% 0.0% 0.0% 0.0% 0.1% 0.0% 0.0% 0.0% 0.0% Veh. Code Fines Clearing 0.0% -0.1% 0.0% 0.1% 0.2% 0.2% 0.1% 0.0% 0.1% 0.0% PA Turnpike Commission - - - - - - - - 19.6% 18.9% Justice Collections 0.0% 0.0% 0.0% 0.0% 0.0% 0.0% 0.0% 0.0% 0.0% 0.0%
Ten Year Revenues as Percent of Motor License Fund Total - For Fiscal Year Ending June 30
- 24 -
Pennsylvania Department of Revenue
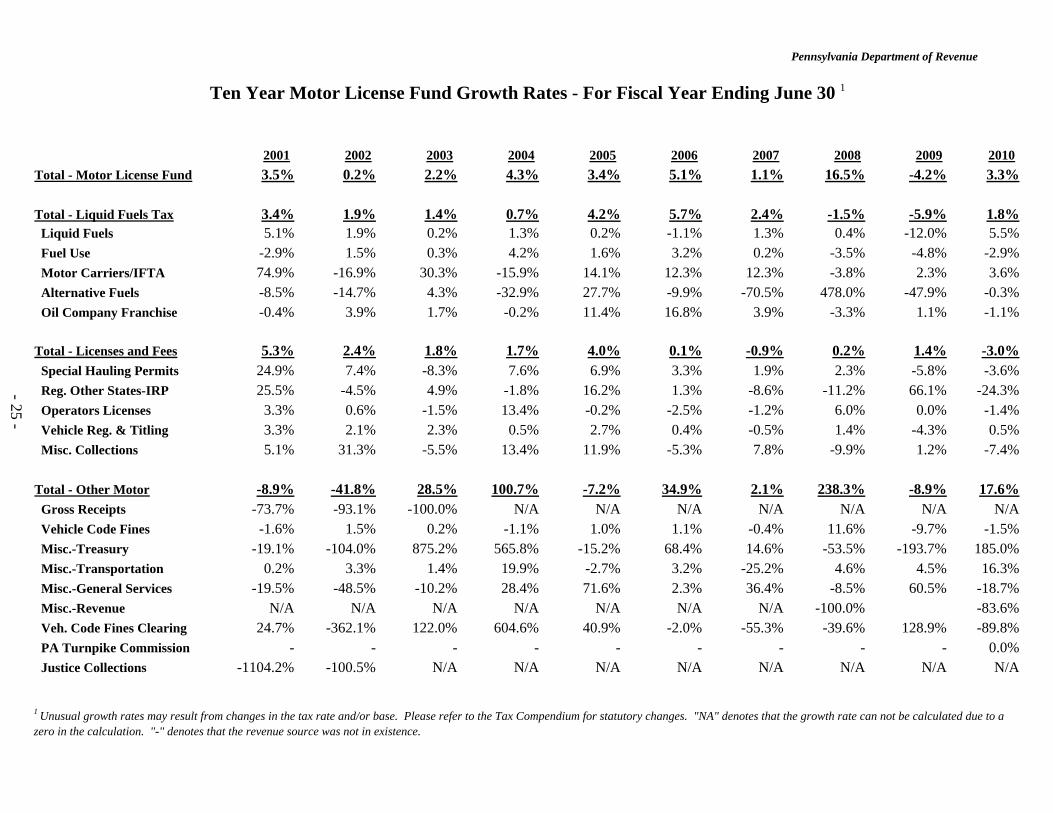
2001 2002 2003 2004 2005 2006 2007 2008 2009 2010Total - Motor License Fund 3.5% 0.2% 2.2% 4.3% 3.4% 5.1% 1.1% 16.5% -4.2% 3.3%
Total - Liquid Fuels Tax 3.4% 1.9% 1.4% 0.7% 4.2% 5.7% 2.4% -1.5% -5.9% 1.8% Liquid Fuels 5.1% 1.9% 0.2% 1.3% 0.2% -1.1% 1.3% 0.4% -12.0% 5.5% Fuel Use -2.9% 1.5% 0.3% 4.2% 1.6% 3.2% 0.2% -3.5% -4.8% -2.9% Motor Carriers/IFTA 74.9% -16.9% 30.3% -15.9% 14.1% 12.3% 12.3% -3.8% 2.3% 3.6% Alternative Fuels -8.5% -14.7% 4.3% -32.9% 27.7% -9.9% -70.5% 478.0% -47.9% -0.3% Oil Company Franchise -0.4% 3.9% 1.7% -0.2% 11.4% 16.8% 3.9% -3.3% 1.1% -1.1%
Total - Licenses and Fees 5.3% 2.4% 1.8% 1.7% 4.0% 0.1% -0.9% 0.2% 1.4% -3.0% Special Hauling Permits 24.9% 7.4% -8.3% 7.6% 6.9% 3.3% 1.9% 2.3% -5.8% -3.6% Reg. Other States-IRP 25.5% -4.5% 4.9% -1.8% 16.2% 1.3% -8.6% -11.2% 66.1% -24.3% Operators Licenses 3.3% 0.6% -1.5% 13.4% -0.2% -2.5% -1.2% 6.0% 0.0% -1.4% Vehicle Reg. & Titling 3.3% 2.1% 2.3% 0.5% 2.7% 0.4% -0.5% 1.4% -4.3% 0.5% Misc. Collections 5.1% 31.3% -5.5% 13.4% 11.9% -5.3% 7.8% -9.9% 1.2% -7.4%
Total - Other Motor -8.9% -41.8% 28.5% 100.7% -7.2% 34.9% 2.1% 238.3% -8.9% 17.6% Gross Receipts -73.7% -93.1% -100.0% N/A N/A N/A N/A N/A N/A N/A Vehicle Code Fines -1.6% 1.5% 0.2% -1.1% 1.0% 1.1% -0.4% 11.6% -9.7% -1.5% Misc.-Treasury -19.1% -104.0% 875.2% 565.8% -15.2% 68.4% 14.6% -53.5% -193.7% 185.0% Misc.-Transportation 0.2% 3.3% 1.4% 19.9% -2.7% 3.2% -25.2% 4.6% 4.5% 16.3% Misc.-General Services -19.5% -48.5% -10.2% 28.4% 71.6% 2.3% 36.4% -8.5% 60.5% -18.7% Misc.-Revenue N/A N/A N/A N/A N/A N/A N/A -100.0% -83.6% Veh. Code Fines Clearing 24.7% -362.1% 122.0% 604.6% 40.9% -2.0% -55.3% -39.6% 128.9% -89.8% PA Turnpike Commission - - - - - - - - - 0.0% Justice Collections -1104.2% -100.5% N/A N/A N/A N/A N/A N/A N/A N/A
Ten Year Motor License Fund Growth Rates - For Fiscal Year Ending June 30 1
1 Unusual growth rates may result from changes in the tax rate and/or base. Please refer to the Tax Compendium for statutory changes. "NA" denotes that the growth rate can not be calculated due to a zero in the calculation. "-" denotes that the revenue source was not in existence.
- 25 -
Pennsylvania Department of Revenue
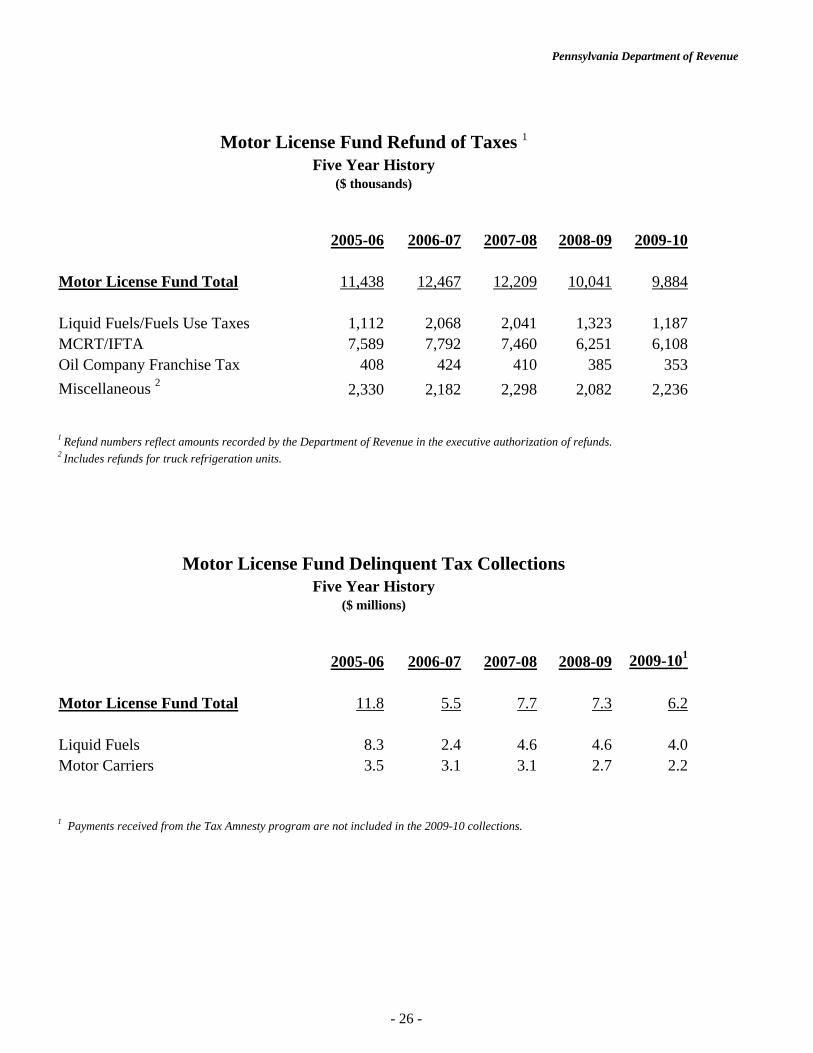
2005-06 2006-07 2007-08 2008-09 2009-10
Motor License Fund Total 11,438 12,467 12,209 10,041 9,884
Liquid Fuels/Fuels Use Taxes 1,112 2,068 2,041 1,323 1,187MCRT/IFTA 7,589 7,792 7,460 6,251 6,108Oil Company Franchise Tax 408 424 410 385 353Miscellaneous 2 2,330 2,182 2,298 2,082 2,236
1 Refund numbers reflect amounts recorded by the Department of Revenue in the executive authorization of refunds.2 Includes refunds for truck refrigeration units.
Motor License Fund Delinquent Tax CollectionsFive Year History
($ millions)
2005-06 2006-07 2007-08 2008-09 2009-101
Motor License Fund Total 11.8 5.5 7.7 7.3 6.2
Liquid Fuels 8.3 2.4 4.6 4.6 4.0Motor Carriers 3.5 3.1 3.1 2.7 2.2
Motor License Fund Refund of Taxes 1
Five Year History($ thousands)
1 Payments received from the Tax Amnesty program are not included in the 2009-10 collections.
- 26 -
Pennsylvania Department of Revenue
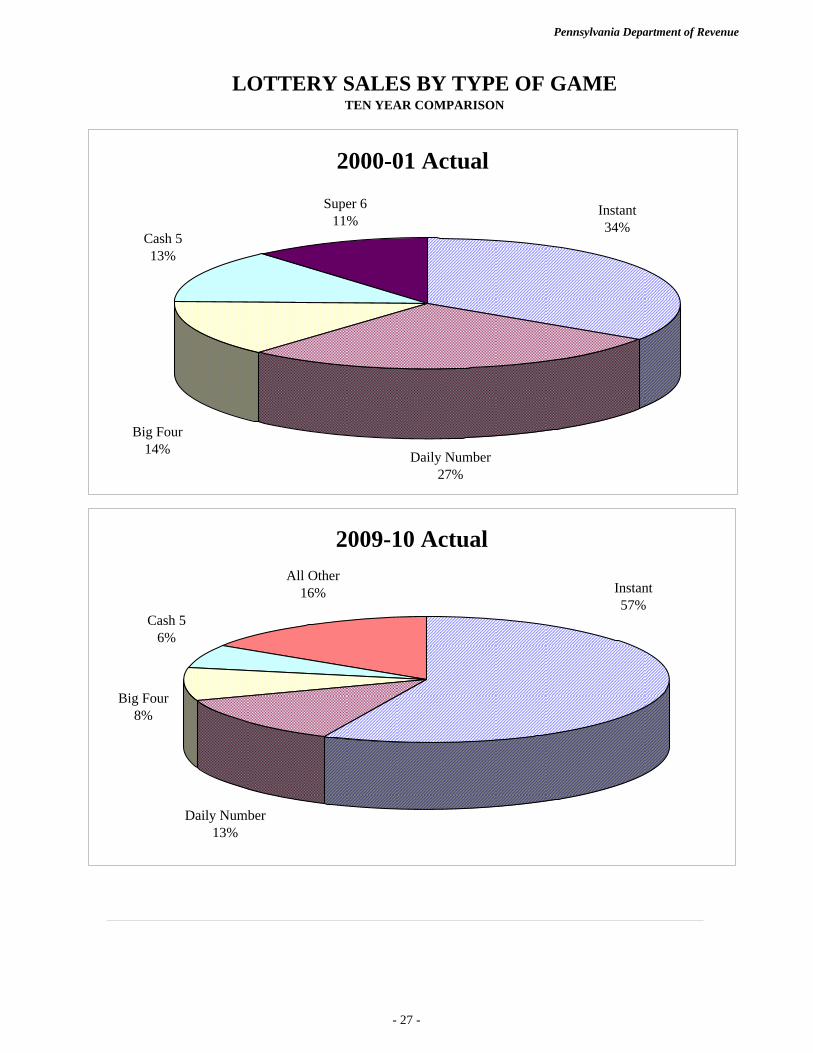
LOTTERY SALES BY TYPE OF GAMETEN YEAR COMPARISON
2000-01 Actual
Instant34%
Super 611%
Big Four14%
Cash 513%
Daily Number27%
2009-10 Actual
Daily Number13%
Cash 56%
Big Four8%
All Other16% Instant
57%
- 27 -
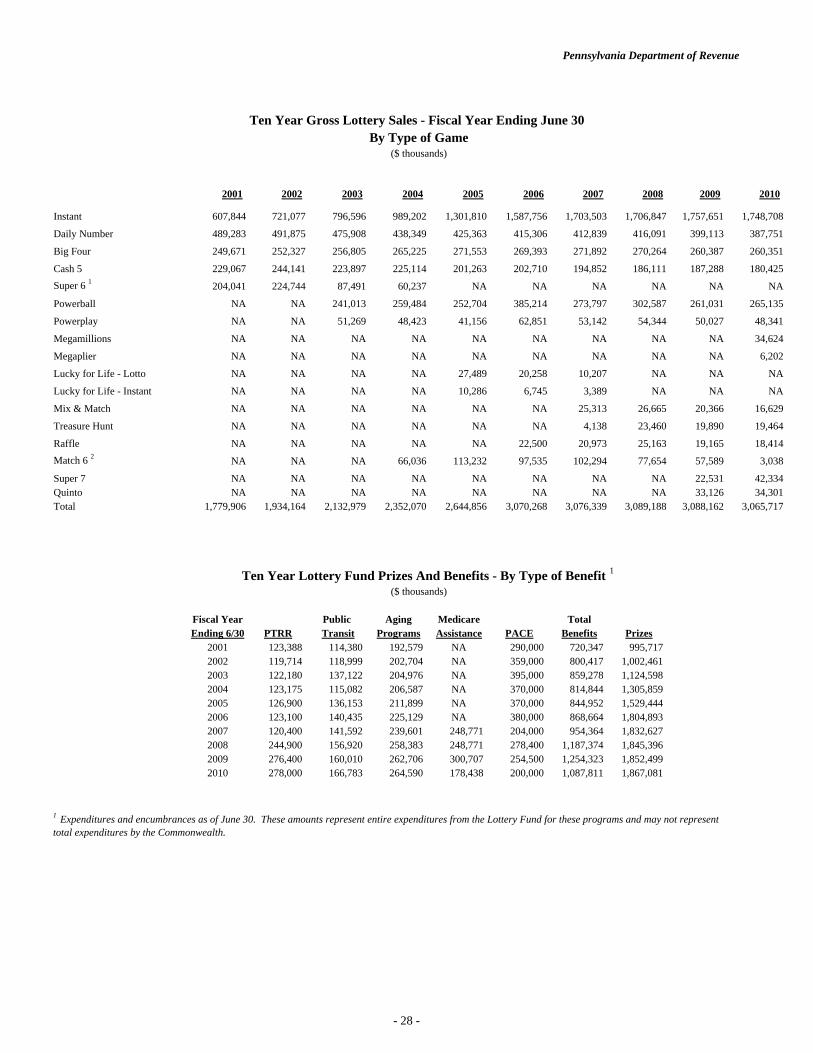
Pennsylvania Department of Revenue
2001 2002 2003 2004 2005 2006 2007 2008 2009 2010
Instant 607,844 721,077 796,596 989,202 1,301,810 1,587,756 1,703,503 1,706,847 1,757,651 1,748,708
Daily Number 489,283 491,875 475,908 438,349 425,363 415,306 412,839 416,091 399,113 387,751
Big Four 249,671 252,327 256,805 265,225 271,553 269,393 271,892 270,264 260,387 260,351
Cash 5 229,067 244,141 223,897 225,114 201,263 202,710 194,852 186,111 187,288 180,425Super 6 1 204,041 224,744 87,491 60,237 NA NA NA NA NA NA
Powerball NA NA 241,013 259,484 252,704 385,214 273,797 302,587 261,031 265,135
Powerplay NA NA 51,269 48,423 41,156 62,851 53,142 54,344 50,027 48,341
Megamillions NA NA NA NA NA NA NA NA NA 34,624
Megaplier NA NA NA NA NA NA NA NA NA 6,202
Lucky for Life - Lotto NA NA NA NA 27,489 20,258 10,207 NA NA NA
Lucky for Life - Instant NA NA NA NA 10,286 6,745 3,389 NA NA NA
Mix & Match NA NA NA NA NA NA 25,313 26,665 20,366 16,629
Treasure Hunt NA NA NA NA NA NA 4,138 23,460 19,890 19,464
Raffle NA NA NA NA NA 22,500 20,973 25,163 19,165 18,414Match 6 2 NA NA NA 66,036 113,232 97,535 102,294 77,654 57,589 3,038
Super 7 NA NA NA NA NA NA NA NA 22,531 42,334Quinto NA NA NA NA NA NA NA NA 33,126 34,301Total 1,779,906 1,934,164 2,132,979 2,352,070 2,644,856 3,070,268 3,076,339 3,089,188 3,088,162 3,065,717
Fiscal Year Public Aging Medicare TotalEnding 6/30 PTRR Transit Programs Assistance PACE Benefits Prizes
2001 123,388 114,380 192,579 NA 290,000 720,347 995,7172002 119,714 118,999 202,704 NA 359,000 800,417 1,002,4612003 122,180 137,122 204,976 NA 395,000 859,278 1,124,5982004 123,175 115,082 206,587 NA 370,000 814,844 1,305,8592005 126,900 136,153 211,899 NA 370,000 844,952 1,529,4442006 123,100 140,435 225,129 NA 380,000 868,664 1,804,8932007 120,400 141,592 239,601 248,771 204,000 954,364 1,832,6272008 244,900 156,920 258,383 248,771 278,400 1,187,374 1,845,3962009 276,400 160,010 262,706 300,707 254,500 1,254,323 1,852,4992010 278,000 166,783 264,590 178,438 200,000 1,087,811 1,867,081
($ thousands)
1 Expenditures and encumbrances as of June 30. These amounts represent entire expenditures from the Lottery Fund for these programs and may not represent total expenditures by the Commonwealth.
Ten Year Gross Lottery Sales - Fiscal Year Ending June 30
($ thousands)By Type of Game
Ten Year Lottery Fund Prizes And Benefits - By Type of Benefit 1
- 28 -
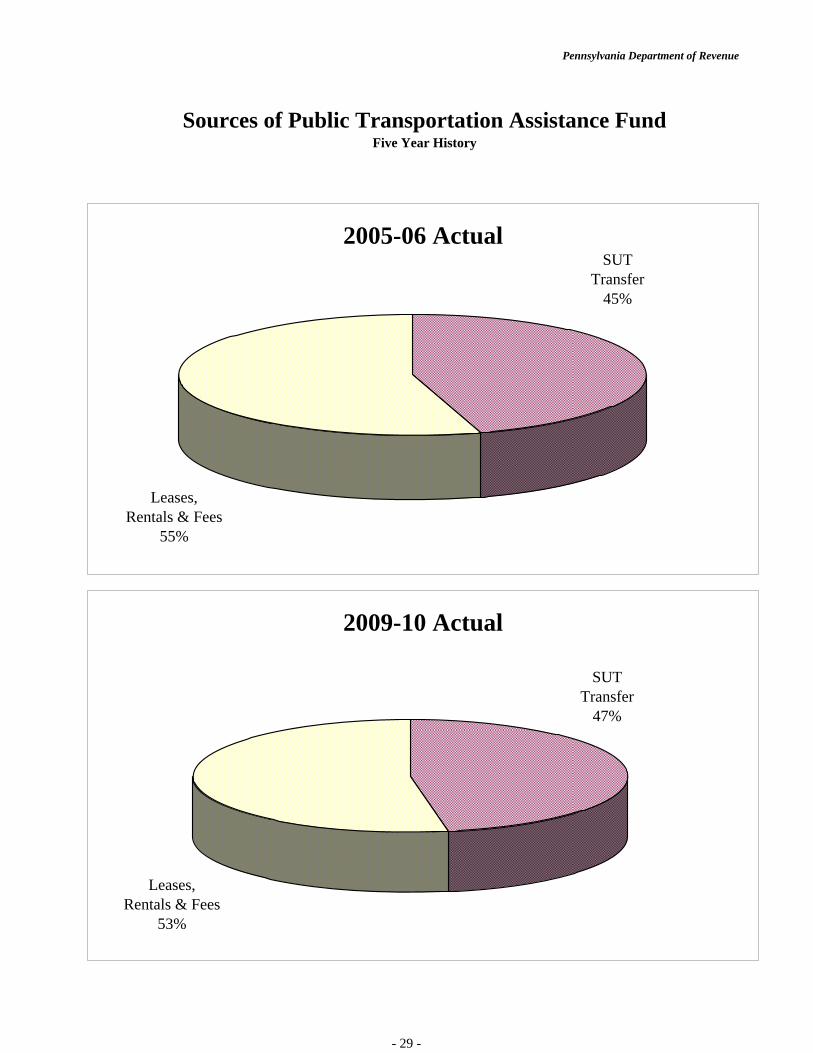
Pennsylvania Department of Revenue
Five Year HistorySources of Public Transportation Assistance Fund
2005-06 ActualSUT
Transfer45%
Leases, Rentals & Fees
55%
2009-10 Actual
Leases,Rentals & Fees
53%
SUTTransfer
47%
- 29 -
Pennsylvania Department of Revenue
Public Transportation Assistance Fund (PTAF) 2005-06 2006-07 2007-08 2008-09 2009-10
Sales & Use Tax Transfer 79.6 82.5 85.2 81.8 79.3Leases, Rentals & Tire Fees 96.1 100.3 103.2 98.0 88.2Total 2 175.6 182.9 188.4 179.8 167.5
Public Transportation Trust Fund (PTTF) 2005-06 2006-07 2007-08 2008-09 2009-10
Sales & Use Tax Transfer 0.0 0.0 396.0 380.0 368.4
Growth in Total Selected Receipts
Public Transportation Assistance Fund Sales & Use Tax Transfer 2.9% 3.7% 3.3% -4.0% -3.1% Leases, Rentals & Tire Fees -1.6% 4.4% 2.9% -5.1% -10.0% Total 0.4% 4.1% 3.1% -4.6% -6.8%
Public Transportation Trust Fund Sales & Use Tax Transfer - - - -4.0% -3.1%
2 Details may not add to totals due to rounding.
Public Transportation Assistance Fund &Public Transportation Trust Fund - Selected Receipts 1
Five Year History($ millions)
1 Refer to the Tax Compendium for legislation affecting the Public Transportation Assistance Fund and the Public Transportation Trust Fund.
- 30 -


![Statistical supplement june 2011 final[1]](https://static.fdocuments.in/doc/165x107/554ad6ddb4c905a37c8b46be/statistical-supplement-june-2011-final1.jpg)