Statistical Supplement to the Federal Reserve Bulletin December … · 2018-11-07 · Preface The...
71
Volume 5 • Number 12 D December 2008 Statistical Supplement to the Federal Reserve C BULLETIN Board of Governors of the Federal Reserve System, Washington, D.C.
Transcript of Statistical Supplement to the Federal Reserve Bulletin December … · 2018-11-07 · Preface The...

Volume 5 • Number 12 D December 2008
Statistical Supplementto the Federal Reserve
C BULLETIN
Board of Governors of the Federal Reserve System, Washington, D.C.

PUBLICATIONS COMMITTEE
Rosanna Pianalto Cameron, Chair • Scott G. Alvarez • Sandra Braunstein • Roger T. Cole• Marianne M. Emerson • Jennifer J. Johnson • Karen H. Johnson • Brian F. Madigan• Stephen R. Malphrus • Louise L. Roseman • David J. Stockton
The Statistical Supplement to the Federal Reserve Bulletin is issued monthly under the direction of the staff Publications Committee. It is assisted by the EconomicEditing Section, Division of Research and Statistics, and the Publications Department, Office of Board Members.

IMPORTANT NOTICE TO SUBSCRIBERSof the
Statistical Supplementto the Federal Reserve Bulletin
Effective with the publication of this issue of the Statistical Supplement to the Federal Reserve Bulletin, theBoard is discontinuing both the print and online versions.
The majority of data published in the Statistical Supplement are available elsewhere on the Federal ReserveBoard's website at www.federalreserve.gov. The Board has created a webpage that provides a detailed list oflinks to the most recent data on its site and links to other data provided by the Federal Reserve Bank of NewYork, the U.S. Treasury, and the Federal Financial Institutions Examination Council. The Board will continue topublish the following tables from the Statistical Supplement in the Statistics and Historical Data section of itswebsite:
1.36 Stock Market, Selected Statistics1.45 New Security Issues, State and Local Governments1.46 New Security Issues, U.S. Corporations1.54 Mortgage Debt Outstanding3.10 U.S. International Transactions, Summary3.12 U.S. Reserve Assets3.13 Foreign Official Assets Held at Federal Reserve Banks3.15 Selected U.S. Liabilities to Foreign Official Institutions3.16 Liabilities to, and Claims on, Foreigners3.17 Liabilities to Foreigners3.18 Banks' Own Claims on Foreigners3.19 Banks' Own and Domestic Customers' Claims on Foreigners3.22 Liabilities to Unaffiliated Foreigners3.23 Claims on Unaffiliated Foreigners3.24 Foreign Transactions in Securities3.25 Marketable U.S. Treasury Bonds and Notes, Foreign Transactions4.20 Assets and Liabilities of Commercial Banks4.30 Assets and Liabilities of U.S. Branches and Agencies of Foreign Banks
Data for the Board's principal statistical releases are available free in multiple formats atwww.federalreserve.gov/releases.
The Statistical Supplement to the Federal Reserve Bulletin (ISSN 1547-6863) is published by the Board ofGovernors of the Federal Reserve System, Washington, DC 20551.
POSTMASTER: Send address changes to Statistical Supplement to the Federal Reserve Bulletin, PUBLICA-TIONS FULFILLMENT, Mail Stop 127, Board of Governors of the Federal Reserve System, Washington, DC20551.

Preface
The Statistical Supplement to the Federal ReserveBulletin, which began publication in 2004, is a con-tinuation of the Financial and Business Statisticssection that appeared in each month's issue of theFederal Reserve Bulletin (1914-2003). All statisticalseries in the Statistical Supplement have been pub-lished with the same frequency that they had in theBulletin, and the numbering system for the tableshave remained the same.
Please note that the Statistical Supplement willcease publication in both the print and online ver-sions with this issue. For more information, see "Im-portant Notice to Subscribers" on the inside frontcover.
Financial and Business Statistics:Table of Contents
These tables reflect the data available as of the secondweek of December 2008.
3 SYMBOLS AND ABBREVIATIONS
DOMESTIC FINANCIAL STATISTICS
Money Stock and Bank Credit
4 Reserves and money stock measures5 Factors affecting reserve balances of depository
institutions6 Reserves and borrowings—Depository
institutions
Policy Instruments
7 Federal Reserve Bank interest rates8 Reserve requirements of depository institutions9 Federal Reserve open market transactions
Federal Reserve Banks
10 Condition and Federal Reserve note statements11 Maturity distribution of loans and securities
Monetary and Credit Aggregates
12 Aggregate reserves of depository institutionsand monetary base
13 Money stock measures
Commercial Banking Institutions—Assets and Liabilities
15 All commercial banks in the United States16 Domestically chartered commercial banks17 Large domestically chartered commercial banks19 Small domestically chartered commercial banks20 Foreign-related institutions21 Memo items
Federal Finance
25 Federal debt subject to statutory limitation25 Gross public debt of U.S. Treasury-
Types and ownership26 U.S. government securities
dealers—Transactions27 U.S. government securities dealers—
Positions and financing28 Federal and federally sponsored credit
agencies—Debt outstanding
Securities Markets and Corporate Finance
29 New security issues—State and local governments29 New security issues—U.S. corporations30 Open-end investment companies—Net sales
and assets30 Domestic finance companies—Assets and liabilities31 Domestic finance companies—Owned and managed
receivables
Real Estate
32 Mortgage markets—New homes33 Mortgage debt outstanding
Consumer Credit
34 Total outstanding34 Terms
Flow of Funds
35 Funds raised in U.S. credit markets37 Summary of financial transactions38 Summary of credit market debt outstanding39 Summary of financial assets and liabilities
Financial Markets
22 Commercial paper outstanding22 Prime rate charged by banks on short-term
business loans23 Interest rates—Money and capital markets24 Stock market—Selected statistics
DOMESTIC NONF1NANC1AL STATISTICS
Selected Measures
40 Output, capacity, and capacity utilization42 Industrial production—Indexes and gross value

2 Federal Reserve Bulletin Statistical Supplement • December 2008
INTERNATIONAL STATISTICS
Summary Statistics
44 U.S. international transactions44 U.S. reserve assets45 Foreign official assets held at Federal Reserve
Banks45 Selected U.S. liabilities to foreign official
institutions
Reported by Banks in the United States
45 Liabilities to, and claims on, foreigners46 Liabilities to foreigners48 Banks' own claims on foreigners49 Banks' own and domestic customers' claims on
foreigners
Reported by Nonbanking BusinessEnterprises in the United States
50 Liabilities to unaffiliated foreigners52 Claims on unaffiliated foreigners
Securities Holdings and Transactions
54 Foreign transactions in securities55 Marketable U.S. Treasury bonds and
notes—Foreign transactions
Interest and Exchange Rates
56 Foreign exchange rates and indexes of the foreignexchange value of the U.S. dollar
57 GUIDE TO SPECIAL TABLES
SPECIAL TABLES
58 Assets and liabilities of commercial banks,September 30, 2008
60 INDEX TO STATISTICAL TABLES
62 FEDERAL RESERVE BOARD PUBLICATIONS
64 ANTICIPATED SCHEDULE OF RELEASE DATESFOR PERIODIC STATISTICAL RELEASES
66 PUBLICATIONS OF INTEREST
67 FEDERAL RESERVE STATISTICAL RELEASESAVAILABLE ON THE COMMERCE DEPARTMENT'SECONOMIC BULLETIN BOARD

Symbols and Abbreviations
cen.a.n.e.c.P
*
0
ABSATSBIFCDCMOCRAFAMCFFBFFIECFHAFHLBBFHLMCFmHAFNMAFSAFSLICG-7G-10GDP
CorrectedEstimatedNot availableNot elsewhere classifiedPreliminaryRevised (Notation appears in column heading
when about half the figures in the column havebeen revised from the most recently publishedtable.)
Amount insignificant in terms of the last decimalplace shown in the table (for example, less than500,000 when the smallest unit given is in millions)
Calculated to be zeroCell not applicableAsset-backed securityAutomatic transfer serviceBank insurance fundCertificate of depositCollateralized mortgage obligationCommunity Reinvestment Act of 1977Federal Agricultural Mortgage CorporationFederal Financing BankFederal Financial Institutions Examination CouncilFederal Housing AdministrationFederal Home Loan Bank BoardFederal Home Loan Mortgage CorporationFarmers Home AdministrationFederal National Mortgage AssociationFarm Service AgencyFederal Savings and Loan Insurance CorporationGroup of SevenGroup of TenGross domestic product
GNMAGSEHUD
IBFIMFIOsIPCsIRAMMDAMSANAICSNOWOCDsOPECOTSPMIPOsREITREMICsRHSRPRTCSCOSDRSICSTRIPS
TIISTIPS
VA
Government National Mortgage AssociationGovernment-sponsored enterpriseDepartment of Housing and Urban
DevelopmentInternational banking facilityInternational Monetary FundInterest-only, stripped, mortgage-backed securitiesIndividuals, partnerships, and corporationsIndividual retirement accountMoney market deposit accountMetropolitan statistical areaNorth American Industry Classification SystemNegotiable order of withdrawalOther checkable depositsOrganization of Petroleum Exporting CountriesOffice of Thrift SupervisionPrivate mortgage insurancePrincipal-only, stripped, mortgage-backed securitiesReal estate investment trustReal estate mortgage investment conduitsRural Housing ServiceRepurchase agreementResolution Trust CorporationSecuritized credit obligationSpecial drawing rightStandard Industrial ClassificationSeparate trading of registered interest and principal
of securitiesSee TIPSTreasury inflation-protected securities (formerly
TIIS, or Treasury inflation-indexed securities)Department of Veterans Affairs
GENERAL INFORMATION
In many of the tables, components do not sum to totals because ofrounding.
Minus signs are used to indicate (1) a decrease, (2) a negativefigure, or (3) an outflow.
"U.S. government securities" may include guaranteed issues
of U.S. government agencies (the flow of funds figures alsoinclude not fully guaranteed issues) as well as direct obliga-tions of the U.S. Treasury.
"State and local government" also includes municipalities,special districts, and other political subdivisions.

4 Federal Reserve Bulletin Statistical Supplement • December 2008
1.10 RESERVES AND MONEY STOCK MEASURES
Percent annual rate of change, seasonally adjusted1
Monetary or credit aggregate
Q4 Q1 Q2 Q3 May Aug. Sept.
Reserves of depository institutions2
1 Total2 Required3 Monetary base3
Concepts of money4
4 Ml5 M2
Nontransaction components6 In M2S
Time and savings depositsCommercial banks
7 Savings, including MMDAs . . .8 Small time1"
Thrift institutions9 Savings, including MMDAs . . .
10 Small time1"
Money market mutual funds11 Retail7
12 Institution-only
-5.54.91.0
- . 35.2
4.623.9
-4.2-26.1
22.954.0
4.7
- . 4
1.39.0
7.74.3
7.2- . 9
34.5
47.0
5.66.62.0
1.05.3
6.3-3.6
18.5-8.7
9.432.7
182.15.7
16.1
12.23.6
1.220.4
1.8-14.1
- 5 . 5
2.2
15.711.63.0
-2.9P
1.5
4.5- 1 . 0
37.0
-12.5
-23.618.4
-20.7-29.1
16.0p
- . 3
15.3
-17.2
-19.514.4
- .77.9
14.86.4
1.422.1 r
5.9-19.3
7.9-1.0
34.335.65.1
-8.0-1.5
-3.937.1'
-14.6-3.5
1,566.84.2
51.5
15.5
19.232.8
-38.1-16.8
- . 4-48.9
1. Unless otherwise noted, rates of change are calculated from average amounts outstand-ing during the preceding month or quarter.
2. Figures incorporate adjustments for discontinuities, or "breaks," associated with regu-latory changes in reserve requirements. (See also table 1.20.)
3. The seasonally adjusted, break-adjusted monetary base consists of (1) seasonallyadjusted, break-adjusted total reserves (line 1), plus (2) the seasonally adjusted currencycomponent of the money stock, plus (3) (for all quarterly reporters on the "Report ofTransaction Accounts, Other Deposits and Vault Cash" and for all weekly reporters whosevault cash exceeds their required reserves) the seasonally adjusted, break-adjusted differencebetween current vault cash and the amount applied to satisfy current reserve requirements.
4. Composition of the money stock measures is as follows:Ml consists of (1) currency outside the U.S. Treasury, Federal Reserve Banks, and the
vaults of depository institutions; (2) travelers checks ofnonbank issuers; (3) demand depositsat commercial banks (excluding those amounts held by depository institutions, the U.S.government, and foreign banks and official institutions) less cash items in the process ofcollection and Federal Reserve float; and (4) other checkable deposits (OCDs), consisting ofnegotiable order of withdrawal (NOW) and automatic transfer service (ATS) accounts at
depository institutions, credit union share draft accounts, and demand deposits at thriftinstitutions. Seasonally adjusted Ml is constructed by summing currency, travelers checks,demand deposits, and OCDs, each seasonally adjusted separately.
M2 consists of Ml plus (1) savings deposits (including money market deposit accounts);(2) small-denomination time deposits (time deposits in amounts of less than $100,000), lessindividual retirement accounts (IRA) and Keogh balances at depository institutions; and (3)balances in retail money market mutual funds, less IRA and Keogh balances at money marketmutual funds. Seasonally adjusted M2 is constructed by summing savings deposits, small-denomination time deposits, and retail money fund balances, each seasonally adjustedseparately, and adding this result to seasonally adjusted Ml.
5. Sum of (1) savings deposits (including MMDAs), (2) small time deposits, and (3) retailmoney fund balances, each seasonally adjusted separately.
6. Small time deposits are those issued in amounts of less than $100,000. All IRA andKeogh account balances at commercial banks and thrift institutions are subtracted from smalltime deposits.
7. IRA and Keogh account balances at money market mutual funds are subtracted fromretail money funds.

Money Stock and Bank Credit 5
1.11 FACTORS AFFECTING RESERVE BALANCES OF DEPOSITORY INSTITUTIONS'Millions of dollars
Average of daily figures
Aug. Sept.
Average of daily figures for week ending on date indicated
2008
Aug. 13 Sept. 3 Sept. 10 Sept. 17 Sept. 24
SUPPLYING RESERVE FUNDS
Reserve Bank credit outstandingSecurities held outright
U.S. Treasury2
Bills3
Notes and bonds, nominal3
Notes and bonds, inflation-indexed3
Inflation compensation4
Federal agency3
Repurchase agreements5
Term auction creditOther loans
Primary creditSecondary creditSeasonal creditPrimary dealer and other broker-dealer credit1"Asset-backed commercial paper money
market mutual fund liquidity facilityOther credit extensions
Net portfolio holdings of Maiden Lane LLC7 . .FloatOther Federal Reserve assets
Gold stockSpecial drawing rights certificate accountTreasury currency outstanding
ABSORBING RESERVE FUNDS
Currency in circulationReverse repurchase agreements5
Foreign official and international accounts . . . .Dealers
Treasury cash holdingsDeposits with Federal Reserve Banks, other than
reserve balancesU.S. Treasury, general accountU.S. Treasury, supplementary financing accountForeign officialService-related
Required clearing balancesAdjustments to compensate for float
OtherOther liabilities and capital9
Reserve balances with Federal Reserve Banks10 . .
SUPPLYING RESERVE FUNDS
Reserve Bank credit outstandingSecurities held outright
U.S. Treasury2
Bills3
Notes and bonds, nominal3
Notes and bonds, inflation-indexed3
Inflation compensation4
Federal agency3
Repurchase agreements5
Term auction creditOther loans
Primary creditSecondary creditSeasonal creditPrimary dealer and other broker-dealer credit1"Asset-backed commercial paper money
market mutual fund liquidity facilityOther credit extensions
Net portfolio holdings of Maiden Lane LLC7 . . .FloatOther Federal Reserve assets
Gold stockSpecial drawing rights certificate accountTreasury currency outstanding
ABSORBING RESERVE FUNDS
Currency in circulationReverse repurchase agreements5
Foreign official and international accountsDealers
Treasury cash holdingsDeposits with Federal Reserve Banks, other than
reserve balancesU.S. Treasury, general accountU.S. Treasury, supplementary financing accountForeign officialService-related
Required clearing balancesAdjustments to compensate for float
OtherOther liabilities and capital9
Reserve balances with Federal Reserve Banks10 . . .
889,322479,042479,042
21,740412,371
39,1925,739
0111,298150,00015,42315,068
10399
153
029,018-1,429105,970
11,0412,200
38,676
830,81442,78242,782
0287
12,6745,070
0103
7,2067,206
0295
44,47010,212
479,486479,486
21,740411,731
39,8326,183
0107,815150,000
18,02117,923
970
00
29,175-1,203105,584
11,0412,200
38,676
831,01743,29443,294
0300
12,3824,806
0154
7,0957,095
1328
44,2339,568
1,054,506481,559478,392
20,303411,73139,832
6,5273,167
108,967149,833133,72629,471
7392
54,873
20,71929,340-1,052152,132
11,0412,200
38,675
834,15256,24752,0804,167
270
98,6955,757
77,914'141
7,3317,331
07,552
45,67471,384
886,205479,396479,396
21,740411,73139,832
6,0930
105,786150,00017,80717,699
7100
0
00
29,145-1,127105,199
11,0412,200
38,676
831,08542,45842,458
0298
12,5104,859
0319
7,0067,006
0325
43,7887,983
889,872479,500479,500
21,740411,73139,832
6,1970
107,714150,00017,60917,513
0950
00
29,183-940
106,80611,0412,200
38,676
830,01744,45544,455
0297
12,3654,765
0103
7,1797,176
31843,99110,664
886,484479,604479,604
21,740411,73139,832
6,3010
103,393150,00018,57018,469
0100
0
00
29,213-1,213106,918
11,0412,200
38,676
829,45642,85842,858
0302
12,4354,828
0101
7,1757,175
0332
44,6048,746
894,412479,701479,701
21,740411,731
39,8326,398
0115,893150,000
19,07018,976
093
0
00
29,253-1,483101,979
11,0412,200
38,675
835,19142,88042,880
0281
12,2394,746
0100
7,0867,086
0307
44,86610,871
890,442479,762479,762
21,740411,731
39,8326,459
0110,821150,000
19,89119,796
0950
00
29,293-1,057101,731
11,0412,200
38,675
834,47742,69042,690
0275
12,2504,723
0161
7,0857,085
0281
44,6807,986
932,632479,818479,818
21,740411,73139,832
6,5150
124,500150,00047,96921,598
896
20,268
06,000
29,333-1,070102,081
11,0412,200
38,675
832,30145,74345,743
0267
14,3664,941
0168
7,3607,360
01,897
44,86947,002
End-of-month figures Wednesday figures
July
898,515479,240479,240
21,740411,73139,832
5,9370
119,000150,00017,52917,432
097
0
00
29,099-2,178105,825
11,0412,200
38,676
831,86245,42245,422
0318
12,7025,256
0103
7,0167,016
0327
43,98116,147
895,974479,702479,702
21,740411,731
39,8326,399
0117,500150,000
19,10419,011
093
0
029,247
-1,470101,891
11,0412,200
38,675
835,12942,61042,610
0281
12,1644,681
099
7,0867,086
0298
44,96812,738
Sept. Aug. 13
1,492,635491,127476,627
18,423411,73139,832
6,64114,50083,000
149,000411,87050,960
060
148,701
151,070'61,08029,407
-954329,184
11,0412,200
38,675
838,25377,93777,937
0270
366,44332,988
299,491'121
7,5667,566
026,27747,168
214,480
898,870479,434479,434
21,740411,73139,832
6,1310
118,250150,00017,65117,552
099
00
29,179-998
105,35511,0412,200
38,676
832,10744,17244,172
0296
12,1424,715
0101
7,0067,006
0319
43,69318,377
Aug. 20
882,696479,538479,538
21,740411,73139,832
6,2350
100,750150,00018,56318,469
0940
00
29,207-1,702106,340
11,0412,200
38,676
830,67543,60643,606
0306
12,7675,177
0102
7,1797,176
3310
44,1213,138
Aug. 27
894,222479,642479,642
21,740411,73139,832
6,3390
111,000150,00019,00218,901
0102
0
00
29,247-1,689107,019
11,0412,200
38,676
832,67743,76843,768
0281
12,6484,989
0100
7,1757,175
0385
44,54912,215
Sept. 3
888,012479,726479,726
21,740411,731
39,8326,423
0109,000150,000
19,08919,000
090
00
29,287-372
101,28211,0412,200
38,675
836,70941,75641,756
0276
13,1095,606
0100
7,0867,086
0317
44,5753,504
Sept. 10
909,783479,782479,782
21,740411,731
39,8326,480
0126,750150,00023,55623,455
0101
0
00
29,327-1,302101,669
11,0412,200
38,675
834,56944,29644,296
0268
13,3125,412
0522
7,0857,085
0292
44,28324,971
Sept. 17
979,163479,839479,839
21,740411,73139,832
6,5360
98,000150,000121,29433,401
1895
59,780
028,00029,367-1,704102,367
11,0412,200
38,675
833,04446,63346,633
0261
24,3035,512
0102
7,3607,360
011,33045,14081,699
1,135,020480,272476,557
18,423411,731
39,8326,5723,714
111,714150,000187,75339,357
1995
88,147
21,76038,37529,373
-1,058176,967
11,0412,200
38,675
833,80159,79056,2193,571
262
142,0445,088
117,046119
7,3647,364
012,42746,536
104,504
Sept. 24
1,196,789486,578476,578
18,423411,731
39,8326,593
10,00086,000
150,000262,341
39,32719
101105,662
72,66744,56629,407
-1,410183,872
11,0412,200
38,675
836,33890,67365,67325,000
270
187,1395,175
159,806150
7,3647,364
014,64446,36187,925
NOTE: Some of the data in this table appears in the Board's H.4.1 (503) weekly statisticalrelease, available at www.federalreserve.gov/releases.
1. Amounts of vault cash held as reserves are shown in table 1.12, line 2.2. Includes securities lent to dealers under the overnight and term securities lending
facilities.3. Face value of the securities.4. Compensation that adjusts for the effect of inflation on the original face value of
inflation-indexed securities.5. Cash value of agreements, which are collateralized by U.S. Treasury and federal agency
securities.
6. Includes credit extended through Primary Dealer Credit Facility and credit extended tocertain other broker-dealers.
7. Fair value.8. Cash value of agreements, which are collateralized by U.S. Treasury securities.9. Includes the liabilities of Maiden Lane LLC to entities other than the Federal Reserve
Bank of New York, including liabilities that have recourse only to the portfolio holdings ofMaiden Lane LLC.
10. Excludes required clearing balances and adjustments to compensate for float.

6 Federal Reserve Bulletin Statistical Supplement • December 2008
1.12 RESERVES AND BORROWINGS Depository Institutions1
Millions of dollars
123456789
1011121314
15
16
123456789
1011121314
15
16
Reserve classification
Reserve balances with Reserve Banks2
Total vault cash3
Applied vault cash4
Surplus vault cash5
Total reserves6
Required reservesExcess reserve balances at Reserve Banks7
Total borrowing at Reserve BanksTerm auction creditPrimarySecondarySeasonalPrimary dealer and other broker-dealer credit5
Asset-backed commercial paper money marketmutual fund liquidity facility
Credit extended to American International Group,Inc
Other credit extensions
2005
Dec.
10,04751,31435,33715,97745,38443,483
1,900169
n.a.97
072
n.a.
n.a.
n.a.n.a.
June 4
10,70247,83736,27011,56846,97244,716
2,256176,297150,00015,936
166
10,295
n.a.
n.a.0
2006
Dec.
8,48050,89734,80316,09443,28341,420
1,863191
n.a.I l l
080
n.a.
n.a.
n.a.n.a.
June 18
7,99848,53032,59815,93340,59638,942
1,653171,945150,000
13,26011269
8,505
n.a.
n.a.0
2007
Dec.
8,17952,16134,52217,63942,70140,932
1,770'15,43011,6133,787
130
n.a.
n.a.
n.a.n.a.
Prorated monthly averages of biweekly averages
Mar.
9,75450,44632,95217,49442,70639,728
2,97894,52375,484
1,61706
16,168
n.a.
n.a.1,249
Apr.
9,25449,31534,25215,06343,50641,661
1,844135,410100,000
9,6240
2125,764
n.a.
n.a.0
B weekly averages of daily figures for
July 2
10,05350,76936,76014,00946,81343,813
3,000168,827150,000
14,7824386
3,917
n.a.
n.a.0
July 16
8,65748,96832,76116,20741,41839,616
1,801163,658150,00013,386
168100
5
n.a.
n.a.0
July 30
9,94449,12436,65512,46946,59944,583
2,016167,077150,000
16,91762992
n.a.
n.a.0
May
9,68848,57635,42313,15345,11143,100
2,011155,780127,41914,076
047
14,238
n.a.
n.a.0
2008
June
9,18149,33334,75214,58143,93341,660
2,272171,278150,000
14,2257075
6,908
n.a.
n.a.0
July
9,34349,22534,78114,44444,12442,147
1,977165,664150,00015,204
10798
255
n.a.
n.a.0
two-week periods ending on dates indicated
2008
Aug. 13
9,13551,14132,87018,27242,00440,157
1,847167,635150,00017,535
4970
n.a.
n.a.0
Aug. 27
9,70549,47436,39913,07646,10444,062
2,041168,090150,000
17,9910
980
n.a.
n.a.0
Sept. 10
9,42949,23034,73514,49644,16341,908
2,255169,481150,00019,386
0940
n.a.
n.a.0
Aug.
9,43050,14234,70415,43844,13442,146
1,988168,078150,000
17,9801
970
n.a.
n.a.0
Sept. 24
75,75350,22535,58414,641
111,33742,57568,762
267,861150,00030,478
1496
54,208
10,880
22,1880
Sept.
67,17350,44335,41115,032
102,58442,53360,051
290,105149,81432,632
3587
53,473
31,877
22,1870
Oct. 8
143,39652,97336,13316,840
179,52943,479
136,050543,050149,07259,737
14557
140,879
133,997
59,1640
1. Data in this table also appear in the Board's H.3 (502) weekly statistical release,available at www.federalreserve.gov/releases. Data are not break-adjusted or seasonallyadj usted.
2. Excludes required clearing balances and adjustments to compensate for float andincludes other off-balance-sheet "as-of" adjustments.
3. Vault cash eligible to satisfy reserve requirements. It includes only vault cash held bythose banks and thrift institutions that are not exempt from reserve requirements. Datesrefer to the maintenance periods in which the vault cash can be used to satisfy reserverequirements.
4. All vault cash held during the lagged computation period by "bound" institutions (thatis, those whose required reserves exceed their vault cash) plus the amount of vault cashapplied during the maintenance period by "nonbound'' institutions (that is, those whose vaultcash exceeds their required reserves) to satisfy current reserve requirements.
5. Total vault cash (line 2) less applied vault cash (line 3).6. Reserve balances with Federal Reserve Banks (line 1) plus applied vault cash (line 3).7. Total reserves (line 5) less required reserves (line 6).8. Includes credit extended through the Primary Dealer Credit Facility and credit extended
to certain other broker-dealers.
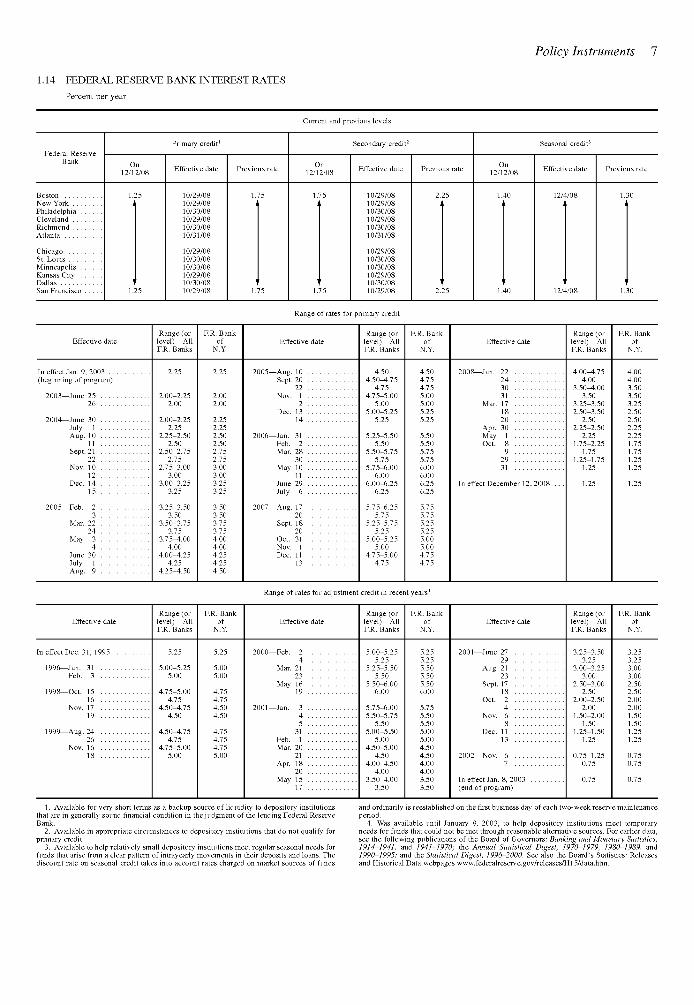
1.14 FEDERAL RESERVE BANK INTEREST RATES
Percent per year
Policy Instruments 1
Current and previous levels
Federal ReserveBank
BostonVew YorkPhiladelphiaClevelandRichmondAtlanta
ChicagoSt. LouisMinneapolisKansas CityDallasSan Francisco
On12/12/08
1.25i
'
1.25
Primary credit1
Effective date
10/29/0810/29/0810/30/0810/29/0810/30/0810/31/08
10/29/0810/30/0810/30/0810/29/0810/30/0810/29/08
Previous rate
1.75
1
1.75
On12/12/08
1.75
1.75
Secondary credit2
Effective date
10/29/0810/29/0810/30/0810/29/0810/30/0810/31/08
10/29/0810/30/0810/30/0810/29/0810/30/0810/29/08
Previous rate
2.25
1
2.25
On12/12/08
1.40
1.40
Seasona credit3
Effective date
12/4/08i
12/4/08
Previous rate
1.30
1
1.30
Range of rates for primary credit
Range of rates for adjustment credit in recent years4
Effective date
In effect Jan. 9, 2003(beginning of program)
2003—June 2526
2004—June 30July 1Aug. 10
11Sept. 21
22Nov. 10
12Dec. 14
15
2005—Feb. 23
Mar. 2224
May 34
June 30July 1Aug. 9
Range(orlevel)—AllF.R. Banks
2.25
2.00-2.252.00
2.00-2.252.25
2.25-2.502.50
2.50-2.752.75
2.75-3.003.00
3.00-3.253.25
3.25-3.503.50
3.50-3.753.75
3.75-4.004.00
4.00-4.254.25
4.25-4.50
F.R. Bankof
N.Y.
2.25
2.002.00
2.252.252.502.502.752.753.003.003.253.25
3.503.503.753.754.004.004.254.254.50
Effective date
2005—Aug. 10Sept. 20
22Nov. 1
2Dec. 13
14
2006—Jan. 31Feb. 2Mar. 28
30May 10
11June 29July 6
2007—Aug. 1720
Sept. 1820
Oct. 31Nov. 1Dec. 11
13
Range(orlevel)—AllF.R. Banks
4.504.50^1.75
4.754.75-5.00
5.005.00-5.25
5.25
5.25-5.505.50
5.50-5.755.75
5.75-6.006.00
6.00-6.256.25
5.75-6.255.75
5.25-5.755.25
5.00-5.255.00
4.75-5.004.75
F.R. Bankof
N.Y.
4.504.754.755.005.005.255.25
5.505.505.755.756.006.006.256.25
5.755.755.255.255.005.004.754.75
Effective date
2008—Jan. 22243031
Mar. 171820
Apr. 30May 1Oct. 8
92931
In effect December 12, 2008 . . .
Range(orlevel)—AllF.R. Banks
4.00^1.754.00
3.50^1.003.50
3.25-3.502.50-3.50
2.502.25-2.50
2.251.75-2.25
1.751.25-1.75
1.25
1.25
F.R. Bankof
N.Y.
4.004.003.503.503.252.502.502.252.251.751.751.251.25
1.25
Effective date
In effect Dec. 31, 1995
1996—Jan. 31Feb. 3
1998—Oct. 1516
Nov. 1719
1999—Aug. 2426
Nov. 1618
Range(orlevel)—AllF.R. Banks
5.25
5.00-5.255.00
4.75-5.004.75
4.50-4.754.50
4.50-4.754.75
4.75-5.005.00
F.R. Bankof
N.Y.
5.25
5.005.00
4.754.754.504.50
4.754.754.755.00
Effective date
2000—Feb. 24
Mar. 2123
May 1619
2001—Jan. 345
31Feb. 1Mar. 20
21Apr. 18
20May 15
17
Range(orlevel)—AllF.R. Banks
5.00-5.255.25
5.25-5.505.50
5.50-6.006.00
5.75-6.005.50-5.75
5.505.00-5.50
5.004.50-5.00
4.504.00^1.50
4.003.50^1.00
3.50
F.R. Bankof
N.Y.
5.255.255.505.505.506.00
5.755.505.505.005.004.504.504.004.003.503.50
Effective date
2001—June 2729
Aug. 2123
Sept. 1718
Oct. 24
Nov. 68
Dec. 1113
2002—Nov. 67
In effect Jan. 8, 2003(end of program)
Range(orlevel)—AllF.R. Banks
3.25-3.503.25
3.00-3.253.00
2.50-3.002.50
2.00-2.502.00
1.50-2.001.50
1.25-1.501.25
0.75-1.250.75
0.75
F.R. Bankof
N.Y.
3.253.253.003.002.502.502.002.001.501.501.251.25
0.750.75
0.75
1. Available for very short terms as a backup source of liquidity to depository institutionsthat are in generally sound financial condition in the judgment of the lending Federal ReserveBank.
2. Available in appropriate circumstances to depository institutions that do not qualify forprimary credit.
3. Available to help relatively small depository institutions meet regular seasonal needs forfunds that arise from a clear pattern of intrayearly movements in their deposits and loans. Thediscount rate on seasonal credit takes into account rates charged on market sources of funds
and ordinarily is reestablished on the first business day of each two-week reserve maintenanceperiod.
4. Was available until January 8, 2003, to help depository institutions meet temporaryneeds for funds that could not be met through reasonable alternative sources. For earlier data,see the following publications of the Board of Governors: Banking and Monetary Statistics,1914-1941, and 1941-1970; the Annual Statistical Digest, 1970-1979, 1980-1989, and1990-1995; and the Statistical Digest, 1996-2000. See also the Board's Statistics: Releasesand Historical Data webpages www.federalreserve.gov/releases/H15/data.htm.

8 Federal Reserve Bulletin Statistical Supplement • December 2008
1.15 RESERVE REQUIREMENTS OF DEPOSITORY INSTITUTIONS
Type of liability
Requirement
Percentage ofliabilities Effective date
Net transaction accounts^1 $0 million-Sl0.3 million2
2 More than $10.3 million-$44.4 million3 . . .3 More than $44.4 million
4 Nonpersonal time deposits
5 Eurocurrency liabilities
0
10
0
0
01/01/0901/01/0901/01/09
12/27/90
12/27/90
NOTE: Required reserves must be held in the form of vault cash and, if vault cash isinsufficient, also in the form of a deposit with a Federal Reserve Bank. An institution that is amember of the Federal Reserve System must hold that deposit directly with a Reserve Bank;an institution that is not a member of the System can maintain that deposit directly with aReserve Bank or with another institution in a pass-through relationship. Reserve requirementsare imposed on commercial banks, savings banks, savings and loan associations, creditunions, U.S. branches and agencies of foreign banks, Edge Act corporations, and agreementcorporations.
1. Total transaction accounts consist of demand deposits, automatic transfer service (ATS)accounts, NOW accounts, share draft accounts, telephone or preauthorized transfer accounts,ineligible acceptances, and obligations issued by affiliates maturing in seven days or less. Nettransaction accounts are total transaction accounts less amounts due from other depositoryinstitutions and less cash items in the process of collection.
For a more detailed description of these deposit types, see Form FR 2900 atwww.federalreserve.gov/boarddocs/reportforms.
2. The amount of net transaction accounts subject to a reserve requirement ratio of zeropercent (the "exemption amount" ) is adjusted each year by statute. The exemption amount isadjusted upward by 80 percent of the previous year's (June 30 to June 30) rate of increase intotal reservable liabilities at all depository institutions. No adjustment is made in the event ofa decrease in such liabilities.
3. The amount of net transaction accounts subject to a reserve requirement ratio of 3percent is the "low reserve tranche." By statute, the upper limit of the low reserve tranche isadjusted each year by 80 percent of the previous year's (June 30 to June 30) rate of increase ordecrease in net transaction accounts held by all depository institutions.
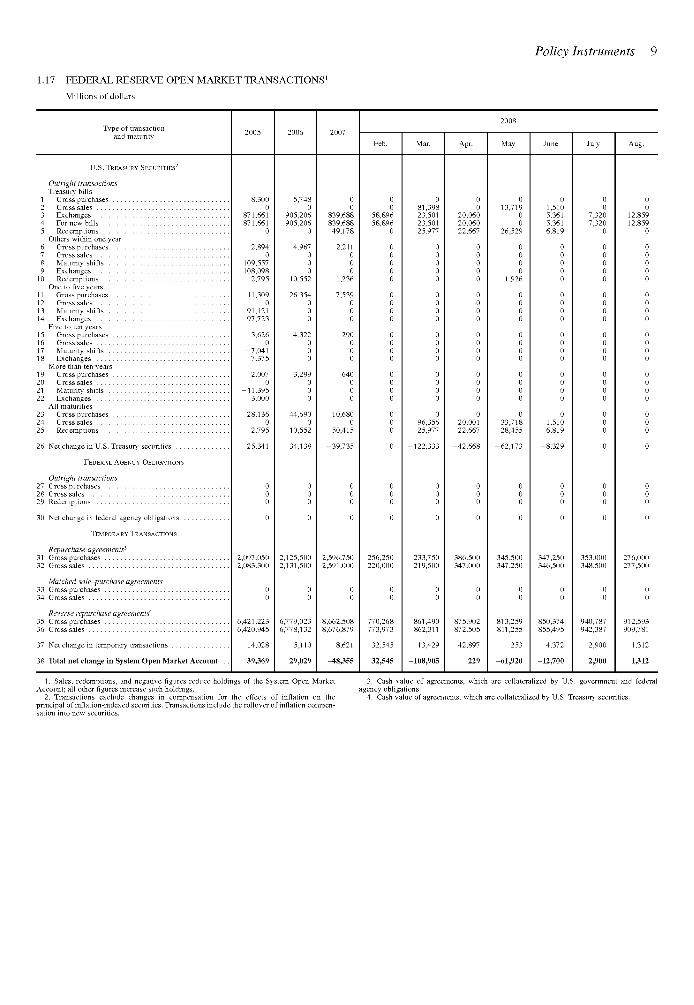
1.17 FEDERAL RESERVE OPEN MARKET TRANSACTIONS1
Millions of dollars
Policy Instruments 9
Type of transactionand maturity
Apr. May July
U.S. TREASURY SECURITIES2
Outright transactionsTreasury bills
1 Gross purchases2 Gross sales3 Exchanges4 For new bills5 Redemptions
Others within one year6 Gross purchases7 Gross sales8 Maturity shifts9 Exchanges
10 RedemptionsOne to five years
11 Gross purchases12 Gross sales13 Maturity shifts14 Exchanges
Five to ten years15 Gross purchases16 Gross sales17 Maturity shifts18 Exchanges
More than ten years19 Gross purchases20 Gross sales21 Maturity shifts22 Exchanges
All maturities23 Gross purchases24 Gross sales25 Redemptions
26 Net change in U.S. Treasury securities
FEDERAL AGENCY OBLIGATIONS
Outright transactionsGross purchasesGross sales
Redemptions
Net change in federal agency obligations . . .
TEMPORARY TRANSACTIONS
Repurchase agreements3
Gross purchasesGross sales
871,661871,661
2,8940
109,557-108,098
2,795
11,3090
-91,12197,723
3,6260
-7,0417,375
2,0070
-11,3953,000
28,1360
2,795
905,206905,206
4,9670
010,552
26,3540
00
3,29900
44,6900
10,552
34,138
2,083,300 2,131,500
Matched sale-purchase agreements33 Gross purchases34 Gross sales
Reverse repurchase agreements*35 Gross purchases36 Gross sales
37 Net change in temporary transactions
38 Total net change in System Open Market Account
6,421,2236,420,945
14,028
39,369
6,779,0236,778,132
-5,110
29,029
00
839,688839,68849,178
2,211000
1,236
7,539000
290000
640000
10,6800
50,415
2,591,000
8,662,5088,676,879
-8,621
^18,355
58,89658,896
256,250220,000
770,268773,973
32,545
32,545
081,39823,50123,50125,977
00000
0000
0000
0000
096,35625,977
233,750219,500
861,490862,311
13,429
-108,905
00
20,06020,06022,667
00000
0000
0000
0000
020,00122,667
-42,668
386,500347,000
875,902872,505
42,897
229
013,719
026,529
01,926
33,71828,455
-62,173
345,500347,250
813,259811,255
253
-61,920
01,5105,3615,3616,819
1,5106,819
-8,329
347,250346,500
850,374855,495
-4,372
-12,700
00
7,3207,320
0
00000
0000
0000
0000
000
353,000348,500
940,787942,387
2,900
2,900
12,85912,859
276,000277,500
912,593909,781
1,312
1,312
1. Sales, redemptions, and negative figures reduce holdings of the System Open MarketAccount; all other figures increase such holdings.
2. Transactions exclude changes in compensation for the effects of inflation on theprincipal of inflation-indexed securities. Transactions include the rollover of inflation compen-sation into new securities.
3. Cash value of agreements, which are collateralized by U.S. government and federalagency obligations.
4. Cash value of agreements, which are collateralized by U.S. Treasury securities.

10 Federal Reserve Bulletin Statistical Supplement • December 2008
1.18 FEDERAL RESERVE BANKS Condition and Federal Reserve Note Statements'
Millions of dollars
Wednesday
Aug. 27 Sept. 3 Sept. 10 Sept. 17 Sept. 24 July Sept.
Consolidated condition statement
ASSETS
1 Gold certificate account2 Special drawing rights certificate account3 Coin4 Securities, repurchase agreements, term auction credit,
and other loans5 Securities held outright6 U.S. Treasury2
7 Bills3
8 Notes and bonds, nominal3
9 Notes and bonds, inflation-indexed3
10 Inflation compensation4
11 Federal agency3
12 Repurchase agreements5
13 Term auction credit14 Other loans15 Net portfolio holdings of Maiden Lane LLC1"16 Items in process of collection17 Bank premises18 Other assets19 Denominated in foreign currencies7
20 All other8
21 Total assets
LIABILITIES
22 Federal Reserve notes, net of F.R. Bank holdings23 Reverse repurchase agreements9
24 Deposits25 Depository institutions26 U.S. Treasury, general account27 U.S. Treasury, supplementary financing account . . . .28 Foreign official29 Other30 Deferred availability cash items31 Other liabilities and accrued dividends10'"
32 Total liabilities
CAPITAL ACCOUNTS
33 Capital paid in34 Surplus
35 Other capital accounts
36 Total capital
MEMO
37 Marketable securities held in custody for foreign officialand international accounts3-12
38 U.S. Treasury39 Federal agency40 Securities lent to dealers41 Overnight facility13
42 Term facility14
43 Federal Reserve notes outstanding44 Less: Notes held by F.R. Banks not
subject to collateralization45 Federal Reserve notes to be collateralized46 Collateral held against Federal Reserve notes47 Gold certificate account48 Special drawing rights certificate account49 U.S. Treasury and agency securities pledged15 . . .50 Other assets pledged
MEMO51 Total U.S. Treasury and agency securities15
52 Less: Face value of securities under reverse repurchaseagreements""
53 U.S. Treasury and agency securitieseligible to be pledged
11,0372,2001,415
759,644479,642479,642
21,740411,73139,832
6,3390
111,000150,00019,00229,247
9262,166
104,84088,17216,668
911,475
795,69443,76824,85019,3774,989
0100385
2,6143,760
870,686
20,18918,5092,091
40,789
2,408,8741,440,551
968,323124,141
6,793117,348
991,668
195,974795,694795,694
11,0372,200
547,720234,737
590,642
42,922
547,720
11,0372,2001,414
757,815479,726479,726
21,740411,731
39,8326,423
0109,000150,000
19,08929,2873,3662,162
99,45784,49214,966
906,738
799,71941,75616,95910,9365,606
0100317
3,7293,772
865,935
20,19118,5112,100
40,803
2,395,3991,436,830
958,569120,790
4,892115,898
11,0372,2001,445
780,089479,782479,782
21,740411,73139,832
6,4800
126,750150,00023,55629,327
1,4322,165
99,50782,17917,328
927,201
797,60244,29638,29532,068
5,4120
522292
2,7253,822
886,740
20,20218,514
1,745
2,394,6601,438,094
956,566117,340
1,441115,899
11,0372,2001,468
849,133479,839479,839
21,740411,731
39,8326,536
098,000
150,000121,29429,367
9082,168
100,24484,66815,576
996,525
796,09446,633
106,04589,102
5,5120
10211,3302,6143,804
955,190
20,21118,5162,608
2,412,9431,451,833
961,111127,325
9,826117,499
1,494
984,920486,578476,578
18,423411,73139,832
6,59310,00086,000
150,000262,34129,407
9682,169
181,718166,494
15,224
1,213,912
799,42290,673
275,07695,301
5,175159,806'
15014,6442,3804,602
1,172,153
20,23618,516
41,759
2,435,9341,469,207
966,727190,53216,059
174,473
11,0372,2001,409
765,770479,240479,240
21,740411,731
39,8325,937
0119,000150,000
17,52929,099
1,0852,167
102,93585,46117,474
915,702
794,90945,42228,90923,2235,256
0'103327
2,4813,450
875,171
19,93518,5012,095
2,391,7531,417,852
973,901137,234
14,086123,148
11,0372,2001,422
766,306479,702479,702
21,740411,731
39,8326,399
0117,500150,000
19,10429,247
7852,173
100,05485,26214,792
913,223
798,15242,61025,24620,1684,681
0'99
2982,2463,717
20,19018,5092,552
2,405,0901,437,380
967,710127,99612,098
115,898
Federal Reserve notes and collateral statement
990,711
190,992799,719799,719
11,0372,200
548,031238,451
588,726
40,694
548,031
989,500
191,897797,602797,602
11,0372,200
563,995220,370
606,532
42,537
563,995
989,956
193,862796,094796,094
11,0372,200
533,638249,220
577,839
44,202
533,638
989,581
190,158799,422799,422
11,0372,200
487,847298,338
572,578
84,731
487,847
990,808
195,899794,909794,909
11,0372,200
553,552228,120
598,240
44,688
553,552
991,160
193,008798,152798,152
11,0372,200
555,319229,597
597,202
41,883
555,319
11,0372,2001,514
1,134,998491,127476,627
18,423411,73139,832
6,64114,50083,000
149,000411,87029,407
2,3632,178
327,007304,495
22,512
1,510,704
801,35977,937
580,935222,05932,988
299,491121
26,2773,3054,969
1,468,505
20,31218,516
3,370
42,198
2,488,6031,519,383
969,220259,24323,699
235,544
989,135
187,777801,359801,359
11,0372,200
499,013289,109
574,127
75,114
499,013
1. Some of the data in this table also appear in the Board's H.4.1 (503) weekly statisticalrelease, which is available at www.federalreserve.gov/releases.
2. Includes securities lent to dealers under the overnight and term securities lendingfacilities.
3. Face value of the securities.4. Compensation that adjusts for the effect of inflation on the original face value of
inflation-indexed securities.5. Cash value of agreements, which are collateralized by U.S. Treasury and federal agency
securities.6. Fair value.7. Includes any exchange-translation assets, which are revalued daily at market exchange
rates.8. Includes special investment account at the Federal Reserve Bank of Chicago in Treasury
bills maturing within ninety days.9. Cash value of agreements, which are collateralized by U.S. Treasury securities.
10. Includes any exchange-translation liabilities, which are revalued daily at marketexchange rates.
11. Includes the liabilities of Maiden Lane LLC to entities other than the Federal ReserveBank of New York, including liabilities that have recourse only to the portfolio holdings ofMaiden Lane LLC.
12. Includes U.S. Treasury STRIPS and other zero coupon bonds at face value.13. Fully collateralized by U.S. Treasury securities.14. Fully collateralized by U.S. Treasury securities, federal agency securities, and other
highly rated debt securities.15. Includes face value of U.S. Treasury and agency securities held outright, compensation
to adjust for the effect of inflation on the original face value of inflation-indexed securities,and cash value of repurchase agreements.
16. Face value of agreements, which are fully collateralized by U.S. Treasury securities.

1.19 FEDERAL RESERVE BANKS Maturity Distribution of Loans and Securities
Millions of dollars
Federal Reserve Banks 11
Type of holding and remaining maturity
Wednesday
Aug. 27 Sept. 3 Sept. 10 Sept. 17 Sept. 24 July Sept.
Term auction credit
2 Within 15 days3 16 days to 90 days .
4 Other loans'
5 Within 15 days6 16 days to 90 days7 91 days to 1 year8 Over 1 year to 5 years
9 Total U.S. Treasury securities2
10 Within 15 days11 16 days to 90 days12 91 days to 1 year13 Over 1 year to 5 years14 Over 5 years to 10 years15 Over 10 years
16 Total federal agency securities3
17 Within 15 days18 16 days to 90 days19 91 days to 1 year20 Over 1 year to 5 years21 Over 5 years to 10 years22 Over 10 years
23 Total repurchase agreements3
24 Within 15 days
25 16 days to 90 days
26 Total reverse repurchase agreements3
27 Within 15 days28 16 days to 90 days
150,000
125,00025.000
19,002
3.87415,128
00
479,642
18,45528,21470,320
169,53991,834
101,280
0
00000
111,000
71,00040,000
43,768
43,7680
150,000
50,000100,000
19,089
4,23814,851
00
479,726
14,85131,65369,268
170,78991,851
101,314
0
00000
109,000
69,00040,000
41,756
41,756
125,00025,000
23,556
8,53915,017
0
479,782
14,95531,54969,272
170,80791,863
101,337
0
000000
126,750
86,75040,000
44,296
44,2960
75,00075,000
121,294
101,23720,057
0
479,839
16,35830,00168,101
170,67693,341
101,361
0
000000
98,000
58,00040,000
46,633
46,6330
150,000
100,00050,000
262,341
135,24877,174
5,35344,566
476,578
19,32623,71668,105
170,69493,353
101,384
10,000
3955,6323,973
000
86,000
46,00040,000
90,673
90,673
150,000
75,00075,000
17,529
3,07414,456
0
479,240
15,72228,40272,326
175,53589,86797,387
0
000000
119,000
79,00040,000
45,4220
50,000100,000
19,104
3,94315,161
0
479,702
14,57032,09970,324
169,55891,846
101,304
0
000000
117,500
77,50040,000
42,610
42,6100
149,000
24,000125,000
411,870
209,415120,253
21,12361,080
476,627
11,04126,62770,092
174,10093,363
101,404
14,500
3959,1784,927
000
83,000
63,00020,000
77,937
77,937
NOTE: Components may not sum to totals because of rounding.1. Excludes the loan from the Federal Reserve Bank of New York to Maiden Lane LLC
that was eliminated when preparing that Bank's statement of condition consistent withconsolidation under generally accepted accounting principles. The loan to Maiden Lane LLCis designed to be repaid from the orderly liquidation of Maiden Lane LLC's portfolioholdings and does not have a fixed amortization schedule.
2. Includes the original face value of inflation-indexed securities and compensation thatadjusts for the effect of inflation on the original face value of such securities.
3. Cash value of agreements.

12 Federal Reserve Bulletin Statistical Supplement • December 2008
1.20 AGGREGATE RESERVES OF DEPOSITORY INSTITUTIONS AND MONETARY BASE1
Billions of dollars, averages of daily figures
2004Dec.
2005Dec.
2006Dec.
2007Dec.
Apr. May July Aug. Sept.
Seasonally adjusted
ADJUSTED FORCHANGES IN RESERVE REQUIREMENTS2
1 Total reserves3
2 Nonborrowed reserves4
3 Required reserves4 Monetary base5
5 Total reserves'"6 Nonborrowed reserves .7 Required reserves7 . . . .8 Monetary bases
46.5546.4944.64
759.17
45.1444.9743.24
787.30
43.3443.1541.48
811.73
42.68'27.2440.91
823.35
42.80-17.35
41.08822.56
44.29-50.23
41.31826.99
43.56-91.85
41.72824.41
44.13-111.65
42.12826.46
43.37-127.91
41.10832.53
43.35-122.32
41.37838.14
44.59-123.49
42.60841.71
102.80-187.31
42.75903.52
Not seasonally adjusted
NOT ADJUSTED FORCHANGES IN RESERVE REQUIREMENTS9
9 Total reserves10
10 Nonborrowed reserves11 Required reserves12 Monetary base"13 Excess reserves'2
14 Borrowings from the Federal Reserve
46.5246.4644.61
764.66
46.8546.7944.94
774.771.91
.06
45.1444.9743.24
793.38
45.3845.2243.48
802.301.90
.17
43.3643.1741.50
818.40
43.2843.0941.42
825.291.86
.19
42.7227.2940.95
829.84
42.7027.2740.93
836.431.77
15.43
42.78-17.38
41.05821.92
42.78-17.38
41.05828.69
1.7260.16
42.70-51.82
39.72825.56
42.71-51.82
39.73832.36
2.9894.52
43.49-91.92
41.65823.38
43.51-91.90
41.66830.49
1.84135.41
45.08-110.70
43.07826.88
45.11-110.67
43.10833.97
2.01155.78
43.90-127.38
41.63831.98
43.93-127.35
41.66839.09
2.27171.28
44.08-121.59
42.10839.22
44.12-121.54
42.15846.46
1.98165.66
44.07-124.01
42.09840.16
44.13-123.94
42.15847.30
1.99168.08
102.52-187.58
42.47900.64
102.58-187.52
42.53908.0360.05
290.11
1. Latest monthly and biweekly figures are available from the Board's H.3 (502) weeklystatistical release, available at www.federalreserve.gov/releases. Historical data starting in1959 and estimates of the effect on required reserves of changes in reserve requirements areavailable from the Monetary and Reserve Analysis Section, Division of Monetary Affairs,Board of Governors of the Federal Reserve System, Washington, DC 20551.
2. Figures reflect adjustments for discontinuities, or "breaks," associated with regulatorychanges in reserve requirements. (See also table 1.10.)
3. Seasonally adjusted, break-adjusted total reserves equal seasonally adjusted, break-adjusted required reserves (line 3) plus excess reserves (line 13).
4. Seasonally adjusted, break-adjusted nonborrowed reserves equal seasonally adjusted,break-adjusted total reserves (line 1) less total borrowings of depository institutions from theFederal Reserve (line 14).
5. The seasonally adjusted, break-adjusted monetary base consists of (1) seasonallyadjusted, break-adjusted total reserves (line 1), plus (2) the seasonally adjusted currencycomponent of the money stock, plus (3) (for all quarterly reporters on the "Report ofTransaction Accounts, Other Deposits and Vault Cash" and for all those weekly reporterswhose vault cash exceeds their required reserves) the seasonally adjusted, break-adjusteddifference between current vault cash and the amount applied to satisfy current reserverequirements.
6. Break-adjusted total reserves equal break-adjusted required reserves (line 7) plus excessreserves (line 13).
7. To adjust required reserves for discontinuities that are due to regulatory changes inreserve requirements, a multiplicative procedure is used to estimate what required reserves
would have been in past periods had current reserve requirements been in effect. Break-adjusted required reserves include required reserves against transactions deposits and nonper-sonal time and savings deposits (but not reservable nondeposit liabilities).
8. The break-adjusted monetary base equals (1) break-adjusted total reserves (line 5), plus(2) the (unadjusted) currency component of the money stock, plus (3) (for all quarterlyreporters on the "Report of Transaction Accounts, Other Deposits and Vault Cash" and for allthose weekly reporters whose vault cash exceeds their required reserves) the break-adjusteddifference between current vault cash and the amount applied to satisfy current reserverequirements.
9. Reflects actual reserve requirements, including those on nondeposit liabilities, with noadjustments to eliminate the effects of discontinuities associated with regulatory changes inreserve requirements.
10. Reserve balances with Federal Reserve Banks plus vault cash used to satisfy reserverequirements.
11. The monetary base, not break-adjusted and not seasonally adjusted, consists of (1) totalreserves (line 9), plus (2) required clearing balances and adjustments to compensate for floatat Federal Reserve Banks, plus (3) the currency component of the money stock, plus (4) (forall quarterly reporters on the "Report of Transaction Accounts, Other Deposits and VaultCash" and for all those weekly reporters whose vault cash exceeds their required reserves)the difference between current vault cash and the amount applied to satisfy current reserverequirements. Since February 1984, currency and vault cash figures have been measured overthe computation periods ending on Mondays.
12. Unadjusted total reserves (line 9) less unadjusted required reserves (line 11).
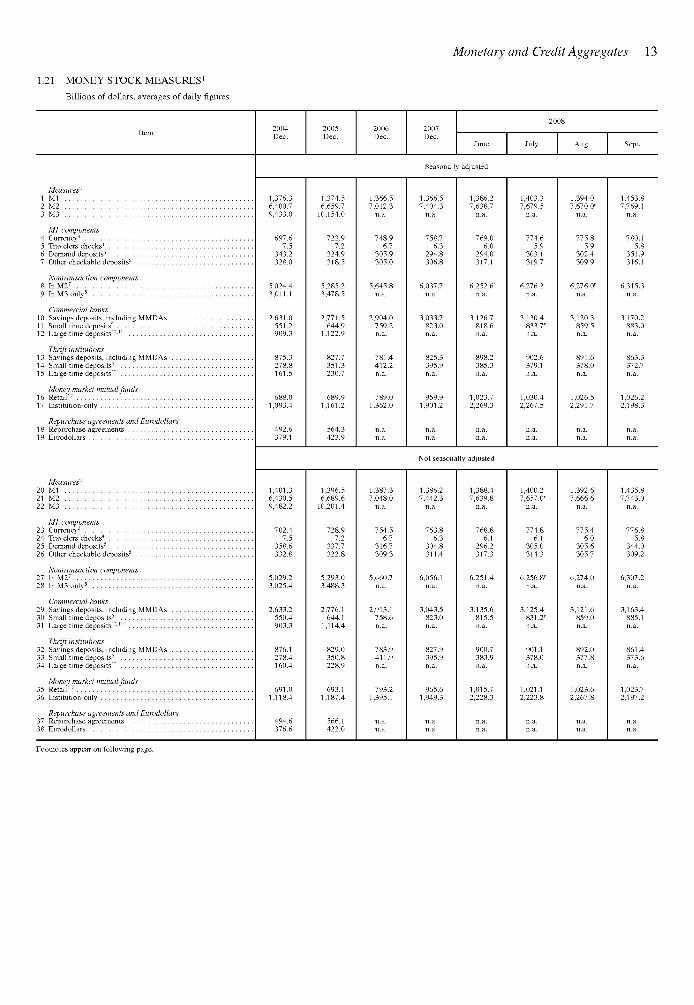
1.21 MONEY STOCK MEASURES1
Billions of dollars, averages of daily figures
Monetary and Credit Aggregates 13
2004Dec.
2005Dec.
2006Dec.
2007Dec.
Aug. Sept.
Seasonally adjusted
Measures2
1 Ml2 M23 M3
Ml components4 Currency3
5 Travelers checks4
6 Demand deposits5
7 Other checkable deposits6
Nontransaction components8 In M27
9 In M3 onlys
Commercial banks10 Savings deposits, including MMDAs . . .11 Small time deposits9
12 Large time deposits10-"
Thrift institutions13 Savings deposits, including MMDAs . . .14 Small time deposits9
15 Large time deposits10
Money market mutual funds16 Retail12
17 Institution-only
Repurchase agreements and Eurodollars18 Repurchase agreements19 Eurodollars
Measures2
20 Ml21 M222 M3
Ml components23 Currency3
24 Travelers checks4
25 Demand deposits5
26 Other checkable deposits6
Nontransaction components27 In M27
28 In M3 onlys
Commercial banks29 Savings deposits, including MMDAs . . .30 Small time deposits9
31 Large time deposits10-"
Thrift institutions32 Savings deposits, including MMDAs . . .33 Small time deposits9
34 Large time deposits10
Money market mutual funds35 Retail12
36 Institution-only
Repurchase agreements and Eurodollars37 Repurchase agreements38 Eurodollars
1,376.36,400.79,433.0
697.67.5
343.2328.0
5,024.43,011.1
2,631.0551.2909.3
875.3278.8161.5
688.01,093.4
492.6379.1
1,374.56,659.7
10,154.0
723.97.2
324.9318.5
5,285.23,478.5
2,771.5644.9
1,122.9
827.7351.3230.7
689.91,161.2
564.3423.9
1,366.57,012.3
n.a.
748.96.7
305.9305.0
5,645.8n.a.
2,904.0759.2n.a.
781.4412.2n.a.
789.01,362.0
n.a.n.a.
1,366.57,404.3
n .a.
758.76.3
294.8306.8
6,037.7n .a.
3,033.7823.0n .a.
825.3395.9n .a.
959.91,901.2
n .a.n .a.
1,386.27,638.7
n.a.
769.06.0
294.0317.1
6,252.6'n.a.
3,126.7818.6n.a.
898.2385.3n.a.
1,023.72,269.3
n.a.n.a.
1,403.37,679.5
n.a.
774.65.9
303.1319.7
6,276.2n.a.
3,130.4833.7'n.a.
902.6379.1n.a.
1,030.42,267.5
n.a.n.a.
1,394.07,670.0'
n.a.
775.85.9
302.4309.9
6,276.0'n.a.
3,120.3859.5n.a.
891.6378.0n.a.
1,026.52,291.7
n.a.n.a.
1,453.87,769.1
n.a.
780.15.8
351.9316.1
6,315.3n.a.
3,170.2883.0n.a.
863.3372.7n.a.
1,026.22,198.3
n.a.n.a.
Not seasonally adjusted
1,401.36,430.59,482.2
702.47.5
358.6332.8
5,029.23,025.4
2,633.2550.4903.3
876.1278.4160.4
691.01,118.4
494.6376.6
1,396.56,689.6
10,201.4
728.97.2
337.7322.8
5,293.03,488.3
2,776.1644.1
1,114.4
829.0350.8228.9
693.11,187.4
566.1422.0
1,387.37,048.0
n.a.
754.56.7
316.7309.3
5,660.7n.a.
2,913.1758.6n.a.
783.9411.9n.a.
793.21,395.1
n.a.n.a.
1,386.27,442.3
763.86.3
304.8311.4
6,056.1
3,043.5823.0
827.9395.9
965.61,949.3
1,388.47,639.8'
768.86.1
296.2317.3
6,251.4
3,135.6815.5
900.7383.9
1,015.72,228.3
1,400.27,657.0'
n.a.
774.86.1
305.0314.3
6,256.8'n.a.
3,125.4831.2'n.a.
901.1378.0n.a.
1,021.12,223.8
n.a.n.a.
1,392.67,666.6
775.46.0
305.6305.7
6,274.0n.a.
3,121.6859.0
892.0377.8n.a.
1,023.62,267.8
1,435.87,743.0
776.85.8
344.0309.2
6,307.2
3,163.4885.1
861.4373.6
1,023.72,197.2
Footnotes appeal on following page.

14 Federal Reserve Bulletin Statistical Supplement • December 2008
NOTES TO TABLE 1.21NOTE: In March 2006, the Board ceased publication of the M3 monetary aggregate and all
the components of non-M2 M3 (large time deposits, repurchase agreements, and Eurodollars)except for institutional money funds. Measures of large time deposits will continue to bepublished by the Board in the Flow of Funds Accounts (Z.I release) on a quarterly basis andin the H.8 release on a weekly basis (for commercial banks).
1. Latest monthly and weekly figures are available from the Board's H.6 (508) weeklystatistical release, available at www.federalreserve.gov/releases. Historical data starting in1959 are available from the Monetary and Reserves Analysis Section, Division of MonetaryAffairs, Board of Governors of the Federal Reserve System, Washington, DC 20551.
2. Composition of the money stock measures is as follows:Ml consists of (1) currency outside the U.S. Treasury, Federal Reserve Banks, and the
vaults of depository institutions; (2) travelers checks ofnonbank issuers; (3) demand depositsat commercial banks (excluding those amounts held by depository institutions, the U.S.government, and foreign banks and official institutions) less cash items in the process ofcollection and Federal Reserve float; and (4) other checkable deposits (OCDs), consisting ofnegotiable order of withdrawal (NOW) and automatic transfer service (ATS) accounts atdepository institutions, credit union share draft accounts, and demand deposits at thriftinstitutions. Seasonally adjusted Ml is constructed by summing currency, travelers checks,demand deposits, and OCDs, each seasonally adjusted separately.
M2 consists of Ml plus (1) savings deposits (including money market deposit accounts);(2) small-denomination time deposits (time deposits in amounts of less than $100,000), lessindividual retirement account (IRA) and Keogh balances at depository institutions; and (3)balances in retail money market mutual funds, less IRA and Keogh balances at money marketmutual funds. Seasonally adjusted M2 is constructed by summing savings deposits, small-denomination time deposits, and retail money fund balances, each seasonally adjustedseparately, and adding this result to seasonally adjusted Ml.
M3 consists of M2 plus (1) balances in institutional money market mutual funds; (2)large-denomination time deposits (time deposits in amounts of $100,000 or more); (3)repurchase agreement (RP) liabilities of depository institutions, in denominations of $100,000or more, on U.S. government and federal agency securities; and (4) Eurodollars held by U.S.addressees at foreign branches of U.S. banks worldwide and at all banking offices in the
United Kingdom and Canada. Large-denomination time deposits, RPs, and Eurodollarsexclude those amounts held by depository institutions, the U.S. government, foreign banksand official institutions, and money market funds. Seasonally adjusted M3 is constructed bysumming institutional money funds, large-denomination time deposits, RPs, and Eurodollars,each seasonally adjusted separately, and adding the result to seasonally adjusted M2.
3. Currency outside the U.S. Treasury, Federal Reserve Banks, and vaults of depositoryinstitutions.
4. Outstanding amount of U.S. do liar-denominated travelers checks ofnonbank issuers.Travelers checks issued by depository institutions are included in demand deposits.
5. Demand deposits at domestically chartered commercial banks, U.S. branches andagencies of foreign banks, and Edge Act corporations (excluding those amounts held bydepository institutions, the U.S. government, and foreign banks and official institutions) lesscash items in the process of collection and Federal Reserve float.
6. Consists of NOW and ATS account balances at all depository institutions, credit unionshare draft account balances, and demand deposits at thrift institutions.
7. Sum of (1) savings deposits (including MMDAs), (2) small time deposits, and (3) retailmoney fund balances.
8. Sum of (1) large time deposits, (2) institution-only money fund balances, (3) RPs, and(4) Eurodollars, each seasonally adjusted.
9. Small time deposits are those issued in amounts of less than $100,000. All IRAs andKeogh accounts at commercial banks and thrift institutions are subtracted from small timedeposits.
10. Large time deposits are those issued in amounts of $100,000 or more, excluding thosebooked at international banking facilities.
11. Large time deposits at domestically chartered commercial banks, U.S. branches andagencies of foreign banks, and Edge Act corporations, excluding those amounts held bydepository institutions, the U.S. government, foreign banks and official institutions, andmoney market mutual funds.
12. IRA and Keogh account balances at money market mutual funds are subtracted fromretail money funds.

Commercial Banking Institutions—Assets and Liabilities 15
1.26 COMMERCIAL BANKS IN THE UNITED STATES Assets and Liabilities'
A. All commercial banks
Billions of dollars
Account
Assets1 Bank credit2 Securities in bank credit3 Treasury and Agency securities2 . .4 Other securities5 Loans and leases in bank credit3 . . . .6 Commercial and industrial7 Real estate8 Revolving home equity9 Other
10 Consumer11 Security4
12 Other loans and leases13 Interbank loans14 Cash assets5
15 Other assets'"
16 Total assets7
Liabilities17 Deposits18 Transaction19 Nontransaction20 Large time21 Other22 Borrowings23 From banks in the U.S24 From others25 Net due to related foreign offices26 Other liabilities
27 Total liabilities
28 Residual (assets less liabilities)5
Assets29 Bank credit30 Securities in bank credit31 Treasury andAgency securities2 . .32 Other securities33 Loans and leases in bank credit3 . . . .34 Commercial and industrial35 Real estate36 Revolving home equity37 Other38 Consumer39 Credit cards and related plans . .40 Other41 Security4
42 Other loans and leases43 Interbank loans44 Cash assets5
45 Other assets'"
46 Total assets7
Liabilities47 Deposits48 Transaction49 Nontransaction50 Large time51 Other52 Borrowings53 From banks in the U.S54 From others55 Net due to related foreign offices56 Other liabilities
57 Total liabilities
58 Residual (assets less liabilities)5
2007
Nov.
9,180.32,464.51,129.01,335.56,715.8'1,408.5'3,562.3'
478.53,083.7'
795.9282.0667.1421.5302.3953.5
10,784.2
6,637.8610.9
6,027.02 026 64,000.42 221 4
456.71,764.7
85.9665.9
9,611.1
1,173.1
Monthly averages
2008
May'
9,403.32,481.21,096.01,385.36,922.01,496.33,657.2
512.23,145.1
827.1292.8648.5446.6306.5987.9
11,047.3
6,887.0613.4
6,273.62 112 84,160.92 319 1
483.91,835.2-23.6693.4
9,875.9
1,171.3
June'
9,374.52,471.81,112.81,359.06,902.71,503.13,648.2
518.43,129.9
831.7280.8638.8453.1300.0
1,003.9
11,030.6
6,909.6603.6
6,306.02 125 54,180.42,316.9
483.41,833.5-18.5674.5
9,882.5
1,148.2
July'
9,399.02,494.41,114.21,380.26,904.61,508.53,627.0
523.53,103.5
839.3295.0634.8437.7296.6
1,019.0
11,044.8
6,884.1621.0
6,263.22 131 04,132.12,340.5
479.61,860.9-46.9674.5
9,852.2
1,192.6
Aug.'
9,415.22,481.11,127.71,353.46,934.11,508.33,645.9
526.23,119.7
845.0305.5629.3434.2297.8
1,018.5
11,056.6
6,914.3600.2
6,314.02 129 94,184.12,357.2
477.01,880.1-92.2673.3
9,852.6
1,204.0
Sept.'
Seasonall
9,575.22,537.11,153.81,383.37,038.11,536.13,666.5
540.43,126.1
852.0331.0652.4462.6368.5
1,042.0
11,335.0
7,072.5640.2
6,432.32,161.04,271.32,398.6
478.61,920.0-61.8715.1
10,124.4
1,210.6
Oct.'
1 adjusted
9,957.12,719.41,227.01,492.47,237.71,600.13,791.4
577.83,213.6
870.7302.6672.9444.6576.5
1,087.6
11,943.3
7,125.1679.4
6,445.72,065.54,380.32,619.8
458.52,161.3
180.2805.9
10,731.0
1,212.3
Nov.
9,897.92,725.81,261.21,464.67,172.11,596.43,784.3
580.53,203.8
876.3269.7645.4344.8851.5
1,131.9
12,099.9
7,063.6707.4
6,356.21,944.14,412.12,601.3
404.62,196.7
389.2840.6
10,894.8
1,205.1
Wednesd ay figures
2008
Nov. 5
9,866.32,692.61,270.81,421.87,173.71,596.63,776.0
578.23,197.7
871.4273.3656.4382.0784.8
1,095.0
12,002.4
7,084.5730.9
6,353.51,986.74,366.82,589.5
413.72,175.8
337.6787.9
10,799.6
1,202.8
Nov. 12
9,906.32,728.21,278.81,449.47,178.11,604.13,785.9
578.63 207.3
872.2263.9652.0343.8863.3
1,108.9
12,095.9
7,077.5702.1
6,375.41,949.74,425.72,655.9
409.52,246.4
387.9799.4
10,920.7
1,175.2
Nov. 19
9,859.12,707.41,241.91,465.67,151.71,589.23,777.4
580.03,197.5
875.7276.2633.2334.5858.5
1,146.2
12,072.1
6,991.2681.9
6,309.41,930.84,378.62,609.7
401.42,208.3
430.0852.8
10,883.7
1,188.3
Nov. 26
9,904.12,720.91,252.31,468.67,183.21,599.63,790.3
582.23,208.1
880.9271.1641.2324.4866.3
1,151.7
12,121.2
7,101.7700.1
6,401.61,933.74,467.92,565.1
401.72,163.4
378.5875.3
10,920.6
1,200.6
Not seasonally adjusted
9 225 9'2,468.71,123.11,345.66,757.2'1,409.7'3,600.6'
482.43,118.2'
796.3343.0453.3284.1666.4433.7307.4950.5
10,844.7
6,676.3613.9
6,062.42 032 84,029.62 221 5
462.21,759.3
95.1682.8
9,675.7
1,169.0
9 385 72,506.41,110.01,396.46,879.31,494.53,628.0
508.43,119.6
822.8340.8482.0293.9640.1434.0304.1985.1
11,011.7
6,862.0609.3
6,252.72 130 34,122.42 338 7
481.01,857.7-64.5699.3
9,835.5
1,176.2
9,340.82,485.01,123.51,361.56,855.81,497.23,616.8
514.53,102.3
826.9341.8485.2280.9634.0435.8296.3999.2
10,971.2
6,864.5602.6
6,261.92 12574,136.22,318.3
479.31,839.0-52.3667.3
9,797.8
1,173.4
9,329.02,476.41,118.51,357.86,852.61,497.43,611.1
521.63,089.5
833.0347.1485.8281.9629.3422.1292.4
1,016.1
10,951.8
6,831.0605.4
6,225.62 093 34,132.32,307.1
467.31,839.8-23.3666.1
9,780.9
1,170.9
9,348.82,465.51,133.01,332.66,883.31,501.23,615.3
526.03,089.3
843.7355.4488.3294.9628.2426.9285.8
1,014.8
10,967.0
6,844.2589.9
6,254.32 102 64,151.62,343.1
469.91,873.2-66.3671.4
9,792.4
1,174.6
9,553.62,516.41,146.21,370.27,037.21,533.53,660.9
540.63,120.2
854.0361.6492.3327.3661.5460.6366.1
1,050.6
11,317.4
7,052.3631.0
6,421.32,148.04,273.22,414.2
477.91,936.3-47.9712.7
10,131.2
1,186.1
9,964.42,702.11,212.51,489.67,262.31,600.63,822.8
580.73,242.1
865.9371.9494.0298.6674.3443.7575.2
1,096.9
11,957.9
7,145.1667.4
6,477.72,075.34,402.42,617.4
454.42,163.1
195.2811.8
10,769.6
1,188.3
9,953.12,735.31,257.01,478.37,217.81,598.93,827.1
585.53,241.6
876.7383.5493.2268.8646.3351.6867.5
1,130.4
12,177.1
7,117.4711.1
6,406.31,957.44,448.92,600.9
408.02,192.9
399.0862.7
10,980.0
1,197.2
9,931.22,707.91,275.41,432.57,223.31,598.63,825.7
582.93,242.9
868.4376.4492.1272.5658.0381.6776.3
1,095.1
12,058.7
7,135.3668.2
6,467.12,003.04,464.22,604.3
412.62,191.7
329.8811.8
10,881.2
1,177.5
9,944.92,727.21,271.11,456.27,217.71,599.23,833.1
583.73,249.4
872.0380.2491.9267.4646.0349.9887.9
1,115.2
12,172.4
7,144.6673.1
6,471.41,969.34,502.12,647.9
411.32,236.6
383.3813.8
10,989.6
1,182.8
9,910.72,713.71,237.51,476.17,197.01,595.63,815.4
585.33,230.1
878.3386.2492.1269.5638.3345.1886.9
1,136.8
12,154.5
7,062.4706.3
6,356.11,943.74,412.42,598.7
405.12,193.7
433.2869.4
10,963.8
1,190.7
9,967.72,736.11,246.21,490.07,231.51,605.43,829.3
587.53,241.8
882.1386.7495.4270.4644.2330.8878.1
1,151.2
12,204.8
7,115.0770.7
6,344.31,939.84,404.52,576.1
408.32,167.8
420.9907.4
11,019.4
1,185.4
Footnotes appear on p. 21.

16 Federal Reserve Bulletin Statistical Supplement • December 2008
1.26 COMMERCIAL BANKS IN THE UNITED STATES Assets and Liabilities' —Continued
B. Domestically chartered commercial banks
Billions of dollars
Account
Assets1 Bank credit2 Securities in bank credit3 Treasury and Agency securities2 . .4 Other securities5 Loans and leases in bank credit3 . . . .6 Commercial and industrial7 Real estate8 Revolving home equity9 Other
10 Consumer11 Security4
12 Other loans and leases13 Interbank loans14 Cash assets5
15 Other assets'"
16 Total assets7
Liabilities17 Deposits18 Transaction19 Nontransaction20 Large time21 Other22 Borrowings23 From banks in the U.S24 From others25 Net due to related foreign offices26 Other liabilities
27 Total liabilities
28 Residual (assets less liabilities)5
Assets29 Bank credit30 Securities in bank credit31 Treasury andAgency securities2 . .32 Other securities33 Loans and leases in bank credit3 . . . .34 Commercial and industrial35 Real estate36 Revolving home equity37 Other38 Other residential39 Commercial40 Consumer41 Credit cards and related plans . .42 Other43 Security4
44 Other loans and leases45 Interbank loans46 Cash assets5
47 Other assets'"
48 Total assets7
Liabilities49 Deposits50 Transaction51 Nontransaction52 Large time53 Other54 Borrowings55 From banks in the U.S56 From others57 Net due to related foreign offices58 Other liabilities
59 Total liabilities
60 Residual (assets less liabilities)5
2007
Nov.
8,026.1'1,990.31,036.3
954.06,035.8'1,133.5'3,526.6'
478.53,048.1'
795.9141.4438.5'342.5245.5904.5
9,445.2r
5,620.3597.8
5,022.51,024.33,998.21,634.7
396.01,238.7
482.0537.2
8,274.2
1,171.0'
Monthly averages
2008
May'
8,268.22,014.41,004.11,010.36,253.71,185.43,616.5
512.23,104.3
827.1189.0435.8371.6248.4938.6
9,729.8
5,774.3596.4
5,177.91,021.44,156.51,711.7
412.01,299.7
527.7547.6
8,561.2
1,168.6
June'
8,253.02,014.61,021.2
993.46,238.41,189.93,606.1
518.43,087.8
831.7180.4430.2384.7240.4947.6
9,724.8
5,784.9586.8
5,198.11,022.14,176.01,714.0
413.71,300.3
546.2534.3
8,579.4
1,145.4
July'
8,276.42,026.41,020.51,005.96,250.01,194.03,584.2
523.53,060.7
839.3194.7437.7372.0240.5970.5
9,751.9
5,763.3603.8
5,159.51,030.54,128.91,735.4
406.71,328.7
529.7537.3
8,565.7
1,186.1
Aug.'
8,291.12,016.61,040.9
975.66,274.51,191.43,601.7
526.23,075.6
845.0204.8431.6368.2244.7975.5
9,770.3
5,786.7583.7
5,203.01,023.44,179.61,753.6
409.61,344.0
509.8532.8
8,582.9
1,187.3
Sept.'
Seasonall
8,456.52,082.31,070.91,011.56,374.21,209.83,623.5
540.43,083.1
852.0241.3447.6394.4307.7995.3
10,040.7
5,969.6621.1
5,348.61,082.24,266.31,791.6
394.61,397.0
506.3567.0
8,834.5
1,206.2
Oct.'
1 adjusted
8,804.22,244.21,151.41,092.86,560.01,249.33,750.6
577.83,172.8
870.7230.6458.8383.8446.5
1,027.0
10,538.9
6,194.5657.0
5,537.51,160.34,377.22,000.9
400.61,600.3
512.8622.5
9,330.7
1,208.2
Nov.
8,779.02,261.71,177.81,083.96,517.31,243.53,745.2
580.53,164.8
876.3213.1439.2298.4577.8
1,077.6
10,606.5
6,201.4689.0
5,512.41,104.14,408.31,993.9
364.81,629.2
556.6654.8
9,406.8
1,199.7
Wednesd ay figures
2008
Nov. 5
8,746.12,232.31,184.51,047.76,513.81,243.93,737.1
578.23,158.9
871.4213.2448.2339.0541.4
1,035.0
10,536.0
6,181.4712.4
5,469.01,104.94,364.11,996.8
377.91,618.9
556.7607.3
9,342.3
1,193.7
Nov. 12
8,764.92,249.81,191.71,058.16,515.01,250.53,746.8
578.63,168.2
872.2205.8439.7300.0607.0
1,056.3
10,602.0
6,213.2683.8
5,529.41,106.44,423.02,041.0
370.31,670.7
555.6619.6
9,429.5
1,172.5
Nov. 19
8,734.82,233.81,160.91,072.96,501.01,238.13,738.6
580.03,158.6
875.7217.5431.1284.3544.4
1,091.6
10,529.1
6,130.3662.5
5,467.81,091.94,375.91,981.8
365.21,616.6
563.6661.6
9,337.3
1,191.8
Nov. 26
8,807.52,273.21,172.21,101.06,534.31,246.13,751.0
582.23,168.8
880.9218.0438.2275.4593.1
1,099.7
10,650.4
6,261.0682.5
5,578.51,116.64,461.91,968.6
355.01,613.6
543.3686.6
9,459.5
1,190.9
Not seasonally adjusted
8,063.2'1,988.41,029.9
958.56,074.81,134.9'3,564.1'
482.43,081.7'1,519.81,561.9'
796.3343.0453.3139.7439.7349.9249.7903.1
9,493.1
5,659.3601.2
5,058.21,030.04,028.21,635.9
398.91,237.0
478.5552.4
8,326.1
1,167.0
8,255.72,036.41,017.91,018.66,219.21,187.03,586.9
508.43,078.51,464.61,613.9
822.8340.8482.0191.5431.1361.7247.3934.7
9,702.2
5,725.0592.5
5,132.51,014.54,118.11,721.4
413.21,308.2
532.8550.1
8,529.3
1,172.8
8,227.12,026.51,032.5
993.96,200.61,187.43,575.1
514.53,060.71,438.91,621.8
826.9341.8485.2181.8429.3370.6237.4941.8
9,676.1
5,730.6586.1
5,144.61,012.84,131.71,712.7
411.61,301.0
533.8529.0
8,506.1
1,170.0
8,225.22,016.41,026.5
989.96,208.81,186.93,568.9
521.63,047.31,422.71,624.5
833.0347.1485.8184.8435.1357.9236.1967.9
9,679.3
5,735.7588.6
5,147.21,019.44,127.81,712.7
399.21,313.5
529.9533.4
8,511.7
1,167.5
8,238.32,006.71,045.1
961.56,231.71,186.03,572.9
526.03,046.91,418.61,628.3
843.7355.4488.3196.9432.2362.5231.9971.8
9,695.2
5,733.1573.6
5,159.51,012.54,147.01,752.1
404.51,347.6
507.0531.8
8,524.0
1,171.2
8,443.12,066.11,062.41,003.76,377.01,207.23,618.0
540.63,077.41,434.01,643.4
854.0361.6492.3240.5457.2391.2303.4
1,002.5
10,026.8
5,955.3612.0
5,343.31,074.84,268.51,827.6
395.21,432.4
495.2565.9
8,844.0
1,182.8
8,813.52,228.81,136.31,092.56,584.81,251.03,781.0
580.73,200.31,511.21,689.1
865.9371.9494.0226.6460.2381.0443.0
1,037.9
10,553.3
6,213.2645.6
5,567.61,168.04,399.62,019.8
399.01,620.7
508.9628.9
9,370.8
1,182.5
8,826.32,265.11,173.31,091.86,561.21,245.83,787.2
585.53,201.71,506.81,694.9
876.7383.5493.2210.3441.2302.9588.6
1,077.8
10,670.3
6,252.2693.2
5,559.01,113.64,445.51,996.8
367.21,629.6
554.2674.8
9,478.1
1,192.2
8,804.12,241.01,188.91,052.16,563.21,247.03,785.7
582.93,202.81,511.51,691.3
868.4376.4492.1211.5450.5336.5528.4
1,037.4
10,581.0
6,232.4650.5
5,581.81,120.14,461.82,015.3
377.41,637.9
534.6627.3
9,409.5
1,171.5
8,802.42,245.11,183.81,061.36,557.31,247.93,793.2
583.73,209.51,517.61,691.9
872.0380.2491.9207.4436.7304.4622.6
1,063.3
10,667.3
6,272.4655.2
5,617.21,117.44,499.82,040.5
372.51,668.0
544.0633.6
9,490.5
1,176.8
8,782.02,236.31,156.91,079.56,545.71,243.73,775.9
585.33,190.61,495.61,695.0
878.3386.2492.1210.1437.7294.6568.0
1,086.6
10,606.2
6,199.5687.9
5,511.71,101.64,410.01,983.2
365.11,618.0
558.7680.2
9,421.6
1,184.6
8,855.22,279.81,165.61,114.26,575.41,249.23,789.4
587.53,201.81,503.41,698.4
882.1386.7495.4213.7441.0278.1599.5
1,099.6
10,709.4
6,269.3752.8
5,516.61,117.44,399.11,974.5
361.91,612.6
568.3714.9
9,527.1
1,182.3
Footnotes appear on p. 21.

Commercial Banking Institutions—Assets and Liabilities 17
1.26 COMMERCIAL BANKS IN THE UNITED STATES Assets and Liabilities' —Continued
C. Large domestically chartered commercial banks
Billions of dollars
Account
Assets1 Bank credit2 Securities in bank credit3 Treasury and Agency securities2 . .4 Trading account5 Investment account6 Mortgage-backed7 Other8 Other securities9 Trading account
10 Investment account11 State and local government . .12 Other13 Loans and leases in bank credit3 . . . .14 Commercial and industrial15 Real estate16 Revolving home equity17 Other18 Other residential19 Commercial20 Consumer21 Security4
22 Federal funds sold to andrepurchase agreementswith broker-dealers
23 Other24 Federal funds sold to and
repurchase agreements withothers
25 All other loans26 Lease-financing receivables27 Interbank loans28 Federal funds sold to and
repurchase agreements withcommercial banks
29 Other30 Cash assets5
31 Other assets'"
32 Total assets7
Liabilities33 Deposits34 Transaction35 Nontransaction36 Large time37 Other38 Borrowings39 From banks in the U.S40 From others41 Net due to related foreign offices42 Other liabilities
43 Total liabilities
44 Residual (assets less liabilities)5
2007
Nov.
5,113.11,388.1
663.872.2
591.6527.064.6
724.3388.7335.660.3
275.33,725.0
741.62,052.2
390.21,662.11,042.0
620.1463.6132.7
105.926.9
44.1192.798.1
225.1
170.654.5
152.5655.0
6,107.7
3,351.5327.1
3,024.4618.9
2,405.51,069.9
150.6919.3477.3459.7
5,358.4
749.2
Monthly averages
2008
May
5,310.91,427.8
647.965.7
582.2534.248.0
779.9408.2371.654.6
317.03,883.1
780.32,107.1
417.31,689.81,026.1
663.7487.3177.5
143.234.3
31.5197.4101.9244.8
190.654.2
146.2706.9
6,352.3
3,461.5326.5
3,135.0608.6
2,526.41,119.5
165.2954.2523.7467.5
5,572.2
780.1
June
5,284.91,428.6
665.266.1
599.1552.246.9
763.4390.4373.0
53.2319.7
3,856.2783.2
2,088.2421.6
1,666.6995.3671.3491.3169.0
143.225.9
24.1198.2102.2259.3
203.755.6
137.3713.1
6,334.4
3,465.6317.7
3,147.9607.2
2,540.71,121.5
161.5960.0541.5453.3
5,581.9
752.5
July
5,288.9'1,433.0
662.7'53.7'
609.0560.348.7
770.3'400.6'369.7
53.3316.5
3,855.9'786.4
2,058.6427.0
1,631.7979.5652.2498.9183.2
157.325.9
27.4202.3
99.0241.5
194.946.6
135.9738.8'
6,338.7
3,424.7327.8
3,096.8612.6
2,484.21,143.4
163.0980.4524.4457.1
5,549.6
789.1
Aug.
5,295.1'1,428.7'
685.4'56.4'
629.1576.752.3
743.3'385.3'358.052.7
305.43,866.4'
780.8'2,066.2
428.61,637.6
984.3653.3503.4193.6
168.425.1
24.9201.795.8
239.5
193.246.3
138.1741.6'
6,346.4
3,436.3317.3
3,119.0606.4
2,512.71,158.6
158.21,000.5
506.2452.5
5,553.7
792.7
Sept.
Seasonall
5,426.8'1,499.0
710.0'72.0'
637.9587.650.3
789.1'404.1'385.0'52.2
332.8'3,927.7'
792.9'2,066.9
440.21,626.7
977.2649.5501.3229.8
189.140.7
22.5220.593.8
257.2
214.143.0
200.3753.6'
6,566.6
3,584.0349.8
3,234.2662.8
2,571.41,194.9
150.41,044.5
501.7485.1
5,765.7
800.9
Oct.'
1 adjusted
5,751.61,665.6
784.3133.6650.7604.346.4
881.3446.5434.7
52.7382.1
4,086.0822.6
2,177.4474.1
1,703.31,019.7
683.6517.1219.6
177.741.9
25.3231.8
92.2247.7
207.140.6
323.0779.4
7,021.7
3,781.7383.3
3,398.4737.2
2,661.31,387.8
152.21,235.6
510.7541.7
6,221.8
799.9
Nov.
5,721.11,676.5
806.9122.1684.7636.448.3
869.7484.0385.652.0
333.64,044.6
816.42,174.5
476.61,697.91,008.1
689.8518.8203.4
172.930.5
20.7219.291.5
184.6
146.837.9
411.8820.4
7,054.7
3,761.8418.0
3,343.7675.9
2,667.81,391.2
130.31,260.9
550.4571.9
6,275.3
779.4
Wednesd ay figures
2008
Nov. 5
5,697.91,655.8
816.8149.1667.7622.545.2
839.0436.2402.8
52.2350.6
4,042.1816.6
2,164.7474.4
1,690.31,003.7
686.6516.2203.2
166.436.9
20.1229.691.6
217.7
182.035.7
396.4784.9
7,014.1
3,763.8442.2
3,321.7680.6
2,641.11,387.5
129.21,258.3
553.3525.3
6,229.9
784.2
Nov. 12
5,715.31,671.1
823.4154.6668.8622.346.6
847.7450.1397.5
51.9345.6
4,044.2822.6
2,175.6475.3
1,700.31,012.7
687.5515.4196.2
161.534.7
23.1219.7
91.6189.6
149.040.6
449.9796.8
7,068.4
3,772.4412.9
3,359.5679.4
2,680.21,436.6
138.51,298.1
551.5539.5
6,299.9
768.5
Nov. 19
5,690.11,661.9
790.499.6
690.8643.647.3
871.5487.5383.9
52.0332.0
4,028.2812.2
2,168.1476.0
1,692.11,003.9
688.3517.6207.9
180.527.4
18.1213.0
91.3172.6
133.339.3
383.8839.3
7,002.8
3,701.1398.2
3,302.9663.9
2,638.91,378.1
128.31,249.8
556.5581.4
6,217.1
785.7
Nov. 26
5,762.21,697.9
800.2100.8699.4648.451.0
897.7518.4379.351.9
327.54,064.3
818.72,183.2
478.01,705.21,012.4
692.8522.7209.0
180.728.2
20.1218.991.6
171.2
134.636.6
408.0844.0
7,103.2
3,798.3414.0
3,384.3685.9
2,698.41,380.9
128.51,252.4
534.1604.8
6,318.1
785.2
Footnotes appear on p. 21.

18 Federal Reserve Bulletin Statistical Supplement • December 2008
1.26 COMMERCIAL BANKS IN THE UNITED STATES Assets and Liabilities' —Continued
C. Large domestically chartered commercial banks—Continued
Billions of dollars
Account
Assets45 Bank credit46 Securities in bank credit47 Treasury and Agency securities2 .48 Trading account49 Investment account50 Mortgage-backed51 Other52 Other securities53 Trading account54 Investment account55 State and local government .56 Other57 Loans and leases in bank credit3 . . .58 Commercial and industrial59 Real estate60 Revolving home equity61 Other62 Other residential63 Commercial64 Consumer65 Credit cards and related plans .66 Other67 Security4
68 Federal funds sold to andrepurchase agreementswith broker-dealers
69 Other70 Federal funds sold to and
repurchase agreementswith others
71 All other loans72 Lease-financing receivables73 Interbank loans74 Federal funds sold to and
repurchase agreementswith commercial banks
75 Other76 Cash assets5
77 Other assets'"
78 Total assets7
Liabilities79 Deposits80 Transaction81 Nontransaction82 Large time83 Other84 Borrowings85 From banks in the U.S86 From others87 Net due to related foreign offices88 Other liabilities
89 Total liabilities
90 Residual (assets less liabilities)5
2007
Nov.
5.158.51,391.2
661.474.4
587.0520.466.6
729.8394.3335.660.8
274.83,767.3
746.22,091.3
394.11,697.21,067.6
629.6462.8131.6331.2130.7
103.727.0
46.0190.799.5
230.1
173.756.4
156.6658.2
6,165.5
3,395.5329.8
3,065.7624.4
2,441.31,069.0
151.2917.8474.8474.9
5,414.2
751.3
Monthly averages
2008
May
5,279.51,438.5
655.665.5
590.1542.048.0
782.9411.7371.254.9
316.33,841.0
778.82,069.3
413.71,655.71,005.2
650.5486.5131.1355.4180.5
145.535.0
28.1197.6100.1239.5
187.052.5
143.7701.2
6,307.5
3,405.6323.2
3,082.4600.7
2,481.71,128.2
166.1962.0528.2469.7
5,531.7
775.7
June
5,239.81,433.4
671.667.7
603.8556.047.8
761.9391.6370.3
53.1317.2
3,806.4777.6
2,048.8418.3
1,630.5977.8652.7487.7131.2356.5170.7
144.725.9
23.7197.8100.1249.1
195.154.0
133.7702.9
6,265.6
3,397.8315.6
3,082.3597.4
2,484.91,118.5
159.1959.4529.8448.4
5,494.5
771.1
July
5,238.8'1,430.1
670.4'54.4'
616.0567.548.5
759.7'392.7'367.0
52.7314.3
3,808.7'777.5
2,039.3424.3
1,615.0963.3651.7491.9134.5357.4173.6
148.425.2
25.2202.0
99.1235.5
189.845.7
131.6733.9
6,272.9
3,394.1317.2
3,076.9603.2
2,473.71,124.7
155.4969.3524.8454.0
5,497.5
775.4
Aug.
5,242.4'1,425.5
690.7'54.9'
635.8583.452.4
734.7'379.0'355.852.1
303.63,816.9'
775.4'2,035.1
427.61,607.4
955.9651.5497.8137.9359.9185.7
161.324.4
26.1200.996.0
237.8
192.045.7
127.3735.1'
6,274.6
3,380.4306.4
3,073.9595.6
2,478.31,161.7
155.91,005.8
504.1452.1
5,498.3
776.3
Sept.
Not seasona
5,428.8'1,491.4
705.8'68.7'
637.1586.051.1
785.7'399.8'385.9'52.2
333.63,937.4'
792.0'2,067.0
440.11,626.8
968.9658.0503.6142.5361.1229.0
189.239.9
26.3224.395.2
259.8
217.242.6
197.1761.4'
6,575.5
3,583.0345.5
3,237.5656.6
2,580.91,231.0
150.61,080.5
492.3484.6
5,790.9
784.6
Oct.'
lly adjusted
5,782.71,655.9
774.0128.0645.9599.046.9
881.9447.6434.3
52.8381.5
4,126.9828.0
2,216.3478.2
1,738.11,039.6
698.4515.4155.9359.5215.6
175.040.6
27.4230.4
93.8249.1
207.941.2
321.3791.1
7,064.3
3,816.9375.8
3,441.1746.2
2,694.91,407.2
151.01,256.2
507.3548.1
6,279.5
784.8
Nov.
5,776.21,684.7
806.1125.5680.6630.849.7
878.6492.0386.552.5
334.04,091.6
821.92,218.2
481.61,736.61,035.5
701.1517.7158.5359.2200.4
169.830.6
21.5219.192.9
188.4
149.139.2
422.0824.3
7,128.4
3,818.4421.5
3,396.9685.0
2,711.91,391.7
130.61,261.1
548.8591.8
6,350.7
777.7
Wednesd ay figures
2008
Nov. 5
5,768.31,667.4
824.2157.6666.7619.547.2
843.2439.1404.1
52.6351.5
4,100.9822.9
2,218.1479.7
1,738.41,038.9
699.5514.7156.0358.7201.2
164.836.4
21.5229.593.1
215.0
177.337.7
385.8790.2
7,076.6
3,813.3392.0
3,421.3694.9
2,726.41,409.8
131.01,278.7
531.9546.0
6,301.0
775.6
Nov. 12
5,762.51,669.6
818.8159.3659.5611.348.3
850.7452.4398.3
52.5345.8
4,093.0824.3
2,224.4480.3
1,744.01,044.0
700.0515.4156.8358.6197.5
162.135.4
21.1217.5
92.9191.7
149.642.0
464.8806.3
7,142.5
3,832.9392.2
3,440.7690.1
2,750.61,436.7
140.31,296.4
540.1553.3
6,363.0
779.6
Nov. 19
5,744.71,669.6
790.5102.9687.6638.449.1
879.1495.0384.1
52.8331.3
4,075.0820.3
2,208.6481.5
1,727.11,026.6
700.5517.3159.2358.2200.1
173.326.8
20.0216.0
92.8179.6
139.440.2
404.4840.3
7,086.9
3,774.6421.3
3,353.3673.3
2,680.01,378.5
127.21,251.4
552.6599.3
6,305.0
781.9
Nov. 26
5,814.01,711.0
797.6102.4695.2643.152.1
913.4533.6379.852.2
327.64,103.0
825.02,219.6
483.21,736.41,033.3
703.2520.7160.1360.6204.5
175.429.0
22.2218.093.0
179.7
142.037.7
414.8848.8
7,177.1
3,829.0466.5
3,362.5686.5
2,676.01,375.5
126.71,248.9
560.5633.1
6,398.1
779.0
Footnotes appear on p. 21.

Commercial Banking Institutions—Assets and Liabilities 19
1.26 COMMERCIAL BANKS IN THE UNITED STATES Assets and Liabilities' —Continued
D. Small domestically chartered commercial banks
Billions of dollars
Account
Assets1 Bank credit2 Securities in bank credit3 Treasury and Agency securities2 . .4 Other securities5 Loans and leases in bank credit3 . . . .6 Commercial and industrial7 Real estate8 Revolving home equity9 Other
10 Consumer11 Other loans and leases12 Interbank loans13 Cash assets5
14 Other assets'"
15 Total assets7
Liabilities16 Deposits17 Transaction18 Nontransaction19 Large time20 Other21 Borrowings22 From banks in the U.S23 From others24 Net due to related foreign offices25 Other liabilities
26 Total liabilities
27 Residual (assets less liabilities)5
Assets28 Bank credit29 Securities in bank credit30 Treasury and Agency securities2 . .31 Other securities32 Loans and leases in bank credit3 . . . .33 Commercial and industrial34 Real estate35 Revolving home equity36 Other37 Other residential38 Commercial39 Consumer40 Credit cards and related plans . .41 Other42 Other loans and leases43 Interbank loans44 Cash assets5
45 Other assets'"
46 Total assets7
Liabilities47 Deposits48 Transaction49 Nontransaction50 Large time51 Other52 Borrowings53 From banks in the U.S54 From others55 Net due to related foreign offices56 Other liabilities
57 Total liabilities
58 Residual (assets less liabilities)5
2007
Nov.
2.913.0602.1372.5229.6
2.310.8'391.9'
1.474.4'88.4
1.386.0'332.4112.2117.393.0
249.5
3,337.6
2 268 8270.6
1,998.1405.5
1,592.7564.8245.4319.4
4.777.5
2,915.8
421.8'
2,904.7'597.2368.6228.6
2,307.5'388.7'
1,472.8'88.4
1,384.4'452.1932.3'333.5211.4122.1112.5119.893.1
245.0
3,327.6'
2,263.8271.4
1,992.5405.6
1,586.8566.9247.7319.2
3.777.5
2,911.9
415.7
Monthly averages
2008
May'
2,957.3586.6356.2230.5
2,370.7405.1
1,509.494.8
1,414.5339.8116.4126.8102.2231.7
3,377.5
2 312 8269.8
2,042.9412.8
1,630.1592.2246.7345.5
4.080.1
2,989.0
388.5
2.976.2597.9362.3235.7
2,378.3408.1
1,517.594.7
1,422.8459.4963.4336.3209.6126.6116.4122.2103.6233.4
3,394.7
2.319.4269.3
2.050.1413.7
1.636.4593.2247.0346.2
4.680.3
2,997.6
397.1
June'
2.968.1586.0356.0230.0
2.382.2406.7
1.518.096.8
1.421.2340.5117.0125.3103.1234.6
3,390.4
2,319.4269.1
2,050.2414.9
1,635.3592.5252.2340.3
4.680.9
2,997.4
393.0
2.987.3593.1361.0232.1
2,394.2409.8
1,526.396.1
1,430.2461.1969.1339.2210.6128.6118.9121.5103.7238.9
3,410.6
2.332.8270.5
2.062.3415.4
1.646.9594.2252.6341.6
4.180.6
3,011.7
398.9
July'
2.987.5593.3357.7235.6
2.394.2407.6
1.525.696.6
1.429.0340.4120.5130.5104.6231.7
3,413.2
2,338.6275.9
2,062.7418.0
1,644.7592.0243.7348.3
5.380.3
3,016.1
397.0
2.986.4586.3356.2230.2
2,400.1409.4
1,529.697.4
1,432.3459.4972.9341.0212.6128.4120.0122.4104.5234.0
3,406.3
2.341.7271.4
2.070.3416.2
1.654.1588.0243.8344.2
5.179.4
3,014.2
392.2
Aug.
2.996.0'587.8355.5232.3
2.408.2'410.6'
1.535.5'97.6
1.438.0'341.7120.4128.7106.6233.9
3,423.9
2,350.4'266.4
2,084.0'417.0'
1,667.0'594.9'251.4'343.5
3.780.3
3,029.3'
394.6'
2.995.9581.2354.4226.8
2,414.7410.6'
1,537.9'98.4
1,439.5'462.6'976.8'345.9217.5128.4120.4124.7104.5236.7'
3,420.6
2.352.7267.1'
2.085.6'416.9'
1.668.7'590.4'248.6'341.8
2.979.7
3,025.7'
394.9'
Sept.'
Seasonall
3.029.8583.3360.9222.4
2.446.4416.9
1.556.6100.2
1.456.4350.7122.2137.3107.4241.6
3,474.1
2,385.7271.2
2,114.4419.5
1,694.9596.7244.2352.5
4.681.9
3,068.8
405.3
Not seasona
3.014.3574.7356.7218.0
2,439.6415.2
1,551.1100.5
1,450.6465.1985.4350.4219.2131.2122.9131.4106.3241.1
3,451.2
2.372.3266.5
2.105.8418.2
1.687.5596.6244.6352.0
2.981.2
3,053.1
398.2
Oct.'
1 adjusted
3.052.6578.6367.1211.5
2.474.0426.7
1.573.2103.7
1.469.5353.7120.5136.1123.5247.6
3,517.2
2,412.8273.8
2,139.0423.1
1,715.9613.2248.4364.7
2.180.8
3,108.9
408.3
lly adjusted
3.030.8572.9362.3210.6
2,457.9423.0
1,564.7102.4
1,462.3471.6990.6350.5216.0134.6119.7132.0121.7246.8
3,489.0
2.396.3269.8
2.126.5421.8
1.704.7612.5248.0364.5
1.680.8
3,091.3
397.7
Nov.
3.057.9585.2371.0214.2
2.472.8427.1
1.570.7103.9
1.466.8357.5117.4113.7166.1257.2
3,551.9
2,439.6271.0
2,168.7428.2
1,740.4602.7234.5368.2
6.382.9
3,131.5
420.3
3.050.1580.5367.2213.2
2,469.6423.8
1,569.0103.9
1,465.2471.4993.8359.0225.0134.0117.7114.5166.6253.5
3,541.9
2.433.8271.7
2.162.1428.6
1.733.6605.1236.6368.5
5.483.1
3,127.3
414.6
Wednesd ay figures
2008
Nov. 5
3.048.2576.5367.8208.7
2.471.7427.3
1.572.4103.8
1.468.6355.1116.9121.4145.0250.1
3,521.9
2,417.6270.2
2,147.4424.4
1,723.0609.3248.7360.6
3.582.0
3,112.4
409.5
3.035.8573.5364.6208.9
2,462.3424.1
1,567.6103.2
1,464.5472.6991.9353.8220.4133.4116.8121.5142.6247.1
3,504.5
2.419.1258.5
2.160.5425.1
1,735.4605.6246.4359.2
2.681.3
3,108.5
395.9
Nov. 12
3.049.5578.7368.3210.4
2.470.8427.9
1.571.3103.3
1.468.0356.8114.9110.5157.1259.5
3,533.5
2,440.8270.9
2,169.9427.1
1,742.8604.4231.8372.7
4.180.2
3,129.5
404.0
3.039.9575.6365.0210.6
2,464.3423.7
1,568.9103.4
1,465.5473.5991.9356.7223.4133.3115.1112.7157.9257.0
3,524.8
2.439.5263.0
2.176.5427.3
1.749.2603.8232.2371.6
3.980.3
3,127.5
397.3
Nov. 19
3.044.7571.9370.5201.4
2.472.8426.0
1.570.4103.9
1.466.5358.1118.3111.7160.6252.3
3,526.3
2,429.2264.3
2,164.9427.9
1,737.0603.7236.9366.8
7.280.2
3,120.2
406.1
3,037.4566.7366.4200.3
2,470.6423.4
1,567.3103.8
1,463.5469.0994.5360.9227.0133.9119.0115.0163.6246.3
3,519.3
2.424.9266.5
2.158.4428.3
1.730.1604.6238.0366.7
6.181.0
3,116.6
402.7
Nov. 26
3.045.3575.3372.1203.3
2.470.0427.4
1.567.8104.2
1.463.6358.2116.6104.2185.1255.7
3,547.2
2,462.7268.5
2,194.2430.7
1,763.5587.7226.5361.2
9.281.8
3,141.4
405.8
3.041.3568.8368.1200.8
2,472.4424.2
1,569.8104.3
1,465.4470.2995.3361.5226.6134.8117.098.4
184.7250.8
3,532.3
2.440.4286.3
2.154.1430.9
1.723.1599.0235.2363.8
7.981.8
3,129.1
403.3
Footnotes appear on p. 21.

20 Federal Reserve Bulletin Statistical Supplement • December 2008
1.26 COMMERCIAL BANKS IN THE UNITED STATES Assets and Liabilities' —Continued
E. Foreign-related institutions
Billions of dollars
Account
Assets1 Bank credit2 Securities in bank credit3 Treasury and Agency securities2 . .4 Other securities5 Loans and leases in bank credit3 . . . .6 Commercial and industrial7 Real estate8 Security4
9 Other loans and leases10 Interbank loans11 Cash assets5
12 Other assets'"
13 Total assets7
Liabilities14 Deposits15 Transaction16 Nontransaction17 Borrowings18 From banks in the U.S19 From others20 Net due to related foreign offices21 Other liabilities
22 Total liabilities
23 Residual (assets less liabilities)5
Assets24 Bank credit25 Securities in bank credit26 Treasury and Agency securities2 . .27 Trading account28 Investment account29 Other securities30 Trading account31 Investment account32 Loans and leases in bank credit3 . . . .33 Commercial and industrial34 Real estate35 Security4
36 Other loans and leases37 Interbank loans38 Cash assets5
39 Other assets'"
40 Total assets7
Liabilities41 Deposits42 Transaction43 Nontransaction44 Borrowings45 From banks in the U.S46 From others47 Net due to related foreign offices48 Other liabilities
49 Total liabilities
50 Residual (assets less liabilities)5
2007
Nov.
1,154.2474.2
92.7381.5680.0275.135.7
140.6228.679.056.749.0
1,338.9
1 017 513.1
1,004.4586.760.7
526.0-396.0
128.7
1,336.9
2.1
1,162.7480.3
93.126.666.5
387.2228.8158.4682.4274.836.5
144.4226.783.857.747.3
1,351.6
1 017 012.8
1 004 2585.663.3
522.3-383.4
130.4
1,349.6
2.0
Monthly averages
2008
May
1,135.1'466.8
91.8375.0668.3'310.9'40.8'
103.8212.875.0'58.149.3
1,317.4'
1,112.817.0
1,095.8607.471.9
535.5-551.2
145.8
1,314.7
2.7
1,130.0'470.0
92.230.162.1
377.8235.0142.8660.0'307.5'41.1
102.4209.072.3'56.850.4
1,309.5
1,137.016.8
1 120 1617.367.8
549.5-597.3
149.2
1,306.2
3.3
June
1,121.5'457.2'
91.6365.7'664.3'313.2'42.1
100.4208.6'
68.5'59.656.3
1,305.8'
1,124.616.8
1,107.9602.9
69.7533.2
-564.6140.3
1,303.1
2.7'
1,113.7'458.5'
90.928.762.2
367.6'221.5'146.1655.2'309.8'41.799.1
204.6'65.2'58.857.4
1,295.0'
1,133.916.5
1 117 3605.6
67.6538.0
-586.1138.3
1,291.6
3.4
July
1,122.6'468.0'
93.7374.3'654.5'314.4'42.8
100.3197.1'65.7'56.148.5
1,292.9
1,120.917.2
1,103.7605.172.9
532.2-576.7
137.2
1,286.5
6.4'
1,103.9'460.0'
92.029.362.6
368.0'219.3'148.7643.9'310.5'42.297.0
194.2'64.2'56.348.2
1,272.5
1,095.216.8
1,078.4594.3
68.1526.3
-553.2132.7
1,269.1'
3.4
Aug.
1,124.1'464.6'
86.8377.8'659.6'317.0'44.1
100.7197.7'66.0'53.243.0
1,286.3
1,127.6'16.5
1,111.0603.667.4
536.2-602.0
140.5
1,269.6
16.7
1,110.5'458.9'
87.829.058.8
371.1'227.1'144.0651.6'315.2'42.498.0
196.0'64.4'54.043.0
1,271.8
1,111.1'16.3
1,094.7591.065.4
525.6-573.3
139.6'
1,268.4
3.3'
Sept.'
Seasonall
1,118.7454.8
83.0371.8663.9326.343.089.7
204.968.160.846.7
1,294.2
1,102.919.1
1,083.8607.084.0
523.0-568.1
148.1
1,289.9
4.4
Not seasona
1,110.5450.2
83.828.155.6
366.5221.8144.7660.2326.342.886.8
204.369.462.748.1
1,290.6
1,097.019.0
1,078.0586.582.7
503.8-543.2
146.8
1,287.2
3.4
Oct.'
1 adjusted
1,152.9475.3
75.6399.6677.7350.840.872.0
214.160.9
130.160.6
1,404.4
930.622.3
908.3618.8
57.9561.0
-332.6183.4
1,400.3
4.1
lly adjusted
1,150.8473.3
76.227.249.1
397.1236.6160.5677.5349.641.872.0
214.162.6
132.259.0
1,404.6
931.921.8
910.1597.7
55.3542.3
-313.8182.9
1,398.7
5.9
Nov.
1,118.9464.1
83.4380.7654.8352.939.156.6
206.246.5
273.754.3
1,493.4
862.218.3
843.8607.439.8
567.6-167.4
185.8
1,488.0
5.4
1,126.8470.2
83.626.856.8
386.6240.4146.2656.6353.239.958.5
205.148.7
278.952.6
1,506.9
865.217.9
847.3604.140.8
563.3-155.2
187.8
1,501.9
4.9
Wednesd ay figures
2008
Nov. 5
1,120.2460.3
86.3374.0659.9352.738.860.1
208.342.9
243.360.0
1,466.4
903.018.5
884.5592.735.8
556.9-219.1
180.6
1,457.3
9.1
1,127.0466.9
86.530.556.1
380.4227.6152.9660.1351.640.061.0
207.545.1
247.957.7
1,477.7
903.017.7
885.3589.035.2
553.8-204.8
184.5
1,471.7
6.0
Nov. 12
1,141.4478.3
87.0391.3663.1353.6
39.058.1
212.343.7
256.352.6
1,493.9
864.318.3
846.0614.9
39.2575.7
-167.7179.8
1,491.2
2.7
1,142.5482.1
87.330.057.3
394.9244.6150.2660.4351.2
39.960.0
209.345.5
265.351.9
1,505.1
872.117.9
854.2607.4
38.9568.6
-160.7180.2
1,499.1
6.0
Nov. 19
1,124.3473.6
80.9392.7650.7351.0
38.958.7
202.150.1
314.154.6
1,543.0
860.919.3
841.6627.9
36.1591.7
-133.6191.3
1,546.5
-3 .5
1,128.7477.3
80.725.854.9
396.7251.9144.7651.4351.9
39.559.4
200.650.5
318.950.2
1,548.3
862.918.4
844.5615.6
39.9575.7
-125.5189.2
1,542.2
6.1
Nov. 26
1,096.6447.7
80.1367.6648.9353.539.453.1
203.049.0
273.252.0
1,470.7
840.817.6
823.1596.546.7
549.8-164.9
188.7
1,461.1
9.6
1,112.4456.3
80.523.557.1
375.8231.9143.9656.1356.240.056.7
203.252.7
278.651.6
1,495.3
845.617.9
827.8601.646.4
555.2-147.4
192.5
1,492.3
3.1
Footnotes appear on p. 21.

Commercial Banking Institutions—Assets and Liabilities 21
1.26 COMMERCIAL BANKS IN THE UNITED STATES Assets and Liabilities' —Continued
F. Memo items
Billions of dollars
Account
MEMOLarge domestically chartered banks,
adjusted for mergers1 Revaluation gains on off-balance-sheet
items9
2 Revaluation losses on off-balance-sheet items9
3 Mortgage-backed securities10
4 Pass-through5 CMO, REMIC, and other6 Net unrealized gains (losses) on
available-for-sale securities"7 Securitized consumer loans12
8 Credit cards and related plans9 Other
10 Securitized real estate loans12
Small domestically charteredcommercial banks, adjusted for
yyi ^v^ers11 Mortgage-backed securities10
12 Securitized consumer loans12
13 Securitized real estate loans12
Foreign-related institutions14 Revaluation gains on off-balance-
sheet items9
15 Revaluation losses on off-balance-sheet items9
Monthly averages
2007
Nov.
2008
May June July Aug. Sept. Oct. Nov.
Wednesday figures
2008
Nov. 5 Nov. 12 Nov. 19 Nov. 26
Not seasonally adjusted
201.6
159.5673.3458.1215.2
-8.1111.974.537.4
1,189.8
242.7283.536.8
82.6
86.8
211.7
164.1716.7477.1239.6
-21.3112.578.334.2
1,218.3'
265.7296.535.4
106.8
103.3
195.1
149.0729.3490.3239.0
-29.2115.681.134.5
1,220.3'
265.0296.9
28.0
99.3
95.8
205.3
159.2737.7501.6236.1
-35.6115.180.235.0
1,233.3'
262.7'296.4
27.5
98.5
94.5
205.3
160.9746.1515.6230.5
-46.2114.279.934.3
1,245.3'
262.6295.531.7'
103.0
101.8
224.5
176.4745.9519.1226.8
-46.5 '120.9'82.638.3'
1,268.0'
265.8'294.335.1
103.2
102.3
276.1
213.2758.2'532.8'225.4
-56.0'133.3'91.741.6'
1,335.6'
266.5'293.2
35.2
129.9
125.5
343.8
264.5780.5563.8216.7
-74.4130.689.641.0
1,339.2
261.2287.235.2
148.5
141.3
281.0
221.8774.5553.7220.8
-72.9131.790.541.2
1,339.3
265.4290.635.2
128.2
124.8
301.2
229.7765.4545.1220.3
-72.3131.690.541.1
1,339.4
265.5287.9
35.2
142.3
135.0
351.5
271.2788.3570.8217.6
-76.1130.089.041.0
1,338.7
257.8284.6
35.2
157.2
146.8
388.5
299.5791.9576.0215.9
-72.6129.889.040.8
1,337.5
257.6287.035.2
151.9
145.5
NOTES: Tables 1.26, 1.27, and 1.28 have been revised to reflect changes in the Board's H.8statistical release, "Assets and Liabilities of Commercial Banks in the United States," whichis available at www.federalreserve.gov/releases. Table 1.27, "Assets and Liabilities of LargeWeekly Reporting Commercial Banks," and table 1.28, "Large Weekly Reporting U.S.Branches and Agencies of Foreign Banks," are no longer being published in the StatisticalSupplement. Instead, abbreviated balance sheets for both large and small domesticallychartered banks have been included in table 1.26, parts C and D. Data are both merger-adjusted and break-adjusted. In addition, data from large weekly reporting U.S. branches andagencies of foreign banks have been replaced by balance sheet estimates of all foreign-relatedinstitutions and are included in table 1.26, part E. These data are break-adjusted.
1. Covers the following types of institutions in the fifty states and the District of Columbia:domestically chartered commercial banks that submit a weekly report of condition (largedomestic); other domestically chartered commercial banks (small domestic); branches andagencies of foreign banks, and Edge Act and Agreement corporations (foreign-relatedinstitutions). Excludes international banking facilities. Data are Wednesday values or pro rataaverages of Wednesday values. Large domestic banks constitute a universe; data for smalldomestic banks and foreign-related institutions are estimates based on weekly samples and onquarter-end condition reports. Data are adjusted for breaks caused by ^classifications ofassets and liabilities.
The data for large and small domestic banks presented on pp. 17-19 are adjusted to removethe estimated effects of mergers between these two groups. The adjustment for mergerschanges past levels to make them comparable with current levels. Estimated quantities ofbalance sheet items acquired in mergers are removed from past data for the bank group thatcontained the acquired bank and put into past data for the group containing the acquiringbank. Balance sheet data for acquired banks are obtained from Call Reports, and a ratioprocedure is used to adjust past levels.
2. Treasury securities are liabilities of the U.S. Treasury. Agency securities are liabilities ofU.S. government agencies and U.S. government-sponsored enterprises.
3. Excludes federal funds sold to, reverse RPs with, and loans made to commercial banksin the United States, all of which are included in "Interbank loans."
4. Consists of reverse RPs with brokers and dealers and loans to purchase and carrysecurities.
5. Includes vault cash, cash items in process of collection, balances due from depositoryinstitutions, and balances due from Federal Reserve Banks.
6. Excludes the due-from position with related foreign offices, which is included in "Netdue to related foreign offices."
7. Excludes unearned income, reserves for losses on loans and leases, and reserves fortransfer risk. Loans are reported gross of these items.
8. This balancing item is not intended as a measure of equity capital for use in capitaladequacy analysis. On a seasonally adjusted basis, this item reflects any differences in theseasonal patterns estimated for total assets and total liabilities.
9. Fair value of derivative contracts (interest rate, foreign exchange rate, other commodityand equity contracts) in a gain/loss position, as determined under FASB Interpretation No. 39.The fair market value of derivative contracts in a gain position is included in "Othersecurities, trading account." The fair value of derivative contracts in a loss position isincluded in "Other liabilities."
10. Includes mortgage-backed securities issued by U.S. government agencies, U.S.government-sponsored enterprises, and private entities.
11. Difference between fair value and historical cost for securities classified as available-for-sale under FASB Statement No. 115. Data are reported net of tax effects. Data shown arerestated to include an estimate of these tax effects.
12. Total amount outstanding.

22 Federal Reserve Bulletin Statistical Supplement • December 2008
1.32 COMMERCIAL PAPER OUTSTANDING
Millions of dollars, seasonally adjusted, end of period
Item
1 All issuers
2 Financial companies'3 Nonfinancial companies2
Year ending December
2003
1,284,153
519,785112,292
2004
1,403,929
589,499129,902
2005
1,662,157
663,951142,363
2006
1,983,118
730,735167,075
2007
1,780,685
816,693162,720
2008
Mar.
1,821,489
835,350173,591
Apr.
1,757,975
802,401186,154
May
1,748,960
810,988181,125
June
1,740,990
817,619165,069
July
1,732,714
808,065168,861
Aug.
1,777,235
832,343195,466
1. Institutions engaged primarily in commercial, savings, and mortgage banking; sales,personal, and mortgage financing; factoring, finance leasing, and other business lending;insurance underwriting; and other investment activities.
2. Includes public utilities and firms engaged primarily in such activities as communica-tions, construction, manufacturing, mining, wholesale and retail trade, transportation, andservices.
1.33 PRIME RATE CHARGED BY BANKS Short-Term Business Loans1
Percent per year
Date of change
1Nov 7
2003 June 27
2004—June 30Aug. 10Sept. 21Nov. 10Dec. 14
2005—Feb. 2Mar. 22May 3June 30Aug. 9Sept. 20Nov. 1Dec. 13
2006—Jan. 31Mar. 28May 10June 29
2007—Sept. 18Oct. 31Dec. 11
2008—Jan. 2230Mar. 18Apr. 30Oct. 829
Rate
4.754 25
4 00
4 254.504.755.005.25
5.505.756.006.256.506.757.007.25
7.507.758.008.25
7.757.507.25
6.506.005.255.004.504.00
Period
2004200520062007
2005 JanFebMarAprMayJuneJulyAugSeptOctNovDec
Averagerate
4.346.197.968.05
5.255.495.585.755.986.016.256.446.596.757.007.15
Period
2006—JanFebMarAprMayJuneJulyAugSeptOctNovDec
Averagerate
7.267.507.537.757.938.028.258.258.258.258.258.25
Period
2007—JanFebMarAprMayJuneJulyAugSeptOctNovDec
2008—JanFebMarAprMayJuneJulyAugSeptOct
Averagerate
8.258.258.258.258.258.258.258.258.037.747.507.33
6.986.005.665.245.005.005.005.005.004.56
1. The prime rate is one of several base rates that banks use to price short-term businessloans. The table shows the date on which a new rate came to be the predominant one quotedby a majority of the twenty-five largest banks by asset size, based on the most recent Call
Report. Data in this table also appear in the Board's H.I 5 (519) weekly statistical release,available on the Board's website, www.federalreserve.gov/releases.

Financial Markets 23
1.35 INTEREST RATES Money and Capital Markets
Percent per year; figures are averages of business day data unless otherwise noted
Item
MONEY MARKET INSTRUMENTS
1 Federal funds1-13
2 Discount window primary credit2-4
Commercial paper3'5'6
Nonfinancial3 1-month4 2-month5 3-month
Financial6 1-month7 2-month8 3-month
Certificates of deposit, secondary market3-1
9 1-month10 3-month11 6-month
12 Eurodollar deposits, 3-month3>s
U.S. Treasury billsSecondary market3-5
13 4-week14 3-month15 6-month
U.S. TREASURY NOTES AND BONDS
Constant maturities''16 1 -year17 2-year18 3-year19 5-year20 7-year21 10-year22 20-year
STATE AND LOCAL NOTES AND BONDS
Moody's series10
23 Aaa24 Baa25 Bond Buyer series"
CORPORATE BONDS
26 Seasoned issues, all industries12
Rating group27 Aaa13
28 Aa29 A30 Baa
MEMODividend-price ratio14
31 Common stocks
2005
3.224.19
3.223.233.42
3.273.363.44
3.343.513.73
3.51
2.943.153.39
3.623.853.934.054.154.294.64
4.284.864.40
5.57
5.235.375.596.06
1.73
2006
4.975.96
4.985.015.10
5.005.045.07
5.065.165.24
5.19
4.674.734.81
4.944.824.774.754.764.805.00
4.154.714.40
5.98
5.595.806.066.48
1.82
2007
5.025.86
5.024.984.92
5.075.105.13
5.235.275.23
5.32
4.324.364.44
4.534.364.354.434.514.634.91
4.134.604.40
6.01
5.565.906.096.48
1.83
June
2.002.25
2.142.152.21
2.342.532.70
2.502.763.09
2.95
1.691.862.13
2.422.773.083.493.734.104.74
4.50'5.42'4.69
6.32
5.686.116.437.07
2.31
2008
July
2.012.25
2.082.132.18
2.342.522.72
2.492.793.13
3.00
1.581.631.93
2.282.572.873.303.604.014.62
4.445.424.68
6.34
5.676.056.477.16
2.44
Aug.
2.002.25
2.042.082.08
2.392.542.76
2.462.793.11
3.00
1.651.721.92
2.182.422.703.143.463.894.53
4.445.454.69
6.31
5.646.016.467.15
2.38'
Sept.
1.812.25
2.102.112.13
2.692.782.91
3.443.593.82
3.95
0.861.131.61
1.912.082.322.883.253.694.32
4.615.734.86
6.39
5.656.036.557.31
2.46
Aug. 29
1.992.25
2.042.08n.a.
2.412.572.78
2.472.803.12
3.00
1.611.691.91
2.172.342.613.063.393.794.43
4.415.444.68
6.24
5.545.936.397.09
2.40
2008, week ending
Sept. 5
1.962.25
2.032.022.11
2.422.582.72
2.462.793.12
3.00
1.551.671.87
2.082.242.462.933.283.694.34
4.345.364.62
6.18
5.495.886.327.04
2.42
Sept. 12
1.992.25
2.032.042.04
2.382.572.72
2.482.793.09
3.00
1.511.601.83
2.052.232.432.923.253.664.28
4.295.534.54
6.17
5.465.876.317.05
2.46
Sept. 19
2.252.25
2.292.212.23
2.642.732.86
3.984.064.12
3.99
0.310.621.27
1.691.852.102.693.083.544.20
4.845.995.03
6.35
5.635.986.517.28
2.45
Sept. 26
1.542.25
1.992.152.17
3.203.103.15
4.16AAA4.36
5.00
0.330.841.56
1.952.112.373.023.403.844.48
4.976.055.23
6.67
5.916.286.857.66
2.52
NOTE: Some of the data in this table also appear in the Board's H.I 5 (519) weeklystatistical release, available at www.federalreserve.gov/releases.
1. The daily effective federal funds rate is a weighted average of rates on trades throughNew York brokers.
2. Weekly figures are averages of seven calendar days, ending on Wednesday of the currentweek; monthly figures include each calendar day in the month.
3. Annualized using a 360-day year or bank interest. Source: U.S. Treasury.4. The rate charged for discounts made and advances extended under the Federal Reserve's
primary credit discount window program, which became effective January 9, 2003. This ratereplaces that for adjustment credit, which was discontinued after January 8, 2003. For furtherinformation, see www.federalreserve.gov/boarddocs/press/bcreg/2002/200210312/defaulthtm. The rate reported is that for the Federal Reserve Bank of New York. Historicalseries for the rate on adjustment credit is available at www.federalreserve.gov/releases/hl5/data.htm.
5. Quoted on a discount basis.6. Interest rates interpolated from data on certain commercial paper trades settled by the
Depository Trust Company. The trades represent sales of commercial paper by dealers ordirect issuers to investors (that is, the offer side). See the Board's Commercial Paperwebpages (www.federalreserve.gov/releases/cp) for more information.
7. An average of dealer offering rates on nationally traded certificates of deposit.8. Bid rates for Eurodollar deposits collected around 9:30 a.m. Eastern time. Data are for
indication purposes only.9. Yields on actively traded issues adjusted to constant maturities. Source: U.S. Treasury.10. General obligation bonds based on Thursday figures; Moody's Investors Service.11. State and local government general obligation bonds maturing in 20 years are used in
compiling this index. The 20-bond index has a rating roughly equivalent to Moody's Alrating. Based on Thursday figures.
12. Daily figures are averages of Aaa, Aa, A, and Baa yields from Moody's InvestorsService. Based on yields to maturity on selected long-term bonds.
13. Effective December 7, 2001, the Moody's Aaa yield includes yields only for industrialfirms. Prior to December 7, 2001, the Aaa yield represented both utilities and industrial.
14. Standard & Poor's corporate series. Common stock ratio is based on the 500 stocks inthe price index.

24 Federal Reserve Bulletin Statistical Supplement • December 2008
1.36 STOCK MARKET Selected Statistics
Indicator
Common stock prices (indexes)1 New York Stock Exchange
(Dec. 31,1965 = 50)
3 Transportation4 Utility5 Finance
6 Standard & Poor's Corporation(1941^3 - 10)'
7 American Stock Exchange(Aug. 31, 1973 = 50)2
Volume of trading (thousands of shares)8 New York Stock Exchange9 American Stock Exchange
10 Margin credit at broker-dealers3
Free credit balances at brokers4
11 Margin accounts5
14 Convertible bonds
2005 2006 2007
2008
Feb.
Pr
7,351.19n.a.n.a.n.a.n.a.
1,207.23
1,567.52
1,542,724n.a.
8,357.63n.a.n.a.n.a.n.a.
1,310.46
1,936.79
2,254,869n.a.
9,653.00n.a.n.a.n.a.n.a.
1,477.19
2,267.99
3,232,195n.a.
9,041.52n.a.n.a.n.a.n.a.
1,354.87
2,269.79
3,832,107n.a.
Mar.
ces and trac
8,776.21n.a.n.a.n.a.n.a.
1,316.94
2,262.29
4,601,666n.a.
Apr. May June July Aug. Sept. Oct.
ng volume (averages of daily figures)
9,174.10n.a.n.a.n.a.n.a.
1,370.47
2,297.06
3,829,875n.a.
9,429.04n.a.n.a.n.a.n.a.
1,403.22
2,351.25
3 774 019n.a.
8,996.98n.a.n.a.n.a.n.a.
1,341.25
2,293.07
4 482 650n.a.
8,427.37n.a.n.a.n.a.n.a.
1,257.33
2,153.19
5 589 370n.a.
8,362.20n.a.n.a.n.a.n.a.
1,281.47
2,078.76
4 226 522n.a.
7,886.29n.a.n.a.n.a.n.a.
1,216.93
1,889.93
6 602 084n.a.
6,130.39n.a.n.a.n.a.n.a.
968.80
1,468.58
6 880 451n.a.
Customer financing (millions of dollars, end-of-period balances)
221,660
119,71088,730
275,380
159,04094,450
285,610
156,19090,340
334,900
266,050133,670
311,660
305,600122,140
295,550
313,740100,600
310,310
325,04095,930
314,360
351,34096,090
313,290
370,20098,890
292,110
385,85090,860
299,960
193,350106,370
233,350
186,870100,330
Margin requirements (percent of market value and effective date)6
Mar. 11, 1968
705070
June 8, 1968
806080
May 6, 1970
655065
Dec. 6, 1971
555055
Nov. 24, 1972
655065
Jan. 3, 1974
505050
1. In July 1976 a financial group made up of banks and insurance companies was added tothe group of stocks on which the index is based. The index is now based on 400 industrialstocks (formerly 425), 20 transportation (formerly 15 rail), 40 public utility (formerly 60), and40 financial.
2. On July 5, 1983, the American Stock Exchange rebased its index, effectively cuttingprevious readings in half.
3. Since July 1983, under the revised Regulation T, margin credit at broker-dealers hasincluded credit extended against stocks, convertible bonds, stocks acquired through theexercise of subscription rights, corporate bonds, and government securities. Separate report-ing of data for margin stocks, convertible bonds, and subscription issues was discontinued inApril 1984.
4. Free credit balances are amounts in accounts with no unfulfilled commitments tobrokers and are subject to withdrawal by customers on demand.
5. Series initiated in June 1984.
6. Margin requirements, stated in regulations adopted by the Board of Governors pursuantto the Securities Exchange Act of 1934, limit the amount of credit that can be used topurchase and carry "margin securities" (as defined in the regulations) when such credit iscollateralized by securities. Margin requirements on securities are the difference between themarket value (100 percent) and the maximum loan value of collateral as prescribed by theBoard. Regulation T was adopted effective Oct. 15, 1934; Regulation U, effective May 1,1936; Regulation G, effective Mar. 11, 1968; and Regulation X, effective Nov. 1, 1971.
On Jan. 1, 1977, the Board of Governors for the first time established in Regulation T theinitial margin required for writing options on securities, setting it at 30 percent of the currentmarket value of the stock underlying the option. On Sept. 30, 1985, the Board changed therequired initial margin, allowing it to be the same as the option maintenance margin requiredby the appropriate exchange or self-regulatory organization; such maintenance margin rulesmust be approved by the Securities and Exchange Commission.

1.40 FEDERAL DEBT SUBJECT TO STATUTORY LIMITATIONBillions of dollars, end of month
Federal Finance 25
Sept. 30 Sept. 30 Sept. 30
1 Federal debt outstanding . . . .
2 Public debt securities3 Held by public4 Held by agencies
5 Agency securities6 Held by public7 Held by agencies
8 Debt subject to statutory limit
9 Public debt securities10 Other debt1
MEMO11 Statutory debt limit
8,530.4
8,507.04.843.23,663.8
23.423.4
.0
8,420.2.1
8,965.0
8,703.7
8,680.24,901.23,779.0
23.523.5
.0
8,592.4.1
8,965.0
8,872.9
8,849.75,054.33,795.4
23.223.2
.0
8,760.7.1
8,965.0
8,890.8
8,867.74,943.03,924.6
23.223.2
.0
8,779.1.1
8,965.0
9,030.6
9,007.75,049.23,958.4
23.023.0
.0
8,921.3.1
9,815.0
9,252.3
9,229.25,136.34,092.9
23.123.1
.0
9,144.7
9,144.6.1
9,461.1
9,437.65,334.04,103.6
23.523.5
9,358.1
9,358.1
9,515.5
9,492.05,285.04,207.0
23.523.5
9,427.9
9,427.8
10,047.8'
10,024.7'5,814.2'4,210.5'
23.1'23.1 '
9,959.8'
9,959.8'
1. Consists of guaranteed debt of U.S. Treasury and other federal agencies, specifiedparticipation certificates, notes to international lending organizations, and District of Colum-bia stadium bonds.
SOURCE: U.S. Department of the Treasury, Monthly Statement of the Public Debt of theUnited States and Monthly Treasury Statement.
1.41 GROSS PUBLIC DEBT OF U.S. TREASURY Types and Ownership
Billions of dollars, end of period
Type and holder
Q4 Ql Q2 Q3
1 Total gross public debt
By type2 Interest-bearing3 Marketable4 Bills5 Notes6 Bonds7 Inflation-indexed notes and bone8 Nonmarketable2
9 State and local government serie10 Foreign issues3
11 Government12 Public13 Savings bonds and notes14 Government account series4 . .15 Non -interest- bearing
By holder^16 U.S. Treasury and other federal agencies and trust funds . . .17 Federal Reserve Banks8
18 Private investors19 Depository institutions20 Mutual funds21 Insurance companies22 State and local treasuries7
Individuals23 Savings bonds24 Pension funds25 Private26 State and Local27 Foreign and international5
28 Other miscellaneous investors7'9
7,596.1
7,578.53,959.71,003.22,157.1
539.5245.9
3,618.8160.7
5.95.9
191.73,230.6
17.6
3,189.1717.8
3,690.6125.0254.1149.7389.1
204.4321.5170.5151.0
1,853.4393.3
8,170.4
8,117.04,184.0
963.92,326.8
516.6328.7
3,986.5235.6
3.83.8
.0191.2
3,506.653.4
3,466.9744.2
3,970.6117.2251.3160.4481.4'
205.1335.0181.2153.8
2,036.0384.1'
8,680.2
8,627.54,413.9
944.22,409.9
530.6411.2
4,338.3257.6
3.03.0
.0187.7
3,839.4124.6
3,783.1778.9
4,122.1115.1250.7159.0516.9'
202.4346.2193.2153.0
2,105.0426.8'
9,229.2
9,207.54,536.61,003.92,488.4
558.5471.7
4,692.6293.2
3.03.0
.0180.5
4,164.321.7
4,097.8740.6
4,395.7129.9362.7123.3531.5
196.4376.1211.6164.5
2,355.1320.7'
9,207.54,536.61,003.92,488.4
558.5471.7
4,692.6293.2
3.03.0
.0180.5
4,164.321.7
4,097.8740.6
4,395.7129.9362.7123.3531.5
196.4376.1211.6164.5
2,355.1320.7'
9,416.64,732.41,158.42,514.0
571.8474.1
4,705.2286.3
4.94.9
.0179.4
4,183.721.0
4,108.2591.2
4,742.9127.9464.7123.4523.6
195.3387.1222.1165.0
2,515.6405.1'
9,471.54,696.41,060.52,543.4
581.0497.5
4,795.6275.2
3.13.1
.0178.8
4,288.120.5
4,212.5478.8
4,806.2115.4449.8123.4522.2
194.9393.3226.0167.3
2,647.9'359.1
10,004.75,236.01,489.82,624.7
582.8524.5
4,788.7260.2
3.03.0
.0177.9
4,297.720.0
4,196.3476.6
5,344.2
1. The U.S. Treasury first issued inflation-indexed securities during the first quarter of1997.
2. Includes (not shown separately) securities issued to the Rural Electrification Administra-tion, depository bonds, retirement plan bonds, and individual retirement bonds.
3. Nonmarketable series denominated in dollars, and series denominated in foreign cur-rency held by foreigners.
4. Held almost entirely by U.S. Treasury and other federal agencies and trust funds.5. Data for Federal Reserve Banks and U.S. government agencies and trust funds are
actual holdings; data for other groups are Treasury estimates.6. U.S. Treasury securities bought outright by Federal Reserve Banks, see Bulletin table
1.18.7. In March 1996, in a redefinition of series, fully defeased debt backed by nonmarketable
federal securities was removed from "Other miscellaneous investors" and added to "Stateand local treasuries." The data shown here have been revised accordingly.
8. Includes nonmarketable foreign series Treasury securities and Treasury deposit funds.Excludes Treasury securities held under repurchase agreements in custody accounts at theFederal Reserve Bank of New York.
9. Includes individuals, government-sponsored enterprises, brokers and dealers, bankpersonal trusts and estates, corporate and noncorporate businesses, and other investors.
SOURCES: Data by type of security, U.S. Treasury Department, Monthly Statement of thePublic Debt of the United States; data by holder, Federal Reserve Board of Governors, Flowof Funds Accounts of the United States and U.S. Treasury Department, Treasury Bulletin,unless otherwise noted.
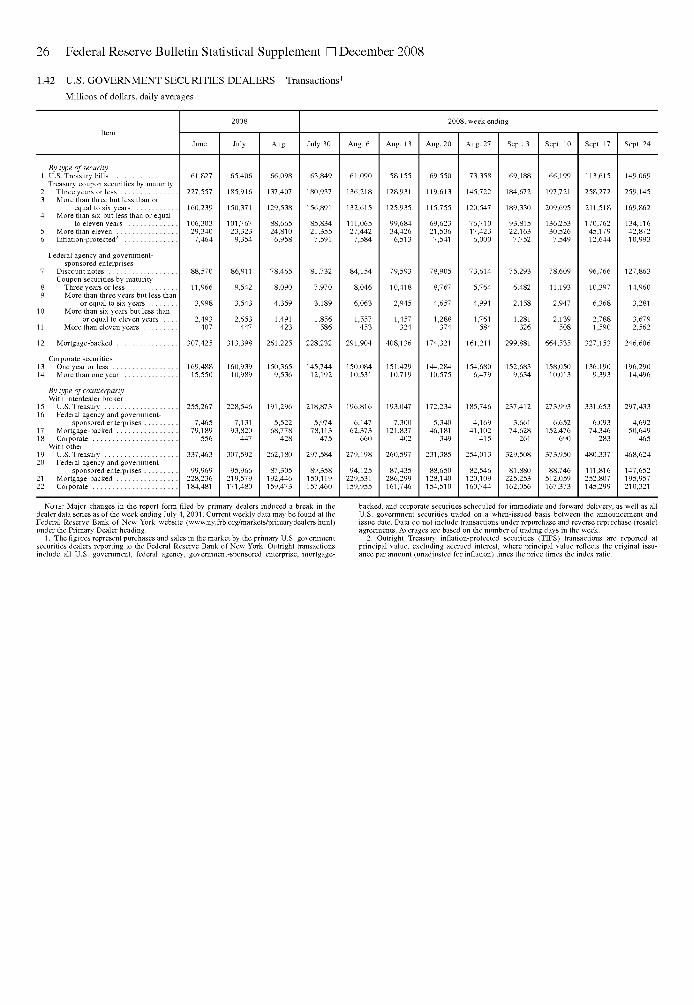
26 Federal Reserve Bulletin Statistical Supplement • December 2008
1.42 U.S. GOVERNMENT SECURITIES DEALERS Transactions1
Millions of dollars, daily averages
Item
By type of security1 U.S. Treasury bills
Treasury coupon securities by maturity2 Three years or less3 More than three but less than or
equal to six years4 More than six but less than or equal
to eleven years5 More than eleven6 Inflation-protected2
Federal agency and government-
sponsored enterprises7 Discount notes
Coupon securities by maturity8 Three years or less9 More than three years but less than
or equal to six years10 More than six years but less than
or equal to eleven years . . . .11 More than eleven years
12 Mortgage-backed
Corporate securities13 One year or less14 More than one year
By type of counterpartyWith interdealer broker
15 U.S. Treasury16 Federal agency and government-
sponsored enterprises17 Mortgage-backed18 Corporate
With other19 U.S. Treasury20 Federal agency and government-
sponsored enterprises21 Mortgage-backed22 Corporate
June
61,827
227,557
160,239
106,30329,3407,464
88,570
11,966
3,998
2,493407
307,425
169,48815,550
255,267
7,46579,189
556
337,463
99,969228,236184,481
2008
July
65,406
185,916
150,371
101,76723,323
9,354
86,911
9,542
3,543
2,653447
313,398
160,93910,989
228,546
7,13193,820
447
307,592
95,966219,579171,480
Aug.
66,098
137,407
129,538
88,66524,8106,958
78,465
8,090
4,359
1,491423
261,225
150,3659,536
191,296
5,52268,778
428
262,180
87,305192,446159,473
July 30
63,849
180,937
156,891
85,83421,3557,591
81,732
7,970
3,189
1,856586
228,232
145,74412,192
218,873
5,97478,113
475
297,584
89,358150,119157,460
Aug. 6
61,090
136,218
132,615
111,06527,4427,584
84,154
8,046
6,063
1,557453
291,904
150,08410,531
196,816
6,14762,373
660
279,198
94,125229,531159,955
Aug. 13
58,155
128,931
125,935
99,68434,426
6,513
79,593
10,418
2,945
1,457324
408,136
151,42910,719
193,047
7,300121,837
402
260,597
87,435286,299161,746
2008, week end
Aug. 20
69,550
119,613
115,755
69,62321,5367,541
78,905
8,767
4,657
1,288374
174,321
144,28410,575
172,234
5,34046,181
349
231,385
88,650128,140154,510
Aug. 27
73,358
145,722
120,547
76,71017,4236,000
73,614
5,764
4,991
1,761584
161,211
154,6806,479
185,746
4,16941,102
415
254,013
82,546120,109160,744
Sept. 3
69,188
184,672
189,330
93,81522,1637,752
75,293
6,482
2,158
1,281326
299,881
152,6839,634
237,412
3,66174,628
261
329,508
81,880225,253162,056
Sept. 10
66,199
197,721
209,695
136,25330,5267,549
78,609
11,193
2,947
2,139508
664,535
158,05010,013
273,993
6,652152,476
690
373,950
88,746512,059167,373
Sept. 17
113,615
258,272
211,518
170,76245,17912,644
96,766
10,397
6,368
2,7881,590
327,153
136,1909,393
331,653
6,09374,346
283
480,337
111,816252,807145,299
Sept. 24
149,069
259,145
169,862
134,11642,87210,993
127,863
14,960
3,281
3,6792,562
246,606
196,29014,496
297,433
4,69250,649
465
468,624
147,652195,957210,321
NOTE: Major changes in the report form filed by primary dealers induced a break in thedealer data series as of the week ending July 4, 2001. Current weekly data may be found at theFederal Reserve Bank of New York website (www.ny.frb.org/markets/primarydealers.html)under the Primary Dealer heading.
1. The figures represent purchases and sales in the market by the primary U.S. governmentsecurities dealers reporting to the Federal Reserve Bank of New York. Outright transactionsinclude all U.S. government, federal agency, government-sponsored enterprise, mortgage-
backed, and corporate securities scheduled for immediate and forward delivery, as well as allU.S. government securities traded on a when-issued basis between the announcement andissue date. Data do not include transactions under repurchase and reverse repurchase (resale)agreements. Averages are based on the number of trading days in the week.
2. Outright Treasury inflation-protected securities (TIPS) transactions are reported atprincipal value, excluding accrued interest, where principal value reflects the original issu-ance par amount (unadjusted for inflation) times the price times the index ratio.

1.43 U.S. GOVERNMENT SECURITIES DEALERS Positions and Financing'
Millions of dollars
Federal Finance 27
Item, by type of security
1 U.S. Treasury billsTreasury coupon securities by maturity
2 Three years or less3 More than three years but less than
or equal to six years4 More than six but less than
or equal to eleven years5 More than eleven6 Inflation-protected
Federal agency and government-sponsored enterprises
7 Discount notesCoupon securities, by maturity
8 Three years or less9 More than three years but less than
or equal to six years10 More than six but less than
or equal to eleven years11 More than eleven
12 Mortgage-backed
Corporate securities13 One year or less14 More than one year
Securities in, U.S. Treasury15 Overnight and continuing16 Term
Federal agency and government-sponsored enterprises
17 Overnight and continuing18 Term
Mortgage-backed securities19 Overnight and continuing20 Term
Corporate securities21 Overnight and continuing22 Term
MEMOReverse repurchase agreements
23 Overnight and continuing24 Term
Securities out, U.S. Treasury25 Overnight and continuing26 Term
Federal agency and government-sponsored enterprises
27 Overnight and continuing28 Term
Mortgage-backed securities29 Overnight and continuing30 Term
Corporate securities31 Overnight and continuing32 Term
MEMORepurchase agreements
33 Overnight and continuing34 Term
June
9,108
-13,449
-30,476
-25,824-3,488
1,755
54,028
75,508
6,354
7,9018,370
62,796
42,634146,739
2008
July
-8,664
-22,891
-27,760
-25,152-2303,895
57,330
81,601
4,987
6,5648,099
61,635
43,069137,203
Aug.
-740
-36,335
-29,420
-22,4212,3866,646
61,525
85,735
3,289
6,8398,667
62,801
37,968125,719
July 30
-9,778
-33,898
-22,506
-29,084586
6,299
60,737
81,134
2,716
6,1868,757
62,980
41,631132,535
Aug. 6
Net
-12,392
-31,509
-29,412
-24,652-4286,723
62,683
83,833
3,092
6,5148,474
60,869
40,916127,956
Aug. 13
outright posit
81
-40,704
-25,925
-24,4313,4747,664
65,388
87,385
3,113
7,2288,720
60,990
43,635129,068
2008, week ending
Aug. 20
ons2
247
-40,268
-27,973
-22,2392,8336,572
62,091
83,425
2,793
6,8408,836
62,980
37,758128,309
Aug. 27
4,727
-35,826
-32,201
-18,4363,4256,226
58,703
86,754
3,859
6,7978,488
66,621
29,760120,795
Sept. 3
4,007
-29,939
-33,212
-22,8472,0995,614
56,972
87,962
3,765
6,7158,885
61,870
38,359120,591
Sept. 10
15,171
-32,680
-32,689
-19,9681,3765,937
60,323
90,108
3,346
6,8639,073
80,468
40,273119,295
Sept. 17
-25,945
-30,619
-22,192
-17,1001,8148,056
66,501
91,628
5,284
10,1449,176
87,403
46,394117,326
Financing3
1 466 6481,352,148
261,210326,870
193,240425,296
124,36559,967
1,144,1681,755,197
1 450 4301,149,620
485,274221,872
786,025201,867
303,72074,983
2,660,6611,562,900
1 472 0281,108,319
270,347319,653
205,437413,308
117,09563,639
1,122,6651,500,834
1 449 923907,866
478,621234,554
781,463208,310
295,05169,649
2,623,6311,331,346
1 497 6951,118,859
280,108325,384
235,693410,709
115,22763,738
1,178,6461,515,967
1 488 321904,837
483,357257,952
811,420202,229
279,91173,367
2,688,1991,340,781
1 409 1211,167,101
273,759324,539
229,168426,278
114,69964,358
1,073,8371,562,770
1 411 941955,729
468,242250,827
793,559216,001
283,41372,507
2,592,5371,396,396
1 512 4961,096,735
293,266321,931
258,890401,740
114,83064,503
1,234,6721,481,495
1 512 181874,167
478,803260,446
839,854182,195
287,98673,166
2,732,3711,293,366
1 471 8651,163,328
268,677332,421
237,274414,894
115,33963,443
1,145,8301,568,745
1 485 213935,609
474,440263,564
809,869207,423
288,31773,392
2,680,0101,377,895
1 522 0561,095,492
269,187327,027
239,380418,092
114,84564,372
1,192,7201,512,601
1 495 872903,841
478,930258,041
820,500203,019
278,57174,047
2,703,0401,346,934
1 458 3281,128,125
283,745324,308
231,640409,784
115,06262,814
1,131,4901,516,559
1 436 556918,197
487,457258,391
807,955216,162
271,48772,239
2,632,2921,364,503
1 546 9541,098,897
293,125317,256
198,772405,541
116,58163,615
1,209,9291,480,167
1 535 345875,354
506,364243,468
761,655197,426
270,17374,410
2,708,1371,294,673
1,538,9991,155,839
301,599347,968
206,553410,288
115,17064,465
1,218,0841,569,790
1 533 059933,795
519,414267,706
808,692205,453
261,24275,323
2,764,7861,390,209
1,444,2021,166,071
240,061303,761
165,496443,017
90,51060,297
1,114,8681,598,657
1,488,196935,247
417,426233,290
873,532201,930
234,27366,301
2,673,6301,355,371
NOTE: Major changes in the report form filed by primary dealers included a break in manyseries as of the week ending July 4, 2001. Current weekly data may be found at the FederalReserve Bank of New York website (www.ny.frb.org/markets/primarydealers.html) under thePrimary Dealer heading.
1. Data for positions and financing are obtained from reports submitted to the FederalReserve Bank of New York by the U.S. government securities dealers on its published list ofprimary dealers. Weekly figures are close-of-business Wednesday data. Positions for calendardays of the report week are assumed to be constant. Monthly averages are based on thenumber of calendar days in the month.
2. Net outright positions include all U.S. government, federal agency, government-sponsored enterprise, mortgage-backed, and corporate securities scheduled for immediate andforward delivery, as well as U.S. government securities traded on a when-issued basisbetween the announcement and issue date.
3. Figures cover financing U.S. government, federal agency, government-sponsored enter-prise, mortgage-backed, and corporate securities. Financing transactions for Treasuryinflation-protected securities (TIPS) are reported in actual funds paid or received, except forpledged securities. TIPS that are issued as pledged securities are reported at par value, whichis the value of the security at original issuance (unadjusted for inflation).

28 Federal Reserve Bulletin Statistical Supplement • December 2008
1.44 FEDERAL AND FEDERALLY SPONSORED CREDIT AGENCIES Debt Outstanding
Millions of dollars, end of period
Agency
Apr. May July
1 Federal and federally sponsored agencies
2 Federal agencies3 Defense Department1
4 Export-Import Bank^3
5 Federal Housing Administration4
6 Government National Mortgage Association certificates ofparticipation5
7 Postal Service6
8 Tennessee Valley Authority9 United States Railway Association6
10 Federally sponsored agencies7
11 Federal Home Loan Banks12 Federal Home Loan Mortgage Corporation13 Federal National Mortgage Association14 Farm Credit Bankss
15 Student Loan Marketing Association9
16 Financing Corporation10
17 Farm Credit Financial Assistance Corporation "18 Resolution Funding Corporation12
MEMO19 Federal Financing Bank debt13
Lending to federal and federally sponsored agencies20 Export-Import Bank3
21 Postal Service6
22 Student Loan Marketing Association23 Tennessee Valley Authority24 United States Railway Association6
Other lending^25 Farmers Home Administration26 Rural Electrification Administration27 Other
24,2676
24,261
854,815733,400949,51097,26678,121
8,1701,261
29,996
n.a.
23,8436
n.a.161
n.a.n.a.
23,837n.a.
n.a.921,793773,600754,535113,02191,929
8,1701,261
29,996
28^25
n.a.n.a.n.a.n.a.n.a.
18,515n.a.9,810
23,5206
23,514
3,1516
n.a.84
n.a.n.a.3,145n.a.
n.a.n.a.n.a.n.a.n.a.n.a.n.a.n.a.n.a.
23,4706
n.a.69
n.a.n.a.
23,464n.a.
n.a.n.a.n.a.n.a.n.a.n.a.n.a.n.a.n.a.
3,1696
n.a.66
n.a.n.a.3,163n.a.
n.a.n.a.n.a.n.a.n.a.n.a.n.a.n.a.n.a.
23,1766
n.a.67
n.a.n.a.
23,170n.a.
n.a.n.a.n.a.n.a.n.a.n.a.n.a.n.a.n.a.
32,422
n.a.n.a.n.a.n.a.n.a.
n.a.n.a.
32,422
29,772
n.a.n.a.n.a.n.a.n.a.
n.a.n.a.
29,772
n.a.
23,5336
n.a.65
n.a.n.a.
23,527n.a.
n.a.n.a.n.a.n.a.n.a.n.a.n.a.n.a.n.a.
30,999
n.a.n.a.n.a.n.a.n.a.
n.a.n.a.
30,999
1. Consists of mortgages assumed by the Defense Department between 1957 and 1963under family housing and homeowners' assistance programs.
2. Includes participation certificates reclassified as debt beginning Oct. 1, 1976.3. On-budget since Sept. 30, 1976.4. Consists of debentures issued in payment of Federal Housing Administration insurance
claims. Once issued, these securities may be sold privately on the securities market.5. Certificates of participation issued before fiscal year 1969 by the Government National
Mortgage Association acting as trustee for the Farmers Home Administration; the Departmentof Health, Education, and Welfare; the Department of Housing and Urban Development; theSmall Business Administration; and the Veterans Administration.
6. Off-budget.7. Includes outstanding noncontingent liabilities: notes, bonds, and debentures. Includes
Federal Agricultural Mortgage Corporation; therefore, details do not sum to total. Some dataare estimated.
8. Excludes borrowing by the Farm Credit Financial Assistance Corporation, which isshown on line 17.
9. Before late 1982, the association obtained financing through the Federal Financing Bank(FFB). Borrowing excludes that obtained from the FFB, which is shown on line 22.
10. The Financing Corporation, established in August 1987 to recapitalize the FederalSavings and Loan Insurance Corporation, undertook its first borrowing in October 1987.
11. The Farm Credit Financial Assistance Corporation, established in January 1988 toprovide assistance to the Farm Credit System, undertook its first borrowing in July 1988.
12. The Resolution Funding Corporation, established by the Financial InstitutionsReform, Recovery, and Enforcement Act of 1989, undertook its first borrowing in October1989.
13. The FFB, which began operations in 1974, is authorized to purchase or sell obligationsissued, sold, or guaranteed by other federal agencies. Because FFB incurs debt solely for thepurpose of lending to other agencies, its debt is not included in the main portion of the table toavoid double counting.
14. Includes FFB purchases of agency assets and guaranteed loans; the latter are loansguaranteed by numerous agencies, with the amounts guaranteed by any one agency generallybeing small. The Farmers Home Administration entry consists exclusively of agency assets,whereas the Rural Electrification Administration entry consists of both agency assets andguaranteed loans.
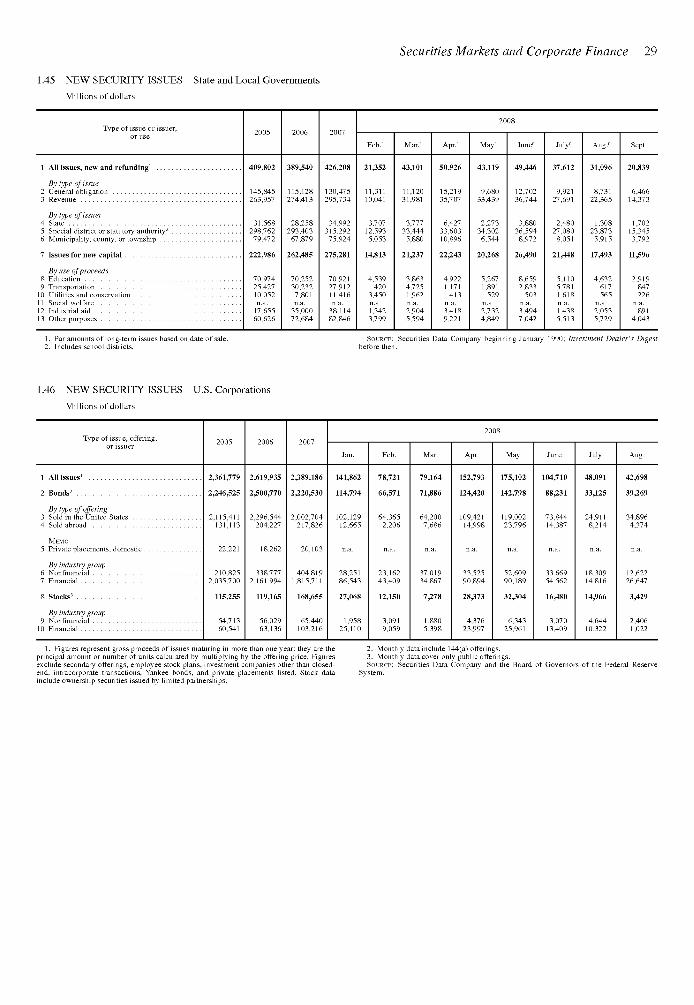
1.45 NEW SECURITY ISSUES State and Local GovernmentsMillions of dollars
Securities Markets and Corporate Finance 29
Type of issue or issuer,or use
Apr/ Mayr July' Aug.r Sept.
1 All issues, new and refunding1
By type of issue2 Geneial obligation3 Revenue
By type of issuer4 State5 Special district 01 statutoiy authority2
6 Municipality, county, 01 township
7 Issues for new capital
By use of proceeds8 Education9 Transportation
10 Utilities and conseivation11 Social welfare12 Industrial aid13 Othei puiposes
409,802
145,845263,957
31,568298,76279,472
222,986
70,97425,42710,052n.a.
17,65560,626
389,540
115,128274,413
28,258293,403
67,879
262,485
70,25230,2327,801n.a.
35,00072,684
426,208
130,475295,734
34,992315,29275,924
275,281
70,92127,91211,416n.a.
38,11482,846
21,352
11,31110,041
3,70712,5935,053
14,813
4,539420
3,450n.a.1,3423,799
43,101
11,12031,981
3,77733,444
5,880
21,237
3,8634,7251,962n.a.2,9045,594
50,926
15,21935,707
6,42733,60310,896
22,243
4,9221,171
413n.a.3,4189,221
43,119
9,68033,439
2,27334,3026,544
20,268
5,2671,891
529n.a.2,7324,849
49,446
12,70236,744
3,88036,5948,972
26,490
8,6592,833
503n.a.3,4947,042
37,612
9,92127,691
2,48027,0808,051
21,448
5,1105,7811,618n.a.1,4385,513
31,096
8,73122,365
1,30823,8735,915
17,493
4,632617565
n.a.2,0535,729
20,839
6,46614,373
1,70215,3453,792
11,596
2,919847226
n.a.891
4,043
SOURCE: Securities Data Company beginning January 1990; Investment Dealer's Digestbefore then.
1. Pal amounts of long-teim issues based on date of sale.2. Includes school distiicts.
1.46 NEW SECURITY ISSUES U.S. Corporations
Millions of dollars
Type of issue, offering,01issuei
1 All issues1
By type of offering3 Sold in the United States
MEMO5 Private placements, domestic
By industry group
7 Financial
8 Stocks3
By industry group
10 Financial
2005
2,361,779
2,246,525
2,115,411131 113
22,221
210,8252,035,700
115,255
54,71360,541
2006
2,619,935
2,500,770
2,296,544204 227
18,262
338,7772,161,994
119,165
56,02963,136
2007
2,389,186
2,220,530
2,002,704217 826
20,103
404,8191,815,711
168,655
65,440103,216
2008
Jan.
141,862
114,794
102,12912 665
n.a.
28,25186,543
27,068
1,95825,110
Feb.
78,721
66,571
64,3652 206
n.a.
23,16243,409
12,150
3,0919,059
Mai.
79,164
71,886
64,2007 686
n.a.
37,01934,867
7,278
1,8805,398
Api.
152,793
124,420
109,42114 998
n.a.
33,52590,894
28,373
4,37623,997
May
175,102
142,798
119,00223 796
n.a.
52,60990,189
32,304
6,34325,961
June
104,710
88,231
73,84414 387
n.a.
33,66954,562
16,480
3,07013,409
July
48,091
33,125
24,9118 214
n.a.
18,30914,816
14,966
4,64410,322
Aug.
42,698
39,269
34,8964 374
n.a.
12,62226,647
3,429
2,4061,022
1. Figures represent gross proceeds of issues maturing in more than one year; they are theprincipal amount or number of units calculated by multiplying by the offering price. Figuresexclude secondary offerings, employee stock plans, investment companies other than closed-end, intracorporate transactions, Yankee bonds, and private placements listed. Stock datainclude ownership securities issued by limited partnerships.
2. Monthly data include 144(a) offerings.3. Monthly data cover only public offerings.SOURCE: Securities Data Company and the Board of Governors of the Federal Reserve
System.

30 Federal Reserve Bulletin Statistical Supplement • December 2008
1.47 OPEN-END INVESTMENT COMPANIES Net Sales and Assets1
Millions of dollars
Item
1 Sales of own shares2
2 Redemptions of own shares
4 Assets4
5 Cash5
6 Other
2006
2,009,480
1,782,393227,087
8,058,059
345,0667,712,993
2007'
2,530,131
2,306,301223,830
8,914,249
378,7958,535,454
2008
Mar.
200,928
201,377-449
8,263,656
383,6127,880,044
Apr.
229,537
198,28431,253
8,634,205
421,2238,212,982
May
205,830
169,77536,055
8,814,797
429,1198,385,678
June
189,241
188,805436
8,276,887
408,3247,868,563
July
193,122
220,070-26,948
8,100,821
376,8207,724,001
Aug.
165,304
177,441-12,137
8,069,019
388,1457,680,874
Sept/
203,056
266,872-63,816
7,245,214
357,9006,887,314
Oct.
239,719
366,566-126,847
6,009,443
311,1045,698,339
1. Data include stock, hybrid, and bond mutual funds and exclude money market mutualfunds.
2. Excludes reinvestment of net income dividends and capital gains distributions and shareissue of conversions from one fund to another in the same group.
3. Excludes sales and redemptions resulting from transfers of shares into or out of moneymarket mutual funds within the same fund family.
4. Market value at end of period, less current liabilities.5. Includes all U.S. Treasury securities and other short-term debt securities.SOURCE: Investment Company Institute. Data based on reports of membership, which
comprises substantially all open-end investment companies registered with the Securities andExchange Commission. Data reflect underwritings of newly formed companies after theirinitial offering of securities.
1.51 DOMESTIC FINANCE COMPANIES Assets and Liabilities1
Billions of dollars, end of period; not seasonally adjusted
ASSETS
2 Consumer
4 Real estate
5 LESS: Reserves for unearned income
8 All other
9 Total assets
10 Bank loans11 Commercial paper
Debt12 Owed to parent
14 All other liabilities15 Capital, surplus, and undivided profits
16 Total liabilities and capital
1 622 4601.8479.2541.4
44.724 5
1 553 2535.7
2,088.8
142.1160.0
312.2806.5423.6244.4
2,088.8
1 732 7640.3498.0594.4
49.226 6
1 656 8486.4
2,143.3
129.2165.3
338.5849.7424.2236.4
2,143.3
1,761.7707.0522.9531.9
50.133 6
1 678 0498.3
2,176.3
182.0123.5
321.4974.1387.7187.6
2,176.3
Qlr
1,727.9642.7505.4579.8
50.725 5
1 651 6497.7
2,149.4
138.1132.5
327.0963.6387.4200.8
2,149.4
2007
Q2'
1,731.3659.0509.2563.2
50.625 5
1 655 2505.2
2,160.4
153.5127.0
344.4959.8385.1190.6
2,160.4
Q3P
1,756.3688.1507.8560.4
50.228 6
1 677 5515.7
2,193.2
176.7119.8
327.8983.9392.4192.7
2,193.2
Q4'
1,761.7707.0522.9531.9
50.133 6
1 678 0498.3
2,176.3
182.0123.5
321.4974.1387.7187.6
2,176.3
Qlr
1,773.4705.6541.9525.8
51.334 7
1 687 4522.0
2,209.4
183.4113.5
328.71,004.5
391.7187.6
2,209.4
2008
Q2r
1,759.2703.7563.9491.6
49.336 3
1 673 6520.4
2,194.1
197.6112.4
319.9989.3391.5183.4
2,194.1
Q3
1,740.4714.8557.0468.6
48.741 0
1 650 6513.5
2,164.1
169.2103.3
326.9986.7392.4185.7
2,164.1
NOTE: Some of the data presented in the table is available in the Board's monthly G.20(422) statistical release, which is available at www.federalreserve.gov/releases.
1. Includes finance company subsidiaries of bank holding companies but not of retailersand banks. Data are amounts carried on the balance sheets of finance companies; securitizedpools are not shown, as they are not on the books.
2. Before deduction for unearned income and losses. Excludes pools of securitized assets.

1.52 DOMESTIC FINANCE COMPANIES Owned and Managed Receivables1
Billions of dollars, amounts outstanding
Securities Markets and Corporate Finance 31
Type of credit
Apr. May July' Aug. Sept.
Seasonally adjusted
2 Consumer . . .3 Real estate . .4 Business
6 Consumer7 Motor vehicle loans8 Motor vehicle leases9 Revolving2
10 Other3
Securitized assets4
11 Motor vehicle loans12 Motor vehicle leases13 Revolving14 Other15 Real estate16 One- to four-family17 Other
Securitized real estate assets4
18 One- to four-family19 Other20 Business21 Motor vehicles22 Retail loans23 Wholesale loans5
24 Leases25 Equipment26 Loans27 Leases28 Other business receivables6 . . .
Securitized assets4
29 Motor vehicles30 Retail loans31 Wholesale loans32 Leases33 Equipment34 Loans35 Leases36 Other business receivables6 .
775.2560.4559.7
781.4278.0
85.366.3
172.3
112.64.2
14.947.8
565.0489.8
51.6
18.94.8
564.5105.5
15.261.229.0
281.993.6
188.391.8
28.82.7
26.0.1
24.411.612.832.2
2,009.8
819.4609.9580.6
2,049.1'
887.4569.0'592.7
891.2562.0'614.3
891.2552.1'620.3
2,045.2'
885.9529.3'630.0
886.1523.4638.3
881.0512.0640.0
Not seasonally adjusted
2,026.2
825.4259.8106.079.9
194.7
112.83.6
15.952.8
614.8538.156.2
16.83.7
586.0105.117.155.732.3
299.5102.4197.193.5
38.03.0
34.9.1
15.49.95.5
34.6
2,065.8'
893.5261.5'122.986.0
236.5'
110.7'3.1
25.644.7
573.8'474.2
59.1
34.9'5.6'
598.6105.7
16.456.932.4
319.4106.1213.3
94.4
33.62.6
30.9.1
13.19.23.9
32.4
884.2255.1'125.583.1
245.7
98.1'3.0
25.143.2
560.1'451.9
68.3
34.55.4'
620.7108.5
15.161.631.8
334.6114.6220.0102.8
28.42.6
25.8.1
13.89.74.1
32.6
884.4254.1'125.383.9
246.5
98.3'2.9
24.842.9
552.4'442.670.0
34.45.4'
627.0110.014.863.431.8
342.0114.8227.2103.1
24.72.5
22.1.1
13.79.64.1
33.5
2,044.5'
880.4250.2'121.984.0
247.6
101.0'2.9
24.542.4
528.3'420.4
71.1
31.45.4'
635.7112.814.764.533.6
347.2113.5233.7103.9
23.62.5
21.1.1
13.79.54.2
34.5
883.7252.6122.183.9
250.1
99.22.9
24.541.9
522.4414.371.5
31.35.3
630.3108.314.560.233.6
349.6115.3234.3103.5
22.12.5
19.6.0
13.29.14.1
33.5
883.0256.6120.883.6
252.2
93.82.8
24.641.4
511.2402.0
72.7
31.35.3
630.5101.4
14.453.333.7
354.5118.2236.4102.5
27.52.5
25.0.0
11.97.94.0
32.6
2,017.2
876.0507.8633.4
2,012.8
881.6258.5118.583.3
254.4
90.72.8
24.741.0
504.9395.273.4
31.25.2
626.297.314.152.430.8
356.6119.0237.5103.2
26.12.4
23.7.0
11.67.63.9
31.4
NOTE: This table has been revised to incorporate several changes resulting from thebenchmarking of finance company receivables to the June 1996 Survey of Finance Compa-nies. In that benchmark survey, and in the monthly surveys that have followed, more-detailedbreakdowns have been obtained for some components. In addition, previously unavailabledata on securitized real estate loans are now included in this table. The new information hasresulted in some reclassification of receivables among the three major categories (consumer,real estate, and business) and in discontinuities in some component series between May andJune 1996.
Includes finance company subsidiaries of bank holding companies but not of retailers andbanks. Data in this table also appear in the Board's G.20 (422) monthly statistical release,available at www.federalreserve.gov/releases.
1. Owned receivables are those carried on the balance sheet of the institution. Managedreceivables are outstanding balances of pools upon which securities have been issued; thesebalances are no longer carried on the balance sheets of the loan originator. Data are shown
before deductions for unearned income and losses. Components may not sum to totalsbecause of rounding.
2. Excludes revolving credit reported as held by depository institutions that are subsidiar-ies of finance companies.
3. Includes personal cash loans, mobile home loans, and loans to purchase other types ofconsumer goods, such as appliances, apparel, boats, and recreation vehicles.
4. Outstanding balances of pools upon which securities have been issued; these balancesare no longer carried on the balance sheets of the loan originator.
5. Credit arising from transactions between manufacturers and dealers—that is, floor planfinancing.
6. Includes loans on commercial accounts receivable, factored commercial accounts, andreceivable dealer capital; small loans used primarily for business or farm purposes; andwholesale and lease paper for mobile homes, campers, and travel trailers.

32 Federal Reserve Bulletin Statistical Supplement • December 2008
1.53 MORTGAGE MARKETS Mortgages on New Homes
Millions of dollars except as noted
Item
PRIMARY MARKETS
Terms]
1 Purchase price (thousands of dollars)2 Amount of loan (thousands of dollars)3 Loan-to-price ratio (percent)4 Maturity (years)5 Fees and charges (percent of loan amount)2
Yield (percent per year)6 Contract rate1
8 Contract rate (HUD series)4
SECONDARY MARKETS
Yield (percent per year)
10 GNMA securities6
FEDERAL NATIONAL MORTGAGEASSOCIATION
Mortgage holdings (end of period)11 Total12 FHA/VA insured13 Conventional
14 Mortgage transactions purchased (during period)
Mortgage commitments (during period)15 Issued7
16 To sells
FEDERAL HOME LOAN MORTGAGE CORPORATION
Mortgage holdings (end of period)*17 Total18 FHA/VA insured19 Conventional
Mortgage transactions (during period)
21 Sales
22 Mortgage commitments contracted (during period)9
2005 2006 2007
Apr.
Terms and y
326.8238.575.329.2
.54
5.865.93
n.a.
n.a.5.13
727,545n.a.n.a.
146,641
n.a.
710,017n.a.n.a.
n.a.397,867
n.a.
345.7253.475.429.5
.66
6.506.60
n.a.
n.a.5.70
724,400n.a.n.a.
196,017
n.a.
703,629n.a.n.a.
n.a.360,023
n.a.
360.7269.977.129.4
.81
6.306.42
n.a.
n.a.5.71
723,976n.a.n.a.
182,470
n.a.
720,813n.a.n.a.
n.a.470,976
n.a.
346.3252.476.428.9
.64
5.895.98
n.a.
n.a.5.22
May June
2008
July Aug. Sept. Oct.
elds in primary and secondary markets
339.4254.277.329.2
.67
5.926.01
n.a.
n.a.5.27
352.7258.375.629.1
.91
5.996.13
n.a.
n.a.5.76
349.1254.875.529.3
.94
6.156.29
n.a.
n.a.5.66
Activity in secondary markets
728,414n.a.n.a.
17,961
n.a.
737,537n.a.n.a.
n.a.40,779
n.a.
736,925n.a.n.a.
20,001
n.a.
770,383n.a.n.a.
n.a.47,310
n.a.
749,640n.a.n.a.
23,385
n.a.
791,798n.a.n.a.
n.a.43,981
n.a.
758,112n.a.n.a.
18,214
n.a.
798,241n.a.n.a.
n.a.21,712
n.a.
358.1261.275.229.11.03
6.186.33
n.a.
n.a.5.68
759,980n.a.n.a.
13,614
n.a.
760,883n.a.n.a.
n.a.22,072
n.a.
353.5253.473.928.61.07
5.936.09
n.a.
n.a.5.20
761,396n.a.n.a.
14,572
n.a.
736,876n.a.n.a.
n.a.21,994
n.a.
n.a.n.a.n.a.n.a.n.a.
n.a.n.a.n.a.
n.a.5.66
777,112n.a.n.a.
24,606
n.a.
n.a.n.a.n.a.
n.a.n.a.
n.a.
1. Weighted averages based on sample surveys of mortgages originated by major institu-tional lender groups for purchase of newly built homes; compiled by the Federal HousingFinance Board in cooperation with the Federal Deposit Insurance Corporation.
2. Includes all fees, commissions, discounts, and "points" paid (by the borrower or theseller) to obtain a loan.
3. Average effective interest rate on loans closed for purchase of newly built homes,assuming prepayment at the end of ten years.
4. Average contract rate on new commitments for conventional first mortgages; from U.S.Department of Housing and Urban Development (HUD). Based on transactions on the firstday of the subsequent month.
5. Average gross yield on thirty-year, minimum-do wnpayment first mortgages insured bythe Federal Housing Administration (FHA) for immediate delivery in the private secondarymarket. Based on transactions on first day of subsequent month.
6. Average net yields to investors on fully modified pass-through securities backed bymortgages and guaranteed by the Government National Mortgage Association (GNMA),assuming prepayment in twelve years on pools of thirty-year mortgages insured by theFederal Housing Administration or guaranteed by the Department of Veterans Affairs.
7. Does not include standby commitments issued but includes standby commitmentsconverted.
8. Includes participation loans as well as whole loans.9. Includes conventional and government-underwritten loans. The Federal Home Loan
Mortgage Corporation's mortgage commitments and mortgage transactions include activityunder mortgage securities swap programs, whereas the corresponding data for the FederalNational MortgageAssociation exclude swap activity.
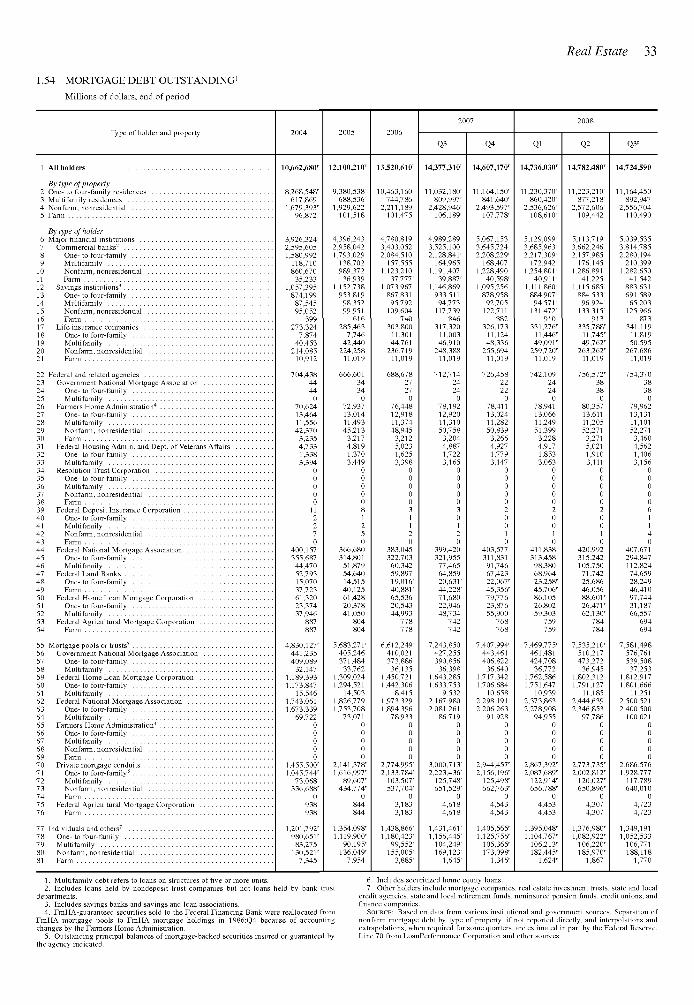
1.54 MORTGAGE DEBT OUTSTANDING1
Millions of dollars, end of period
Real Estate 33
Type of holder and propertyQ3 Q4 Q1 Q2 Q3>
1 All holders .
By type of property2 One- to four-family residences3 Multifamily residences4 Nonfarm, nonresidential5 Farm
By type of holder6 Major financial institutions . . .7 C i l b k 2789101112131415161718192021
222324252627282930313233343536373839404142434445464748495051525354
jCommercial banks2
One- to four-familyMultifamilyNonfarm, nonresidentialFarm
Savings institutions3
One- to four-familyMultifamilyNonfarm, nonresidentialFarm
Life insurance companies .One- to four-familyMultifamilyNonfarm, nonresidentialFarm
Federal and related agenciesGovernment National Mortgage Association
One- to four-familyMultifamily
Farmers Home Administration4
One- to four-familyMultifamilyNonfarm, nonresidentialFarm
Federal Housing Admin, and Dept. of Veterans AffairsOne- to four-familyMultifamily
Resolution Trust CorporationOne- to four-familyMultifamilyNonfarm, nonresidentialFarm
Federal Deposit Insurance CorporationOne- to four-familyMultifamilyNonfarm, nonresidentialFarm
Federal National Mortgage AssociationOne- to four-familyMultifamily
Federal Land BanksOne- to four-familyFarm
Federal Home Loan Mortgage CorporationOne- to four-familyMultifamily
Federal Agricultural Mortgage CorporationFarm
One- to four-familyMultifamily
Federal Home Loan Mortgage CorporationOne- to four-familyMultifamily
Federal National Mortgage Association . . .One- to four-familyMultifamily
Farmers Home Administration4
One- to four-familyMultifamilyNonfarm, nonresidentialFarm
Private mortgage conduitsOne- to four-family1"MultifamilyNonfarm, nonresidentialFarm
Federal Agricultural Mortgage CorporationFarm
77 Individuals and others7 . . .78 One- to four-family79 Multifamily80 Nonfarm, nonresidential81 Farm
10,662,680'
8,268,548'617,869
1 679 393'96,872
12,100,210'
9,380,538'688,536'
1,929,622'101,518
13,520,610' 14,736,030' 14,782,480' 14,724,590
10,463,160'744,786'
2,211,189'101,475'
11,032,180'809,997'
2,428,946'106,189'
3,926,3242,595,6051,580,992
118,710860,670
35,2331,057,395
874,19987,54595,052
599273,324
7,87440,453
214,08510,912
704,4384444
070,62413,46411,55642,370
3,2354,7331,3383,394
000
112
70
400,157355,68744,47052,79315,07037,72361,32023,37437,946
887887
4,830,127'441,235409,089
32,1471,189,3931,173,847
15,5461,743,0611,673,339
69,7220
0
01,455,500'1,045,744'
73,068336,688'
0938938
4,396,2432,958,0421,793,029
138,702989,372
36,9391,152,738
953,81998,35299,951
616285,463
7,74642,440
224,25811,019
666,6013434
072,93713,01411,49345,213
3,2174,8191,3703,449
0000081250
366,680314,801
51,87954,64014,51540,12561,42820,37841,050
804804
5,683,271'405,246371,484
33,7621,309,0241,294,521
14,5031,826,7791,753,708
73,0710000
2,141,378'1,616,997'
89,607'434,774'
0844844
4,780,8193,403,0522,084,510'
157,5551,123,210
37,777'1,073,967
867,83195,792
109,604740
303,80011,30144,761
236,71911,019
688,67827270
76,44812,91811,37448,945
3,2125,0231,6253,398
00000
1120
383,045322,70360,34259,89719,016'40,881'65,53620,54344,993
778778
6,612,249'410,021373,88636,135
1,450,7211,442,306
8,4151,973,3291,894,396
78,93300000
2,774,995'
4,989,2893,525,1002,128,841'
164,9651,191,407
39,887'1,146,869
933,51194,773
117,739846
317,32011,00346,910
248,38811,019
712,71424240
78,19212,92011,31050,7583,2044,8871,7223,165
00000
0120
399,420321,95577,46564,85920,631'44,228'71,68022,94648,734
742742
7,243,850'427,255390,856
36,3981,643,2851,633,753
9,5322,167,9802,081,261
86,71900000
3,000,713'
11,164,150'841,640'
2,493,597'107,778'
5,067,1533,645,7242,208,229'
168,4071,228,490
40,598'1,095,256
878,95892,705
122,711882
326,17311,12448,336
255,69411,019
726,4582222
078,41113,02411,28250,8393,2664,9271,7793,147
00000
0010
403,577311,83191,74667,42322,067'45,356'79,77623,87655,900
768768
7,407,994'443,461406,822
36,6401,717,3421,706,684
10,6582,298,1912,206,263
91,92800000
2,944,457'
11,230,370'860,420'
2,536,626'108,610'
5,129,099'3,685,963'2,217,309'
172,942'1,254,801'
40,911'1,111,860'
884,907'94,571'
131,472'910
331,276'11,446'49,091'
259,720'11,019
742,10924240
78,94113,06611,24951,399
3,2284,9171,8533,063
0000020
411,838313,45898,38068,96423,258'45,706'86,10526,80259,303
759759
7,469,775'461,481424,708
36,7721,762,5861,751,647
10,9392,373,8632,278,908
94,9550000
877,218'2,572,606'
109,442
5,113,719'3,662,246'2,157,985'
176,145'1,286,891'
41,2251,115,685'
884,533'96,924'
133,315'913
335,788'11,745'49,762'
263,262'11,019
756,572'38380
80,35713,61111,20552,2713,2715,0211,9103,111
0000020
420,992315,242105,75071,74225,68646,05688,601'26,471'62,130'
784784
7,535,210'510,217473,272
36,9451,802,3121,791,127
11,1852,444,6392,346,853
97,7860000
2,133,784'103,507'537,704'
03,1833,183
2,223,436'125,748'651,529'
04,6184,618
2,156,196'125,498'662,763'
04,5434,543
1,201,792'980,651'
83,275130,521'
7,345
1,354,098'1,119,900'
90,195'136,049'7,954
1,438,866'1,180,423'
99,552'155,005'
3,885'
1,431,461'1,156,445'
104,249'169,123'
1,645'
1,405,565'1,125,756'
105,365'173,098'
1,346'
2,867,392'2,087,689'
122,914'656,788'
04,4534,453
1,395,048'1,104,767'
106,213'182,445'
1,624'
2,773,735'2,002,812'
120,027'650,896'
04,3074,307
1,376,980'1,082,922'
106,220'185,970'
1,867
11,164,450892,947
2,556,704110,490
5,039,5353,814,7852,280,194
210,3991,282,650
41,542883,631691,589
65,203125,966
873341,119
11,81950,595
267,68611,019
754,3703838
079,96213,13111,10152,2713,4604,5621,4063,156
0000061140
407,671294,847112,82474,65928,24946,41097,74431,18766,557
694694
7,581,498576,761539,508
37,2531,812,9171,801,666
11,2512,500,5212,400,500
100,0210000
2,686,5761,928,777
117,789640,010
04,7234,723
1,349,1911,052,533
106,771188,118
1,770
1. Multifamily debt refers to loans on structures of five or more units.2. Includes loans held by nondeposit trust companies but not loans held by bank trust
departments.3. Includes savings banks and savings and loan associations.4. FmHA-guaranteed securities sold to the Federal Financing Bank were reallocated from
FmHA mortgage pools to FmHA mortgage holdings in 1986:Q4 because of accountingchanges by the Farmers Home Administration.
5. Outstanding principal balances of mortgage-backed securities insured or guaranteed bythe agency indicated.
6. Includes securitized home equity loans.7. Other holders include mortgage companies, real estate investment trusts, state and local
credit agencies, state and local retirement funds, noninsured pension funds, credit unions, andfinance companies.
SOURCE: Based on data from various institutional and government sources. Separation ofnonfarm mortgage debt by type of property, if not reported directly, and interpolations andextrapolations, when required for some quarters, are estimated in part by the Federal Reserve.Line 70 from LoanPerformance Corporation and other sources.
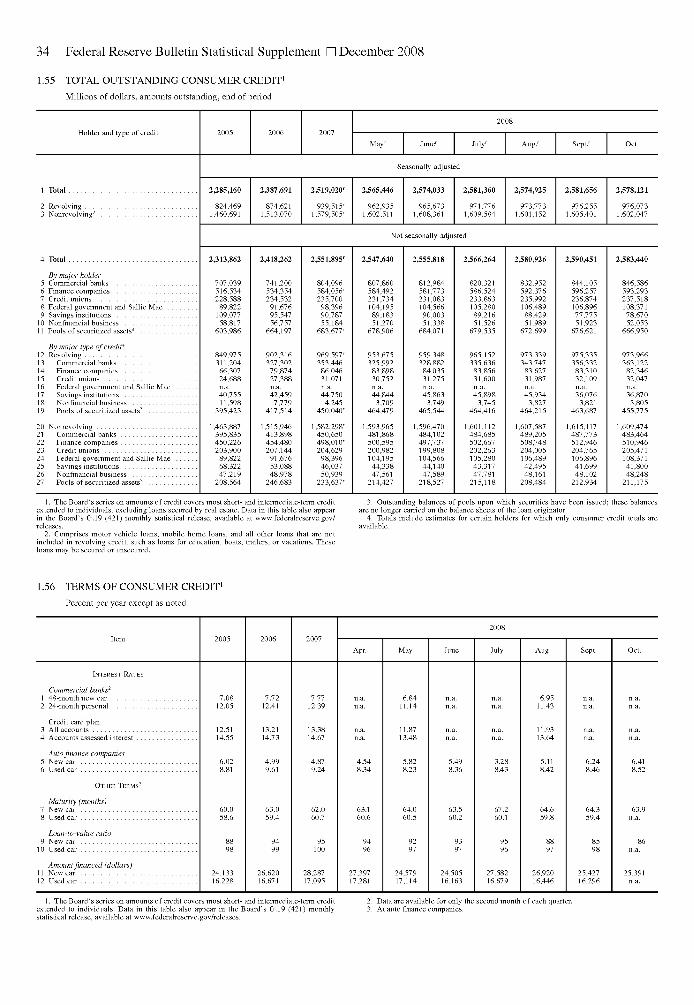
34 Federal Reserve Bulletin Statistical Supplement • December 2008
1.55 TOTAL OUTSTANDING CONSUMER CREDIT1
Millions of dollars, amounts outstanding, end of period
Holder and type of credit
July' Aug.r Sept/
2 Revolving . . .3 Nonrevolving2
824,4691,460,691
4 Total
By major holder5 Commercial banks6 Finance companies7 Credit unions8 Federal government and Sallie Mae .9 Savings institutions
10 Nonfinancial business11 Pools of securitized assets3
By major type of credit*12 Revolving13 Commercial banks14 Finance companies15 Credit unions16 Federal government and Sallie Mae17 Savings institutions18 Nonfinancial business19 Pools of securitized assets3
20 Nonrevolving21 Commercial banks22 Finance companies23 Credit unions24 Federal government and Sallie Mae25 Savings institutions26 Nonfinancial business27 Pools of securitized assets3
2,313,862
707,039516,534228,588
89,822109,07758,817
603,986
849,975311,20466,30724,688n.a.40,75511,598
395,423
1,463,887395,835450,226203,900
89,82268,32247,219
208,564
Seasonally adjusted
2,387,691
874,6211,513,070
2,519,020'
939,515'1,579,505'
962,9351,602,511
2,574,033
965,6731,608,361
2,581,360
971,7761,609,584
973,7731,601,152
2,581,656
976,2551,605,401
Not seasonally adjusted
2,418,262
741,200534,354234,532
91,67695,54756,757
664,197
902,316327,30279,87427,388n.a.42,4597,779
417,514
1,515,946413,898454,480207,144
91,67653,08848,978
246,683
2,551,895'
804,096584,056'235,70098,39690,78755,184
683,677'
969,597'353,44686,04631,071n.a.44,750
4,245450,040'
1,582,298'450,650498,010'204,62998,39646,03750,939
233,637'
2,547,640 2,555,818 2,566,264
807,860584,492231,734104,19589,18351,270
678,906
953,675325,992
83,89830,752n.a.44,844
3,709464,479
1,593,965481,868500,595200,982104,19544,33847,561
214,427
812,984581,773231,083104,56690,00351,338
684,071
959,348328,88284,03531,275n.a.45,863
3,749465,544
1,596,470484,102497,737199,808104,56644,14047,589
218,527
820,321586,524233,863105,28089,21651,526
679,535
965,152335,63683,85631,600n.a.45,898
3,745464,416
1,601,112484,685502,667202,263105,28043,31747,781
215,118
2,580,926
832,952592,376235,992106,48988,42951,989
672,699
973,339343,747
83,62731,987n.a.45,934
3,827464,215
1,607,587489,205508,748204,005106,48942,49548,161
208,484
2,590,451
844,105596,257236,874106,89677,77551,923
676,621
975,335356,33283,31032,109n.a.36,076
3,821463,687
1,615,117487,773512,946204,765106,89641,69948,102
212,934
2,578,121
976,0731,602,047
2,583,440
846,586593,293237,518108,37178,67052,053
666,950
973,966363,122
82,34632,047n.a.36,8703,805
455,775
1,609,474483,464510,946205,471108,37141,80048,248
211,175
1. The Board's series on amounts of credit covers most short- and intermediate-term creditextended to individuals, excluding loans secured by real estate. Data in this table also appearin the Board's G.19 (421) monthly statistical release, available at www.federalreserve.gov/releases.
2. Comprises motor vehicle loans, mobile home loans, and all other loans that are notincluded in revolving credit, such as loans for education, boats, trailers, or vacations. Theseloans may be secured or unsecured.
3. Outstanding balances of pools upon which securities have been issued; these balancesare no longer carried on the balance sheets of the loan originator.
4. Totals include estimates for certain holders for which only consumer credit totals areavailable.
1.56 TERMS OF CONSUMER CREDIT1
Percent per year except as noted
Item
INTEREST RATES
Commercial banks2
2 24-month personal
Credit card plan3 All accounts4 Accounts assessed interest
Auto finance companies5 New car
OTHER TERMS3
Maturity (months)7 New car
Loan-to-value ratio9 New car
10 Used car
Amount financed (dollars)11 New car12 Used car
2005
7.0812.05
12.5114.55
6.028 81
60.058 6
8898
24,13316,228
2006
7.7212.41
13.2114.73
4.999 61
63.059 4
9499
26,62016,671
2007
7.7712.39
13.3814.67
4.879 24
62.060 7
95100
28,28717,095
Apr.
n.a.n.a.
n.a.n.a.
4.548 34
63.160 6
9496
27,39717,281
May
6.8411.14
11.8713.48
5.828 23
64.060 5
9297
24,57917,114
June
n.a.n.a.
n.a.n.a.
5.498 36
63.560 2
9397
24,50516,163
2008
July
n.a.n.a.
n.a.n.a.
3.288 43
67.260 1
9596
27,58216,679
Aug.
6.9511.43
11.9313.64
5.118 42
64.659 8
8897
26,92016,446
Sept.
n.a.n.a.
n.a.n.a.
6.248 46
64.359 4
8598
25,42716,296
Oct.
n.a.n.a.
n.a.n.a.
6.418 52
63.9
86
25,391n.a.
1. The Board's series on amounts of credit covers most short- and intermediate-term creditextended to individuals. Data in this table also appear in the Board's G.19 (421) monthlystatistical release, available at www.federalreserve.gov/releases.
2. Data are available for only the second month of each quarter.3. At auto finance companies.

1.57 FUNDS RAISED IN U.S. CREDIT MARKETS1
Billions of dollars; quarterly data at seasonally adjusted annual rates
Flow of Funds 35
Transaction category or sector
Q3 Q4 Q1 Q2 Q3 Q4 Q1
Nonfinancial sectors
1 Total net borrowing by domestic nonfinancial sectors
By instrument2 Commercial paper3 Treasury securities4 Agency- and GSE-backed securities5 Municipal securities and loans6 Corporate bonds7 Bank loans n.e.c8 Other loans and advances9 Mortgages
10 Home11 Multifamily residential12 Commercial13 Farm14 Consumer credit
By borrowing sector15 Household16 Nonfinancial business17 Corporate18 Nonfarm noncorporate19 Farm20 State and local government21 Federal government
22 Foreign net borrowing in United States
23 Commercial paper24 Bonds25 Bank loans n.e.c26 Other loans and advances
27 Total domestic plus foreign
28 Total net borrowing by financial sectors
By instrument29 Open market paper30 Government-sponsored enterprise securities31 Agency- and GSE-backed mortgage pool securities32 Corporate bonds33 Bank loans n.e.c34 Other loans and advances35 Mortgages
By borrowing sector36 Commercial banking37 Savings institutions38 Credit unions39 Life insurance companies40 Government-sponsored enterprises41 Agency- and GSE-backed mortgage pools42 Issuers of asset-backed securities (ABSs)43 Finance companies44 Real estate investment trusts (REITs)45 Brokers and dealers46 Funding corporations
1,398.6
-57.9257.1
.5159.4129.3
-106.615.7
893.1758.6
37.190.56.9
107.9
832.9164.2
9.1148.0
7.1143.9257.6
93.4
58.831.65.3
-2 .3
1,491.9
1,667.7
-37.3398.4-2.4137.6150.4
-77.05.5
988.2798.9
71.2119.4-1.3104.4
981.0170.480.092.1-1.6120.3396.0
42.4
18.328.7-2.5-2.1
1,710.1
1,957.7
15.3362.5
- .6130.574.410.820.4
1,229.31,028.1
48.3150.2
2.7115.0
1,064.0416.6165.8244.7
6.1115.3361.9
130.7
68.761.83.8
-3.6
2,088.5
2,247.3
-7.7307.3
- . 4195.053.6
137.647.7
1,419.81,106.0
71.7237.5
4.694.5
1,180.9587.9243.6331.6
12.7171.6306.9
102.6
38.254.514.5
-4.6
2,349.9
2,332.4
22.4183.7
- . 3177.3213.4173.454.8
1,403.21,072.3
52.7270.7
7.5104.4
1,196.9800.9433.4349.1
18.4151.2183.4
254.4
97.1150.913.8
-7.4
2,586.8
2,029.5
-21.5172.4-1.0169.2133.8163.1
-36.11,330.01,006.0
35.9280.5
7.6119.7
1,112.8598.1248.2336.1
13.9147.2171.4
523.0
362.8180.2
-12.2-7.7
2,552.6
2,308.1
111.1135.8
.5252.8315.9223.268.5
1,091.5730.9
68.0285.0
7.6108.9
937.91,015.8
634.4358.822.6
218.2136.3
253.6
8.6218.031.6-4.6
2,561.7
2,307.5
18.9327.5-1 .3249.1282.2
85.281.3
1,149.4846.0
63.1231.9
8.3115.1
905.4851.0528.0297.4
25.6224.9326.2
136.1
-19.8174.8
-16.0-3.0
2,443.6
2,101.0
40.9-70.7
- .1246.7377.5
92.379.6
1,197.0784.8
95.2308.6
8.4137.7
942.81,016.5
625.5379.9
11.1212.4-70.8
227.4
22.4167.340.7-2.9
2,328.4
2,742.5
-30.6435.9
- . 8165.5225.2420.1299.1
1,026.1577.2104.5335.8
8.5202.1
856.21,312.7
767.7532.4
12.6138.5435.0
2.9
-193.8173.226.3-2.9
2,745.3
2,315.5
16.0257.1
.7198.7371.6397.9
3.7971.4618.5129.7214.7
8.598.5
829.91,062.8
577.4461.2
24.2164.8257.8
21.7
-78.356.145.3-1.3
2,337.2
Financial sectors
2,036.3
54.6487.5
1.3152.8274.8257.7101.7559.8313.069.0
174.53.3
146.1
481.0927.0575.1321.530.4
139.5488.8
277.1
214.639.823.8-1.1
870.3
-99.9219.8326.8384.8
21.16.8
11.0
49.7-23.4
2.02.0
219.8326.8212.3
66.227.3
-1.7-10.7
1,060.8
-62.9250.9330.6481.4
21.431.28.2
48.534.52.22.9
250.9330.6244.2111 .131.56.4
-1.9
968.7
22.275.047.9
665.558.174.125.9
78.489.02.33.0
75.047.9
427.3134.398.315.2
-2.2
1,064.0
214.6-84.0167.3691.0
17.044.413.9
85.123.83.3
.4-84.0167.3669.233.559.8
.1105.6
1,287.7
197.635.6
295.4795.0-64.1
21.27.0
177.4-111.9
4.22.7
35.6295.4772.0
34.841.1
6.429.9
931.3
72.2-83.5284.4663.2-42.8
29.97.8
51.617.12.02.4
-83.5284.4701.1-36.6
32.85.0
-44.9
1,249.0
174.340.7
278.9981.5
-216.8-3.9-5 .8
400.6-463.3
8.44.3
40.7278.9910.969.014.0
-20.96.4
1,264.2
233.566.7
482.5476.3
51.0-30.5-15.2
90.9-20.7-10.5
4.966.7
482.5428.8
13.92.2
59.5146.0
1,398.0
362.6161.4534.9280.848.9
.49.0
147.1-24.6
10.612.6
161.4534.9472.8
9.3-21.2
39.955.3
2,348.0
-689.5556.6622.2997.8101.6746.2
12.9
496.2363.5
37.926.9
556.6622.2
97.7122.1
-14.7-29.4
69.0
1,356.3
-360.0344.8866.3274.627.5
187.016.1
318.671.115.713.7
344.8866.3
-285.2-45.6
10.4-85.9132.4
-191.4119.9534.1
-14.8176.7156.420.8
228.167.0
-15.29.6
119.9534.1
-305.073.9
-40.362.3
-91.7

36 Federal Reserve Bulletin Statistical Supplement • December 2008
1.57 FUNDS RAISED IN U.S. CREDIT MARKETS1—Continued
Billions of dollars; quarterly data at seasonally adjusted annual rates
Transaction category or sector
Q3 Q4 Q1 Q2 Q3 Q4 Q1
58 Corporate equities59 Nonfmancial corporations60 Foreign shares purchased by U.S. residents61 Financial corporations62 Mutual fund shares
47 Total net borrowing, all sectors . . . .
48 Open market paper49 Treasury securities50 Agency- and GSE-backed securities . .51 Municipal securities52 Corporate and foreign bonds53 Bank loans n.e.c54 Other loans and advances55 Mortgages56 Consumer credit
57 Total net issues .
2^62.2
-99.1257.1547.2159.4545.7-80.2
20.2904.1107.9
2,770.9
-82.0398.4579.1137.6660.5-58.1
34.6996.4104.4
3,057.2
106.2362.5122.3130.5801.872.790.9
1,255.2115.0
3,413.9
245.1307.382.8
195.0799.0169.187.4
1,433.894.5
3,874.5
317.1183.7330.6177.3
1,159.3123.168.6
1,410.3104.4
3,483.9
413.6172.4199.9169.2977.2108.1
-13.91,337.8
119.7
3,810.8
294.1135.8320.1252.8
1,515.438.060.0
1,085.7108.9
3,707.8
232.6327.5547.9249.1933.4120.247.8
1,134.2115.1
3,726.4
426.0-70.7696.2246.7825.6181.977.0
1,206.0137.7
5,093.3
-913.9435.9
1,178.0165.5
1,396.3548.0
1,042.31,039.0
202.1
3,693.5
-422.4257.1
1,211.9198.7702.2470.7189.4987.598.5
3,115.1
77.7487.5655.2152.8299.8458.3256.9580.6146.1
Funds raised through mutual funds and corporate equities
227.4
46.4-41.6
17.071.0
181.1
427.5
138.9-42.0118.062.9
288.6
366.0
67.7-126.6
84.8109.5298.2
110.9
-149.3-363.4
142.671.5
260.2
-80.4
-417.2-614.1
138.558.4
336.8
-274.8
-512.6-534.0
41.8-20.4237.8
16.6
-349.1-751.2
251.0151.2365.6
193.6
-315.0-572.8
174.083.8
508.6
-80.6
-604.5-814.0
161.548.0
523.9
-207.1
-453.5-831.2
227.6150.1246.4
-657.4
-840.3-1,124.8
-39.2323.6183.0
131.2
-75.3-562.2
135.2351.7206.5
1. Data in this table also appear in the Board's Z.I quarterly statistical release, tables F.2through F.4, available at www.federalreserve.gov/releases.

1.58 SUMMARY OF FINANCIAL TRANSACTIONS1
Billions of dollars except as noted; quarterly data at seasonally adjusted annual rates
Flow of Funds 37
Transaction category or sector
Q3 Q4 Q1 Q2 Q3 Q4 Q1
NET LENDING IN CREDIT MARKETS2
1 Total net lending in credit markets
2 Domestic nonfinancial sectors3 Household4 Nonfinancial corporate business5 Nonfarm noncorporate business6 State and local governments7 Federal government8 Rest of the world9 Financial sectors
10 Monetary authority11 Commercial banking12 U.S.-chartered commercial banks13 Foreign banking offices in United States . .14 Bank holding companies15 Banks in U.S.-affiliated areas16 Savings institutions17 Credit unions18 Property-casualty insurance companies . . . .19 Life insurance companies20 Private pension funds21 State and local government retirement funds22 Federal government retirement funds23 Money market mutual funds24 Mutual funds25 Closed-end funds26 Exchange-traded funds27 Government-sponsored enterprises28 Agency- and GSE-backed mortgage pools29 Asset-backed securities issuers (ABSs)30 Finance companies31 Real estate investment trusts (REITs)32 Brokers and dealers33 Funding corporations
RELATION OF LIABILITIESTO FINANCIAL ASSETS
34 Net flows through credit markets
Other financial sources35 Official foreign exchange36 Special drawing rights certificates37 Treasury currency38 Foreign deposits39 Net interbank transactions40 Checkable deposits and currency41 Small time and savings deposits42 Large time deposits43 Money market fund shares44 Security repurchase agreements45 Corporate equities46 Mutual fund shares47 Trade payables48 Security credit49 Life insurance reserves50 Pension fund reserves51 Taxes payable52 Noncorporate proprietors' equity53 Miscellaneous
54 Total financial sources
Liabilities not identified as assets (-)55 Treasury currency56 Foreign deposits57 Net interbank liabilities58 Security repurchase agreements59 Taxes payable60 Miscellaneous
Floats not included in assets (-)61 Federal government checkable deposits62 Other checkable deposits63 Trade credit
2,362.2
152.035.925.8- . 886.24.9
467.21,743.1
77.7404.4393.8
6.23.11.3
33.444.239.9
233.0-8.6
-50.712.7
-17.7138.7
8.63.7
224.1326.8219.0103.723.828.4
-102.1
2,362.2
3.2.0
1.021.017.4
-8 .3325.4
50.0-16.7106.646.4
181.186.7
-87.060.1
262.922.2
-84.1505.3
3,855.6
- .621.57.2
36.019.7
-23.0
-1.6- .7
164.9
2,770.9
157.8103.4-3.2
1.558.3
-2.1582.8
2,030.237.2
332.9352.2-38.5
8.610.6
127.351.267.0
180.669.218.86.0
-95.9138.035.5
.7241.0330.6233.2122.925.779.628.6
2,770.9
- . 9.0.6
36.0-14.5
85.0307.4
55.8-207.5
218.7138.9288.6
22.4120.066.8
258.5-1.145.0
456.9
4,647.3
- . 352.8
-4.3-33.9-42.6-26.2
-8.9.0
20.6
64 Total identified to sectors as assets .
3,057.2
291.6173.931.111.572.4
2.7854.4
1,911.151.2
608.0571.1
.013.9
103.539.873.6
173.0- . 317.84.7
-124.9116.6
11.03.8
48.947.9
416.2214.9
87.9-29.2
47.0
-3.2.0.7
89.919.484.8
281.6252.9
-136.588.167.7
298.2194.4179.433.1
288.428.5
-18.01,616.0
6,422.6
61.914.9
-139.9-20.2198.8
27.9- . 89.4
6,270.9
3,413.9
284.5109.342.311.4
124.1-2.7
749.02,380.4
26.4658.4507.9144.5-4.210.2
199.336.266.9
110.344.518.17.7
-5.5124.1
1.56.8
-69.1167.3673.6117.266.982.347.5
-9.6.0.8
67.8-12.4
3.5314.4284.4127.0350.8
-149.3260.2336.6
.216.1
238.328.1
-137.81,389.1
6,522.1
.740.6-3.7134.2
-18.1177.8
-6.6- .9
-31.7
6,229.9
3,874.5
293.8203.7
-10.912.384.64.0
855.02,725.7
34.7761.7656.3103.7
3.3-1.7
-98.130.147.775.614.076.3
8.4220.0184.9
6.75.7
46.6295.4725.8
89.757.5
106.236.9
-2.6.0.6
98.8-11.2-18.7347.0261.2305.3496.0
-417.2336.8217.4211.565.6
198.219.9
-54.01,724.0
7,653.1
-1.1114.3-1.9297.9
1.9-201.2
-3.0- . 596.6
7,350.0
3,483.9
286.6277.2
-70.512.681.3
-14.0724.1
2,473.221.4
154.557.394.0
6.6-3.3258.1
7.931.848.638.914.47.6
362.1130.8-4.9
2.8-30.4284.4721.3158.144.5
162.558.6
-4.2.0
1.0-38.7
43.9-73.0336.8344.7418.0602.2
-512.6237.8123.3173.076.3
161.821.3
-26.62,007.7
7,376.6
.637.048.1
144.624.1
-123.7
16.4- .9
76.9
7,153.6
3,810.8
332.8181.0
7.512.5
122.98.9
952.22,525.8
21.41,274.71,165.9
100.38.0
.5-859.7
27.750.67.7
41.643.7
2.5216.5232.6
5.57.9
51.7278.9728.6-5.887.1
218.594.1
-5.9.0.0
-64.4116.5
-75.2578.7-3.6378.8619.1
-349.1365.6211.0274.275.4
216.928.4
-62.61,538.5
7,653.2
- . 5-138.0-71.8601.823.7
-44.5
-19.1- . 8
140.0
7,162.5
3,707.8
90.5-185.6
98.712.1
145.020.3
1,017.92,599.4
13.0204.139.3
188.2-16.8-6.5189.139.832.894.330.7-8.414.9
431.1285.2
- .96.8
-86.9482.5585.256.5
-36.2279.7-13.9
3,707.8
.1
.0
.4284.6
-487.091.9
386.4276.7441.4707.9
-315.0508.6295.5105.528.4
136.433.115.0
1,208.9
7,426.7
297.050.5
-73.6-29.2
-958.6
-5.9- . 8
276.7
7,870.9
3,726.4
189.678.6
-62.414.0
144.914.6
866.52,670.3
44.7678.4489.7194.9-5 .3
- .967.424.634.799.539.618.63.4
290.4365.6
13.915.681.0
534.9484.0-34.7-48.8
-199.0156.4
3,726.4
- . 3.0
1.3395.322.2
-99.2205.8107.4442.5116.6
-604.5523.9334.0365.736.4
149.211.9
-48.43,550.3
9,236.7
.7377.1-54.5-33.9-23.0647.3
- . 5- 1 . 3
-54 .1
8,378.8
5,093.3
645.1867.6
-195.617.3
-40.1-4.2587.2
3,861.0-33.7963.4704.5238.1
21.4- .7
136.840.934.099.350.161.317.5
444.2184.4
-18.09.6
673.3622.2167.1110.5
-135.8436.3-2.5
.1
.01.4
185.7205.5124.0329.4529.0
1,260.4222.3
-453.5246.4283.6-19.1
28.9164.426.1
-122.02,225.8
10,331.7
.949.0
-12.6103.8
-24.3-172.5
13.5- . 8
-8.5
10,383.2
3,693.5
515.4631.3-86.2
16.4-57.0
11.0835.2
2,342.8-177.21,157.4
882.2185.793.0
-3.5-130.6
35.74.4
45.514.049.111.1
396.9249.3
5.918.9
288.6866.3
-242.1-92.9
8.6362.0
-528.3
3,693.5
- .1.0
- . 441.3
100.8.9
223.8365.3819.9
-670.4-840.3
183.0221.5653.943.1
227.725.4
-107.51,049.5
6,030.6
- .6-59.5
23.7-814.6
-5.5934.5
-2.4-1.2
8.4
5,947.9
3,115.1
-1,014.9-921.9-92.7
11.8-31.9
19.8996.0
3,133.9-430.9
592.5427.3160.9
4.0.3
8.345.048.390.831.642.940.1
1,293.4252.8-6.017.5
298.0534.1
-292.388.6
-39.4174.2344.7
.0- .950.0
-231.374.8
461.9320.6
1,549.396.3
-75.3206.5275.4313.323.4
149.525.4
-18.31,424.4
7,760.4
- .9-11.1-15.8-18.9-69.3
79.2
-5.7-1.025.9
7,777.9
1. Data in this table also appear in the Board's Z.I quarterly statistical release, tables F.Iand F.5, available at www.federalreserve.gov/releases.
2. Excludes corporate equities and mutual fund shares.

38 Federal Reserve Bulletin Statistical Supplement • December 2008
1.59 SUMMARY OF CREDIT MARKET DEBT OUTSTANDING'
Billions of dollars, end of period
Transaction category or sector
1 Total credit market debt owed bydomestic nonfinancial sectors
By instrument2 Commercial paper3 Treasury securities4 Agency- and GSE-backed securities5 Municipal securities and loans6 Corporate bonds7 Bank loans n.e.c8 Other loans and advances9 Mortgages
10 Home11 Multifamily residential12 Commercial13 Farm14 Consumer credit
By borrowing sector15 Households16 Nonfinancial business17 Corporate18 Nonfarm noncorporate19 Farm20 State and local government21 Federal government
22 Foreign credit market debt held inUnited States
23 Commercial paper24 Bonds25 Bank loans n.e.c26 Other loans and advances
27 Total credit market debt owed by nonfinancialsectors, domestic and foreign
28 Total credit market debt owed byfinancial sectors
By instrument29 Open market paper30 Government-sponsored enterprise securities31 Agency- and GSE-backed mortgage pool
securities32 Corporate bonds33 Bank loans n.e.c34 Other loans and advances35 Mortgages
By borrowing sector36 Commercial banks37 Bank holding companies38 Savings institutions39 Credit unions40 Life insurance companies41 Government-sponsored enterprises42 Agency- and GSE-backed mortgage pools43 Issuers of asset-backed securities (ABSs)44 Brokers and dealers45 Finance companies46 Real estate investment trusts (REITs)47 Funding corporations
48 Total credit market debt, domestic and foreign .
49 Open market paper50 Treasury securities51 Agency- and GSE-backed securities52 Municipal securities53 Corporate and foreign bonds54 Bank loans n.e.c55 Other loans and advances56 Mortgages57 Consumer credit
2003 2004 2005 2006
2006
Q3 Q4 Ql
2007
Q2 Q3 Q4
2008
Ql
Nonfinancial sectors
22,327.3
82.54,008.2
24.91,900.52,870.11,088.4
955.49 293 17,230.5
543.61.424.8
94.12.104.4
9.499.57,227.24,860.32,198.8
168.11,567.64,033.1
1,258.1
275.5874.4
66.142.2
23,585.4
24,299.8
97.84,370.7
24.32,031.02,944.51,099.2
975.810 537 28.273.4
591.91.575.0
96.92.219.4
10.578.27,643.75,026.02,443.5
174.21,682.84,395.0
1,445.7
344.2993.0
69.938.6
25,745.5
26,547.1
90.14,678.0
23.82,225.92,998.11,236.81,023.5
11 957 09.379.4
663.61.812.5
101.52.313.9
11.759.28,231.65,269.62,775.0
186.91,854.44,701.9
1,528.9
382.41.028.2
84.434.0
28,076.0
28,876.2
112.54,861.7
23.52,403.23,211.51,410.21,075.1
13 360 210.451.7
716.32.083.2
109.02.418.3
12.956.19,029.35,699.83,124.2
205.32,005.64,885.3
1,785.1
479.51.180.8
98.326.6
30,661.3
28,268.7
110.64,803.2
23.42,332.73,132.51,361.61,046.2
13 091 510.279.0
699.32.006.2
107.12.367.0
12.715.48,781.35,548.53,033.1
199.71,945.44,826.6
1,716.9
474.31.124.6
90.427.7
29,985.6
28,876.2
112.54,861.7
23.52,403.23,211.51,410.21,075.1
13 360 210.451.7
716.32.083.2
109.02.418.3
12.956.19,029.35,699.83,124.2
205.32,005.64,885.3
1,785.1
479.51.180.8
98.326.6
30,661.3
29,463.5
126.25,014.3
23.22,465.63,282.11,433.91,087.3
13 631 510.652.4
732.12.135.9
111.12.399.5
13.129.09,234.75,829.23,198.1
207.42,062.45,037.4
1,799.0
474.01.224.5
74.725.8
31,262.5
29,956.2
154.34,904.0
23.22,533.83,376.41,466.21,118.7
13,946.310,862.2
755.82.215.0
113.22.433.3
13.378.29,529.66,023.33,293.4
212.92,121.24,927.2
1,848.5
472.21.266.3
84.925.1
31,804.7
30,622.2
131.45,010.0
23.02,560.83,432.71,572.71,176.0
14,209.511,015.8
782.02.296.3
115.42.506.1
13.628.09,817.86,175.03,425.1
217.72,143.55,032.9
1,849.6
424.21.309.6
91.524.4
32,471.8
31,249.3
123.85,099.2
23.12,618.23,525.61,665.61,191.0
14,446.211,158.3
814.42.356.0
117.52.556.6
13.839.710,096.66,331.03,541.9
223.72,190.75,122.3
1,862.6
412.21.323.6
102.824.0
33,111.9
31,763.0
140.05,299.1
23.52,656.93,594.31,727.31,208.2
14,570.911,226.5
831.72.394.4
118.32.542.9
13.906.710,307.26,458.63,621.8
226.92,226.65,322.6
1,926.3
460.21.333.6
108.823.7
33,689.3
Financial sectors
10,875.5
935.02,601.3
3 326 73 242 1
164.0501.7104.7
338.6321.8296.8
9.18.0
2.601.33,326.72,181.7
47.0995.3230.0519.3
11,859.0
957.12,676.3
3,374.63,922.5
222.1575.8130.6
357.4381.3385.8
11.411.1
2.676.33,374.62,609.0
62.21.129.6
343.2517.1
12,868.5
1,171.72,592.2
3,541.94,559.0
239.1620.2144.5
394.3429.5409.6
14.711.5
2.592.23,541.93,278.3
62.41.108.6
402.9622.7
14,153.7
1.366.02,627.8
3,837.35,354.8
175.0641.4151.5
498.3499.7297.8
18.914.2
2.627.83,837.34,050.3
68.81.144.2
444.0652.5
13,816.8
1.280.52,617.6
3,763.15,129.9
229.0643.7153.0
424.1476.2412.4
16.813.1
2.617.63,763.13,816.8
74.01.119.5
440.5642.6
14,153.7
1.366.02,627.8
3,837.35,354.8
175.0641.4151.5
498.3499.7297.8
18.914.2
2.627.83,837.34,050.3
68.81.144.2
444.0652.5
14,449.0
1.403.52,644.5
3,955.75,489.9
183.3624.4147.7
495.3520.3288.3
16.215.4
2.644.53,955.74,155.3
83.71.133.6
444.6696.1
14,800.4
1.483.32,684.8
4,075.85,567.8
196.8642.0150.0
511.0551.5289.5
18.918.6
2.684.84,075.84,280.5
93.61.135.2
439.3701.8
15,384.9
1.302.02,824.0
4,243.25,815.5
225.2821.8153.2
597.5586.8375.928.425.3
2.824.04,243.24,294.9
86.31.173.3
435.6713.8
15,745.3
1.252.62,910.2
4,463.75,862.1
232.2867.1157.2
630.1631.1395.132.328.7
2.910.24,463.74,228.8
64.81.169.1
438.2753.2
15,925.1
1.184.42,940.2
4,594.65,875.3
271.8896.4162.4
647.5665.4407.2
28.531.1
2.940.24,594.64,150.9
80.41.173.3
428.1738.1
All sectors
34,460.9
1 292 94.008.25,952.91,900.56,986.61,318.41.499.39 397 72.104.4
37,604.5
1,399.14,370.76,075.22,031.07,860.01,391.21.590.2
10,667.72,219.4
40,944.6
1,644.24,678.06,158.02,225.98,585.21,560.31.677.6
12,101.52,313.9
44,814.9
1,958.04,861.76,488.62,403.29,747.01,683.41.743.0
13,511.72,418.3
43,802.4
1,865.34,803.26,404.12,332.79,387.01,681.01.717.6
13,244.52,367.0
44,814.9
1,958.04,861.76,488.62,403.29,747.01,683.41.743.0
13,511.72,418.3
45,711.5
2,003.75,014.36,623.42,465.69,996.41,692.01.737.5
13,779.22,399.5
46,605.1
2,109.84,904.06,783.82,533.8
10,210.51,747.91.785.8
14,096.22,433.3
47,856.7
1,857.65,010.07,090.22,560.8
10,557.91,889.42.022.1
14,362.72,506.1
48,857.2
1,788.65,099.27,397.12,618.2
10,711.42,000.62.082.1
14,603.42,556.6
49,614.4
1,784.65,299.17,558.22,656.9
10,803.22,107.92.128.3
14,733.32,542.9
1. Data in this table appear in the Board's Z.I quarterly statistical release, tables L.2through L.4, available at www.federalreserve.gov/releases.
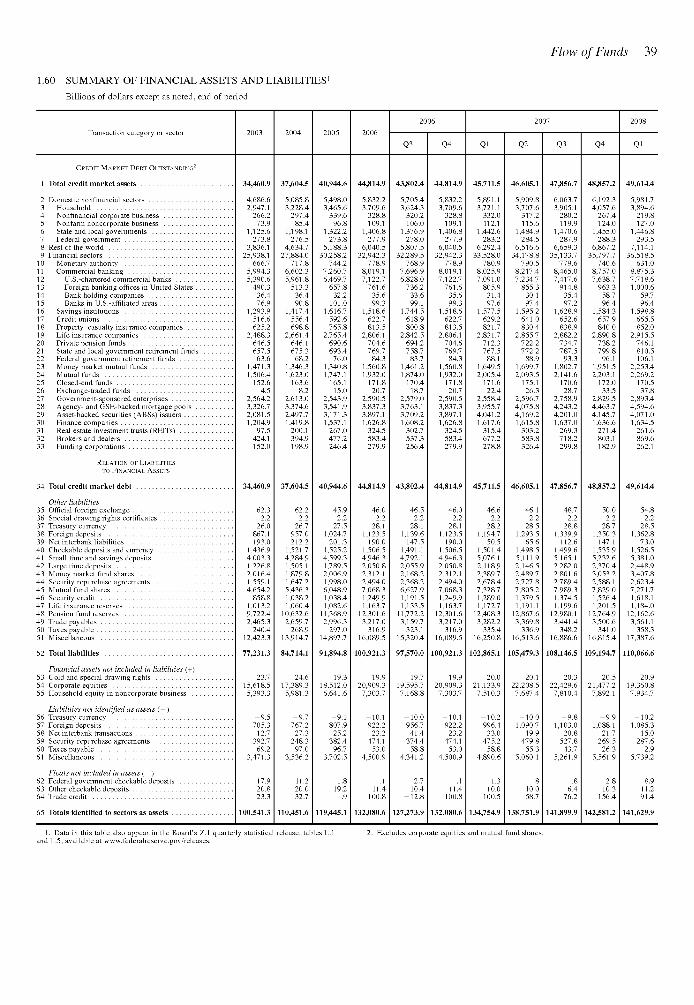
1.60 SUMMARY OF FINANCIAL ASSETS AND LIABILITIES1
Billions of dollars except as noted, end of period
Flow of Funds 39
Transaction category or sectorQ3 Q4 Q1 Q2 Q3 Q4 Q1
CREDIT MARKET DEBT OUTSTANDING2
1 Total credit market assets
Domestic nonfinancial sectorsHouseholdNonfinancial corporate businessNonfarm noncorporate businessState and local governmentsFederal government
Rest of the worldFinancial sectors
Monetary authorityCommercial banking
U.S.-chartered commercial banksForeign banking offices in United States . .Bank holding companiesBanks in U.S.-affiliated areas
Savings institutionsCredit unionsProperty-casualty insurance companies . . . .Life insurance companiesPrivate pension fundsState and local government retirement fundsFederal government retirement fundsMoney market mutual fundsMutual fundsClosed-end fundsExchange-traded fundsGovernment-sponsored enterprisesAgency- and GSE-backed mortgage poolsAsset-backed securities (ABSs) issuersFinance companiesReal estate investment trusts (REITs)Brokers and dealersFunding corporations
RELATION OF LIABILITIESTO FINANCIAL ASSETS
34 Total credit market debt
Other liabilities35 Official foreign exchange36 Special drawing rights certificates .37 Treasury currency38 Foreign deposits39 Net interbank liabilities40 Checkable deposits and currency .41 Small time and savings deposits . .42 Large time deposits43 Money market fund shares44 Security repurchase agreements . .45 Mutual fund shares46 Security credit47 Life insurance reserves48 Pension fund reserves49 Trade payables50 Taxes payable51 Miscellaneous
52 Total liabilities
Financial assets not included in liabilities (+)53 Gold and special drawing rights54 Corporate equities55 Household equity in noncorporate business . .
Liabilities not identified as assets ( - )56 Treasury currency57 Foreign deposits58 Net interbank transactions59 Security repurchase agreements60 Taxes payable61 Miscellaneous
Floats not included in assets ( - )62 Federal government checkable deposits63 Other checkable deposits64 Trade credit
65 Totals identified to sectors as assets
34,460.9
4,686.62,947.1
266.273.9
1,125.6
37,604.5
5,085.83,228.4
297.485.4
273.83,836.1
25,938.1666.7
5,994.35,390.6
276.54,634.7
27,884.0717.8
6,602.35,961.8
490.336.476.9
1,293.9516.6625.2
2,488.3646.5657.563.6
1,471.3
513.336.490.8
1,417.4556.4
2,661.4646.1675.3
68.21,346.3
1,506.4152.6
4.52,564.2
1,623.0163.6
8.22,613.0
3,326.72,081.51,204.9
97.5424.1152.0
34,460.9
62.3
26.0867.1193.0
1,436.9
3,374.62,497.71,419.8
200.1394.9198.9
37,604.5
62.22.2
26.7957.0212.2
1,521.74,003.31,226.82,016.41,559.1
4,284.91,505.11,879.81,647.2
4,654.2858.8
1,013.29,722.4
5,436.31,038.21,060.4
10,632.62,465.3
240.412,423.3
77,231.3
23.715,618.55,393.3
-9.5705.3
12.7392.769.2
-3,471.3
-17.920.823.3
100,541.3
2,659.7268.9
13,914.7
84,714.1
24.617,389.35,981.3
-9.7767.2
27.3248.3
97.0-3,536.2
11.220.032.7
110,451.6
40,944.6
5,498.03,465.6
339.696.8
1,322.2273.8
5,188.330,258.2
744.27,260.76,469.7
657.832.2
101.01,616.7
592.6765.8
2,765.4690.6693.476.0
1,340.81,747.1
165.115.0
2,543.93,541.93,171.31,537.1
267.0477.2246.4
40,944.6
45.92.2
27.51,024.7
201.31,525.24,599.31,789.52,006.91,998.06,048.91,038.41,082.6
11,368.92,996.3
297.014,897.7
91,894.8
19.318,512.06,641.6
-9.1807.9
25.2382.4
96.7-3,702.5
1.819.2
.9
119,445.1
44,814.9
5,832.23,709.6
328.8109.1
1,406.8277.9
6,040.532,942.3
778.98,019.17,122.7
761.635.699.3
1,518.6622.7813.5
2,806.1704.6769.7
84.31,560.81,932.0
171.820.7
2,590.53,837.33,897.11,626.8
324.5583.4279.9
46.02.2
28.11,123.5
190.01,506.54,946.32,050.82,312.12,494.07,068.31,249.91,163.7
12,301.63,217.0
316.916,089.5
100,921.3
19.920,909.37,303.7
-10.1922.2
23.2474.1
53.0-4,500.9
.111.4
100.8
43,802.4
5,705.43,624.3
320.2106.0
1,376.9278.0
5,807.532,289.5
768.97,696.96,828.0
736.233.699.1
1,744.5618.9800.8
2,842.5694.2758.7
83.71,461.21,874.0
170.418.7
2,579.03,763.13,709.21,608.2
302.7537.3256.4
46.52.2
28.11,139.6
147.51,491.14,792.12,055.92,168.22,368.26,627.91,191.51,133.5
11,772.23,159.7
323.115,320.4
97,570.0
19.719,595.77,168.8
-10.0956.741.4
374.458.8
-4,341.2
2.710.4
-12.8
44,814.9
5,832.23,709.6
328.8109.1
1,406.8277.9
6,040.532,942.3
778.98,019.17,122.7
761.635.699.3
1,518.6622.7813.5
2,806.1704.6769.7
84.31,560.81,932.0
171.820.7
2,590.53,837.33,897.11,626.8
324.5583.4279.9
46.02.2
28.11,123.5
190.01,506.54,946.32,050.82,312.12,494.07,068.31,249.91,163.7
12,301.63,217.0
316.916,089.5
100,921.3
19.920,909.37,303.7
-10.1922.223.2
474.153.0
-4,500.9
.111.4
100.8
45,711.5
5,891.13,721.1
332.0112.1
1,442.6283.2
6,292.433,528.0
780.98,025.97,091.0
805.931.497.6
1,577.5629.2821.7
2,831.7712.3767.5
88.11,649.52,005.4
171.622.4
2,558.43,955.74,041.21,617.6
315.4677.2278.8
46.62.2
28.21,194.7
50.51,501.45,076.12,118.92,389.72,678.47,328.71,289.01,172.7
12,408.33,282.2
335.416,250.8
102,865.1
20.021,133.97,510.3
-10.2996.433.0
475.258.8
-4,890.6
1.310.0
100.5
134,754.9
46,605.1
5,909.83,707.6
317.2115.6
1,484.9284.5
6,516.634,178.8
790.58,217.47,234.7
855.330.197.4
1,595.2641.0830.4
2,855.7722.2772.2
88.91,699.72,093.5
175.126.3
2,596.74,075.84,169.21,615.8
303.2583.8326.4
46,605.1
46.12.2
28.51,293.5
65.61,498.55,111.92,146.52,489.72,727.87,805.21,379.51,191.1
12,867.63,369.8
336.916,513.6
105,479.3
20.122,208.57,687.4
-10.01,090.7
19.9479.8
55.3-5,060.1
10.058.7
138,751.9
47,856.7
6,063.73,905.1
280.2119.9
1,470.6287.9
6,659.335,133.7
779.68,465.07,417.6
914.835.497.2
1,628.9652.6838.9
2,882.2734.7787.5
93.31,802.72,141.6
170.628.7
2,758.94,243.24,201.01,637.0
269.3718.2299.8
47,856.7
48.72.2
28.81,339.9
112.61,499.65,165.12,282.02,801.62,789.47,989.31,374.51,199.6
12,980.13,441.4
348.216,886.6
108,146.5
20.322,429.67,810.4
-9 .81,103.0
20.8527.843.7
-5,261.9
6.476.2
141,899.9
48,857.2
6,192.34,057.6
267.4124.0
1,455.0288.3
6,867.235,797.7
740.68,757.07,638.7
963.358.796.4
1,584.3657.9840.0
2,890.8738.2799.8
96.11,951.52,203.1
172.033.5
2,829.54,463.74,145.71,636.6
271.4803.1182.9
48,857.2
50.02.2
28.71,350.3
147.11,535.95,232.62,370.43,053.22,588.17,829.01,526.41,201.5
12,764.93,500.6
341.016,815.4
109,194.7
20.521,477.27,892.1
-9.91,088.1
21.7269.5
26.3-5,561.9
2.810.3
156.4
142,581.2
49,614.4
5,981.73,894.6
219.8127.0
1,446.8293.5
7,114.136,518.5
631.08,875.37,718.61,000.6
59.796.4
1,598.8665.5852.0
2,915.5746.1810.5106.1
2,253.42,269.2
170.537.8
2,893.44,594.64,071.01,634.5
261.6869.6262.1
49,614.4
54.8
28.51,362.8
73.01,526.55,381.02,448.93,407.82,623.47,271.71,618.11,184.0
12,162.63,561.1
358.317,387.6
110,066.6
20.919,360.87,934.7
-10.21,085.3
15.0287.6
2.9-5,739.2
8.911.291.4
141,629.9
1. Data in this table also appear in the Board's Z.I quarterly statistical release, tables L.Iand L.5, available at www.federalreserve.gov/releases.
2. Excludes corporate equities and mutual fund shares.
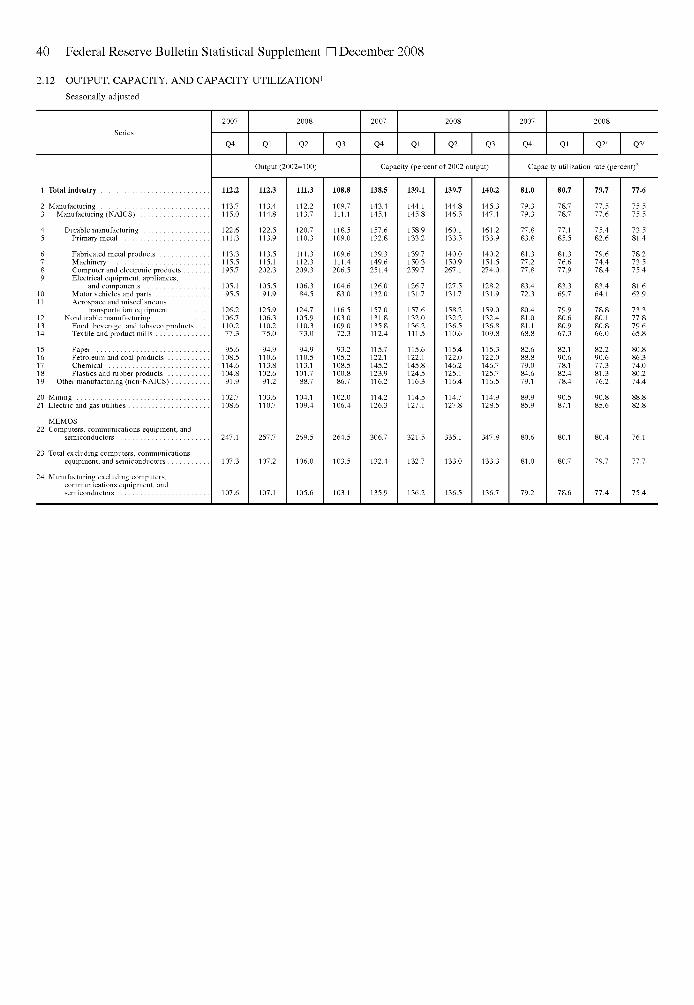
40 Federal Reserve Bulletin Statistical Supplement • December 2008
2.12 OUTPUT, CAPACITY, AND CAPACITY UTILIZATION'
Seasonally adjusted
Series
1 Total Industry
2 Manufacturing3 Manufacturing (NAICS)
4 Durable manufacturing5 Primary metal
6 Fabricated metal products
8 Computer and electronic products9 Electrical equipment, appliances,
and components10 Motor vehicles and parts11 Aerospace and miscellaneous
transportation equipment12 Nondurable manufacturing13 Food, beverage, and tobacco products . . . .14 Textile and product mills
15 Paper16 Petroleum and coal products17 Chemical18 Plastics and rubber products19 Other manufacturing (non-NAICS)
20 Mining21 Electric and gas utilities
MEMOS22 Computers, communications equipment, and
semiconductors
23 Total excluding computers, communicationsequipment, and semiconductors
24 Manufacturing excluding computers,communications equipment, andsemiconductors
2007
Q4 Q1
2008
Q2' Q3'
Output (2002=100)
112.2
113.7115.0
122.6111.3
113.3115.5195.7
105.195.5
126.2106.7110.277.3
95.6108.5114.6104.891.9
102.7108.6
247.1
107.3
107.6
112.3
113.4114.8
122.5113.9
113.5115.1202.3
105.591.9
125.9106.3110.275.0
94.9110.6113.8102.691.2
103.6110.7
257.7
107.2
107.1
111.3
112.2113.7
120.7110.3
111.3112.3209.3
106.384.5
124.7105.9110.373.0
94.9110.5113.1101.788.7
104.1109.4
269.5
106.0
105.6
108.8
109.7111.1
118.5109.0
109.6111.4206.5
104.683.0
116.5103.0109.072.3
93.2105.2108.5100.886.7
102.0106.4
264.5
103.5
103.1
2007
Q4 Q1
2008
Q2 Q3
Capacity (percent of 2002 output)
138.5
143.4145.1
157.6132.8
139.3149.6251.4
126.0132.0
157.0131.8135.8112.4
115.7122.1145.2123.9116.2
114.2126.3
306.7
132.4
135.9
139.1
144.1145.8
158.9133.2
139.7150.3259.7
126.7131.7
157.6132.0136.2111.5
115.6122.1145.8124.5116.3
114.5127.1
321.5
132.7
136.2
139.7
144.8146.5
160.1133.5
140.0150.9267.1
127.5131.7
158.2132.2136.5110.6
115.4122.0146.2125.1116.4
114.7127.8
335.1
133.0
136.5
140.2
145.3147.1
161.2133.9
140.2151.5274.0
128.2131.9
159.0132.4136.8109.8
115.3122.0146.7125.7116.5
114.9128.5
347.8
133.3
136.7
2007
Q4 Q1
2008
Q2' Q3'
Capacity utilization rate (percent)2
81.0
79.379.3
77.883.8
81.377.277.8
83.472.3
80.481.081.168.8
82.688.879.084.679.1
89.985.9
80.6
81.0
79.2
80.7
78.778.7
77.185.5
81.376.677.9
83.369.7
79.980.680.967.3
82.190.678.182.478.4
90.587.1
80.1
80.7
78.6
79.7
77.577.6
75.482.6
79.674.478.4
83.464.1
78.880.180.866.0
82.290.677.381.376.2
90.885.6
80.4
79.7
77.4
77.6
75.575.5
73.581.4
78.273.575.4
81.662.9
73.377.879.665.8
80 886.374.080.274.4
88.882.8
76.1
77.7
75.4

Selected Measures 41
2.12 OUTPUT, CAPACITY, AND CAPACITY UTILIZATION1—CONTINUED
Seasonally adjusted
Series
1 Total Industry
2 Manufacturing3 Manufacturing (NAICS)
4 Durable manufacturing5 Primary metal
6 Fabricated metal products . . . .7 Machinery8 Computer and electronic
products9 Electrical equipment,
appliances, andcomponents
10 Motor vehicles and parts11 Aerospace and
miscellaneoustransportation equipment .
12 Nondurable manufacturing13 Food, beverage, and tobacco
products14 Textile and product mills
15 Paper16 Petroleum and coal products . .17 Chemical18 Plastics and rubber products . .19 Other manufacturing (non-NAICS) .
20 Mining21 Electric and gas utilities
MEMOS22 Computers, communications
equipment, and semiconductors .
23 Total excluding computers,communications equipment,and semiconductors
24 Manufacturing excluding computers,communicationsequipment, and semiconductors .
1973
High
88.8
88.388.4
89.4101.9
91.794.6
87.0
99.395.8
75.987.6
86.389.5
96.792.185.396.186.2
93.496.2
84.4
89.1
88.4
1975
Low
74.0
71.571.3
69.669.8
69.974.3
66.0
68.054.8
68.172.3
77.561.8
74.180.869.161.775.6
87.682.9
62.3
74.4
71.9
Previous cycle2
High
86.6
86.286.2
86.790.1
83.192.7
90.0
91.995.1
87.185.8
84.289.6
95.491.083.590.188.0
93.889.0
89.6
86.8
86.4
Low
70.9
68.567.8
62.946.9
61.858.0
77.4
64.644.9
69.075.4
80.472.1
81.468.867.971.886.7
79.677.7
75.1
70.6
68.0
Latest cycle3
High
85.0
85.485.3
84.693.8
81.785.3
81.9
89.189.5
87.486.7
86.091.1
92.688.285.089.891.1
86.392.7
81.7
85.3
85.8
Low
Capacity ut
78.6
77.177.0
73.575.0
72.774.0
76.7
77.056.0
81.081.4
80.977.6
86.182.479.976.480.4
83.684.1
75.3
78.7
77.2
2007
Nov. June'
lization rate (percent)4
81.1
79.379.3
77.983.5
81.677.1
78.0
83.472.6
80.880.9
81.068.6
82.488.579.085.079.0
90.086.3
80.7
81.1
79.2
79.6
77.377.4
75.382.2
78.674.2
77.8
83.665.9
79.279.7
80.465.6
82.090.277.081.776.0
90.985.9
79.4
79.6
77.2
July'
79.5
77.177.2
75.383.7
78.373.5
76.9
83.267.7
78.179.4
79.965.9
81.390.476.781.874.9
92.184.9
78.1
79.5
77.1
2008
Aug.' Sept.'
78.3
76.276.3
73.982.4
78.674.6
75.5
82.360.2
77.578.9
79.766.6
82.089.075.880.274.4
91.580.9
76.1
78.4
76.2
75.0
73.173.0
71.378.1
77.772.5
73.7
79.360.9
64.175.0
79.365.0
79.279.469.578.674.0
82.882.7
74.0
75.0
73.0
Oct.'
76.0
73.473.4
69.671.8
76.370.9
72.4
79.358.7
62.077.6
80.064.7
77.787.973.976.774.3
88.783.1
72.1
76.2
73.5
Nov.p
75.4
72.372.2
68.566.4
74.569.2
70.9
77.457.0
69.876.3
80.062.8
76.287.971.274.373.8
90.984.3
69.9
75.7
72.4
NOTE: The statistics in this release cover output, capacity, and capacity utilization in theindustrial sector, which is defined by the Federal Reserve to comprise manufacturing, mining,and electric and gas utilities. Mining is defined as all industries in sector 21 of the NorthAmerican Industry Classification System, or NAICS; electric and gas utilities are those inNAICS sectors 2211 and 2212. Manufacturing comprises NAICS industries (sector 31-33)plus the logging industry and the newspaper, periodical, book, and directory publishingindustries. Logging and publishing are classified elsewhere in NAICS (under agriculture andinformation respectively), but historically they were considered to be manufacturing and wereincluded in the industrial sector under the Standard Industrial Classification (SIC) system. InDecember 2002, the Federal Reserve reclassified all its industrial output data from the SICsystem to NAICS.
1. Data in this table appear in the Board's G. 17(419) monthly statistical release. The dataare also available on the Board's website, www.federalreserve.gov/releases/gl7. The latesthistorical revision of the industrial production index and the capacity utilization rates wasreleased on March 28, 2008. The 2008 annual revision is described in an article in the FederalReserve Bulletin titled "Industrial Production and Capacity Utilization: The 2008 Revision,"www.federalreserve.gov/pubs/bulletin/2008/pdf/Industrial08.pdf.
2. Monthly highs, 1978-80; monthly lows, 1982.3. Monthly highs, 1988-89; monthly lows, 1990-91.4. Capacity utilization is calculated as the ratio of the Federal Reserve's seasonally
adjusted index of industrial production to the corresponding index of capacity.
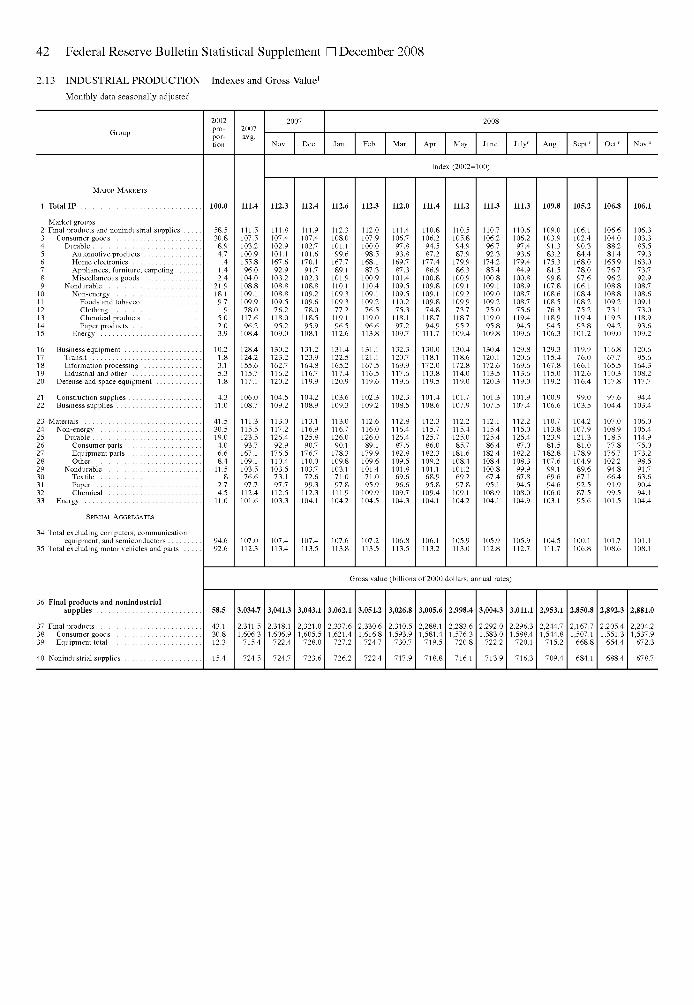
42 Federal Reserve Bulletin Statistical Supplement • December 2008
2.13 INDUSTRIAL PRODUCTION Indexes and Gross Value1
Monthly data seasonally adjusted
Group
2002pro-por-tion
2007
Apr. May Aug.r Sept/
MAJOR MARKETS
1 Total IP
Market groups2 Final products and nonindustrial supplies . .3 Consumer goods4 Durable5 Automotive products6 Home electronics7 Appliances, furniture, carpeting . . .8 Miscellaneous goods9 Nondurable
10 Non-energy11 Foods and tobacco12 Clothing13 Chemical products14 Paper products15 Energy
16 Business equipment17 Transit18 Information processing19 Industrial and other20 Defense and space equipment
21 Construction supplies22 Business supplies
23 Materials24 Non-energy25 Durable26 Consumer parts27 Equipment parts28 Other29 Nondurable30 Textile31 Paper32 Chemical33 Energy
SPECIAL AGGREGATES
34 Total excluding computers, communicationequipment, and semiconductors
35 Total excluding motor vehicles and parts . .
36 Final products and nonindustrialsupplies
37 Final products38 Consumer goods . . .39 Equipment total
40 Nonindustrial supplies .
58.530.88.94.7
.41.42.4
21.918.19.7
.95.02.03.9
10.21.83.15.31.8
4.311.0
41.530.519.04.06.68.4
11.5.8
2.74.5
11.0
94.692.6
43.130.8
111.5107.5103.2100.9155.896.0
104.0108.8109.1109.978.0
117.696.2
108.4
128.4124.2155.6115.7117.1
106.0108.7
111.3115.5123.593.7
167.1109.1103.576.697.7
112.4101.6
107.0112.3
Index (2002=100)
112.3
111.807.402.901.167.692.903.208.808.809.576.2
118.095.209.0
30.223.262.7
116.220.2
04.509.2
113.0117.226.492.976.5
110.403.573.197.7
112.503.3
07.4113.4
112.4
111.9107.4102.7101.6170.191.7
102.3108.8109.2109.678.0
118.595.9
108.1
131.2123.9164.8116.7119.9
104.2108.9
113.1116.9125.890.7
176.7110.0103.772.699.3
112.3104.1
107.4113.5
112.6
112.3108.0101.199.6
167.789.1
101.9110.1109.3109.377.2
119.196.5
112.6
131.4122.5165.2117.4120.9
103.6109.3
113.0116.7126.090.1
178.3109.8103.171.097.8
111.9104.2
107.6113.8
112.3
112.0107.9100.098.5
168.187.3
100.9110.4109.1109.276.5
119.096.6
113.8
131.1121.1167.5116.5119.6
102.3109.2
112.6116.0126.089.1
179.9109.6101.471.095.9
109.9104.5
107.2113.5
112.0
111.4106.797.893.8
169.787.3
101.4109.5109.5110.275.3
118.197.2
109.7
132.3120.7169.9117.6119.6
102.3108.5
112.8116.4126.487.6
182.8109.5101.869.696.6
109.7104.3
106.8113.5
111.4
110.8106.294.587.2
177.486.9
100.8109.8109.1109.874.8
118.794.9
111.7
130.0118.1172.0113.8119.5
101.4108.6
112.3115.7125.786.0
182.3109.2101.168.995.8
109.4104.1
106.1113.2
111.2
110.5105.894.987.9
179.986.3
100.9109.1109.2109.973.7
118.795.2
109.4
130.4118.6172.8114.0119.0
101.7107.9
112.2115.4125.085.7
181.6108.4101.269.297.8
109.1104.2
105.9113.0
111.3
110.7106.296.792.3
174.285.4
100.8109.1109.0109.275.0
119.095.8
109.8
130.4120.1172.6113.5120.3
101.3107.5
112.1115.4125.486.4
182.4108.4100.867.495.1
108.9104.1
105.9112.8
111.3
110.6106.297.493.6
179.484.9
100.8108.9108.7108.775.6
119.494.5
109.6
129.8120.6169.6113.6119.0
101.9107.4
112.2115.0125.487.0
182.2108.399.967.894.5
108.0104.9
105.9112.7
109.8
109.0103.991.383.2
175.381.599.8
107.8108.6108.576.3
118.994.5
106.3
129.3115.4167.8115.0119.2
100.9106.6
110.7113.8123.981.5
182.8107.699.169.694.6
106.0103.1
104.5111.7
105.2
106.1102.490.384.4
168.078.097.6
106.1108.4108.275.2
119.493.8
101.2
119.976.0
166.1112.6116.4
99.0103.5
104.2107.9121.381.0
178.9104.989.667.192.587.595.6
100.1106.8
106.8
106.6104.088.281.4
165.976.796.2
108.8108.8109.273.1
119.394.2
109.0
116.867.7
165.5110.3117.8
97.6104.4
107.0108.9118.577.8
176.7102.294.866.491.999.5
101.5
101.7108.6
Gross value (billions of 2000 dollars, annual rates)
12.3
15.4
3,034.7
2,311.51,606.3
715.4
724.5
2,318.11,606.9
722.4
724.7
3,043.1
2,321.01,605.5
728.0
723.6
2,337.61,621.4
727.2
726.2
2,330.61,616.8
724.7
722.4
3,026.8
2,310.51,593.9
730.7
717.9
2,288.11,581.4
719.5
718.8
2,998.4
2,283.61,576.3
720.8
716.1
2,292.01,583.0
722.2
713.9
2,296.31,588.4
720.1
716.3
2,953.1
2,244.71,544.8
715.2
709.4
2,167.71,507.1
668.8
684.1
106.3103.385.579.3
163.073.792.9
108.7108.6109.173.0
118.993.6
109.2
120.695.6
164.3108.2win
94.4103.4
106.0105.4114.975.0
173.298.591.763.690.494.1
104.4
101.1108.1
2,892.3
2,205.41,551.3
654.4
688.4
2,204.21,537.9
672.3

Selected Measures 43
2.13 INDUSTRIAL PRODUCTION Indexes and Gross Value1—Continued
Monthly data seasonally adjusted
Group
INDUSTRY GROUPS
41 Manufacturing42 Manufacturing (NAICS)
43 Durable manufacturing44 Wood products45 Nonmetallic mineral
products46 Primary metal47 Fabricated metal products .48 Machinery49 Computer and electronic
products50 Electrical equipment,
appliances, andcomponents
51 Motor vehicles and parts . .52 Aerospace and
miscellaneoustransportationequipment
53 Furniture and relatedproducts
54 Miscellaneous
55 Nondurable manufacturing . .56 Food, beverage, and
tobacco products . . . .57 Textile and product mills . .58 Apparel and leather59 Paper60 Printing and support61 Petroleum and coal
products62 Chemical63 Plastics and rubber
products
64 Other manufacturing(non-NAICS)
65 Mining66 Utilities67 Electric68 Natural gas
69 Manufacturing excludingcomputers, communicationsequipment, andsemiconductors
70 Manufacturing excluding motorvehicles and parts
NAICScode2
321
327331332333
334
3353361-3
3364-9
337339
311,2313,4315,6
322323
324325
326
1133,5111
212211,2
22112212
2002pro-por-tion
83.278.5
43.21.5
2.32.35.75.3
8.1
2.27.4
3.5
1.83.3
35.3
11.31.41.03.12.4
1.810.7
3.8
4.7
7.29.68.21.4
77.8
75.7
2007avg.
112.9114.2
121.099.2
108.1110.3112.0116.0
183.4
104.997.2
122.3
102.0115.9
106.6
110.180.578.595.899.8
108.7114.2
103.4
92.9
101.4108.2110.498.2
107.6
114.3
2007
Nov. Dec. Jan. Feb. Mar. Apr. May
2008
June' July' Aug.' Sept.' Oct.' Nov.'
Index (2002=100)
113.8115.1
122.994.2
109.7111.0113.7115.4
196.2
105.095.8
126.9
101.4116.0
106.6
110.077.176.895.499.4
108.1114.7
105.4
91.7
102.9109.1111.199.4
107.7
115.3
113.8115.1
122.894.3
105.9112.9113.1114.6
198.1
106.195.5
126.4
100.1117.2
106.8
110.177.278.797.399.0
108.5114.6
104.5
91.9
103.9108.2109.7101.2
107.6
115.4
113.8115.2
122.992.3
106.1115.2113.4115.2
198.5
106.193.9
127.4
98.1117.8
106.8
110.075.377.896.098.4
111.7114.6
103.0
91.3
103.2110.8112.4103.2
107.6
115.5
113.1114.5
122.291.0
104.9114.1113.5114.1
202.2
104.493.0
125.2
96.4115.3
106.0
109.775.277.193.797.3
110.6113.6
102.8
91.2
103.6112.6113.5107.9
106.8
114.8
113.3114.6
122.491.4
106.5112.3113.6116.0
206.2
106.088.6
125.1
95.9117.1
106.2
111.074.776.095.198.4
109.5113.2
102.0
91.0
103.9108.7110.4101.0
106.7
115.3
112.3113.7
120.790.2
104.9111.5112.4112.4
208.9
105.783.1
124.4
94.6116.3
106.0
110.673.375.693.897.4
110.6113.2
101.3
89.1
104.0110.4111.8103.4
105.6
114.7
112.3113.7
120.689.6
105.0109.5111.5112.3
209.5
106.683.4
124.0
94.4116.6
106.2
110.473.474.596.497.0
110.9113.4
101.5
88.5
104.1108.0109.2102.0
105.6
114.7
112.1113.5
120.989.0
103.8109.9110.1112.1
209.7
106.786.9
125.6
93.7116.1
105.5
109.972.475.994.694.2
110.0112.7
102.4
88.4
104.2110.0112.399.4
105.4
114.2
111.9113.4
121.188.0
105.1112.0109.7111.1
208.9
106.489.2
124.0
92.8116.6
105.2
109.372.576.693.892.6
110.3112.3
102.7
87.2
105.7108.9111.398.1
105.3
113.8
110.8112.2
119.287.3
104.1110.3110.2112.9
206.9
105.579.4
123.3
89.2118.8
104.5
109.073.277.194.594.0
108.6111.2
100.9
86.6
105.1103.9105.795.4
104.2
113.4
106.3107.6
115.384.3
101.4104.6108.9110.0
203.6
101.880.4
102.1
87.6116.7
99.3
108.771.276.191.393.2
96.8102.1
99.0
86.2
95.1106.4108.795.8
99.9
108.5
107.0108.3
112.779.8
102.196.3
107.0107.7
201.5
102.077.5
98.9
84.8116.0
102.8
109.770.773.989.593.2
107.2108.6
96.7
86.5
102.0107.1109.397.2
100.7
109.5
105.5106.7
111.278.1
98.489.1
104.6105.2
199.1
99.875.3
111.6
82.3114.1
101.2
109.768.473.787.792.3
107.1104.7
93.8
86.0
104.6108.8111.098.8
99.2
108.0
NOTE: The statistics in this release cover output, capacity, and capacity utilization in theindustrial sector, which is defined by the Federal Reserve to comprise manufacturing, mining,and electric and gas utilities. Mining is defined as all industries in sector 21 of the NorthAmerican Industry Classification System, or NAICS; electric and gas utilities are those inNAICS sectors 2211 and 2212. Manufacturing comprises NAICS industries (sector 31-33)plus the logging industry and the newspaper, periodical, book, and directory publishingindustries. Logging and publishing are classified elsewhere in NAICS (under agriculture andinformation respectively), but historically they were considered to be manufacturing and wereincluded in the industrial sector under the Standard Industrial Classification (SIC) system. InDecember 2002, the Federal Reserve reclassified all its industrial output data from the SICsystem to NAICS.
1. Data in this table appear in the Board's G. 17(419) monthly statistical release. The dataare also available on the Board's website, www.federalreserve.gov/releases/gl7. The latesthistorical revision of the industrial production index and the capacity utilization rates wasreleased on March 28, 2008. The 2008 annual revision is described in an article in the FederalReserve Bulletin titled "Industrial Production and Capacity Utilization: The 2008 Revision,"www.federalreserve.gov/pubs/bulletin/2008/pdf/Industrial08.pdf.
2. North American Industry Classification System.

44 Federal Reserve Bulletin Statistical Supplement • December 2008
3.10 U.S. INTERNATIONAL TRANSACTIONS Summary
Millions of dollars; quarterly data seasonally adjusted except as noted1
Item credits or debits
Q3 Q4 Q1 Q2' Q3
1 Balance on current account2 Balance on goods and services . . .3 Exports4 Imports5 Income, net6 Investment, net7 Direct8 Portfolio9 Compensation of employees . . .
10 Unilateral current transfers, net . . .
11 Change in U.S. government assets other than officialreserve assets, net (increase, —)
12 Change in U.S. official reserve assets (increase, —)13 Gold14 Special drawing rights (SDRs)15 Reserve position in International Monetary Fund16 Foreign currencies
17 Change in U.S. private assets abroad (increase, —)18 Bank-reported claims2
19 Nonbank-reported claims20 U.S. purchase of foreign securities, net21 U.S. direct investments abroad, net
22 Change in foreign official assets in United States (increase, +)23 U.S. Treasury securities24 Other U.S. government obligations25 Other U.S. government liabilities2
26 Other U.S. liabilities reported by U.S. banks2
27 Other foreign official assets3
28 Change in foreign private assets in United States (increase, +)29 U.S. bank-reported liabilities4
30 U.S. nonbank-reported liabilities31 Foreign private purchases of U.S. Treasury securities, net . .32 U.S. currency flows33 Foreign purchases of other U.S. securities, net34 Foreign direct investments in United States, net
35 Capital account transactions, net5
36 Discrepancy37 Due to seasonal adjustment38 Before seasonal adjustment
MEMOChanges in official assets
39 U.S. official reserve assets (increase, - )40 Foreign official assets in United States, excluding line 25
(increase, +)
-728,993-711,5671,283,753
-1,995,32072,35878,758
173,205-94,447
-6,400-89,784
5,539
14,0960
4,51110,200-615
-566,266-207,625-71,207
-251,199-36,235
259,268112,841100,493
-42126,26020,095
988,079214,73669,572
132,3008,447
450,386112,638
-4,03632,313
14,096
259,689
-788,116-753,2831,457,015
-2,210,29857,19463,804
184,146-120,342
-6,609-92,027
5,346
2,3740
- 2 2 33,331- 7 3 4
-1,259,469-488,424-164,597-365,204-241,244
487,939208,564219,837
2,81622,36534,357
1,573,174461,100242,727-58,204
2,227683,363241,961
-3,880-47,078
2,374
485,123
-731,214-700,2581,645,726
-2,345,98481,74988,776
233,861-145,085
-7,027-112,705
-1220
-1541,021-989
-1,267,459-644,751
-706-288,731-333,271
411,05858,865
171,4655,342
108,69566,691
1,646,645532,813156,290156,825
-10,675573,850237,542
-1,843-41,287
-122
405,716
-172,952-168,114
424,873-592,986
22,95824,72959,710
-34,981-1,771
-27,796
623
- 5 40
- 3 7230
- 2 4 7
-171,045-88,697
80,012-100,317
-62,043
13,469-25,810
18,022913
9,87310,471
253,00753,92555,59967,406
655-30,486105,908
-61771,627
-21,80593,431
- 5 4
12,556
-167,241-173,783
435,465-609,248
36,32738,15174,835
-36,684-1,824
-29,784
- 2 20
- 3 5285
-272
-130,990-115,926
100,043-4,202
-110,905
145,49742,72812,1094,132
52,53733,991
234,905123,987
-111,84660,059-3,530110,48955,746
-571-45,600
8,892-54,491
- 2 2
141,365
-175,640-177,110
451,645-628,756
33,21235,00970,261
-35,252-1,797
-31,742
-29112
-359
-263,634-221,316
81,848-35,066-89,100
173,53388,64979,234
1,645-26,930
30,935
285,48479,08884,08563,263
-914-20,475
80,437
-14,1319,271
-23,403
-276
171,888
-180,944-180,079
475,498-655,578
28,16429,94564,868
-34,923-1,780
-29,028
-22-955-290
145,558213,85949,324
-33,576-84,049
145,39158,14393,1452,439
-30,05521,719
-122,672-256,616-54,350
65,692
17,068105,304
-63158,677
-3,36862,045
-1,267
142,952
41 Change in Organization of Petroleum Exporting Countries officialassets in United States (part of line 22)
-174,091-176,536
489,053-665,589
30,83532,63665,299
-32,663-1,800
-28,390
- 3 0256
-405
235,678151,99453,78786,768
-56,871
117,663116,479-8,361
1,7149,617
-1,786
8,029-147,874
83,59889,506
5,845-89,163
66,117
-59339,487
-33,73973,226
-179
115,949
1. Seasonal factors are not calculated for lines 11-16, 18-20, 22-35, and 38-41.2. Associated primarily with military sales contracts and other transactions arranged with
or through foreign official agencies.3. Consists of investments in U.S. corporate stocks and in debt securities of private
corporations and state and local governments.4. Reporting banks included all types of depository institutions as well as some brokers
and dealers.
5. Consists of capital transfers (such as those of accompanying migrants entering orleaving the country and debt forgiveness) and the acquisition and disposal of nonproducednonfinancial assets.
SOURCE: U.S. Department of Commerce, Bureau of Economic Analysis, Survey of CurrentBusiness.
3.12 U.S. RESERVE ASSETS
Millions of dollars, end of period
Asset
1 Total
2 Gold stock1
3 Special drawing rights2-3
4 Reserve position in International MonetaryFund2
5 Foreign currencies4
2005
65,127
11,0438,210
8,03637,838
2006
65,895
11,0418,870
5,04040,943
2007
70,565
11,0419,476
4,24445,804
2008
Apr.
74,372
11,0419,767
4,25349,311
May
75,170
11,0419,771
5,11149,247
June
75,740
11,0419,849
5,23749,613
July
74,832
11,0419,772
4,93049,089
Aug.
72,560
11,0419,494
4,77447,252
Sept.
71,834
11,0419,418
4,75046,626
Oct.
69,763
11,0419,001
4,43345,288
Nov.'
73,378
11,0419,023
7,34445,970
NOTE: The data presented in this table are available in the monthly statistical release "U.S.Reserve Assets; Foreign Official Assets Held at Federal Reserve Banks," on the Board'swebsite at www.federalreserve.gov/releases.
1. Gold held "under earmark" at Federal Reserve Banks for foreign and internationalaccounts is not included in the gold stock of the United States; see table 3.13, line 3. Goldstock is valued at $42.22 per fine troy ounce.
2. Special drawing rights (SDRs) are valued according to a technique adopted by theInternational Monetary Fund (IMF) in July 1974. Values are based on a weighted average ofexchange rates for the currencies of member countries. From July 1974 through December1980, sixteen currencies were used; since January 1981, five currencies have been used. U.S.SDR holdings and reserve positions in the IMF have also been valued on this basis since July1974.
3. Includes allocations of SDRs by the International Monetary Fund on Jan. 1 of the yearindicated, as follows: 1970—$867 million; 1971—$717 million; 1972—$710 million; 1979—$1,139 million; 1980—$1,152 million; 1981—$1,093 million; plus net transactions in SDRs.
4. Valued at current market exchange rates. Excludes outstanding reciprocal currencyswaps with foreign central banks. At end-November 2008 swaps outstanding were $506,818billion: $264,113 billion with the European Central Bank, $20,851 billion with the SwissNational Bank, $54,295 billion with the Bank of England, $96,990 billion with the Bank ofJapan, $21,620 billion with the Reserve Bank of Australia, $25 billion with the Bank ofSweden, $15 billion with the National Bank of Denmark, and $8,950 billion with the Bank ofNorway.

Summary Statistics 45
3.13 FOREIGN OFFICIAL ASSETS HELD AT FEDERAL RESERVE BANKS'
Millions of dollars, end of period
Asset
1 Deposits
Held in custody2 U.S. Treasury securities2
3 Earmarked gold3
2005
83
1,069,0148,967
2006
98
1,133,9698,967
2007
96
1,191,7068,710
2008
Apr.
105
1,310,6498,548
May
99
1,315,6168,534
June
211
1,348,9888,521
July
103
1,375,1998,494
Aug.
99
1,397,6928,487
Sept.
121
1,443,4218,440
Oct.
184
1,521,4458,426
Nov.'
187
1,555,9618,412
NOTE: The data presented in this table are available in the monthly statistical release "U.S.Reserve Assets; Foreign Official Assets Held at Federal Reserve Banks," on the Board'swebsite at www.federalreserve.gov/releases.
1. Excludes deposits and U.S. Treasury securities held for international and regionalorganizations.
2. Marketable U.S. Treasury bills, notes, and bonds and nonmarketable U.S. Treasurysecurities, in each case measured at face (not market) value.
3. Held in foreign and international accounts and valued at $42.22 per fine troy ounce; notincluded in the gold stock of the United States.
3.15 SELECTED U.S. LIABILITIES TO FOREIGN OFFICIAL INSTITUTIONS
Millions of dollars, end of period
Item
1 Total1
By type2 Liabilities reported by banks in the United States2
U.S. Treasury bonds and notes
5 Nonmarketable4
6 U.S. securities other than U.S. Treasury securities5
By area7 Europe1
9 Latin America and Caribbean
11 Africa
2006
2,585,038
284,827176,829
1 271 1741,026
851,182
435,0627,078
175,7461 915 375
12,42239,354
2007
3,239,548
398,233196,344
1 443 6911,111
1,200,169
602,97611,370
267,4432 292 778
25,26239,719
2006
June"
2,490,430
308,842184,847
1 211 819986
783,937
414,9867,859
159,4441,851,832
15,95540,354
June8
2,490,430
308,842184,847
1,211,819986
783,937
414,9867,859
159,4441,851,832
15,95540,354
Dec.
2,585,038
284,827176,829
1,271,1741,026
851,182
435,0627,078
175,7461,915,375
12,42239,354
2008
July
3,417,787'
364,629'232,464
1,533,9561,163
1,285,574
646,522'11,340
289,4002,392,984
33,96843,573
Aug.
3,418,207
362,166245,562
1,538,8041,171
1,270,503
639,14411,264
289,7992,408,081
31,40938,509
Sept.
3,437,945'
355,513'276,781
1,543,7481,179
1,260,724
624,139'11,336
284,7572,444,758'
32,89940,056'
Oct.p
3,452,305
303,323360,550
1,542,6641,187
1,244,581
592,26112,942
279,3192,486,409
36,73144,643
1. For data before June 2006, includes the Bank for International Settlements.2. Principally demand deposits, time deposits, bankers acceptances, commercial paper,
negotiable time certificates of deposit, and borrowings under repurchase agreements.3. Includes nonmarketable certificates of indebtedness and Treasury bills issued to official
institutions of foreign countries.4. Excludes notes issued to foreign official nonreserve agencies. Includes current value of
zero-coupon Treasury bond issues to foreign governments as follows: Mexico, beginningMarch 1990, 30-year maturity issue; Venezuela, beginning December 1990, 30-year maturityissue; Argentina, beginning April 1993, 30-year maturity issue.
5. Debt securities of U.S. government corporations and federally sponsored agencies, andU.S. corporate stocks and bonds.
6. Data in the two columns shown for this date reflect different benchmark bases forforeigners' holdings of selected U.S. long-term securities. Figures in the first column arecomparable to those for earlier dates; figures in the second column are based in part on abenchmark survey as of end-June 2006 and are comparable to those shown for the followingdates.
SOURCE: Based on U.S. Department of the Treasury data and on data reported to theTreasury by banks (including Federal Reserve Banks) and securities dealers in the UnitedStates, and in periodic benchmark surveys of foreign portfolio investment in the UnitedStates.
3.16 LIABILITIES TO, AND CLAIMS ON, FOREIGNERS Reported by Banks in the United States1
Payable in Foreign Currencies
Millions of dollars, end of period
Item
2 Deposits3 Other liabilities
5 Deposits
8 Deposits
2004
98,34952,41045,939
129,54451,02978,515
32,0568,519
23,537
2005
91,69359,24132,452
100,14443,94256,202
56,10020,93135,169
2006
140,87397,08843,785
131,53059,15272,378
64,55834,90129,657
2007
Dec'
261,508121,159140,349
170,11373,62996,484
74,69350,26324,430
2008
Mar.'
257,938115,014142,924
184,35477,098
107,256
84,29957,79726,502
June'
233,44999,032
134,417
160,37771,74888,629
80,66350,28230,381
Sept.
225,85995,247
130,612
142,50865,88276,626
72,39540,99231,403
Data on claims exclude foreign currencies held by U.S. monetary authorities. 2. Assets owned by customers of the reporting bank located in the United States thatrepresent claims on foreigners held by reporting banks for the accounts of the domesticcustomers.
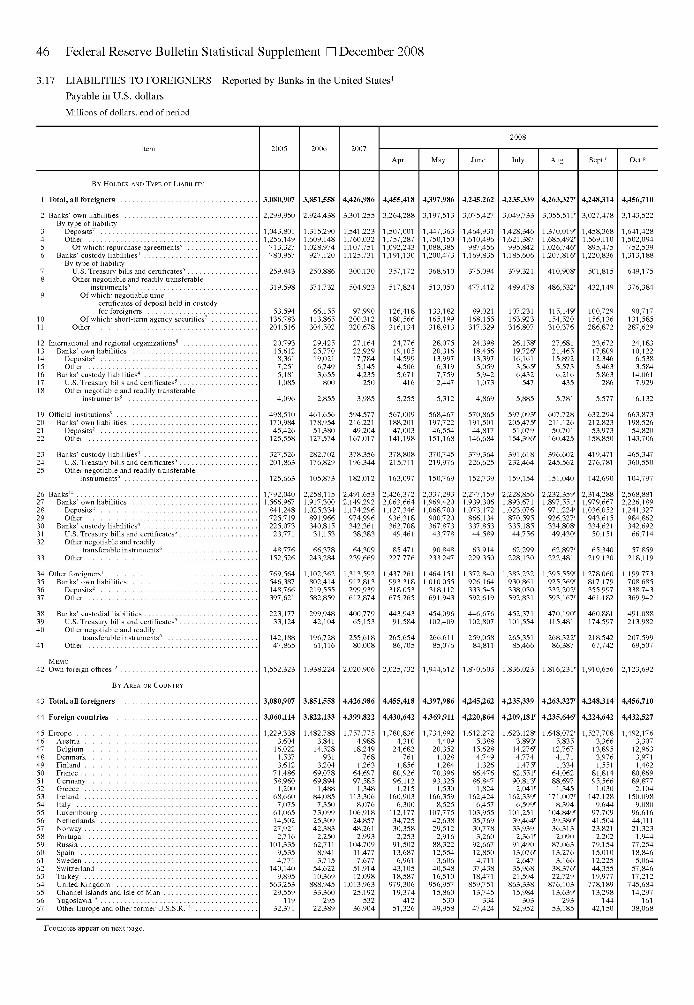
46 Federal Reserve Bulletin Statistical Supplement • December 2008
3.17 LIABILITIES TO FOREIGNERS Reported by Banks in the United States1
Payable in U.S. dollars
Millions of dollars, end of period
Apr. May July Aug. Sept/
BY HOLDER AND TVPE OF LIABILITY
1 Total, all foreigners
2 Banks' own liabilitiesBy type of liability
3 Deposits2
4 Other5 Of which: repurchase agreements3
6 Banks' custody liabilities4
By type of liability7 U.S. Treasury bills and certificates5
8 Other negotiable and readily transferableinstruments'"
9 Of which: negotiable timecertificates of deposit held in custodyfor foreigners
10 Of which: short-term agency securities7 . . .11 Other
12 International and regional organizations5
13 Banks' own liabilities14 Deposits2
15 Other161718
Banks' custody liabilities4
U.S. Treasury bills and certificates5
Other negotiable and readily transferableinstruments'"
19 Official institutions9
20 Banks' own liabilities21 Deposits2
22 Other
23 Banks' custody liabilities4
24 U.S. Treasury bills and certificates5
25 Other negotiable and readily transferableinstruments'"
26 Banks10
27 Banks' own liabilities28 Deposits2
OtherBanks' custody liabilities4
U.S. Treasury bills and certificates5
Other negotiable and readilytransferable instruments'' . . .
Other
29303132
34 Other foreigners"35 Banks' own liabilities36 Deposits2
37 Other
383940
Banks' custodial liabilitiesU.S. Treasury bills and certificates5
Other negotiable and readilytransferable instruments'' . . .
Other
MEMO42 Own foreign offices12
BY AREA OR COUNTRY
43 Total, all foreigners
44 Foreign countries . .
45 Europe46 Austria47 Belgium48 Denmark49 Finland50 France51 Germany52 Greece53 Ireland54 Italy55 Luxembourg56 Netherlands57 Norway58 Portugal59 Russia60 Spain61 Sweden62 Switzerland63 Turkey64 United Kingdom65 Channel Islands and Isle of Man66 Yugoslavia13
67 Other Europe and other former U.S.S.R.1
3,080,907
! ,299,950
3,851,558
2,924,438
4,426,986
3,301,255
4,455,418
3,264,288
4,397,986
3,197,513
4,245,262
3,075,427 3,049,733
4,263,327'
3,055,511'
4,248,314
3,027,478
1,043,8011,256,149
713,327780,957
259,843
53,594136,783201,516
20,79315,6128,3617,2515,1811,085
4,096
498,510170,98445,426125,558
327,526201,863
1,315,2901,609,1481,028,974
927,120
250,886
371,732
66,155113,865304,502
29,42525,77019,0216,7493,655
800
2,855
461,656178,95451,380
127,574
282,702176,829
1,541,2231,760,0321,107,7511,125,731
300,130
504,923
97,990200,312320,678
27,16422,92917,7845,1454,235
250
3,985
594,577216,22149,204
167,017
378,356196,344
1,507,0011,757,2871,092,2431,191,130
357,172
517,824
126,418180,566316,134
24,77619,10514,5994,5065,671
416
5,255
567,009188,20147,003
141,198
378,808215,711
1,447,3631,750,1501,088,3851,200,473
368,610
513,050
133,182165,199318,813
28,07520,31613,9976,3197,7592,447
5,312
568,467197,72246,554
151,168
370,745219,976
1,464,9311,610,496
987,456
1,169,835
375,094
477,412
89,021168,155317,329
24,39818,45613,3975,0595,9421,073
4,869
570,865191,50144,817
146,684
379,364226,625
152,739
1,428,3461,621,387
995,842
1,185,606
379,321
489,478
107,231163,923316,807
26,158'19,726'16,1613,565'6,432
547
5,885
597,093'205,475'
51,079154,396'
391,618232,464
159,154
1,370,019'1,685,492'1,026,746'1,207,816'
410,908'
486,532'
115,149'154,520310,376
27,68121,46515,8925,5736,216
435
5,781
607,728211,12650,701
160,425
396,602245,562
151,040
1,458,3681,569,110
895,475
1,220,836
501,815
432,149
100,729156,136286,872
23,67217,80912,3465,4635,863
286
5,577
632,294212,82353,973
158,850
419,471276,781
142,690
,792,040,566,967
2,258,1151,917,300
2,491,6532,149,292
!,426,372!,063,664
2,337,2931,969,420
841,248725,719225,07323,771
48,776152,526
769,564546,387148,766397,621
223,17733,124
142,18847,865
1,025,334891,966340,81531,153
66,378243,284
1,102,362802,414219,555582,859
299,94842,104
196,72861,116
1,174,296974,996342,361
38,383
64,309239,669
1,313,592912,813299,939612,874
400,77965,153
255,61880,008
1,127,346936,318362,70849,461
85,471227,776
1,437,261993,318318,053675,265
443,94391,584
265,65486,705
1,068,700900,720367,87343,778
90,848233,247
1,464,1511,010,055
318,112691,943
454,096102,409
266,61185,076
2,277,1591,939,3061,073,172
866,134337,85344,589
63,914229,350
1,372,840926,164333,545592,619
446,676102,807
259,05884,811
3,080,907
3,060,114
3,851,558
3,822,133
4,426,986
4,399,822
4,455,418
4,430,642
4,397,986
4,369,911
4,245,262
4,220,864
2,228,8561,893,6711,023,076
870,595335,18544,756
62,299228,130
1,383,232930,861338,030592,831
452,371101,554
265,35185,466
4,235,339
4,209,181'
2,232,359'1,897,551'
971,224'926,327'334,808'49,430'
62,897'222,481
1,395,559'925,369'332,202'593,167'
470,190'115,481
268,322'86,387
4,263,327'
4,235,646'
2,314,2881,979,6671,036,052
943,615334,62150,151
65,340219,130
1,278,060817,179355,997461,182
460,881174,597
218,54267,742
4,248,314
4,224,642
,229,3383,604
16,0221,5373,612
71,48658,960
1,20068,6607,075
61,06514,50227,921
2,716101,335
9,5354,771
140,1409,895
563,25329,559
11932,371
1,482,7883,841
14,528931
3,20469,07869,894
1,48884,0857,350
73,09925,30942,383
2,25062,7118,9413,715
54,62210,369
888,94533,360
29522,389
1,757,7754,988
18,249768
1,26364,69797,585
1,348113,306
8,076106,91824,85748,261
2,993104,709
11,4777,677
51,91412,098
1,013,96325,192
53236,904
,780,8364,310
24,682761
1,85680,92696,112
1,215160,903
6,300112,17734,72530,358
2,25391,50213,6876,961
43,10518,587
979,30619,374
41251,326
1,734,8924,409
20,3521,0281,284
70,39693,325
1,530166,359
8,525107,77542,63829,512
2,91688,32212,5543,606
40,54816,510
956,95715,860
53049,958
1,612,2725,388
15,6284,7491,326
66,47686,847
1,824162,424
6,457103,95535,76930,7783,260
92,66712,8504,711
37,43818,471
859,75113,745
33447,424
,623,128'3,893'
14,276'4,7741,475'
62,551'90,813'
2,041'162,339'
6,599'101,25139,464'33,939
2,361'91,49013,076'2,647
35,96821,594
863,33815,984
30352,952
1,648,072'5,835
12,7674,1711,334
64,06288,697
1,345171,007'
8,394104,849'39,380'36,313
2,09087,06313,2763,166
38,376'22,729
876,10313,639'
29353,185
,527,7083,366
13,8953,9761,551
81,81495,566
1,030147,128
9,64497,70941,50423,821
2,20279,15415,01012,22544,35519,977
778,18913,298
14442,150
4,456,710
3,143,522
1,641,4281,502,094
752,539
1,313,188
649,175
376,384
90,717131,585287,629
24,18310,1226,5383,584
14,0617,929
6,132
663,873198,52654,820
143,706
465,347360,550
104,797
2,568,8812,226,1891,241,327
984,862342,692
66,714
57,859218,119
1,199,773708,685338,743369,942
491,088213,982
207 59969,507
4,456,710
4,432,527
1,492,1763,307
12,9633,9711,482
80,86989,8772,104
150,0989,080
96,61644,11121,323
1,94477,25418,8465,064
57,84617,212
745,68414,297
16138,068
Footnotes appear on next page.

3.17 LIABILITIES TO FOREIGNERS Reported by Banks in the United States1—Continued
Payable in U.S. dollars
Millions of dollars, end of period
Bank-Reported Data 47
Apr. Aug. Sept.
MEMO68 European Union1-
69 Canada .
70 Latin America71 Argentina
BrazilChileColombiaEcuadorGuatemalaMexicoPanamaPeruUruguayVenezuelaOther Latin America
7273747576777879808182
83 Caribbean .848586878889909192
BahamasBermudaBritish Virgin Islands .Cayman IslandsCubaJamaicaNetherlands Antilles . .Trinidad and Tobago .Other Caribbean
n.a.
33,552
133,6379,674
11,9008,9616,4773,3931,643
42,5325,2623,0514,939
27,2618,544
1,214,058211,45952,132n.a.
907,840
44,613
156,73110,50616,06716,83911,6573,4091,420
45,3497,1254,2676,116
22,75911,217
1,669,856256,17355,12921,493
1,297,459
59,391
172,93111,97424,41815,53910,9713,2731,816
52,3546,9965,1686,367
23,02911,026
1,838,464284,53948,52433,579
1,417,794
70,047
169,28012,64115,22016,15810,4723,7021,893
52,1777,6676,9006,188
23,60712,655
1,851,603288,58644,89841,082
1,434,281
73,165
180,44912,17628,08013,38011,0013,7971,919
51,7917,6136,2356,362
25,91812,177
1,817,175284,69546,06139,140
1,404,289
75,690
173,46411,55824,02213,95311,0113,4312,005
49,7857,1556,5645,748
25,84412,388
1,816,528291,79849,26438,805
1,395,234
70,679
175,92911,59422,68113,55810,9973,4371,685
54,7287,4006,4675,665
25,21912,498
1,773,526301,699
50,16239,892
1,341,814
66,884'
180,862'11,57424,213'13,57211,389'3,3751,684
58,553'6,923'6,3215,481
25,96611,811
,768,378'280,458'45,13441,247'
,361,148'
67,864
176,36313,30517,99414,47412,1973,6951,642
56,1287,6245,3965,583
26,10612,219
1,806,228300,86944,70541,915
1,374,349
1,283,018
78,981
193,90812,99120,72316,64312,1743,7521,744
65,5808,0595,8965,911
27,72812,707
1,908,446
93 AsiaChina
94 Mainland95 Hong Kong96 India97 Indonesia98 Israel99 Japan
100 Korea (South)101 Philippines102 Taiwan103 Thailand104 Middle Eastern oil-exporting countries105 Other
106 Africa107 Egypt108 Morocco109 South Africa110 Oil-exporting countries17
111 Other
112 Other countries113 Australia114 New Zealand115 All other
116 International and regional organizations .117 International15
118 Regional"
120916
6,3962,830
32,365
408,192
46,43933,97213,7024,2129,802
156,24527,094
3,77623,252
9,96149,46330,274
20,0954,953
1383,0496,8585,097
21,24217,7693,007
466
20,79315,6845,109
821,0238,4563,346
26,695
422,744
44,41043,11118,8084,3867,318
127,60627,786
3,85222,917
8,31869,49244,740
14,7812,252
1981,3964,4386,497
30,62025,2774,505
838
29,42525,2024,223
801,323
10,0863,301
39,238
527,061
94,36744,48118,2135,2127,770
146,35034,7694,834
26,05614,18880,13350,688
25,8163,682
1801,6296,117
14,208
18,38414,1303,1101,144
27,16423,1074,057
921,1009,2502,808
29,506
494,703
84,25142,14812,2263,7689,742
133,29421,5793,308
24,25415,00893,42751,698
35,1534,781
2112,9853,727
23,449
29,02024,8233,0461,151
24,77620,4134,363
941,0928,2492,822
30,733
495,419
68,39146,21012,930
3,11311,862
132,36921,743
2,92823,99019,679
105,05747,147
36,8674,035
1703,3844,168
25,110
31,94427,783
3,175986
28,07523,7714,304
931,4587,2503,976
28,650
480,912
58,49640,68314,8054,723
12,085131,45321,6073,698
22,15917,837
105,34248,024
36,9844,486
2742,9644,665
24,595
25,01421,0373,213
764
24,39819,7044,694
921,4136,4542,979
29,021
500,045
65,08940,68015,6445,099
10,079136,02721,6043,596
22,71218,919
112,79147,805
39,4805,101
3492,6625,405
25,963
26,39422,2203,0591,115
26,158'21,371'4,787
941,3125,4213,220
30,344
526,972'
73,215'40,57917,4836,558'8,606
142,04420,155'
3,69422,502'18,005'
125,30948,822'
21,5253,855
2422,9914,315
10,122
22,95317,3874,772
794
27,68123,3244,357
941,1534,7173,757
34,669
599,338
124,71352,51318,2018,271
11,248150,03616,4524,101
29,91214,364
121,77847,749
24,7877,321
5322,9673,965
10,002
22,35417,6813,990
683
23,67218,3045,368
47 03540,985
1,485,02893
1,0115,1183,266
37,082
705,227
183,60961,32221,4616,068
14,635166,695
14,3086,456
33,75018,727
125,98952,207
29,64810,536
5423,1744,351
11,045
24,14118,8894,540
712
24,18320,2753,908
1. Reporting banks include all types of depository institutions as well as some banks/financial holding companies and brokers and dealers. Excludes bonds and notes of maturitieslonger than one year. Effective February 2003, coverage is expanded to include liabilities ofbrokers and dealers to affiliated foreign offices.
2. Non-negotiable deposits and brokerage balances.3. Data available beginning January 2001.4. Financial claims on residents of the United States, other than long-term securities, held
by or through reporting banks for foreign customers. Effective February 2003, also includesloans to U.S. residents in managed foreign offices of U.S. reporting institutions.
5. Includes nonmarketable certificates of indebtedness and Treasury bills issued to officialinstitutions of foreign countries.
6. Principally bankers acceptances, commercial paper, negotiable time certificates ofdeposit, and short-term agency securities.
7. Data available beginning January 2001.8. Principally the International Bank for Reconstruction and Development, the Inter-
American Development Bank, and the Asian Development Bank. Excludes "holdings ofdollars" of the International Monetary Fund. Beginning with data for June 2006, alsoincludes the Bank for International Settlements.
9. Foreign central banks and foreign central governments. Before June 2006, also includesthe Bank for International Settlements.
10. Excludes central banks, which are included in "Official institutions." Includes posi-tions with affiliated banking offices also included in memo line (44) above.
11. As of February 2003, includes positions with affiliated non-banking offices alsoincluded in memo line (44) above.
12. For U.S. banks, includes amounts owed to own foreign branches and foreign subsidiar-ies consolidated in the quarterly Consolidated Reports of Condition filed with bank regulatory
agencies. For agencies, branches, and majority-owned subsidiaries of foreign banks, consistsprincipally of amounts owed to the head office or parent foreign office, and to foreignbranches, agencies, or wholly owned subsidiaries of the head office or parent foreign bank.Effective February 2003, includes amounts owed to affiliated foreign offices of U.S. brokersand dealers.
13. In February 2003, Yugoslavia changed its name to Serbia and Montenegro. Data forother entities of the former Yugoslavia recognized as independent states by the United Statesare reported under "Other Europe.''
14. For data prior to June 2006, also includes the Bank for International Settlements andthe European Central Bank.
15. As of May 2004, the European Union includes Austria, Belgium, Cyprus, the CzechRepublic, Denmark, Estonia, Finland, France, Germany, Greece, Hungary, Ireland, Italy,Latvia, Lithuania, Luxembourg, Malta, the Netherlands, Poland, Portugal, Slovakia, Slovenia,Spain, Sweden, and the United Kingdom. Data available beginning in June 2006. As ofJanuary 2007, also includes Bulgaria and Romania.
16. Comprises Bahrain, Iran, Iraq, Kuwait, Oman, Qatar, Saudi Arabia, and United ArabEmirates (Trucial States).
17. Comprises Algeria, Gabon, Libya, and Nigeria.18. Principally the International Bank for Reconstruction and Development. Excludes
"holdings of dollars" of the International Monetary Fund. Beginning with data for June 2006,also includes the Bank for International Settlements.
19. African, Asian, Caribbean, European, Latin American, and Middle Eastern regionalorganizations.

48 Federal Reserve Bulletin Statistical Supplement • December 2008
3.18 BANKS' OWN CLAIMS ON FOREIGNERS Reported by Banks in the United States1
Payable in U.S. dollars
Millions of dollars, end of period
Area or countryApr. May July Aug. Sept.
1 Total, all foreigners
2 Foreign countries
3 Europe4 Austria5 Belgium6 Denmark7 Finland8 France9 Germany
10 Greece11 Ireland12 Italy13 Luxembourg14 Netherlands15 Norway16 Portugal17 Russia18 Spain19 Sweden20 Switzerland21 Turkey22 United Kingdom23 Channel Islands and Isle of Man24 Other Europe and other former U.S.S.R.2
MEMO
25 European Union3
26 Canada
27 Latin America28 Argentina29 Brazil30 Chile31 Colombia32 Ecuador33 Guatemala34 Mexico35 Panama36 Peru37 Uruguay38 Venezuela39 Other Latin America4
40 Caribbean41 Bahamas42 Bermuda43 British Virgin Islands4
44 Cayman Islands45 Jamaica46 Netherlands Antilles47 Trinidad and Tobago48 Other Caribbean4
49 AsiaChina
50 Mainland51 Hong Kong52 India53 Indonesia54 Israel55 Japan56 Korea (South)57 Philippines58 Taiwan59 Thailand60 Middle Eastern oil-exporting countries5
61 Other
62 Africa63 Egypt64 Morocco65 South Africa66 Oil-exporting countries'"67 Other
68 Other countries69 Australia70 New Zealand71 Allother
72 International and regional organizations7 .
1,864,834
1,857,584
918,6604.139
11,900864
9,24788,87330,027
9716,42618,4828,201
20,95814,688
8321,2648,3729,452
143,8923,270
487,49232,5667,618
n.a.
64,104
51,1702,290
15,1116,6422,438
582872
14,6012,0761,226
4642,2732,595
620,474113,45817,846n.a.
475,227444
4,444907
8,148
190,610
14,8078,4122,518
4404,288
106,37717,254
1,7908,6267,796
12,3305,972
1,621422
63331317488
10,94510,226
541178
7,250
2,291,340
2,282,166
1,188,9194,277
13,5921,1569,434
112,40618,189
25024,30430,9917,144
29,57831,032
9241,7459,8348,907
105,3683,741
732,43036,893
6,724
71,325
59,1952,763
19,8946,6892,900
6041,031
16,5692,3161,446
3552,2812,347
724,316120,90417,7772,807
572,273669
2,4841,0556,347
221,858
15,4486,8882,827
5195,319
140,32924,484
9963,1665,729
10,5795,574
1,853597
56255403542
14,70013,195
1,263242
9,174
2,791,032
2,780,727
2,980,086
2,970,340
2,987,770
2,980,137
2,855,584
2,850,292
2,874,606'
2,868,459'
2,887,355'
2,881,301'
2,781,644'
2,776,233'
2,690,423
2,685,948
1,587,2184,055
20,5662,828
28,445162,29533,725
11045,96035,87013,26052,12222,684
1,3641,800
20,4487,279
191,9703,426
900,34924,35714,306
1,341,415
85,145
83,0423,978
30,3408,8493,567
9621,314
21,7833,8592,995
3382,3352,722
801,309151,18710,6513,328
622,637657
4,114673
8,062
185,695
18,4898,8204,385
9853,724
83,65227,383
1,2071,2225,960
23,1606,708
8,164312
27493442
6,890
30,15428,716
1,122316
10,305
1,725,8554,998
40,4576,451
32,133201,697
51,589341
67,36847,231
9,14253,15213,8201,5521,797
49,1239,431
186,3203,658
911,71612,20121,678
91,367
83,4584,825
24,7619,7873,524
8111,296
24,9064,4083,857
2711,8983,114
856,318147,173
16,1103,881
669,531742
4,409855
13,617
169,445
15,5649,2694,2931,0863,387
84,31622,182
1,1331,5484,045
15,5967,026
16,679356
60562891
14,810
27,21825,527
1,236455
9,746
1,680,9185,335
33,8886,159
27,073188,78653,633
34773,66849,445
8,36654,96615,4121,6262,033
55,1608,576
145,3973,663
916,7148,733
21,938
1,503,879
92,996
96,0733,866
38,62610,1923,527
8351,311
23,7524,5884,144
3111,9562,965
892,761154,129
17,8323,905
701,914769
4,229766
9,217
172,807
23,0328,9455,3521,3295,419
78,83621,090
1,0281,2073,629
16,1096,831
17,578367
18450608
16,135
27,00425,159
1,440405
7,633
1,593,2215,416
31,0294,021
29,854181,17357,384
27568,57448,22410,76759 29015,0731,4172,244
47,4967,433
116,6753,675
874,3816,730
22,090
88,786
96,7344,224
37 79610,3533,625
7861,377
23,9025,0204,517
2971,8732,964
865,530147,091
13,2893,996
686,156818
4,053807
9,320
158,654
19,5018,8865,6541,1444,109
74,83819,4641,4481,6341,116
13,2657,595
18,614367
30374696
17,147
28,75327,317
1,012424
5,292
1,584,3105,717
26,4765,804
22,469190,23347,686
25166,09252,3769,216
53,64216,8101,7452,667
47,6307,032
106,3513,928
890,0705,110
23,003
1,447,679
81,114
97,5764,763
37,28010,5243,529
7781,323
24,7574,8834,239
2911,8193,390
884,107'157,522
14,0554,161
691,654'811
3,656755
11,493
171,371
21,7029,4816,6381,0626,618
79,22718,2831,2141,2052,930
13,6709,341
20,2971,353
11387950
17,596
29,68427,926
1,298460
6,147
1,621,268'8,435'
32,824'4,188
24,164'193,272'47,820'
136'70,475'57,180'8,958'
57,473'16,4131,433'2,455
45,796'8,132
106,3013,839
905,8994,883
21,192
91,539
103,7945,356
41,78710,9743,591
7611,387
25,2985,0014,586
3201,7742,959
869,000'152,480
11,8765,705
683,884'814
3,530864
9,847
165,375'
23,65310,0565,9831,0885,564
70,62017,262'
9931,1651,134
17,30510,552
2,838417
6532940943
27,48725,799
1,223465
6,054'
1,607,640'4,624
21,7302,321
25,807'171,946'49,736
14963,66849,84411,50846,49823,912
1,3702,518
46,326'7,899
107,3123,782
947,9294,356
14,405
1,464,034'
94,104'
92,891'4,816'
31,086'11,0783,770
8311,355
25,4444,8424,540
3331,8052,991
816,595'141,424
13,1785,324
637,837'808
3,400592
14,032
138,417'
10,49713,8845,882
2,87969,40213,773'
8641,954
9010,9897,092
3,968397
8895964
1,704
22,61821,276
817525
5,411
1,511,1484,329
18,6532,485
22,106167,16640,699
37868,27440,27310,66044,54514,0681,3592,532
40,6567,139
121,3193,741
884,6467,1478,973
85,654
95,3164,806
33,83010,0213,712
8261,349
25,7275,3954,440
3421,7933,075
828,655174,971
9,7674,776
616,495836
3,493671
17,646
139,697
3,77011,0945,1461,0581,848
81,66713,797
8501,135
10911,2347,989
2,835358
519656
1,299
22,64321,136
921586
4,475
1. Reporting banks include all types of depository institutions as well as bank/financialholding companies and brokers and dealers. Effective February 2003, coverage is expanded toinclude claims of brokers and dealers on affiliated foreign offices and cross-border brokeragebalances.
2. For data prior to June 2006, also includes the Bank for International Settlements and theEuropean Central Bank.
3. As of May 2004, the European Union includes Austria, Belgium, Cyprus, the CzechRepublic, Denmark, Estonia, Finland, France, Germany, Greece, Hungary, Ireland, Italy,Latvia, Lithuania, Luxembourg, Malta, the Netherlands, Poland, Portugal, Slovakia, Slovenia,Spain, Sweden, and the United Kingdom. Data available beginning in June 2006. As of
January 2007, also includes Bulgaria and Romania.4. Before June 2006, data for the British Virgin Islands were included in "Other
Caribbean.''5. Comprises Bahrain, Iran, Iraq, Kuwait, Oman, Qatar, Saudi Arabia, and United Arab
Emirates (Trucial States).6. Comprises Algeria, Gabon, Libya, and Nigeria.7. Includes the International Bank for Reconstruction and Development, as well as
African, Asian, Caribbean, European, Latin American, and Middle Eastern regional organiza-tions. Beginning with data for June 2006, also includes the Bank for InternationalSettlements.

Bank-Reported Data 49
3.19 BANKS' OWN AND DOMESTIC CUSTOMERS' CLAIMS ON FOREIGNERS Reported by Banks in the United States1
Payable in U.S. dollars
Millions of dollars, end of period
Type of claim
1 Total claims reported by banks
2 Banks' own claims on foreigners3 Foreign official institutions2
5 Other foreigners4
6 Claims on banks' domestic customers5
7 Non-negotiable deposits8 Negotiable CDs9 Other short-term negotiable instruments6 . .
10 Other claims
MEMO11 Non-negotiable deposits7
12 Negotiable CDs7
13 Other short-term negotiable
14 Other claims7
16 Loans collateralized by repurchase
2005
2,344,155
1,864,83472,919
1 391 775400,140
479,321227,685
91,196140,863
19,577
748,3202,414
7,3241,106,7761 304 277
482,090
2006
2,944,476
2 291 34098,010
1 662 805530,525
653,136277,734168,304185,13421,964
923,9586,272
9,2361,351,8741 639 474
664,373
2007
3,547,969
2 791 032108,326
2 067 163615,543
756,937394,043'167,311173,42322,160'
978,1825,830
42,2521,764,7681 928 520
764,821
2008
Apr.
2 980 08692,643
2 234 603652,840
1,076,6572,190
42,5861,858,6532 070 008
814,026
May
2 987 770117,571
2 230 628639,571
1,106,9763,277
40,3211,837,1962 050 758
813,211
June
3,554,284'
2 855 58496,578
2 134 480624,526
698,700'339,572'172,688'171,143
15,297'
1,092,8472,610
39,7731,720,3541 980 944
742,200
July'
2 874 606104,736
2 144 305625,565
1,076,9202,692
45,0961,749,8981,948,816
795,782
Aug.'
2 887 355109,073
2 166 694611,588
1,072,9852,653
38,0851,773,6321,957,281
807,559
Sept.
3,423,529
2 781 644'76,817'
2 115 684'589,143'
641,885308,280171,364146,54515,696
991,5542,256
40,0751,747,759'1,952,210'
748,798
Oct.'
2 690 42358,037
2 087 529544,857
1,021,929616
42,4801,625,3981,866,243
672,962
1. For banks' claims, data are monthly; for claims of banks' domestic customers, data arefor the quarter ending with the month indicated.
Reporting banks include all types of depository institutions as well as banks/financialholding companies and brokers and dealers. Effective February 2003, coverage is expanded toinclude claims of brokers and dealers on affiliated foreign offices and cross-border balances.
2. Prior to February 2003, reflects claims on all foreign public borrowers.3. Includes positions with affiliated banking offices also included in memo line (15) above.4. As of February 2003, includes positions with affiliated non-banking offices also in-
cluded in memo line (15) above.5. Assets held by reporting banks in the accounts of their domestic customers. Effective
March 2003, includes balances in off-shore sweep accounts.
6. Primarily bankers acceptances and commercial paper. Prior to February 2003, alsoincludes negotiable certificates of deposit.
7. Data available beginning February 2003.8. For U.S. banks, includes amounts due from own foreign branches and foreign subsidiar-
ies consolidated in quarterly Consolidated Reports of Condition filed with bank regulatoryagencies. For agencies, branches, and minority-owned subsidiaries of foreign banks, consistsprincipally of amounts due from the head office or parent foreign bank, and from foreignbranches, agencies, or wholly owned subsidiaries of the head office or parent foreign bank.Effective February 2003, includes amounts due from affiliated foreign offices of U.S. brokersand dealers.
9. Data available beginning January 2001.

50 Federal Reserve Bulletin Statistical Supplement • December 2008
3.22 LIABILITIES TO UNAFFILIATED FOREIGNERS Reported by Nonbanking Business Enterprises in the United States
Millions of dollars, end of period
Type of liability, and area or countrySept. Sept.p
1 Total
By type2 Financial liabilities3 Short-term negotiable securities'
4 Other liabilities'Of which:
5 Borrowings'6 Repurchase agreements'
By currency7 U.S. dollars8 Foreign currency2
9 Canadian dollars10 Euros11 United Kingdom pounds sterling12 Japanese yen13 All other currencies
By area or country14 Europe15 Belgium-Luxembourg16 France17 Germany18 Netherlands19 Switzerland20 United Kingdom
MEMO:
21 Euro area3
22 Canada
23 Latin America and Caribbean24 Bahamas25 Bermuda26 Brazil27 British West Indies4
28 Cayman Islands29 Mexico30 Venezuela31 Asia32 Japan33 Middle Eastern oil-exporting countries1
34 Africa35 Oil-exporting countries'"
36 All other7
92,009
62,84711,759
n.a.n.a.
29,57533,2722,3999,067
18,3371,5641,905
38,690775
1,3492,911
363514
29,473
8,715208
n.a.7,178
2618
4,7241,648
36
13194
76,710
39,2499,050
24,00315,2462,3544,0523,1692,0183,653
22,697342761
2,533406124
12,712
5,955
2,530
7,6030
99170
n.a.6,446
251
5,3231,383
173
99797
89,217
48,71211,617
10,12018,573
35,03313,6792,8064,6294,0241,393
827
30,184936995
11,1741,183
34614,308
14,659
3,986
12,43500
n.a.12,265
300
1,9241,346
100
310
106,508
52,6496,783
12,21924,908
31,58921,060
1,32811,4144,0442,3971,877
34,443863621
6,264204313
24,956
8,567
2,361
12,64500
15
12,3883514
3,1061,3921,088
270
112,853
55,0514,663
13,53615,048
29,10325,948
83413,0064,0073,3194,782
35,076460
1,4666,164
242289
23,664
9,496
3,232
14,1967
13,9942716
2,4451,676
56
260
103,835'
47,9194,923
14,1307,625
26,47421,445
1,1938,4963,9483,5364,272
28,175467
1,4532,940
256287
20,230
6,369
2,104
15,01700
29n.a.
14,8022818
2,4701,563
53
310
111,287'
46,1757,751
15,0155,027
23,99522,180
8999,9683,9673,8493,497
26,207225
1,5221,843
28590
21,680
1,964
15,1060
5826
n.a.14,833
3616
2,6881,864
123
880
107,533'
39,2856,374
14,0864,614
21,64617,639
8798,8934,3192 3351,213
22,846985485
1,553284
9118,638
3,892
1,391
13,0811
9364
n.a.12,635
7013
1,694810
50
960
103,044
36,0586,163
15,2693,906
23,02113,037
8705,3813,1902,694
902
17,909701590
1,739238112
13,964
3,588
1,311
14,0960
6537
n.a.13,743
7713
2,5781,640
88
1034

Nonbank-Reported Data 51
3.22 LIABILITIES TO UNAFFILIATED FOREIGNERS Reported by Nonbanking Business Enterprises in the United States—Continued
Millions of dollars, end of period
Type of liability, and area or country
38 Trade payables39 Advance payments and other liabilities
By currency40 Payable in U.S. dollars
42 Canadian dollars
44 United Kingdom pounds sterling
46 All other currencies
By area or countryCommercial liabilities
47 Europe
49 France50 Germany
52 Switzerland
MEMO54 Euro area3
55 Canada
56 Latin America and Caribbean
58 Bermuda59 Brazil60 British West Indies4
61 Cayman Islands62 Mexico
64 Asia
66 Middle Eastern oil-exporting countries5
67 Africa
69 All other7
2004
29,16218,18110,981
25,8113,351
2241,058
704296
1,069
9,030123
1,0191,024
305564
3 407
3,730
2,145
4,27632
515113
n.a.101
1,942433
12,2394,2212,910
947424
525
2005
37,46123,05014,411
34,7252,736
171989471308797
10,574109
1,8701,113
4891,1132 882
5,405
2,375
5,74870
713218
n.a.76
2,209680
17,4275,9713,986
916493
421
2006
40,50525,67314,832
37,2983,207
730610470377
1,020
10,962222
1,5671,217
526724
3 046
5,226
3,708
5,75770
777241
n.a.539
2,120353
18,7555,8643,855
849283
474
June
53,85928,23725,622
50,4403,419
707617541381
1,173
14,876209
1,5592,201
7551,3704 313
6,850
4,737
7,817163
1,008360
n.a.647
2,512663
24,0495,6885,803
1,267637
1,113
2007
Sept.
57,80229,32228,480
54,9692,833
666482300354
1,031
15,069220
1,6672,161
9291,2913 928
7,279
4,271
8,546122
1,160425
n.a.728
2,936586
26,8325,4767,324
1,453763
1,631
Dec.
55,916'27,86628,050'
52,687'3,229
969579319372990
15,330'260
1,7122,037
9381,418'3 328
7,677
5,663
8,35889
707911
n.a.1,1672,820
557
23,4105,3257,105
1,458655
1,697
Mar.
65,112'32,27232,840'
61,122'3,9901,756
528294400
1,012
15,641'280
1,7741,284
7511,937'3 730
7,162
5,365
9,671180
1,2641,142n.a.
9973,076
870
30,462'6,1669,945
2,1411 069
1,832
2008
June
68,248'37,77230,476'
65,066'3,182
911731270262
1,008
17,781'377
1,6881,3591,1332,743'4 425
7,114'
5,846
10,767'162
1,0101,049n.a.
8594,130'1 174
30,1875,564
12,254
1,9201 108
1,747
Sept.p
66,98633,41633,570
64,3202,6661,025
370158254859
17,845537
2,0471,317
7302,8713 696
8,344
5,930
8,508108663
1,070n.a.
7472,5541 325
31,3725,8889,982
1,587739
1,744
1. Data available beginning March 2003. For data on borrowings and repurchase agree-ments, data available on a consistently defined basis beginning in June 2006.
2. Foreign currency detail available beginning March 2003.3. Comprises Austria, Belgium, Finland, France, Germany, Ireland, Italy, Luxembourg,
Netherlands, Portugal, and Spain. As of December 2001, also includes Greece. AlthoughSlovenia joined the euro area January 2007, separate data for Slovenia are not available.
4. Beginning March 2003, data for the Cayman Islands replaced data for the British WestIndies.
5. Comprises Bahrain, Iran, Kuwait, Oman, Qatar, Saudi Arabia, and United Arab Emir-ates (Trucial States).
6. Comprises Algeria, Gabon, Libya, and Nigeria.7. Includes international and regional organizations.
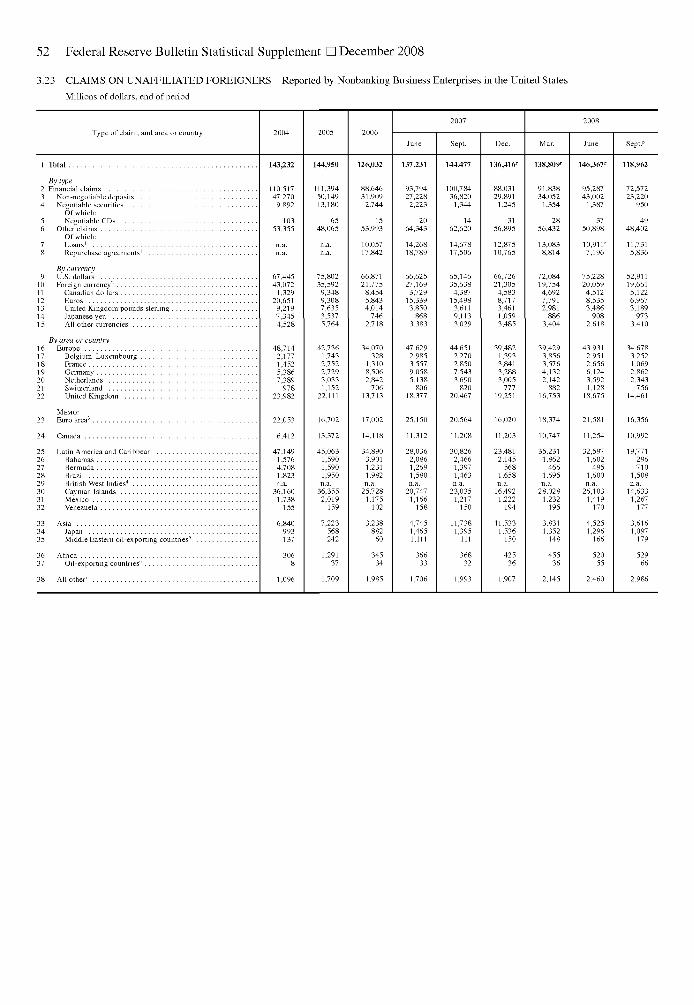
52 Federal Reserve Bulletin Statistical Supplement • December 2008
3.23 CLAIMS ON UNAFFILIATED FOREIGNERS Reported by Nonbanking Business Enterprises in the United States
Millions of dollars, end of period
Type of claim, and area or countrySept. Sept.p
1 Total
By type2 Financial claims3 Non-negotiable deposits .4 Negotiable securities
Of which:5 Negotiable CDs'6 Other claims
Of which:7 Loans'8 Repurchase agreements'
By currency9 U.S. dollars
10 Foreign currency2
11 Canadian dollars12 Euros13 United Kingdom pounds sterling14 Japanese yen15 All other currencies
By area or country16 Europe17 Belgium-Luxembourg .18 France19 Germany20 Netherlands21 Switzerland22 United Kingdom
MEMO:23 Euro area3
24 Canada
2526272829303132
333435
3637
Latin America and CaribbeanBahamasBermudaBrazilBritish West Indies4
Cayman IslandsMexicoVenezuela
AsiaJapanMiddle Eastern oil-exporting countries5
AfricaOil-exporting countries'" . .
143,232
110,51747,270
9,892
10353,355
n.a.n.a.
67,44543,072
1,32920,6519,2197,3454,528
38 All other7
48,7142,1771,4525,3867,389
97823,982
6,412
47,1491,5764,7081,823n.a.
36,1601,738
155
6,840993137
3068
1,096
144,950
111,39450,14913,180
6548,065
75,80235,5929,3489,3087,6353,5375,764
42,7361,7432,7522,7293,0331,152
22,111
16,702
13,372
45,0631,5901,5901,950n.a.
36,3552,019
159
7,223568242
1,29137
126,032
88,64631,909
2,744
1553,993
10,05717,842
66,87121,775
8,4545,8434,014
7462,718
34,070328
1,3108,5062,842
70613,713
14,118
34,8903,9011,2311,982n.a.
25,7281,175
102
3,238882
60
34534
137,231
93,79427,2282,223
2064,343
14,26818,789
66,62527,1693,729
15 3393,850
8683,383
47,6292,9853,5579,0585,138
80618,377
25,150
11,312
28,0362,0861,2691,580n.a.
20,7471,166
158
4,7451,4651,111
36633
144,477
100,78436,820
1,344
1462,620
14,67817,506
65,14635,6384,387
15,4983,6119,1133,029
44,6512,2702,8507,5433,690
82020,467
20,564
11,208
30,8262,4661,3971,463n.a.
23,0351,217
150
11,7381,395
111
36832
136,416'
88,03129,8911,245
3156,895
12,87510,765
66,72621,3054,5838,7173,4611,0593,485
39,4821,3933,8413,2883,005
77719,251
11,203
23,4812,145
5681,658n.a.
16,4921,222
194
11,5331,536
150
42536
138,809'
91,83834,052
1,354
2856,432
13,0838,814
72,08419,7544,6927,7912,981
8863,404
39,4293,8563,5764,1322,142
88216,753
18,374
10,747
35,2311,862
4661,695n.a.
28,0281,232
195
3,8311,352
148
45536
146,367'
95,28743,002
1,387
3750,898
10,911'7,196
75,22820,0594,5128,5353,486
9082,618
43,9312,9512,6566,1243,5921,128
18,675
21,581
11,254
32,5971,602
4951,600n.a.
26,1031,419
170
4,5251,296
166
52055
118,962
72,57223,220
950
4948,402
11,7315,836
52,91119,6615,1226,9673,189
9733,410
34,6783,2521,0692,8622,343
75614,461
16,356
10,992
19,771296710
1,508n.a.
14,6331,267
177
3,6161,097
179
52966

Nonbank-Reported Data 53
3.23 CLAIMS ON UNAFFILIATED FOREIGNERS Reported by Nonbanking Business Enterprises in the United States—Continued
Millions of dollars, end of period
Type of claim, and area or countrySept. Sept.p
39 Commercial claims40 Trade receivables41 Advance payments and other claims
By currency42 Payable in U.S. dollars43 Payable in foreign currencies2
44 Canadian dollars45 Euros46 United Kingdom pounds sterling47 Japanese yen48 All other currencies
By area or countryCommercial claims
49 Europe50 Belgium-Luxembourg51 France52 Germany53 Netherlands54 Switzerland55 United Kingdom
MEMO
56 Euro area3
57 Canada
58 Latin America and Caribbean59 Bahamas60 Bermuda61 Brazil62 British West Indies4
63 Cayman Islands64 Mexico65 Venezuela66 Asia67 Japan68 Middle Eastern oil-exporting countries5 .
69 Africa70 Oil-exporting countries'"
71 All other7
32.71529,2293,486
27,4395,276
5121,5611,586
2381,379
13,457257
2,2611,401
4941,5283,742
2,017
6,47755
650935
n.a.160
2,018319
8,9431,8551,071
629154
1,192
33,55629,2314,325
29,8983,658
4811,335
706187949
12,084470
2,3111,509
354724
2,677
7,663
2,750
6,75741
6481,022
612,089
380
10,0732,1281,558
830258
37,38632,8024,584
33,1604,226
7401,108
661281
1,436
14,105443
2,1101,642
728718
3,789
3,402
7,14648
503945
n.a.323
2,067379
11,0112,4671,754
43,43736,0017,436
39,6443,793
6581,233
707257938
16,762488
1,9561,780
6651,0875,118
4,109
8,08933
1,267922
n.a.585
1,952451
12,5073,1561,686
982321
43,69336,5207,173
40,1363,557
6371,124
663285848
16,501368
1,9721,713
745948
5,734
8,436
3,595
8,74727
1,528946
4522,196
474
13,0272,9482,114
1,007261
48,38541,792
6,593
43,3445,041
7882,116
749319
1,069
16,667333
2,2201,638
9841,3664,520
5,215
8,84955
1,1361,024n.a.
4952,283
475
15,6873,9822,402
964314
46,97139,5367,435
42,9054,0661,0591,171
631253952
16,800256
1,9701,701
6301,1385,139
4,555
9,17247
1,310971
n.a.335
2,307500
14,3153,8951,922
1,297316
51,08043,7757,305
47,9453,135
3991,311
550156719
18,819309
2,6252,6361,082
9725,501
10,619
4,803
10,88248
1,2981,223
6392,935
501
14,4864,0131,915
1,330341
46,39040,290
6,100
44,5951,795
258540310115572
15,388251
2,2132,333
396836
4,804
8,229
4,384
9,61857
1,1411,124
4602,708
414
14,9694,1342,614
1,216313
1. Data available beginning March 2003. For data on loans and repurchase agreements,data available on a consistently defined basis beginning in June 2006.
2. Foreign currency detail available beginning March 2003.3. Comprises Austria, Belgium, Finland, France, Germany, Ireland, Italy, Luxembourg,
Netherlands, Portugal, and Spain. As of December 2001, also includes Greece. AlthoughSlovenia joined the euro area January 2007, separate data for Slovenia are not available.
4. Beginning March 2003, data for the Cayman Islands replaced data for the British WestIndies.
5. Comprises Bahrain, Iran, Kuwait, Oman, Qatar, Saudi Arabia, and United Arab Emir-ates (Trucial States).
6. Comprises Algeria, Gabon, Libya, and Nigeria.7. Includes international and regional organizations.

54 Federal Reserve Bulletin Statistical Supplement • December 2008
3.24 FOREIGN TRANSACTIONS IN SECURITIES
Millions of dollars
Transaction, and area or countryJan.-Oct. Apr. May July Aug. Sept.
U.S. corporate securities
STOCKS
1 Foreign purchases
2 Foreign sales
3 Net purchases, or sales (-)
4 Foreign countries5 Of which: by foreign official institutions6 Europe7 Belgium8 France9 Germany
10 Ireland11 Luxembourg12 Netherlands13 Switzerland14 United Kingdom15 Channel Islands and Isle of Man16 Canada17 Latin America18 Caribbean19 Middle East Oil Exporters'20 Other Asia21 China, Mainland22 Hong Kong23 Japan24 Africa25 Other countries
26 International and regional organizations2 . .
U.S. GOVERNMENT AGENCY BONDS
27 Foreign purchases
28 Foreign sales
29 Net purchases, or sales (-)
30 Foreign countries31 Of which: by foreign official institutions . . .32 Europe33 Belgium34 France35 Germany36 Ireland37 Luxembourg38 Netherlands39 Switzerland40 United Kingdom41 Channel Islands and Isle of Man42 Canada43 Latin America44 Caribbean45 Middle East Oil Exporters'46 Other Asia47 China, Mainland48 Hong Kong49 Japan50 Africa51 Other countries
52 International and regional organizations2 . .
CORPORATE BONDS3
6,718,156
150,3715,766
97,0661,625
21,735-8,040-1,78811,608
-5,3631,180
75,764102
11,8182,166
35,0687,974
-4,490471
-463-669
89680
44
1,572,1601,285,696
286,464
286,22892,632
86,320-274-2614,4714,1335,028-655-186
51,0721,5289,507
13,97139,7417,037
128,75037,40131,65944,761
-1981,100
236
53 Foreign purchases
54 Foreign sales
55 Net purchases, or sales (-)
56 Foreign countries57 Of which: by foreign official institutions .58 Europe59 Belgium60 France61 Germany62 Ireland63 Luxembourg64 Netherlands65 Switzerland66 United Kingdom67 Channel Islands and Isle of Man68 Canada69 Latin America70 Caribbean71 Middle East Oil Exporters'72 Other Asia73 China, Mainland74 Hong Kong75 Japan76 Africa77 Other countries
78 International and regional organizations3
1,678,4641,167,658
509,78328,556
316,130-2,09722,144
-11,83113,9373,3653,1979,739
253,76210,3888,052
10,02991,3094,666
72,28231,15814,81012,646-1887,503
1,023
10,443,794
195,522
195,56215,107
89,259-1,16819,521
60028
-7,1436,887
-2,97769,473
8778,086
78048,59012,24031,734
3,99335,434-4,973
-3005,173
-40
2,050,4511,824,365
226,086
225,707119,057
82,025-1,808
4,293290
1,115-8,520
-585-1,90660,3064,8233,2326,376
-7,9298,353
132,58673,73330,72214,061
381,026
379
1,913,3071,519,952
393,355
392,10850,566
207,482-7,413
4,2615,4198,658
-14,650-6523,581
208,956-6,71712,2745,097
41,6943,803
116,18741,67512,78039,565
-1695,740
1,247
10.776.03C
30,87219,094
-2,232-1,077-7,974
-19,184358
-6,971-8623,377
16,769397
6,6223,764
-24,3827,139
43,932-961
26,71213,308
-4,597626
29
2,335,3782,293,883
41,495
42,079-7,030
66,787-1,275
3,673-3,080
-558-22,120
-974-790
95,574-1,497
6,1926,961
-69,474-13,834
46,14222,90623,36813,782
-1,350655
-584
1,246,0781,177,408
68,81132,348
-17,004-9,679-3,527
5,350-11,095-7,707-1,099
607607
-12,3355,5971,916
15,8604,521
58,31627,910
5,12222,988
-190-205
-141
958,436970,005
-11,569436
-11354
-7,604-5,545
437-2363,572
3366,538
-351,370
105-14,716
952,887-1861,9651,131
-1,717520
0
259,359244,088
15,271
15,25611,012
10,954-52135294
-379-3,584
-365-154
14,168-12
1,2103,660
-19,896-2,10020,79111,8915,3322,605
149488
15
164,754139,751
24,8877,513
6,762- 8
-367246880
1,219- 3 8306
5,435-734
58026
7,306551
9,7756,947
7471,107
19-132
116
997,461981,481
15,980
15,97636
4,045308
2,437-8,451
744- 6 0
-403804
3,94646
1,571394
2,601489
6,167130
7,670- 3 3- 3 2741
255,882227,727
28,155
28,27511,036
11,893-130-677
343-605
-4,615110
-15818,424
- 7 02,5851,468
-9,626-1,34423,51914,8594,3534,474
- 4 4-176
-120
189,665129,823
59,842
59,7659,088
16,149-926
210289444
-1,366681678
21,155-4,757
1,511262
23,141654
17,0789,2381,6424,640
- 2 0990
77
1,066,1251,067,942
-1,817
-1,820527
560-401
-1,711-2,182
-362-69
-5231,1483,073
2241,088
437-9,763
-403,979-2132,721
8171,471
448
3
227,298195,834
31,464
31,4159,142
4,190- 5 8
1,995-1,273
53-3,945
88407
6,713-20208
-28911,884-480
15,9999,6414,567
770-181
84
49
124,990120,305
4,685
4,7374,102
-2,745-1,430
- 86,549
-1,041-1,702
- 9-264
-3,132-1,748
1,130-470
-2,6761,2588,2283,817
6403,648
1,273,5581,279,336
-5,7831,069
5,328-62
3,806-128
182-927-859-3132,590-185
-1,698970
-4,844187
-4,995-736-127
920-814
83
173,505213,612
-40,107
-40,049-16,160
-8,58052
-1,817726
-754-3,427
-125-118
-1,517-67156
-2,800-12,044
-3,371-12,410
-3,3671,187
-5,518-412-588
-58
97,810101,948
-4,128172
-4,567-130-353-120
-2,532-648-106
-6249
- 8 416
-3,203786
4,3781,567
6563,573
- 4 8-1,469
-10
905,531906,513
-987-1,415
5,19768
-1,1611,533
210-317
-1,403-1,388
5,241652
1,836689
-5,212-396
-1,818-37592132
-920-363
155,794179,983'
-24,189'
-24,391'-13,146
-4,827'41
204-1,221'
-909 '-3,444'
210'- 5 8 '
2,707'17'
-1,654'25
-2,131'-3,037'
-11,901'-7,154'
138'-2,913'
-555 '-311 '
202
80,58793,717
-13,077-510
-11,574-1,361-1,003
-778-1,774-2,863
-349343
-2,634-520
236254
-3,721628
1,177-778
1991,711-116
39
-53
1,168,9131,157,394
11,52148
-2,949-489
-6,787-703-561
-1,365-856-6739,715
745697656
13,656-155-242
491,803
720-85-57
- 2
190,743184,572
6,171
6,504-8,677
227-76
-2,102-1,159
-859-1,280
239176
4,695- 7
-5753,244
15,664-1,490
-10,628-7,730
-195-1,281
60
93,860'102,298'
-8,367'-1,150
-4,382'-495-188-832
-2,268-1,621
-385-4552,903'-654
7727
-43392
-3,645-2,599
-347-529
-90- 1 3
-71
1,018,2291,024,350
-6,121
-6,120-135
-15,788-46
-2,681-2,113
-244-975
-1,586179
-6,673-728
- 7 3-1,181
4,760- 6 8
7,37513
2,2554,617
80-1,225
- 1
201,719251,935
-50,216
-50,169-16,747
-11,537-70
-1,420396
-775-361
39-364
-5,756-134-126
614-22,466
-552-15,902-4,863
-155-2,136
100-300
-47
90,843103,947
-13,104
-13,096739
-7,755-1,714
-583-506
-2,680-901
27- 1 8-56
-639750
-165-4,525
-104-1,376
1,491-185-390
98-19

3.24 FOREIGN TRANSACTIONS IN SECURITIES—ContinuedMillions of dollars
Securities Holdings and Transactions 55
Transaction, and area or country
79 Stocks, net purchases or sales (-)4
80 Foreign purchases
82 Bonds, net purchases or sales (-)4
83 Foreign purchases
85 Net purchases, or sales (-) of stocks and bonds4
86 Foreign countries87 Europe
89 United Kingdom
91 Latin America
93 Asia
95 Africa
97 Nonmonetary international andregional organizations2
2006 2007
2008
Jan.-Oct.
2008
Apr. May June July Aug. Sept. Oct.'
Foreign securities
-106,4553,636,1853 742 640
-144,452
1,879,7132 024 165
-250,907
-256,016-220,413-54,927
-157,698-18,153-12,714
25,656-18,652
2,159-2,252-9,488
5,109
-95,2985,215,7655 311 063
-129,015
2,971,8033,100,818
-224,313
-240,242-218,683-62,543
-154,906-10,935
-7,948-18,442
27,0664,0321,112
-12,412
15,929
-1,2254,884,9404 886 165
72,126
2,037,2571,965,131
70,901
61,45738,95722,522-7,202-5,10817,608
-38,10767,55011,8301,264
-20,707
9,444
-245505.496505,741
10,728
193,225182,497
10,483
8,529-5,690-3,927-6,145-2,397
2,8994,420
10,532-1,188
-217-1,018
1,954
-18,106494,660512,766
-8,303
182,056190,359
-26,409
-26,401-18,064-1,544
-19,134-6,351-5,117-2,136
7,7265,233-591
-1,868
-8
1,562499,993498,431
-11,517
188,259199,776
-9,955
-9,858812
-1,739-856
-2,2163,603
-7,2963,663
-1,658- 2 2
-8,402
-97
16,894560,901544,007
17,278
158,503141,225
34,172
34,15812,10317,610
-2,4701,444
4772,253
16,7548,144
296831
14
2,851428,218425,367
17,366'
157,238139,872'
20,217'
17,750'23,181'8,768'
11,140'1,734
-1,133-13,624
5,977'591601
1,014
2,467
-2,445482,941485,386
37,810
227,068189,258
35,365
34,41533,67314,3258,6552,3171,019
-8,6252,861
-1,116185
2,985
950
21,795458,842437,047
14,513
177,088162,575
36,308
35,93024,674
-21019,993
-1,6773,832
4076,114
-1,185697
1,883
378
1. Comprises oil-exporting countries as follows: Bahrain, Iran, Iraq, Kuwait, Oman, Qatar,Saudi Arabia, and United Arab Emirates (Trucial States).
2. Includes the International Bank for Reconstruction and Development, as well asAfrican, Asian, Caribbean, European, Latin American, and Middle Eastern regional organiza-tions. Beginning with data for June 2006, also includes the Bank for International Settle-ments.
3. Includes state and local securities. Also includes issues of new debt securities soldabroad by U.S. corporations organized to finance direct investment abroad.
4. Net foreign sales (-) of foreign securities are equivalent to net U.S. purchases of foreignsecurities.
5. Comprises Austria, Belgium, Finland, France, Germany, Ireland, Italy, Luxembourg,Netherlands, Portugal, and Spain. As of December 2001, also includes Greece.
3.25 MARKETABLE U.S. TREASURY BONDS AND NOTES Foreign Transactions1
Millions of dollars; net purchases, or sales (—), during period
Area or countryJan.-Oct. Apr. July Aug.' Sept.
1 Total reported
2 Foreign countries3 Of which: by foreign official institutions . . .
4 Europe5 Belgium6 France7 Germany8 Ireland9 Luxembourg
10 Netherlands11 Norway12 Sweden13 Switzerland14 United Kingdom15 Channel Islands and Isle of Man16 Other Europe and former U.S.S.R17 Canada
18 Latin America19 Brazil20 Mexico21 Venezuela22 All other Latin America
23 Caribbean
24 Asia25 China, Mainland26 Hong Kong27 Japan28 Korea29 Middle East Oil Exporters2
30 All other Asia
31 Africa
32 African oil exporters3
33 Other countries
34 International and regional organizations4 . .
195,536
194.71469,639
98,982357
-1,6002,116
-1,325-1,293
6845,063
702-2,89891,782
-2965,690
14,161
21,83823,100
-322242
-1,182
-9,838
68,69440,63316,257
1,3126,1684,548-224
3,5152,400
-2,638
822
201,9882,994
178,485-3,100-7,827-3,358
1,734- 2 8
1,471-27,339
2,176-2,560
208,792-9749,498
-1,936
86,16077,066
1,735-1967,555
2,380
-67,850-7,968
2,056-47,384-17,874
1,8051,515
6,1274,568
-1,378
-1,048
340,21598,973
192,376-1,592
-11,920640
-12,944-775
-4,29325,945-2,276
-470190,455
1,0288,577
-1,658
5,3032,605
-3,704-3916,793
27,512
111,16090,49111,63115,462
-6,37717,738
-17,785
8,2819,527
-2,759
-299
76,958
76,94422,298
51,683- 5 6
-2,8202,539-327
435677770- 2 6986
46,640-1232,9884,514
-602597
-2,07524
852
5,485
15,01112,8492,705
-3,791-3901,4682,170
591448
262
14
5,673
5,726-3,724
17,160-289
-6,3151,675
-5,216-225
4111,754
72-725
24,047- 3 3
2,0034,727
3,683819
1,401119
1,344
-13,296
-10,66211,692
-92-13,432-1,735
817-7,912
4,6625,297
-548
- 5 3
27,9921,105
3,966-1201,038
-3,945-1,784
-139-607
-3,636-8122,4039,790-1661,945
-2,571
4,5661,1662,541- 1 6875
20,878
467-302-9154,520
-1,9011,697
-2,632
988
1,745
- 3 0 2
334
34,65810,068
7,487-1461,377- 7 4
-1,677374
-210-1,476
- 5 4-7149,230
198660
69
-5,921-2,751-4,350
-1871,367
3,910
27,44613,665-485
11,962-1,111
8032,612
1,736865
-69
-368
32,837
33,0404,848
16,842-1924,326
251297
-752-1,066
-577374
-1,01815,558
136-494
787
-5,719-2,772-2,098
15-864
12,273
9,12918,262
446-10,263
2,4931,353
-3,162
4391,271
- 7 1 1
- 2 0 3
20,737
20,4614,944
29,080-116
-1,602-581-301-268
-1,98310,992
-1,095232
29,57672
-5,846-7,447
-3,280-4,705
- 9 327
1,491
10,470
-5,7714,171
968-7,889-1,684
6,765-8,102
-3,097-1,951
506
276
34,665
35,185-1,084
11,758- 6 5
1,305237
-1,685168
-686-1,689
81216,380
172-2,970-4,161
-9,847-8,093-2,028
- 6 8342
11,601
26,4349,9812,294
12,940-4,114
4,0681,265
5661,842
-1,166
-520
1. Official and private transactions in marketable U.S. Treasury securities having anoriginal maturity of more than one year. Data are based on monthly transactions reports.Excludes nonmarketable U.S. Treasury bonds and notes held by official institutions of foreigncountries.
2. Comprises Bahrain, Iran, Iraq, Kuwait, Oman, Qatar, Saudi Arabia, and United ArabEmirates (Trucial States).
3. Comprises Algeria, Gabon, Libya, and Nigeria.4. Includes the International Bank for Reconstruction and Development, as well as
African, Asian, Caribbean, European, Latin American, and Middle Eastern regional organiza-tions. Beginning with data for June 2006, also includes the Bank for International Settle-ments.

56 Federal Reserve Bulletin Statistical Supplement • December 2008
3.28 FOREIGN EXCHANGE RATES AND INDEXES OF THE FOREIGN EXCHANGE VALUE OF THE U.S. DOLLAR1
Currency units per U.S. dollar except as noted
2008
May July Aug. Sept.
Exchange rates
COUNTRY/CURRENCY UNIT
1 Australia/dollar2
2 Brazil/real3 Canada/dollar4 China, P.R./yuan5 Denmark/krone6 European Monetary Union/euro3 . .7 Hong Kong/dollar8 India/rupee9 Japan/yen
10 Malaysia/ringgit11 Mexico/peso12 New Zealand/dollar2
13 Norway/krone14 Singapore/dollar15 South Africa/rand16 South Korea/won17 Sri Lanka/rupee18 Sweden/krona19 Switzerland/franc20 Taiwan/dollar21 Thailand/baht22 United Kingdom/pound2
23 Venezuela/bolivar
NOMINAL
24 Broad (January 1997=100)s
25 Major currencies (March 1973=100)''26 Other important trading partners (January
1997=100)7
REAL
27 Broad (March 1973=100)s
28 Major currencies (March 1973=100)s
29 Other important trading partners (March1973=100)7
0.76272.43521.21158.19365.99531.24497.7775
44.00110.11
3.786910.8940.70496.44121.66396.3606
1,023.75100.383
7.47101.2459
32.13140.252
1.82042.11
110.7183.71
97.9890.63
0.75352.17381.13407.97235.94221.25637.7681
45.19116.31
3.666110.9060.64926.40951.58826.7668
954.32103.940
7.37181.2532
32.50737.8761.84342.14
0.83911.94611.07347.60585.44131.37117.8016
41.18117.76
3.435410.9280.73655.85571.50657.0477
928.97110.620
6.75501.1999
32.85532.2032.00202.14
0.94921.65850.99936.97254.79631.55547.7988
42.00104.36
3.212710.4380.77775.05711.36597.6076
1,034.13107.771
5.98871.0448
30.58932.026
1.96502.14
0.95111.61791.01666.89934.79261.55627.8073
42.76106.92
3.256810.3270.76165.13511.36797.9367
1,031.49107.763
6.02491.0371
30.37133.175
1.96642.14
0.96201.59001.01306.83554.73351.57597.8001
42.70106.85
3.247610.2090.75465.10581.35917.6114
1,015.05107.609
6.00151.0283
30.41433.471
1.98882.14
0.88151.61271.05356.84624.98941.49557.8076
42.91109.36
3.330010.1150.70915.33311.40527.6651
1,046.11107.718
6.28451.0841
31.22133.8201.88652.14
0.81681.80311.05826.83075.20201.43427.7854
45.53106.57
3.440510.6630.67395.69581.42978.0753
1,134.87107.823
6.68161.1102
31.99234.2381.79732.14
108.5282.46
96.8790.55
103.4077.84
92.28'86.40'
95.8370.75
85.94'79.99'
96.0971.42
86.55'81.06'
95.4070.91
85.98'80.66'
97.9374.09
87.88'83.87'
100.3075.51
89.73'85.26'
0.68702.18101.18476.83585.62531.32667.7588
48.6299.973.5222
12.6590.60776.49731.47849.7800
1,329.19108.166
7.44351.1429
32.70334.4211.68622.14
106.9580.42
94.5790.07
1. Averages of certified noon buying rates in New York for cable transfers. Data in thistable also appear in the Board's G.5 (405) monthly statistical release, available atwww.federalreserve.gov/releases.
2. U.S. dollars per currency unit.3. The euro is reported in place of the individual euro area currencies. By convention, the
rate is reported in U.S. dollars per euro.4. Starting with the January 2004 Statistical Supplement to the Federal Reserve Bulletin,
revised index values resulting from the periodic revision of data that underlie the calculatedtrade weights are reported. For more information on the indexes of the foreign exchange valueof the dollar, see Federal Reserve Bulletin, vol. 91 (Winter 2005), pp. 1-8.
5. Weighted average of the foreign exchange value of the U.S. dollar against the currenciesof a broad group of U.S. trading partners. The weight for each currency is computed as anaverage of U.S. bilateral import shares from and export shares to the issuing country and of a
measure of the importance to U.S. exporters of that country's trade in third country markets.The source for exchange rates not listed in the table above but used in the calculation of thisindex is Bloomberg LLP.
6. Weighted average of the foreign exchange value of the U.S. dollar against a subset ofbroad index currencies that circulate widely outside the country of issue. The weight for eachcurrency is its broad index weight scaled so that the weights of the subset of currencies in theindex sum to one.
7. Weighted average of the foreign exchange value of the U.S. dollar against a subset ofbroad index currencies that do not circulate widely outside the country of issue. The weightfor each currency is its broad index weight scaled so that the weights of the subset ofcurrencies in the index sum to one. The source for exchange rates not listed in the table abovebut used in the calculation of this index is Bloomberg LLP.
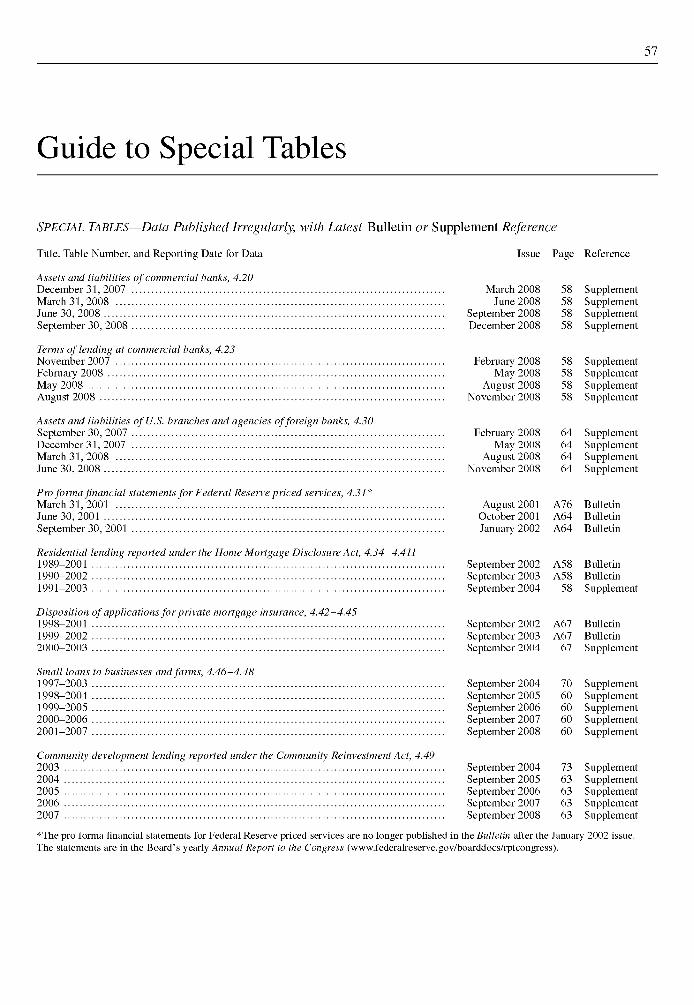
Guide to Special Tables
57
SPECIAL TABLES—Data Published Irregularly, with Latest Bulletin or Supplement Reference
Title, Table Number, and Reporting Date for Data Issue Page Reference
Assets and liabilities of commercial banks, 4.20December 31,2007 March 2008 58 SupplementMarch 31,2008 June 2008 58 SupplementJune 30, 2008 September 2008 58 SupplementSeptember 30, 2008 December 2008 58 Supplement
Terms of lending at commercial banks, 4.23November 2007 February 2008 58 SupplementFebruary 2008 May 2008 58 SupplementMay 2008 August 2008 58 SupplementAugust 2008 November 2008 58 Supplement
Assets and liabilities of U.S. branches and agencies of foreign banks, 4.30September 30,2007 February 2008 64 SupplementDecember 31,2007 May 2008 64 SupplementMarch 31,2008 August 2008 64 SupplementJune 30, 2008 November 2008 64 Supplement
Pro forma financial statements for Federal Reserve priced services, 4.31*March 31,2001 August 2001 A76 BulletinJune 30, 2001 October 2001 A64 BulletinSeptember 30, 2001 January 2002 A64 Bulletin
Residential lending reported under the Home Mortgage Disclosure Act, 4.34-4.4111989-2001 September 2002 A58 Bulletin1990-2002 September 2003 A58 Bulletin1991-2003 September 2004 58 Supplement
Disposition of applications for private mortgage insurance, 4.42-4.451998-2001 September 2002 A67 Bulletin1999-2002 September 2003 A67 Bulletin2000-2003 September 2004 67 Supplement
Small loans to businesses and farms, 4.46-4.481997-2003 September 2004 70 Supplement1998-2004 September 2005 60 Supplement1999-2005 September 2006 60 Supplement2000-2006 September 2007 60 Supplement2001-2007 September 2008 60 Supplement
Community development lending reported under the Community Reinvestment Act, 4.492003 September 2004 73 Supplement2004 September 2005 63 Supplement2005 September 2006 63 Supplement2006 September 2007 63 Supplement2007 September 2008 63 Supplement
*The pro forma financial statements for Federal Reserve priced services are no longer published in the Bulletin after the January 2002 issue.The statements are in the Board's yearly Annual Report to the Congress (www.federalreserve.gov/boarddocs/rptcongress).

58 Federal Reserve Bulletin Statistical Supplement • December 2008
4.20 DOMESTIC AND FOREIGN OFFICES Insured Commercial Bank Assets and Liabilities
Consolidated Report of Condition, September 30, 2008
Millions of dollars except as noted
Domestictotal
Banks with foreign offices'Banks withdomestic
offices only2
1 Total assets
2 Cash and balances due from depository institutions3 Cash items in process of collection, unposted debits, and currency and coin4 Cash items in process of collection and unposted debits5 Currency and coin6 Balances due from depository institutions in the United States7 Balances due from banks in foreign countries and foreign central banks8 Balances due from Federal Reserve Banks
9 Total securities, held-to-maturity (amortized cost) and avail able-for-sale (fair value)10 U.S. Treasury securities11 U.S. government agency and corporation obligations (excludes mortgage-backed
securities)12 Issued by U.S. government agencies13 Issued by U.S. government-sponsored agencies14 Securities issued by states and political subdivisions in the United States15 Mortgage-backed securities (MBS)16 Pass-through securities17 Guaranteed by GNMA18 Issued by FNMA and FHLMC19 Other pass-through securities20 Other mortgage-backed securities (includes CMOs, REMICs, and stripped MBS)21 Issued or guaranteed by FNMA, FHLMC or GNMA22 Collateralized by MBS issued or guaranteed by FNMA, FHLMC, or GNMA23 All other mortgage-backed securities24 Asset-backed securities25 Credit card receivables26 Home equity lines27 Automobile loans28 Other consumer loans29 Commercial and industrial loans30 Other31 Other debt securities32 Other domestic debt securities33 Foreign debt securities34 Investments in mutual funds and other equity securities with readily determinable
fair value
35 Federal funds sold and securities purchased under agreements to resell36 Federal funds sold in domestic offices37 Securities purchased under agreements to resell
38 Total loans and leases (gross) and lease-financing receivables (net)39 LESS: Unearned income on loans40 LESS: Loans and leases held for sale41 Total loans and leases (net of unearned income)42 LESS: Allowance for loan and lease losses43 Loans and leases, net of unearned income and allowance
Total loans and leases, gross, by category44 Loans secured by real estate45 Construction and land development46 Farmland47 One- to four-family residential properties48 Revolving, open-end loans, extended under lines of credit
Closed-end loans secured by one- to four-family residential properties49 Secured by first liens50 Secured by junior liens51 Multifamily (five or more) residential properties52 Nonfarm n on residential properties53 Loans to depository institutions and acceptances of other banks54 Commercial banks in the United States55 Other depository institutions in the United States56 Banks in foreign countries57 Loans to finance agricultural production and other loans to farmers58 Commercial and industrial loans59 U.S. addressees (domicile)60 Non-U.S. addressees (domicile)61 Loans to individuals for household, family, and other personal expenditures (includes
purchased paper)62 Credit cards63 Other revolving credit plans64 Other consumer loans (including single-payment, installment, and all student loans)65 Obligations (other than securities) of states and political subdivisions in the United States
(includes nonrated industrial development obligations)66 All other loans67 Loans to foreign governments and official institutions68 Other loans69 Loans for purchasing and carrying securities70 All other loans (excludes consumer loans)71 Lease-financing receivables
72 Trading assets73 Premises and fixed assets (including capitalized leases)74 Other real estate owned75 Investments in un con soli dated subsidiaries and associated companies76 Net due from own foreign offices, Edge Act and agreement subsidiaries, and IBFs77 Intangible assets78 Goodwill79 Other intangible assets80 All other assets
11,942^57
689,458
1,701,78534,967
145,1006,058
139,042136,348
1,029,014662,22567,862
580,87013,493
366,788142,45912,464
211,865210,11832,713
9,93812,01814,64615,665
124,180128,75932,95495,806
17,479
717,725219,999497,726
6,875,9902,645
141,0926,732,253
135,6446,596,609
3,820,356n.a.n.a.n.a.n.a.
n.a.n.a.n.a.n.a.135,613n.a.n.a.n.a.59,116
1,423,353n.a.n.a.
986,454371,15268,247
547,054
52,457275,371
1,914273,457n.a.n.a.123,271
898,214106,11118,92320,541n.a.
451,593332,538119,055600,304
10^99,782
449,782nnnnnn
nn
nnn
.a.
.a.
.a.
.a.
.a.
.a.
.a.
.a.
.a.
.a.
.a.
545,700219,999325,701
6,359,9712,341
3,752,914547,28561,581
2,075,484576,062
1,307,073192,348148,935919,629102,459
58,3441,220,342
849,997305,77356,741
487,484
52,453209,984
542209,442
9,207,521
600,657133,323n.a.n.a.69,315
231,948166,071
1,273,22525,931
38,5002,717
35,78257,700
830,164533,433
52,791468,064
12,578296,731
89,58511,366
195,780205,085
30,5759,708
11,80114,46115,225
123,316106,13020,24685,884
9,716
634,136172,487461,650
4,938,2161,608
107,1534,829,455
105,6644,723,790
114,85147,05110,28157,51914,519
1,110,010898,355211,656
817,846311,38863,822
442,636
40,889256,920
1,897255,023
108,971
863,53761,33910,28320,058n.a.
405,086299,349105,737508,256
7,664,946
360,981128,21995,25332,96654,79811,899
166,065
n.a.n.a.n.a.n.a.n.a.n.a.n.a.n.a.n.a.n.a.n.a.n.a.n.a.n.a.n.a.n.a.n.a.n.a.n.a.n.a.
462,112172,487289,625
4,422,1971,304
n.a.n.a.n.a.n.a.
2,406,767273,914
10,6941,587,041
492,545
940,434154,06196,070
439,04981,69746,51510,27824,90413,747
907,000887,212
19,787
681,389246,00852,315
383,066
40,885191,533
525191,00838,260
152,74899,180
n.a.n.a.n.a.n.a.20,329n.a.n.a.n.a.n.a.
2,734,835
88,801
428,5609,036
106,6003,341
103,26078,648
198,850128,792
15,071112,806
91570,05752,875
1,09816,0855,0332,139
229217185440864
22,63012,7089,922
7,762
83,58947,51336,076
1,937,7741,037
33,9391,902,799
29,9801,872,819
1,346,146273,371
50,887488,443
83,517
366,63938,28752,865
480,58020,762
44,597313,342
168,60859,7654,426
104,418
11,56818,451
1718,434
14,299
34,67844,771
8,640483
n.a.46,50733,18913,31892,049

Special Tables 59
4.20 DOMESTIC AND FOREIGN OFFICES Insured Commercial Bank Assets and Liabilities—Continued
Consolidated Report of Condition, September 30, 2008
Millions of dollars except as noted
Domestictotal
Banks with foreign offices'Banks withdomestic
offices only2
81 Total liabilities, minority interest, and equity capital
82 Total liabilities
83 Total deposits84 Individuals, partnerships, and corporations (include all certified and official checks) . . . .85 U.S. government86 States and political subdivisions in the United States87 Commercial banks and other depository institutions in the United States88 Banks in foreign countries89 Foreign governments and official institutions (including
foreign central banks)
90 Total transaction accounts91 Individuals, partnerships, and corporations (include all certified and official checks) . .92 U.S. government93 States and political subdivisions in the United States94 Commercial banks and other depository institutions in the United States95 Banks in foreign countries96 Foreign governments and official institutions (including foreign central banks) . . . .
97 Total demand deposits
98 Total nontransaction accounts99 Individuals, partnerships, and corporations (include all certified and official checks) . .
100 U.S. government101 States and political subdivisions in the United States102 Commercial banks and other depository institutions in the United States103 Banks in foreign countries104 Foreign governments and official institutions (including foreign central banks)
105 Federal funds purchased and securities sold under agreements to repurchase106 Federal funds purchased in domestic offices107 Securities sold under agreements to repurchase108 Trading liabilities109 Other borrowed money (includes mortgage indebtedness and obligations under capitalized
leases)110 Subordinated notes and debentures to deposits111 Net due to own foreign offices, Edge Act and agreement subsidiaries, and IBFs112 All other liabilities113 Minority interest in consolidated subsidiaries
114 Total equity capital
MEMO115 Trading assets at large banks2
116 U.S. Treasury securities (domestic offices)117 U.S. government agency obligations (excluding MBS)118 Securities issued by states and political subdivisions in the United States119 Mortgage-backed securities120 Other debt securities121 Other trading assets122 Trading assets in foreign offices123 Revaluation gains on interest rate, foreign exchange rate, and other
commodity and equity contracts124 Total individual retirement (IRA) and Keogh plan accounts125 Total brokered deposits126 Fully insured brokered deposits127 Issued in denominations of less than $100,000128 Issued in denominations of $100,000, or in denominations greater than $100,000 and
participated out by the broker in shares of $100,000 or less129 Money market deposit accounts (MMDAs)130 Other savings deposits (excluding MMDAs)131 Total time deposits of less than $100,000132 Total time deposits of $100,000 or more
133 Number of banks
11,942,357
10,770,631
7.711.5976,961,043
n .a.n .a.149.428176.866
n.a.
9,228,560
6.206.8665,773,293
5,180318,05982,32522.710
n .a.n .a.n .a.n .a.
n .a.n .a.n .a.n .a.n .a.n .a.n .a.
855,954298,839557,114356,666
1,328,263173,781n .a.344,371
15,744
1,155,982
5,300
722,104607,499
2,33069,81333,313
8,357792
540,862
5,484,7625,165,794
2,850248,24649,01214,3524,507
694,929298,839396,090
848,183n .a.n .a.n .a.n .a.n .a.n .a.273,930
313,228n .a.n .a.n .a.n .a.
n .a.n .a.n .a.n .a.n .a.
454,18436,958
8,01927,42679,43680,76828,418
0
193,159229,487526,129384,024329,715
54,3082,471,453
706,6061,179,2001,127,502
9,207,521
8,325,182
5,720,6245,135,445
n .a.n .a.
119,971176,695
100,407
n .a.n .a.n .a.
711,307215,581495,726356,127
1,061,882165,577n .a.
309,66614,628
867,711
6,783,111
4,215,8933,947,695
4,338183,16152,86822,539
5,292
449,553373,120
1,98836,60228,781
8,274788
374,609
3,766,3403,574,575
2,350146,55924,08814,2654,504
550,282215,581334,702n .a.
940,557n .a.
532,970n .a.n .a.
n .a.
2,445,449
1,990,9731,825,598
843134,89829,457
171
272,551234,379
34233,2114,532
83
166,253
1,718,4221,591,219
500101,68624,925
144,64783,25961,388
539
266,3808,204
n.a.34,705
1,115
288,271
419,57436,863
6,85527,34075,42555,54125,629
0
191,920125,144255,915154,082135,865
18,2171,895,188
463,123625,075782,954
34,61095
1,16485
4,01125,2272,789
0
1,239104,343270,214229,941193,850
36,091576,266243,482554,125344,549
7,003
NOTE. The notation "n.a." indicates the lesser detail available from banks that do not haveforeign offices, the inapplicability of certain items to banks that have only domestic offices, orthe absence of detail on a fully consolidated basis for banks that have foreign offices.
1. All transactions between domestic and foreign offices of a bank are reported in "net duefrom" and "net due to" lines. All other lines represent transactions with parties other than thedomestic and foreign offices of each bank. Because these intra-office transactions are nullifiedby consolidation, total assets and total liabilities for the entire bank may not equal the sum ofassets and liabilities, respectively, of the domestic and foreign offices.
Foreign offices include branches in foreign countries, Puerto Rico, and U.S.-affiliatedinsular areas; subsidiaries in foreign countries; all offices of Edge Act and agreementcorporations wherever located; and international banking facility (IBF).
2. Components of "Trading Assets at Large Banks" are reported only by banks thatreported trading assets of $2 million or more any quarter of the preceding calendar year.

60
Index to Statistical Tables
ACCEPTANCES, bankers (See Bankers acceptances)Assets and liabilities (See also Foreigners)
Commercial banks, 15-21, 58-59Domestic finance companies, 30, 31Federal Reserve Banks, 10Foreign-related institutions, 20
AutomobilesConsumer credit, 34Production, 42, 43
BANKERS acceptances, 5, 10Bankers balances, 15-21 (See also Foreigners)
Bonds (See also U.S. government securities)New issues, 29Rates, 23
Business loans (See Commercial and industrial loans)
CAPACITY utilization, 40, 41Capital accounts
Commercial banks, 15-21, 58-59Federal Reserve Banks, 10
Certificates of deposit, 23Commercial and industrial loans
Commercial banks, 15-21, 58-59Weekly reporting by banks, 17, 18
Commercial banksAssets and liabilities, 15-21, 58-59Commercial and industrial loans, 15-21, 58-59Consumer loans held, by type and terms, 34Real estate mortgages held, by holder and property, 33Time and savings deposits, 4
Commercial paper, 22, 23, 30Condition statements (See Assets and liabilities)Consumer credit, 34Corporations
Security issues, 29, 55Credit unions, 34Currency in circulation, 5, 13Customer credit, stock market, 24
DEBT (See securities and U.S. government securities)Demand deposits, 15-21Depository institutions
Reserve requirements, 8Reserves and related items, 4—6, 12
DepositsCommercial banks, 4, 15-21, 58-59Federal Reserve Banks, 5, 10
Discount rates at Reserve Banks and at foreign central banks andforeign countries (See Interest rates)
Discounts and advances by Reserve Banks (See Loans)
EXCHANGE rates, foreign, 56
FARM mortgage loans, 33Federal agency obligations, 5, 9-11, 26, 27Federal credit agencies, 28Federal finance
Debt subject to statutory limitation, and types and ownership ofgross debt, 25
Federal Financing Bank, 28Federal funds, 23Federal Home Loan Banks, 28Federal Home Loan Mortgage Corporation, 28, 32, 33Federal Housing Administration, 28, 32, 33Federal Land Banks, 33Federal National Mortgage Association, 28, 32, 33Federal Reserve Banks
Condition statement, 10
Discount rates (See Interest rates)U.S. government securities held, 5, 10, 11, 25
Federal Reserve credit, 5, 6, 10, 12Federal Reserve notes, 10Federally sponsored credit agencies, 28Finance companies
Assets and liabilities, 30Business credit, 31Loans, 34Paper, 22, 23
Float, 5Flow of funds, 35-39Foreign currency operations, 10Foreign deposits in U.S. banks, 5Foreign exchange rates, 56Foreign-related institutions, 20Foreigners
Claims on, 45, 48^19, 52-53Liabilities to, 45^17, 50-51, 54, 55
GOLDCertificate account, 10Stock, 5, 45
Government National Mortgage Association, 28, 32, 33
INDUSTRIAL production, 42, 43Insurance companies, 25, 33Interest rates
Bonds, 23Consumer credit, 34Federal Reserve Banks, 7Money and capital markets, 23Mortgages, 32Prime rate, 22
International capital transactions of United States, 44-55International organizations, 45, 46^17, 48, 50-55Investment companies, issues and assets, 30Investments
Commercial banks, 4, 15-21Federal Reserve Banks, 10, 11Financial institutions, 33
LIFE insurance companies (See Insurance companies)Loans
Commercial banks, 15-21, 58-59Federal Reserve Banks, 5-7, 10, 11Financial institutions, 33Insured or guaranteed by United States, 32, 33
MANUFACTURINGCapacity utilization, 40, 41Production, 42, 43
Margin requirements, 24Member banks, reserve requirements, 8Mining production, 43Monetary and credit aggregates, 4, 12Money and capital market rates, 23Money stock measures and components, 4, 13Mortgages (See Real estate loans)Mutual funds, 13, 30Mutual savings banks (See Thrift institutions)
OPEN market transactions, 9
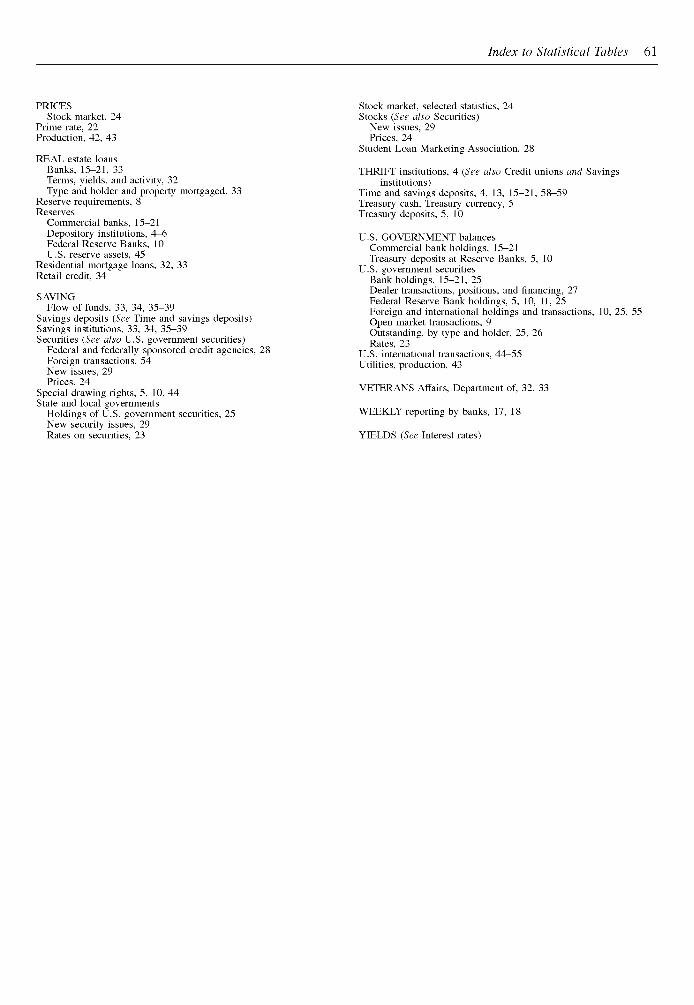
Index to Statistical Tables 61
PRICESStock market, 24
Prime rate, 22Production, 42, 43
REAL estate loansBanks, 15-21, 33Terms, yields, and activity, 32Type and holder and property mortgaged, 33
Reserve requirements, 8Reserves
Commercial banks, 15-21Depository institutions, 4—6Federal Reserve Banks, 10U.S. reserve assets, 45
Residential mortgage loans, 32, 33Retail credit, 34
SAVINGFlow of funds, 33, 34, 35-39
Savings deposits (See Time and savings deposits)Savings institutions, 33, 34, 35-39Securities (See also U.S. government securities)
Federal and federally sponsored credit agencies, 28Foreign transactions, 54New issues, 29Prices, 24
Special drawing rights, 5, 10, 44State and local governments
Holdings of U.S. government securities, 25New security issues, 29Rates on securities, 23
Stock market, selected statistics, 24Stocks (See also Securities)
New issues, 29Prices, 24
Student Loan Marketing Association, 28
THRIFT institutions, 4 (See also Credit unions and Savingsinstitutions)
Time and savings deposits, 4, 13, 15-21, 58-59Treasury cash, Treasury currency, 5Treasury deposits, 5, 10
U.S. GOVERNMENT balancesCommercial bank holdings, 15-21Treasury deposits at Reserve Banks, 5, 10
U.S. government securitiesBank holdings, 15-21, 25Dealer transactions, positions, and financing, 27Federal Reserve Bank holdings, 5, 10, 11, 25Foreign and international holdings and transactions, 10, 25, 55Open market transactions, 9Outstanding, by type and holder, 25, 26Rates, 23
U.S. international transactions, 44—55Utilities, production, 43
VETERANS Affairs, Department of, 32, 33
WEEKLY reporting by banks, 17, 18
YIELDS (See Interest rates)

62 Federal Reserve Bulletin Statistical Supplement • December 2008
Federal Reserve Board Publications
For ordering assistance, write PUBLICATIONS FULFILL-MENT, MS-127, Board of Governors of the Federal ReserveSystem, Washington, DC 20551, or telephone (202) 452-3245,or FAX (202) 728-5886. You may also use the publicationsorder form available on the Board's website(www.federalreserve.gov). When a charge is indicated, paymentshould accompany request and be made payable to the Board ofGovernors of the Federal Reserve System or may be ordered viaMasterCard, VISA, or American Express. Payment from foreignresidents should be drawn on a U.S. bank.
BOOKS AND MISCELLANEOUS PUBLICATIONS
ANNUAL PERCENTAGE RATE TABLES (Truth in Lending—Regulation Z) Vol. I (Regular Transactions). 1969. 100 pp.Vol. II (Irregular Transactions). 1969. 116 pp. Each volume$5.00.
ANNUAL REPORT, 2003.
ANNUAL REPORT: BUDGET REVIEW, 2004.
ANNUAL STATISTICAL DIGEST: period covered, release date, num-ber of pages, and price.
1981 October 19821982 December 19831983 October 19841984 October 19851985 October 19861986 November 19871987 October 19881988 November 19891980-89 March 19911990 November 19911991 November 19921992 December 19931993 December 19941994 December 19951990-95 November 19961996-2000 March 2002
FEDERAL RESERVE BULLETIN. Quarterly. $10.00 per year or $2.50each in the United States, its possessions, Canada, andMexico. Elsewhere, $15.00 per year or $3.50 each.
FEDERAL RESERVE REGULATORY SERVICE. Loose-leaf; updated
monthly. (Requests must be prepaid.)Consumer and Community Affairs Handbook. $75.00 per year.Monetary Policy and Reserve Requirements Handbook. $75.00
per year.Securities Credit Transactions Handbook. $75.00 per year.The Payment System Handbook. $75.00 per year.Federal Reserve Regulatory Service. Four vols. (Contains all
four Handbooks plus substantial additional material.) $200.00per year.
Rates for subscribers outside the United States are as followsand include additional airmail costs:
Federal Reserve Regulatory Service, $250.00 per year.Each Handbook, $90.00 per year.
239 pp.266 pp.264 pp.254 pp.231 pp.288 pp.272 pp.256 pp.712 pp.185 pp.215 pp.215 pp.281 pp.190 pp.404 pp.352 pp.
$ 6.50$ 7.50$11.50$12.50$15.00$15.00$15.00$25.00$25.00$25.00$25.00$25.00$25.00$25.00$25.00$25.00
FEDERAL RESERVE REGULATORY SERVICE FOR PERSONALCOMPUTERS. CD-ROM; updated monthly.
Standalone PC. $300 per year.Network, maximum 1 concurrent user. $300 per year.Network, maximum 10 concurrent users. $750 per year.Network, maximum 50 concurrent users. $2,000 per year.Network, maximum 100 concurrent users. $3,000 per year.Subscribers outside the United States should add $50 to cover
additional airmail costs.
THE FEDERAL RESERVE SYSTEM—PURPOSES AND FUNCTIONS.
2005. 136 pp.GUIDE TO THE FLOW OF FUNDS ACCOUNTS. January 2000.
1,186 pp. $20.00 each.REGULATIONS OF THE BOARD OF GOVERNORS OF THE FEDERAL
RESERVE SYSTEM.STATISTICAL SUPPLEMENT TO THE FEDERAL RESERVE BULLETIN.
Monthly. $25.00 per year or $2.50 each in the United States,its possessions, Canada, and Mexico. Elsewhere, $35.00 peryear or $3.50 each.
EDUCATION PAMPHLETSShort pamphlets suitable for classroom use. Multiple copies areavailable without charge.
A Consumer's Guide to Mortgage Lock-InsA Consumer's Guide to Mortgage Settlement CostsA Consumer's Guide to Mortgage RefinancingsA Guide to Business Credit for Women, Minorities, and Small
BusinessesChoosing a Credit CardConsumer Handbook on Adjustable Rate Mortgages (also avail-
able in Spanish)Consumer Handbook to Credit Protection LawsHome Mortgages: Understanding the Process and Your Right
to Fair LendingHow to File a Consumer Complaint about a Bank (also available
in Spanish)In Plain English: Making Sense of the Federal ReserveKeys to Vehicle Leasing (also available in Spanish)Looking for the Best Mortgage (also available in Spanish)Making Sense of SavingsPrivacy Choices for Your Personal Financial InformationProtecting Yourself from Overdraft and Bounced-Check FeesPutting Your Home on the Loan Line Is Risky Business (also
available in Spanish)Series on the Structure of the Federal Reserve System
The Board of Governors of the Federal Reserve SystemThe Federal Open Market CommitteeFederal Reserve Bank Board of DirectorsFederal Reserve Banks
What You Should Know About Home Equity Lines of Credit(also available in Spanish)
When Is Your Check Not a Check? (also available in Spanish)

63
STAFF STUDIES: Only Summaries Printed in theBULLETIN
Studies and papers on economic and financial subjects that are ofgeneral interest. Staff Studies 1-158, 161, 163, 165, 166, 168, and169 are out of print, but photocopies of them are available. StaffStudies 165-176 are available online at www.federalreserve.gov/pubs/staffstudies. Requests to obtain single copies of any paper orto be added to the mailing list for the series may be sent toPublications Fulfillment.
159. NEW DATA ON THE PERFORMANCE OF NONBANK SUBSIDIAR-IES OF BANK HOLDING COMPANIES, by Nellie Liang andDonald Savage. February 1990. 12 pp.
160. BANKING MARKETS AND THE USE OF FINANCIAL SER-VICES BY SMALL AND MEDIUM-SIZED BUSINESSES, byGregory E. Elliehausen and John D. Wolken. September1990. 35 pp.
162. EVIDENCE ON THE SIZE OF BANKING MARKETS FROM MORT-GAGE LOAN RATES IN TWENTY CITIES, by Stephen A.Rhoades. February 1992. 11 pp.
164. THE 1989-92 CREDIT CRUNCH FOR REAL ESTATE, byJames T. Fergus and John L. Goodman, Jr. July 1993.20 pp.
167. A SUMMARY OF MERGER PERFORMANCE STUDIES IN BANK-ING, 1980-93, AND AN ASSESSMENT OF THE "OPERATINGPERFORMANCE" AND "EVENT STUDY" METHODOLOGIES, byStephen A. Rhoades. July 1994. 37 pp.
170. THE COST OF IMPLEMENTING CONSUMER FINANCIAL REGULA-TIONS: AN ANALYSIS OF EXPERIENCE WITH THE TRUTH INSAVINGS ACT, by Gregory Elliehausen and Barbara R.Lowrey. December 1997. 17 pp.
171. THE COST OF BANK REGULATION: A REVIEW OF THE EVI-DENCE, by Gregory Elliehausen. April 1998. 35 pp.
172. USING SUBORDINATED DEBT AS AN INSTRUMENT OF MARKETDISCIPLINE, by Study Group on Subordinated Notesand Debentures, Federal Reserve System. December 1999.69 pp.
173. IMPROVING PUBLIC DISCLOSURE IN BANKING, by StudyGroup on Disclosure, Federal Reserve System. March 2000.35 pp.
174. BANK MERGERS AND BANKING STRUCTURE IN THE UNITEDSTATES, 1980-98, by Stephen Rhoades. August 2000. 33 pp.
175. THE FUTURE OF RETAIL ELECTRONIC PAYMENTS SYSTEMS:INDUSTRY INTERVIEWS AND ANALYSIS, Federal Reserve Staff,for the Payments System Development Committee, FederalReserve System. December 2002. 27 pp.
176. BANK MERGER ACTIVITY IN THE UNITED STATES, 1994-2003, by Steven J. Pilloff. May 2004. 23 pp.

64 Federal Reserve Bulletin Statistical Supplement • December 2008
ANTICIPATED SCHEDULE OF RELEASE DATES FOR PERIODIC STATISTICAL RELEASES OF THE BOARD OFGOVERNORS OF THE FEDERAL RESERVE SYSTEM
For ordering assistance, write PUBLICATIONS FULFILLMENT, MS-127, Board of Governors of the Federal ReserveSystem, 20th Street and Constitution Ave., N.W., Washington, DC 20551, or telephone (202) 452-3244, or FAX (202)728-5886. You may also use the publications order form available on the Board's website (www.federalreserve.gov). When acharge is indicated, payment should accompany request and be made payable to the Board of Governors of the FederalReserve System or may be ordered via MasterCard, VISA, or American Express. Payment from foreign residents should bedrawn on a U.S. bank.
Release number and title
Weekly Releases
H.2. Actions of the Board:Applications and ReportsReceived
H.3. Aggregate Reserves ofDepository Institutions andthe Monetary Base3
H.4.1. Factors Affecting Reserve Balancesof Depository Institutions andCondition Statement ofFederal Reserve Banks3
H.6. Money Stock Measures3
H.8. Assets and Liabilities ofCommercial Banks in theUnited States3
H. 10. Foreign Exchange Rates 3
H.15. Selected Interest Rates3
Monthly Releases
G.5. Foreign Exchange Rates3
G. 15. Research Library—Recent Acquisitions
G.17. Industrial Production andCapacity Utilization 3
G.19. Consumer Credit3
G.20. Finance Companies3
Annualmailrate
$55.00
$20.00
$20.00
$35.00
$30.00
$20.00
$20.00
$ 5.00
No charge
$15.00
$ 5.00
$ 5.00
Annualfaxrate
n.a.
n.a.
n.a.
n.a.
n.a.
$20.00
$20.00
$ 5.00
n.a.
n.a.
$ 5.00
n.a.
Approximatereleasedays1
Friday
Thursday
Thursday
Thursday
Friday
Monday
Monday
First of month
First of month
Midmonth
Fifth working dayof month
End of month
which data refer
Week endingpreviousSaturday
Week endingpreviousWednesday
Week endingpreviousWednesday
Week endingMonday ofprevious week
Week endingpreviousWednesday
Week endingpreviousFriday
Week endingpreviousFriday
Previous month
Previous month
Previous month
Second monthprevious
Second monthprevious
CorrespondingBulletin orStatistical
Supplementtable numbers2
1.20
1.11, 1.18
1.21
1.26A-F
3.28
1.35
3.28
2.12,2.13
1.55, 1.56
1.51, 1.52
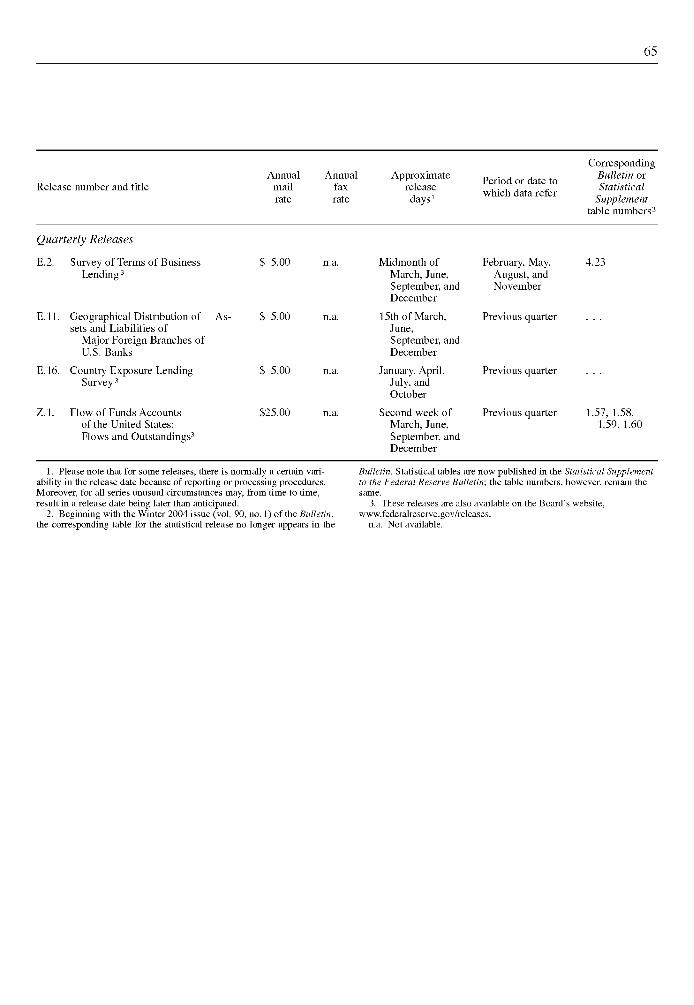
65
Release number and titleAnnual Annual
mail faxrate rate
Approximatereleasedays1
Period or date towhich data refer
CorrespondingBulletin orStatistical
Supplementtable numbers2
Quarterly Releases
E.2. Survey of Terms of BusinessLending 3
E. 11. Geographical Distribution ofsets and Liabilities of
Major Foreign Branches ofU.S. Banks
E.16. Country Exposure LendingSurvey 3
Z.I. Flow of Funds Accountsof the United States:Flows and Outstandings3
As-
5.00
5.00
$ 5.00
$25.00
Midmonth ofMarch, June,September, andDecember
15th of March,June,September, andDecember
January, April,July, andOctober
Second week ofMarch, June,September, andDecember
February, May,August, andNovember
Previous quarter
Previous quarter
Previous quarter
4.23
1.57, 1.58,1.59, 1.60
1. Please note that for some releases, there is normally a certain vari-ability in the release date because of reporting or processing procedures.Moreover, for all series unusual circumstances may, from time to time,result in a release date being later than anticipated.
2. Beginning with the Winter 2004 issue (vol. 90, no. 1) of the Bulletin,the corresponding table for the statistical release no longer appears in the
Bulletin. Statistical tables are now published in the Statistical Supplementto the Federal Reserve Bulletin; the table numbers, however, remain thesame.
3. These releases are also available on the Board's website,www.federalreserve.gov/releases.
n.a. Not available.

66 Federal Reserve Bulletin Statistical Supplement • December 2008
Publications of Interest
FEDERAL RESERVE REGULATORY SERVICE
To promote public understanding of its regulatory func-tions, the Board publishes the Federal Reserve Regu-latory Service, a four-volume loose-leaf service con-taining all Board regulations as well as related statutes,interpretations, policy statements, rulings, and staffopinions. For those with a more specialized interest inthe Board's regulations, parts of this service are pub-lished separately as handbooks pertaining to monetarypolicy, securities credit, consumer affairs, and the pay-ment system.
These publications are designed to help those whomust frequently refer to the Board's regulatory materi-als. They are updated monthly, and each contains cita-tion indexes and a subject index.
The Monetary Policy and Reserve RequirementsHandbook contains Regulations A, D, and Q, plusrelated materials.
The Securities Credit Transactions Handbook con-tains Regulations T, U, and X, which deal with exten-sions of credit for the purchase of securities, and relatedstatutes, Board interpretations, rulings, and staff opin-ions. Also included is the Board's list of foreign marginstocks.
The Consumer and Community Affairs Handbookcontains Regulations B, C, E, G, M, P, Z, AA, BB, andDD, and associated materials.
The Payment System Handbook deals with expeditedfunds availability, check collection, wire transfers, andrisk-reduction policy. It includes Regulations CC, J, andEE, related statutes and commentaries, and policystatements on risk reduction in the payment system.
For domestic subscribers, the annual rate is $200 forthe Federal Reserve Regulatory Service and $75 foreach handbook. For subscribers outside the UnitedStates, the price, which includes additional airmail costs,is $250 for the service and $90 for each handbook.
The Federal Reserve Regulatory Service is also avail-able on CD-ROM for use on personal computers. For astandalone PC, the annual subscription fee is $300. Fornetwork subscriptions, the annual fee is $300 for 1 con-current user, $750 for a maximum of 10 concurrentusers, $2,000 for a maximum of 50 concurrent users,and $3,000 for a maximum of 100 concurrent users.Subscribers outside the United States should add $50to cover additional airmail costs. For further informa-tion, call (202) 452-3244.
All subscription requests must be accompanied by acheck or money order payable to the Board of Gover-nors of the Federal Reserve System. Orders should beaddressed to Publications Fulfillment, Mail Stop 127,Board of Governors of the Federal Reserve System,Washington, DC 20551.
GUIDE TO THE FLOW OF FUNDS ACCOUNTS
A new edition of Guide to the Flow of Funds Accountsis now available from the Board of Governors. The newedition incorporates changes to the accounts since theinitial edition was published in 1993. Like the earlierpublication, it explains the principles underlying theflow of funds accounts and describes how the accountsare constructed. It lists each flow series in the Board'sflow of funds publication, "Flow of Funds Accounts ofthe United States" (the Z.I quarterly statistical release),
and describes how the series is derived from sourcedata. The Guide also explains the relationship betweenthe flow of funds accounts and the national income andproduct accounts and discusses the analytical uses offlow of funds data. The publication can be purchased,for $20.00, from Publications Fulfillment, Mail Stop127, Board of Governors of the Federal Reserve Sys-tem, Washington, DC 20551.

67
Federal Reserve Statistical ReleasesAvailable on the Commerce Department'sEconomic Bulletin Board
The Board of Governors of the Federal Reserve Sys- For further information regarding a subscription totern makes some of its statistical releases available to the economic bulletin board, please call (202) 482-the public through the U.S. Department of Com- 1986. The releases transmitted to the economic bulle-merce's economic bulletin board. Computer access tin board, on a regular basis, are the following:to the releases can be obtained by subscription.
ReferenceNumber
H.3
H.4.1
H.6
H.8
H.10
H.15
G.5
G.17
G.19
Z.I
Statistical release
Aggregate Reserves
Factors Affecting Reserve Balances
Money Stock
Assets and Liabilities of Insured Domestically Charteredand Foreign Related Banking Institutions
Foreign Exchange Rates
Selected Interest Rates
Foreign Exchange Rates
Industrial Production and Capacity Utilization
Consumer Installment Credit
Flow of Funds
Frequency of release
Weekly/Thursday
Weekly/Thursday
Weekly/Thursday
Weekly/Monday
Weekly/Monday
Weekly/Monday
Monthly/end of month
Monthly/midmonth
Monthly/fifth business day
Quarterly