Statistical Supplement to - USDA ERS. United States ... AP-077, U.S. Department of ... Statistical...
33
United States Department of Agriculture Economic Research Service Administrative Publication Number 077 September 2017 Statistical Supplement to Household Food Security in the United States in 2016 Alisha Coleman-Jensen Matthew P. Rabbitt Christian A. Gregory Anita Singh
Transcript of Statistical Supplement to - USDA ERS. United States ... AP-077, U.S. Department of ... Statistical...
United States Department of Agriculture
Economic Research Service
Administrative Publication Number 077
September 2017
Statistical Supplement to Household Food Security in the United States in 2016
Alisha Coleman-Jensen Matthew P. Rabbitt Christian A. GregoryAnita Singh
Economic Research Service www.ers.usda.gov
United States Department of Agriculture
Recommended citation format for this publication:
Alisha Coleman-Jensen, Matthew P. Rabbitt, Christian A. Gregory, and Anita Singh. Statistical Supplement to Household Food Security in the United States in 2016, AP-077, U.S. Department of Agriculture, Economic Research Service, September 2017.
Use of commercial and trade names does not imply approval or constitute endorsement by USDA.
To ensure the quality of its research reports and satisfy government-wide standards, ERS requires that all research reports with substantively new material be reviewed by qualified technical research peers. This technical peer review process, coordinated by ERS' Peer Review Coordinating Council, allows experts who possess the technical background, perspective, and expertise to provide an objective and meaningful assessment of the output’s substantive content and clarity of communication during the publication’s review.
In accordance with Federal civil rights law and U.S. Department of Agriculture (USDA) civil rights regulations and policies, the USDA, its Agencies, offices, and employees, and institutions participating in or administering USDA programs are pro-hibited from discriminating based on race, color, national origin, religion, sex, gender identity (including gender expression), sexual orientation, disability, age, marital status, family/parental status, income derived from a public assistance program, political beliefs, or reprisal or retaliation for prior civil rights activity, in any program or activity conducted or funded by USDA (not all bases apply to all programs). Remedies and complaint filing deadlines vary by program or incident.
Persons with disabilities who require alternative means of communication for program information (e.g., Braille, large print, audiotape, American Sign Language, etc.) should contact the responsible Agency or USDA's TARGET Center at (202) 720-2600 (voice and TTY) or contact USDA through the Federal Relay Service at (800) 877-8339. Additionally, program information may be made available in languages other than English.
To file a program discrimination complaint, complete the USDA Program Discrimination Complaint Form, AD-3027, found online at How to File a Program Discrimination Complaint and at any USDA office or write a letter addressed to USDA and provide in the letter all of the information requested in the form. To request a copy of the complaint form, call (866) 632-9992. Submit your completed form or letter to USDA by: (1) mail: U.S. Department of Agriculture, Office of the Assis-tant Secretary for Civil Rights, 1400 Independence Avenue, SW, Washington, D.C. 20250-9410; (2) fax: (202) 690-7442; or (3) email: [email protected].
USDA is an equal opportunity provider, employer, and lender.
United States Department of Agriculture
Economic Research Service
Administrative Publication Number 077
September 2017
Statistical Supplement to Household Food Security in the United States in 2016
Alisha Coleman-Jensen, [email protected]
Matthew P. Rabbitt, [email protected] Christian A. Gregory, [email protected] Singh, USDA, Food and Nutrition Service
Note to Readers
This Supplement provides statistics that complement those in Household Food Security in the United States in 2016 (ERR-237). That research report provides the primary national statistics on household food security, food spending, and use of Federal food and nutrition assistance programs by food-insecure households. The Supplement provides additional statistics on component items of the household food security measure, the frequency of occurrence of food-insecure conditions, and selected statistics on household food security, food spending, and use of Federal and community food and nutrition assistance programs.
Keywords: Food security, food insecurity, food spending, food pantry, soup kitchen, emergency kitchen, material well-being, SNAP, Food Stamp Program, National School Lunch Program, WIC
About the Authors
Alisha Coleman-Jensen is a sociologist and Matthew Rabbitt and Christian Gregory are econ-omists with the USDA Economic Research Service (ERS). Anita Singh is with USDA’s Food and Nutrition Service.
Acknowledgments
The authors thank Brian Stacy, Mark Prell, Jean Buzby, David Smallwood, and Constance Newman of ERS for their reviews of the report. We also thank editors Courtney Knauth and Margaret Carter and designer Cynthia Ray, all of ERS.
ii Statistical Supplement to Household Food Security in the United States in 2016, AP-077
Economic Research Service/USDA
Contents
Statistical Supplement Tables . . . . . . . . . . . . . . . . . . . . . . . . . . . . . . . . . . . . . . . . . . . . . . . . . . . . . . iii
Tables in Household Food Security in the United States in 2016 . . . . . . . . . . . . . . . . . . . . . . . . . . . . . . . . . . . . . . . . . . . . . . . . . . . . . . . . . . . . iv
Introduction . . . . . . . . . . . . . . . . . . . . . . . . . . . . . . . . . . . . . . . . . . . . . . . . . . . . . . . . . . . . . . . . . . . .1
Food Insecurity in Low-Income Households . . . . . . . . . . . . . . . . . . . . . . . . . . . . . . . . . . . . . . . . . . .2
Number of Persons by Household Food Security Status and Selected Household Characteristics . . . . . . . . . . . . . . . . . . . . . . . . . . . . . . . . . . . . . . . . . . . . . . . . . .4
Food Security During the 30 Days Prior to the Food Security Survey . . . . . . . . . . . . . . . . . . . . . . .7
Household Responses to Questions in the Food Security Scale . . . . . . . . . . . . . . . . . . . . . . . . . . . . . . . . . . . . . . . . . . . . . . . . . . . . . . . . . . . . . .9
Frequency of Occurrence of Behaviors, Experiences, and Conditions That Indicate Food Insecurity . . . . . . . . . . . . . . . . . . . . . . . . . . . . . . . . . . . . . . . . . . . . . . . . . . . . . .13
Monthly and Daily Occurrence of Food-Insecure Conditions . . . . . . . . . . . . . . . . . . . . . . . . . . . . . . . . . . . . . . . . . . . . . . . . . . . . . . . . . 16
Food Spending by Food-Secure and Food-Insecure Households . . . . . . . . . . . . . . . . . . . . . . . . . . . 18
Use of Food Pantries and Emergency Kitchens . . . . . . . . . . . . . . . . . . . . . . . . . . . . . . . . . . . . . . . .20
Food Spending by Households That Received Food and Nutrition Assistance . . . . . . . . . . . . . . . .23
Food Security During the 30 Days Prior to the Food Security Survey in Households That Received Food and Nutrition Assistance . . . . . . . . . . . . . . . . . . . . . . . . . . . . .24
Combined Use of Federal and Community Food and Nutrition Assistance . . . . . . . . . . . . . . . . . . .25
References . . . . . . . . . . . . . . . . . . . . . . . . . . . . . . . . . . . . . . . . . . . . . . . . . . . . . . . . . . . . . . . . . . .26
iii Statistical Supplement to Household Food Security in the United States in 2016, AP-077
Economic Research Service/USDA
Statistical Supplement Tables
Table S-1—Households with annual income below 130 percent of the poverty line by food security status and selected household characteristics, 2016 . . . . . . . . . . . . . . 3
Table S-2—Number of individuals by food security status of households and selected household characteristics, 2016 . . . . . . . . . . . . . . . . . . . . . . . . . . . . . . . . . . . . . . . . . . . .5
Table S-3—Number of children by food security status of households and selected household characteristics, 2016 . . . . . . . . . . . . . . . . . . . . . . . . . . . . . . . . . . . . . . . . . . . . . . . . . . . .6
Table S-4—Households by food security status during the 30 days prior to the food security survey and selected household characteristics, 2016 . . . . . . . . . . . . . . . . . . . . . . . . . . . .8
Table S-5—Responses to items in the food security scale, 2013-16 . . . . . . . . . . . . . . . . . . . . . . . . . 10
Table S-6—Percentage of households by food security raw score, 2016 . . . . . . . . . . . . . . . . . . . . . 11
Table S-7—Frequency of occurrence of behaviors, experiences, and conditions indicating food insecurity reported by all U.S. households, 2016 . . . . . . . . . . . . . . . . . . . . . . . . . 14
Table S-8—Frequency of occurrence of behaviors, experiences, and conditions indicating food insecurity reported by households with very low food security, 2016 . . . . . . . . .15
Table S-9—Monthly and daily occurrence of behaviors, experiences, and conditions indicating food insecurity reported by all U.S. households, 2016 . . . . . . . . . . . . . . . . . 17
Table S-10—Weekly household food spending relative to the cost of the Thrifty Food Plan (TFP) by food security status and selected household characteristics, 2016 . . . . . . . . . . . . . . 19
Table S-11—Use of food pantries and emergency kitchens, 2016 . . . . . . . . . . . . . . . . . . . . . . . . . . 21
Table S-12—Prevalence of food security and food insecurity of households with annual incomes less than 185 percent of the poverty line, by use of food pantries and emergency kitchens, 2016 . . . . . . . . . . . . . . . . . . . . . . . . . . . . . . . . . . . . . . . . . . . . . . 21
Table S-13—Use of food pantries, by selected household characteristics, 2016 . . . . . . . . . . . . . . . .22
Table S-14—Weekly household food spending relative to the cost of the Thrifty Food Plan (TFP) by participation in selected Federal and community food and nutrition assistance programs, 2016 . . . . . . . . . . . . . . . . . . . . . . . . . . . . . . . . . . . . . . . . . . . . . . . . . . . . . .23
Table S-15—Prevalence of food insecurity during the 30 days prior to the food security survey, by participation in selected Federal and community food and nutrition assistance programs, 2016 . . . . . . . . . . . . . . . . . . . . . . . . . . . . . . . . . . . . . . . . . . . . . . . . . . . . . .24
Table S-16—Combined use of Federal and community food and nutrition assistance programs by low-income households, 2016 . . . . . . . . . . . . . . . . . . . . . . . . . . . . . . . . . . . . . . . . .25
iv Statistical Supplement to Household Food Security in the United States in 2016, AP-077
Economic Research Service/USDA
Tables in Household Food Security in the United States in 2016
Coleman-Jensen, Alisha, Matthew P. Rabbitt, Christian A. Gregory, and Anita Singh. 2017. Household Food Security in the United States in 2016, ERR-237, USDA, Economic Research Service.
Table 1A—Households and individuals by food security status of household, 1998-2016 . . . . . . . . .7
Table 1B—Households with children by food security status and children by food security status of household, 1998-2016 . . . . . . . . . . . . . . . . . . . . . . . . . . . . . . . . . . . . . . . . . . . 10
Table 2—Households by food security status and selected household characteristics, 2016 . . . . . . 14
Table 3—Prevalence of food security and food insecurity in households with children by selected household characteristics, 2016 . . . . . . . . . . . . . . . . . . . . . . . . . . . . . . . . . . . 16
Table 4—Prevalence of household-level food insecurity and very low food security by State, average 2014-16 . . . . . . . . . . . . . . . . . . . . . . . . . . . . . . . . . . . . . . . . . . . . . . . . . . . . . . . . .20
Table 5— Change in prevalence of household food insecurity and very low food security by State, 2014-16 (average), 2011-13 (average), and 2004-06 (average) . . . . . . . . . . . . .22
Table 6—Weekly household food spending per person and relative to the cost of the Thrifty Food Plan (TFP), 2016 . . . . . . . . . . . . . . . . . . . . . . . . . . . . . . . . . . . . . . . . . . . .25
Table 7—Weekly household food spending per person and relative to the cost of the Thrifty Food Plan (TFP) by food security status, 2016 . . . . . . . . . . . . . . . . . . . . . . . . . .27
Table 8—Percentage of households by food security status and participation in selected Federal food and nutrition assistance programs, 2016 . . . . . . . . . . . . . . . . . . . . . . . . . . . 31
Table 9—Participation of food-insecure households in selected Federal food and nutrition assistance programs, 2016 . . . . . . . . . . . . . . . . . . . . . . . . . . . . . . . . . . . . . . . . . . . . . . . .32
1 Statistical Supplement to Household Food Security in the United States in 2016, AP-077
Economic Research Service/USDA
Statistical Supplement to Household Food Security in the United States in 2016
Introduction
This supplement provides statistics on component items of the household food security measure, the frequency of occurrence of food-insecure conditions, and selected statistics on household food secu-rity, food spending, and use of Federal and community food and nutrition assistance programs. It complements Household Food Security in the United States in 2016 (ERR-237), which provides the primary national statistics on household food security, food spending, and use of Federal food and nutrition assistance programs by food-insecure households.
The statistics presented here are based on data collected in the Current Population Survey (CPS) Food Security Supplement conducted in December 2016. Information about the survey, data, and methods are available in Household Food Security in the United States in 2016. All statistics were calculated by applying the Food Security Supplement weights to responses of the surveyed house-holds to obtain nationally representative prevalence estimates. Unless otherwise noted, statistical differences described in the text are significant at the 90-percent confidence level.1
1Standard errors of estimates were calculated using balanced repeated replication (BRR) methods based on replicate weights computed for the Supplement by the U.S. Census Bureau.
2 Statistical Supplement to Household Food Security in the United States in 2016, AP-077
Economic Research Service/USDA
Food Insecurity in Low-Income Households
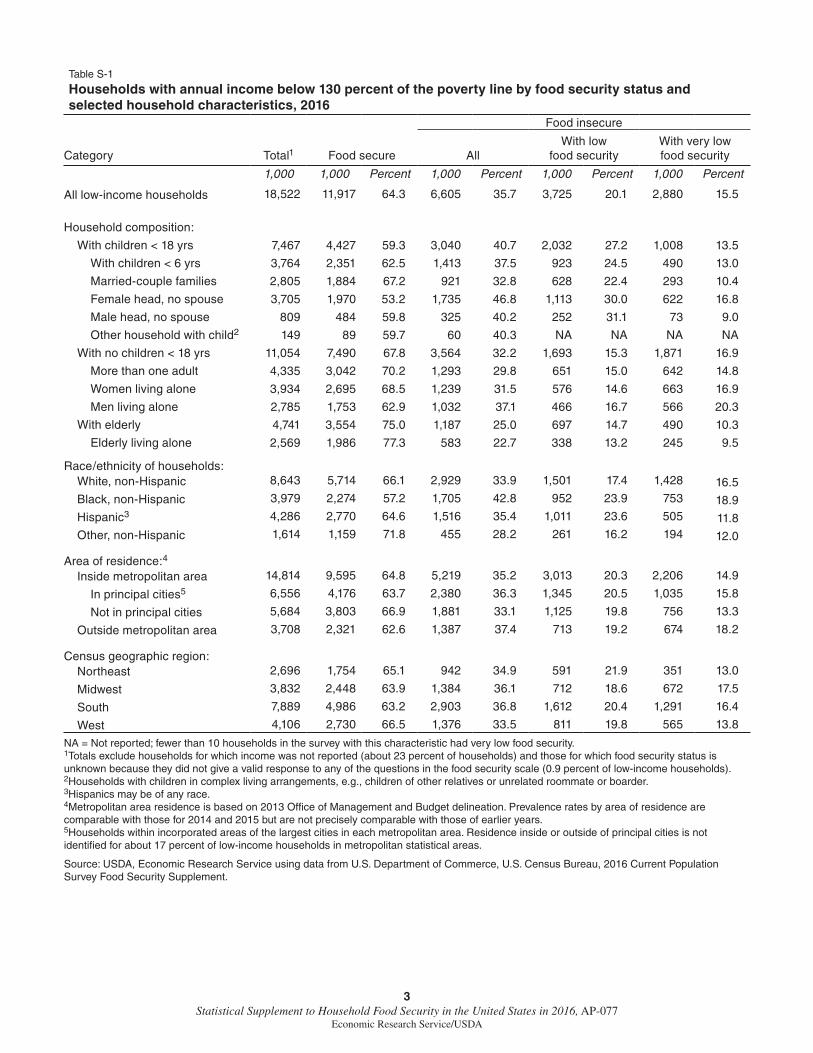
Table S-1 presents food security statistics for households with annual incomes below 130 percent of the poverty line.2 Food insecurity is by definition a condition that results from insufficient household resources. However, many factors that might affect a household’s food security (such as job loss, divorce, or other unexpected events) are not captured by an annual income measure. Some house-holds experienced episodes of food insecurity, or even very low food security, even though their annual incomes were well above the poverty line (Nord and Brent, 2002; Gundersen and Gruber, 2001). On the other hand, many low-income households manage to remain food secure. In 2016, 64.3 percent of households with incomes below 130 percent of the poverty line were food secure, while 35.7 percent were food insecure.
2The Federal poverty line was $24,339 annual income for a family of four in 2016 (two adults and two children). Households with monthly income below 130 percent of the poverty line are eligible to receive SNAP benefits, provided they meet other eligibility criteria. Children were eligible for free meals in the National School Lunch and School Break-fast Programs if household income was determined to be at or below 130 percent of poverty.
3 Statistical Supplement to Household Food Security in the United States in 2016, AP-077
Economic Research Service/USDA
Table S-1
Households with annual income below 130 percent of the poverty line by food security status and selected household characteristics, 2016
Food insecure
Category Total1 Food secure AllWith low
food securityWith very low food security
1,000 1,000 Percent 1,000 Percent 1,000 Percent 1,000 Percent
All low-income households 18,522 11,917 64.3 6,605 35.7 3,725 20.1 2,880 15.5
Household composition:
With children < 18 yrs 7,467 4,427 59.3 3,040 40.7 2,032 27.2 1,008 13.5
With children < 6 yrs 3,764 2,351 62.5 1,413 37.5 923 24.5 490 13.0
Married-couple families 2,805 1,884 67.2 921 32.8 628 22.4 293 10.4
Female head, no spouse 3,705 1,970 53.2 1,735 46.8 1,113 30.0 622 16.8
Male head, no spouse 809 484 59.8 325 40.2 252 31.1 73 9.0
Other household with child2 149 89 59.7 60 40.3 NA NA NA NA
With no children < 18 yrs 11,054 7,490 67.8 3,564 32.2 1,693 15.3 1,871 16.9
More than one adult 4,335 3,042 70.2 1,293 29.8 651 15.0 642 14.8
Women living alone 3,934 2,695 68.5 1,239 31.5 576 14.6 663 16.9
Men living alone 2,785 1,753 62.9 1,032 37.1 466 16.7 566 20.3
With elderly 4,741 3,554 75.0 1,187 25.0 697 14.7 490 10.3
Elderly living alone 2,569 1,986 77.3 583 22.7 338 13.2 245 9.5
Race/ethnicity of households: White, non-Hispanic 8,643 5,714 66.1 2,929 33.9 1,501 17.4 1,428 16.5 Black, non-Hispanic 3,979 2,274 57.2 1,705 42.8 952 23.9 753 18.9 Hispanic3 4,286 2,770 64.6 1,516 35.4 1,011 23.6 505 11.8 Other, non-Hispanic 1,614 1,159 71.8 455 28.2 261 16.2 194 12.0
Area of residence:4
Inside metropolitan area 14,814 9,595 64.8 5,219 35.2 3,013 20.3 2,206 14.9
In principal cities5 6,556 4,176 63.7 2,380 36.3 1,345 20.5 1,035 15.8
Not in principal cities 5,684 3,803 66.9 1,881 33.1 1,125 19.8 756 13.3
Outside metropolitan area 3,708 2,321 62.6 1,387 37.4 713 19.2 674 18.2
Census geographic region: Northeast 2,696 1,754 65.1 942 34.9 591 21.9 351 13.0
Midwest 3,832 2,448 63.9 1,384 36.1 712 18.6 672 17.5
South 7,889 4,986 63.2 2,903 36.8 1,612 20.4 1,291 16.4
West 4,106 2,730 66.5 1,376 33.5 811 19.8 565 13.8
NA = Not reported; fewer than 10 households in the survey with this characteristic had very low food security.1Totals exclude households for which income was not reported (about 23 percent of households) and those for which food security status is unknown because they did not give a valid response to any of the questions in the food security scale (0.9 percent of low-income households).2Households with children in complex living arrangements, e.g., children of other relatives or unrelated roommate or boarder.3Hispanics may be of any race. 4Metropolitan area residence is based on 2013 Office of Management and Budget delineation. Prevalence rates by area of residence are comparable with those for 2014 and 2015 but are not precisely comparable with those of earlier years.5Households within incorporated areas of the largest cities in each metropolitan area. Residence inside or outside of principal cities is not identified for about 17 percent of low-income households in metropolitan statistical areas.
Source: USDA, Economic Research Service using data from U.S. Department of Commerce, U.S. Census Bureau, 2016 Current Population Survey Food Security Supplement.
4 Statistical Supplement to Household Food Security in the United States in 2016, AP-077
Economic Research Service/USDA
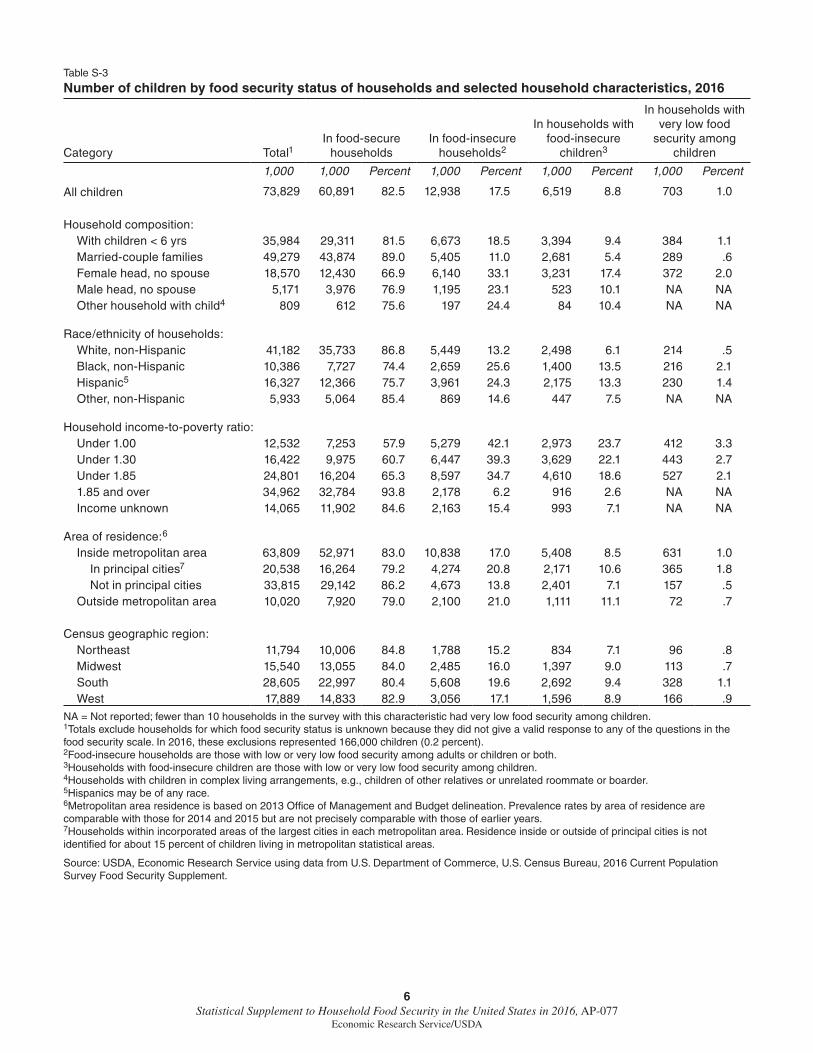
Number of Persons by Household Food Security Status and Selected Household Characteristics
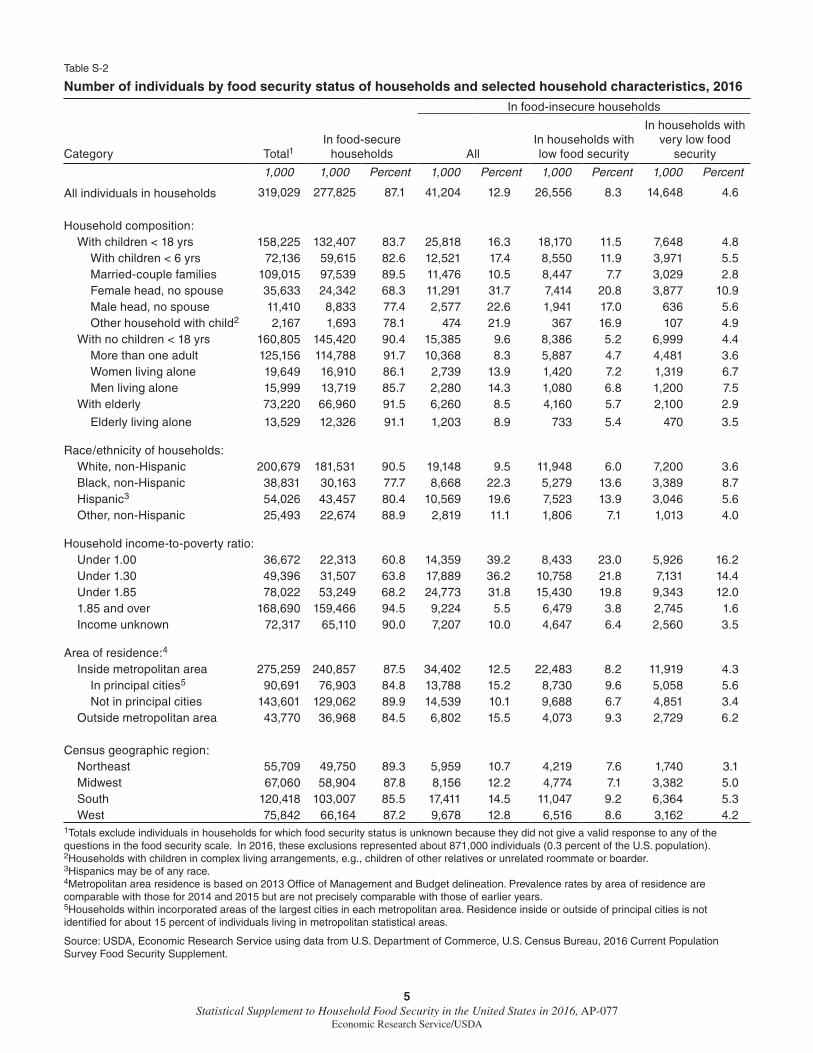
The food security survey is designed to measure food security status at the household level. While it is informative to examine the number of persons residing in food-insecure households, these statis-tics should be interpreted carefully (see tables S-2 for individuals and S-3 for children). Within a food-insecure household, different household members may have been affected differently by the household’s food insecurity. Some members—particularly young children—may have experienced only mild effects or none at all, while adults were more severely affected. It is more precise, there-fore, to describe these statistics as representing “persons living in food-insecure households” rather than as representing “food-insecure persons.” Similarly, “persons living in households with very low food security” is a more precise description than “persons with very low food security.”
5 Statistical Supplement to Household Food Security in the United States in 2016, AP-077
Economic Research Service/USDA
Table S-2
Number of individuals by food security status of households and selected household characteristics, 2016
In food-insecure households
Category Total1In food-secure
households AllIn households with low food security
In households with very low food
security
1,000 1,000 Percent 1,000 Percent 1,000 Percent 1,000 Percent
All individuals in households 319,029 277,825 87.1 41,204 12.9 26,556 8.3 14,648 4.6
Household composition: With children < 18 yrs 158,225 132,407 83.7 25,818 16.3 18,170 11.5 7,648 4.8 With children < 6 yrs 72,136 59,615 82.6 12,521 17.4 8,550 11.9 3,971 5.5 Married-couple families 109,015 97,539 89.5 11,476 10.5 8,447 7.7 3,029 2.8 Female head, no spouse 35,633 24,342 68.3 11,291 31.7 7,414 20.8 3,877 10.9 Male head, no spouse 11,410 8,833 77.4 2,577 22.6 1,941 17.0 636 5.6 Other household with child2 2,167 1,693 78.1 474 21.9 367 16.9 107 4.9 With no children < 18 yrs 160,805 145,420 90.4 15,385 9.6 8,386 5.2 6,999 4.4 More than one adult 125,156 114,788 91.7 10,368 8.3 5,887 4.7 4,481 3.6 Women living alone 19,649 16,910 86.1 2,739 13.9 1,420 7.2 1,319 6.7 Men living alone 15,999 13,719 85.7 2,280 14.3 1,080 6.8 1,200 7.5 With elderly 73,220 66,960 91.5 6,260 8.5 4,160 5.7 2,100 2.9
Elderly living alone 13,529 12,326 91.1 1,203 8.9 733 5.4 470 3.5
Race/ethnicity of households: White, non-Hispanic 200,679 181,531 90.5 19,148 9.5 11,948 6.0 7,200 3.6 Black, non-Hispanic 38,831 30,163 77.7 8,668 22.3 5,279 13.6 3,389 8.7 Hispanic3 54,026 43,457 80.4 10,569 19.6 7,523 13.9 3,046 5.6 Other, non-Hispanic 25,493 22,674 88.9 2,819 11.1 1,806 7.1 1,013 4.0
Household income-to-poverty ratio: Under 1.00 36,672 22,313 60.8 14,359 39.2 8,433 23.0 5,926 16.2 Under 1.30 49,396 31,507 63.8 17,889 36.2 10,758 21.8 7,131 14.4 Under 1.85 78,022 53,249 68.2 24,773 31.8 15,430 19.8 9,343 12.0 1.85 and over 168,690 159,466 94.5 9,224 5.5 6,479 3.8 2,745 1.6 Income unknown 72,317 65,110 90.0 7,207 10.0 4,647 6.4 2,560 3.5
Area of residence:4
Inside metropolitan area 275,259 240,857 87.5 34,402 12.5 22,483 8.2 11,919 4.3 In principal cities5 90,691 76,903 84.8 13,788 15.2 8,730 9.6 5,058 5.6 Not in principal cities 143,601 129,062 89.9 14,539 10.1 9,688 6.7 4,851 3.4 Outside metropolitan area 43,770 36,968 84.5 6,802 15.5 4,073 9.3 2,729 6.2
Census geographic region: Northeast 55,709 49,750 89.3 5,959 10.7 4,219 7.6 1,740 3.1 Midwest 67,060 58,904 87.8 8,156 12.2 4,774 7.1 3,382 5.0 South 120,418 103,007 85.5 17,411 14.5 11,047 9.2 6,364 5.3 West 75,842 66,164 87.2 9,678 12.8 6,516 8.6 3,162 4.21Totals exclude individuals in households for which food security status is unknown because they did not give a valid response to any of the questions in the food security scale. In 2016, these exclusions represented about 871,000 individuals (0.3 percent of the U.S. population).2Households with children in complex living arrangements, e.g., children of other relatives or unrelated roommate or boarder.3Hispanics may be of any race. 4Metropolitan area residence is based on 2013 Office of Management and Budget delineation. Prevalence rates by area of residence are comparable with those for 2014 and 2015 but are not precisely comparable with those of earlier years. 5Households within incorporated areas of the largest cities in each metropolitan area. Residence inside or outside of principal cities is not identified for about 15 percent of individuals living in metropolitan statistical areas.
Source: USDA, Economic Research Service using data from U.S. Department of Commerce, U.S. Census Bureau, 2016 Current Population Survey Food Security Supplement.
6 Statistical Supplement to Household Food Security in the United States in 2016, AP-077
Economic Research Service/USDA
Table S-3
Number of children by food security status of households and selected household characteristics, 2016
Category Total1In food-secure
householdsIn food-insecure
households2
In households with food-insecure
children3
In households with very low food
security among children
1,000 1,000 Percent 1,000 Percent 1,000 Percent 1,000 Percent
All children 73,829 60,891 82.5 12,938 17.5 6,519 8.8 703 1.0
Household composition: With children < 6 yrs 35,984 29,311 81.5 6,673 18.5 3,394 9.4 384 1.1 Married-couple families 49,279 43,874 89.0 5,405 11.0 2,681 5.4 289 .6 Female head, no spouse 18,570 12,430 66.9 6,140 33.1 3,231 17.4 372 2.0 Male head, no spouse 5,171 3,976 76.9 1,195 23.1 523 10.1 NA NA Other household with child4 809 612 75.6 197 24.4 84 10.4 NA NA
Race/ethnicity of households: White, non-Hispanic 41,182 35,733 86.8 5,449 13.2 2,498 6.1 214 .5 Black, non-Hispanic 10,386 7,727 74.4 2,659 25.6 1,400 13.5 216 2.1 Hispanic5 16,327 12,366 75.7 3,961 24.3 2,175 13.3 230 1.4 Other, non-Hispanic 5,933 5,064 85.4 869 14.6 447 7.5 NA NA
Household income-to-poverty ratio: Under 1.00 12,532 7,253 57.9 5,279 42.1 2,973 23.7 412 3.3 Under 1.30 16,422 9,975 60.7 6,447 39.3 3,629 22.1 443 2.7 Under 1.85 24,801 16,204 65.3 8,597 34.7 4,610 18.6 527 2.1 1.85 and over 34,962 32,784 93.8 2,178 6.2 916 2.6 NA NA Income unknown 14,065 11,902 84.6 2,163 15.4 993 7.1 NA NA
Area of residence:6
Inside metropolitan area 63,809 52,971 83.0 10,838 17.0 5,408 8.5 631 1.0 In principal cities7 20,538 16,264 79.2 4,274 20.8 2,171 10.6 365 1.8 Not in principal cities 33,815 29,142 86.2 4,673 13.8 2,401 7.1 157 .5 Outside metropolitan area 10,020 7,920 79.0 2,100 21.0 1,111 11.1 72 .7
Census geographic region: Northeast 11,794 10,006 84.8 1,788 15.2 834 7.1 96 .8 Midwest 15,540 13,055 84.0 2,485 16.0 1,397 9.0 113 .7 South 28,605 22,997 80.4 5,608 19.6 2,692 9.4 328 1.1 West 17,889 14,833 82.9 3,056 17.1 1,596 8.9 166 .9
NA = Not reported; fewer than 10 households in the survey with this characteristic had very low food security among children.1Totals exclude households for which food security status is unknown because they did not give a valid response to any of the questions in the food security scale. In 2016, these exclusions represented 166,000 children (0.2 percent).2Food-insecure households are those with low or very low food security among adults or children or both.3Households with food-insecure children are those with low or very low food security among children.4Households with children in complex living arrangements, e.g., children of other relatives or unrelated roommate or boarder.5Hispanics may be of any race. 6Metropolitan area residence is based on 2013 Office of Management and Budget delineation. Prevalence rates by area of residence are comparable with those for 2014 and 2015 but are not precisely comparable with those of earlier years. 7Households within incorporated areas of the largest cities in each metropolitan area. Residence inside or outside of principal cities is not identified for about 15 percent of children living in metropolitan statistical areas.
Source: USDA, Economic Research Service using data from U.S. Department of Commerce, U.S. Census Bureau, 2016 Current Population Survey Food Security Supplement.
7 Statistical Supplement to Household Food Security in the United States in 2016, AP-077
Economic Research Service/USDA
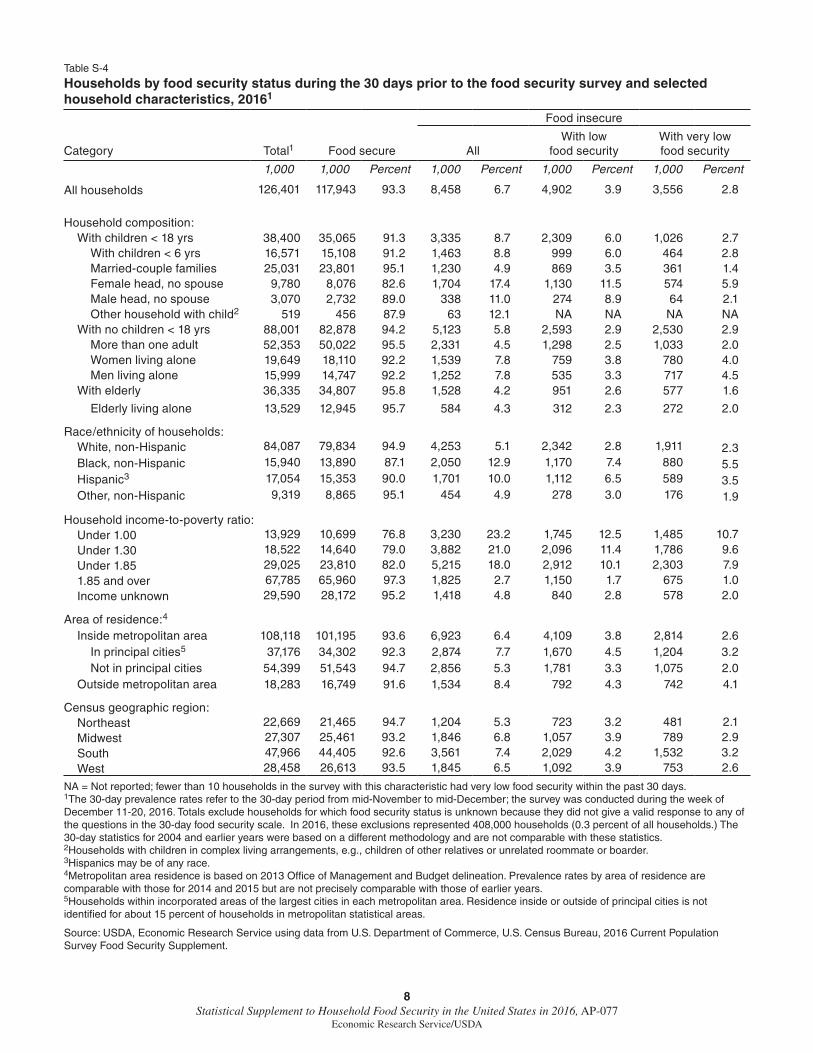
Food Security During the 30 Days Prior to the Food Security Survey
The annual food security survey was designed with the primary objective of assessing households’ food security during the 12-month period prior to the survey, but information is also collected with reference to the 30-day period prior to the survey. Households that responded affirmatively to each 12-month question were asked whether the same behavior, experience, or condition occurred during the last 30 days. Responses to these questions were used to assess the food security status of house-holds during the 30 days prior to the survey, following the same protocols that were used for the 12-month measure. The 30-day food security measurement protocol was revised in 2005, so 30-day statistics for 2016 are directly comparable with those for 2005 and later years, but not with those reported for 2004 and earlier years.
An estimated 93.3 percent of households were food secure throughout the 30-day period from mid-November to mid-December 2016 (table S-4).3 An estimated 6.7 percent (8.5 million households) were food insecure at some time during that 30-day period, including 2.8 percent (3.6 million) with very low food security. The national-level prevalence rates of food insecurity and very low food security were essentially unchanged from the corresponding 30-day period in 2015 (7.0 percent and 2.9 percent, respectively; see Coleman-Jensen et al., 2016). However, there were a few statistically significant changes in prevalence rates for some subpopulations. From 2015 to 2016, 30-day food insecurity declined for households headed by White, non-Hispanic adults, households in suburban areas, and in the Northeast. During this same time period, 30-day very low food security declined for single-father families and in suburban areas, while increasing for households headed by Black, non-Hispanic adults.
The number of households that were food insecure at some time during the 30 days from mid-November to mid-December 2016 (8,458,000 households; table S-4) was 54 percent of the number that were food insecure at some time during the 12 months prior to the survey (15,551,000 house-holds; Coleman-Jensen et al., 2017); the corresponding statistic for very low food security was 58 percent. If food insecurity during this 30-day period was similar to that for other 30-day periods throughout the year, then these comparisons imply that the average household that was food inse-cure at some time during the year experienced this condition in 7 months of the year. Likewise, the average household with very low food security experienced that condition in 7 months of the year.4 However, analysis of food insecurity in different months suggests that food insecurity is some-what more prevalent in the summer months (July-September) than in March-April and November-December (Cohen et al., 2002; Nord and Romig, 2006; Nord and Kantor, 2006), so typical frequencies may be somewhat higher than the 7 months implied by the December data.
3The food security survey was conducted December 11-20, 2016.4The number of months is estimated as the monthly rate divided by the annual rate multiplied by 12.
8 Statistical Supplement to Household Food Security in the United States in 2016, AP-077
Economic Research Service/USDA
Table S-4
Households by food security status during the 30 days prior to the food security survey and selected household characteristics, 20161
Food insecure
Category Total1 Food secure AllWith low
food securityWith very low food security
1,000 1,000 Percent 1,000 Percent 1,000 Percent 1,000 Percent
All households 126,401 117,943 93.3 8,458 6.7 4,902 3.9 3,556 2.8
Household composition: With children < 18 yrs 38,400 35,065 91.3 3,335 8.7 2,309 6.0 1,026 2.7 With children < 6 yrs 16,571 15,108 91.2 1,463 8.8 999 6.0 464 2.8 Married-couple families 25,031 23,801 95.1 1,230 4.9 869 3.5 361 1.4 Female head, no spouse 9,780 8,076 82.6 1,704 17.4 1,130 11.5 574 5.9 Male head, no spouse 3,070 2,732 89.0 338 11.0 274 8.9 64 2.1 Other household with child2 519 456 87.9 63 12.1 NA NA NA NA With no children < 18 yrs 88,001 82,878 94.2 5,123 5.8 2,593 2.9 2,530 2.9 More than one adult 52,353 50,022 95.5 2,331 4.5 1,298 2.5 1,033 2.0 Women living alone 19,649 18,110 92.2 1,539 7.8 759 3.8 780 4.0 Men living alone 15,999 14,747 92.2 1,252 7.8 535 3.3 717 4.5 With elderly 36,335 34,807 95.8 1,528 4.2 951 2.6 577 1.6
Elderly living alone 13,529 12,945 95.7 584 4.3 312 2.3 272 2.0
Race/ethnicity of households: White, non-Hispanic 84,087 79,834 94.9 4,253 5.1 2,342 2.8 1,911 2.3 Black, non-Hispanic 15,940 13,890 87.1 2,050 12.9 1,170 7.4 880 5.5 Hispanic3 17,054 15,353 90.0 1,701 10.0 1,112 6.5 589 3.5 Other, non-Hispanic 9,319 8,865 95.1 454 4.9 278 3.0 176 1.9
Household income-to-poverty ratio: Under 1.00 13,929 10,699 76.8 3,230 23.2 1,745 12.5 1,485 10.7 Under 1.30 18,522 14,640 79.0 3,882 21.0 2,096 11.4 1,786 9.6 Under 1.85 29,025 23,810 82.0 5,215 18.0 2,912 10.1 2,303 7.9 1.85 and over 67,785 65,960 97.3 1,825 2.7 1,150 1.7 675 1.0 Income unknown 29,590 28,172 95.2 1,418 4.8 840 2.8 578 2.0 Income unknown
Area of residence:4
Inside metropolitan area 108,118 101,195 93.6 6,923 6.4 4,109 3.8 2,814 2.6 In principal cities5 37,176 34,302 92.3 2,874 7.7 1,670 4.5 1,204 3.2 Not in principal cities 54,399 51,543 94.7 2,856 5.3 1,781 3.3 1,075 2.0 Outside metropolitan area 18,283 16,749 91.6 1,534 8.4 792 4.3 742 4.1
Census geographic region: Northeast 22,669 21,465 94.7 1,204 5.3 723 3.2 481 2.1 Midwest 27,307 25,461 93.2 1,846 6.8 1,057 3.9 789 2.9 South 47,966 44,405 92.6 3,561 7.4 2,029 4.2 1,532 3.2 West 28,458 26,613 93.5 1,845 6.5 1,092 3.9 753 2.6
NA = Not reported; fewer than 10 households in the survey with this characteristic had very low food security within the past 30 days.1The 30-day prevalence rates refer to the 30-day period from mid-November to mid-December; the survey was conducted during the week of December 11-20, 2016. Totals exclude households for which food security status is unknown because they did not give a valid response to any of the questions in the 30-day food security scale. In 2016, these exclusions represented 408,000 households (0.3 percent of all households.) The 30-day statistics for 2004 and earlier years were based on a different methodology and are not comparable with these statistics.2Households with children in complex living arrangements, e.g., children of other relatives or unrelated roommate or boarder.3Hispanics may be of any race.4Metropolitan area residence is based on 2013 Office of Management and Budget delineation. Prevalence rates by area of residence are comparable with those for 2014 and 2015 but are not precisely comparable with those of earlier years. 5Households within incorporated areas of the largest cities in each metropolitan area. Residence inside or outside of principal cities is not identified for about 15 percent of households in metropolitan statistical areas.
Source: USDA, Economic Research Service using data from U.S. Department of Commerce, U.S. Census Bureau, 2016 Current Population Survey Food Security Supplement.
9 Statistical Supplement to Household Food Security in the United States in 2016, AP-077
Economic Research Service/USDA
Household Responses to Questions in the Food Security Scale
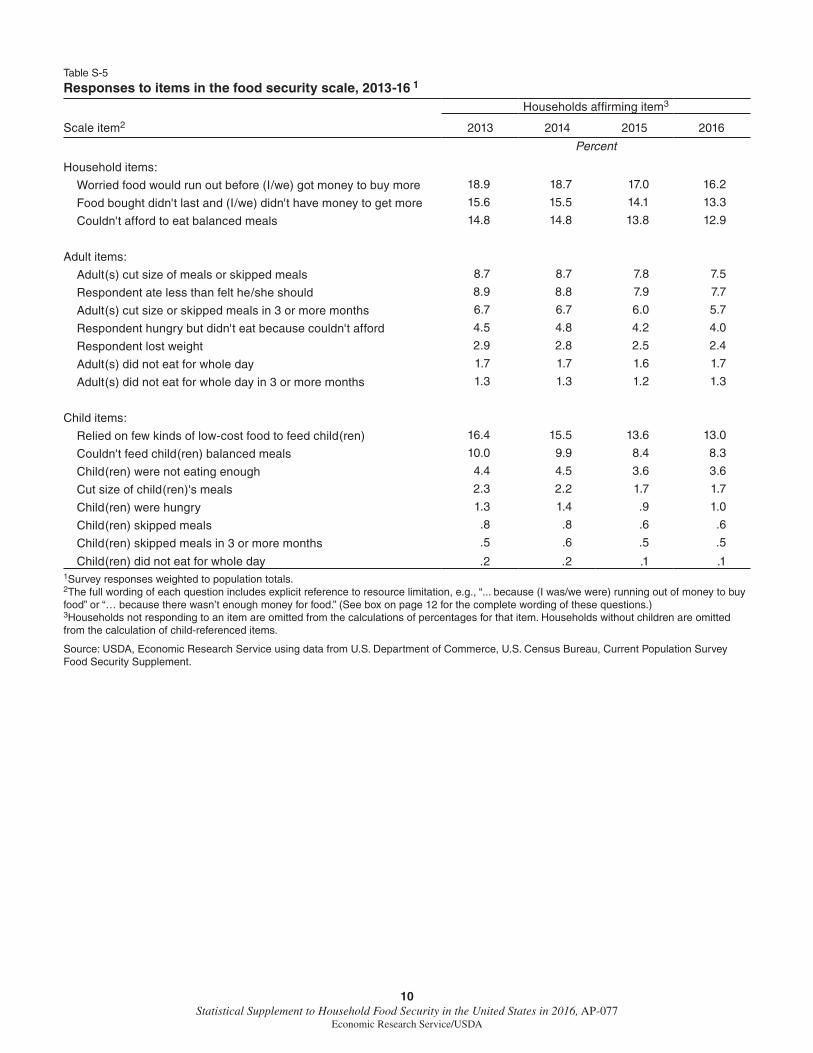
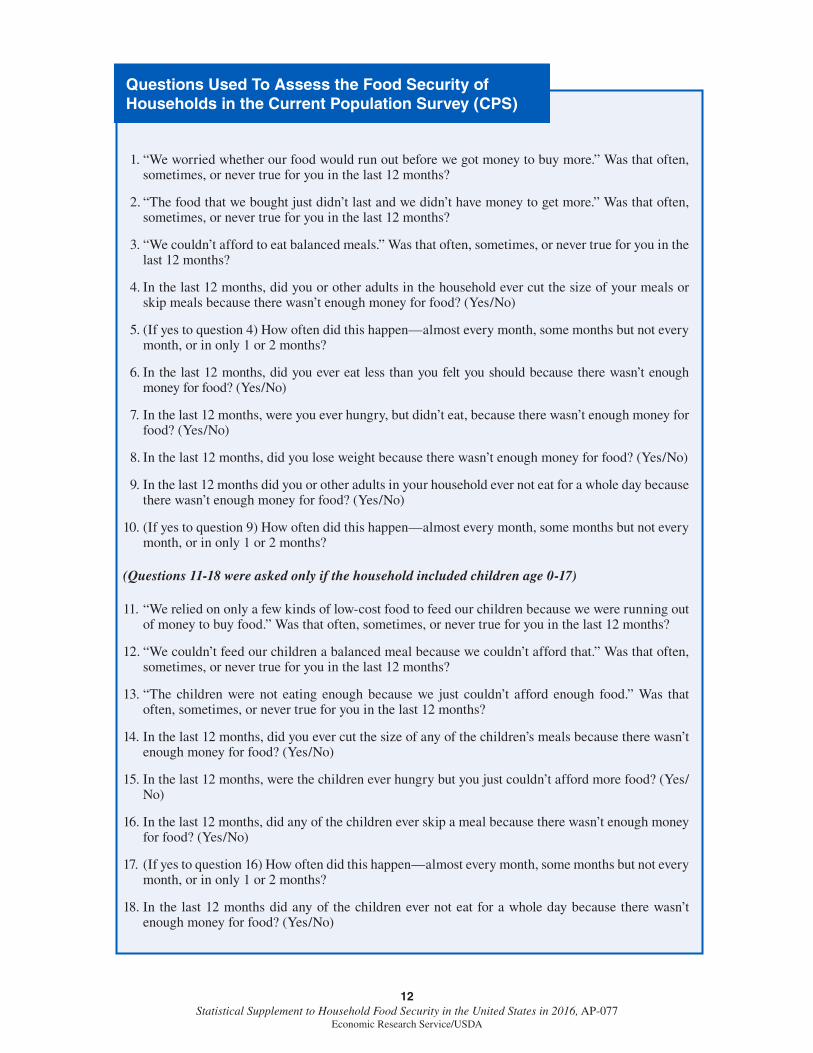
The 18 questions used for the food security measure ask about conditions, experiences, and behav-iors that range widely in severity (items near the top of the lists in Table S-5 are relatively less severe, while those nearer the bottom are more severe). Those indicating less severe food insecurity are observed in a larger proportion of households, and the proportion declines as severity increases (table S-5). The two least severe questions refer to uncertainty about having enough food and the experience of running out of food. The remaining 16 items indicate reduced quality, variety, or desirability of diets and increasingly severe disruptions of normal eating patterns and reductions in food intake. (See page 12 for the complete wording of these questions.) Three or more affirmative responses are required for a household to be classified as food insecure. Thus, all households in that category affirmed at least one item indicating reduced diet quality or disruption of normal eating patterns or reduction in food intake, and most food-insecure households reported multiple indicators of these conditions (table S-6).
A large majority of households (73.3 percent of households with children and 83.0 percent of those without children) reported no problems or concerns in meeting their food needs. Households that reported only one or two indications of food insecurity (10.2 percent of households with children and 6.6 percent of households without children) are also classified as food secure. Most of these households affirmed one or both of the first two items, indicating uncertainty about having enough food or about exhausting their food supply, but did not indicate actual disruptions of normal eating patterns or reductions in food intake. Although these households are classified as food secure, the food security of some of them may have been marginal at times, especially in the sense that they lacked “assured ability to acquire acceptable foods in socially acceptable ways,” a condition that the Life Sciences Research Office includes in its definition of food security (Anderson, 1990, p. 1,598).5 Research examining health and children’s development in these marginally food-secure households generally indicates that outcomes are either intermediate between those in highly food-secure and food-insecure households or more closely resemble those in food-insecure households (Radimer and Nord, 2005; Winicki and Jemison, 2003; Wilde and Peterman, 2006).
5The Life Sciences Research Office (LSRO) is a nonprofit organization based in Bethesda, MD. Concepts and defini-tions of food security and related conditions developed by LSRO for the American Institute of Nutrition (Anderson, 1990) provided key parts of the theoretical underpinnings of the household food security measure.
10 Statistical Supplement to Household Food Security in the United States in 2016, AP-077
Economic Research Service/USDA
Table S-5
Responses to items in the food security scale, 2013-16 1
Households affirming item3
Scale item2 2013 2014 2015 2016
Percent
Household items:
Worried food would run out before (I/we) got money to buy more 18.9 18.7 17.0 16.2
Food bought didn't last and (I/we) didn't have money to get more 15.6 15.5 14.1 13.3
Couldn't afford to eat balanced meals 14.8 14.8 13.8 12.9
Adult items:
Adult(s) cut size of meals or skipped meals 8.7 8.7 7.8 7.5
Respondent ate less than felt he/she should 8.9 8.8 7.9 7.7
Adult(s) cut size or skipped meals in 3 or more months 6.7 6.7 6.0 5.7
Respondent hungry but didn't eat because couldn't afford 4.5 4.8 4.2 4.0
Respondent lost weight 2.9 2.8 2.5 2.4
Adult(s) did not eat for whole day 1.7 1.7 1.6 1.7
Adult(s) did not eat for whole day in 3 or more months 1.3 1.3 1.2 1.3
Child items:
Relied on few kinds of low-cost food to feed child(ren) 16.4 15.5 13.6 13.0
Couldn't feed child(ren) balanced meals 10.0 9.9 8.4 8.3
Child(ren) were not eating enough 4.4 4.5 3.6 3.6
Cut size of child(ren)'s meals 2.3 2.2 1.7 1.7
Child(ren) were hungry 1.3 1.4 .9 1.0
Child(ren) skipped meals .8 .8 .6 .6
Child(ren) skipped meals in 3 or more months .5 .6 .5 .5
Child(ren) did not eat for whole day .2 .2 .1 .11Survey responses weighted to population totals. 2The full wording of each question includes explicit reference to resource limitation, e.g., “... because (I was/we were) running out of money to buy food” or “… because there wasn’t enough money for food.” (See box on page 12 for the complete wording of these questions.)3Households not responding to an item are omitted from the calculations of percentages for that item. Households without children are omitted from the calculation of child-referenced items.
Source: USDA, Economic Research Service using data from U.S. Department of Commerce, U.S. Census Bureau, Current Population Survey Food Security Supplement.

11 Statistical Supplement to Household Food Security in the United States in 2016, AP-077
Economic Research Service/USDA
Table S-6
Percentage of households by food security raw score, 2016
Panel A: Households with children—18-item household food security scale
Raw score (number of food-insecure
conditions reported) Percent of households1Cumulative percent of
households1 Food security status
0 73.28 73.28Food secure
(83.49 percent)1 6.04 79.32
2 4.17 83.49
3 3.66 87.15
Low food security(11.72 percent)
4 2.76 89.91
5 2.16 92.07
6 1.88 93.957 1.26 95.21
8 1.30 96.51
Very low food security(4.79 percent)
9 .97 97.48
10 .83 98.31
11 .47 98.78
12 .44 99.22
13 .24 99.46
14 .24 99.70
15 .17 99.87
16 .01 99.88
17 .06 99.9418 .06 100.00
Panel B: Households with children—8-item child food security scale
0 85.42 85.42 Children food secure ( 92.01 percent)1 6.59 92.01
2 4.45 96.46 Low food security among children ( 7.21 percent)
3 1.95 98.41
4 .81 99.22
5 .40 99.62Very low food security
among children (0.78 percent)
6 .12 99.74
7 .17 99.91
8 .09 100.00Panel C: Households with no children—10-item adult food security scale
0 82.98 82.98Food secure
(89.54 percent)1 3.68 86.66
2 2.88 89.54
3 2.89 92.43Low food security
(5.58 percent)4 1.32 93.75
5 1.37 95.12
6 1.64 96.76
Very low food security(4.88 percent)
7 1.27 98.03
8 .86 98.89
9 .41 99.30
10 .70 100.001Survey responses weighted to population totals.
Source: USDA, Economic Research Service using data from U.S. Department of Commerce, U.S. Census Bureau, 2016 Current Population Survey Food Security Supplement.
12 Statistical Supplement to Household Food Security in the United States in 2016, AP-077
Economic Research Service/USDA
Questions Used To Assess the Food Security of Households in the Current Population Survey (CPS)
1. “We worried whether our food would run out before we got money to buy more.” Was that often, sometimes, or never true for you in the last 12 months?
2. “The food that we bought just didn’t last and we didn’t have money to get more.” Was that often, sometimes, or never true for you in the last 12 months?
3. “We couldn’t afford to eat balanced meals.” Was that often, sometimes, or never true for you in the last 12 months?
4. In the last 12 months, did you or other adults in the household ever cut the size of your meals or skip meals because there wasn’t enough money for food? (Yes/No)
5. (If yes to question 4) How often did this happen—almost every month, some months but not every month, or in only 1 or 2 months?
6. In the last 12 months, did you ever eat less than you felt you should because there wasn’t enough money for food? (Yes/No)
7. In the last 12 months, were you ever hungry, but didn’t eat, because there wasn’t enough money for food? (Yes/No)
8. In the last 12 months, did you lose weight because there wasn’t enough money for food? (Yes/No)
9. In the last 12 months did you or other adults in your household ever not eat for a whole day because there wasn’t enough money for food? (Yes/No)
10. (If yes to question 9) How often did this happen—almost every month, some months but not every month, or in only 1 or 2 months?
(Questions 11-18 were asked only if the household included children age 0-17)
11. “We relied on only a few kinds of low-cost food to feed our children because we were running out of money to buy food.” Was that often, sometimes, or never true for you in the last 12 months?
12. “We couldn’t feed our children a balanced meal because we couldn’t afford that.” Was that often, sometimes, or never true for you in the last 12 months?
13. “The children were not eating enough because we just couldn’t afford enough food.” Was that often, sometimes, or never true for you in the last 12 months?
14. In the last 12 months, did you ever cut the size of any of the children’s meals because there wasn’t enough money for food? (Yes/No)
15. In the last 12 months, were the children ever hungry but you just couldn’t afford more food? (Yes/No)
16. In the last 12 months, did any of the children ever skip a meal because there wasn’t enough money for food? (Yes/No)
17. (If yes to question 16) How often did this happen—almost every month, some months but not every month, or in only 1 or 2 months?
18. In the last 12 months did any of the children ever not eat for a whole day because there wasn’t enough money for food? (Yes/No)
13 Statistical Supplement to Household Food Security in the United States in 2016, AP-077
Economic Research Service/USDA
Frequency of Occurrence of Behaviors, Experiences, and Conditions That Indicate Food Insecurity
Most of the questions used to calculate the food security scale also elicit information about how often the food-insecure behavior, experience, or condition occurred. The food security scale does not take all of this frequency-of-occurrence information into account, but analysis of these responses can provide insight into the frequency and duration of food insecurity. Frequency-of-occurrence information is collected in the CPS Food Security Supplement using two different methods:
• Method1: A condition is described, and the respondent is asked whether this was often, some-times, or never true for his or her household during the past 12 months.
• Method2: Respondents who answer “yes” to a yes/no question are asked, “How often did this happen—almost every month, some months but not every month, or in only 1 or 2 months?”
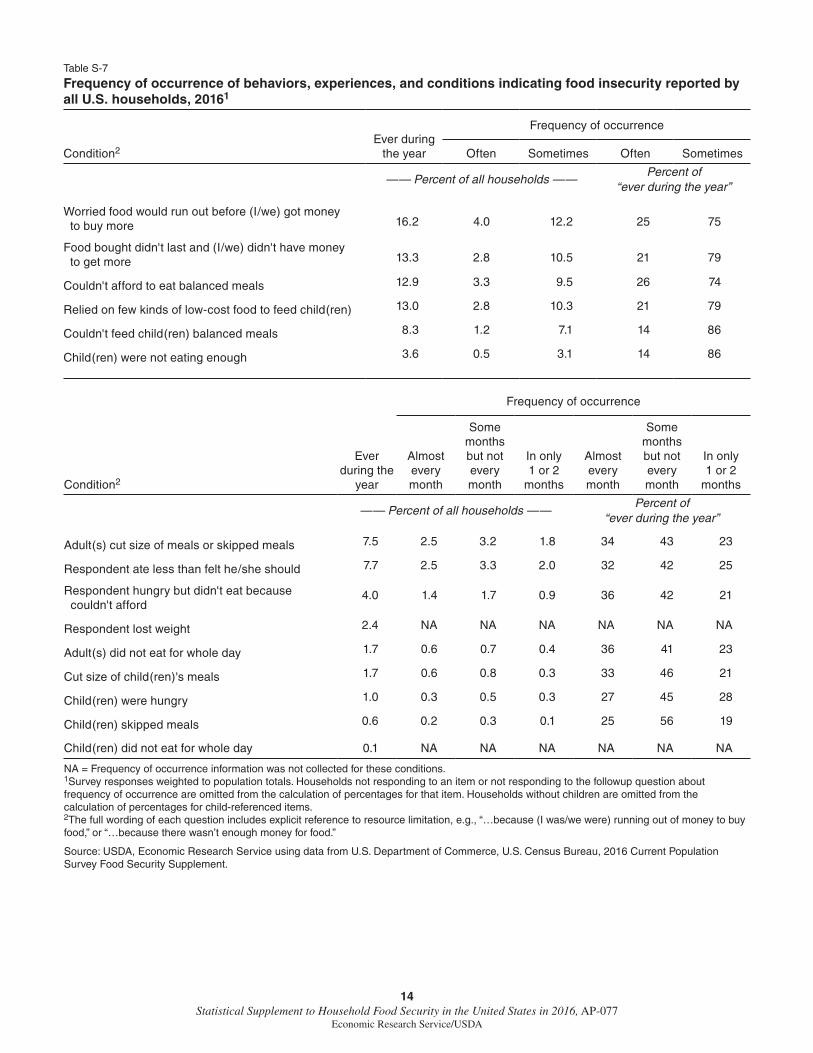
Table S-7 presents responses to each food security question broken down by reported frequency of occurrence for all households interviewed in the December 2016 survey. Questions using Method 1 are presented in the top panel of the table, and those using Method 2 are presented in the bottom panel. Most households that responded affirmatively to Method 1 questions reported that the behavior, experience, or condition occurred “sometimes,” while 14 to 26 percent (depending on the specific question) reported that it occurred “often.”
In response to Method 2 questions, conditional on affirming the general question, 25 to 36 percent of respondents reported that the behavior, experience, or condition occurred “in almost every month;” 41 to 56 percent reported that it occurred in “some months, but not every month;” and 19 to 28 percent reported that it occurred “in only 1 or 2 months.”
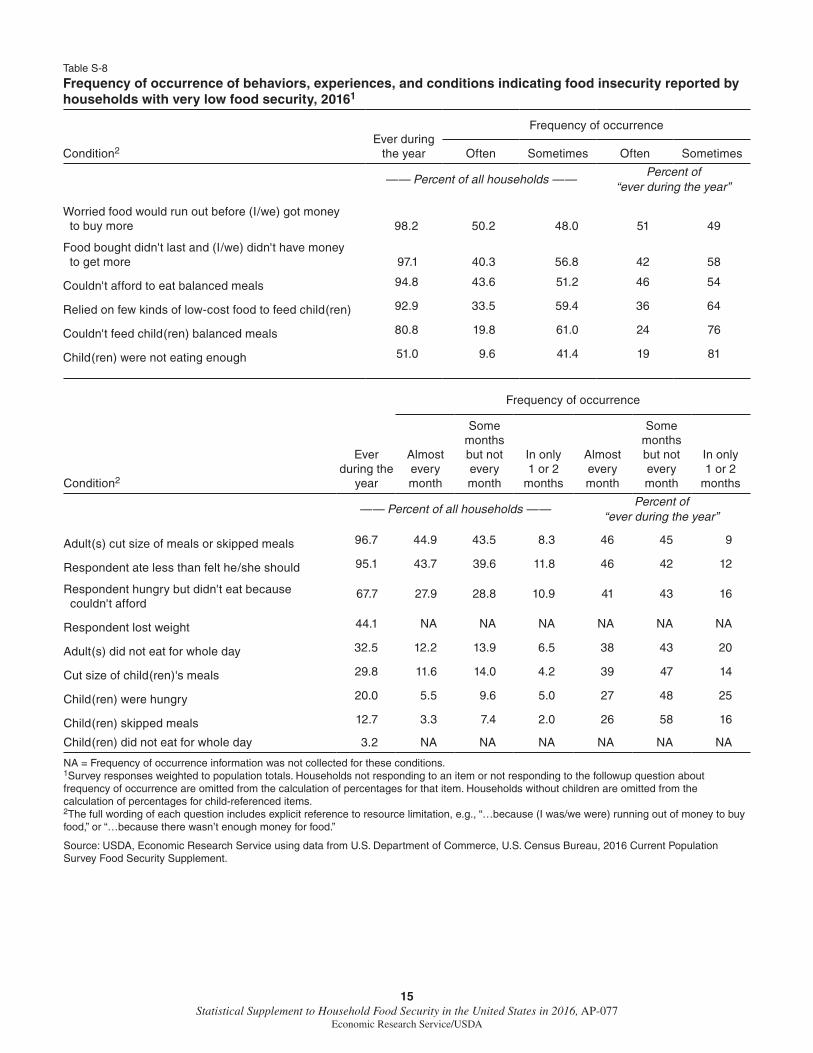
Table S-8 presents the same frequency-of-occurrence response statistics for households classified as having very low food security.
14 Statistical Supplement to Household Food Security in the United States in 2016, AP-077
Economic Research Service/USDA
Table S-7
Frequency of occurrence of behaviors, experiences, and conditions indicating food insecurity reported by all U.S. households, 20161
Ever during the year
Frequency of occurrence
Condition2 Often Sometimes Often Sometimes
—— Percent of all households ——Percent of
“ever during the year”
Worried food would run out before (I/we) got money to buy more 16.2 4.0 12.2 25 75
Food bought didn't last and (I/we) didn't have money to get more 13.3 2.8 10.5 21 79
Couldn't afford to eat balanced meals 12.9 3.3 9.5 26 74
Relied on few kinds of low-cost food to feed child(ren) 13.0 2.8 10.3 21 79
Couldn't feed child(ren) balanced meals 8.3 1.2 7.1 14 86
Child(ren) were not eating enough 3.6 0.5 3.1 14 86
Ever during the
year
Frequency of occurrence
Condition2
Almost every month
Some months but not every month
In only 1 or 2
months
Almost every month
Some months but not every month
In only 1 or 2
months
—— Percent of all households ——Percent of
“ever during the year”
Adult(s) cut size of meals or skipped meals 7.5 2.5 3.2 1.8 34 43 23
Respondent ate less than felt he/she should 7.7 2.5 3.3 2.0 32 42 25
Respondent hungry but didn't eat because couldn't afford
4.0 1.4 1.7 0.9 36 42 21
Respondent lost weight 2.4 NA NA NA NA NA NA
Adult(s) did not eat for whole day 1.7 0.6 0.7 0.4 36 41 23
Cut size of child(ren)'s meals 1.7 0.6 0.8 0.3 33 46 21
Child(ren) were hungry 1.0 0.3 0.5 0.3 27 45 28
Child(ren) skipped meals 0.6 0.2 0.3 0.1 25 56 19
Child(ren) did not eat for whole day 0.1 NA NA NA NA NA NA
NA = Frequency of occurrence information was not collected for these conditions.1Survey responses weighted to population totals. Households not responding to an item or not responding to the followup question about frequency of occurrence are omitted from the calculation of percentages for that item. Households without children are omitted from the calculation of percentages for child-referenced items.2The full wording of each question includes explicit reference to resource limitation, e.g., “…because (I was/we were) running out of money to buy food,” or “…because there wasn’t enough money for food.”
Source: USDA, Economic Research Service using data from U.S. Department of Commerce, U.S. Census Bureau, 2016 Current Population Survey Food Security Supplement.
15 Statistical Supplement to Household Food Security in the United States in 2016, AP-077
Economic Research Service/USDA
Table S-8
Frequency of occurrence of behaviors, experiences, and conditions indicating food insecurity reported by households with very low food security, 20161
Ever during the year
Frequency of occurrence
Condition2 Often Sometimes Often Sometimes
—— Percent of all households ——Percent of
“ever during the year”
Worried food would run out before (I/we) got money to buy more 98.2 50.2 48.0 51 49
Food bought didn't last and (I/we) didn't have money to get more 97.1 40.3 56.8 42 58
Couldn't afford to eat balanced meals 94.8 43.6 51.2 46 54
Relied on few kinds of low-cost food to feed child(ren) 92.9 33.5 59.4 36 64
Couldn't feed child(ren) balanced meals 80.8 19.8 61.0 24 76
Child(ren) were not eating enough 51.0 9.6 41.4 19 81
Ever during the
year
Frequency of occurrence
Condition2
Almost every month
Some months but not every month
In only 1 or 2
months
Almost every month
Some months but not every month
In only 1 or 2
months
—— Percent of all households ——Percent of
“ever during the year”
Adult(s) cut size of meals or skipped meals 96.7 44.9 43.5 8.3 46 45 9
Respondent ate less than felt he/she should 95.1 43.7 39.6 11.8 46 42 12
Respondent hungry but didn't eat because couldn't afford
67.7 27.9 28.8 10.9 41 43 16
Respondent lost weight 44.1 NA NA NA NA NA NA
Adult(s) did not eat for whole day 32.5 12.2 13.9 6.5 38 43 20
Cut size of child(ren)'s meals 29.8 11.6 14.0 4.2 39 47 14
Child(ren) were hungry 20.0 5.5 9.6 5.0 27 48 25
Child(ren) skipped meals 12.7 3.3 7.4 2.0 26 58 16
Child(ren) did not eat for whole day 3.2 NA NA NA NA NA NA
NA = Frequency of occurrence information was not collected for these conditions.1Survey responses weighted to population totals. Households not responding to an item or not responding to the followup question about frequency of occurrence are omitted from the calculation of percentages for that item. Households without children are omitted from the calculation of percentages for child-referenced items.2The full wording of each question includes explicit reference to resource limitation, e.g., “…because (I was/we were) running out of money to buy food,” or “…because there wasn’t enough money for food.”
Source: USDA, Economic Research Service using data from U.S. Department of Commerce, U.S. Census Bureau, 2016 Current Population Survey Food Security Supplement.
16 Statistical Supplement to Household Food Security in the United States in 2016, AP-077
Economic Research Service/USDA
Monthly and Daily Occurrence of Food-Insecure Conditions
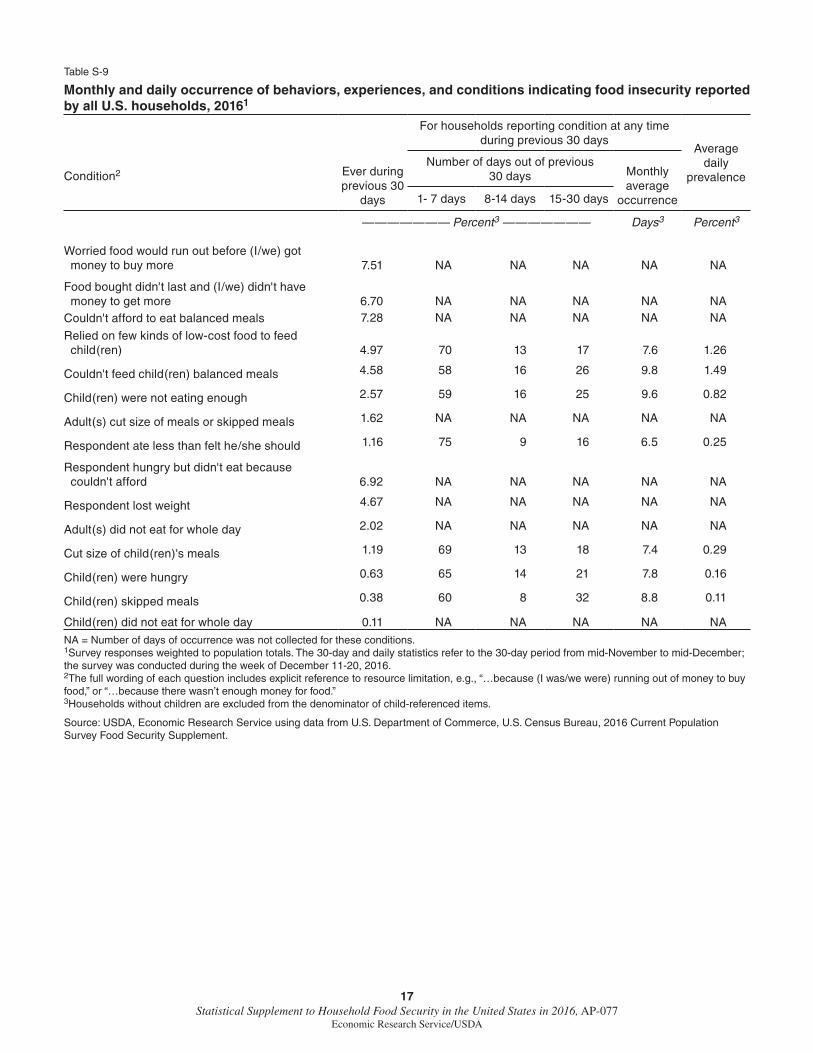
Respondents also reported whether the behaviors and experiences that indicate food insecurity had occurred during the 30 days prior to the survey. For seven of these behaviors and experiences, respondents also reported how many days the condition had occurred during that period. Responses to these questions are summarized in table S-9.6
No direct measure of the daily prevalence of very low food security has yet been developed. However, the ratio of daily prevalence to monthly prevalence of the various indicator conditions provides a basis for approximating the average daily prevalence of very low food security during the reference 30-day period. For adult-referenced items, the daily prevalence is calculated by multiplying the 30-day prevalence of the condition by the number of days on which that experience occurred, and dividing that product by 30 to get the average daily prevalence of each condition. The estimate of the daily prevalence of very low food security was based on the calculation of the average daily prevalence for the two conditions with the highest and lowest ratio of the daily prevalence divided by the monthly prevalence.
For the adult-referenced items, daily prevalence ranged from 22 to 33 percent of their prevalence at any time during the month (analysis not shown, based on table S-9). The corresponding range for daily prevalence of the child-referenced items was 24 to 29 percent of monthly prevalence. These findings are generally consistent with those of Nord et al. (2000) and are used to estimate upper and lower bounds of the daily prevalence of very low food security described in Household Food Security in the United States in 2016 (ERR-237).
6Average daily prevalence is calculated as the product of the 30-day prevalence and the average number of days di-vided by 30.
17 Statistical Supplement to Household Food Security in the United States in 2016, AP-077
Economic Research Service/USDA
Table S-9
Monthly and daily occurrence of behaviors, experiences, and conditions indicating food insecurity reported by all U.S. households, 20161
Ever during previous 30
days
For households reporting condition at any time during previous 30 days
Average daily
prevalenceCondition2Number of days out of previous
30 days Monthly average
occurrence 1- 7 days 8-14 days 15-30 days
——————— Percent3 ——————— Days3 Percent3
Worried food would run out before (I/we) got money to buy more 7.51 NA NA NA NA NA
Food bought didn't last and (I/we) didn't have money to get more 6.70 NA NA NA NA NACouldn't afford to eat balanced meals 7.28 NA NA NA NA NA
Relied on few kinds of low-cost food to feed child(ren) 4.97 70 13 17 7.6 1.26
Couldn't feed child(ren) balanced meals 4.58 58 16 26 9.8 1.49
Child(ren) were not eating enough 2.57 59 16 25 9.6 0.82
Adult(s) cut size of meals or skipped meals 1.62 NA NA NA NA NA
Respondent ate less than felt he/she should 1.16 75 9 16 6.5 0.25
Respondent hungry but didn't eat because couldn't afford 6.92 NA NA NA NA NA
Respondent lost weight 4.67 NA NA NA NA NA
Adult(s) did not eat for whole day 2.02 NA NA NA NA NA
Cut size of child(ren)'s meals 1.19 69 13 18 7.4 0.29
Child(ren) were hungry 0.63 65 14 21 7.8 0.16
Child(ren) skipped meals 0.38 60 8 32 8.8 0.11
Child(ren) did not eat for whole day 0.11 NA NA NA NA NA
NA = Number of days of occurrence was not collected for these conditions.1Survey responses weighted to population totals. The 30-day and daily statistics refer to the 30-day period from mid-November to mid-December; the survey was conducted during the week of December 11-20, 2016.2The full wording of each question includes explicit reference to resource limitation, e.g., “…because (I was/we were) running out of money to buy food,” or “…because there wasn’t enough money for food.”3Households without children are excluded from the denominator of child-referenced items.
Source: USDA, Economic Research Service using data from U.S. Department of Commerce, U.S. Census Bureau, 2016 Current Population Survey Food Security Supplement.
18 Statistical Supplement to Household Food Security in the United States in 2016, AP-077
Economic Research Service/USDA
Food Spending by Food-Secure and Food-Insecure Households
Food-secure households typically spent more on food than food-insecure households of similar age-gender composition. The pattern of higher median food spending relative to the cost of the Thrifty Food Plan by food-secure households was consistent across household structure, race and Hispanic ethnicity, income, residence, and geographic region (table S-10).

19 Statistical Supplement to Household Food Security in the United States in 2016, AP-077
Economic Research Service/USDA
Table S-10
Weekly household food spending relative to the cost of the Thrifty Food Plan (TFP) by food security status and selected household characteristics, 2016
Median weekly food spending relative to TFP1
Category Food secure Food insecureRatio (cost of TFP = 1.0)
All households 1.29 1.00
Household composition: With children < 18 yrs 1.16 0.96 At least one child < 6 yrs 1.17 1.00 Married-couple families 1.21 0.95 Female head, no spouse 1.06 0.96 Male head, no spouse 1.10 0.94 Other household with child2 1.02 NA With no children < 18 yrs 1.35 1.08 More than one adult 1.25 0.91 Women living alone 1.39 1.12 Men living alone 1.72 1.18 With elderly 1.21 0.94 Elderly living alone 1.35 1.12
Race/ethnicity of households: White, non-Hispanic 1.35 1.03 Black, non-Hispanic 1.11 0.94 Hispanic3 1.15 1.00 Other, non-Hispanic 1.26 1.00
Household income-to-poverty ratio: Under 1.00 0.97 0.92 Under 1.30 0.99 0.92 Under 1.85 1.05 0.96 1.85 and over 1.40 1.15 Income unknown 1.21 0.96
Area of residence:4
Inside metropolitan area 1.31 1.02 In principal cities5 1.33 1.04 Not in principal cities 1.32 1.00 Outside metropolitan area 1.15 0.97
Census geographic region: Northeast 1.33 1.12 Midwest 1.21 0.99 South 1.26 0.96 West 1.32 1.02
Note: These estimates are based on categorical food spending data rather than continuous data that were used in previous years. Beginning with the 2015 Current Population Survey Food Security Supplement, food spending amounts are categorized in public-use data. ERS analysis suggests that this change has little effect on the estimates of median food spending reported here. NA = Median not reported; fewer than 100 interviewed households in the category.1Statistics exclude households that did not answer the questions about spending on food or reported zero usual food spending and those that did not provide valid responses to any of the questions on food security. These exclusions represented 9 percent of all households.2Households with children in complex living arrangements, e.g., children of other relatives or unrelated roommate or boarder.3Hispanics may be of any race. 4Metropolitan area residence is based on 2013 Office of Management and Budget delineation. Prevalence rates by area of residence are comparable with those for 2014 and 2015 but are not precisely comparable with those of earlier years. 5Households within incorporated areas of the largest cities in each metropolitan area. Residence inside or outside of principal cities is not identified for about 15 percent of households in metropolitan statistical areas.
Source: USDA, Economic Research Service using data from U.S. Department of Commerce, U.S. Census Bureau, 2016 Current Population Survey Food Security Supplement.
20 Statistical Supplement to Household Food Security in the United States in 2016, AP-077
Economic Research Service/USDA
Use of Food Pantries and Emergency Kitchens
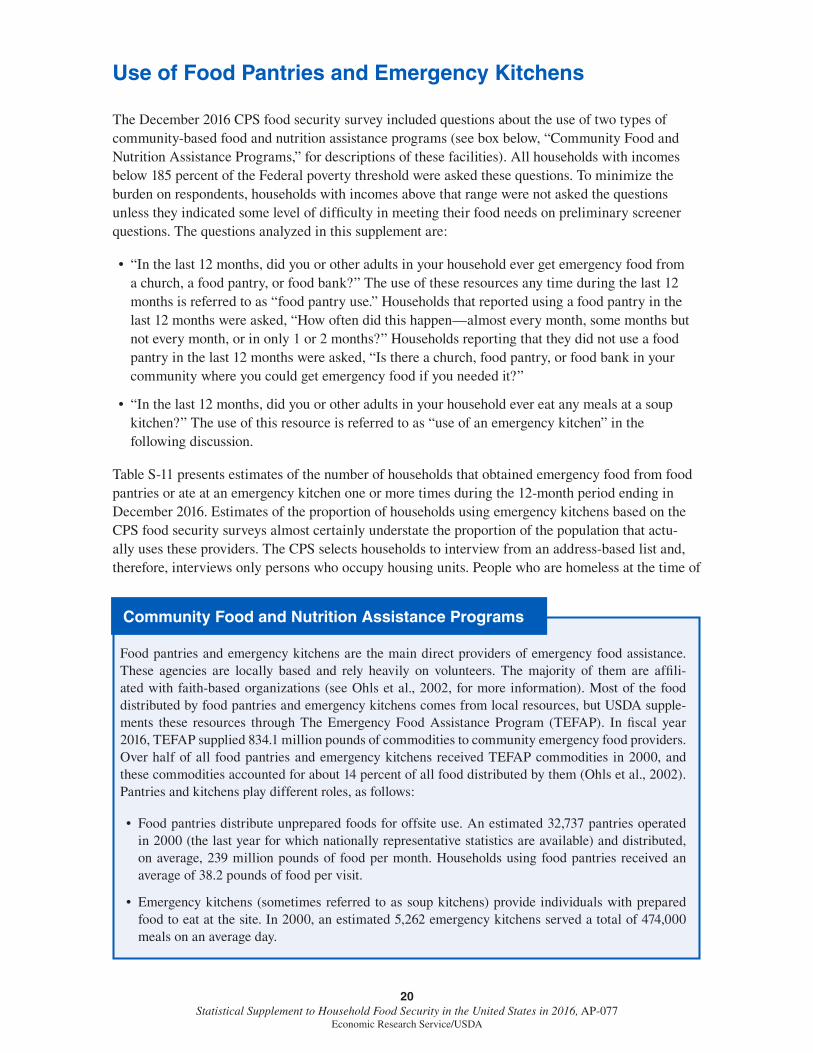
The December 2016 CPS food security survey included questions about the use of two types of community-based food and nutrition assistance programs (see box below, “Community Food and Nutrition Assistance Programs,” for descriptions of these facilities). All households with incomes below 185 percent of the Federal poverty threshold were asked these questions. To minimize the burden on respondents, households with incomes above that range were not asked the questions unless they indicated some level of difficulty in meeting their food needs on preliminary screener questions. The questions analyzed in this supplement are:
• “Inthelast12months,didyouorotheradultsinyourhouseholdevergetemergencyfoodfroma church, a food pantry, or food bank?” The use of these resources any time during the last 12 months is referred to as “food pantry use.” Households that reported using a food pantry in the last 12 months were asked, “How often did this happen—almost every month, some months but not every month, or in only 1 or 2 months?” Households reporting that they did not use a food pantry in the last 12 months were asked, “Is there a church, food pantry, or food bank in your community where you could get emergency food if you needed it?”
• “Inthelast12months,didyouorotheradultsinyourhouseholdevereatanymealsatasoupkitchen?” The use of this resource is referred to as “use of an emergency kitchen” in the following discussion.
Table S-11 presents estimates of the number of households that obtained emergency food from food pantries or ate at an emergency kitchen one or more times during the 12-month period ending in December 2016. Estimates of the proportion of households using emergency kitchens based on the CPS food security surveys almost certainly understate the proportion of the population that actu-ally uses these providers. The CPS selects households to interview from an address-based list and, therefore, interviews only persons who occupy housing units. People who are homeless at the time of
Food pantries and emergency kitchens are the main direct providers of emergency food assistance. These agencies are locally based and rely heavily on volunteers. The majority of them are affili-ated with faith-based organizations (see Ohls et al., 2002, for more information). Most of the food distributed by food pantries and emergency kitchens comes from local resources, but USDA supple-ments these resources through The Emergency Food Assistance Program (TEFAP). In fiscal year 2016, TEFAP supplied 834.1 million pounds of commodities to community emergency food providers. Over half of all food pantries and emergency kitchens received TEFAP commodities in 2000, and these commodities accounted for about 14 percent of all food distributed by them (Ohls et al., 2002). Pantries and kitchens play different roles, as follows:
• Foodpantriesdistributeunpreparedfoodsforoffsiteuse.Anestimated32,737pantriesoperatedin 2000 (the last year for which nationally representative statistics are available) and distributed, on average, 239 million pounds of food per month. Households using food pantries received an average of 38.2 pounds of food per visit.
• Emergencykitchens(sometimesreferredtoassoupkitchens)provideindividualswithpreparedfood to eat at the site. In 2000, an estimated 5,262 emergency kitchens served a total of 474,000 meals on an average day.
Community Food and Nutrition Assistance Programs
21 Statistical Supplement to Household Food Security in the United States in 2016, AP-077
Economic Research Service/USDA
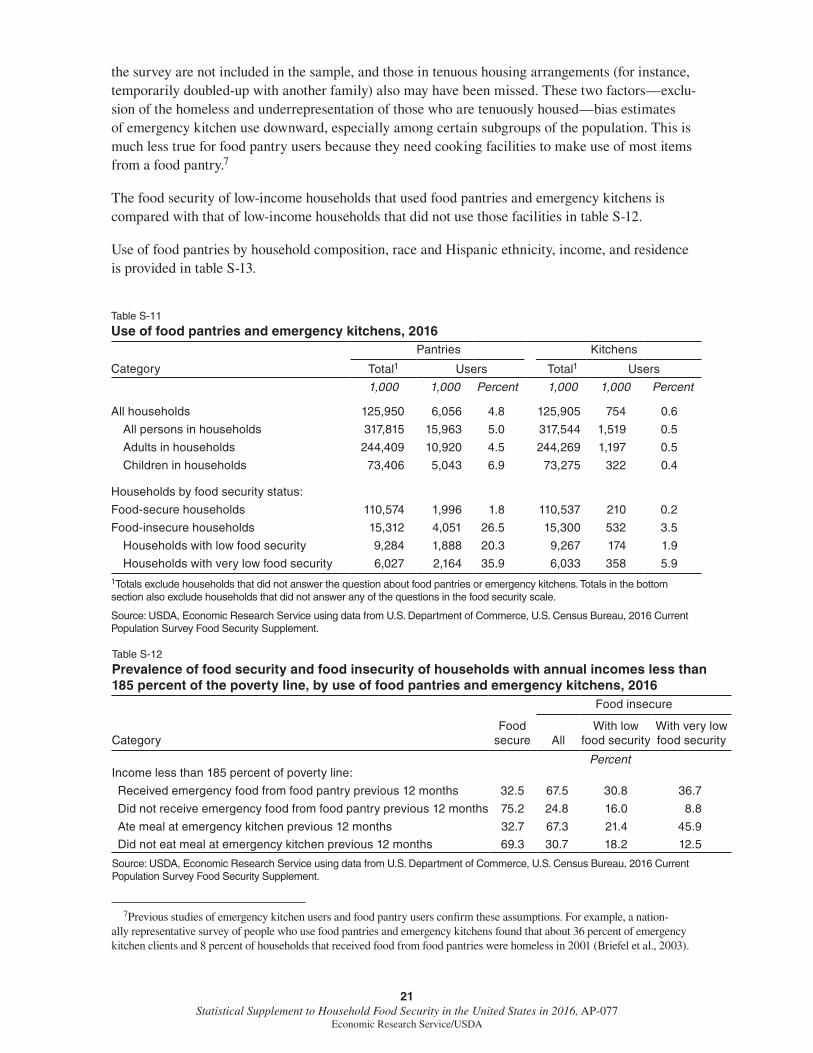
the survey are not included in the sample, and those in tenuous housing arrangements (for instance, temporarily doubled-up with another family) also may have been missed. These two factors—exclu-sion of the homeless and underrepresentation of those who are tenuously housed—bias estimates of emergency kitchen use downward, especially among certain subgroups of the population. This is much less true for food pantry users because they need cooking facilities to make use of most items from a food pantry.7
The food security of low-income households that used food pantries and emergency kitchens is compared with that of low-income households that did not use those facilities in table S-12.
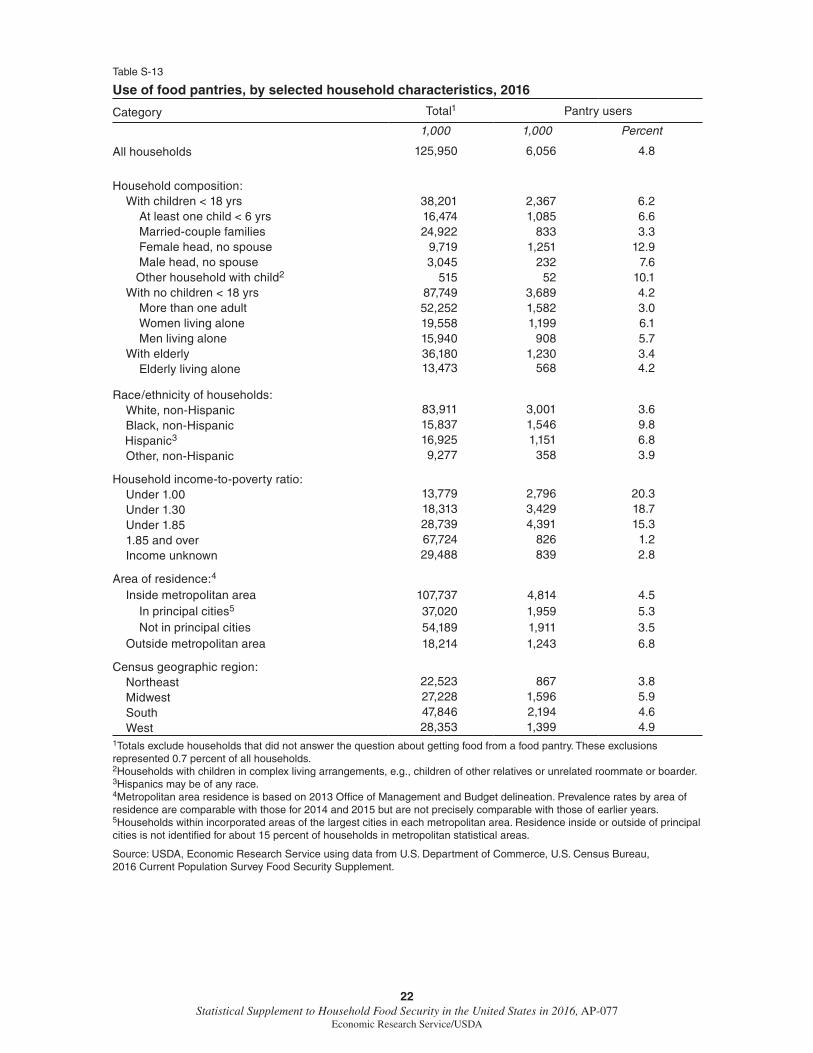
Use of food pantries by household composition, race and Hispanic ethnicity, income, and residence is provided in table S-13.
Table S-11
Use of food pantries and emergency kitchens, 2016Pantries Kitchens
Category Total1 Users Total1 Users
1,000 1,000 Percent 1,000 1,000 Percent
All households 125,950 6,056 4.8 125,905 754 0.6
All persons in households 317,815 15,963 5.0 317,544 1,519 0.5
Adults in households 244,409 10,920 4.5 244,269 1,197 0.5
Children in households 73,406 5,043 6.9 73,275 322 0.4
Households by food security status:
Food-secure households 110,574 1,996 1.8 110,537 210 0.2
Food-insecure households 15,312 4,051 26.5 15,300 532 3.5
Households with low food security 9,284 1,888 20.3 9,267 174 1.9
Households with very low food security 6,027 2,164 35.9 6,033 358 5.91Totals exclude households that did not answer the question about food pantries or emergency kitchens. Totals in the bottom section also exclude households that did not answer any of the questions in the food security scale.
Source: USDA, Economic Research Service using data from U.S. Department of Commerce, U.S. Census Bureau, 2016 Current Population Survey Food Security Supplement.
Table S-12
Prevalence of food security and food insecurity of households with annual incomes less than 185 percent of the poverty line, by use of food pantries and emergency kitchens, 2016
Food secure
Food insecure
Category AllWith low
food securityWith very low food security
PercentIncome less than 185 percent of poverty line:
Received emergency food from food pantry previous 12 months 32.5 67.5 30.8 36.7
Did not receive emergency food from food pantry previous 12 months 75.2 24.8 16.0 8.8
Ate meal at emergency kitchen previous 12 months 32.7 67.3 21.4 45.9
Did not eat meal at emergency kitchen previous 12 months 69.3 30.7 18.2 12.5
Source: USDA, Economic Research Service using data from U.S. Department of Commerce, U.S. Census Bureau, 2016 Current Population Survey Food Security Supplement.
7Previous studies of emergency kitchen users and food pantry users confirm these assumptions. For example, a nation-ally representative survey of people who use food pantries and emergency kitchens found that about 36 percent of emergency kitchen clients and 8 percent of households that received food from food pantries were homeless in 2001 (Briefel et al., 2003).
22 Statistical Supplement to Household Food Security in the United States in 2016, AP-077
Economic Research Service/USDA
Table S-13
Use of food pantries, by selected household characteristics, 2016
Category Total1 Pantry users
1,000 1,000 Percent
All households 125,950 6,056 4.8
Household composition: With children < 18 yrs 38,201 2,367 6.2 At least one child < 6 yrs 16,474 1,085 6.6 Married-couple families 24,922 833 3.3 Female head, no spouse 9,719 1,251 12.9 Male head, no spouse 3,045 232 7.6 Other household with child2 515 52 10.1 With no children < 18 yrs 87,749 3,689 4.2 More than one adult 52,252 1,582 3.0 Women living alone 19,558 1,199 6.1 Men living alone 15,940 908 5.7 With elderly 36,180 1,230 3.4 Elderly living alone 13,473 568 4.2
Race/ethnicity of households: White, non-Hispanic 83,911 3,001 3.6 Black, non-Hispanic 15,837 1,546 9.8 Hispanic3 16,925 1,151 6.8 Other, non-Hispanic 9,277 358 3.9
Household income-to-poverty ratio: Under 1.00 13,779 2,796 20.3 Under 1.30 18,313 3,429 18.7 Under 1.85 28,739 4,391 15.3 1.85 and over 67,724 826 1.2 Income unknown 29,488 839 2.8 Income unknown
Area of residence:4
Inside metropolitan area 107,737 4,814 4.5 In principal cities5 37,020 1,959 5.3 Not in principal cities 54,189 1,911 3.5 Outside metropolitan area 18,214 1,243 6.8
Census geographic region: Northeast 22,523 867 3.8 Midwest 27,228 1,596 5.9 South 47,846 2,194 4.6 West 28,353 1,399 4.91Totals exclude households that did not answer the question about getting food from a food pantry. These exclusions represented 0.7 percent of all households.2Households with children in complex living arrangements, e.g., children of other relatives or unrelated roommate or boarder.3Hispanics may be of any race. 4Metropolitan area residence is based on 2013 Office of Management and Budget delineation. Prevalence rates by area of residence are comparable with those for 2014 and 2015 but are not precisely comparable with those of earlier years. 5Households within incorporated areas of the largest cities in each metropolitan area. Residence inside or outside of principal cities is not identified for about 15 percent of households in metropolitan statistical areas.
Source: USDA, Economic Research Service using data from U.S. Department of Commerce, U.S. Census Bureau, 2016 Current Population Survey Food Security Supplement.
23 Statistical Supplement to Household Food Security in the United States in 2016, AP-077
Economic Research Service/USDA
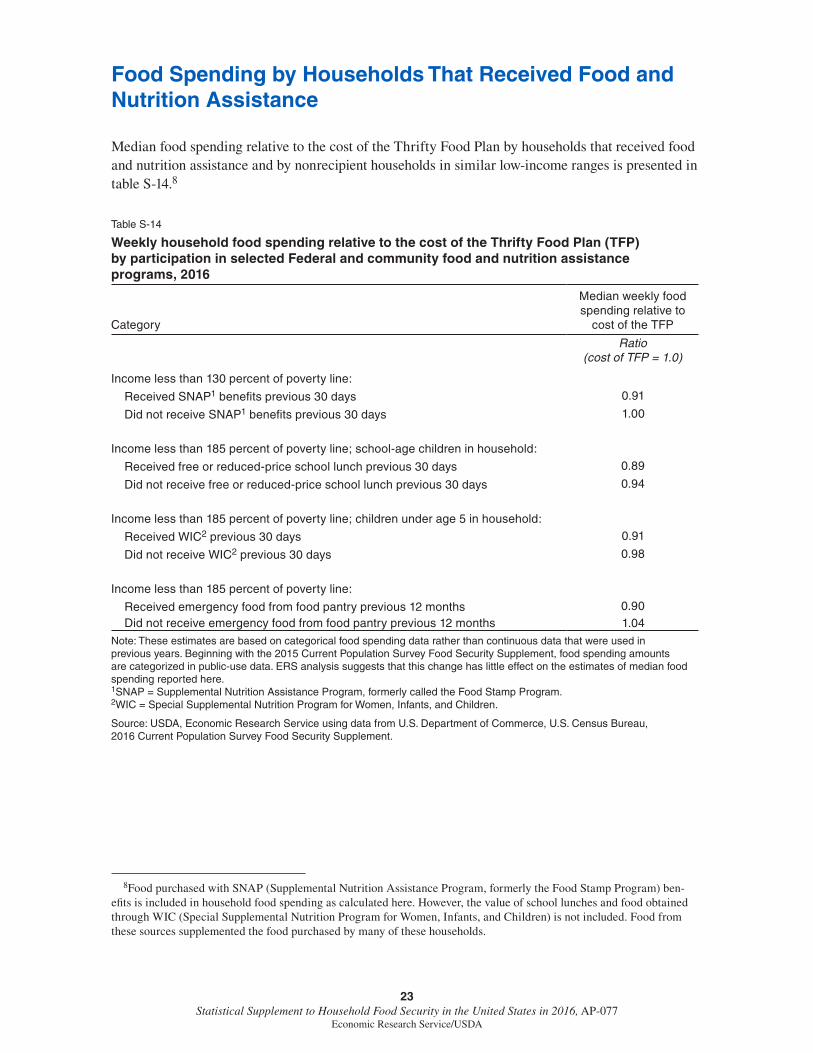
Food Spending by Households That Received Food and Nutrition Assistance
Median food spending relative to the cost of the Thrifty Food Plan by households that received food and nutrition assistance and by nonrecipient households in similar low-income ranges is presented in table S-14.8
Table S-14
Weekly household food spending relative to the cost of the Thrifty Food Plan (TFP) by participation in selected Federal and community food and nutrition assistance programs, 2016
Category
Median weekly food spending relative to
cost of the TFP
Ratio (cost of TFP = 1.0)
Income less than 130 percent of poverty line:
Received SNAP1 benefits previous 30 days 0.91
Did not receive SNAP1 benefits previous 30 days 1.00
Income less than 185 percent of poverty line; school-age children in household:
Received free or reduced-price school lunch previous 30 days 0.89
Did not receive free or reduced-price school lunch previous 30 days 0.94
Income less than 185 percent of poverty line; children under age 5 in household:
Received WIC2 previous 30 days 0.91
Did not receive WIC2 previous 30 days 0.98
Income less than 185 percent of poverty line:
Received emergency food from food pantry previous 12 months 0.90 Did not receive emergency food from food pantry previous 12 months 1.04
Note: These estimates are based on categorical food spending data rather than continuous data that were used in previous years. Beginning with the 2015 Current Population Survey Food Security Supplement, food spending amounts are categorized in public-use data. ERS analysis suggests that this change has little effect on the estimates of median food spending reported here.1SNAP = Supplemental Nutrition Assistance Program, formerly called the Food Stamp Program.2WIC = Special Supplemental Nutrition Program for Women, Infants, and Children.
Source: USDA, Economic Research Service using data from U.S. Department of Commerce, U.S. Census Bureau, 2016 Current Population Survey Food Security Supplement.
8Food purchased with SNAP (Supplemental Nutrition Assistance Program, formerly the Food Stamp Program) ben-efits is included in household food spending as calculated here. However, the value of school lunches and food obtained through WIC (Special Supplemental Nutrition Program for Women, Infants, and Children) is not included. Food from these sources supplemented the food purchased by many of these households.
24 Statistical Supplement to Household Food Security in the United States in 2016, AP-077
Economic Research Service/USDA
Food Security During the 30 Days Prior to the Food Security Survey in Households That Received Food and Nutrition Assistance
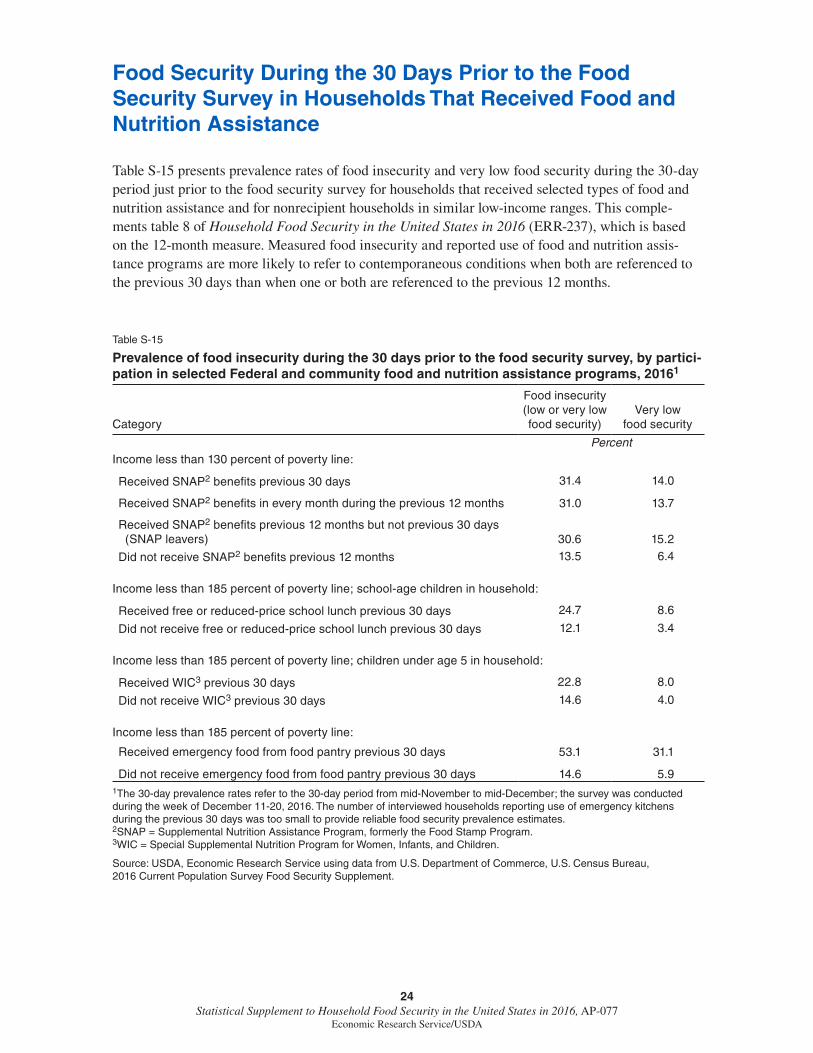
Table S-15 presents prevalence rates of food insecurity and very low food security during the 30-day period just prior to the food security survey for households that received selected types of food and nutrition assistance and for nonrecipient households in similar low-income ranges. This comple-ments table 8 of Household Food Security in the United States in 2016 (ERR-237), which is based on the 12-month measure. Measured food insecurity and reported use of food and nutrition assis-tance programs are more likely to refer to contemporaneous conditions when both are referenced to the previous 30 days than when one or both are referenced to the previous 12 months.
Table S-15
Prevalence of food insecurity during the 30 days prior to the food security survey, by partici-pation in selected Federal and community food and nutrition assistance programs, 20161
Category
Food insecurity (low or very low food security)
Very low food security
PercentIncome less than 130 percent of poverty line:
Received SNAP2 benefits previous 30 days 31.4 14.0
Received SNAP2 benefits in every month during the previous 12 months 31.0 13.7
Received SNAP2 benefits previous 12 months but not previous 30 days (SNAP leavers) 30.6 15.2
Did not receive SNAP2 benefits previous 12 months 13.5 6.4
Income less than 185 percent of poverty line; school-age children in household:
Received free or reduced-price school lunch previous 30 days 24.7 8.6
Did not receive free or reduced-price school lunch previous 30 days 12.1 3.4
Income less than 185 percent of poverty line; children under age 5 in household:
Received WIC3 previous 30 days 22.8 8.0
Did not receive WIC3 previous 30 days 14.6 4.0
Income less than 185 percent of poverty line:
Received emergency food from food pantry previous 30 days 53.1 31.1
Did not receive emergency food from food pantry previous 30 days 14.6 5.91The 30-day prevalence rates refer to the 30-day period from mid-November to mid-December; the survey was conducted during the week of December 11-20, 2016. The number of interviewed households reporting use of emergency kitchens during the previous 30 days was too small to provide reliable food security prevalence estimates.2SNAP = Supplemental Nutrition Assistance Program, formerly the Food Stamp Program.3WIC = Special Supplemental Nutrition Program for Women, Infants, and Children.
Source: USDA, Economic Research Service using data from U.S. Department of Commerce, U.S. Census Bureau, 2016 Current Population Survey Food Security Supplement.

25 Statistical Supplement to Household Food Security in the United States in 2016, AP-077
Economic Research Service/USDA
Combined Use of Federal and Community Food and Nutrition Assistance
Both Federal and community food and nutrition assistance programs are important resources for low-income households. To design and manage these programs so that they function together effectively as a nutrition safety net, it is important to know how they complement and supplement each other. The extent to which households that participate in Federal food and nutrition assistance programs also receive assistance from community food assistance programs provides information about these relationships (table S-16).
Table S-16
Combined use of Federal and community food and nutrition assistance programs by low-income households,1 2016
Category
Share of category that obtained food
from food pantry
Share of food pantry users in category
Share of category that ate meal at emergency
kitchen
Share of emergency
kitchen users in category
Percent
Received SNAP2 benefits previous 30 days 29.7 53.0 4.0 58.1
Received free or reduced-price school lunch previous 30 days 20.9 29.5 1.4 15.8
Received WIC3 previous 30 days 21.7 10.2 NA NA
Participated in one or more of the three Federal programs 24.5 65.3 2.9 62.5
Did not participate in any of the three Federal programs 9.0 34.8 1.2 37.5
NA = Not reported; fewer than 10 households in the survey reported receipt of WIC and use of an emergency kitchen.1Analysis is restricted to households with annual incomes less than 185 percent of the poverty line because most households with incomes above that range were not asked whether they participated in food assistance programs.2SNAP = Supplemental Nutrition Assistance Program, formerly the Food Stamp Program.3WIC = Special Supplemental Nutrition Assistance Program for Women, Infants, and Children.
Source: USDA, Economic Research Service using data from U.S. Department of Commerce, U.S. Census Bureau, 2016 Current Population Survey Food Security Supplement.
26 Statistical Supplement to Household Food Security in the United States in 2016, AP-077
Economic Research Service/USDA
References
Anderson, S.A. (ed.). 1990. “Core Indicators of Nutritional State for Difficult-To-Sample Populations,” Journal of Nutrition 120(11S):1557-1600. Report by the Life Sciences Research Office, Federation of American Societies for Experimental Biology, for the American Institute of Nutrition.
Briefel, R., J. Jacobson, N. Clusen, T. Zavitsky, M. Satake, B. Dawsen, and R. Cohen. 2003. The Emergency Food Assistance System—Findings From the Client Survey, E-FAN-03-007, prepared by Mathematica Policy Research, Inc., for USDA, Economic Research Service.
Cohen, Barbara, Mark Nord, Robert Lerner, James Parry, and Kenneth Yang. 2002. Household Food Security in the United States, 1998 and 1999: Technical Report, E-FAN-02-010, prepared by IQ Solutions and USDA, Economic Research Service.
Coleman-Jensen, Alisha, Matthew P. Rabbitt, Christian A. Gregory, and Anita Singh. 2016. Statistical Supplement to Household Food Security in the United States in 2015, AP-072, USDA, Economic Research Service.
Coleman-Jensen, Alisha, Matthew P. Rabbitt, Christian A. Gregory, and Anita Singh. 2017. Household Food Security in the United States in 2016, ERR-237, USDA, Economic Research Service.
Gundersen, Craig, and Joseph Gruber. 2001. “The Dynamic Determinants of Food Insecurity,” Margaret Andrews and Mark Prell (eds.), Second Food Security Measurement and Research Conference, Volume II: Papers, FANRR-11-2, pp. 92-110. USDA, Economic Research Service.
Nord, Mark, Margaret Andrews, and F. Joshua Winicki. 2000. Frequency and Duration of Food Insecurity and Hunger in U.S. Households, presentation at the Fourth International Conference on Dietary Assessment Methods, Tucson, AZ, September 17-20, 2000.
Nord, Mark, and C. Philip Brent. 2002. Food Insecurity in Higher Income Households, E-FAN-02-016, USDA, Economic Research Service.
Nord, Mark, and Linda S. Kantor. 2006. “Seasonal Variation in Food Insecurity Is Associated with Heating and Cooling Costs among Low-Income Elderly Americans,” Journal of Nutrition 136:2939-44.
Nord, Mark, and Kathleen Romig. 2006. “Hunger in the Summer: Seasonal Food Insecurity and the National School Lunch and Summer Food Service Programs,” Journal of Children and Poverty 12(2):141-58.
Ohls, James, Fazana Saleem-Ismail, Rhoda Cohen, and Brenda Cox. 2002. The Emergency Food Assistance System Study—Findings From the Provider Survey, Volume II: Final Report, FANRR-16-2, prepared by Mathematica Policy Research, Inc., for USDA, Economic Research Service.
Radimer, Kathy L., and Mark Nord. 2005. “Associations of Household, Adult, and Child Food Security with Health Conditions: National Health and Nutrition Examination Survey (NHANES) 1999-2002,” presentation at the Experimental Biology annual research conference San Diego, CA, March 31-April 5, 2005.
27 Statistical Supplement to Household Food Security in the United States in 2016, AP-077
Economic Research Service/USDA
Wilde, Parke E., and Jerusha N. Peterman. 2006. “Individual Weight Change Is Associated with Household Food Security Status,” Journal of Nutrition 136:1395-1400.
Winicki, Joshua, and Kyle Jemison. 2003. “Food Insecurity and Hunger in the Kindergarten Classroom: Its Effect on Learning and Growth,” Contemporary Economic Policy 21(2):145-56.