The State Ownership Report 2019 - Regjeringen.no
152
2019 The State Ownership Report
Transcript of The State Ownership Report 2019 - Regjeringen.no
2019
The State Ownership Report


Category
1Goal of the highest possible return over time and where the State no longer has a rationale for its ownership
Category
2
Contents
The Minister’s introduction 7Scope and key figures 8Key issues for the State as owner 16How the State exercises its ownership 22A sustainable portfolio for long-term value creation 34
Goal of the highest possible return over time and where the State has a special rationale for its ownership
Ambita AS 42Baneservice AS 43Entra ASA 44Flytoget AS 45Giek kredittforsikring AS 46Mesta AS 47
Aker Kværner Holding AS 50Argentum Fondsinvesteringer AS 51DNB ASA 52Eksportfinans Norway ASA 53Electronic chart centre AS 54Equinor ASA 55Investinor AS 56Kommunalbanken AS 57Kongsberg Gruppen ASA 58Mantena AS 59Nammo AS 60Norsk Hydro ASA 61Nysnø Klimainvesteringer AS 62Posten Norge AS 63Statkraft SF 64Telenor ASA 65Vygruppen AS 66Yara International ASA 67

AppendicesThe companies’ reporting on the State’s expectations 122The companies' reporting standards and sustainability guidelines 128Remuneration to the board and auditors for 2019 132Remuneration to the CEO for 2019 134Gender balance on the board and in management 136Owner-appointed and shareholder-elected board members 142
Contact details 148Comments and definitions 150
Category
3Goal of the most efficient possible attainment of public policy goals
Companies that are not categorised
Andøya Space Center AS 70Avinor AS 71Bane Nor SF 72Bjørnøen AS 73Carte Blanche AS 74Den Nationale Scene 75Andøya Space Center AS 76Den Norske Opera & Ballett AS 76Avinor AS 77Eksportkreditt Norge AS 77Enova 78Entur AS 79Fiskeri- og havbruksnæringens forskningsfinansiering AS 80Gassco AS 81Gassnova SF 82Graminor AS 83Helse Midt-Norge RHF 84Helse Nord RHF 85Helse Sør-Øst RHF 86Helse Vest 87Innovasjon Norge 88Kimen Såvarelaboratoriet AS 89Kings bay 90Nationaltheatret AS 91Nofima AS 92Norsk Institutt for Odontologiske Materialer AS 93Norfund 94Norges Sjømatråd 95Norsk Helsenett SF 96Norsk rikskringkasting AS 97Norsk Tipping 98Norske tog AS 99Norsk senter for forskningsdata AS 100Nye veier AS 101Petoro AS 102Rogaland teater AS 103
Simula Research Laboratory AS 104Siva – Selskapet for Industrivekst SF 105Space Norway AS 106Statnett SF 107Statskog SF 108Staur gård AS 109Store Norske Spitsbergen Kulkompani AS 110Talent Norge AS 111Trøndelag Teater AS 112Universitetssenteret på Svalbard AS 113Vinmonopolet AS 114
Filmparken AS 118Folketrygdfondet 119Rosenkrantzgate 10 AS 119Rygge 1 AS 119

. ...
As an owner, we are focused on the companies being transparent on material matters relating to the company’s operations. Good reporting provides insight into the company's ability to create value. This is either in the form of returns or efficient attainment of public policy goals in both the short and long term.
The State’s direct ownership is extensive and diverse. Twelve ministries manage the State’s ownership interests in 73 companies. This takes place on behalf of the Norwegian people, and transparency and trust are the cornerstones of the State’s ownership in these companies. The State’s Ownership Report is an annual report of the State’s direct ownership and allows you to read about the strategies, performance, financial development and important events for the respective companies in 2019.
In November 2019, the Government presented a new White Paper on Ownership. Report to the Storting no. 8 (2019–2020), The State's direct ownership in companies – Sustainable value creation, was considered by the Storting in April 2020. This update of the State's ownership policy is not a revolution, but rather an evolution that facilitates value creation for the companies both now and into the future. There are fixed frameworks for how the State exercises ownership. Within these frameworks, we have further developed and clarified the policy to help the companies better attain their goals.
The State’s goals as owner are the highest possible return over time or most efficient possible attainment of public policy goals. This requires the companies to be sustainable. Companies that understand and manage development trends in society, including both risks and opportunities, will have a competitive advantage that contributes to longterm value creation.
NRK, Simula, Statkraft, Posten Norge, Kommunalbanken and Ambita have provided brief overviews of how they are working to develop their business strategies in line with important development trends in society. I find these examples to be interesting, innovative and inspiring and hope more people can derive enjoyment from them.
As an owner, we are focused on the companies being transparent on material matters relating to the company’s operations. Good reporting provides insight into the company's ability to create value. This is either in the form of returns or efficient attainment of public policy goals in both the short and long term.
Iselin NybøMinister of Trade and Industry
Insight into the company's activities is a prerequisite for good ownership, and reporting can be a impetus for the companies better attaining their goals. This year’s ownership report lists the goals and goal attainment for more companies than before. The seven listed companies in which the State is a part owner had a return of 3.9 per cent in 2019, compared with 3.2 per cent in 2018. In comparison, the Oslo Stock Exchange Benchmark Index had a return of 16.5 per cent in 2019 and 1.8 per cent in 2018. The nonlisted companies which have the objective of making a return, had a return on equity of 9.1 per cent in 2019, compared with 11.0 per cent in 2018.
At the time of writing, the Government has been busy dealing with the Corona situation. The ministries that manage state ownership are closely monitoring the situation and have ongoing dialogue with the companies. Several of the companies in which the State is an owner have activities that contribute to maintaining production and services that are of critical importance to society. At the same time, several of the companies in the portfolio have experienced significant falls in value and have given notice of and, in some instances carried out, extensive layoffs. The companies within the oil and gas industry and transport sector have been particularly hard hit. The boards in each of the companies must assess the situation and the need for various measures.
I would like to thank all of the boards and all of the employees in the companies in which the State has ownership interests. Your year-round efforts are an important contribution to the Norwegian economy and national welfare. Many of you are now in a challenging period. Both myself and the Government will do our part to ensure that the business sector and Norwegian society get through this crisis as best as possible.
I hope you find this report informative and useful!
The Minister’s introduction
7

Scope and key figures
The following is an overview of the 73 companies in which the State has full or part ownership and key figures for these companies in 2019. The companies have been divided into three categories based on the State's goals as owner and whether the State has a rationale for its ownership. For the companies in Categories 1 and 2, the State’s goal as owner is the highest possible return over time. These are companies that primarily operate in competition with other companies. For companies in Category 3, the State’s goal as owner is the most efficient possible attainment of public policy goals. These are companies that do not primarily operate in competition with other companies.
Category 1
The State no longer has a rationale for its ownership.
Category 2The State has a special rationale for its ownership
Category 3
Goal of the highest possible return over time
Goal of the most efficient possible attainment of public policy goals
9
Photo: Ole Jørgen Bratland

The graph shows the development in the value of the State's ownership interests, divided among companies where the state’s goal is the highest possible return over time (Categories 1 and 2) and the companies where the State’s goal is the most efficient possible attainment of public policy goals (Category 3). The amounts are calculated based on the market value of the listed companies and the book value of the non-listed and public policy companies.
Overview of the State's direct ownership Key figures 2019*
Value of the State’s ownership interests in companies with state ownership
NOK billion
Statkraft: 94
DNB: 88
Helse Sør-Øst: 39
Yara International: 36
Norsk Hydro: 23
Norfund: 23
Statnett: 18
Kommunalbanken: 16
Other companies: 121
Equinor: 393
Telenor: 123
974 mrd. kroner
Value development in the portfolio in the past five years
NOK billion
Category 1 and 2 Category 3
115 644
1
200
400
600
800
1 000
1 200
2015 2016 2017 2018 2019
122 715
143 843
151 834
157 817
The value of the State's ownership interest is calculated based on the market value of the listed companies and the book value of the nonlisted and public policy companies.
73Number of companies
(73)
41.5 billionDividend to the State
(45.7 billion)
9.1%Return on equity from non-listed companies
(11.0%)
287,727Number of employees
(280,550)
3.9%Return from listed companies
(3,2%)
* See definitions on page 150. The figures are to be considered estimates that may be revised at a later date.** Categories 1 and 2 () The figures in brackets on this page show the figures for 2018.
183 billionPurchases by/subsidies from
the public sector:(172 billion)
1,378 billionOperating revenues
(1,422 billion)
20%Equity ratio**
(21%)
Scope and key figures10

Overview of the State's direct ownership by ministry as of May 2020
Ministry and company Category Ownership interest
Ministry of Finance
Folketrygdfondet (speciallegislation company) 100%
Ministry of Defence
Rygge 1 AS 100%
Ministry of Health and Care Services
Helse MidtNorge RHF (speciallegislation company)
3 100%
Helse Nord RHF (speciallegislation company) 3 100%
Helse SørØst RHF (speciallegislation company) 3 100%
Helse Vest RHF (speciallegislation company) 3 100%
Nordisk Institutt for Odontologiske Materialer AS 3 49%
Norsk Helsenett SF 3 100%
AS Vinmonopolet (speciallegislation company) 3 100%
Ministry of Climate and Environment
Bjørnøen AS 3 100%
Enova SF 3 100%
Kings Bay AS 3 100%
Ministry of Local Government and Modernisation
Kommunalbanken AS 2 100%
Ministry of Culture
Carte Blanche AS 3 70%
AS Den Nationale Scene 3 66.67%
Den Norske Opera & Ballett AS 3 100%
Filmparken AS 77.6%
Nationaltheatret AS 3 100%
Norsk rikskringkasting AS 3 100%
Norsk Tipping AS (speciallegislation company) 3 100%
Rogaland Teater AS 3 66.67%
Rosenkrantzgate 10 AS 3.07%
Talent Norge AS 3 33.3%
Trøndelag Teater AS 3 66.67%
Ministry of Education and Research
NSD – Norsk senter for forskningsdata AS 3 100%
Simula Research Laboratory AS 3 100%
Universitetssenteret på Svalbard AS 3 100%
Ministry of Agriculture and Food
Graminor AS 3 28.2%
Kimen Såvarelaboratoriet AS 3 51%
Statskog SF 3 100%
Staur gård AS 3 100%
Ministry of Trade, Industry and Fisheries
Aker Kværner Holding AS 2 30%
Ambita AS 1 100%
Andøya Space Center AS 3 90%
Ministry and company Category Ownership interest
Argentum Fondsinvesteringer AS 2 100%
Baneservice AS 1 100%
DNB ASA 2 34%
Eksportfinans ASA 2 15%
Eksportkreditt Norge AS 3 100%
Electronic Chart Centre AS 2 100%
Entra ASA 1 8.24%
Fiskeri og havbruksnæringens forskningsfinansiering AS 3 100%
Flytoget AS 1 100%
GIEK Kredittforsikring AS 1 100%
Innovasjon Norge (speciallegislation company) 3 51%
Investinor AS 2 100%
Kongsberg Gruppen ASA 2 50.001%
Mantena AS 2 100%
Mesta AS 1 100%
Nammo AS 2 50%
Nofima AS 3 56.8%
Norges sjømatråd AS 3 100%
Norsk Hydro ASA 2 34.26%
Nysnø Klimainvesteringer AS 2 100%
Posten Norge AS 2 100%
Siva – Selskapet for Industrivekst SF 3 100%
Space Norway AS 3 100%
Statkraft SF 2 100%
Store Norske Spitsbergen Kulkompani AS 3 100%
Telenor ASA 2 53.97%
Yara International ASA 2 36.21%
Ministry of Petroleum and Energy
Equinor ASA 2 67%
Gassco AS 3 100%
Gassnova SF 3 100%
Petoro AS 3 100%
Statnett SF 3 100%
Ministry of Transport
Avinor AS 3 100%
Bane NOR SF 3 100%
Entur AS 3 100%
Norske tog AS 3 100%
Nye Veier AS 3 100%
Vygruppen AS 2 100%
Ministry of Foreign Affairs
Norfund (speciallegislation company) 3 100%
Scope and key figures 11
THE STATEOWNERSHIP
REPORT2019

For companies in Categories 1 and 2, the State’s goal is the highest possible return over time. For the companies in Category 1, the State no longer has any rationale for its ownership, while for the companies in Category 2, the State has a special rationale for its ownership. A total of six companies are in Category 1 and 18 companies are in Category 2. There are listed companies in both categories.
Return in 2019 – and in the past five years*
0 2 4 6 8 10 12 14 16 18
Return 2019
Average annual return, last five years
The listed companies
Oslo Børsindeks
The listed companies
Oslo Stock Exchangeindex
Return from listed companies*
Return 2019 Average return on Oslo Stock Exchange, last five years
Average annual return, last five years
-10 %
0 %
10 %
20 %
30 %Entra
DN
B
Equinor
Telenor
Oslo Stock
Exchange index
Norsk
Hydro
KongsbergG
ruppen
YaraInterntaional
Return on equity from non-listed companies
Return on equity 2019
-40 %
-30 %
-20 %
-10 %
0 %
10 %
20 %
30 %
40 %
50 %
Flytoget
Mantena
Baneservice
Statkraft
Vygruppen
Komm
unalbanken
Argentum
Fondsinvesteringer
Investinor
Nam
mo
Electronic Chart Centre
Aker Kværner H
olding
Mesta
Ambita
Eksportfinans
Posten Norge
Nysnø Klim
ainvesteringer
GIEK Kredittforsikring
Average annual return on equity, last five years
Dividend to the StateNOK million
Dividend to the State 2019
0
5 000
10 000
15 000
20 000
25 000
DN
B*
Yara International
Norsk H
ydro*
Other com
panies
Argentum
Fondsinvesteringer*
Equinor
Telenor
Statkraft
Average annual dividend to the State, last five years See page 13 for remarks concerning dividends *
*Source: FactSet
Companies in category
1and2
Scope and key figures12

Non-listed companies Category The State’s ownership
interest
Book value of State's
ownership interest **
Return on
equity
Operating revenues
Result after
tax and minority interests
Dividend to the State
Number of employees
Statkraft SF 2 100% 93,795 12.3% 29,415 11,012 6,454 3,973
Kommunalbanken AS 2 100% 16,401 9.5% 8,817 1,283 0 85
Argentum Fondsinvesteringer AS 2 100% 8,394 8.0% 763 706 0** 25
Posten Norge AS 2 100% 6,297 0.0% 24,212 2 0 14,270
Vygruppen AS 2 100% 4,873 12.0% 17,065 564 0 11,666
Investinor AS 2 100% 3,249 7.0% 263 222 0 20
Aker Kværner Holding AS 2 30% 1,518 32.8% 1,988 0
Nammo AS 2 50% 1,389 7.0% 5,073 192 *** 2,404
Eksportfinans ASA 2 15% 970 2.0% 229 106 16 22
Flytoget AS 1 100% 915 42.6% 1,002 349 0 334
Nysnø Klimainvesteringer AS 2 100% 711 1.0% 17 2 0 9
Mesta AS 1 100% 433 34.7% 4,316 182 0 1,630
Mantena AS 2 100% 390 27.9% 1,571 75 0 958
Baneservice AS 1 100% 280 14.0% 1,239 37 9 668
GIEK Kredittforsikring AS 1 100% 218 3.4% 51 8 0 31
Ambita AS 1 100% 107 4.9% 440 5 0 158
Electronic Chart Centre AS 2 100% 5 16.9% 29 1 0 20
Total non-listed companies 139,944 9.1% 94,502 12,368 6,479 36,273
Total for all companies in Categories 1 and 2 816,957 1,104,733 69,479 39,852 151,430
3.9%Return from listed companies (3.2%)
9.1%Return on equity from non-listed companies
(11.0%)
39.9 billionDividend to the State
(44.3 billion)
Group accounting figures for 2019 – companies in Categories 1 and 2*NOK million
Listed companies Category The State’s ownership
interest
Market value of
the State’s ownership
interest*
Return Operating revenues
Result after
tax and minority interests
Dividend to the State
Number of employees
Equinor ASA 2 67.00% 392,576 0.5% 566,342 16,218 20,057 21,412
Telenor ASA 2 53.97% 122,563 1.5% 113,666 7,773 6,541 21,089
DNB ASA** 2 34.00% 88,118 24.9% 39,202 25,726 4,836** 9,336
Yara International ASA 2 36.21% 36,024 11.4% 113,837 5,280 1,480 16,033
Norsk Hydro ASA 2 34.26% 23,137 13.6% 150,766 1,811 *** 36,310
Kongsberg Gruppen ASA 2 50.001% 12,420 19.7% 24,081 700 225 10,793
Entra ASA 1 8.24% 2,175 30.3% 2,338 3,225 234 184
Total listed companies 677,013 3.9% 1,010,231 57,111 33 373 115,157 * Market value of the State’s ownership interest as of 31 December 2019 ** The consideration of dividends for 2019 has been postponed until an extraordinary
general meeting to be held no later than December 2020.
* See definitions on page 150. The figures are to be considered estimates that may be revised at a later date.() The figures in brackets on this page show the figures for 2018.
*** The board of directors in Norsk Hydro ASA was granted a power of attorney at the annual general meeting in 2020 to resolve distribution of dividends based on the 2019 annual accounts. The power of attorney is to be used at the board's discretion and expires on the date of the annual general meeting in 2021 and is restricted to a maximum dividend payment of NOK 2.6 billion corresponding to NOK 1.25 per share.
* The State's share of book value less minority interests as of 31 December 2019.
** Estimate. Not decided as of May 2020.
*** In consultation with the board, the general meeting voted against the proposal for dividends due to the Covid19 situation. The board will continually assess developments and possibly return with a proposal to approve dividends for 2019 at a later stage in 2020.
Scope and key figures 13
THE STATEOWNERSHIP
REPORT2019

Number of employees in other companies
Purchases from/subsidies to other companies
Number of employees in Category 3 companies
0 1000 2000 3000 4000 5000
Bane NOR
Norsk rikskringkasting
Avinor
Vinmonopolet
Statnett
Innovasjon Norge
Den Norske Opera & Ballett
Norsk Tipping
Norsk Helsenett
Nofima
Employees in remaining companies
4 6 12
3 334
3 012
1 862
764
636
423
394
418
2 906
1 493Helse Sør-Øst62 025
Helse Vest22 582
Helse Midt-Norge17 526
Helse Nord14 301
Other companies 19,854
Total employees
136,288
The State's total purchases from/subsidies to companies in Category 3 NOK million
Helse Sør-Øst78 772
Helse Vest28 341
Helse Midt-Norge21 239
Helse Nord17 536
0 5000 10000 15000 20000 25000
Bane NOR
Nye Veier
Norfund
Innovasjon Norge
Den Norske Opera & Ballett
Gassnova
Siva – Selskapet for Industrivekst
Store Norske Spitsbergen Kulkompani
Petoro
Nationaltheatret
Purchases by/subsidies to remaining companies
20 642
5 432
1 168
2 035
641
360
331
287
206
1 380
478
Total purchases/subsidies NOK
178,848million
For companies in Category 3, the State’s goal is the most efficient possible attainment of public policy goals. The State’s public policy goals vary from one company to the next. Information regarding the companies’ goal attainment is provided on the company pages. Category 3 consists of 45 companies that do not primarily operate in competition with other companies.
Other companies 32,960
Companies in category
3
Scope and key figures14

Group accounting figures 2019 – companies in Category 3*NOK million
Company State's owner-
ship interest
Operating revenues
Purchases by/ subsidies
from the public sector
Result after
tax and minority interests
Dividend to the State
Book value of State's
ownership interest **
Number of employees
Helse SørØst RHF 100% 86,765 78,772 2,009 0 38,690 62,025
Norsk Tipping AS 100% 40,278 0 5,676 0 496 423 Helse Vest RHF 100% 29,979 28,341 662 0 15,945 22,582 Helse MidtNorge RHF 100% 22,945 21,239 530 0 10,251 17,526 Helse Nord RHF 100% 18,633 17,536 181 0 10,935 14,301 AS Vinmonopolet 100% 14,321 0 469 234 944 1,862
Bane NOR SF 100% 14,281 20,642 427 0 10,948 4,612
Avinor AS 100% 11,785 0 702 0 15,279 3,012 Statnett SF 100% 9,641 0 1,906 1,261 17,783 1,493 Nye Veier AS 100% 6,993 5,432 807 0 3,886 162 Norsk rikskringkasting AS 100% 6,011 0 199 0 1,736 3,334 Norfund 100% 1,345 2,035 1,113 0 23,009 87 Norske tog AS 100% 1,256 0 222 3,065 34
Innovasjon Norge 51% 1,168 1,168 140 117 817 764
Norsk Helsenett SF 100% 842 138 34 0 0 418
Den Norske Opera & Ballett AS 100% 808 641 19 0 81 636
Nofima AS 56.8% 676 106 20 0 108 394
Gassnova SF 100% 644 478 115 0 136 40 Siva – Selskapet for Industrivekst SF 100% 598 360 100 0 991 45 Entur AS 100% 490 0 14 0 129 253 Norges sjømatråd AS 100% 417 5 9 0 285 77 Statskog SF 100% 340 14 84 64 1,875 115 Fiskeri og havbruksnæringens forskningsfinansiering AS 100% 322 0 14 0 15 18
Petoro AS 100% 292 287 1 0 24 65 Nationaltheateret AS 100% 283 206 8 0 32 342 Simula Research Labaratory AS 100% 236 119 36 0 109 155 Store Norske Spitsbergen Kulkompani AS 100% 200 331 300 0 1,500 148 AS Den Nationale Scene 66.67% 185 149 3 0 35 130 Andøya Space Center AS 90% 168 54 10 0 97 94 Universitetssenteret på Svalbard AS 100% 166 136 0 0 27 103 Trøndelag Teater AS 66.67% 136 106 0 0 8 170 Enova SF 100% 127 127 4 0 27 78 Rogaland Teater AS 67% 117 92 6 0 45 122 Eksportkreditt Norge AS 100% 112 115 4 0 34 49 NSD – Norsk senter for forskningsdata AS 100% 84 39 3 0 43 104 Kings Bay AS 100% 73 33 0 0 5 25 Space Norway AS 100% 70 0 110 0 640 27 Talent Norge AS 33.33% 68 37 2 0 3 4 Graminor AS 28.2% 66 29 1 0 20 34
Carte Blanche AS 70% 42 40 0 0 6 30 Nordisk Institutt for Odontologiske Materialer AS 49% 39 37 0 0 7 29 Kimen Såvarelaboratoriet AS 51% 12 4 1 0 5 20 Staur gård AS 100% 10 0 2 0 6 5 Bjørnøen AS 100% 0 0 0 0 4 Gassco AS 100% 0 0 0 0 15 341 Total 273,022 178,848 15,512 1,676 156,934 136,288
* See definitions on page 150. The figures are to be considered estimates that may be revised at a later date.** The State's share of book value less minority interests as of 31 December 2019
Scope and key figures 15
THE STATEOWNERSHIP
REPORT2019

Key issues for the State as owner
Key issues may include reports to the Storting, changes in the State’s ownership interests, capital contributions or other issues. The issues referred to in this report are from January 2019 to May 2020.

17
Photo: Statkraft

Reports to the StortingNew white paper on ownership policyOn 22 November 2019, the Government presented Report to the Storting no. 8 (2019–2020) The State's direct ownership of companies – Sustainable value creation (white paper). In the white paper, the Government describes why the state has direct ownership interests in companies, what the State owns, including the state’s rationale for its ownership and the State’s goal as an owner of each company. The white paper also describes how the State exercises its ownership, including the State’s principles for good corporate governance and the State’s expectations of the companies. The rationale for state ownership and the State’s goal as an owner of each company are clarified. Furthermore, the system for categorising the companies was simplified by the previous Categories 2 and 3 being combined into the present Category 2. The key elements of the framework for the state’s exercise of ownership, which have been fixed over time, were continued in the new white paper and included in the State’s principles for good corporate governance. The policy, which
includes both the State's expectations for and followup of the companies, is further developed and clarified within this framework. (See the chapter on how the State exercises its ownership). A parliamentary majority supported the Government’s policy as outlined in the white paper when this was considered by the Storting on 21 April 2020, cf. Recommendation no. 225 S (2019–2020).
Norsk rikskringkasting ASOn 29 March 2019, the Government presented Report no. 17 (2018–2019) to the Storting – Diversity and arm's length distance: Media policy for a new age. The report discusses the use of financial policy instruments to realise the Government’s media policy objectives. Among the Government’s conclusions in the report were that the broadcasting licence fee should be discontinued from 1 January 2020 and for Norsk rikskringkasting AS to thereafter be financed through allocations via the national budget. The Storting supported this, and in the 2019 national budget adopted the new financing arrangement effective from and including 2020.
Authorisation from the Storting to reduce state ownership.In line with policy, the authorisation granted by the Storting to the Ministry of Trade, Industry and Fisheries to fully or partly reduce the State’s ownership in Ambita AS, Baneservice AS, Entra ASA and Mesta AS has been renewed on an annual basis. The Ministry did not request renewed authorisation to reduce the State's ownership in Telenor ASA from 53.97 per cent to 34 per cent, (see the white paper on ownership policy). Through the consideration of Proposition 1 S (2019–2020), the Ministry of Trade, Industry and Fisheries was granted the authority to conduct the full or partial sale, or possibly dissolution, of GIEK Kredittforsikring AS.
18 Key issues for the State as owner
Photo: Stortinget
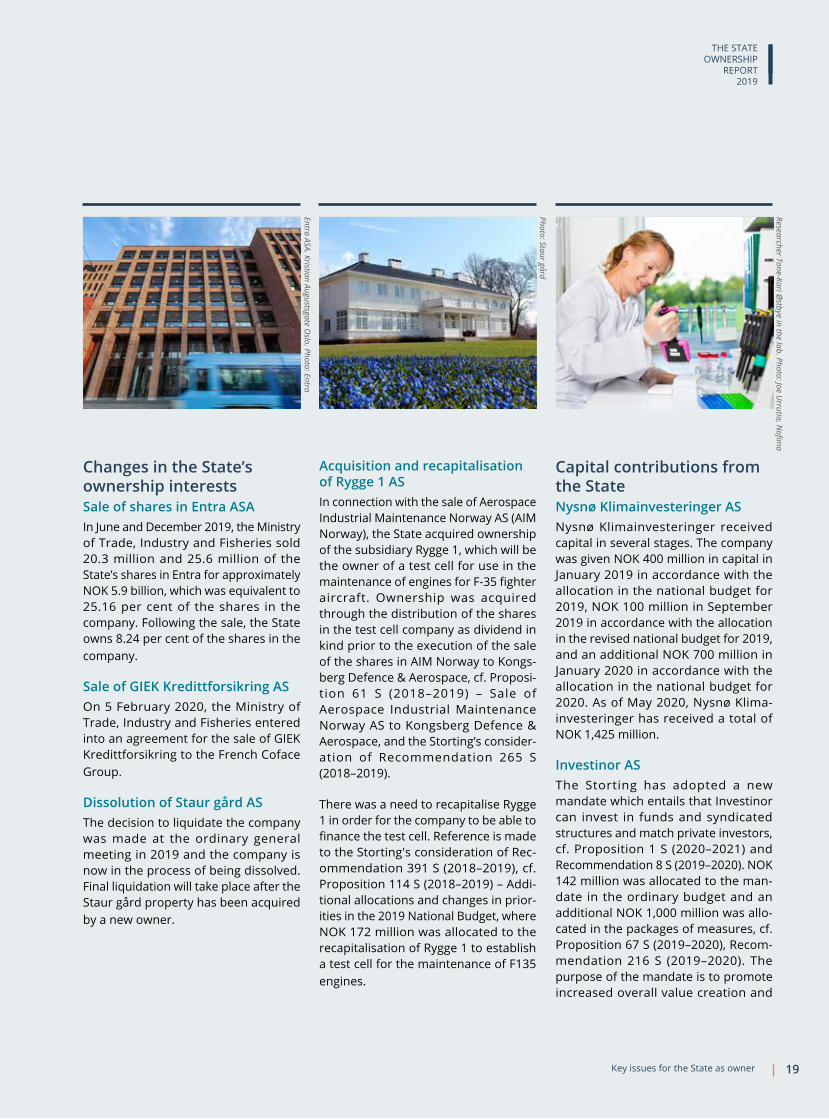
Changes in the State’s ownership interestsSale of shares in Entra ASA In June and December 2019, the Ministry of Trade, Industry and Fisheries sold 20.3 million and 25.6 million of the State’s shares in Entra for approximately NOK 5.9 billion, which was equivalent to 25.16 per cent of the shares in the company. Following the sale, the State owns 8.24 per cent of the shares in the company.
Sale of GIEK Kredittforsikring ASOn 5 February 2020, the Ministry of Trade, Industry and Fisheries entered into an agreement for the sale of GIEK Kredittforsikring to the French Coface Group.
Dissolution of Staur gård ASThe decision to liquidate the company was made at the ordinary general meeting in 2019 and the company is now in the process of being dissolved. Final liquidation will take place after the Staur gård property has been acquired by a new owner.
Acquisition and recapitalisation of Rygge 1 ASIn connection with the sale of Aerospace Industrial Maintenance Norway AS (AIM Norway), the State acquired ownership of the subsidiary Rygge 1, which will be the owner of a test cell for use in the maintenance of engines for F-35 fighter aircraft. Ownership was acquired through the distribution of the shares in the test cell company as dividend in kind prior to the execution of the sale of the shares in AIM Norway to Kongsberg Defence & Aerospace, cf. Proposition 61 S (2018–2019) – Sale of Aero space Industrial Maintenance Norway AS to Kongsberg Defence & Aerospace, and the Storting’s consideration of Recommendation 265 S (2018–2019).
There was a need to recapitalise Rygge 1 in order for the company to be able to finance the test cell. Reference is made to the Storting's consideration of Recommendation 391 S (2018–2019), cf. Proposition 114 S (2018–2019) – Additional allocations and changes in priorities in the 2019 National Budget, where NOK 172 million was allocated to the recapitalisation of Rygge 1 to establish a test cell for the maintenance of F135 engines.
Capital contributions from the StateNysnø Klimainvesteringer AS Nysnø Klimainvesteringer received capital in several stages. The company was given NOK 400 million in capital in January 2019 in accordance with the allocation in the national budget for 2019, NOK 100 million in September 2019 in accordance with the allocation in the revised national budget for 2019, and an additional NOK 700 million in January 2020 in accordance with the allocation in the national budget for 2020. As of May 2020, Nysnø Klimainvesteringer has received a total of NOK 1,425 million.
Investinor AS The Storting has adopted a new mandate which entails that Investinor can invest in funds and syndicated structures and match private investors, cf. Proposition 1 S (2020–2021) and Recommendation 8 S (2019–2020). NOK 142 million was allocated to the mandate in the ordinary budget and an additional NOK 1,000 million was allocated in the packages of measures, cf. Proposition 67 S (2019–2020), Recommendation 216 S (2019–2020). The purpose of the mandate is to promote increased overall value creation and
Entra ASA. Kristian Augustsgate Oslo. Photo: Entra
Photo: Staur gård
Researcher Tone-Kari Østbye in the lab. Photo: Joe U
rrutia, Nofim
a
19
THE STATEOWNERSHIP
REPORT2019
Key issues for the State as owner

restructuring of Norwegian business and industry by improving the market for earlystage capital in Norway. The Storting has also decided that the management of the existing preseed fund, seed fund and coinvestment fund for Northern Norway shall be transferred from Innovasjon Norge to Investinor, cf. Prop 1 S (2020–2021) and Recommendation 8 S (2019–2020).
Mantena ASWhen considering the revised national budget for 2018, the Storting resolved to allocate up to NOK 200 million to Mantena in the form of a subordinated loan or equity contribution, to ensure that the company has a suitable capital structure and liquidity during a demanding restructuring phase. Due to there being uncertainty regarding when the capital contribution would occur, the allocated funds were made transferable to 2019. In 2019, Mantena received NOK 170 million in the form of an equity contribution.
Fiskeri- og havbruksnæringens forskningsfinansiering AS In connection with being converted into a Stateowned limited company on 1 January 2019, Fiskeri- og havbruks-næringens forskningsfinansi ering AS was allocated share capital of NOK 1 million.
Other mattersDistributions in connection with the redemption and cancellation of sharesSeveral of the listed companies in the State's portfolio have socalled buyback programmes whereby the company is authorised to purchase own shares in the market with a view to cancelling the shares. A template agreement has been established for such cases to ensure that the State’s ownership interest in the company remains unchanged through the buyback programme (when redeeming a proportionate percentage of the State’s shares). As part of these types of agreements, in 2019 the State received NOK 1,265 million as settlement for the redemption of shares in DNB ASA, NOK 59.2 million for redemption of shares in Entra ASA, NOK 2,380 million for redemption of shares in Telenor ASA and NOK 104 million for redemption of shares in Yara International ASA.
Mantena Photo: Bård G
udim
Caged salmon. Photo: FH
F
Key issues for the State as owner2020
Responsibility for ownership in Mantena AS has been transferred to the Ministry of Trade, Industry and Fisheries.Pursuant to a Royal Decree in December 2019, it was decided that responsibility for managing the State’s ownership in Mantena would be transferred from the Ministry of Transport to the Ministry of Trade, Industry and Fisheries on 1 January 2020. This is in line with the Government's policy that the Ownership Department of the Ministry of Trade, Industry and Fisheries shall manage the State's ownership of the companies in Categories 1 and 2 unless there are special considerations that warrant alternative solutions.
Conversion to State-owned limited companyOn 1 January 2019, Fiskeri og havbruksnæringens forskningsfond was converted into a Stateowned limited company: Fiskeri og havbruksnæringens forsknings finansiering AS. The purpose of this conversion was to clarify ambiguities regarding governance, responsibility and the framework that regulates the enterprise by using a more suitable form of association.
Review of business-oriented policy instrumentsIn 2018, the Government initiated a comprehensive review of the businessoriented policy instruments. The purpose of this review is to ensure the best possible value-creation and profitable workplaces within sustainable frameworks, based on the funds that are channelled through the policy instruments. The companies included in the review are Eksportkreditt Norge AS, Fiskeri og havbruksnæringens forskningsfinansiering AS, Innovasjon Norge, Norges sjømatråd AS, Siva – Selskapet for Industrivekst SF, Enova SF, Gassnova SF, Investinor AS, Nysnø Klimainvesteringer AS and Argentum Fondsinvesteringer AS.
Key issues for the State as owner
Photo: Store Norske
21
The State’s exercise of ownership shall contribute to the attainment of the State’s goal as an owner of the highest possible return over time or most efficient possible attainment of public policy goals. Among other things, this takes place by the State setting clear expectations of the companies, electing competent boards, and systematically following up the companies. As a longterm and responsible owner, the State contributes to sustainable value creation in the companies. For more information about the State's exercise of ownership see the White Paper on Ownership Policy: Report to the Storting no. 8 (2019–2020) The State's direct ownership of companies – Sustainable value creation.
How the State exercises its ownership
Photo: Ole Jørgen Bratland

The State’s exercise of ownership shall contribute to the attainment of the State’s goals as an owner. For companies in Categories 1 and 2, the State’s goal is the highest possible return over time, while for companies in Category 3, the State’s goal is the most efficient possible attainment of public policy goals. See Figure 1. If companies in Category 3 also operate in competition with others, the State’s goal is normally the highest possible return over time in this limited part of the company's operations.
Goal attainment over time requires the companies to be sustainable. A sustainable company balances financial, social and environmental factors in a way that contributes to longterm
value creation. As a longterm and responsible owner, the State contributes to sustainable value creation and promotes responsibility in the companies.
The State's ten principles for good corporate governance in Figure 2 form the basis for the State's exercise of ownership.
As an owner, the State has clear expectations of the companies (see Figure 3). These support the State’s goals as owner. The companies’ work on the different areas in which the State has expectations is adapted to the distinctive nature, size, risk exposure and what is material to each company.
“The State’s exercise of ownership shall contribute to the attainment of the state’s goal as an owner.”
FIGURE 1:
Categorisation of companies with state ownership
Category 1
The State no longer has a rationale for its ownership.
Category 2
The State has a special rationale for its ownership.
Category 3
Goal of the highest possible return over time
Goal of the most efficient possible attainment of public policy goals
Corporate governance 23

1. The State shall be a responsible owner.
2. The State shall demonstrate transparency about its ownership and exercise of ownership.
3. The State’s exercise of ownership shall contribute to the attainment of the State’s goal as an owner. This takes place through expectations of the companies, voting at general meetings and other means of exercising ownership.
4. The State’s exercise of ownership is based on the division of roles and responsibilities between the owner, the board of directors and the general manager set out in company law, and on generally recognised principles and standards for corporate governance.
5. The State’s authority as owner shall be exercised through the general meeting.
6. The board of directors is responsible for managing the company. The State shall assess
the company’s goal attainment and its efforts regarding the State’s expectations, and the board’s contribution in this context.
7. Relevant expertise shall be the State’s main consideration in its work on the composition of boards of directors. The State shall also emphasise capacity and diversity based on the distinctive nature of the company.
8. The State shall exercise its ownership in accordance with the principle of equal treatment of shareholders set out in company law.
9. The State’s role as owner shall be kept separate from its other roles.
10. State ownership shall not give companies with a state ownership interest undue competitive advantages or disadvantages compared to companies without a state ownership interest.
FIGURE 2:
The State’s ten principles for good corporate governance
Photo: Statnett, Johan Wildhagen
Corporate governance24
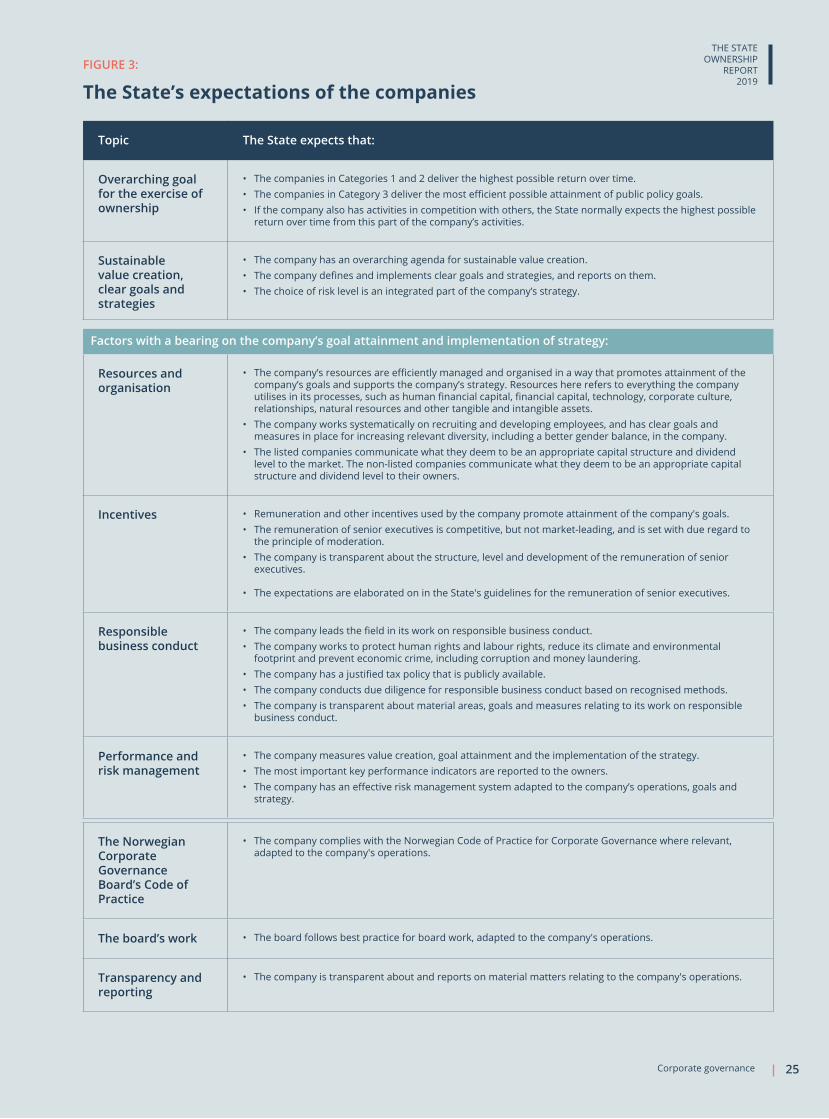
Topic The State expects that:
Overarching goal for the exercise of ownership
• The companies in Categories 1 and 2 deliver the highest possible return over time.• The companies in Category 3 deliver the most efficient possible attainment of public policy goals. • If the company also has activities in competition with others, the State normally expects the highest possible
return over time from this part of the company’s activities.
Sustainable value creation, clear goals and strategies
• The company has an overarching agenda for sustainable value creation.• The company defines and implements clear goals and strategies, and reports on them.• The choice of risk level is an integrated part of the company’s strategy.
FIGURE 3:
The State’s expectations of the companies
The Norwegian Corporate Governance Board’s Code of Practice
• The company complies with the Norwegian Code of Practice for Corporate Governance where relevant, adapted to the company's operations.
The board’s work • The board follows best practice for board work, adapted to the company's operations.
Transparency and reporting
• The company is transparent about and reports on material matters relating to the company's operations.
Factors with a bearing on the company’s goal attainment and implementation of strategy:
Resources and organisation
• The company’s resources are efficiently managed and organised in a way that promotes attainment of the company’s goals and supports the company’s strategy. Resources here refers to everything the company utilises in its processes, such as human financial capital, financial capital, technology, corporate culture, relationships, natural resources and other tangible and intangible assets.
• The company works systematically on recruiting and developing employees, and has clear goals and measures in place for increasing relevant diversity, including a better gender balance, in the company.
• The listed companies communicate what they deem to be an appropriate capital structure and dividend level to the market. The nonlisted companies communicate what they deem to be an appropriate capital structure and dividend level to their owners.
Incentives • Remuneration and other incentives used by the company promote attainment of the company's goals.• The remuneration of senior executives is competitive, but not marketleading, and is set with due regard to
the principle of moderation.• The company is transparent about the structure, level and development of the remuneration of senior
executives.
• The expectations are elaborated on in the State's guidelines for the remuneration of senior executives.
Responsible business conduct
• The company leads the field in its work on responsible business conduct.• The company works to protect human rights and labour rights, reduce its climate and environmental
footprint and prevent economic crime, including corruption and money laundering.• The company has a justified tax policy that is publicly available.• The company conducts due diligence for responsible business conduct based on recognised methods.• The company is transparent about material areas, goals and measures relating to its work on responsible
business conduct.
Performance and risk management
• The company measures value creation, goal attainment and the implementation of the strategy. • The most important key performance indicators are reported to the owners.• The company has an effective risk management system adapted to the company’s operations, goals and
strategy.
Corporate governance 25
THE STATEOWNERSHIP
REPORT2019
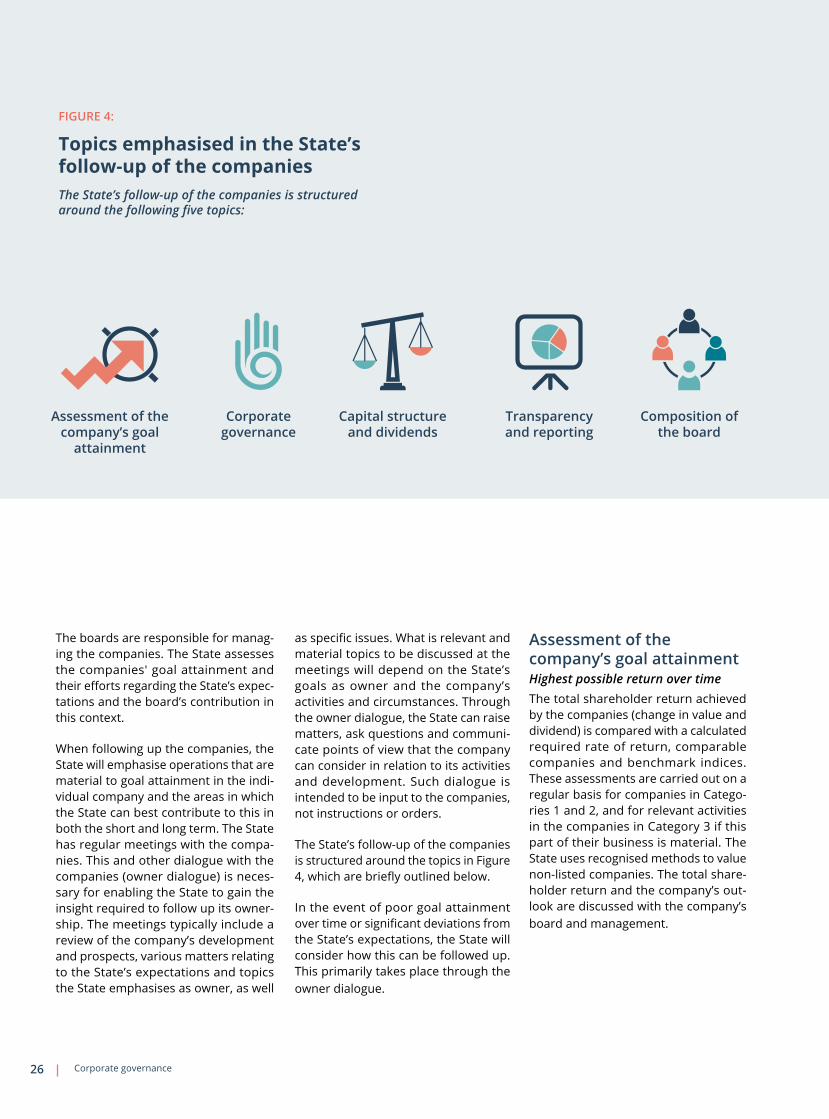
The boards are responsible for managing the companies. The State assesses the companies' goal attainment and their efforts regarding the State’s expectations and the board’s contribution in this context.
When following up the companies, the State will emphasise operations that are material to goal attainment in the individual company and the areas in which the State can best contribute to this in both the short and long term. The State has regular meetings with the companies. This and other dialogue with the companies (owner dialogue) is necessary for enabling the State to gain the insight required to follow up its ownership. The meetings typically include a review of the company’s development and prospects, various matters relating to the State’s expectations and topics the State emphasises as owner, as well
Capital structure and dividends
as specific issues. What is relevant and material topics to be discussed at the meetings will depend on the State’s goals as owner and the company’s activities and circumstances. Through the owner dialogue, the State can raise matters, ask questions and communicate points of view that the company can consider in relation to its activities and development. Such dialogue is intended to be input to the companies, not instructions or orders.
The State’s followup of the companies is structured around the topics in Figure 4, which are briefly outlined below.
In the event of poor goal attainment over time or significant deviations from the State’s expectations, the State will consider how this can be followed up. This primarily takes place through the owner dialogue.
Assessment of the company’s goal attainmentHighest possible return over timeThe total shareholder return achieved by the companies (change in value and dividend) is compared with a calculated required rate of return, comparable companies and benchmark indices. These assessments are carried out on a regular basis for companies in Categories 1 and 2, and for relevant activities in the companies in Category 3 if this part of their business is material. The State uses recognised methods to value nonlisted companies. The total shareholder return and the company’s outlook are discussed with the company’s board and management.
FIGURE 4:
Topics emphasised in the State’s follow-up of the companiesThe State’s follow-up of the companies is structured around the following five topics:
Assessment of the company’s goal
attainment
Corporate governance
Transparency and reporting
Composition of the board
Corporate governance26

FIGURE 5:
Good practice for dialogue on goals, indicators and target figures
Photo: Nye Veier AS
Corporate governance 27
The board understands the State’s goal
– dialogue
The State assesses goal attainment
The company reports on goals, indicators and
goal attainment
The State assesses and challenges the board’s goals, indicators and
target figures
The State defines the rationale for ownership and its goal as an owner
The board develops goals, indicators and
target figures
over time. This includes how the company understands and manages drivers of value creation in the long term. The purpose of this dialogue is to create a shared understanding between the board and the owner about material opportunities and risks to the company’s value creation and the State’s goal attainment.
The company's agenda for sustainable value creation is specified in more short-term strategies. Essential to the State’s followup is understanding how the company works with the strategy and implements this. This includes the company’s work with resources and organisation, incentives and responsible business conduct.
Clear goals and strategies give the company direction and assist in allocating resources where the contribution to value creation is greatest. Different
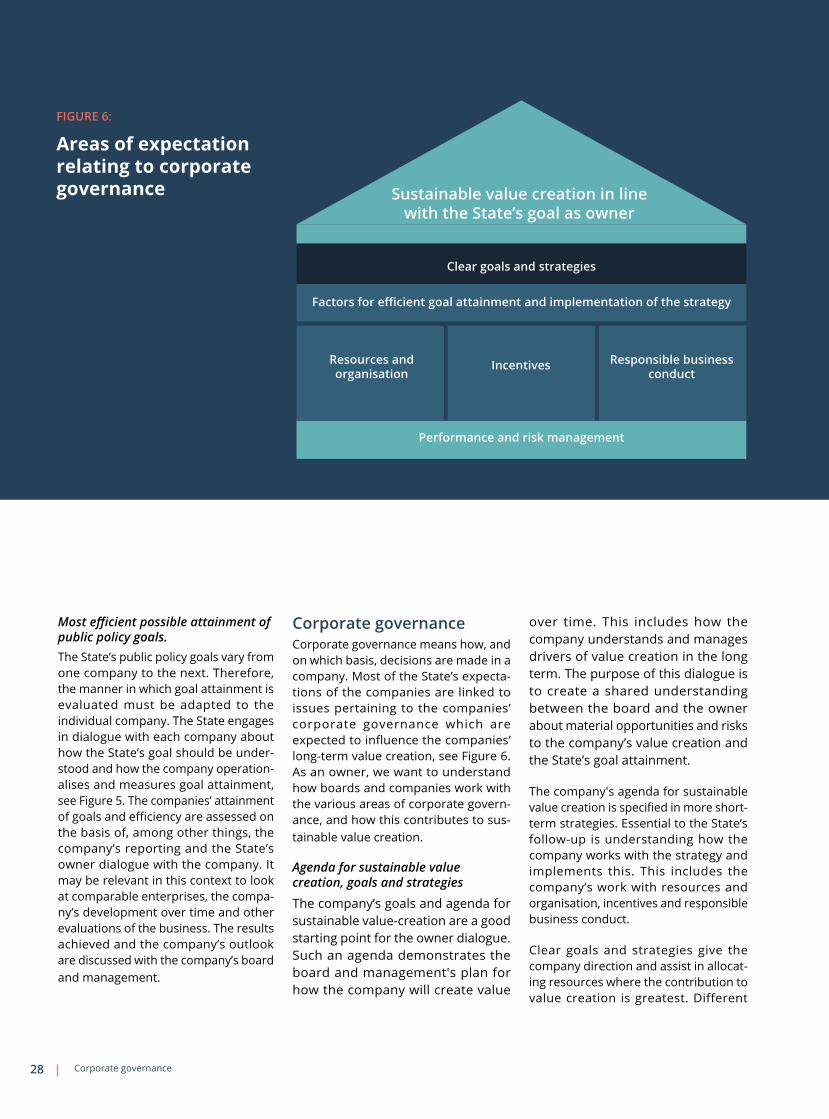
Corporate governanceCorporate governance means how, and on which basis, decisions are made in a company. Most of the State’s expectations of the companies are linked to issues pertaining to the companies’ corporate governance which are expected to influence the companies’ longterm value creation, see Figure 6. As an owner, we want to understand how boards and companies work with the various areas of corporate governance, and how this contributes to sustainable value creation.
Agenda for sustainable value creation, goals and strategies
The company’s goals and agenda for sustainable valuecreation are a good starting point for the owner dialogue. Such an agenda demonstrates the board and management's plan for how the company will create value
FIGURE 6:
Areas of expectation relating to corporate governance
Most efficient possible attainment of public policy goals.The State’s public policy goals vary from one company to the next. Therefore, the manner in which goal attainment is evaluated must be adapted to the individual company. The State engages in dialogue with each company about how the State’s goal should be understood and how the company operationalises and measures goal attainment, see Figure 5. The companies’ attainment of goals and efficiency are assessed on the basis of, among other things, the company’s reporting and the State’s owner dialogue with the company. It may be relevant in this context to look at comparable enterprises, the company’s development over time and other evaluations of the business. The results achieved and the company’s outlook are discussed with the company’s board and management.
Corporate governance28
Sustainable value creation in line with the State’s goal as owner
Clear goals and strategies
Factors for efficient goal attainment and implementation of the strategy
Performance and risk management
Resources and organisation
Incentives Responsible business conduct

strategies entail different risks. Determining how much and which types of risk the company is willing to accept in order to achieve its goals is part of the board’s strategy work.
It is decisive for goal attainment that the strategy is properly implemented in the organisation. The State assesses and challenges the company on whether its goals, key performance indicators and target figures are relevant and expedient, see Figure 5.
Resources and organisationAn appropriate set of resources, that the resources are adapted to the company’s strategy and that they are allocated where they best contribute to attainment of the company’s goals are decisive for goal attainment. The State also places emphasis on the board regularly assessing whether the company’s organisation supports the company’s strategy
and whether its resources are used efficiently.
The company’s culture influences employee behaviour and thereby the company’s goal attainment and the ability to act responsibly. The board has a specific role in defining, facilitating and evaluating the company’s culture, so that it promotes attainment of the company’s goals and supports the company’s strategy. The attitudes and conduct of managers are decisive in developing the desired culture.
Diversity of background and expertise among employees and in management give different perspectives which can provide a better basis for making good decisions. The State places emphasis on the board taking ownership of the company’s work in this area and expects that the companies have clear goals and measures in place for increasing
relevant diversity, including a better gender balance. The gender balance in the companies can be found on page 136.
IncentivesThe right incentives contribute to the implementation of the company’s goals and the State expects that the remuneration and other incentives provided by the companies to both senior executives and other employees promote the attainment of the company’s goals. Good remuneration schemes are linked to measurable factors that individual employees can influence and are designed to create a commonality of interest of longterm value creation between the owners, the board, the management and other employees.
It is crucial that the companies succeed in recruiting and retaining good executives. At the same time, moderation is
Corporate governance 29
VYgruppen Photo: Mads Kristiansen

important. The State places emphasis on the board taking responsibility for the company’s remuneration to senior executives and expects that such remuneration is competitive, but not marketleading compared with similar companies or enterprises and that it is set with due regard to the principle of moderation. Among other things, this means that the level of remuneration shall not be higher than necessary for retaining and attracting the desired expertise. The State places emphasis on the board, in its statement on executive pay, being transparent about how the State’s expectations in this area are being met.
The State’s expectations as regards executive pay are elaborated in the State’ guidelines for the remuneration of senior executives, see www.regjeringen.no.
specific expectations that the companies conduct due diligence, that the company’s have a justified tax policy and that the companies are transparent about material areas, goals and measures relating to their work on responsible business conduct. The work is adapted to the business, nature and risks for each company.
Capital structure and dividends An appropriate capital structure promotes the company’s value creation or efficient attainment of public policy goals. The board is responsible for the company’s capital structure, but decisions made at the general meeting concerning dividend and capital adjustments will affect the capital structure.
Dividend from a company provides the owner with a continuous direct
These guidelines will be revised in 2020. The table on page 134 presents the remuneration paid to the CEOs of the companies.
Responsible business conductThe State is a longterm owner that promotes responsibility in the companies. Responsible business conduct helps to increase confidence in and the legitimacy of the companies.
The State expects the companies to lead the field in their work on responsible business conduct. Among other things, this entails identifying and managing important risk areas for those affected by the company’s operations, ensuring board support for this work, incorporating it into the company’s goals, strategy and guidelines, and following internationally recognised guidelines, principles and conventions. In addition, the State has
“The Government’s ambition is that the Norwegian State’s exercise of ownership is in accordance with best international practice. Good exercise of ownership strengthens trust in the State as an owner and contributes to increased value creation.”
Corporate governance30

return and the ability to adjust the company’s capital structure. The State communicates both longterm and annual dividend expectations to the companies in Categories 1 and 2, and to companies in Category 3 when relevant. Longterm expectations generally apply for a period of three to five years, and should contribute to predictability for the companies. Among other things, dividend expectations are determined based on the State’s assessment of the company’s capital structure, earnings outlook, investment needs and opportunities, activities and risk profile, and how dividend contributes to goal attainment. The State engages in dialogue with the companies about this and annually communicates its dividend expectations to the board, before the board presents its dividend proposal to the general meeting.
Transparency and reporting The State assesses each company’s transparency and reporting in relation to the State’s expectations and approves the annual accounts and annual report at the general meeting. The State has an overall expectation that the companies are transparent about and report on material matters relating to their activities and specific expectations in individual areas which are described in Figure 3.
Among other things, transparency is essential to enable stakeholders to assess the company’s activities, goal attainment and the risks the company poses to society, people and the environment. Transparency is also important to gain the public’s trust that there is fair competition between companies with and without a state ownership interest.
Good corporate reporting provides insight into the company's ability to create value and is a prerequisite for good exercise of ownership. Access to relevant information at the right time makes it possible to evaluate many aspects, including the company’s goals, strategy, performance, development, material elements of corporate governance and risk exposure.
The State engages in dialogue with the companies about the content of the regular reporting to the owners and the general public. The purpose is to ensure that the reporting provides sufficient insight to be able to assess goal attainment and exercise ownership effectively.
Corporate governance 31
Photo: Statkraft

Board composition One of the most important tasks of the State as an owner is to contribute to composing competent and wellfunctioning boards of directors. Relevant expertise shall be the State’s main consideration in its work on the composition of boards of directors. Expertise is about relevant experience and background as well as personal qualities. Together, the board of each individual company should have the expertise required based on the company’s business (object), industry, opportunities and challenges, and the State’s goal as an owner. When selecting board members, the State emphasises management experience, board experience, and relevant industry experience with good results. The State also emphasises capacity and diversity based on the distinctive nature of the company. Diversity provides different perspectives
and facilitates open, wellinformed discussions that may, in turn, result in better decisions. By diverse is meant that the board members represent different backgrounds and expertise, including as a result of different work experience, education, gender, age, geographical affiliation and cultural background. Gender distribution on the boards and changes in this over time can be found on pages 136140.
At general meetings, the minister for each individual ministry elects the board members in whollyowned companies they are constitutionally responsible for, and votes on the election of board members at partlyowned companies. For whollyowned companies, the individual ministries nominate candidates for the board. Dedicated nomination committees elected by the general meeting which nominate board members at the general meeting have been
established in the listed companies and several of the other partlyowned companies
Board elections follow the process presented in Figure 7. The State evaluates the board with the goal of it being composed of people who will contribute to the attainment of the State’s goal as an owner. The State also assesses the company’s activities, opportunities and challenges faced and the expertise that the board should possess in the future. In this assessment, the State emphasises the contribution of the board and each board member to the company's goal attainment, and whether the board's composition, work method, expertise and efforts indicate a need for changes. The State conducts an annual assessment of all boards and board members, irrespective of whether they are up for reelection.
FIGURE 7:
Annual plan board election processThe figure shows the annual board election process followed by the State as owner.
JanDecFeb
Mar
Apr
MayJunJul
Aug
Sept
Oct
Nov
Board evaluation and assessment
Search, interview and reference check
Board elections – decisions
Voting at the general meeting
Commencement of board election
process
Description of skills
Corporate governance32

In companies that are whollyowned by the State, the State conducts interviews with all ownerappointed board members and the managing director of the company as part of the assessment process. The State also endeavours to conduct interviews with board members elected by and among the employees. The State endeavours to maintain a dialogue with the chair of the board during the work of considering possible changes to the board. In companies that have their own nomination committees, these committees are tasked with assessing the composition of the board, but the State also carries out its own reviews in these cases.
The above assessments form the basis for a description of skills, which is prepared for each board. The description of skills constitutes the mandate for the board recruitment process and is what the State uses in its search for new board members. The recruitment process involves searches of women and men in all parts of the country. During the interview phase, the State assesses the candidate's qualifications, including personal aptitude, capacity and impartiality. The board elections are approved at the general meeting.
"One of the most important tasks of the State as owner is to contribute to the composition of competent and wellfunctioning boards. Relevant expertise is the main consideration for the State’s work with board composition."
Corporate governance 33
THE STATEOWNERSHIP
REPORT2019

A sustainable portfolio for long-term value creation
The highest possible return or the most efficient possible attainment of public policy goals over time requires the companies to be sustainable. This entails balancing financial, social and environmental factors in a way that contributes to longterm value creation, while ensuring that today’s needs are met without limiting the possibilities of future generations. The following are a selection of examples of how different companies in the State’s portfolio work on understanding value drivers and development trends in society and integrating these into their business strategies. This provides a competitive advantage which contributes to longterm value creation.

Statskog Photo: Steinar Johansen
35

Kommunalbanken creates climate risk assessment tools for the municipalities
Kommunalbanken AS
Together with professional assistance from the Center for International Climate Research (CICERO), Kommunalbanken (KBN) has developed a digital climate risk assessment tool for Norwegian municipalities. The tool makes it possible to search each municipality and obtain an overview of the largest sources of emissions, the climate profile at county level and how the most important industries in the municipalities may be exposed to physical risk and transitional risk in connection with climate change.
The climate risk assessment tool is intended to serve as an aid for municipalities to start assessing and managing climate risk together with their most important stakeholders. This involves not only better equipping the municipalities to address climate challenges, but also better risk management to ensure a sustainable municipal economy, good ability to service loans and greater scope for making necessary investments. As the most important lender to the municipal sector, this is also of value to KBN. The tool will be further developed in 2020 to provide municipalities with even better and more relevant information about their own climate risks.
From linear TV and radio to on-demand digital content
NRK enjoys a high level of confidence in Norwegian society. 87 per cent of the country’s population use one or more of the public broadcaster’s services every day. NRK is continually working on digitisation and restructuring to fulfil its role as public broadcaster: to cover social, democratic and cultural needs in Norwegian society. Audience habits are changing from linear viewing and listening to ondemand, digital content. The competition for being found, selected and preferred is demanding during a time of intense international competition from gigantic companies such as Netflix and YouTube. While many European public broadcasters have given up on reaching young viewers, l isteners and readers, NRK has increased its popularity among young people. The key is relevant content at the right time on the right platforms. By embracing the entire population, NRK can achieve its goal of being a lavish and diverse public arena and a worldclass publisher and content producer.
Norsk rikskringkasting AS
Photo: Norsk rikskringkasting AS
Ambita assists with better residential property transactions
All registration of properties in Norway was previously in paper form. Large quantities of paper were filled in, sent between the involved parties, signed manually and sent by mail to the Norwegian Mapping Authority. If there were errors or omissions, the papers had to be returned to sender, corrected and sent once more. Just over 1.5 million registrations per year corresponds to 16 million sheets of paper. That is quite a few truckloads.
By using Ambita's services together with the Norwegian Mapping Authority and Altinn, banks and real estate agents can now coordinate, sign and register documents digitally. There are major benefits, which include improving the efficiency of work processes, reducing the number of errors and endcustomers experiencing faster and better property transactions. In 2019, there were just over 700,000 digital property registrations, and almost 500,000 of these went through Ambita's solutions. The proportion of digital registrations is increasing every day, together with the benefits for the involved parties, the environment and society at large.
Ambita AS
Photo: Istockphoto, Bongkarn Thanyakij
Photo: Komm
unalbanken
Sustainable value creation36
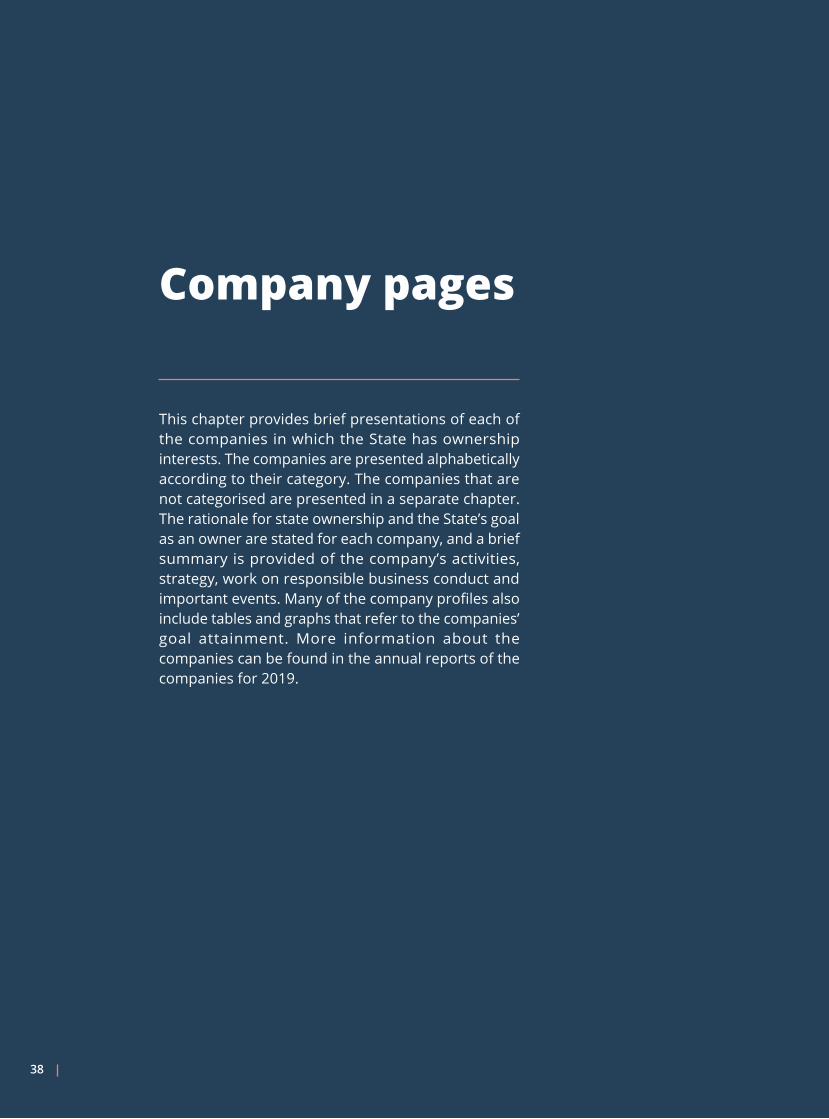
Targeted work for achieving better gender balance
Simula Research Laboratory AS
In order to attract and retain the best talent, and to develop researchers and leaders, Simula places major importance on gender balance and diversity. This provides greater scope in terms of experience, ideas and creativity. Simula has worked with recruiting and developing talented female researchers for over ten years, and milestones have been achieved along the way. An early target of 25 per cent female employees at the company was achieved in 2013, and the next target is 40 per cent by 2028. At yearend 2019, the proportion of women at the company was 30 per cent. Recruitment of and support to female talent are effective policy instruments, but the company also places strong emphasis on offering a good working environment for all employees, both women and men, from many different cultures. This involves management development, access to the professional and administrative resources that are necessary for establishing themselves as researchers, and arrangements that enable them to have a family life. The measures that have been implemented have made Simula a far more diverse workplace, which is highly attractive for researchers throughout the world.
Photo: Bård Gudim
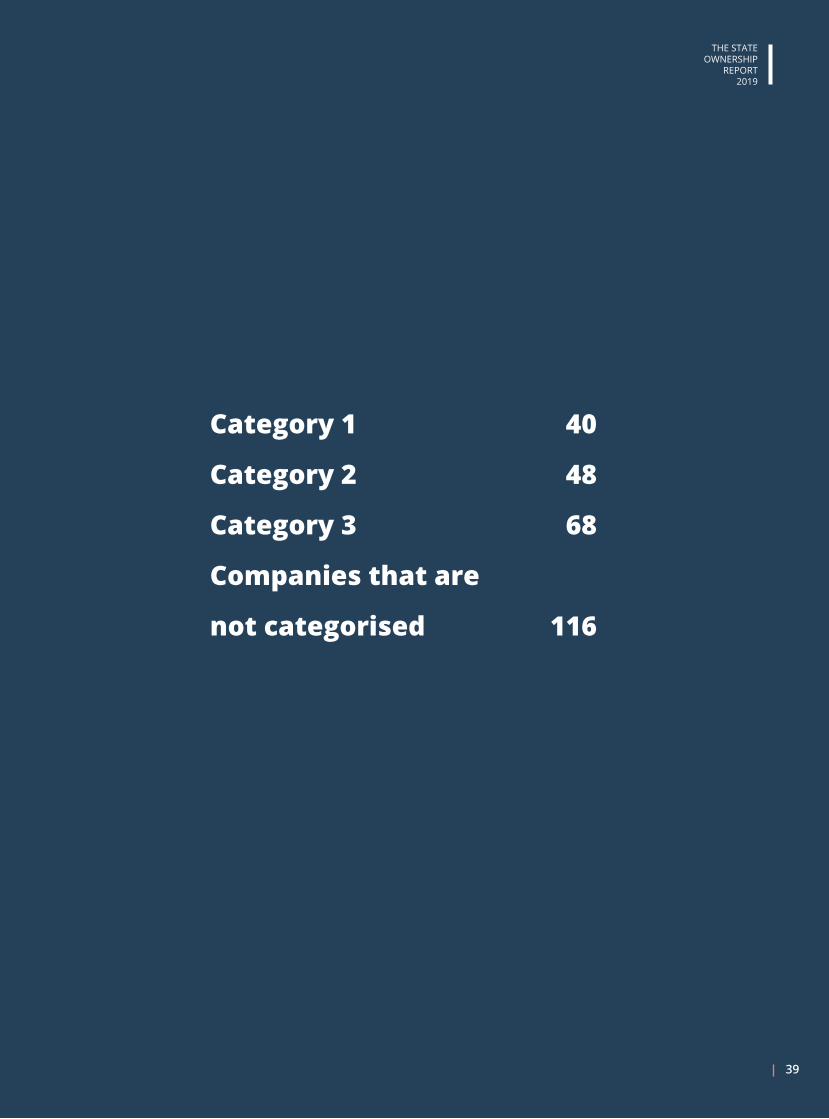
Solar and wind power for Mercedes
Statkraft has entered into agreements to supply renewable electricity to the German motor vehicle group Daimler, the manufacturer of Mercedes and other car models. The electricity will be produced by solar and wind power plants. When these are not producing, Statkraft will supply electricity from its hydropower plants. The electricity will be partly supplied from facilities that are no longer covered by the subsidy schemes and which would have been shut down without secure revenues from longterm power agreements. Part of the electricity will also be supplied from newly constructed solar power plants. The agreement is part of Daimler's plan to reduce its greenhouse gas emissions. These types of longterm agreements provide risk relief to the owners of the solar and wind power plants, which makes it possible to make investments on market terms. When solar and wind are combined with hydropower, it is also possible to offer ordinary and stable power delivery based on 100 per cent renewable energy. Without contributions from a market integrator such as Statkraft, it would not be possible for small solar and wind power players to enter into these types of agreements with major industry players.
Statkraft SF
Photo: Statkraft
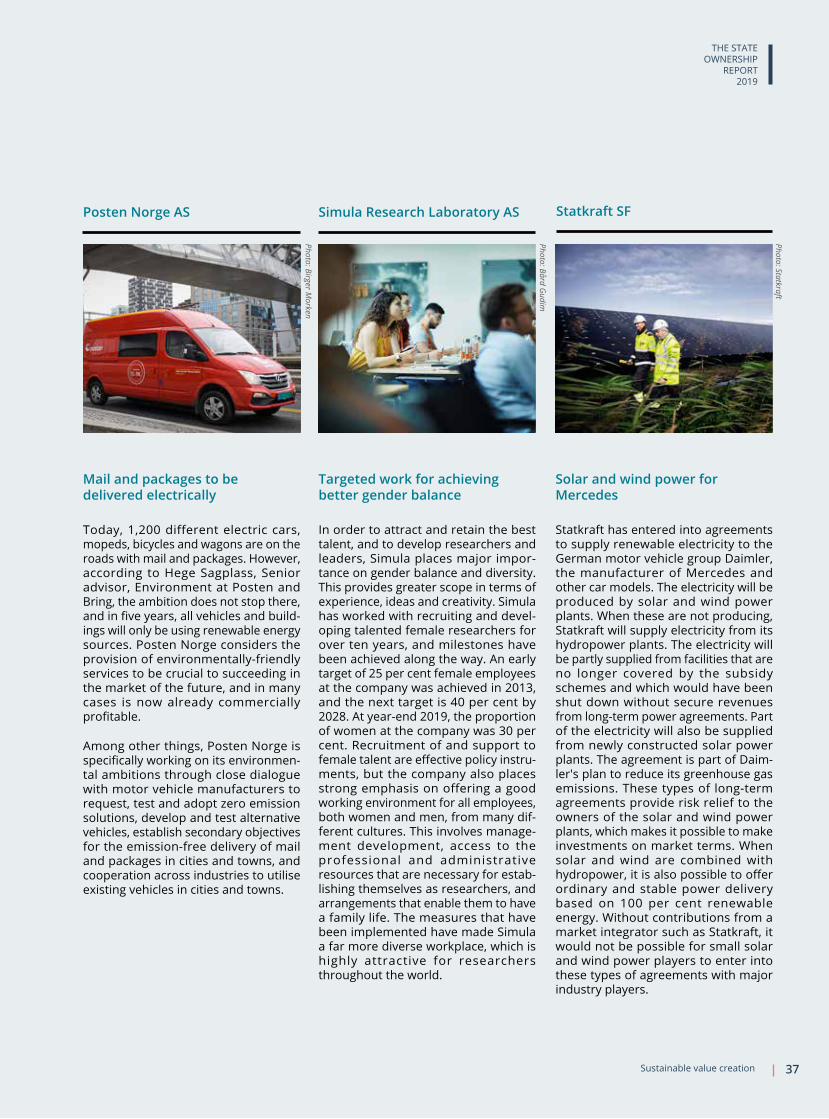
Today, 1,200 different electric cars, mopeds, bicycles and wagons are on the roads with mail and packages. However, according to Hege Sagplass, Senior advisor, Environment at Posten and Bring, the ambition does not stop there, and in five years, all vehicles and buildings will only be using renewable energy sources. Posten Norge considers the provision of environmentallyfriendly services to be crucial to succeeding in the market of the future, and in many cases is now already commercially profitable.
Among other things, Posten Norge is specifically working on its environmental ambitions through close dialogue with motor vehicle manufacturers to request, test and adopt zero emission solutions, develop and test alternative vehicles, establish secondary objectives for the emissionfree delivery of mail and packages in cities and towns, and cooperation across industries to utilise existing vehicles in cities and towns.
Mail and packages to be delivered electrically
Posten Norge AS
Photo: Birger Morken
Sustainable value creation 37
THE STATEOWNERSHIP
REPORT2019
Company pages
This chapter provides brief presentations of each of the companies in which the State has ownership interests. The companies are presented alphabetically according to their category. The companies that are not categorised are presented in a separate chapter. The rationale for state ownership and the State’s goal as an owner are stated for each company, and a brief summary is provided of the company’s activities, strategy, work on responsible business conduct and important events. Many of the company profiles also include tables and graphs that refer to the companies’ goal attainment. More information about the companies can be found in the annual reports of the companies for 2019.
38
Category 1 40
Category 2 48
Category 3 68
Companies that are
not categorised 116
39

This category comprises the companies where the State’s goal is the highest possible return over time and where the State no longer has a rationale for its ownership. It is the Government’s ambition to reduce state ownership in companies in Category 1. State ownership will only be reduced if this is seen as financially beneficial for the State.
Goal of the highest possible return over time and where the State no longer has a rationale for its ownership
Category
1
Ambita AS 42Baneservice AS 43Entra ASA 44Flytoget AS 45Giek kredittforsikring AS 46Mesta AS 47

Photo: Entra
41

Statement of comprehensive income (NOK millions)
2019 2018
Operating revenues 440 394
Operating result (EBIT) 9.6 14.9
Result before tax and minority interests
10.5 15.8
Tax charge 4.6 4.9
- Minority interests 0.7 0.9
Result after tax and minority interests 5.2 11.8
Balance sheet
Total assets 262 184
- Of which cash reserves 36.2 72.1
Total equity 130 112
- Of which minority interests 23.3 6.8
Total debt and liabilities 132 71.9
Dividend and values
Dividend for the financial year 0 4.4
Dividend percentage 0 0.4
Average dividend percentage in the past five years
0.2 0.5
Dividend to the State 0 4.4
Repayment of capital 0 0
Capital contributions from the State 0 0
Key figures
Capital employed 155 113
Operating margin (EBIT margin) 2.2% 3.8%
Return on equity in the past year 4.9% 11.5%
Average return on equity in the past five years
15.8% 18.8%
Return on capital employed in the past year
8.1% 14.6%
Equity ratio 49.6% 60.9%
Investments 0 0
Other key figures
Number of employees 158 86
Percentage employees in Norway 87% 100%
Photo: Peeterv, Istockphoto.com
Long-term goals Indicator Goals 2019
Result 2019 (2018)
Sales growth Revenue growth 12% 12% (7%)
Uptime (services) Uptime as a % 99.5% 99.82 % ()
Innovation Percentage of development work that is innovation 50% 59% (est 53%)
Sick leave Shortterm sick leave 1.6% 1.61 % (2.1 %)
EBITDA Stable margin on turnover 9% 9% (9%)
Company's principal objectives and results 2019 (selection)
Board of Directors:Toril Nag (chair) Ingeborg Moen Borgerud (vice chair) Sven Størmer Thaulow Eli Cathrine Disch Henrik Lie Nilsen Anders Rognes* Åse Nonås* * elected by the employees.
State ownership: 100% Ministry of Trade, Industry and FisheriesCEO:Stig W. SeljesethAuditor:EY AS
State ownership The State no longer has any rationale for ownership in Ambita AS. The State’s goal as an owner is the highest possible return over time.
Attainment of the State’s goalThe company had a return on equity of 5 per cent in 2019. The average return on equity in the past five years was 16 per cent.
About the companyAmbita provides digitalisation solutions for the property market. Ambita solutions are now used in most residential property sales processes in Norway. The company was established in 1992 and has been exposed to competition since 2014. Ambita's head office is in Oslo.
Important events in 2019Ambita developed, launched and rolled out “Megler pakke fleX” (Agent Package fleX) – a valueadded and standardized agent package that makes the agent’s process for collecting information more efficient.
Many agents and lawyers have started using Ambita’s solution for digital registration and in so doing have reduced time spent on settlements.
Ambita contributed to increased value creation and improved efficiency for property developers with the company’s solutions Tomtesøk, Digital nabovarsling and Byggesøknaden.no.
The company acquired 51% of 4CastGroup AS and this has provided valuable insight and a good decisionmaking basis for players in the residential housing and construction markets in Norway and Sweden.
StrategyThe company’s principal objective is to contribute to creating an efficient and safe real estate market for everyone. The current strategy defines three clear strategic focus areas:
1) Further develop positions in the real estate market,
2) Be relevant to private customers, and 3) Be the best in property data.
Responsible business conduct• Climate and environment: Ambita has a
natural environmental focus, since digitisation of paperbased routines is a key part of the Group's activities.
• Human rights: The company focusses on protecting human rights, including when purchasing IT services from companies in other countries. Ambita conducts due diligence assessments in connection with potential assignments/activities in other countries.
• Anti-corruption: The company has created its own companyadapted AntiCorruption Guidelines that all employees have to sign. Ambita has a justified tax policy which is available on the company's website.
Company website:www.ambita.com
Return on assets
Return on equity Return on capital employed
0 %10 %20 %30 %40 %50 %60 %70 %
2016 2017 20182015 2019
32% 38%68% 62%Company Management group
Gender balance 2019
Ambita AS
42 CATEGORY 1

Statement of comprehensive income (NOK millions)
2019 2018
Operating revenues 1,239 843
Operating result (EBIT) 71.8 54.2
Result before tax and minority interests
64.8 50.7
Tax charge 21.9 12.8
- Minority interests 5.9 5.2
Result after tax and minority interests 37.0 32.8
Balance sheet
Total assets 1,117 612
- Of which cash reserves 128 215
Total equity 305 266
- Of which minority interests 25.0 17.7
Total debt and liabilities 811 347
Dividend and values
Dividend for the financial year 8.8 14.7
Dividend percentage 25% 45%
Average dividend percentage in the past five years
28% 25%
Dividend to the State 8.8 14.7
Repayment of capital 0 0
Capital contributions from the State 0 0
Key figures
Capital employed 748 401
Operating margin (EBIT margin) 6% 6%
Return on equity in the past year 14.0% 13.7%
Average return on equity in the past five years
21.3% 22.8%
Return on capital employed in the past year
13.0% 14.4%
Equity ratio 27% 43%
Investments 469 17.6
Other key figures
Number of employees 668 424
Percentage employees in Norway 94% 93%
Photo: Baneservice AS
Company website: www.baneservice.com
Board of Directors:Dagfinn Neteland (chair) Ole Falk Hansen Ann Pedersen Jill Akselsen Harald Vaagaasar Nikolaisen Ole Christian Rognlien* Tom Bragen* Ole Strøm* * elected by the employees
State ownership: 100% Ministry of Trade, Industry and FisheriesCEO: Ingvild StoråsAuditor: BDO AS
Long-term goals Indicator Goals 2019 Result 2019 (2018)
Turnover of NOK 2.2 billion in 2023
Turnover (organic growth) NOK 952 million NOK 1,012 million, excluding acquired enterprises (NOK
843 million)
Profitable operation EBITDA margin %.
EBITDA margin 9.0% 10.6% including acquired enterprises (10.3%)
No losttime injuries. Hvalue >=4,0 5.7%, excluding acquired enterprises (5.5%)
High employee satisfaction Employee engagement index (EEI) 4.9 (scale 16) 5.0 (4.9)
Satisfied customers Customer satisfaction ("Overall impression")
>= 4.0 (scale 15) 4.3 (4.3)
Company's principal objectives and results 2019 (selection)
State ownership The State no longer has any rationale for ownership in Baneservice AS. The State’s goal as an owner is the highest possible return over time.
Attainment of the State’s goalThe company had a return on equity of 14 per cent in 2019. The average return on equity in the past five years was 21 per cent.
About the company Baneservice provides railwayrelated maintenance services and new installations. The company was divested from what was earlier known as the Norwegian National Railway Administration in 2005. Baneservice's head office is in Bærum.
Important events in 2019• Baneservice delivered a strong turnover and
solid results in 2019.
• The company completed the acquisition of Norsk Jernbanedrift Holding AS and thereby consolidated its position as the leading rail infrastructure contractor in Norway.
• Installation of ERTMS, a digital signalling system, for Siemens Mobility and Lieråsen Tunnel for Bane NOR are two of the most important contracts that were entered into in 2019.
• The parent company was certified as an EcoLighthouse (Miljøfyrtårn) enterprise in January 2019.
StrategyThe company‘s business concept is to be the leading provider of services and products for rail infrastructure. This includes the provision of complex multidisciplinary rail contractor services for both new installations and maintenance The group’s ambition is to grow organically and structurally in an expanding market. The acquisition of Norsk Jernbanedrift Holding has strengthened the group’s competitiveness, capacity and expertise for being able to gain significant market share in the future.
Responsible business conductThe group’s guidelines for its corporate social responsibility work describe how the enterprise is to work within the areas of human rights, employee rights, environment/climate and anticorruption, including through the group’s ethical rules. The guidelines describe how employees at the group should address bullying/harassment, competition legislation, use of social media, breach of rules relating to HSE and working hours etc. In 2019 there was a focus on initiatives concerning the environment and climate, as well as initiatives for increasing the number of women in technical/operational positions.
7% 38%93% 62%
Company Management group
Gender balance 2019
0 %
10 %
20 %
30 %
40 %
2016 2017 20182015 2019
Return on assets
Return on equity Return on capital employed
Baneservice AS
43CATEGORY 1

Company's principal objectives and results 2019 (selection)
Long-term goals Indicator Goals 2019
Result 2019 (2018)
High customer satisfaction
Customer satisfaction (Norwegian Tenant Satisfaction Index)
81 86 (84)
Environmental leadership
Low energy consumption in the property portfolio (kWh/m2)
140 135 (142)
Profitable growth Return on equity 6.7% 23% (25%)
Photo: Enrra ASA
State ownership The State no longer has any rationale for ownership in Entra ASA. The State’s goal as an owner is the highest possible return over time.
Attainment of the State’s goalIn 2019 the company had a shareholder return, including dividends, of 30.3 per cent. In the past five years, the average annual shareholder return, including dividends, was 18.3 per cent. During the same periods, the Oslo Stock Exchange Benchmark Index provided respective returns of 16.5 per cent and 10.1 per cent per year.
About the company Entra owns, manages and develops office properties in central locations near public transport hubs in the four largest cities in Norway. The company was divested from Statsbygg in 2000. Entra is listed on the Oslo Stock Exchange and is headquartered in Oslo.
Important events in 2019 • In 2019, Entra signed new and renegotiated
contracts with total annual rent amounting to NOK 371 million.
• Four development projects totalling 51,800m2 in size were completed and transferred to the management portfolio.
• Entra purchased one property and sold two properties during the year and a net 5,300m2 was added to the portfolio.
• Sonja Horn was appointed as the new CEO in June 2019.
Strategy Entra is a leading and professional owner, manager and developer of office properties in Norway. Entra focuses on highquality, environmentallyfriendly properties that are centrally located in Oslo and the surrounding region, Bergen, Stavanger and Trondheim. Entra's business strategy is to deliver profitable growth, have a high level of customer satisfaction and to be an environmental leader in the industry.
Responsible business conduct It is of strategic importance for Entra to operate the business in a sustainable manner and the company considers this to be a prerequisite for longterm results and value creation. The company has a systematic approach to understanding and managing the company's impact on society, as well as the requirements and expectations of stakeholders. In connection with this, Entra has a particular focus on climate and the environment, urban development, motivated employees, ethics and measures for combating corruption, as well as health, safety and the environment.
Statement of comprehensive income (NOK millions)
2019 2018
Rental income 2,338 2,243
Operating result (EBIT) 1,780 1,587
- of which the result from property management
1,471 1,434
Result before tax and minority interests 3,735 3,073
Tax charge 11 338
- Minority interests 498 198
Result after tax and minority interests 3,225 2,537
Balance sheet
Total assets 51,160 47,709
- Of which includes investment properties 49,095 44,714
Of which cash reserves 317 230
Total equity 24,517 22,269
- Of which minority interests 1,947 1,746
Total debt and liabilities 26,642 25,439
Assets and dividend
Market value at yearend 26,409 21,166
Market value of the State’s ownership interest at yearend*
2,176 7,070
Closing price 145.0 115.2
Dividend for the financial year 860 827
Dividend percentage 27% 33%
Average dividend percentage in the past five years
23% 24%
Dividend to the State 234 276
Return in the past year 30.3% 1.9%
Average return in the past five years 18.3% 15.4%
Distributions in connection with the redemption and cancellation of shares
59.2 0
Capital contributions from the State 0 0
Key figures
Capital employed 44,418 41,440
Net lease margin 92% 92%
Operating margin (EBIT margin) 86% 86%
Equity ratio 48% 47%
Investments 2,686 2,110
Key figures
Number of employees 184 164
Percentage employees in Norway 100% 100%
* The State reduced its ownership in 2019 from 33.4% to 8.2%.
Board of Directors: Siri Beate Hatlen (chair) Kjell Bjordal (vice chair) Camilla AC Tepfers Widar Salbuvik Ingrid Dahl Hovland Mariann Halsvik Larsen* Erling Nedkvitne* * elected by the employees.State ownership:
8.24% The Ministry of Trade, Industry and FisheriesCEO: Sonja HornAuditor: Deloitte AS
38% 43%62% 57%Company Management group
Gender balance 2019
Website: www.entra.no
-10 %0 %
10 %20 %30 %40 %50 %60 %
2016 2017 20182015 2019
Average total return, last five years*
*The graph shows share price performance including reinvested dividends as of 31.12 for each year
Entra ASANorway Oslo BenchmarkOMX Nordic / Real Estate - SS
0
50
100
150
200
250
Accumulated total return, last five years *
*The graph shows what the value of NOK 100 (invested in 2015) would be worth as of 31 December 2019 by investing in Entra, Oslo Stock Exchange and the relevant industry index.
2016 2017 20182015 2019
Entra ASA
44 CATEGORY 1

Photo: Øyvind H
aug
Company's principal objectives and results 2019 (selection)
Auditor: PwC ASCompany website: www.flytoget.no
Board of Directors:Rolf Gunnar Roverud (chair) Marianne Ødegård Ribe (vice chair) Stein Bemer Gyrid Skalleberg Ingerø Aslak Sverdrup Camilla S. L. Eide* Per Stene*
Jon E. Johansen* * elected by the employeesState ownership: 100% The Ministry of Trade, Industry and FisheriesCEO: Philipp Engedal
State ownership The State no longer has any rationale for ownership in Flytoget AS. The State’s goal as an owner is the highest possible return over time.
Attainment of the State’s goalThe company had a return on equity of 42.6 per cent in 2019. The average return on equity in the past five years was 24.3 per cent.
About the company Flytoget operates a rail passenger transport service between Drammen and Oslo Airport. The company had 6.7 million passengers in 2019, or around 10 per cent of all train passengers in Norway. Flytoget was established in 1992 to develop the Gardermoen Line and the company has operated a passenger transport service on this line since Oslo Airport opened in 1998. Flytoget's head office is situated in Oslo.
Important events in 2019• Flytoget delivered its best ever result and also
achieved record revenues by passing NOK 1 billion for the first time.
• The first of a total of eight new Flytog trains arrived in Norway and were tested on Norwegian tracks.
• Flytoget received excellent customer satisfaction scores during yet another year without a serious accident.
StrategyFlytoget contributes to a high share of public transport by offering an efficient and environmentallyfriendly means of transport to and from Oslo Airport. By providing a service that emphasizes the needs of the traveller, Flytoget is able to use a willingness to pay a premium price when competing with private and publicly funded operators on the rail line from Drammen to Oslo Airport.
Responsible business conductFlytoget aims to prevent and limit the negative impact or damage caused by the company’s operations on people, the environment and society, based on the overall value chain, the United Nations Sustainable Development Goals and the OECD Guidelines for Corporate Social Responsibility. Moving more travellers from car to train is Flytoget's greatest contribution to society.
Statement of comprehensive income (NOK millions)
2019 2018
Operating revenues 1,002 993
Operating result (EBIT) 443 206
Result before tax and minority interests
447 203
Tax charge 98.6 40.6
- Minority interests 0 0
Result after tax and minority interests 349 163
Balance sheet
Total assets 1,628 1,411
- Of which cash reserves 295 114
Total equity 915 721
- Of which minority interests 0 0
Total debt and liabilities 713 690
Dividend and values
Dividend for the financial year 0 163
Dividend percentage 0% 100%
Average dividend percentage in the past five years
60% 90%
Dividend to the State 0 163
Repayment of capital 0 0
Capital contributions from the State 0 0
Key figures
Capital employed 915 721
Operating margin (EBIT margin) 44% 21%
Return on equity in the past year 42.6% 22.6%
Average return on equity in the past five years
24.3% 20.0%
Return on capital employed in the past year
54.9% 28.8%
Equity ratio 56% 51%
Investments 119 75
Other key figures
Number of employees 334 331
Percentage employees in Norway 100% 100%
39% 50%61% 50%Company Management group
Gender balance 2019
Long-term goals Indicator Goals 2019
Result 2019 (2018)
Return on equity 31.6% 42.6% (22.6%)
No serious injuries Serious injuries 0 0 (0)
Maintain high level of punctuality Punctuality 97% 94.3% (93.8%)
Maintain high customer satisfaction Customer satisfaction index 97% 96% (97%)
0 %10 %20 %30 %40 %50 %60 %
2016 2017 20182015 2019
Return on assets
Return on equity Return on capital employed
Flytoget AS
45CATEGORY 1

Photo: GIEK Kredittforsikring AS
Board of Directors: MaiLill Ibsen (chair) Bjarne Borgersen Anne Breiby Einar Westby Kjerstin Fyllingen Ronny Karlsen Ahlberg* * elected by the employees
Auditor: PricewaterhouseCoopers ASCompany website: www.giekkreditt.no
48% 28%52% 72%Company Management group
Gender balance 2019
-8 %
-4 %
0 %
4 %
8 %
12 %
2016 2017 20182015 2019
Return on assets
Return on equity
State ownership The State no longer has any rationale for ownership in GIEK Kredittforsikring AS. The State’s goal as an owner is the highest possible return over time.
In December 2019, the Government received the Storting's consent to carry out a full or partial sale of the State's shares in GIEK Kredittforsikring, or alternatively dissolve the company. Following an extensive sales process, the Ministry of Trade, Industry and Fisheries entered into an agreement in February 2020 to sell 100 per cent of the shares in GIEK Kredittforsikring to the French Coface group.
About the company GIEK Kredittforsikring offers shortterm credit insurance. This enterprise has roots that date back to 1922 and a separate company was formed when it was split off from Norwegian Export Credit Guarantee Agency (GIEK) in 2001. GIEK Kredittforsikring has its head office in Oslo.
Statement of comprehensive income (NOK millions)
2019 2018
Premium revenues at own cost 50.7 52.3
Result from technical accounts for general insurance
14.5 12
Result, nontechnical accounts 15.4 1.6
Result before other result components
0.2 10.3
Result after tax 7.6 13.8
Balance sheet
Total assets 430 423
- Of which cash reserves 83.4 34
Total equity 218 225
- Of which minority interests 0 0
Total debt and liabilities 212 197
Assets and dividend
Dividend for the financial year 0 0
Dividend share 0% 0%
Average dividend percentage in the past five years
0% 0%
Dividend to the State 0 0
Repayment of capital 0 0
Capital contributions from the State
0 0
Key figures
Equity ratio 51% 53%
Solvency margin 260% 258%
Cost ratio 62% 74%
Loss ratio 77% 59%
Combined ratio 139% 133%
Return on equity 3.4% 6%
Average return on equity in the past five years
3.9% 2.3%
Other key figures
Number of employees 31 35
Percentage employees in Norway 100% 100%
State ownership: 100% The Ministry of Trade, Industry and FisheriesCEO: Erica Blakstad
Giek kredittforsikring AS
46 CATEGORY 1
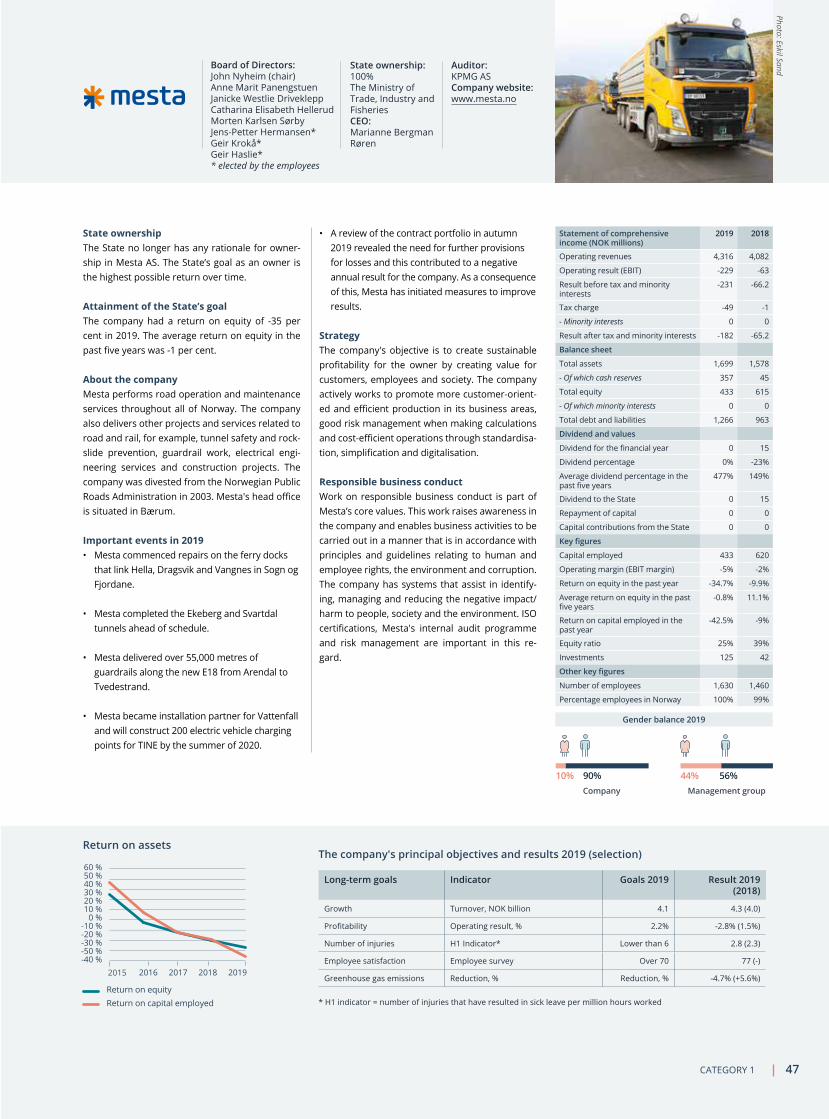
Photo: Eskil Sand
State ownership The State no longer has any rationale for ownership in Mesta AS. The State’s goal as an owner is the highest possible return over time.
Attainment of the State’s goalThe company had a return on equity of 35 per cent in 2019. The average return on equity in the past five years was 1 per cent.
About the company Mesta performs road operation and maintenance services throughout all of Norway. The company also delivers other projects and services related to road and rail, for example, tunnel safety and rockslide prevention, guardrail work, electrical engineering services and construction projects. The company was divested from the Norwegian Public Roads Administration in 2003. Mesta's head office is situated in Bærum.
Important events in 2019• Mesta commenced repairs on the ferry docks
that link Hella, Dragsvik and Vangnes in Sogn og Fjordane.
• Mesta completed the Ekeberg and Svartdal tunnels ahead of schedule.
• Mesta delivered over 55,000 metres of guardrails along the new E18 from Arendal to Tvedestrand.
• Mesta became installation partner for Vattenfall and will construct 200 electric vehicle charging points for TINE by the summer of 2020.
The company's principal objectives and results 2019 (selection)
Long-term goals Indicator Goals 2019 Result 2019 (2018)
Growth Turnover, NOK billion 4.1 4.3 (4.0)
Profitability Operating result, % 2.2% 2.8% (1.5%)
Number of injuries H1 Indicator* Lower than 6 2.8 (2.3)
Employee satisfaction Employee survey Over 70 77 ()
Greenhouse gas emissions Reduction, % Reduction, % 4.7% (+5.6%)
10% 44%90% 56%Company Management group
Gender balance 2019
Auditor: KPMG ASCompany website:www.mesta.no
Board of Directors: John Nyheim (chair) Anne Marit Panengstuen Janicke Westlie Driveklepp Catharina Elisabeth Hellerud Morten Karlsen Sørby JensPetter Hermansen* Geir Krokå* Geir Haslie* * elected by the employees
State ownership: 100% The Ministry of Trade, Industry and FisheriesCEO: Marianne Bergman Røren
• A review of the contract portfolio in autumn 2019 revealed the need for further provisions for losses and this contributed to a negative annual result for the company. As a consequence of this, Mesta has initiated measures to improve results.
StrategyThe company's objective is to create sustainable profitability for the owner by creating value for customers, employees and society. The company actively works to promote more customeroriented and efficient production in its business areas, good risk management when making calculations and costefficient operations through standardisation, simplification and digitalisation.
Responsible business conductWork on responsible business conduct is part of Mesta’s core values. This work raises awareness in the company and enables business activities to be carried out in a manner that is in accordance with principles and guidelines relating to human and employee rights, the environment and corruption. The company has systems that assist in identifying, managing and reducing the negative impact/harm to people, society and the environment. ISO certifications, Mesta's internal audit programme and risk management are important in this regard.
Statement of comprehensive income (NOK millions)
2019 2018
Operating revenues 4,316 4,082
Operating result (EBIT) 229 63
Result before tax and minority interests
231 66.2
Tax charge 49 1
- Minority interests 0 0
Result after tax and minority interests 182 65.2
Balance sheet
Total assets 1,699 1,578
- Of which cash reserves 357 45
Total equity 433 615
- Of which minority interests 0 0
Total debt and liabilities 1,266 963
Dividend and values
Dividend for the financial year 0 15
Dividend percentage 0% 23%
Average dividend percentage in the past five years
477% 149%
Dividend to the State 0 15
Repayment of capital 0 0
Capital contributions from the State 0 0
Key figures
Capital employed 433 620
Operating margin (EBIT margin) 5% 2%
Return on equity in the past year 34.7% 9.9%
Average return on equity in the past five years
0.8% 11.1%
Return on capital employed in the past year
42.5% 9%
Equity ratio 25% 39%
Investments 125 42
Other key figures
Number of employees 1,630 1,460
Percentage employees in Norway 100% 99%
2016 2017 20182015 2019
-50 %-40 %
-30 %-20 %-10 %
0 %10 %20 %30 %40 %50 %60 %
Return on assets
Return on equity Return on capital employed * H1 indicator = number of injuries that have resulted in sick leave per million hours worked
Mesta AS
47CATEGORY 1

This category comprises the companies where the State’s goal is the highest possible return over time and where the State has a special rationale for ownership. The rationale for ownership is stated on the company pages. The State’s rationale for ownership is fulfilled by the State owning a certain percentage of the company, and usually through provisions in the company’s articles of association. The companies primarily operate in competition with others.
Goal of the highest possible return over time and where the State has a special rationale for its ownership
Category
2
Aker Kværner Holding AS 50Argentum Fondsinvesteringer AS 51DNB ASA 52Eksportfinans Norway ASA 53Electronic chart centre AS 54Equinor ASA 55Investinor AS 56Kommunalbanken AS 57Kongsberg Gruppen ASA 58Mantena AS 59Nammo AS 60Norsk Hydro ASA 61Nysnø Klimainvesteringer AS 62Posten Norge AS 63Statkraft SF 64Telenor ASA 65Vygruppen AS 66Yara International ASA 67

Petoro Photo: Einar Aslaksen Melkøya
THE STATEOWNERSHIP
REPORT2019
49

Photo: Kvaerner Stord Yard
Statement of comprehensive income (NOK millions)
2019 2018
Operating revenues 0 0
Operating result (EBIT) 2 2
Result before tax and minority interests
1,988 1,504
Tax charge 0 0
- Minority interests 0 0
Result after tax and minority interests 1,988 1,504
Balance sheet
Total assets 5,061 7,149
- Of which cash reserves 9.7 1.4
Total equity 5,060 7,048
- Of which minority interests 0 0
Total debt and liabilities 0.8 101
Dividend and values
Dividend for the financial year 0 96
Dividend percentage 0
Average dividend percentage in the past five years
Dividend to the State 0 28.8
Repayment of capital 0 0
Capital contributions from the State 0 0
Market value of the State's indirect ownership in underlying companies
1,518 2,145
Key figures
Capital employed 5,060 7,052
Operating margin (EBIT margin)
Return on equity in the past year 32.8% 19.2%
Average return on equity in the past five years
8.1% 10.7%
Return on capital employed in the past year
32.8% 19.2%
Equity ratio 100% 99%
Investments 0 0
Other key figures
Number of employees 0 0
Percentage employees in Norway
State ownership The rationale for the State's ownership in Aker Kværner Holding AS is to help ensure that industrial expertise in petroleumrelated activities and other new activities are developed and that such expertise is managed from Norway. The State’s goal as an owner is the highest possible return over time.
Attainment of the State’s goalThe company had a return on equity of 32.8 per cent in 2019. The average return on equity in the past five years was 8,1 per cent.
About the company Aker Kværner Holding owns approximately 40 per cent of the shares in Akastor ASA, Aker Solutions ASA and Kværner ASA. The State and the other owner of Aker Kværner Holding, Aker ASA, have entered into a shareholder agreement, which in practice gives the State and Aker negative control of Akastor, Aker Solutions and Kværner in certain key areas. The State became an owner in Aker Kværner Holding through the purchase of shares in 2007.
Important events in 2019 • 2019 was a challenging year for the oil supplier
industry in Norway and internationally. Few major contracts were awarded and there was serious overcapacity and the associated margin pressure within several market segments.
• The companies in which Aker Kværner Holding has ownership interests generally had low order intakes in 2019.
• The share prices for Akastor and Aker Solutions fell by 23.9 per cent and 37.7 per cent respectively in 2019.
Strategy Aker Kværner Holding’s strategy is to be a majority owner in Akastor, Aker Solutions and Kværner. On 22 June 2007, the State entered into an agreement to acquire 30 per cent of the shares in Aker Kværner Holding AS at the price of NOK 145.6 per share in Aker Kværner, plus interest until the takeover date. Aker Kværner was later split into three companies: Akastor, Aker Solutions and Kvaerner.
Responsible business conduct Aker Solutions and Kværner established new company strategies in 2019. Among other things, both companies are planning increased investments within renewable energy and carbon capture. The common denominator for the core activities of the three companies is an increased focus on digital solutions to provide more resourceefficient and environmentallyfriendly products and solutions.
Board of Directors:Øyvind Eriksen (chair), Bjørn Erik Næss, Kjell Inge Røkke, Else Bugge Fougner, Kristin Margrethe Krohn Devold, Atle Tranøy* * elected by the employees
State ownership: 30% Ministry of Trade, Industry and FisheriesGeneral Manager:Arild Støren Frick Auditor:Deloitte AS
-40 %
-20 %
0 %
20 %
40 %
2016 2017 20182015 2019
Return on assets
Return on equity
0% 0%0% 0%Company Management group
Gender balance 2019
Aker Kværner Holding AS
50 CATEGORY 2

Photo: Argentum Fondsinvesteringer AS
Long-term goals Indicator Goals 2019 Result 2019 (2018)
PE return better than upper (third) quartile (TQ) for PE in Europe, measured since 2002.
Gross PE return (before Argentum’s operating expenses)
Benchmark is 12.1% 15.1% (15.4%)
Share of capital invested in funds better than European TQ
Share Benchmark is 25% 57.3% (57.3%)
Cost spread (difference in return before and after own operating expenses). Targets are set on an annual basis.
Operating expenses 1.7% 1.6% (1.6%)
Capital raised from external investors. Targets are set on an annual basis.
External capital committed during the year
NOK 400 million NOK 831 million (NOK 513 million)
The company's principal objectives and results 2019 (selection)
State ownership The State’s rationale for ownership in Argentum Fondsinvesteringer AS is to maintain a significant investment firm that is focused on private equity funds, with head office functions in Norway. The State’s goal as an owner is the highest possible return over time.
Attainment of the State’s goalThe company had a return on equity of 8.0 per cent in 2019. The average return on equity during the past five years was 9.7 per cent.
About the company Argentum is an asset manager that primarily invests in private equity funds in Norway and Northern Europe. These funds invest in nonlisted companies in which they see potential for increased value creation and where they can make a positive contribution. Argentum also manages capital for other investors. The company was established in 2001. Argentum’s head office is situated in Bergen.
Important events in 2019• Argentum's funds sold companies for
approximately NOK 2 billion.
• Argentum held four conferences on women in finance and early phase in Bergen, Tromsø, Stavanger, and Trondheim.
• Argentum's most recent vintage fund raised NOK 831 million of external capital.
StrategyArgentum contributes to sustainable value creation through profitable investments. The company’s primary goal is the highest possible return over time. The company's annual value creation survey shows that companies in Argentum's portfolio have higher growth in both employment and turnover than listed companies and the Norwegian business sector in general.
Responsible business conductA conscious awareness of corporate social responsibility and ESG is a prerequisite for Argentum being able to achieve the company’s longterm goals for sustainable value creation. Argentum adheres to the UN Principles for Responsible Investment (PRI) and is a member of the UN Global Compact. Corporate social responsibility is integrated into Argentum's investment processes. Each year, Argentum publishes a corporate social responsibility report which summarises the followup of the funds’ work with ESG.
Statement of comprehensive income (NOK millions)
2019 2018
Operating revenues 763 1,539
Operating result (EBIT) 667 1,456
Result before tax and minority interests
686 1,451
Tax charge 20.1 20.9
- Minority interests 0 0
Result after tax and minority interests
706 1,430
Balance sheet
Total assets 9,029 9,284
- Of which cash reserves 289 1,404
Total equity 8,394 9,188
- Of which minority interests 0 0
Total debt and liabilities 634 95.3
Assets and dividend
Dividend for the financial year 0* 1,500
Dividend percentage 0% 105%
Average dividend percentage in the past five years
91% 84%
Dividend to the State 0* 1,500
Repayment of capital 0 0
Capital contributions from the State
0 0
Key figures
Return on equity in the past year 8.0% 16.5%
Average return on equity in the past five years
9.7% 10.1%
Equity ratio 93% 99%
Investments 0 0
Other key figures
Number of employees 25 24
Percentage employees in Norway 100% 100%
* Estimate. Not decided as of May 2020.
32% 33%68% 67%Company Management group
Gender balance 2019
-5 %0 %5 %
10 %15 %20 %25 %
2016 2017 20182015 2019
Return on assets
Return on equity
Board of Directors:Jon Hindar (chair), Susanne Munch Thore (vice chair), Kjell Martin Grimeland, Rikke Reinemo, Tina Steinsvik Sund, Christian BergState ownership:
100% Ministry of Trade, Industry and FisheriesCEO:Joachim HøeghKrohnAuditor: EY AS
Company website: www.argentum.com
Argentum Fondsinvesteringer AS
51CATEGORY 2

Photo: Stig B. Fiksdal / DN
B ASA
State ownership The State's rationale for ownership in DNB ASA is to maintain a leading technology and financial services company with head office functions in Norway. The State’s goal as an owner is the highest possible return over time.
Attainment of the State’s goalIn 2019, the company had a shareholder return, including dividends, of 24.9 per cent. In the past five years, the average annual shareholder return, including dividends, was 12.9 per cent. During the same periods, the Oslo Stock Exchange Benchmark Index provided respective returns of 16.5 per cent and 10.1 per cent per year.
About the companyDNB is Norway's largest financial services group and one of the largest in the Nordic region. The group offers a broad range of financial services, including loans, saving, investments, payment services, advisory services, real estate broking, insurance and pension for private and corporate customers. The State became a shareholder in DNB during the banking crisis in the 1990s. DNB is listed on Oslo Stock Exchange and is headquartered in Oslo.
Important events in 2019 • Kjerstin R. Braathen took up the position as CEO
on 1 September and Ottar Ertzeid took over as CFO on the same day.
• The new, cloudbased mobile bank was launched and used by more than 1 million people.
• The #huninvesterer (she invests) campaign was launched to put financial equality on the agenda.
• DNB Markets was named best investment bank by Kapital magazine.
Strategy DNB’s principal objective is to create the best customer experiences and deliver on financial goals. Longterm profitable operations are a prerequisite for the business. Of particular importance moving forward will be to preserve and increase existing revenue streams while also finding new sources of income.
Responsible business conduct Given its position as one of the largest financial services groups in the Nordic region, DNB has both the opportunity and the responsibility to make a positive impact on society. Corporate social responsibility at DNB is about how the group creates value by assessing both risk and opportunities from a longterm perspective, and is a natural part of the company's operations and activities. Ethics and environmental and societal issues are integrated into corporate governance through principles for corporate social responsibility that establish the overarching framework for the management of the group.
Company's principal objectives and results 2019 (selection)
Financial ambitions Objectives 2020-2022
Results 2019 (2018)
Return on equity (ROE) (Principal objective)
> 12% 11.7% (11.7%)
Cost ratio (Key performance indicator)
< 40% 42.2% (43.8%)
Core tier 1 capital adequacy (Capitalisation level)
17.9% 18.6% (17.2%)
Dividend ratio (dividend policy) > 50% 57% (56%)
Board of Directors: Olaug Svarva (chair) Tore Olaf Rimmereid (vice chair) KarlChristian Agerup Jaan Ivar Semlitsch Gro Bakstad Carl Anders Løvvik* Jorunn Løvås* * elected by the employeesState ownership:
34% The Ministry of Trade, Industry and Fisheries CEO: Kjerstin R. BraathenAuditor: EY AS
Statement of comprehensive income (NOK millions)
2019 2018
Net interest income 39,202 36,822
Operating result (EBIT) 31,235 28,979
Tax charge 5,465 4,493
- Minority interests 5
Result after tax and minority interests 25,726 24,282
Balance sheet
Total assets 2,793,294 2,634,903
- Of which cash reserves 307,751 159,298
- Of which loans to customers 1,667,189 1,597,758
Total equity 242,255 223,966
- Of which minority interests 45
Total debt and liabilities 2,551,038 2,410,937
- Of which customer deposits 969,557 927,092
Assets and dividend
Market value at yearend 259,169 221,643
Market value of the State’s ownership interest at yearend
88,118 75,359
Closing price 164.0 138.2
Dividend for the financial year 14,035* 13,105
Dividend percentage 57% 56%
Average dividend percentage in the past five years
49% 43%
Dividend to the State 4,836* 4,500
Return in the past year 24.9% 4.5%
Average return in the past five years 12.9% 9.0%
Distributions in connection with the redemption and cancellation of shares
1,265 1,243
Capital contributions from the State 0 0
Key figures
Return on equity 11.7% 11.7%
Other key figures
Number of employees 9,336 9,609
Percentage employees in Norway 85% 85%
* Consideration of dividends has been postponed until an extraordinary general meeting is held no later than December 2020.
47% 50%53% 50%Company Management group
Gender balance 2019
-10 %
0 %
10 %
20 %
30 %
2016 2017 20182015 2019
Average total return, last five years*
*The graph shows share price performance including reinvested dividends as of 31.12 for each year
Website: www.dnb.no
Norway Oslo BenchmarkDNB ASA
S&P Nordic BMI / Banks -IG
020406080
100120140160180
2016 2017 20182015 2019
Accumulated total return, last five years *
*The graph shows what the value of NOK 100 (invested in 2015) would be worth as of 31 December 2019 by investing in Entra, Oslo Stock Exchange and the relevant industry index.
DNB ASA
52 CATEGORY 2

Photo: Eksportfinans ASA
State ownershipThe State’s rationale for ownership in Eksportfinans ASA is to contribute to the company being able to manage its existing portfolio in accordance with applicable/established contracts. The State’s goal as an owner is the highest possible return over time.
Attainment of the State’s goalThe company had a return on equity of 1.6 per cent in 2019. The average return on equity in the past five years was 2.1 per cent.
About the company Eksportfinans manages a portfolio of loans to the Norwegian export industry, foreign buyers of Norwegian capital goods, and the municipal sector in Norway. Almost all of the loans are guaranteed by the Norwegian Export Credit Guarantee Agency (GIEK) or banks. The company also manages a portfolio of international securities. Eksportfinans has not granted new loans since 2012, which was when Eksportkreditt Norge took over responsibility for providing new Statesupported export credits. The company was established in 1962 and is now owned by 22 commercial and savings banks in addition to the State, which acquired its ownership interest through a private placement in 2001. Eksportfinans’ head office is in Oslo.
Important events in 2019 • Eksportfinans continued to manage its existing
portfolio of assets and liabilities in accordance with applicable/established agreements.
• As expected, the company's balance sheet value decreased during the year.
• Operations were stable and solvency and liquidity were both strong.
• Due to a reduction in the level of activity, the number of employees was reduced by five, and at the end of 2019 the company had 20 fulltime equivalents divided among 22 employees.
Strategy Eksportfinans’ objective is to preserve the value of the company by managing its existing portfolio of assets and liabilities in accordance with applicable/established agreements. The balance sheet value is expected to continue to decrease as outstanding loans and liabilities fall due or are redeemed.
Responsible business conduct Eksportfinans' activities have no significant direct consequences for the external environment or a major direct impact on society. However, projects financed by the company may have such an impact. Eksportfinans has not approved new loans since 2012, but has an awareness of, among other things, environmental and social issues, as well as corruption in the existing portfolio. Eksportfinans’ Social Responsibility Policy sets out ethical guidelines, whistleblowing routines, HSE and anticorruption guidelines, antimoney laundering measures, and environmental and social requirements for projects funded by Eksportfinans.
Company website: www.eksportfinans.no
Board of Directors: Sigurd Carlsen (chair) Toril Eidesvik (vice chair) Bjørn Berg Line Hødal Torgersen Thomas Falck Ole Anders Næss* * elected by the employeesState ownership:
15% Ministry of Trade, Industry and FisheriesCEO: Geir Ove Olsen Auditor: PricewaterhouseCoopers AS
27% 25%73% 75%Company Management group
Gender balance 2019
-6 %
-4 %
-2 %
0 %
2 %
2016 2017 20182015 2019
Return on assets
Return on equity
Statement of comprehensive income (NOK millions)
2019 2018
Operating revenues 229 184
Operating result (EBIT) 141 95
Result before tax and minority interests
141 95
Tax charge 35 24
- Minority interests 0 0
Result after tax and minority interests
106 71
Balance sheet
Total assets 14,583 19,225
- Of which cash reserves 469 430
Total equity 6,467 6,422
- Of which minority interests 0 0
Total debt and liabilities 8,116 12,803
Assets and dividend
Dividend for the financial year 106 0
Dividend percentage 100% 0%
Average dividend percentage in the past five years
20% 0%
Dividend to the State 15.9 0
Repayment of capital 0 500
Capital contributions from the State
0 0
Key figures
Return on equity in the past year 1.6% 1.1%
Average return on equity in the past five years
2.1% 11%
Core capital adequacy ratio 126% 114%
Other key figures
Number of employees 22 25
Percentage employees in Norway 100% 100%
Eksportfinans Norway ASA
53CATEGORY 2

Photo: Electronic Chart Centre AS
State ownershipThe State’s rationale for ownership in Electronic Chart Centre AS (ECC) is to contribute to maritime safety by having an enterprise that manages authorised electronic navigational charts and makes these accessible to the public. The State’s goal as an owner is the highest possible return over time.
Attainment of the State’s goalThe company had a return on equity of 16.9 per cent in 2019. The average return on equity in the past five years was 16.3 per cent.
About the companyECC contributes to improved safety at sea, on land and in the air, through the development and operation of a database of electronic navigational charts. The company was divested from the Norwegian Mapping Authority in 1999 and makes a contribution to Norway’s leading role in maritime safety. ECC's head office is in Stavanger.
Important events in 2019• Won a 3year research project together with
Kongsberg Digital to show, via 3D demonstrator, the value of combining and visualizing different maritime mapping data and other types of data (for example, depth data, tides, currents) for maritime stakeholders.
• Commenced a collaborative project with the Norwegian Coastal Administration to make it easier to distribute standardised recommended sailing routes to maritime endusers.
• Started pilot operation for data distribution of detailed depth data (S102) to improve situational awareness in shallow waters in a collaborative project with PRIMAR, Canada Hydrographic Service and Teledyne Caris.
StrategyECC contributes to improved safety at sea through operational management of PRIMAR and the provision of technology/expertise to other national and commercial stakeholders that operate at sea, in the air and on land. ECC aims to have sustainable value creation by developing support for the new maritime S100 product standards to create the basis for new product deliveries.
Responsible business conductECC was founded with the societal mission of contributing to improved safety at sea, and this was also later made to include improved safety in the air and on land. The company's solutions and infrastructure ensure that quality assured data is distributed to all stakeholders in the Maritime Safety Circle. ECC is a member of several IHO working groups where new maritime product standards are developed. The company's solutions are continuously developed and improved to meet future demands and requirements for sustainability, quality, standardisation, efficiency and userfriendliness. ECC is certified under ISO standard 9001:2015.
Company's principal objectives and results in 2019 ECC shall generate returns through activities which contribute to safety at sea, in the air and on land. This is achieved by supporting the continued development of secure and efficient solutions for customers. ECC has had multiple control parameters, but will introduce more structured performance parameters with associated reporting in 2020.
Board of Directors:Tina Steinsvik Sund (chair), Knut Ole Flåthen (vice chair), Nicolai Jarlsby, Hege Støre State ownership: 100% Ministry of Trade, Industry and Fisheries
Acting CEO:Kirsten Elisabeth Bøe Auditor: Deloitte AS Company website: www.ecc.no
Statement of comprehensive income (NOK millions)
2019 2018
Operating revenues 28.8 29.4
Operating result (EBIT) 0.8 1.1
Result before tax and minority interests
0.9 1.1
Tax charge 0 0
- Minority interests 0 0
Result after tax and minority interests
0.9 1.1
Balance sheet
Total assets 10.5 12.3
- Of which cash reserves 5.7 6.3
Total equity 4.6 5.5
- Of which minority interests 0 0
Total debt and liabilities 5.9 6.8
Assets and dividend
Dividend for the financial year 0 0.9
Dividend percentage 0% 80%
Average dividend percentage in the past five years
174% 262%
Dividend to the State 0 0.9
Repayment of capital 0 0
Capital contributions from the State
0 0
Key figures
Capital employed 4.6 5.5
Operating margin (EBIT margin) 3% 4%
Return on equity in the past year 16.9% 15.7%
Average return on equity in the past five years
16.3% 13.9%
Return on capital employed in the past year
16.6% 15.9%
Equity ratio 44% 45%
Investments 0.1 0.3
Other key figures
Number of employees 20 22
Percentage employees in Norway 100% 100%
2016 2017 20182015 2019-30 %-20 %-10 %
0 %10 %20 %30 %40 %50 %60 %70 %
Return on assets
Return on equity Return on capital employed
Electronic chart centre AS
40% 40%60% 60%Company Management group
Gender balance 2019
54 CATEGORY 2

Photo: Ole Jørgen Bratland
State ownership The State's rationale for ownership in Equinor ASA is to maintain a leading technology and energy company with head office functions in Norway. On the basis of guidelines specified in a sale and marketing instruction, Equinor sells the Norwegian State's oil and gas in conjunction with Equinor’s own reserves. This arrangement presupposes that the State is the majority owner of Equinor. The State’s goal as an owner is the highest possible return over time.
Attainment of the State’s goalIn 2019, the company had a shareholder return, including dividends, of 0.5 per cent. The average shareholder return in the past five years was 14.1 per cent. During the same periods, the Oslo Stock Exchange Benchmark Index had respective returns of 16.5 per cent and 10.1 per cent per year.
About the company Equinor is an international technology and energy company whose main activity is the production of oil and gas. The company also has downstream operations and activities in renewable energy, such as offshore wind farms and solar energy. Equinor markets and sells the State’s oil and gas together with its own volumes, cf. the sale and marketing instruction that was stipulated in the articles of association prior to the company’s listing in 2001. The company was established as a wholly Stateowned limited company in 1972. Equinor is listed on Oslo Stock Exchange and the New York Stock Exchange and is headquartered in Stavanger.
Important events in 2019 • Startup of Johan Sverdrup, as well as Mariner,
Trestakk, Utgard and Snefrid Nord
• Important steps in developing the company as a player within offshore wind: Dogger Bank and Empire Wind
• Investment decision for Hywind Tampen
• Launched share buyback programme of up to USD 5 billion by 2022.
Strategy Equinor continues to follow its strategy for safe operations, high value creation and low carbon emissions by developing and maximising value from its position on the Norwegian Continental Shelf, the international oil and gas activities, processing and trading, and the company's growing renewables business.
Responsible business conduct Equinor is an international energy company dedicated to longterm value creation in a lowcarbon future. The safety and security of the company's employees and integrity in operations are Equinor's highest priorities. Equinor endeavours to maintain its advantage as a leading company in carbonefficient oil and gas production, while building a lowcarbon business operation to utilise the new opportunities that are arising during this period of energy restructuring. The company believes that a lower carbon footprint will make it more competitive in the future, and sustainability is part of Equinor's strategy work.
Company's principal objectives and results 2019 (selection)
Auditor: Ernst & Young AS Website: www.equinor.com
Board of Directors: Jon Erik Reinhardsen (chair) Jeroen van der Veer (vice chair) Bjørn Tore Godal Anne Drinkwater Wenche Agerup Rebekka Glasser Herlofsen Jonathan Lewis Finn Bjørn Ruyter
Hilde Møllerstad* Stig Lægreid* Per Martin Labråten* * elected by the employeesState ownership: 67% Ministry of Petroleum and EnergyCEO: Eldar Sætre
* SIF = Number of serious incidents per million hours worked. TRIF = total number of personal injuries per million hours worked.
31% 69%Company
27% 73%Management group
Gender balance 2019
Statement of comprehensive income (NOK millions)
2019 2018
Operating revenues 566,342 647,394
Operating result (EBIT) 81,831 163,790
Result before tax and minority interests
81,770 153,517
Tax charge 65,481 92,197
- Minority interests 70.4 24.4
Result after tax and minority interests 16,218 61,296
Balance sheet
Total assets 1,038,954 915,118
- Of which cash reserves 45,558 61,459
Total equity 362,199 349,664
- Of which minority interests 176 155
Total debt and liabilities 421,265 356,195
Assets and dividend
Market value at yearend 585,935 613,479
Market value of the State’s ownership interest at yearend
392,576 411,031
Closing price 175.5 183.75
Dividend for the financial year 29,410 24,896
Dividend percentage 181% 41%
Average dividend percentage in the past five years
232% 232%
Dividend to the State 20,057 16,738
Return in the past year 0.5% 8.8%
Average return in the past five years 11.3% 10.0%
Distributions in connection with the redemption and cancellation of shares
0 0
Capital contributions from the State 0 0
Key figures
Capital employed 617,681 558,922
Operating margin (EBIT margin) 14% 25%
Equity ratio 35% 50%
Investments 89,795 82,997
Other key figures
Number of employees 21,412 20,525
Percentage employees in Norway 85% 87%
-10 %
0 %
10 %
20 %
30 %
40 %
2016 2017 20182015 2019
Average total return, last five years*
*The graph shows share price performance including reinvested dividends as of 31.12 for each year
Equinor ASANorway Oslo BenchmarkMSCI World Index / Oil Gas & Consumable Fuels -IND (106829)
020406080
100120140160180200
2016 2017 20182015 2019
Accumulated total return, last five years *
*The graph shows what the value of NOK 100 (invested in 2015) would be worth as of 31 December 2019 by investing in Equinor, Oslo Stock Exchange and the relevant industry index.
Equinor ASA
Long term goals Indicator Goals 2019 Result 2019 (2018)
Safe operations SIF, TRIF* SIF: 0,4, TRIF: 2,5 SIF: 0,6 (0,5), TRIF: 2,5 (2,8)
CO2 intensity below 8kg / foe in 2025
CO2intensity No short term goal, long term
goal of CO2 intensity below
8kg / foe in 2025
9.5kg/foe (9kg/foe)
Oil and gas leakage Number of leakage greater than 0,1 kg per second
10 10 (12)
Flat production growth in 2019
Production growth %
0 % 2 % (This goal was not measured in
2018)
Organic investments
$ Billion ~$ 11 billion $ 10 billion (9,9 billion)
Relative return on capital employed
ROACE % Being above average among
comparable companies
Ranked nr. 4 of comparable compa
nies (above average)
55

Photo: Henrik Fjørtoft
State ownership The State's rationale for ownership in Investinor AS is to contribute to increased capital access for companies in an early phase of development. The State’s goal as an owner is the highest possible return over time.
Attainment of the State’s goalThe company’s investment portfolio had a return of 8.4 per cent in 2019. The investment portfolio’s average return in the past five years was 2.1 per cent. These figures are before the company's operating expenses, financial revenues etc.
About the company Investinor invests in competitive Norwegian, internationallyoriented companies that are at an early stage of development. The company’s investments are made on a commercial basis, and on the same terms as private investors. The company was established in 2008. Investinor's head office is in Trondheim.
Important events in 2019 • Investinor invested in ten new portfolio
companies and conducted 54 followup investments in existing portfolio companies.
• NOK 921 million in new capital was injected into the portfolio companies, of which Investinor contributed NOK 306 million.
• 18 of the 65 portfolio companies had positive value growth, while nine companies had negative value growth.
• The gross return (operating revenues) was NOK 263 million, of which NOK 157 million was a change in price for listed shares. The realised loss was NOK 70 million, divided among six companies. Three of these companies have been divested.
Strategy Investinor’s aim is to develop selected Norwegian companies into world leaders in their fields and thereby generate a commercial return. Investinor’s organisation shall have the ability to make good investments, exercise ownership that creates value and to sell its stake in portfolio companies when other owners are better suited than Investinor to take these companies to the next level.
Responsible business conduct Investinor’s approach to responsible investment practices is that satisfactory returns for the owner must be longterm and financially, environmentally and socially sustainable. Therefore, incorporating environmental, social and corporate governance (ESG) issues into all the company’s investment analyses, decisionmaking processes and active ownership is strategically important for Investinor. Investinor uses its ownership influence to encourage portfolio companies to align their approach to sustainability and corporate social responsibility as closely as possible with Investinor’s requirements and has a focus on managing material risks and opportunities relating to environmental and social impact.
Auditor: KPMG ASCompany website: www.investinor.no
Board of Directors: Thomas Falck (chair), Anne Kathrine Slungård (vice chair), Olaug Svarva, Thor Egil Five, Hans Aasnæs
State ownership: 100% Ministry of Trade, Industry and FisheriesCEO: Terje Eidesmo
20% 0%80% 100%Company Management group
Gender balance 2019
-8 %-6 %-4 %-2 %0 %2 %4 %6 %8 %
10 %
2016 2017 20182015 2019
Return on assets
Return on equity
Statement of comprehensive income (NOK millions)
2019 2018
Operating revenues 263 159
Operating result (EBIT) 211 206
Result before tax and minority interests
222 198
Tax charge 0 0
- Minority interests 0 0
Result after tax and minority interests
222 198
Balance sheet
Total assets 3,275 2,695
- Of which cash reserves 26.8 32.9
Total equity 3,249 2,678
- Of which minority interests 0 0
Total debt and liabilities 25.5 16.7
Assets and dividend
Dividend for the financial year 0 0
Dividend share 0% 0%
Average dividend percentage in the past five years
25% 25%
Dividend to the State 0 0
Repayment of capital 0 0
Capital contributions from the State
350 0
Key figures
Return on equity in the past year 7.5% 7.1%
Average return on equity in the past five years
2.0% 0.5%
Equity ratio 99% 99%
Other key figures
Number of employees 20 18
Percentage employees in Norway 100% 100%
Investinor AS
56 CATEGORY 2

Long-term goals Indicator Goals 2019 Result 2019 (2018)
Market share of approximately 50% Market share 48% 46.8% (48.3%)
8% return on equity Return on equity 8.13% 9.5% (11.9%)
Contribute to achieving national objectives for a lowemission society through an increased proportion of green loans.
Growth in green lending as a proportion of total lending growth.
1/3 49% (36%)
Highest possible customer satisfaction score
Score (1–6) Highest possible
5.32 (5.17)
The company's principal objectives and results 2019 (selection)
CEO: Kristine FalkgårdAuditor: EY ASCompany website: www.kbn.com
Board of Directors:Brit Kristin Sæbø Rugland (chair) Rune Midtgaard (vice chair) Eyvind Aven Martha Takvam Nanna Egidius Petter Steen jr. Ida Espolin Johnson
Marit Urmo Harstad* Harald Jacobsen * * elected by the employeesState ownership: 100% Ministry of Local Government and Modernisation
State ownership The State’s rationale for ownership in Kommunalbanken AS is to facilitate the financing of the municipal sector. The State’s goal as an owner is the highest possible return over time.
Attainment of the State’s goalThe company had a return on equity of 9.5 per cent in 2019. The average return on equity in the past five years was 12.2 per cent.
About the company Kommunalbanken offers longterm loan financing to the municipal sector. The business was organised as a limited liability company in 1999 as a continuation of the State bank Norges Kommunalbank, which had been established in 1926. Kommunalbanken's head office is in Oslo.
Important events in 2019• Kommunalbanken approved 628 new loans
totalling NOK 53.8 billion to finance, among other things, schools, health and care services, water, sewerage and waste disposal, and climate adaptation.
• The growth in Kommunalbanken’s green loans for projects with climate and environmentrelated ambitions accounted for about half of the total loan growth for the year.
• The customer satisfaction score was the highest Kommunalbanken has recorded. Among other things, customer visits and the KBN Finans service were appreciated.
• Kommunalbanken launched a climate risk assessment tool for the municipalities and will further develop this to provide the municipalities with an even better decisionmaking basis.
StrategyThrough financial expertise, digital interaction and insight into the municipal sector, Kommunalbanken shall contribute to municipalities succeeding in their work of developing the best possible welfare services for their citizens. In order to satisfy the owner's requirement for a financial return, Kommunalbanken works systematically to optimise the balance sheet composition and make capital expenditure more efficient.
Responsible business conductSustainability must permeate the manner in which Kommunalbanken carries out its activities. Kommunalbanken shall support longterm and responsible investments and sustainable debt management. Kommunalbanken sets high expectations for ethics and sustainability both within its own organisation and for customers, suppliers and collaborative partners. Kommunalbanken has zero tolerance for corruption and money laundering. Kommunalbanken will help to achieve national objectives for a lowemission society through green, discounted loans for projects that have clear climaterelated ambitions.
0 %
5 %
10 %
15 %
20 %
25 %
2016 2017 20182015 2019
Return on assets
Return on equity
Statement of comprehensive income (NOK millions)
2019 2018
Interest income 8,817 6,755
Operating result (EBIT) 1,771 1,995
Result before tax and minority interests
1,771 1,995
Tax charge 488 499
Minority interests 0 0
Result after tax and minority interests 1,283 1,496
Balance sheet
Total assets 460,778 457,701
- Of which cash reserves 459 276
- Of which securities, deposits etc. 132,077 139,782
Total equity 16,401 15,422
- Of which minority interests 0 0
Total debt and liabilities 444,377 442,279
Assets and dividend
Dividend for the financial year 0 481
Dividend percentage 0% 39%
Average dividend percentage in the past five years
26% 36%
Dividend to the State 0 481
Repayment of capital 0 0
Capital contributions from the State 0 0
Key figures
Capital employed
Core tier 1 capital adequacy 17% 17%
Return on equity in the past year 9.5% 11.9%
Average return on equity in the past five years
12.2% 11.6%
Return on capital employed in the past year
Equity ratio 10% 12%
Investments 0 0
Other key figures
Number of employees 85 82
Percentage employees in Norway 100% 100%
42% 36%58% 64%Company Management group
Gender balance 2019
Photo: Hundven-Clem
ents Photography
Kommunalbanken AS
57CATEGORY 2
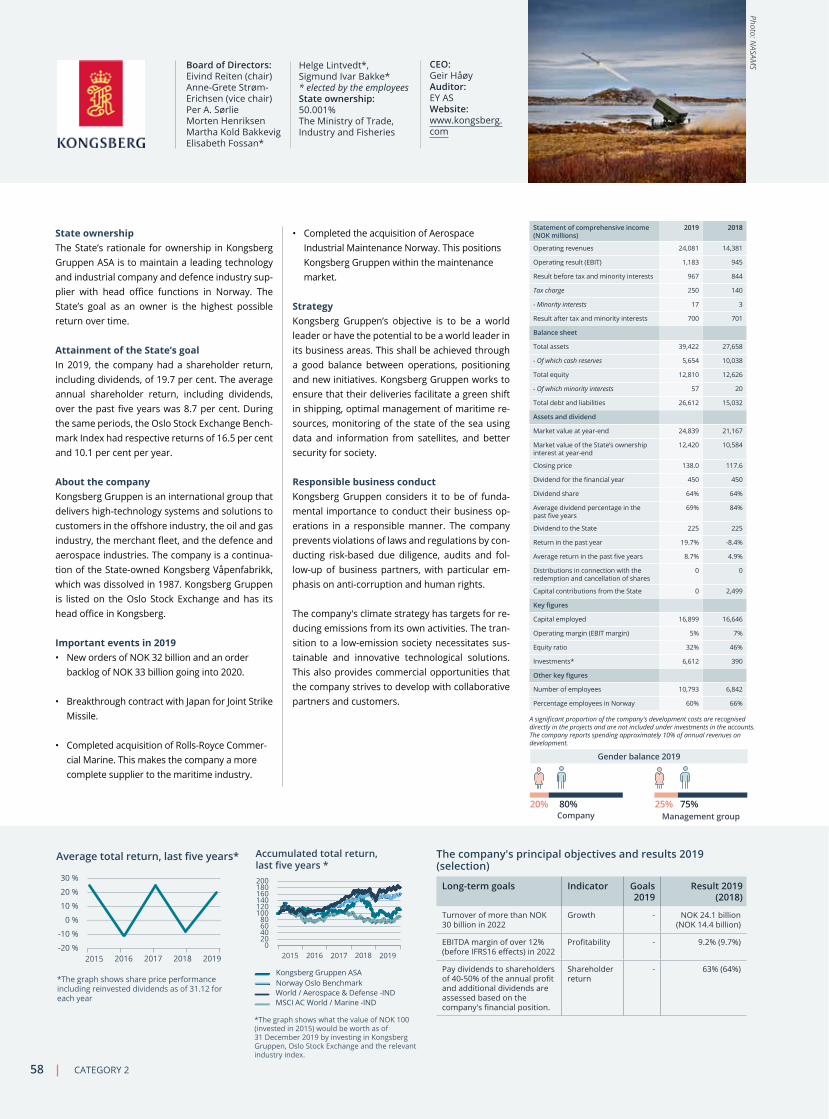
Photo: NASAM
S
State ownership The State’s rationale for ownership in Kongsberg Gruppen ASA is to maintain a leading technology and industrial company and defence industry supplier with head office functions in Norway. The State’s goal as an owner is the highest possible return over time.
Attainment of the State’s goalIn 2019, the company had a shareholder return, including dividends, of 19.7 per cent. The average annual shareholder return, including dividends, over the past five years was 8.7 per cent. During the same periods, the Oslo Stock Exchange Benchmark Index had respective returns of 16.5 per cent and 10.1 per cent per year.
About the companyKongsberg Gruppen is an international group that delivers hightechnology systems and solutions to customers in the offshore industry, the oil and gas industry, the merchant fleet, and the defence and aerospace industries. The company is a continuation of the Stateowned Kongsberg Våpenfabrikk, which was dissolved in 1987. Kongsberg Gruppen is listed on the Oslo Stock Exchange and has its head office in Kongsberg.
Important events in 2019 • New orders of NOK 32 billion and an order
backlog of NOK 33 billion going into 2020.
• Breakthrough contract with Japan for Joint Strike Missile.
• Completed acquisition of RollsRoyce Commercial Marine. This makes the company a more complete supplier to the maritime industry.
• Completed the acquisition of Aerospace Industrial Maintenance Norway. This positions Kongsberg Gruppen within the maintenance market.
Strategy Kongsberg Gruppen’s objective is to be a world leader or have the potential to be a world leader in its business areas. This shall be achieved through a good balance between operations, positioning and new initiatives. Kongsberg Gruppen works to ensure that their deliveries facilitate a green shift in shipping, optimal management of maritime resources, monitoring of the state of the sea using data and information from satellites, and better security for society.
Responsible business conduct Kongsberg Gruppen considers it to be of fundamental importance to conduct their business operations in a responsible manner. The company prevents violations of laws and regulations by conducting riskbased due diligence, audits and followup of business partners, with particular emphasis on anticorruption and human rights.
The company's climate strategy has targets for reducing emissions from its own activities. The transition to a lowemission society necessitates sustainable and innovative technological solutions. This also provides commercial opportunities that the company strives to develop with collaborative partners and customers.
The company's principal objectives and results 2019 (selection)
Long-term goals Indicator Goals 2019
Result 2019 (2018)
Turnover of more than NOK 30 billion in 2022
Growth NOK 24.1 billion (NOK 14.4 billion)
EBITDA margin of over 12% (before IFRS16 effects) in 2022
Profitability 9.2% (9.7%)
Pay dividends to shareholders of 40-50% of the annual profit and additional dividends are assessed based on the company's financial position.
Shareholder return
63% (64%)
CEO: Geir HåøyAuditor: EY ASWebsite: www.kongsberg.com
Board of Directors: Eivind Reiten (chair) AnneGrete Strøm Erichsen (vice chair) Per A. Sørlie Morten Henriksen Martha Kold Bakkevig Elisabeth Fossan*
Helge Lintvedt*, Sigmund Ivar Bakke* * elected by the employeesState ownership: 50.001% The Ministry of Trade, Industry and Fisheries
Statement of comprehensive income (NOK millions)
2019 2018
Operating revenues 24,081 14,381
Operating result (EBIT) 1,183 945
Result before tax and minority interests 967 844
Tax charge 250 140
- Minority interests 17 3
Result after tax and minority interests 700 701
Balance sheet
Total assets 39,422 27,658
- Of which cash reserves 5,654 10,038
Total equity 12,810 12,626
- Of which minority interests 57 20
Total debt and liabilities 26,612 15,032
Assets and dividend
Market value at yearend 24,839 21,167
Market value of the State’s ownership interest at yearend
12,420 10,584
Closing price 138.0 117.6
Dividend for the financial year 450 450
Dividend share 64% 64%
Average dividend percentage in the past five years
69% 84%
Dividend to the State 225 225
Return in the past year 19.7% 8.4%
Average return in the past five years 8.7% 4.9%
Distributions in connection with the redemption and cancellation of shares
0 0
Capital contributions from the State 0 2,499
Key figures
Capital employed 16,899 16,646
Operating margin (EBIT margin) 5% 7%
Equity ratio 32% 46%
Investments* 6,612 390
Other key figures
Number of employees 10,793 6,842
Percentage employees in Norway 60% 66%
A significant proportion of the company's development costs are recognised directly in the projects and are not included under investments in the accounts. The company reports spending approximately 10% of annual revenues on development.
20% 25%80% 75%Company Management group
Gender balance 2019
-20 %
-10 %
0 %
10 %
20 %
30 %
2016 2017 20182015 2019
Average total return, last five years*
*The graph shows share price performance including reinvested dividends as of 31.12 for each year World / Aerospace & Defense -IND
Norway Oslo Benchmark Kongsberg Gruppen ASA
MSCI AC World / Marine -IND
020406080
100120140160180200
2016 2017 20182015 2019
Accumulated total return, last five years *
*The graph shows what the value of NOK 100 (invested in 2015) would be worth as of 31 December 2019 by investing in Kongsberg Gruppen, Oslo Stock Exchange and the relevant industry index.
Kongsberg Gruppen ASA
58 CATEGORY 2

Photo: Mantena AS and Bård G
udim
7% 25%93% 75%Company Management group
Gender balance 2019
Company website: www.mantena.org
Board of Directors: Kari Broberg (chair), Ronny Solberg (vice chair), Øyvind Hasaas, Marianne Kartum, Kjell Helmer Vekve Næss*, Jomar Morten Kvitland*, Petter Trønnes* * elected by the employees
State ownership: 100% The Ministry of Trade, Industry and FisheriesCEO: Kjetil Hovland Auditor: Deloitte AS
State ownershipThe State's rationale for ownership in Mantena AS is to have a provider of maintenance and workshop services for rolling stock. The State’s goal as an owner is the highest possible return over time.
Attainment of the State’s goalThe company had a return on equity of 27.9 per cent in 2019. The average return on equity in the past two years was 6.5 per cent.
About the company Mantena provides maintenance services to rail operators in Norway, principally the maintenance of locomotives, carriages and multiple units. The company also maintains components and maintains and repairs rolling stock. The company was demerged from Vygruppen in 2017. Mantena's head office is in Oslo.
Important events in 2019• Growth in revenue and improved financial
result. Equity was strengthened by the owner providing increased share capital of NOK 170 million.
• Changes to the pension scheme, which have resulted in increased competitiveness in comparison with the previous scheme.
• The most important new contracts were the maintenance contract with GoAhead Nordic for “Traffic Package 1 – South” in Norway and the contract with SJ for Öresundståg in Sweden.
• Lost the tender for maintenance of Vy's Flirt trains.
StrategyMantena's vision is to be the Nordic region's most innovative total maintenance service supplier in the railway sector. Mantena shall be a leader in innovative methods for planning and carrying out maintenance, including methods that can increase maintenance intervals and extend the service life of materials. New services are also being developed which will enable Mantena to take greater responsibility for the overall work and thus allow customers to focus on their core activities.
Responsible business conductMantena places importance on compliance with the OECD Due Diligence Guidance For Responsible Business Conduct. Mantena’s routines are intended to prevent harm to people, society and the environment. Any incidents and nearincidents are reported and followed up through a separate deviation system. Mantena is certified according to EN NSISO 14001:2015, with an environmental policy that forms the basis for this work. Mantena has established governing documents which apply the principles of the UN Declaration of Human Rights and the ILO's core conventions.
The company's principal objectives and results 2019 Mantena's principal objectives were to ensure profitable operations and to be awarded longterm contracts. These objectives were achieved in the form of an operating profit of NOK 90 million and the signing of several major, longterm contracts. 2020 will see a comprehensive review of the overall strategy with a view to updating this and defining clear goals and measures for further developing the company.
Statement of comprehensive income (NOK millions)
2019 2018
Operating revenues 1,571 1,502
Operating result (EBIT) 91.6 7.3
Result before tax and minority interests
96.4 22.7
Tax charge 21.8 0.9
Minority interests 0 0
Result after tax and minority interests 74.6 23.6
Balance sheet
Total assets 1,020 1,110
- Of which cash reserves 278 172
Total equity 390 146
- Of which minority interests 0 0
Total debt and liabilities 630 964
Assets and dividend
Dividend for the financial year 0 0
Dividend share 0% 0%
Average dividend percentage in the past five years
0% 0%
Dividend to the State 0 0
Repayment of capital 0 0
Capital contributions from the State 170 0
Key figures
Capital employed 390 146
Operating margin (EBIT margin) 6% 0%
Return on equity in the past year 27.9% 14.9%
Average return on equity in the past two years
6.5%
Return on capital employed in the past year
38.1% 2.0%
Equity ratio 38% 13%
Investments 20.9 37.9
Other key figures
Number of employees 958 1,059
Percentage employees in Norway 88% 85%
-20 %-10 %
0 %10 %20 %30 %40 %50 %
2018 2019
Return on assets
Return on equity Return on capital employed
Mantena AS
59CATEGORY 2

CEO: Morten Brandtzæg Auditor: EY ASCompany website: www.nammo.com
Board of Directors:Dag Schjerven (chair) Esa Heikki Elias Rautalinko (vice chair) Ville Petteri Jaakonsalo Dag Jakob Opedal SirpaHelena Sormunen
Cathrine Bjaarstad Marianne Stensrud* Petri Mikael Kontola*
*elected by the employees State ownership: 50% The Ministry of Trade, Industry and Fisheries
State ownershipThe State’s rationale for ownership in Nammo AS is to maintain a leading technology and industrial company with head office functions in Norway and, on the grounds of security and emergency preparedness, it is considered expedient that a significant part of the company's activities be maintained in Norway. The State’s goal as an owner is the highest possible return over time.
Attainment of the State’s goal The company had a return on equity of 7 per cent in 2019. The average return on equity in the past five years was 9 per cent.
In consultation with the board, the general meeting voted against the proposal for dividends due to the Covid19 situation. The board will continually assess developments and possibly return with a proposal to approve dividends for 2019 at a later stage in 2020.
About the company Nammo supplies hightechnology products to the aerospace and defence industry. The core business includes the development and production of rocket motors, military and sports ammunition, shoulderlaunched munitions systems and environmentallyfriendly demilitarisation services. The company was founded in 1998 through the merger of three major Nordic munitions companies with a view to strengthening security of supply in the Nordic region. Nammo’s head office is in Vestre Toten.
Important events in 2019• Nammo signed a framework agreement to
supply ammunition to the Norwegian Armed Forces. The agreement also entails an obligation to support Norway's security of supply.
• During the year, Nammo entered into several agreements relating to the development of new rangeextending propulsion systems for artillery and missiles.
• The company continued its improvement measures for optimising the organisation, corporate structure and cost structures to increase profitability in both the short and longterm.
• Measures were implemented to strengthen the company's sustainability work.
StrategyNammo’s strategy is to ensure it continues to have a high market share in the Nordic home market and profitable growth in the USA, Europe and other selected markets by supplying highperformance niche products to demanding customers and through strategic emergency response agreements with military customers in the Nordic region.
Responsible business conduct2019 saw the start of an internal assessment of Nammo’s sustainability work, including compliance with the OECD Due Diligence Guidance For Responsible Business Conduct. The company has adopted the accountability compass developed by the OECD's point of contact in Norway. All legal entities will be assessed and followedup in areas where improvements are necessary. An improved whistleblowing channel has been implemented at all the company's European entities. Work on a clearer sustainability strategy has been initiated and a materiality analysis has been carried out.
Statement of comprehensive income (NOK millions)
2019 2018
Operating revenues 5,073 4,920
Operating result (EBIT) 352 362
Result before tax and minority interests
305 332
Tax charge 115 91.5
- Minority interests 1.6 0
Result after tax and minority interests 192 240
Balance sheet
Total assets 6,229 6,084
Total equity 2,776 2,688
- Of which minority interests 0.6 0.9
Total debt and liabilities 3,453 3,396
Assets and dividend
Dividend for the financial year * 120.1
Dividend percentage * 50%
Average dividend percentage in the past five years
40% 50%
Dividend to the State * 60.1
Repayment of capital 0 0
Capital contributions from the State 0 0
Key figures
Capital employed 4,091 4,030
Operating margin (EBIT margin) 7% 7%
Return on equity in the past year 7% 9.2%
Average return on equity in the past five years
9.2% 9.8%
Return on capital employed in the past year
8.7% 9.2%
Equity ratio 45% 44%
Investments 293 307
Other key figures
Number of employees 2,404 2,435
Percentage employees in Norway 33% 32%
In consultation with the board, the general meeting voted against the proposal for dividends due to the Covid-19 situation. The board will continually assess developments and possibly return with a proposal to approve dividends for 2019 at a later stage in 2020.
25% 20%75% 80%Company Management group
Gender balance 2019
0 %2 %4 %6 %8 %
10 %12 %14 %
2016 2017 20182015 2019
Return on assets
Return on equity Return on capital employed
Photo: Nam
mo
Nammo AS
60 CATEGORY 2

Photo: Bård Gudim
/ Norsk H
ydro ASA
State ownershipThe State's rationale for ownership in Norsk Hydro ASA (Hydro) is to maintain a leading technology and industrial company with head office functions in Norway. The State’s goal as an owner is the highest possible return over time.
Attainment of the State’s goalIn 2019 the company had a shareholder return, including dividends, of 13.6 per cent. The average annual shareholder return, including dividends, over the past five years was 2.1 per cent. During the same periods, the Oslo Stock Exchange Benchmark Index had respective returns of 16.5 per cent and 10.1 per cent per year.
About the companyHydro is a global supplier of aluminium and has activities throughout the entire value chain. The State acquired a major stake in Hydro following the Second World War. Hydro is listed on the Oslo Stock Exchange and is headquartered in Oslo.
Important events in 2019 • New strategic agenda – clear objectives of
improving profitability and promoting sustainability to increase longterm value for stakeholders and contribute to a sustainable society.
• Implementation of strong measures, including a NOK 7.3 billion improvement programme (lifting of production embargo in Brazil amounted to NOK 2.7 billion), strategic review of the Rolled Products business area, revised organisational model, and new framework for capital allocation.
• Lifting of production embargo at Alunorte.
• Returned to normal operations after a serious cyber attack.
• The 2020 ambition of becoming carbonneutral from a lifecycle perspective was achieved in 2019, one year ahead of schedule, and the new objective is to reduce CO2 emissions by 30 per cent by 2030.
Strategy Hydro’s goal is to lift profitability and promote sustainability in order to increase longterm value for the company’s stakeholders. In terms of profitability, the most important target is delivering 10 per cent capital returns over the business cycle, which is to be achieved with NOK 7.3 billion in improvements and other portfolio optimisation.
Responsible business conduct Hydro's future profitability depends the company’s ability to operate in a sustainable manner. A set of ambitions has been quantified to improve the company’s performance on climate, environment and corporate social responsibility towards 2030. Reduced risk, safe operations, improved relations with stakeholders and communities, greater resource efficiency and lower emissions will enable Hydro’s business to be more robust. Hydro is working to develop new markets, including through new green brands: REDUXA, which has one of the world’s lowest carbon footprints (lower than 4kg of CO2 per kg of aluminium produced) and CIRCAL, which is produced with a minimum of 75 per cent postconsumer scrap. Compliance with laws, regulations and Hydro’s governing documents, as well as respect of human rights are also of fundamental importance to Hydro.
The company's principal objectives and results 2019
Long-term goals Indicator Goals 2019 Result 2019 (2018)
Return that exceeds the cost of capital
Return on capital Objective over the cycle <10 %
1.3% (6.6%)
Improvement Programme
EBIT improvements NOK 0.5 billion NOK 1 billion ()
Carbon neutral from a life cycle perspective**
Balance between direct and indirect emissions in relation to savings achieved through the user phase.
Achieved
CEO: Hilde Merete Aasheim Auditor: KPMG AS Website: www.hydro.com
Board of Directors:Dag Mejdell (chair) Irene Rummelhoff (vice chair) Marianne Wiinholt Finn Marum Jebsen Thomas Schulz Liselott Kilaas
Peter Kukielski Svein Kåre Sund* Arve Baade* Sten Roar Martinsen* * elected by the employeesState ownership: 34.26% The Ministry of Trade, Industry and Fisheries
Statement of comprehensive income (NOK millions)
2019 2018
Operating revenues 150,766 160,149
Underlying EBIT 3,359 9,069
Result before tax and minority interests
1,556 6,462
Tax charge 813 2,139
- Minority interests 558 67
Result after tax and minority interests
1,811 4,256
Balance sheet
Total assets 164,401 164,928
- Of which cash reserves 12,286 5,995
Total equity 84,081 90,756
- Of which minority interests 4,148 4,936
Total debt and liabilities 80,320 74,172
Assets and dividend
Market value at yearend 67,532 81,125
Market value of the State’s ownership interest at yearend
23,137 27,795
Closing price 32.6 39.2
Dividend for the financial year * 2,558
Dividend percentage 0% 60%
Average dividend percentage in the past five years
55% 57%
Dividend to the State * 886
Return in the past year 13.6% 34.3%
Average return in the past five years 2.1% 10.8%
Distributions in connection with the redemption and cancellation of shares
0 0
Capital contributions from the State 0 0
Key figures
Capital employed 109,096 109,471
Underlying EBIT margin 2% 6%
Equity ratio 51% 55%
Investments 10,907 7,614
Other key figures
Number of employees 36,310 36,236
Percentage employees in Norway 11% 11%
* The board of directors in Norsk Hydro ASA was granted a power of attorney at the annual general meeting in 2020 to resolve distribution of dividends based on the 2019 annual accounts. The power of attorney is to be used at the board's discretion and expires on the date of the annual general meeting in 2021 and is restricted to a maximum dividend payment of NOK 2.6 billion corresponding to NOK 1.25 per share.
Company Management group60%18% 40%82%
Gender balance 2019
* Underlying return on capital.
** Objective achieved one year ahead of schedule – new objective is to reduce CO2emissions by 30 per cent by 2030.
-40 %
-20 %
0 %
20 %
40 %
60 %
2016 2017 20182015 2019
Average total return, last five years*
*The graph shows share price performance including reinvested dividends as of 31.12 for each year Norway Oslo Benchmark
Norsk Hydro ASA
World / Aluminum -IND
020406080
100120140160180
2016 2017 20182015 2019
Accumulated total return, last five years *
*The graph shows what the value of NOK 100 (invested in 2015) would be worth as of 31 December 2019 by investing in Norsk Hydro, Oslo Stock Exchange and the relevant industry index.
Norsk Hydro ASA
61CATEGORY 2
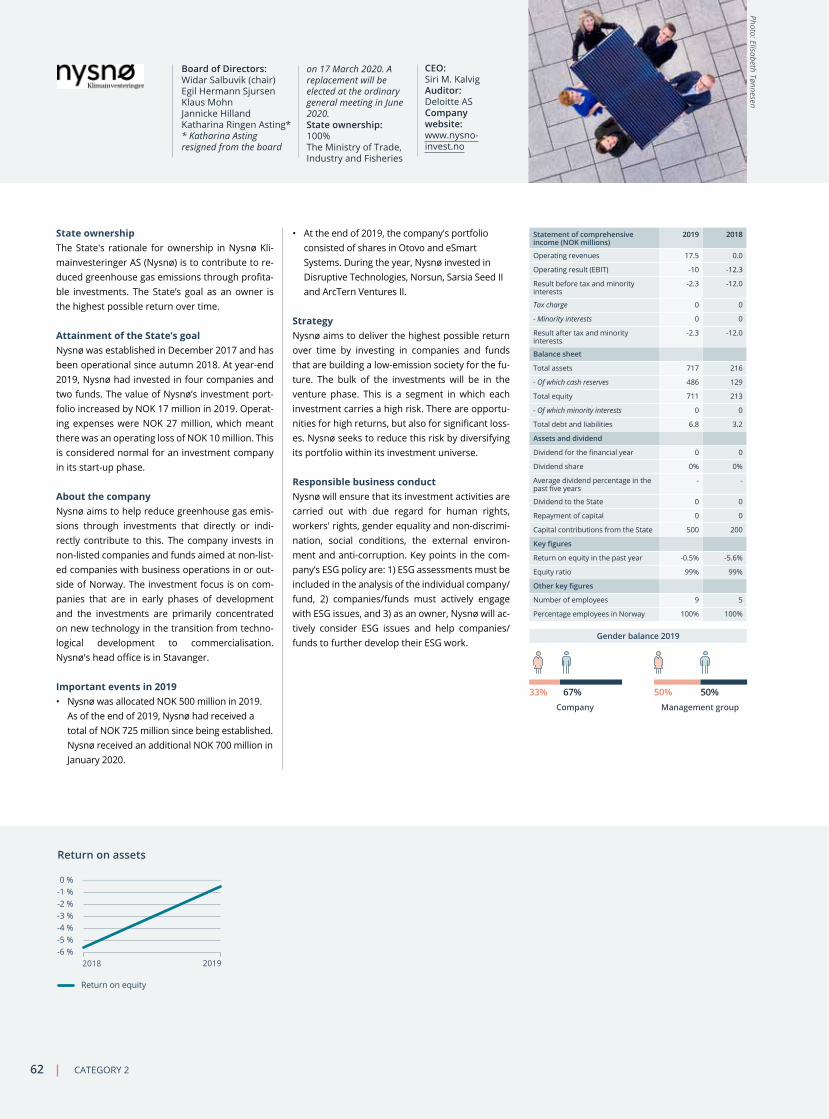
Photo: Elisabeth Tønnesen
State ownership The State's rationale for ownership in Nysnø Klimainvesteringer AS (Nysnø) is to contribute to reduced greenhouse gas emissions through profitable investments. The State’s goal as an owner is the highest possible return over time.
Attainment of the State’s goalNysnø was established in December 2017 and has been operational since autumn 2018. At yearend 2019, Nysnø had invested in four companies and two funds. The value of Nysnø’s investment portfolio increased by NOK 17 million in 2019. Operating expenses were NOK 27 million, which meant there was an operating loss of NOK 10 million. This is considered normal for an investment company in its startup phase.
About the company Nysnø aims to help reduce greenhouse gas emissions through investments that directly or indirectly contribute to this. The company invests in nonlisted companies and funds aimed at nonlisted companies with business operations in or outside of Norway. The investment focus is on companies that are in early phases of development and the investments are primarily concentrated on new technology in the transition from technological development to commercialisation. Nysnø's head office is in Stavanger.
Important events in 2019• Nysnø was allocated NOK 500 million in 2019.
As of the end of 2019, Nysnø had received a total of NOK 725 million since being established. Nysnø received an additional NOK 700 million in January 2020.
• At the end of 2019, the company's portfolio consisted of shares in Otovo and eSmart Systems. During the year, Nysnø invested in Disruptive Technologies, Norsun, Sarsia Seed II and ArcTern Ventures II.
StrategyNysnø aims to deliver the highest possible return over time by investing in companies and funds that are building a lowemission society for the future. The bulk of the investments will be in the venture phase. This is a segment in which each investment carries a high risk. There are opportunities for high returns, but also for significant losses. Nysnø seeks to reduce this risk by diversifying its portfolio within its investment universe.
Responsible business conduct Nysnø will ensure that its investment activities are carried out with due regard for human rights, workers' rights, gender equality and nondiscrimination, social conditions, the external environment and anticorruption. Key points in the company’s ESG policy are: 1) ESG assessments must be included in the analysis of the individual company/fund, 2) companies/funds must actively engage with ESG issues, and 3) as an owner, Nysnø will actively consider ESG issues and help companies/funds to further develop their ESG work.
CEO: Siri M. Kalvig Auditor: Deloitte ASCompany website: www.nysnoinvest.no
Board of Directors: Widar Salbuvik (chair) Egil Hermann Sjursen Klaus Mohn Jannicke Hilland Katharina Ringen Asting** Katharina Asting resigned from the board
on 17 March 2020. A replacement will be elected at the ordinary general meeting in June 2020.State ownership: 100% The Ministry of Trade, Industry and Fisheries
-6 %-5 %-4 %-3 %-2 %-1 %0 %
2018 2019
Return on assets
Return on equity
Statement of comprehensive income (NOK millions)
2019 2018
Operating revenues 17.5 0.0
Operating result (EBIT) 10 12.3
Result before tax and minority interests
2.3 12.0
Tax charge 0 0
- Minority interests 0 0
Result after tax and minority interests
2.3 12.0
Balance sheet
Total assets 717 216
- Of which cash reserves 486 129
Total equity 711 213
- Of which minority interests 0 0
Total debt and liabilities 6.8 3.2
Assets and dividend
Dividend for the financial year 0 0
Dividend share 0% 0%
Average dividend percentage in the past five years
Dividend to the State 0 0
Repayment of capital 0 0
Capital contributions from the State 500 200
Key figures
Return on equity in the past year 0.5% 5.6%
Equity ratio 99% 99%
Other key figures
Number of employees 9 5
Percentage employees in Norway 100% 100%
33% 50%67% 50%Company Management group
Gender balance 2019
Nysnø Klimainvesteringer AS
62 CATEGORY 2

State ownership The State's rationale for ownership in Posten Norge AS is to have a provider that can meet the State’s need for nationwide postal services. This is stipulated in the articles of association. Pursuant to the articles of association, the State’s goal as an owner is the highest possible return over time.
Attainment of the State’s goal The company had a return on equity after minority interests of 0.0 per cent in 2019. The average return on equity after minority interests in the past five years was 1.9 per cent.
About the company Posten Norge is a Nordic postal and logistics group which develops and supplies integrated solutions in postal, communications and logistics services. The company was divested from the State in 1996. Posten Norge's head office is in Oslo.
Important events in 2019• A majority of the Stortinget voted to allow mail
delivery every other day from 1 July 2020.
• Named Norway’s most innovative company by a professional jury under the auspices of the magazine "Innomag". Opened the "Innovation Hub", an arena for exploring and testing new services and which stimulates interdisciplinary work.
• Implemented measures for reducing carbon footprint such as the collaborative project “Elskede By” (Beloved cities) in which environmentallyfriendly vehicles transport parcels and goods to customers in the city centre, and carry waste back with them.
• Testing and launching of new services, including optional place of delivery (such as “Innenfor døren” (Indoors)), new tasks for delivery staff, common notice of change of address together with the Norwegian Tax Administration and a new delivery network (Post in Shops) in Sweden.
StrategyThe Group is positioning itself for longterm growth in the logistics segment particularly in the ecommerce sector. In order to meet new customer needs and offer attractive solutions to Nordic online stores, both capacity and networks are being expanded. Posten Norge is committed to innovation and is developing and launching new services to provide customers with greater freedom of choice and to make their everyday lives easier.
Responsible business conductFor Posten Norge, sustainability is about creating viable development in terms of economy, climate/environment and social conditions. After conducting a stakeholder analysis, the group has chosen to focus its efforts on four of the United Nations Sustainable Development Goals. These are: Decent work and economic growth (Goal 8), Industry, innovation and infrastructure (Goal 9), Sustainable cities and communities (Goal 11), and Climate action (Goal 13).
CEO: Tone Wille Auditor: Ernst & Young ASCompany website: www.postennorge.no
Board of Directors: Andreas Enger (chair) Anne Carine Tanum (vice chair) Finn Kinserdal Henrik Höjsgaard Liv Fiksdahl Tina Stiegler Lars Nilsen*
Tove Gravdal Rundtom* Ann Elisabeth Wirgeness* Odd Christian Øverland* * elected by the employeesState ownership: 100% The Ministry of Trade, Industry and Fisheries
Long-term goals Indicator Goals 2019
Result 2019 (2018)
No one should be injured or sick as a result of working in the Group. Sick leave 5.9% 5.9 % (6.0 %)
No one should be injured or sick as a result of working in the Group. Injury frequency (H2) 7.8 7.8 (8.7)
The gender balance among managers shall reflect the gender balance throughout the Group*
Percentage of female managers
31% 27% (28%)
Company's principal objectives and results 2019 (selection)
* Until and including 2019, the gender balance target among managers was expressed as an ambition to reflect the gender balance in the group as a whole, which was 31% in 2019. From and including 2020, the ambition is expressed as 31% female managers in 2020 and 35% in 2023, and as a target of 40% in 2030.
-2 %0 %2 %4 %6 %8 %
10 %12 %
2016 2017 20182015 2019
Return on assets
Return on equity Return on capital employed
Statement of comprehensive income (NOK millions)
2019 2018
Operating revenues 24,212 23,894
Operating result (EBIT) 157 407
Result before tax and minority interests
21.0 366
Tax charge 8 118
- Minority interests 15 2
Result after tax and minority interests
2 246
Balance sheet
Total assets 19,867 16,071
- Of which cash reserves 3,912 3,613
Total equity 6,363 6,481
- Of which minority interests 66 31
Total debt and liabilities 13,504 9,590
Assets and dividend
Dividend for the financial year 0 124
Dividend percentage 0% 50%
Average dividend percentage in the past five years
56% 61%
Dividend to the State 0 124
Repayment of capital 0 0
Capital contributions from the State 0 0
Key figures
Capital employed 13,930 10,406
Operating margin (EBIT margin) 1% 2%
Return on equity in the past year 0.0% 3.8%
Average return on equity in the past five years
1.9% 3.4%
Return on capital employed in the past year
4.6% 7.2%
Equity ratio 32% 40%
Investments 646 962
Public procurements
Ministry of Transport 619 536
Other key figures
Number of employees 14,270 15,021
Percentage employees in Norway 83% 82%
31% 50%69% 50%Company Management group
Gender balance 2019
Photo: Posten Norge AS
Posten Norge AS
63CATEGORY 2

Photo: Statkraft
Long-term goals Indicator Goals 2019 Result 2019 (2018)
Prevent corruption and unethical behaviour in all activities
Targets Zero serious compliance incidents
0 (0)
Deliver solid returns on investments ROACE 7% 16.3% (14.7%)
Efficient operation of the Nordic hydropower portfolio
Realised prices compared to market price
3.5% higher realised price than market
price
4.5% (4.8%)
Increase capacity in renewable energy (hydro, wind and solar power)
New capacity (GW) 9 GW growth within 20182025
1.4 GW
Greater diversity in terms of background, expertise and gender
Number of women in senior management positions
40% 27.5% (23%)
Company's principal objectives and results 2019 (selection)
Auditor: Deloitte ASCompany website: www.statkraft.no
Board of Directors: Thorhild Widvey (chair) Peter Mellbye (vice chair) Hilde Drønen Mikael Lundin Ingelise Arntsen Bengt Ekenstierna Vilde Eriksen Bjerknes* Asbjørn Sevlejordet*
Thorbjørn Holøs* * elected by the employeesState ownership: 100% Ministry of Trade, Industry and FisheriesCEO: Christian RynningTønnesen
State ownership The State's rationale for ownership in Statkraft SF is to own Norwegian hydropower resources and maintain a leading technology and industrial company with head office functions in Norway.This contributes to the development of Norwegian expertise within renewable energy. The State’s goal as an owner is the highest possible return over time.
Attainment of the State’s goalThe company had a return on equity of 12 per cent in 2019. The average return on equity in the past five years was 9 per cent.
About the company Statkraft is Europe's largest producer of renewable energy and a major player in the European energy market. The company also has both production and trading activities in selected markets in Asia and South America. The focal point of Statkraft’s activities is in Norway through the company’s Norwegian hydropower business. The company can also invest in profitable projects internationally. The company was divested from Statskraftverkene in 1992. Statkraft's head office is situated in Oslo.
Important events in 2019• Development of the company’s hydropower
portfolio, with 140 ongoing projects in the Nordic region at the end of 2019, as well as development projects in Albania, India and Chile.
• Completion of three of the wind farms for the Fosen project in Norway.
• Growth in solar and wind power, with investment decisions and ongoing projects in Ireland, Brazil, Chile and Norway.
• Strengthened trading activities – new energy agreements with industrial companies in Norway, and strong growth in longterm agreements with both renewable producers and industrial companies elsewhere in Europe.
StrategyDevelop Statkraft's hydropower portfolio, with reinvestments in Norway and Sweden, as well as acquisitions and new capacity in selected markets in Europe, South America and Asia.
Be a serious developer of solar and wind power. Growth in customer activities, with market services and longterm energy agreements for industrial customers and producers of renewables.
Responsible business conductEnergy production is the principal source of greenhouse gas emissions globally. Therefore, increased renewable energy production is essential for meeting climate targets. Statkraft is Europe's largest producer of renewable energy. All growth at Statkraft is within renewable energy.
Statkraft has a strong focus on further developing a good health and safety culture. Key elements include HSE (Health, Safety, and Environment) leadership, an improved framework for HSE management, and enhanced HSE in projects.
Statkraft seeks to share knowledge about renewable energy, energy systems, climate change and environmental issues.
Statement of comprehensive income (NOK millions)
2019 2018
Operating revenues 29,415 27,585
Operating result (EBIT) 17,010 15,480
Result before tax and minority interests
19,071 20,709
Tax charge 7,642 7,255
- Minority interests 417 680
Result after tax and minority interests 11,012 12,775
Balance sheet
Total assets 174,985 179,739
- Of which cash reserves 15,214 23,261
Total equity 98,177 95,251
- Of which minority interests 4,382 3,970
Total debt and liabilities 76,809 84,487
Assets and dividend
Dividend for the financial year 6,454 8,444
Dividend percentage 59% 66%
Average dividend percentage in the past five years
68% 85%
Dividend to the State 6,454 8,444
Repayment of capital 0 0
Capital contributions from the State 0 0
Key figures
Capital employed 130,637 131,733
Operating margin (EBIT margin) 58% 56%
Return on equity in the past year 12.3% 14.5%
Average return on equity in the past five years
9.2% 8.0%
Return on capital employed in the past year
16.7% 17.0%
Equity ratio 56% 53%
Investments 7,423 6,982
Other key figures
Number of employees 3,973 3,557
Percentage employees in Norway 55% 57%
26% 29%74% 71%Company Management group
Gender balance 2019
-5 %
0 %
5 %
10 %
15 %
20 %
2016 2017 20182015 2019
Return on assets
Return on equity Return on capital employed
Statkraft SF
64 CATEGORY 2

Photo: Telenor ASA
State ownership The State's rationale for ownership in Telenor ASA is to maintain a leading technology and industrial company with head office functions in Norway. The State’s goal as an owner is the highest possible return over time.
Attainment of the State’s goalIn 2019, the company had a shareholder return, including dividends, of 1.5 per cent. The average annual shareholder return, including dividends, over the past five years was 6.4 per cent. During the same periods, the Oslo Stock Exchange Benchmark Index had respective returns of 16.5 per cent and 10.1 per cent per year.
About the company Telenor is a global mobile operator with 186 million mobile subscriptions. The company was established in 1994 through the conversion of Televerket into a limited liability company. Telenor is listed on the Oslo Stock Exchange and has its head office in Bærum.
Important events in 2019 • In December, Telenor commenced the
commercial rollout of 5G in Finland. During 2019, Telenor launched several 5G pilot projects and opened Malaysia's first 5G lab.
• Telenor acquired the Finnish telecom operator DNA Plc. The acquisition strengthens Telenor's position in the Nordic region, and means that the company has business operations in Norway, Sweden, Denmark and Finland.
• The company was in talks with the Malay Axiata Group with the aim of merging Telenor's Asian operations with Axiata's operations in selected Asian countries. The talks were unsuccessful.
Strategy Deliver growth through targeted customer services that fuel the persistent need for connectivity and related services. Continue to innovate the company’s core business and be a leader in modernisation.
Responsible business conduct In 20202021, Telenor plans to reinforce its strong foundation for ethical and responsible business operations through the means by which commercial risk is managed, including how customer data is managed, and in the company’s role as a global citizen that is working towards achieving its climate ambitions.
Company's principal objectives and results 2019 (selection)
Long-term goals
Indicator Goals 2019 Result 2019 (2018)
Low singledigit yearonyear organic sales growth.
Operating revenues (organic growth, i.e. adjusted for currency effects and business acquisitions and disposals)
approx. 2018 level
(subscription and traffic revenues)
+ 0.4% ( 0.4%)(subscription
and traffic revenues)
Efficiency and prioritisation of investments
[Investments excluding licenses and frequencies] / operating revenues (%)
Approx 15% 15.3% (15.8%)
13% annual reduction in operating expenses
Operating expenses (adjusted for foreign currency effects and business acquisitions)
13% reduction 0.8 % (3%) reduction
CEO: Sigve BrekkeAuditor: EY ASWebsite: www.telenor.com
Board of Directors: Gunn Wærsted (chair) Jørgen Kildahl (vice chair) Sally Margaret Davis Grethe Viksaas Jon Erik Reinhardsen Jacob Aqraou
Anita Helen Steine* Jan Otto Eriksen* Esben Smistad* * elected by the employeesState ownership: 53.97% The Ministry of Trade, Industry and Fisheries
Statement of comprehensive income (NOK millions)
2019 2018
Operating revenues 113,666 105,923
Operating result (EBIT) 25,702 20,945
Result before tax and minority interests 20,968 17,701
Tax charge 9,033 6,024
- Minority interests 3,421 2,711
Result after tax and minority interests 7,773 14,731
Balance sheet
Total assets 248,899 191,272
- Of which cash reserves 13,867 18,492
Total equity 43,339 54,455
- Of which minority interests 5,286 5,009
Total debt and liabilities 205,559 136,817
Assets and dividend
Market value at yearend 227,115 246,469
Market value of the State’s ownership interest at yearend
122,574 133,019
Closing price 157.5 167.5
Dividend for the financial year 12,121 18,381
Dividend percentage 156% 125%
Average dividend percentage in the past five years
161% 153%
Dividend to the State 6,541 9,919
Return in the past year 1.5% 2.8%
Average return in the past five years 6.4% 8.8%
Distributions in connection with the redemption and cancellation of shares
2,380 2,733
Capital contributions from the State 0 0
Key figures
Capital employed* 188,361 125,262
Operating margin (EBIT margin) 23% 20%
Equity ratio 17% 28%
Investments 45,882 31,296
Other key figures
Number of employees 21,089 20,571
Percentage employees in Norway 22% 25%
37% 30%63% 70%Company Management group
Gender balance 2019
* The figures for 2019 include leasing debt. This was not the case for 2018.
-20 %-10 %
0 %10 %20 %30 %40 %50 %
2016 2017 20182015 2019
Average total return, last five years*
*The graph shows share price performance including reinvested dividends as of 31.12 for each year
Norway Oslo Benchmark Telenor ASA
STOXX Europe 600 Optimised / Telecommunications - SS
020406080
100120140160180
2016 2017 20182015 2019
Accumulated total return, last five years *
*The graph shows what the value of NOK 100 (invested in 2015) would be worth as of 31 December 2019 by investing in Telenor, Oslo Stock Exchange and the relevant industry index.
Telenor ASA
65CATEGORY 2

Photo: Ivar Kvaal
Long-term goals Indicator Goals 2019
Result 2019 (2018)
Growth in number of journeys Growth in the number of journeys for passenger
trains Growth in the number of express bus trips
2.8%
5.7%
2.8% (6.4%) 6% (5.2%)
High level of punctuality for passenger trains
Total punctuality Operatordependent
punctuality
91%
98%
86.3% (85.8%) 97.7%
(97.6%)
High level of punctuality for freight trains
Punctuality to customer 91% 95% (92%)
Low sick leave Percentage sick leave 7.3% 7.1% (7.8%)
Company's principal objectives and results 2019 (selection)
18% 29%82% 71%Company Management group
Gender balance 2019
Grethe Therese Thorsen* *elected by the employeesState ownership: 100% Ministry of TransportCEO: Geir Isaksen Auditor: Deloitte AS
Board of Directors:Dag Mejdell (chair) Åsne Havnelid (vice chair) Geir Inge Stokke Wenche Teigland Semming Semmingsen Ove Sindre Lund* Jan Audun Stand*
State ownership The State's rationale for ownership in Vygruppen AS (Vy) is to have a provider that can meet the State’s need for the transport of passengers and freight by rail. The State’s goal as an owner is the highest possible return over time.
Attainment of the State’s goalThe company had a return on equity of 12 per cent in 2019. The average return on equity in the past five years was 13 per cent.
About the company Vygruppen (Vy) is a transport group with operations in Norway and Sweden. The business activities primarily consist of rail passenger services, rail freight transport and bus services. The company was divested from the State in 1996 and has been organised as a Stateowned limited company since 2002. Vy’s head office is in Oslo.
Important events in 2019• On 12 March, Nettbuss and NSB announced a
change to a single collective brand name Vy.
• On 9 December, Vy came out on top in the competitive tender for the operation of rail services in Western Norway.
• In 2019, Vy Buss was awarded five contracts in Norway and two in Sweden on the basis of competitive tendering procedures.
• In 2019, 78.7 million environmentallyfriendly train journeys and 125.9 million bus trips were made with Vy. The growth in travel for passenger trains in Norway was 2.8 per cent.
StrategyVy's corporate strategy "The Best Journey" consists of four types of journeys: the smart journey, the green journey, the safe journey and the profitable journey. These journeys have the following strategic themes: the smart journey that will make it easy to travel environmentally friendly by public transport, the green journey that will reduce emissions per trip, the safe journey that creates security and diversity, and the profitable journey that provides efficient use of resources.
Responsible business conductThe board assesses Vygruppen’s strategy on an annual basis. Among other things, the assessment is based on risk analyses, materiality analyses related to sustainability, assessments of the market and development of competition, as well as internal analyses.
Vygruppen’s most important sustainability contribution is to make it easy to travel environmentallyfriendly by public transport. This is primarily measured by the growth in the number of journeys. At the same time, Vy will reduce greenhouse gas emissions by reducing energy consumption and switching to fossilfree alternatives and reduce injuries and sick leave.
0 %
5 %
10 %
15 %
20 %
25 %
2016 2017 20182015 2019
Return on assets
Return on equity Return on capital employed
Statement of comprehensive income (NOK millions)
2019 2018
Operating revenues 17,065 15,895
Operating result (EBIT) 660 701
Result before tax and minority interests 699 585
Tax charge 135 120
- Minority interests 0 0
Result after tax and minority interests 564 465
Balance sheet
Total assets 16,772 17,795
- Of which cash reserves 1,395 1,709
Total equity 4,873 4,869
- Of which minority interests 0 0
Total debt and liabilities 11,899 12,926
Assets and dividend
Dividend for the financial year 0 233
Dividend percentage 0% 50%
Average dividend percentage in the past five years
23% 32%
Dividend to the State 0 233
Repayment of capital 0 0
Capital contributions from the State 0 0
Key figures
Operating margin (EBIT margin) 4% 4%
Return on equity in the past year 11.6% 9.4%
Average return on equity in the past five years
13.2% 14.5%
Return on capital employed in the past year
6.5% 8.1%
Equity ratio 29% 27%
Investments 2,074 1,087
Public procurements
Norwegian Railway Directorate 3,962 3,682
Other key figures
Number of employees 11,666 10,999
Percentage employees in Norway 82% 85%
Company website: www.vy.no
Vygruppen AS
66 CATEGORY 2
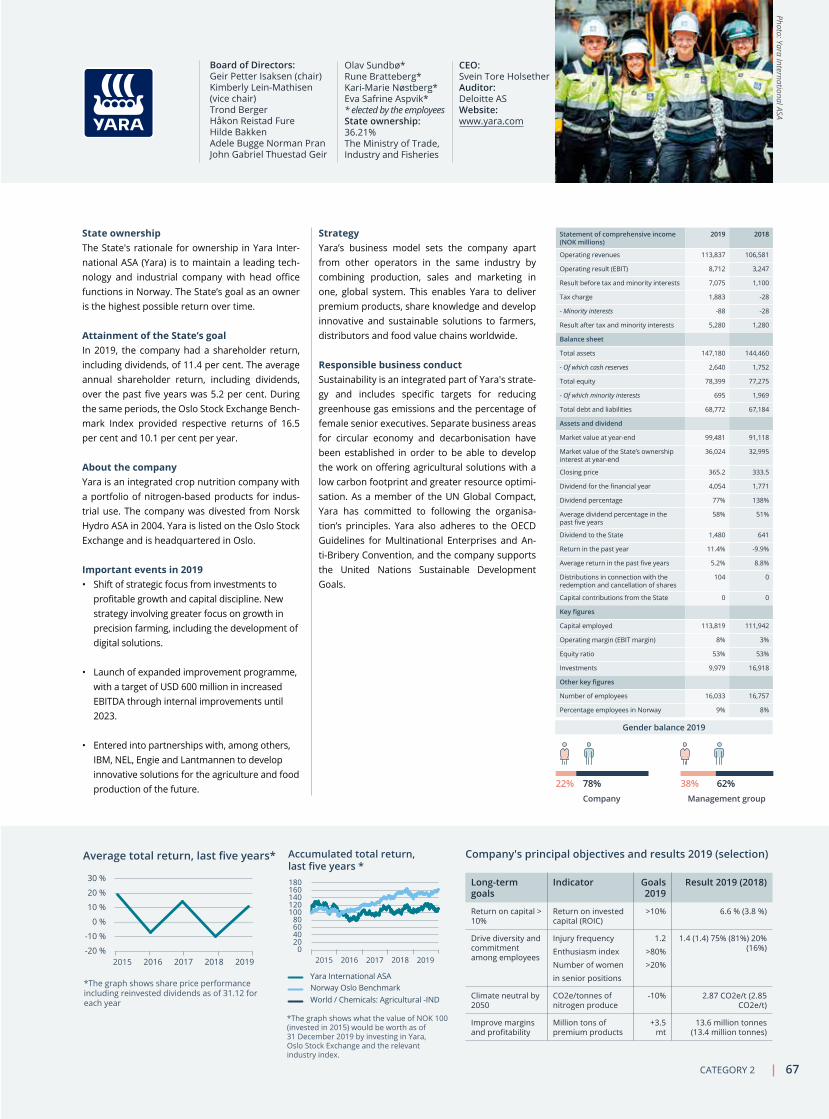
Photo: Yara International ASA
Company's principal objectives and results 2019 (selection)
Long-term goals
Indicator Goals 2019
Result 2019 (2018)
Return on capital > 10%
Return on invested capital (ROIC)
>10% 6.6 % (3.8 %)
Drive diversity and commitment among employees
Injury frequency
Enthusiasm index
Number of women
in senior positions
1.2
>80%
>20%
1.4 (1.4) 75% (81%) 20% (16%)
Climate neutral by 2050
CO2e/tonnes of nitrogen produce
10% 2.87 CO2e/t (2.85 CO2e/t)
Improve margins and profitability
Million tons of premium products
+3.5 mt
13.6 million tonnes (13.4 million tonnes)
CEO: Svein Tore HolsetherAuditor: Deloitte ASWebsite: www.yara.com
Board of Directors:Geir Petter Isaksen (chair) Kimberly LeinMathisen (vice chair) Trond Berger Håkon Reistad Fure Hilde Bakken Adele Bugge Norman Pran John Gabriel Thuestad Geir
Olav Sundbø* Rune Bratteberg* KariMarie Nøstberg* Eva Safrine Aspvik* * elected by the employeesState ownership: 36.21% The Ministry of Trade, Industry and Fisheries
State ownership The State's rationale for ownership in Yara International ASA (Yara) is to maintain a leading technology and industrial company with head office functions in Norway. The State’s goal as an owner is the highest possible return over time.
Attainment of the State’s goalIn 2019, the company had a shareholder return, including dividends, of 11.4 per cent. The average annual shareholder return, including dividends, over the past five years was 5.2 per cent. During the same periods, the Oslo Stock Exchange Benchmark Index provided respective returns of 16.5 per cent and 10.1 per cent per year.
About the company Yara is an integrated crop nutrition company with a portfolio of nitrogenbased products for industrial use. The company was divested from Norsk Hydro ASA in 2004. Yara is listed on the Oslo Stock Exchange and is headquartered in Oslo.
Important events in 2019 • Shift of strategic focus from investments to
profitable growth and capital discipline. New strategy involving greater focus on growth in precision farming, including the development of digital solutions.
• Launch of expanded improvement programme, with a target of USD 600 million in increased EBITDA through internal improvements until 2023.
• Entered into partnerships with, among others, IBM, NEL, Engie and Lantmannen to develop innovative solutions for the agriculture and food production of the future.
Strategy Yara’s business model sets the company apart from other operators in the same industry by combining production, sales and marketing in one, global system. This enables Yara to deliver premium products, share knowledge and develop innovative and sustainable solutions to farmers, distributors and food value chains worldwide.
Responsible business conduct Sustainability is an integrated part of Yara's strategy and includes specific targets for reducing greenhouse gas emissions and the percentage of female senior executives. Separate business areas for circular economy and decarbonisation have been established in order to be able to develop the work on offering agricultural solutions with a low carbon footprint and greater resource optimisation. As a member of the UN Global Compact, Yara has committed to following the organisation’s principles. Yara also adheres to the OECD Guidelines for Multinational Enterprises and AntiBribery Convention, and the company supports the United Nations Sustainable Development Goals.
Statement of comprehensive income (NOK millions)
2019 2018
Operating revenues 113,837 106,581
Operating result (EBIT) 8,712 3,247
Result before tax and minority interests 7,075 1,100
Tax charge 1,883 28
- Minority interests 88 28
Result after tax and minority interests 5,280 1,280
Balance sheet
Total assets 147,180 144,460
- Of which cash reserves 2,640 1,752
Total equity 78,399 77,275
- Of which minority interests 695 1,969
Total debt and liabilities 68,772 67,184
Assets and dividend
Market value at yearend 99,481 91,118
Market value of the State’s ownership interest at yearend
36,024 32,995
Closing price 365.2 333.5
Dividend for the financial year 4,054 1,771
Dividend percentage 77% 138%
Average dividend percentage in the past five years
58% 51%
Dividend to the State 1,480 641
Return in the past year 11.4% 9.9%
Average return in the past five years 5.2% 8.8%
Distributions in connection with the redemption and cancellation of shares
104 0
Capital contributions from the State 0 0
Key figures
Capital employed 113,819 111,942
Operating margin (EBIT margin) 8% 3%
Equity ratio 53% 53%
Investments 9,979 16,918
Other key figures
Number of employees 16,033 16,757
Percentage employees in Norway 9% 8%
22% 38%78% 62%Company Management group
Gender balance 2019
-20 %
-10 %
0 %
10 %
20 %
30 %
Average total return, last five years*
*The graph shows share price performance including reinvested dividends as of 31.12 for each year
2016 2017 20182015 20190
20406080
100120140160180
Yara International ASA
World / Chemicals: Agricultural -IND Norway Oslo Benchmark
2016 2017 20182015 2019
Accumulated total return, last five years *
*The graph shows what the value of NOK 100 (invested in 2015) would be worth as of 31 December 2019 by investing in Yara, Oslo Stock Exchange and the relevant industry index.
Yara International ASA
67CATEGORY 2
This category comprises the companies where the State’s goal is the most efficient possible attainment of public policy goals. The State's rationale for ownership and the State's goal as owner are stated on the company pages. The companies in Category 3 do not primarily operate in competition with other companies. Some of the companies may nonetheless engage in some activities in which they operate in competition with others. In such cases, the State’s goal is normally the highest possible return over time in this limited part of the company’s operations.
Goal of the most efficient possible attainment of public policy goals
Category
3
Andøya Space Center AS 70Avinor AS 71Bane Nor SF 72Bjørnøen AS 73Carte Blanche AS 74Den Nationale Scene 75Andøya Space Center AS 76Den Norske Opera & Ballett AS 76Avinor AS 77Eksportkreditt Norge AS 77Enova 78Entur AS 79Fiskeri- og havbruksnæringens forskningsfinansiering AS 80Gassco AS 81Gassnova SF 82Graminor AS 83Helse Midt-Norge RHF 84Helse Nord RHF 85Helse Sør-Øst RHF 86Helse Vest 87Innovasjon Norge 88Kimen Såvarelaboratoriet AS 89Kings bay 90Nationaltheatret AS 91Nofima AS 92
Norsk Institutt for Odontologiske Materialer AS 93Norfund 94Norges Sjømatråd 95Norsk Helsenett SF 96Norsk rikskringkasting AS 97Norsk Tipping 98Norske tog AS 99Norsk senter for forskningsdata AS 100Nye veier AS 101Petoro AS 102Rogaland teater AS 103Simula Research Laboratory AS 104Siva – Selskapet for Industrivekst SF 105Space Norway AS 106Statnett SF 107Statskog SF 108Staur gård AS 109Store Norske Spitsbergen Kulkompani AS 110Talent Norge AS 111Trøndelag Teater AS 112Universitetssenteret på Svalbard AS 113Vinmonopolet AS 114

The Norw
egian Opera and Ballet. Photo: Erik Berg
69

Photo: Trond Abrahamsen
Auditor: VesterålsRevisjon ASCompany website: www.andoyaspace.no
Board of Directors:Rasmus Sunde (chair) Rolf Skatteboe (vice chair) Stine Ramstad Westby Grete Ellingsen Bjørn Kanck Trond Hegrestad Christina Aas Terje Lundemo Endresen*
Ingrid Hanssen* * elected by the employeesState ownership: 90% The Ministry of Trade, Industry and FisheriesCEO: Odd Roger Enoksen
State ownership The State’s rationale for ownership in Andøya Space Center AS is to ensure that Norwegian business and industry, research communities and public administration have good access to infrastructure for testing technology and scientific research. The State’s goal as owner is to strengthen technological and scientific expertise in Norwegian business and industry, research communities and public administration.
Attainment of the State’s goalAndøya Space Center achieves this goal by providing infrastructure, equipment and expertise to business and industry, the defence sector, research communities and public administration to conduct relevant measurements, testing, exercises and training.
About the company Andøya Space Center supplies operational services and products for space and atmospheric research, environmental monitoring and technology testing and verification. The company also contributes to knowledge development and interest in these areas. The company was established in 1997 when it was split from the Norwegian Space Centre foundation. Andøya Space Center's head office is in Andøya.
Important events in 2019• Submission of application for capital to launch
small satellites.
• Completion of the rocket projects for NASA and the University of Oslo.
• Development of the drone service, with an emphasis on emergency preparedness.
StrategyAndøya Space Center shall be the preferred aerospace and defence service provider in Arctic areas.
The Andøya Space Center group shall be a supplier to Norwegian and international customers by operating launch services and associated services relating to research rockets, drones and small satellites, conducting groundbased remote sensing and assisting in the testing of military weapons systems.
Responsible business conductThe Andøya Space Center group works with responsible business conduct by having efficient operations, offering places for apprentices, supporting social services aimed at children and young people, and through compliance with the internal ethical guidelines and environmental monitoring programme.
Statement of comprehensive income (NOK millions)
2019 2018
Operating revenues 167.7 141.4
Operating result (EBIT) 7.2 10.9
Result before tax and minority interests 5.7 10.5
Tax charge 4.2 0.4
- Minority interests 0 0
Result after tax and minority interests 9.9 10.9
Balance sheet
Total assets 233.8 188.8
- Of which cash reserves 34.3 28.2
Total equity 107.5 97.6
- Of which minority interests 0 0
Total debt and liabilities 126.3 91.2
Public procurements/grants
Procurements: European Space Agency 37.7 36.4
Grants: Norwegian Directorate for Education and Training
16.2 15.4
Assets and dividend
Dividend for the financial year 0 0
Dividend share 0% 0%
Average dividend percentage in the past five years
0% 0%
Dividend to the State 0 0
Repayment of capital 0 0
Capital contributions from the State 0 0
Key figures
Capital employed 196 148
Operating margin (EBIT margin) 4% 8%
Equity ratio 46% 52%
Investments 40.5 30.7
Other key figures
Number of employees 94 94
Percentage employees in Norway 100% 99%
28% 25%72% 75%Company Management group
Gender balance 2019
Andøya Space Center AS
70 CATEGORY 3

Photo: CatchLightFotostudio AS
Website: www.avinor.no
Board of Directors:Anne Carine Tanum (chair) Ola Henrik Strand (vice chair) Linda Bernander Silseth Eli Skrøvset Herlof Nilssen Olav Aadal* Heidi Anette Sørum* Bjørn Tore Mikkelsen* * elected by the employees
State ownership: 100% Ministry of TransportCEO: Dag FalkPetersenAuditor: EY AS
State ownership The State’s goal as owner in Avinor AS is to own, operate and develop a nationwide network of airports for the civilian sector and joint air navigation services for the civilian and military sectors. It is a requirement for the company to be run efficiently.
Attainment of the State’s goalThe group’s total operating revenues in 2019 were NOK 11,785 million (NOK 11,724 million), and the profit after tax was NOK 702 million (NOK 1,170 million). Operating expenses totalled NOK 8,151 million in 2019 (NOK 7,523 million), an increase of 8.3 per cent, which was primarily due to increased provisions for cleanup costs related to environmental contaminants at Avinor’s firefighting exercise area. Avinor's investments in 2019 totalled NOK 2,535 million (NOK 2,057 million). No dividend was paid in 2020 for the 2019 financial year. NOK 585 million in dividends was paid in 2019.
About the company Avinor AS was established in 2003 when the Norwegian Civil Aviation Authority (Luftsfartsverket) was converted into a Stateowned limited company and comprises 43 airports and air navigation services for the civilian and military sectors. Avinor shall be selffinanced insofar as this is possible through its own revenues from its primary and commercial activities. Within the company, operations are managed as a single entity, such that the financially profitable airports help finance unprofitable airports.
Important events in 2019• On 19 October 2019, Røst Airport became the
first to have its tower remotely operated from Bodø Remote Tower Center.
• In May 2019, Avinor handed over the operation of Haugesund Airport to the local operator Lufthavndrift AS.
• Work commenced on planning the new airport in Bodø.
StrategyThe following primary objectives are defined in Avinor’s strategic plan for 20182023: Contributing to the sustainable growth of Norway and its regions (Social development), creating valuable experiences for passengers and visitors (Business development), developing a competitive company (Airport development), and developing a proud and improvementoriented corporate culture (Organisational development).
Responsible business conductAviation will contribute to the growth and transformation of Norwegian society and business as a whole and Avinor will facilitate further development and expected growth in air traffic, while at the same time ensuring compliance with national climate targets and international climate commitments. Alongside airlines, the Norwegian Civil Aviation Authority, and other aviation stakeholders, Avinor has for several years been an active contributor to international efforts relating to the climate and is at the forefront of paving the way for sustainable aviation in the future. Electrification and increased use of sustainable biofuels are key elements in these efforts.
The company's principal objectives and results 2019 (selection)
Long-term goals Indicator Goals 2019 Result 2019 (2018)
High level of predictability for passengers Regularity 98% 98% (98%)
Punctuality 88% 84% (84%)
High level of safety Serious aviation incidents 0 1 (0)
Aviation accidents with/without personal injury 0 0 (0)
Highest possible return within the public policy framework Return on invested capital 5.1% 3% (4.2%)
Statement of comprehensive income (NOK millions)
2019 2018
Operating revenues 11,785 11,724
Operating result (EBIT) 1,463 2,097
Result before tax and minority interests
900 1,497
Tax charge 198 327
- Minority interests 0 0
Result after tax and minority interests
702 1,170
Balance sheet
Total assets 44,162 43,690
- Of which cash reserves 1,059 1,740
Total equity 15,279 14,541
- Of which minority interests 0 0
Total debt and liabilities 28,883 29,149
Public procurements/grants
Procurements 0 0
Grants 0 0
Assets and dividend
Dividend for the financial year 0 585
Dividend percentage 0% 50%
Average dividend percentage in the past five years
32% 36%
Dividend to the State 0 585
Repayment of capital 0 0
Capital contributions from the State 0 0
Key figures
Capital employed 35,373 36,282
Operating margin (EBIT margin) 12% 18%
Equity ratio 35% 33%
Investments 2,535 2,056
Other key figures
Number of employees 3,012 3,099
Percentage employees in Norway 100% 100%
23% 42%77% 58%Company Management group
Gender balance 2019
Avinor AS
71CATEGORY 3

Photo: Øyvind H
aug
Political policy activities - the company's principal objectives and results 2019 (selection)
Business subject to competition – the company's principal objectives and results 2019 (selection)
Long-term goals Indicator Goals 2019 Result 2019 (2018)
Providing Europe's safest railway
Number of deaths 0 5 (5)
Number of seriously injured
0 6 (4)
Be among the most operationally stable railway infrastructure managers in Europe
Punctuality, all passenger trains
90% 89.2% (88.7%)
Punctuality, all freight trains
80% 78.2% (73%)
Productivity increase of 15% compared with 2018
Productivity ≥ 3 % 12.5% ()
Bane NOR Eiendom AS with subsidiaries
Long-term goals Indicator Goals 2019
Result 2019 (2018)
High financial occupancy rate
Percentage of leased area in terms of rental value
94% 95% (93%)
Competitive customer satisfaction
Customer satisfaction score questionnaire
78 72 (74)
Satisfactory return on the property portfolio
Value development + direct return for the property portfolio in Bane NOR Eiendom AS
4.3% 7% ()
Website: www.banenor.no
Board of Directors:Siri Beate Hatlen (chair) Olaf Trygve Melbø (vice chair) Ane Rongen Breivega Toril Nag Baard Haugen Torfinn Håverstad* Solbjørg Engeset* * elected by the employeesState ownership:
100% Ministry of TransportCEO:Gorm Frimannslund Auditor: PwC AS
State ownershipThe State’s rationale for ownership in Bane NOR SF is to ensure the management and development of national railway infrastructure and railway property. The State’s goal as owner is costefficient management and development of safe, accessible railway infrastructure and railwayrelated property activities.
Attainment of the State’s goalBane NOR’s profit for 2019 was NOK 427 million, which was primarily due to profits from the sale of property in Bane NOR Eiendom AS. Following challenges with punctuality after the summer maintenance work in 2019, Bane NOR generally had a relatively satisfactory result in terms of punctuality. For the part of the business that is subject to competition (Bane NOR Eiendom AS), Bane NOR had value growth and a direct return of 7.0 per cent in 2019.
About the company Bane NOR is responsible for the planning, development, management, operation and maintenance of the national rail network, for traffic management, and for the management and development of railway property. Bane NOR was founded in 2016, and in 2017, the majority of the activities of the administrative agency the Norwegian National Rail Administration (Jernbaneverket) were transferred to Bane NOR. Bane NOR’s head office is situated in Oslo.
Important events in 2019• Establishment of the subsidiary Spordrift AS,
which took over the operation and maintenance of the railway infrastructure on 1 July 2019. The services will be gradually exposed to competition until 1 October 2027.
• In February 2019, drilling work was completed on the Follobane Tunnel, which is part of the largest ongoing infrastructure project on the Norwegian railway network and is Norway’s longest railway tunnel.
• Construction was cleared to commence for the Drammen–Kobbervikdalen and Nykirke–Barkåker projects. The projects are an important part of the InterCity development, which will give shorter travel times, better punctuality and increased frequency.
StrategyBane NOR’s vision is “Norway on rails”. The company will achieve the objectives in the railway reform through the strategic focus areas of “Safety”, “More rail for the money”, “Customers first” and “Futureoriented contributor to society”. The strategy and strategic focus areas are put into operation through indicators and targets.
Responsible business conductThe company works to make a positive impact in the areas closest to the core business, analyse the risk situation and opportunities and initiate measures when necessary. Together with Bane NOR's stakeholders, the company has identified ten areas of importance to be assigned particular focus in the future and progress on these will be reported.
Statement of comprehensive income (NOK millions)
2019 2018
Operating revenues 14,281 15,208
Operating result (EBIT) 475 633
Result before tax and minority interests
529 659
Tax charge 102 30
- Minority interests 0 0
Result after tax and minority interests
427 629
Balance sheet
Total assets 186,378 178,082
- Of which cash reserves 2,114 1,899
Total equity 10,948 9,976
- Of which minority interests 0 0
Total debt and liabilities 175,430 168,106
Public procurements/grants
Procurements: Norwegian Railway Directorate
20,642 18,434
Grants 0 0
Assets and dividend
Dividend for the financial year 0 0
Dividend share 0% 0%
Average dividend percentage in the past five years
0% 0%
Dividend to the State 0 0
Repayment of capital 0 988
Capital contributions from the State 0 0
Key figures
Capital employed 20,250 20,480
Operating margin (EBIT margin) 3 % 4%
Equity ratio 6% 6%
Investments 0 0
Other key figures
Number of employees 4,612 4,532
Percentage employees in Norway 100% 100%
35% 50%65% 50%Company Management group
Gender balance 2019
Bane Nor SF
72 CATEGORY 3

Photo: Kings Bay AS
State ownership Bjørnøen AS owns all the land and some historic buildings on the Arctic island of Bjørnøya. Bjørnøya is a nature reserve and is largely protected. Bjørnøen was taken over by the State in 1932 and placed under the management of Kings Bay AS, which also supplies management services to Bjørnøen, in 1967. Bjørnøen's head office is in NyÅlesund.
In cooperation with the Ministry of Trade, Industry and Fisheries, the Ministry of Climate and Environment will assess whether to transfer title to the land on Bjørnøya to the Ministry of Trade, Industry and Fisheries, which manages all Stateowned land in Svalbard.
Attainment of the State’s goalThe company manages the State’s ownership of the land on Bjørnøya. Among other things, this takes place through a lease agreement with the Norwegian Meteorological Institute, which has a meteorological station on Bjørnøya.
About the company The State’s rationale for ownership in Bjørnøen is to manage the State’s ownership of the land on Bjørnøya. The State’s goal as owner is to manage the State’s ownership of the land on Bjørnøya.
Statement of comprehensive income (NOK millions)
2019 2018
Operating revenues 0.2 0.2
Operating result (EBIT) 0 0
Result before tax and minority interests 0 0
Tax charge 0 0
- Minority interests 0 0
Result after tax and minority interests 0 0
Balance sheet
Total assets 4.2 4.2
- Of which cash reserves 0 0
Total equity 4.1 4.1
- Of which minority interests 0 0
Total debt and liabilities 0.1 0.1
Public procurements/grants
Procurements 0 0
Grants 0 0
Assets and dividend
Dividend for the financial year 0 0
Dividend share 0% 0%
Average dividend percentage in the past five years
0% 0%
Dividend to the State 0 0
Repayment of capital 0 0
Capital contributions from the State 0 0
Key figures
Capital employed 4.1 4.1
Operating margin (EBIT margin) 0% 0%
Equity ratio 98% 98%
Investments
Number of employees 0 0
Percentage employees in Norway 0% 0%
Board of Directors: Tor Instanes (chair) Widar Salbuvik (vice chair) Ellen Langeggen Elin Bang Tverfjeld
State ownership: 100% Ministry of Climate and EnvironmentCEO:Per Erik Hanevold
Auditor: PwC ASWebsite: www.kingsbay.no
0% 0%0% 0%
Company Management group
Gender balance 2019
Bjørnøen AS
73CATEGORY 3
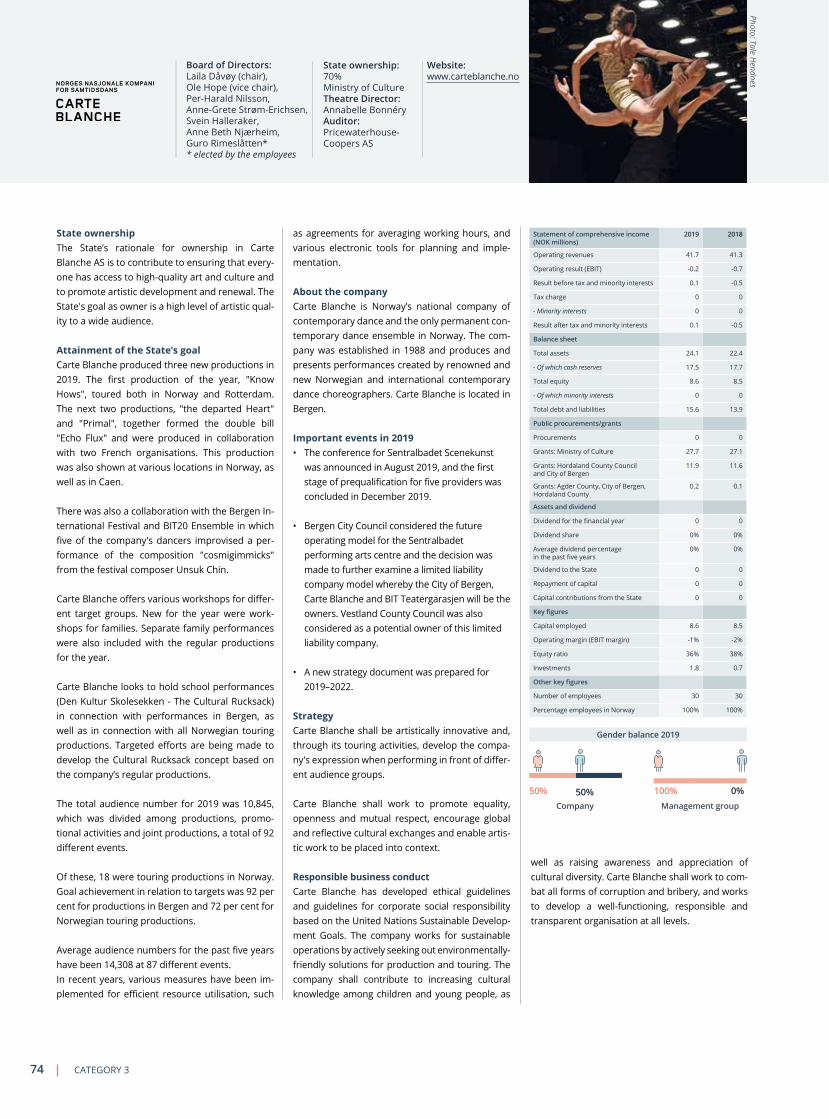
Photo: Tale Hendnes
50% 100%50% 0%Company Management group
Gender balance 2019
Website: www.carteblanche.no
Board of Directors: Laila Dåvøy (chair), Ole Hope (vice chair), PerHarald Nilsson, AnneGrete StrømErichsen, Svein Halleraker, Anne Beth Njærheim, Guro Rimeslåtten* * elected by the employees
State ownership: 70% Ministry of CultureTheatre Director: Annabelle Bonnéry Auditor: PricewaterhouseCoopers AS
State ownership The State’s rationale for ownership in Carte Blanche AS is to contribute to ensuring that everyone has access to highquality art and culture and to promote artistic development and renewal. The State's goal as owner is a high level of artistic quality to a wide audience.
Attainment of the State’s goalCarte Blanche produced three new productions in 2019. The first production of the year, "Know Hows", toured both in Norway and Rotterdam. The next two productions, "the departed Heart" and "Primal", together formed the double bill "Echo Flux" and were produced in collaboration with two French organisations. This production was also shown at various locations in Norway, as well as in Caen.
There was also a collaboration with the Bergen International Festival and BIT20 Ensemble in which five of the company's dancers improvised a performance of the composition "cosmigimmicks" from the festival composer Unsuk Chin.
Carte Blanche offers various workshops for different target groups. New for the year were workshops for families. Separate family performances were also included with the regular productions for the year.
Carte Blanche looks to hold school performances (Den Kultur Skolesekken The Cultural Rucksack) in connection with performances in Bergen, as well as in connection with all Norwegian touring productions. Targeted efforts are being made to develop the Cultural Rucksack concept based on the company’s regular productions.
The total audience number for 2019 was 10,845, which was divided among productions, promotional activities and joint productions, a total of 92 different events.
Of these, 18 were touring productions in Norway. Goal achievement in relation to targets was 92 per cent for productions in Bergen and 72 per cent for Norwegian touring productions.
Average audience numbers for the past five years have been 14,308 at 87 different events. In recent years, various measures have been implemented for efficient resource utilisation, such
as agreements for averaging working hours, and various electronic tools for planning and implementation.
About the company Carte Blanche is Norway’s national company of contemporary dance and the only permanent contemporary dance ensemble in Norway. The company was established in 1988 and produces and presents performances created by renowned and new Norwegian and international contemporary dance choreographers. Carte Blanche is located in Bergen.
Important events in 2019• The conference for Sentralbadet Scenekunst
was announced in August 2019, and the first stage of prequalification for five providers was concluded in December 2019.
• Bergen City Council considered the future operating model for the Sentralbadet performing arts centre and the decision was made to further examine a limited liability company model whereby the City of Bergen, Carte Blanche and BIT Teatergarasjen will be the owners. Vestland County Council was also considered as a potential owner of this limited liability company.
• A new strategy document was prepared for 2019–2022.
StrategyCarte Blanche shall be artistically innovative and, through its touring activities, develop the company's expression when performing in front of different audience groups.
Carte Blanche shall work to promote equality, openness and mutual respect, encourage global and reflective cultural exchanges and enable artistic work to be placed into context.
Responsible business conductCarte Blanche has developed ethical guidelines and guidelines for corporate social responsibility based on the United Nations Sustainable Development Goals. The company works for sustainable operations by actively seeking out environmentally friendly solutions for production and touring. The company shall contribute to increasing cultural knowledge among children and young people, as
well as raising awareness and appreciation of cultural diversity. Carte Blanche shall work to combat all forms of corruption and bribery, and works to develop a wellfunctioning, responsible and transparent organisation at all levels.
Statement of comprehensive income (NOK millions)
2019 2018
Operating revenues 41.7 41.3
Operating result (EBIT) 0.2 0.7
Result before tax and minority interests 0.1 0.5
Tax charge 0 0
- Minority interests 0 0
Result after tax and minority interests 0.1 0.5
Balance sheet
Total assets 24.1 22.4
- Of which cash reserves 17.5 17.7
Total equity 8.6 8.5
- Of which minority interests 0 0
Total debt and liabilities 15.6 13.9
Public procurements/grants
Procurements 0 0
Grants: Ministry of Culture 27.7 27.1
Grants: Hordaland County Council and City of Bergen
11.9 11.6
Grants: Agder County, City of Bergen, Hordaland County
0.2 0.1
Assets and dividend
Dividend for the financial year 0 0
Dividend share 0% 0%
Average dividend percentage in the past five years
0% 0%
Dividend to the State 0 0
Repayment of capital 0 0
Capital contributions from the State 0 0
Key figures
Capital employed 8.6 8.5
Operating margin (EBIT margin) 1% 2%
Equity ratio 36% 38%
Investments 1.8 0.7
Other key figures
Number of employees 30 30
Percentage employees in Norway 100% 100%
Carte Blanche AS
74 CATEGORY 3

Photo: Magnus Skrede
Website: www.dns.no
Board of Directors: Katrine Trovik (chair) Dag Rune Olsen Kjersti Berge Anders Bjørnsen RoyEddy Lie Kristoffer Sagmo Aalberg* Arne Kambestad* * elected by the employeesState ownership:
66.67% Ministry of CultureTheatre Director: Stefan Larsson Auditor: EY AS
State ownership The State’s rationale for ownership in AS Den Nationale Scene (DNS) is to help ensure that everyone has access to highquality art and culture and to promote artistic development and renewal. The State's goal as owner is a high level of artistic quality to a wide audience.
Attainment of the State’s goalPerformance indicators linked to a programme of high artistic quality include the number of world premieres, Norwegian premieres and joint productions, as well as audience response and press. DNS produced 27 different performances in 2019. There were also guest performances, tours and promotional activities. The performances have received consistently good responses from audiences and the press. Surveys show that 92.5 per cent were satisfied with their experience at DNS, and 97 per cent wanted to return. Important initiatives have been to create innovative and lavish family performances, initiate new stage plays based on Bergen's history, and generally promote new dramatic art. The 2019 repertoire presented eight world premieres, three Norwegian premieres and five joint productions.
Performance indicators for the goal of reaching a wide audience include the number of tickets sold and participants at promotional activities, as well as the result of various initiatives for reaching new audience groups. DNS had a record audience figure of 170,115 in 2019. The increase was primarily from popular children’s performances and larger touring activities in collaboration with others. DNS actively works to reach new audience groups, as well as to strengthen its relationship with the existing audience. Among other things, DNS has reintroduced yearly passes, strengthened the loyalty program Teatertjommi (over 1,000 members between the ages of 1830), increased the number of organisations receiving tickets via the Kavli Fund (900 tickets) and 4,000 school and kindergarten children received free tickets through Den kulturelle skolesekken (Cultural Rucksack), Den kulturelle bæremeisen (Cultural Child Carrier) and OBOS. In addition, the performance “Å Bergen, Bergen” was streamed to 21 different institutions.
About the company DNS is one of Norway’s five national dramatic art institutions. The theatre creates highquality, socially relevant, engaging and relevant theatre for a broad audience. The theatre is an extension of Ole Bull’s Det Norske Theater, which was established in 1850. The State became partowner in 1972. DNS is located in Bergen.
Important events in 2019• Agnete Haaland had been Theatre Director at
DNS for two fixedterm periods (eight years) and 2019 was her final year. Stefan Larsson was appointed in 2018 as Theatre Director for 2020–2024. He performed some work at DNS during 2019 and planned the repertoire for 2020.
• In May, the Ministry of Culture appointed a new DNS board of directors for 2019–2023. Katrine Trovik took over from Siren Sundland as board chair.
• The Ministry granted additional funds to undertake major renovations on the roof and external walls in 20172018. This work will be completed in the spring of 2020. There was no clarification in 2019 regarding the choice of solution for the development of the theatre building and DNS is awaiting the Ministry’s decision.
• DNS has been strongly involved in the debate concerning the cultural policy reform for regional areas. DNS is of the view that if State grants are transferred to regional level, the State will lose its most important policy instrument for managing cultural policy.
StrategyDNS’s vision is to create highquality, socially relevant and engaging theatre for a broad audience. In line with its mandate as a national theatre, DNS presents a diverse programme, contributes towards artistic development, safeguards cultural heritage and collaborates extensively with other players. DNS is focussed on the importance of the theatre to inclusion, gender equality, social development and democratic participation.
Statement of comprehensive income (NOK millions)
2019 2018
Operating revenues 185 163
Operating result (EBIT) 2.3 4.4
Result before tax and minority interests 2.7 4.8
Tax charge 0 0
- Minority interests 0 0
Result after tax and minority interests 2.7 4.8
Balance sheet
Total assets 93.3 83.8
- Of which cash reserves 38.8 41.1
Total equity 53 46.2
- Of which minority interests 0 0
Total debt and liabilities 40.3 37.7
Public procurements/grants
Procurements 0 0
Grants: Ministry of Culture 149 131
Assets and dividend
Dividend for the financial year 0 0
Dividend share 0% 0%
Average dividend percentage in the past five years
0% 0%
Dividend to the State 0 0
Repayment of capital 0 0
Capital contributions from the State 0 0
Key figures
Capital employed 53 46.2
Operating margin (EBIT margin) 1% 3 %
Equity ratio 57% 55%
Investments 5.2 4.4
Other key figures
Number of employees 130 142
Percentage employees in Norway 100% 100%
50% 57%50% 43%Company Management group
Gender balance 2019
Responsible business conductDNS shall carry out its activities in a manner that benefits people, society and the environment. DNS aims to fulfil its corporate social responsibility in line with the Government’s ownership policy and to safeguard human rights and workers’ rights within its organisation. All employees shall act in a manner that is ethically responsible and follow the guidelines that are in place. DNS takes environmental concerns into consideration when making decisions and in its operations, and works systematically towards reducing the negative impact of climate change.
Den Nationale Scene
75CATEGORY 3

Photo: Erik BergWebsite: www.operaen.no
Board of Directors:Anne Carine Tanum (chair) Jan Petersen (vice chair) Rolf Thorsen Håkon Berge Sarah Willand Gro Malmbekk Bergrabb Markku Salonen* Christine Eikeland* * elected by the employees
State ownership: 100% Ministry of CultureCEO: Geir Bergkastet Auditor:KPMG AS
State ownership The State’s rationale for ownership in Den Norske Opera & Ballett AS (DNO&B) is to contribute to everyone having access to opera, ballet and concerts of high artistic quality, and to promote artistic development and renewal. The State's goal as owner is a high level of artistic quality to a wide audience.
Attainment of the State’s goalDNO&B has been a leading institution in the Norwegian and international opera and ballet landscape. During 2019, audiences were presented with a diverse repertoire of international quality artistic performances. The Opera House in Bjørvika is the centre of the institution's activities. 2019 saw the presentation of a rich repertoire of opera, ballet and concerts, spread among 374 performances. The number of visitors for all activities was about 370,000, compared with an average of 380,000 in the past five years. Total seat occupancy ended at 89% for 2019, which is about the average for previous years. The opera has become an important venue for independent artists, and there is extensive artistic collaboration.
DNO&B recorded a profit for the third consecutive year, however the financial situation remains challenging in terms of pension costs, increased maintenance costs and pressure on own revenues. Selffinancing was 21 per cent, compared with 20 per cent in 2018.
About the company DNO&B is the country’s largest institution for music and dramatic art and comprises the Norwegian National Ballet and the Norwegian National Opera, the Norwegian National Opera Orchestra, the Norwegian National Opera Chorus, the Norwegian National Ballet 2, the Norwegian National Opera Children’s Chorus and the Norwegian National Ballet School. The company was established in 1957.
Important events in 2019• The Norwegian National Ballet’s Ibsen Ballets
have become signature works and international successes.
• The Norwegian National Ballet’s major performance for the year at Bjørvika was La Bayadère, which was one of the most demanding the company has ever produced. The result was brilliant reviews and full houses.
• Opera Director Annilese Miskimmon resigned from her fixedterm position in 2019, and Randi Stene has been appointed as the new Opera Director starting in the spring of 2020.
• DNO&B conducted a feasibility study together with Nationaltheatret and Det Norske Teatret to assess potential collaboration that could strengthen the scope of their activities.
StrategyDNO&B will make art more important in people’s lives by creating opera and ballet that leave a mark, reach out to as wide an audience as possible, expand artistic opportunities and have a respectful community which promotes outstanding performances. The strategy supports the new cultural policy objectives adopted by the Storting in 2019.
Responsible business conductDNO&B's activities shall be carried out in a responsible manner for people, society and the environment. DNO&B contributes to a decent working life, where fundamental standards of work and rights are safeguarded. DNO&B has guidelines and procedures for following up its corporate social responsibility, which include purchases, collaborative partners and sponsors. Through DNO&B's work with the environment and corporate social responsibility, the company was recertified in 2019 as an EcoLighthouse (Miljøfyrtårn) for three more years. Targets for work relating to climate change and efforts regarding gender equality and diversity are incorporated into the company's longterm strategy. DNO&B works systematically with sick leave and HSE, and new ethical guidelines and whistleblowing routines were established in 2018. Initiatives for reducing instances involving bullying/harassment and inappropriate behaviour are prioritised in the company's strategy work.
Statement of comprehensive income (NOK millions)
2019 2018
Operating revenues 808 786
Operating result (EBIT) 17.9 1.5
Result before tax and minority interests
18.7 1
Tax charge 0 0
- Minority interests 0 0
Result after tax and minority interests
18.7 1
Balance sheet
Total assets 275 249
- Of which cash reserves 122 98.3
Total equity 80.7 99.3
- Of which minority interests 0 0
Total debt and liabilities 356 348
Public procurements/grants
Grants: Ministry of Culture 640 625
Grants: Funds from the Ministry of Culture’s gift reinforcement programme
1.4 0
Assets and dividend
Dividend for the financial year 0 0
Dividend share 0% 0%
Average dividend percentage in the past five years
0% 0%
Dividend to the State 0 0
Repayment of capital 0 0
Capital contributions from the State
0 0
Key figures
Capital employed 50.3 51.4
Operating margin (EBIT margin) 2% 0%
Equity ratio 29% 40%
Other key figures
Number of employees 636 648
Percentage employees in Norway 100% 100%
54% 43%46% 57%Company Management group
Gender balance 2019
Den Norske Opera & Ballett ASAndøya Space Center AS
76 CATEGORY 3

Photo: Getty Im
ageS
State ownership The State’s rationale for ownership in Eksportkreditt Norge AS is to have a manager of the export credit scheme. The State’s goal as owner is to promote Norwegian exports through competitive, accessible and efficient export financing.
Attainment of the State’s goalThe company’s activities in 2019 supported the State’s goal as owner for Eksportkreditt Norge to promote Norwegian exports by securing financing for export contracts valued at NOK 11.4 billion. Surveys conducted as part of the review of policy instruments also showed that stakeholders consider the export financing services to be competitive and that they were consistently satisfied with the services and expertise provided by Eksportkreditt Norge. Due to the difficult situation for petroleumrelated industries in recent years, Eksportkreditt Norge has worked extensively to follow up the outstanding loan portfolio linked to this part of the portfolio.
About the company Eksportkreditt Norge manages the State’s export credit scheme (loan scheme), which entails offering financial services for the purchase of capital goods and services, principally for export. The purpose is to offer export credit to the customers of Norwegian export companies on internationally competitive terms. The company was founded in 2012 when it took over responsibility for management of the State’s export credit scheme from Ek
sportfinans. Eksportkreditt Norge’s head office is located in Oslo.
Important events in 2019• The first disbursement of loans under the new,
temporary, ship financing scheme took place in 2019.
• More than half of new applications in 2019 were from small and mediumsized enterprises.
StrategyThe aim of Eksportkreditt Norge is to promote Norwegian exports through competitive, accessible and efficient export financing. The company works actively with relevant public funding agencies such as GIEK and Innovasjon Norge to promote its services and make these readily available, particularly for small and mediumsized enterprises.
Responsible business conductEksportkreditt Norge’s overarching corporate social responsibility guidelines can be found in the OECD Framework. Eksportkreditt Norge has also adopted the Equator Principles. In order to contribute to an increased focus on climate change and assess greenhouse gas emissions within ship financing, Eksportkreditt Norge signed up to the Poseidon Principles in 2019. These are an international framework with the objective of measuring the carbon footprint of ship financing portfolios.
Auditor: KPMG ASWebsite: www.eksportkreditt.no
Board of Directors: Else Bugge Fougner (chair), Finn Ivar Marum, Siri Beate Hatlen, Ingelise Arntsen, Øyvind Holte, Marie Sørli* * elected by the employees
State ownership: 100% The Ministry of Trade, Industry and FisheriesCEO:Otto Søberg
Statement of comprehensive income (NOK millions)
2019 2018
Operating revenues 112 114
Operating result (EBIT) 3.9 5
Result before tax and minority interests 5.5 6.1
Tax charge 1.4 1.6
- Minority interests 0 0
Result after tax and minority interests 4.1 4.5
Balance sheet
Total assets 69.8 84.9
- Of which cash reserves 0 0
Total equity 33.5 29.4
- Of which minority interests 0 0
Total debt and liabilities 36.2 55.5
Public procurements/grants
Procurements 0 0
Grants: The Ministry of Trade, Industry and Fisheries
115 112
Assets and dividend
Dividend for the financial year 0 0
Dividend share 0% 0%
Average dividend percentage in the past five years
0% 0%
Dividend to the State 0 0
Repayment of capital 0 0
Capital contributions from the State 0 0
Key figures
Capital employed 33.5 29.4
Operating margin (EBIT margin) 3 % 4%
Equity ratio 48% 35%
Investments 0 0
Other key figures
Number of employees 49 45
Percentage employees in Norway 100% 100%
57% 29%43% 71%Company Management group
Gender balance 2019
Eksportkreditt Norge ASAvinor AS
77CATEGORY 3

Photo: Rec Solar Norw
ay AS
The company's principal objectives and results 2019 (selection)
Long-term objectives 2017-2020 Indicator Result 2019 (2017-2019)
Climate results for 1 million tonnes of CO2equivalents in sector not subject to quotas
Million tonnes of CO2equivalents in sector not subject to quotas 0.31 (0.81)
Energy results equivalent to 4 TWh Terawatt hours (TWh) 2.1 TWh (5.2 TWh)
Effect equivalent to 400 MW Megawatts (MW) 177 MW (422 MW)
Innovation results equivalent to generated innovation capital of NOK 4
billion NOK 5.7 billion (NOK 8.5 billion)
Most cost-effective management of Enova and the Climate and Energy Fund
Share of costs for administration and other activities from total allocated funds in the Climate and Energy Fund
3.2%
Number of applications processed under the Enova grant per fulltime equivalent. 11,038 applications
49% 25%51% 75%Company Management group
Gender balance 2019
CEO:Nils Kristian Nakstad Auditor: Deloitte ASWebsite: www.enova.no
Board of Directors: Tore Holm (chair) Arne Fosen (vice chair) Eirik Gaard Kristiansen Linda Litlekalsøy Aase Dina Elverum Aune Olav Hasaas Hege Økland
Hege Glasø Wiggen* Ingrid Aune* Børge Nilssen Stafne* * elected by the employeesState ownership:100% Ministry of Climate and Environment
State ownership The State’s rationale for ownership in Enova is to ensure a policy instrument for the transition to a lowemission society. The State’s goal as owner is the highest possible reduction in greenhouse gas emissions, improved security of energy supply and technological development, which will bring about a reduction in greenhouse gas emissions in the long term, in line with the fouryear agreements on the management of the Climate and Energy Fund.
Attainment of the State’s goal2019 was a record year for Enova. 1,484 projects in business and industry with a total value of NOK 5.2 billion were approved and NOK 334 million was disbursed for 20,789 energy initiatives in Norwegian homes.
Enova’s objective is to establish instruments with the aim of achieving lasting market changes. This means that how a project contributes to market change will be just as important as the quantifiable results from the individual projects. In 2019, Enova supported several promising technology projects, including Equinor’s Hywind Tamp en project and solar cell innovation by REC Solar. These projects contribute to the development of new technologies that may be important to the transition to a lowemission society. Support was also provided for a large number of zeroemission vehicles through the zeroemission fund, which contributes to the use of new technology.
About the company The company’s primary policy instrument is investment support. The company’s tasks are outlined in more detail in an agreement between the Ministry of Climate and Environment and Enova on the management of the Climate and Energy Fund. The company was founded in 2001 and its head office is located in Trondheim.
Important events in 2019• Establishment of the zeroemission fund for
commercial transport. The scheme is administered by Enova.
StrategyThe fouryear management agreement gives Enova a longterm financial framework and considerable freedom with regards to its operation. Enova will establish policy instruments with the aim of achieving lasting market changes, such that efficient energy and climate solutions will, in the longterm, be preferred without support. These activities can be focussed on all sectors.
Responsible business conductEthical guidelines are central to Enova’s organisational development. Enova's procurement processes set requirements for ethical trading and for avoiding social dumping. Enova wants its suppliers to have clear climate ambitions and to facilitate social integration. Enova seeks to minimize its impact on the external environment, and in 2019 the company moved into a model building that is foremost in the country in terms of its energy use and carbon footprint.
Statement of comprehensive income (NOK millions)
2019 2018
Operating revenues 127 127
Operating result (EBIT) 5 2.6
Result before tax and minority interests 3.9 3.5
Tax charge 0 0
- Minority interests 0 0
Result after tax and minority interests 3.9 3.5
Balance sheet
Total assets 53.0 56.1
- Of which cash reserves 45.3 54.8
Total equity 26.9 30.7
- Of which minority interests 0 0
Total debt and liabilities 26.1 25.4
Public procurements/grants
Procurements 0 0
Grants: The Climate and Energy Fund 127 127
Assets and dividend
Dividend for the financial year 0 0
Dividend share 0% 0%
Average dividend percentage in the past five years
0% 0%
Dividend to the State 0 0
Repayment of capital 0 0
Capital contributions from the State 0 0
Key figures
Capital employed 26.9 30.7
Operating margin (EBIT margin) 4% 2%
Equity ratio 51% 55%
Investments 0 0
Other key figures
Number of employees 78 77
Percentage employees in Norway 100% 100%
Enova
78 CATEGORY 3
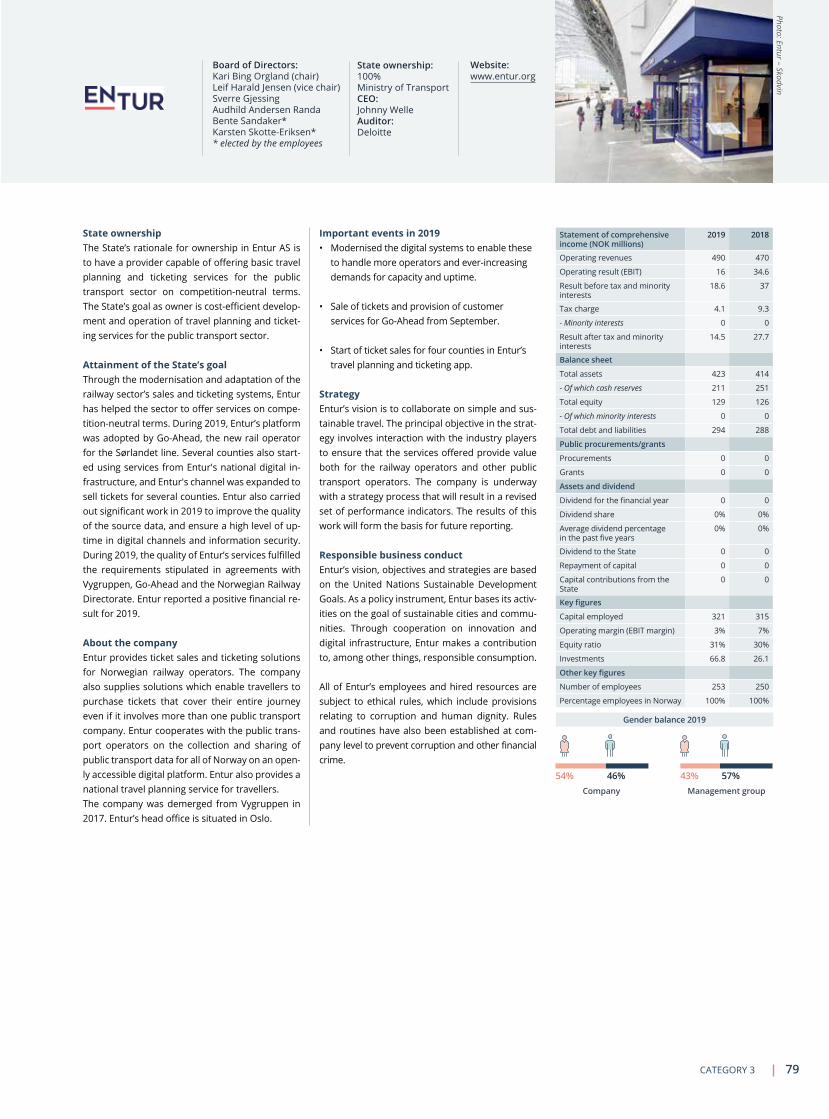
Photo: Entur – Skodvin
Board of Directors: Kari Bing Orgland (chair) Leif Harald Jensen (vice chair) Sverre Gjessing Audhild Andersen Randa Bente Sandaker* Karsten SkotteEriksen* * elected by the employees
State ownership: 100% Ministry of TransportCEO:Johnny WelleAuditor: Deloitte
State ownership The State’s rationale for ownership in Entur AS is to have a provider capable of offering basic travel planning and ticketing services for the public transport sector on competitionneutral terms. The State’s goal as owner is costefficient development and operation of travel planning and ticketing services for the public transport sector.
Attainment of the State’s goalThrough the modernisation and adaptation of the railway sector’s sales and ticketing systems, Entur has helped the sector to offer services on competitionneutral terms. During 2019, Entur’s platform was adopted by GoAhead, the new rail operator for the Sørlandet line. Several counties also started using services from Entur's national digital infrastructure, and Entur's channel was expanded to sell tickets for several counties. Entur also carried out significant work in 2019 to improve the quality of the source data, and ensure a high level of uptime in digital channels and information security. During 2019, the quality of Entur’s services fulfilled the requirements stipulated in agreements with Vygruppen, GoAhead and the Norwegian Railway Directorate. Entur reported a positive financial result for 2019.
About the company Entur provides ticket sales and ticketing solutions for Norwegian railway operators. The company also supplies solutions which enable travellers to purchase tickets that cover their entire journey even if it involves more than one public transport company. Entur cooperates with the public transport operators on the collection and sharing of public transport data for all of Norway on an openly accessible digital platform. Entur also provides a national travel planning service for travellers. The company was demerged from Vygruppen in 2017. Entur’s head office is situated in Oslo.
Important events in 2019• Modernised the digital systems to enable these
to handle more operators and everincreasing demands for capacity and uptime.
• Sale of tickets and provision of customer services for GoAhead from September.
• Start of ticket sales for four counties in Entur’s travel planning and ticketing app.
StrategyEntur’s vision is to collaborate on simple and sustainable travel. The principal objective in the strategy involves interaction with the industry players to ensure that the services offered provide value both for the railway operators and other public transport operators. The company is underway with a strategy process that will result in a revised set of performance indicators. The results of this work will form the basis for future reporting.
Responsible business conductEntur’s vision, objectives and strategies are based on the United Nations Sustainable Development Goals. As a policy instrument, Entur bases its activities on the goal of sustainable cities and communities. Through cooperation on innovation and digital infrastructure, Entur makes a contribution to, among other things, responsible consumption.
All of Entur’s employees and hired resources are subject to ethical rules, which include provisions relating to corruption and human dignity. Rules and routines have also been established at company level to prevent corruption and other financial crime.
Statement of comprehensive income (NOK millions)
2019 2018
Operating revenues 490 470
Operating result (EBIT) 16 34.6
Result before tax and minority interests
18.6 37
Tax charge 4.1 9.3
- Minority interests 0 0
Result after tax and minority interests
14.5 27.7
Balance sheet
Total assets 423 414
- Of which cash reserves 211 251
Total equity 129 126
- Of which minority interests 0 0
Total debt and liabilities 294 288
Public procurements/grants
Procurements 0 0
Grants 0 0
Assets and dividend
Dividend for the financial year 0 0
Dividend share 0% 0%
Average dividend percentage in the past five years
0% 0%
Dividend to the State 0 0
Repayment of capital 0 0
Capital contributions from the State
0 0
Key figures
Capital employed 321 315
Operating margin (EBIT margin) 3% 7%
Equity ratio 31% 30%
Investments 66.8 26.1
Other key figures
Number of employees 253 250
Percentage employees in Norway 100% 100%
54% 43%46% 57%Company Management group
Gender balance 2019
Website: www.entur.org
Entur AS
79CATEGORY 3

Photo: Terje Aamodt
State ownership The State’s rationale for its ownership in Fiskeri og havbruksnæringens forskningsfinansiering AS (FHF) is to strengthen funding of marine research and development. The State’s goal as owner is to strengthen funding of marine research and development to create added value, environmental adaptation, restructuring and innovation in the fisheries and aquaculture industry.
Attainment of the State’s goalKnowledge is fundamental to the development of the seafood industry. FHF finances research and development projects that provide shared knowledge for the work of seafood companies on environmental adaptation, restructuring and valuecreation. Since being established in 2001, more than NOK 3 billion has been invested in generic R&D through FHF.
The seafood industry has experienced growth in annual value creation since 2013. Total value creation has now passed NOK 100 billion (including ripple effects). Employment is increasing and the industry has had the strongest annual growth rate in Norway of 11.7 per cent in the last few years.
A focus on environmental adaptation and restructuring has resulted in growth in the provision of technology and services for the industry. Total value creation from the technology and service providers was calculated at NOK 32.4 billion in 2018. FHF has financed the development of an environmental database for aquaculture, and has contributed several research projects concerning the increased utilisation of byproducts. The utilisation rate of byproducts for the industry as a whole was 82 per cent (2018), which is the highest ever recorded.
About the company FHF funds industrybased research and development. The undertaking was established in 2000 and converted into a limited liability company in 2019. FHF’s head office is located in Oslo.
Important events in 2019• Total value creation from the seafood industry
passed NOK 100 billion.
• FHF was converted from an underlying administrative body into a Stateowned limited company.
StrategyA broad commercial basis ensures that the prioritisation of research projects takes place in the areas that best contribute to sustainable value creation.
Responsible business conductResearch projects financed by FHF follow established ethical principles for research and compliance is ensured through ethical guidelines and established administrative routines. Whistleblowing routines have been established.
Website: fhf.no
Members of the Board:JanneGrethe Strand Aasnæs (chair) Edmund Broback (vice chair) Britt Kathrine Drivenes Øyvin Oaland Hans Frode Kielland Asmyhr Kjell Ingebrigtsen Elin Tveit Sveen
State ownership: 100% Ministry of Trade, Industry and FisheriesCEO:Geir AndreassenAuditor: Ernst & Young
FHF has three principal objectives:
• Contribute to increased sustainable value creation in the seafood industry
• Contribute to increased environmental adaptation and sustainability in the industry.
• Contribute to restructuring and innovation in the industry.
FHF has several performance indicators to ensure that the company is working towards these objectives.
FHF's performance measurement system provides assessments of results in all completed projects.
Value creation in the industry is measured through R&D projects which document developments in all parts of the seafood industry.
Environmental adaptation and sustainability are supported by a number of research projects and documented through separate documentation projects. 2019 saw the launch of the sustainability portfolio for aquaculture, which documents sustainability in the aquaculture industry.
Restructuring and innovation are the objectives of a number of projects. Investments in the seafood industry are assessed and documented (Norce 2019/12). More than NOK 115 billion was invested in the industry from 2000 to 2019. Investments in 2019 were 14 billion, the highest ever level when measured in terms of fixed prices.
In 2019, 56 new R&D projects were started, 70 projects were completed and at yearend there were 144 ongoing projects financed by FHF.
The company's principal objectives and results 2019 (selection)
Statement of comprehensive income (NOK millions)
2019 2018*
Operating revenues 322
Operating result (EBIT) 4.3
Result before tax and minority interests
14.1
Tax charge 0
- Minority interests 0
Result after tax and minority interests 14.1
Balance sheet
Total assets 583.9
- Of which cash reserves 523.1
Total equity 14.8
- Of which minority interests 0
Total debt and liabilities 568.3
Public procurements/grants
Procurements 0
Grants 0
Assets and dividend
Dividend for the financial year 0
Dividend percentage 0%
Average dividend percentage in the past five years
0%
Dividend to the State 0
Repayment of capital 0
Capital contributions from the State 1.0
Key figures
Capital employed 14.8
Operating margin (EBIT margin) 1%
Equity ratio 3%
Investments 0
Other key figures
Number of employees 18
Percentage employees in Norway 100%
*FHF was converted into a State-owned limited company from 1 January 2019.
61% 33%39% 67%Company Management group
Gender balance 2019
Fiskeri- og havbruksnæringens forskningsfinansiering AS
80 CATEGORY 3

Photo: Haakon N
ordvik
The company's principal objectives and results 2019 (selection)
Long-term goals Indicator Goals 2019 Result 2019 (2018)
Safer and more value Critical incidents* Availability Operating
expenses** Extra capacity Sales
0 99.38 4,786 million 349 MSM3 1.5 (1.16) 99.37 (99.14) 4,955 (4,797) 422
(1,229)
Reduce climate impact Kg CO2/tonnes 15 14,11 (14.94)
Auditor: PwC ASWebsite: www.gassco.no
Board of Directors: Jan Steffen Skogseth (chair) AnneLene Midseim Johan Einar Hustad Tor Rasmus Skjærpe Brynjar Aardal* Kenneth Flotve* * elected by the employees
State ownership: 100% Ministry of Petroleum and EnergyCEO:Frode Leversund
State ownershipThe State’s rationale for ownership in Gassco AS is to ensure a single neutral and independent operator for the integrated gas transport system and to facilitate efficient utilisation of the resources on the Norwegian continental shelf. The State’s goal as owner is the efficient operation and comprehensive development of the gas transport system on the Norwegian continental shelf.
Attainment of the State’s goalGassco has a managementbyobjectives system which, through boardapproved performance indicators, measures whether the company is delivering on the public policy goals. The company has HSE, financial and operational indicators.
In the past five years, Gassco has transported an average of 111.1 billion sm3 from fields on the Norwegian continental shelf to the landing points. During the same period, the transport system had an average delivery regularity of 99.42 per cent, and the quality of delivered gas was 99.98 per cent in accordance with specifications. Average CO2 emissions were 15.0 kg CO2/tonnes produced.
About the companyGassco is the operator for the integrated gas transport system from the Norwegian continental shelf to Europe. The gas transport system is a natural monopoly that consists of pipelines, processing facilities, platforms and gas terminals on the European continent and in the UK. The shippers pay regulated transport tariffs that provide the owners with a reasonable return. Gassco does not make a profit or loss from its operations. The company was founded in 2001 and its head office is located in Karmøy.
Important events in 2019• Preparations for the tiein of a branch pipe from
Europipe II to Nybro in Denmark (Baltic Pipe).
• Studies were carried out which showed that it may be profitable to build new transport solutions in and from the Barents Sea. Coordinated development is important for realising the resource potential.
• Based on assessments of future needs in the Heimdal area, the decision was made to link the pipelines in the area together.
StrategyGassco's strategic objectives are safer and more value, create infrastructure for the future, and reduce climate impact. The strategic objectives form the basis for the company's strategic action plans and key performance indicators which the company reports on. Risk management is an integrated part of Gassco's corporate governance.
Responsible business conductGassco sets requirements for responsible business conduct based on the ten principles in the UN Global Compact and the OECD Due Diligence Guidance For Responsible Business Conduct. The United Nations Sustainable Development Goals constitute a framework for Gassco's work on contributing to sustainable value creation. Gassco conducts due diligence assessments and materiality analyses in line with the OECD guidelines and Oslo Stock Exchange’s guidance on the reporting of corporate social responsibility. The company’s sustainability report for 2019 includes the company’s core values, tax policy and ethical guidelines.
* Number of critical incidents in last 12 months/million hours of work
** Operating expenses excl. electricity and fees
Statement of comprehensive income (NOK millions)
2019 2018
Operating revenues 0 0
Operating result (EBIT) 0 0
Result before tax and minority interests 0 0
Tax charge 0 0
- Minority interests 0 0
Result after tax and minority interests 0 0
Balance sheet
Total assets 1,520 1,011
- Of which cash reserves 345 313
Total equity 15 15
- Of which minority interests 0 0
Total debt and liabilities 1,505 996
Public procurements/grants
Procurements 0 0
Grants 0 0
Assets and dividend
Dividend for the financial year 0 0
Dividend share 0% 0%
Average dividend percentage in the past five years
0% 0%
Dividend to the State 0 0
Repayment of capital 0 0
Capital contributions from the State 0 0
Key figures
Capital employed 93.3 100.1
Operating margin (EBIT margin) 0% 0%
Equity ratio 1% 1%
Investments 44.1 30.5
Other key figures
Number of employees 341 330
Percentage employees in Norway 57% 58%
27% 57%73% 43%Company Management group
Gender balance 2019
Gassco AS
81CATEGORY 3

Photo: TCM D
AWebsite: www.gassnova.no
Board of Directors: Morten Ruud (chair), Marianne Holmen (vice chair), Cathrine Brekke, Trond Moengen, Kjell Olav Kristiansen, Ståle Aakenes * * elected by the employees
State ownership: 100% Ministry of Petroleum and EnergyCEO: Trude Sundset Auditor: Deloitte AS
State ownership The State’s rationale for ownership in Gassnova SF is to safeguard the State’s interests relating to carbon capture and storage (CCS). The State’s goal as owner is to contribute to technological development and the development of expertise for costeffective, forwardlooking CCS solutions.
Attainment of the State’s goalGassnova’s principal objective is to contribute to technological development and the development of expertise for costeffective, forwardlooking CCS solutions. Gassnova will also contribute to realising gains from the work on CLIMIT, Technology Centre Mongstad (TCM) and the Full Scale Project.
About the companyGassnova manages the State’s interests relating to the capture, transport and geological storage of carbon dioxide. This includes promoting technological development and the development of expertise for costeffective, forwardlooking CCS solutions, and acting as an advisor to the Ministry of Petroleum and Energy. Gassnova is responsible for coordinating and heading the secretariat function at CLIMIT, which is the Ministry of Petroleum and Energy’s programme for research, development and testing of CCS technology shared between the Research Council of Norway and Gassnova. Gassnova also manages the State’s ownership interests in TCM DA and is responsible for planning, coordinating and following up the fullscale CCS demonstration project in Norway until an investment decision is made. Gassnova was established as a government agency in 2005 and converted into a State enterprise in 2007. Gassnova's head office is situated in Porsgrunn and there are 40 employees.
Important events in 2019• Evaluation of Norcem and Fortum Oslo Varme's
capture projects as a basis for the Ministry of Petroleum and Energy's assessment and recommendation for a decision on fullscale CCS.
• Conducted an updated socioeconomic analysis for the realisation of fullscale CCS.
• Preparation of final report for preliminary planning of fullscale carbon capture, transport and storage.
• Establishment of plan for realising gains from the fullscale project.
• Negotiated an agreement between the State and the three industrial owners of TCM (Shell, Equinor and Total) to continue until the end of 2023.
• Gassnova's part of the CLIMIT programme (CLIMIT Demo) had 100 active projects in the portfolio.
• Gassnova arranged the CLIMIT Summit, which gathered more than 270 international CCS experts in Oslo.
• Gassnova supported the Ministry of Petroleum and Energy and the European Commission, which organised a CCS conference in Oslo, with over 400 participants from the EU, Canada, the USA and Japan.
StrategyGassnova’s objective is to manage the State’s interests in the Full Scale Project, Technology Centre Mongstad (TCM) and CLIMIT. In terms of strategy, Gassnova works to create the maximum possible value for its owner, the Ministry of Petroleum and Energy, within these three areas. The breadth of the tasks that the company is responsible for has enabled Gassnova to build up expertise over time. In 2019, Gassnova carried out broadbased strategy work which highlighted the company’s roles and capabilities. This will form the basis of a longterm and sustainable course into the future.
Responsible business conductGassnova is operated in an ethical, sustainable and responsible manner, in accordance with laws, regulations and generally accepted practice. The company works to reduce the carbon and environmental footprint from its everyday activities. Gassnova places specific emphasis on preventive measures aimed at financial crime, particularly anticorruption and conflicts of interest. This takes place through transparency and awareness activities among the company’s own employees. Gassnova’s own requirements and expectations are laid down in the company’s guidelines for efforts relating to corporate social responsibility, as well as guidelines and principles for ethical conduct, conflicts of interest and whistleblowing. Gassnova’s ethical guidelines were prepared in line with the UN Global Compact, OECD Guidelines on Corporate Governance of StateOwned Enterprises, and Ethical Guidelines for the Public Service.
Statement of comprehensive income (NOK millions)
2019 2018
Operating revenues 644 295
Operating result (EBIT) 133 11.5
Result before tax and minority interests 137 11.4
Tax charge 22.4 0
- Minority interests 0 0
Result after tax and minority interests 115 11.4
Balance sheet
Total assets 516 327
- Of which cash reserves 257 201
Total equity 136 13
- Of which minority interests 0 0
Total debt and liabilities 381 314
Public procurements/grants
Procurements 0 0
Grants: Ministry of Petroleum and Energy
478 273
Assets and dividend
Dividend for the financial year 0 0
Dividend share 0% 0%
Average dividend percentage in the past five years
0% 0%
Dividend to the State 0 0
Repayment of capital 0 0
Capital contributions from the State 0 0
Key figures
Capital employed 136 13.4
Operating margin (EBIT margin) 21% 4%
Equity ratio 26% 4%
Investments 0 0
Other key figures
Number of employees 40 42
Percentage employees in Norway 100% 100%
35% 71%65% 29%Company Management group
Gender balance 2019
Gassnova SF
82 CATEGORY 3

Photo: Gram
inor AS
35% 67%65% 33%Company Management group
Gender balance 2019
Website: www.graminor.no
Board of Directors: Hans Frode Kielland Asmyhr (chair) Bjørn Stabbetorp (vice chair) Jostein Fjeld Wenche Myhre Dale Hildegunn Norheim Ellen Margrethe Hovland Jon Arne Dieseth* * elected by the employees
State ownership: 28.8% Ministry of Agriculture and FoodCEO: Kristin BørresenAuditor: BDO AS
State ownership The State’s rationale for ownership in Graminor AS is to have a company that breeds plants suitable for the Norwegian and Nordic climate. The State’s goal as owner is the most costeffective development, production and sale of plant matter to the agriculture and horticulture industry that is suitable for Norwegian and Nordic growing conditions.
Attainment of the State’s goalIn 2019, the company contributed to the development, production and sale of plant matter to the agriculture and horticulture industry that is suitable for Norwegian and Nordic growing conditions.
About the company Graminor engages in plant breeding, represents imported varieties and produces prebasic seed. The company was established in 2002, as a continuation of Norsk Kornforedling AS, in order to concentrate Norwegian plant breeding for farming and horticulture in a single company. Graminor’s head office is located in Hamar.
Important events in 2019• The company contributed seven new approved
varieties on the Norwegian list of varieties.
• Graminor passed 1 million in worldwide sales for trees of the pear variety Celina.
• In 2019, Norgesmøllen launched “Mirakelmel” (Miracle Flour) which has a wheat flour content that is 100% from Graminor’s “Mirakel” (Miracle) variety.
StrategyThe board initiated a new strategy process for the company in 2019. The strategy will be completed within the first half of 2020.
Responsible business conductThe company has a high level of responsibility and transparency in its activities, and has open and beneficial cooperation with the State and the parties to the “Agricultural Settlement” (Jordbruksoppgjøret).
Statement of comprehensive income (NOK millions)
2019 2018
Operating revenues 66.1 75.4
Operating result (EBIT) 0.4 5.2
Result before tax and minority interests 0.4 5.7
Tax charge 0.4 0.7
- Minority interests 0 0
Result after tax and minority interests 0.8 5.0
Balance sheet
Total assets 91 95,7
- Of which cash reserves 14.9 24.6
Total equity 72.6 71.4
- Of which minority interests 0 0
Total debt and liabilities 15.9 24.3
Public procurements/grants
Procurements 0 0
Grants: Ministry of Agriculture and Food 29 22
Assets and dividend
Dividend for the financial year 0 0
Dividend share 0% 0%
Average dividend percentage in the past five years
0% 0%
Dividend to the State 0 0
Repayment of capital 0 0
Capital contributions from the State 0 0
Key figures
Capital employed 91 96
Operating margin (EBIT margin) 1% 7%
Equity ratio 80% 75%
Investments 0 0
Other key figures
Number of employees 34 34
Percentage employees in Norway 100% 100%
Graminor AS
83CATEGORY 3

Photo: Terje Visnes
The company's principal objectives and results 2019 (selection)
Long-term goals Indicator Goals 2019 Result 2019 (2018)
Reduce unnecessary waiting and variation in goal attainment
Average waiting time Reduced from 2018 59 days (57 days)
Prioritise mental health care and specialised interdisciplinary substance abuse treatment
Average waiting time Adults: 45 days Children: 40 days Specialised interdisciplinary substance abuse treatment (TSB): 35 days
Adults: 50 days (50 days) Children: 47 days (54 days)
TSB: 29 days (30 days)
Better quality and patient safety Percentage of units with mature safety climate in each health trust
60% 75%, 83% and 80% for the three respective health trusts
Auditor: BDO ASWebsite: www.helse midt.no
Board of Directors:Tina Steinsvik Sund (chair) Liv Stette (vice chair) Beate Skillingstad Bjørn Gustafsson Kristian Dahlberg Hauge Steinar Kristoffersen Anita Solberg* Tore Brudeseth*
Lindy Jaroschvon Schweder* * elected by the employeesState ownership: 100% Ministry of Health and Care ServicesCEO:Stig Arild Slørdahl
State ownershipThe State’s rationale for ownership in Helse MidtNorge RHF is to ensure that specialist health services are available in Norway to everyone who needs them when they need them, regardless of age, gender, place of residence, personal finances and ethnic background. The State’s goal as owner is to achieve highquality and equitable specialist health services, and to facilitate research and teaching.
Attainment of the State’s goalThe company works systematically to achieve the State’s three principal objectives: to reduce unnecessary waiting and variation in capacity utilisation, prioritise mental health care and specialised interdisciplinary substance abuse treatment, and better quality and patient safety. Following a sharp decrease in waiting times from 2015 to 2017, these increased slightly in 2018 and 2019. Only two out of nine targets within the prioritisation of mental health care and specialised interdisciplinary substance abuse treatment (TSB) were achieved, however the development in waiting times is positive. The company has the lowest proportion of corridor patients in the country, and there is a downward trend. The company delivered positive financial results and met financial requirements for 2019.
About the company Helse MidtNorge RHF is responsible for ensuring that the populations of Møre og Romsdal and Trøndelag have access to equitable and highquality specialist health services. The company also has statutory functions within research, education and training of patients and nextofkin. The regional health authorities were established in 2002 when the State took over responsibility for the specialist health services from the county authorities. Helse Midt Norge RHF has its head office in Stjørdal.
Important events in 2019• In March 2019, Helse MidtNorway RHF signed a
contract for the introduction of the Health Platform – a joint medical record solution for the entire health service in the region.
• Trondheim Municipality became a committed partner in the Health Platform.
• A new competitive tender process was carried out in 2019 for the construction of a new hospital in Nordmøre og Romsdal and the project is in the cooperation phase with the developer.
StrategyHelse MidtNorge RHF works in accordance with the adopted Strategy 2030 to achieve its objectives by focussing on creating the patients’ health service, adopting knowledge and technology for better health care services, recruiting, developing and retaining competent personnel, and being a good team player.
Responsible business conductThe four health regions have presented a joint report on the specialist health service’s work on responsible business conduct.
The report includes all health trusts in the country and the jointlyowned companies in the area. For 2019, the report concerned climate and the environment, human rights, workers’ rights and anticorruption. The report was prepared by the Interregional cooperation committee for climate and the environment in the specialist health service and includes the health trusts in the four regions, as well as the jointly owned companies.
Statement of comprehensive income (NOK millions)
2019 2018
Operating revenues 22,945 21,908
Operating result (EBIT) 516 619
Result before tax and minority interests 531 604
Tax charge 1 2.1
- Minority interests 0 0
Result after tax and minority interests 530 602
Balance sheet
Total assets 20,991 19,869
- Of which cash reserves
Total equity 10,251 9,720
- Of which minority interests 0 0
Total debt and liabilities 10,740 10,149
Public procurements/grants
Procurements 0 0
Grants: Ministry of Health and Care Services
21,239 20,040
Assets and dividend
Dividend for the financial year 0 0
Dividend share 0% 0%
Average dividend percentage in the past five years
0% 0%
Dividend to the State 0 0
Repayment of capital 0 0
Capital contributions from the State 0 0
Key figures
Capital employed 13,567 12,483
Operating margin (EBIT margin) 2% 3 %
Equity ratio 49% 49%
Investments
Other key figures
Number of employees 17,526 17,144
Percentage employees in Norway 100% 100%
75% 43%25% 57%Company Management group
Gender balance 2019
Helse Midt-Norge RHF
84 CATEGORY 3
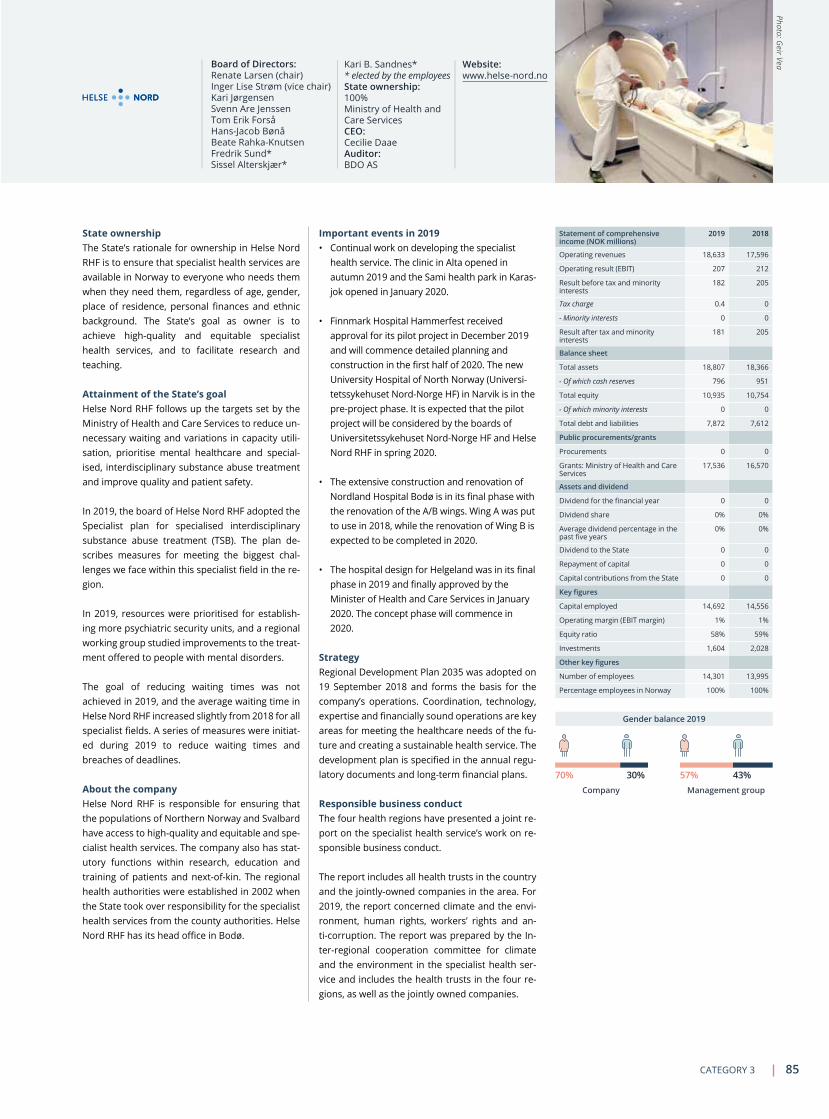
Photo: Geir VeaWebsite:
www.helsenord.noBoard of Directors:Renate Larsen (chair) Inger Lise Strøm (vice chair) Kari Jørgensen Svenn Are Jenssen Tom Erik Forså HansJacob Bønå Beate RahkaKnutsen Fredrik Sund* Sissel Alterskjær*
Kari B. Sandnes* * elected by the employeesState ownership: 100% Ministry of Health and Care ServicesCEO: Cecilie DaaeAuditor: BDO AS
State ownership The State’s rationale for ownership in Helse Nord RHF is to ensure that specialist health services are available in Norway to everyone who needs them when they need them, regardless of age, gender, place of residence, personal finances and ethnic background. The State’s goal as owner is to achieve highquality and equitable specialist health services, and to facilitate research and teaching.
Attainment of the State’s goalHelse Nord RHF follows up the targets set by the Ministry of Health and Care Services to reduce unnecessary waiting and variations in capacity utilisation, prioritise mental healthcare and specialised, interdisciplinary substance abuse treatment and improve quality and patient safety.
In 2019, the board of Helse Nord RHF adopted the Specialist plan for specialised interdisciplinary substance abuse treatment (TSB). The plan describes measures for meeting the biggest challenges we face within this specialist field in the region.
In 2019, resources were prioritised for establishing more psychiatric security units, and a regional working group studied improvements to the treatment offered to people with mental disorders.
The goal of reducing waiting times was not achieved in 2019, and the average waiting time in Helse Nord RHF increased slightly from 2018 for all specialist fields. A series of measures were initiated during 2019 to reduce waiting times and breaches of deadlines.
About the companyHelse Nord RHF is responsible for ensuring that the populations of Northern Norway and Svalbard have access to highquality and equitable and specialist health services. The company also has statutory functions within research, education and training of patients and nextofkin. The regional health authorities were established in 2002 when the State took over responsibility for the specialist health services from the county authorities. Helse Nord RHF has its head office in Bodø.
Important events in 2019• Continual work on developing the specialist
health service. The clinic in Alta opened in autumn 2019 and the Sami health park in Karasjok opened in January 2020.
• Finnmark Hospital Hammerfest received approval for its pilot project in December 2019 and will commence detailed planning and construction in the first half of 2020. The new University Hospital of North Norway (Universitetssykehuset NordNorge HF) in Narvik is in the preproject phase. It is expected that the pilot project will be considered by the boards of Universitetssykehuset NordNorge HF and Helse Nord RHF in spring 2020.
• The extensive construction and renovation of Nordland Hospital Bodø is in its final phase with the renovation of the A/B wings. Wing A was put to use in 2018, while the renovation of Wing B is expected to be completed in 2020.
• The hospital design for Helgeland was in its final phase in 2019 and finally approved by the Minister of Health and Care Services in January 2020. The concept phase will commence in 2020.
StrategyRegional Development Plan 2035 was adopted on 19 September 2018 and forms the basis for the company’s operations. Coordination, technology, expertise and financially sound operations are key areas for meeting the healthcare needs of the future and creating a sustainable health service. The development plan is specified in the annual regulatory documents and longterm financial plans.
Responsible business conductThe four health regions have presented a joint report on the specialist health service’s work on responsible business conduct.
The report includes all health trusts in the country and the jointlyowned companies in the area. For 2019, the report concerned climate and the environment, human rights, workers’ rights and anticorruption. The report was prepared by the Interregional cooperation committee for climate and the environment in the specialist health service and includes the health trusts in the four regions, as well as the jointly owned companies.
Statement of comprehensive income (NOK millions)
2019 2018
Operating revenues 18,633 17,596
Operating result (EBIT) 207 212
Result before tax and minority interests
182 205
Tax charge 0.4 0
- Minority interests 0 0
Result after tax and minority interests
181 205
Balance sheet
Total assets 18,807 18,366
- Of which cash reserves 796 951
Total equity 10,935 10,754
- Of which minority interests 0 0
Total debt and liabilities 7,872 7,612
Public procurements/grants
Procurements 0 0
Grants: Ministry of Health and Care Services
17,536 16,570
Assets and dividend
Dividend for the financial year 0 0
Dividend share 0% 0%
Average dividend percentage in the past five years
0% 0%
Dividend to the State 0 0
Repayment of capital 0 0
Capital contributions from the State 0 0
Key figures
Capital employed 14,692 14,556
Operating margin (EBIT margin) 1% 1%
Equity ratio 58% 59%
Investments 1,604 2,028
Other key figures
Number of employees 14,301 13,995
Percentage employees in Norway 100% 100%
70% 57%30% 43%Company Management group
Gender balance 2019
Helse Nord RHF
85CATEGORY 3

Photo: Helse Sør-Ø
st
58% 38%42% 62%Company Management group
Gender balance 2019
CEO:Cathrine Marie Lofthus Auditor: PwC ASWebsite: www.helsesorost.no
Board of Directors:Svein Ingvar Gjedrem (chair) Anne Cathrine Frøstrup (vice chair) Bushra Ishaq Vibeke Limi Olaf Qvale Dobloug Einar Lunde Sigrun Elisabeth Vågeng
Kirsten Brubakk* Christian Grimsgaard* Lasse Bent Sølvberg* * elected by the employeesState ownership: 100% Ministry of Health and Care Services
State ownership The State’s rationale for ownership in Helse SørØst RHF is to ensure that specialist health services are available in Norway to everyone who needs them when they need them, regardless of age, gender, place of residence, personal finances and ethnic background. The State’s goal as owner is to achieve highquality and equitable specialist health services, and to facilitate research and teaching.
Attainment of the State’s goalIn 2019, Helse SørØst RHF carried out its primary tasks of patient treatment, training of health care personnel, research and training of patients and nextofkin in accordance with the guidelines set by the owner in the regulatory documents and minutes from health trust meetings. The management requirements stipulated by the Ministry of Health and Care Services for 2019 were followed up. The board of Helse SørØst RH expressed its satisfaction with this in the 2019 annual report, however also noted that the quality and results in some areas were not good enough and that the health trust group must work actively to make improvements.
The financial results for Helse SørØst RHF in 2019 were better than what were budgeted for. Finances are, on the whole, well under control, however there is also a major need for new investments. Correct prioritisation of the investment projects is important for ensuring good quality patient treatment.
About the company Helse SørØst RHF is responsible for ensuring that the populations of Innlandet, Oslo, Vestfold og Telemark, Viken and Agder have access to equitable and highquality specialist health services. The company also has statutory functions in research, education and training of patients and nextofkin. The regional health authorities were established in 2002 when the State took over responsibility for the specialist health services from the county authorities. Helse SørØst's head office is in Hamar.
Important events in 2019• Measures to resolve capacity challenges in and
around the capital city included the dimensioning of Oslo universitetssykehus HF and relief of Akershus universitets sykehus HF. On the whole, the development projects for Oslo universitetssykehus HF represent a commitment to the region.
• From summer 2019, all patients in Helse SørØst were given the opportunity to read parts of their medical records at www.helsenorge.no.
• The handling of Covid19 has resulted in extraordinary restructuring of activities in 2020, which will have major implications for the results achieved.
StrategyRegional Development Plan 2035 defines development targets up until 2035:
• Better public health, with continuous efforts ranging from prevention to specialised health care services.
• Quality patient care and good user experiences.
• Good working environment for employees, skills development and more time for patient care.
• Sustainable health services for society.
Responsible business conductThe four health regions presented a joint report on the specialist health service’s corporate social responsibility work.
The report includes all health trusts in the country and the jointlyowned companies in the area. For 2019, the report concerned climate and the environment, human rights, workers’ rights and anticorruption. The report was prepared by the Interregional cooperation committee for climate and the environment in the specialist health service and includes the health trusts in the four regions, as well as the jointly owned companies.
Statement of comprehensive income (NOK millions)
2019 2018
Operating revenues 86,765 81,755
Operating result (EBIT) 1,920 1,775
Result before tax and minority interests
2,011 1,768
Tax charge 2 1
- Minority interests 0 1
Result after tax and minority interests 2,009 1,768
Balance sheet
Total assets 74,670 68,405
- Of which cash reserves 13,445
Total equity 38,690 36,679
- Of which minority interests 11
Total debt and liabilities 35,981 31,726
Public procurements/grants
Procurements 0 0
Grants: Ministry of Health and Care Services
78,772 73,961
Assets and dividend
Dividend for the financial year 0 0
Dividend share 0% 0%
Average dividend percentage in the past five years
0% 0%
Dividend to the State 0 0
Repayment of capital 0 0
Capital contributions from the State 0 0
Key figures
Capital employed 52,306 48,114
Operating margin (EBIT margin) 2% 2%
Equity ratio 52% 54%
Investments 0 0
Other key figures
Number of employees 62,025 61,106
Percentage employees in Norway 100% 100%
Helse Sør-Øst RHF
86 CATEGORY 3

Photo: Helse Vest
Auditor: BDO ASCompany website: www.helsevest.no
Board of Directors:Einar Strømsvåg (chair) Olin Johanne Henden (vice chair) Pernille Lysaker Gunnar Berge Ingeborg Cecilie T. Morken Sigurd K. Hille Bente Pilskog*
Wenche Kristin Røkenes* Bjørn Egil Vikse* * elected by the employeesState ownership: 100% Ministry of Health and Care ServicesCEO: Inger Cathrine Bryne
State ownershipThe State’s rationale for ownership in Helse Vest is to ensure that specialist health services are available in Norway to everyone who needs them when they need them, regardless of age, gender, place of residence, personal finances and ethnic background. The State’s goal as owner is to achieve highquality and equitable specialist health services, and to facilitate research and teaching.
Attainment of the State’s goalHelse Vest RHF follows up the targets set by the Ministry of Health and Care Services to reduce unnecessary waiting and variations in capacity utilisation, prioritise mental healthcare and specialised interdisciplinary substance abuse treatment and improve quality and patient safety.
There are variations between the different health trusts in terms of efficiency and capacity utilisation. The work on reducing unnecessary waiting and variations in capacity utilisation will continue to be a high priority alongside the work to ensure quality and patient safety in treatment.
Clinical pathways are an important part of standardised pathways. During 2019, Helse Vest RHF initiated measures to improve the results for clinical cancer pathways.
The prioritisation of mental health care and substance abuse treatment has also given results. The clinical pathways for substance abuse and mental health care were introduced at the start of 2019. Waiting times within mental health care and specialised substance abuse treatment (TSB) are clearly lower than for somatic treatment.
About the company Helse Vest RHF is responsible for ensuring that the populations of Rogaland and Vestland have access to equitable and highquality specialist health services. The company also has statutory functions within research, education and training of patients and nextofkin. The regional health authorities were established in 2002 when the State took over responsibility for the specialist health services from the county authorities. Helse Vest RHF has its head office in Stavanger.
Important events in 2019• Helse Vest RHF continued to work on digitisa
tion in the hospitals in 2019 with the introduction of new systems in several areas, including for clinical work and support for logistics, warehousing, purchases, budget, accounting and procurements. There is a high degree of standardisation and modernisation of the ICT infrastructure in the health region.
• Total investments amounted to NOK 3,046 million in 2019. The largest projects are the new hospital building in Stavanger, continued work on the Children and Youth Hospital in Bergen, and the major development projects in Helse Førde and Helse Fonna.
StrategyThe overarching vision in the Health 2035 strategy for Helse Vest RHF is to promote health, mastery and quality of life. The strategy and plans shall contribute to achieving the provision of health services for patients and be developed to meet future needs. This also applies to the development plan adopted in December 2018 with the following common goals:
• Safe and local health care services.
• Good coordination and efficient use of resources during the patient’s entire experience.
• Active patient involvement and holistic treatment.
• A futureoriented and innovative knowledge organisation
Responsible business conductThe four health regions presented a joint report on the specialist health service’s corporate social responsibility work.
The report includes all health trusts in the country and the jointlyowned companies in the area. For 2019, the report concerned climate and the environment, human rights, workers’ rights and anticorruption. The report was prepared by the Interregional cooperation committee for climate and the environment in the specialist health service and includes the health trusts in the four regions, as well as the jointly owned companies.
Statement of comprehensive income (NOK millions)
2019 2018
Operating revenues 29,979 28,581
Operating result (EBIT) 568 602
Result before tax and minority interests
662 668
Tax charge
- Minority interests
Result after tax and minority interests
662 668
Balance sheet
Total assets 27,358 24,879
- Of which cash reserves 6,075 5,560
Total equity 15,945 15,284
- Of which minority interests
Total debt and liabilities 11,413 9,595
Public procurements/grants
Procurements 0 0
Grants: Ministry of Health and Care Services
28,341 26,995
Assets and dividend
Dividend for the financial year 0 0
Dividend share 0% 0%
Average dividend percentage in the past five years
0% 0%
Dividend to the State 0 0
Repayment of capital 0 0
Capital contributions from the State 0 0
Key figures
Capital employed 20,783 18,692
Operating margin (EBIT margin) 2% 2%
Equity ratio 58% 61%
Investments
Other key figures
Number of employees 22,582 22,176
Percentage employees in Norway 100% 100%
75% 33%25% 67%Company Management group
Gender balance 2019
Helse Vest
87CATEGORY 3

Photo: Rocketfarm
CEO:Håkon Haugli Auditor: Deloitte ASWebsite: www.innovasjonnorge.no
Board of Directors: Gunnar Bovim (chair) Jørand Ødegård Lunde (vice chair) Arvid Andenæs Kristin Misund Jan Løkling Helene Falch Fladmark Merete Nygaard Kristiansen
Sigbjørn Johnsen Eirik Wærness Leela Borring Låstad* Morten HillmannBrugård* * elected by the employeesState ownership:51% The Ministry of Trade, Industry and Fisheries
State ownership The State’s goal as owner of Innova sjon Norge (Innovation Norway) is to promote a nationally coordinated service of businessoriented measures and schemes to spur commercially and socially beneficial business development and promote regional business opportunities. The State’s goal as owner is to promote valuecreating business development throughout Norway.
Attainment of the State’s goalEconomics Norway measures the impact of Innovasjon Norge’s activities by using three performance indicators. These indicate that companies which received support had annual added growth in sales revenues in 2019 of 9.0 percentage points (2018: 8.7), annual added growth in value creation of 8.3 percentage points (2018: 6.6) and annual added growth in productivity of 4 percentage points (2018: 2.2). In addition to overall measurements of the three effect indicators, measurements and regular evaluations related to the various assignments are also carried out.
Principal followup of efficient resource use takes place in connection with assignments from ministries and county councils. The company’s total operating expenses increased in 2019 and, according to primary indicators, costefficiency appeared to have fallen slightly. The company is working with digitalisation and other measures for streamlining operations, and efficient use of resources is also being followed up in light of the Government’s comprehensive review of businessoriented policy instruments.
About the company Innovasjon Norge is a policy instrument used by the State and county authorities to realise valuecreating business development throughout Norway, cf. Act relating to Innovasjon Norge. The company manages businessoriented policy instruments on assignment from various ministries and the county authorities. The common objective of these policy instruments is to promote business development that is both commercially and socioeconomically profitable and to realise regional business opportunities through secondary objectives of facilitating more good entrepreneurs, more highgrowth companies and more innovative business communities. The company was founded in 2003 by merging several different policy instruments. Innovasjon Norge's head office is in Oslo.
Important events in 2019• The Government initiated a comprehensive
review of the businessoriented policy instruments, and Innovasjon Norge makes an important contribution to this work. The review will help to further develop the company as an important policy instrument.
• Innovasjon Norge initiated a digital change of pace to give Norwegian companies easier access to Innovasjon Norge’s services and core expertise.
• Innovasjon Norge also strengthened its work on creating the easiest possible path for Norwegian businesses to access European instruments.
• Håkon Haugli took over as the new CEO of Innovasjon Norge on 11 May 2019.
StrategyInnovasjon Norge’s new strategy for 2020–2025 will strengthen the company’s ability to achieve its objectives in the coming years. The company will work to ensure that more companies are successful in achieving sustainable growth and exports. Through demanddriven work, Innovasjon Norge will strive to ensure that the business sector contributes to solving global social challenges. Innovasjon Norge will also help create jobs nationwide through active participation in regional partnerships.
Responsible business conductInnovasjon Norge works actively to strengthen corporate social responsibility, both within the company and among the company's customers, through advice and requirements. The company’s sustainability strategy constitutes the framework for the work in this area. It builds upon the UN Sustainable Development Goals, the principles in the UN Global Compact, the OECD Guidelines for Multinational Enterprises and UN Guiding Principles for Business and Human Rights. Corporate social responsibility is an integrated part of Innovasjon Norge’s services and all parties that receive services from the company are required to comply with good business practices in line with the abovestated guidelines and principles.
Statement of comprehensive income (NOK millions)
2019 2018
Operating revenues 1,297 1,279
Operating result (EBIT) 184 231
Result before tax and minority interests
140 208
Tax charge 0 0
- Minority interests 0 0
Result after tax and minority interests 140 208
Balance sheet
Total assets 26,371 26,058
- Of which cash reserves 1,272 1,067
Total equity 1,602 1,602
- Of which minority interests 0 0
Total debt and liabilities 24,769 24,457
Public procurements/grants
Procurements 0 0
Grants: The Ministry of Trade, Industry and Fisheries
1,168 1,141
Assets and dividend
Dividend for the financial year 139 195
Dividend percentage 99% 94%
Average dividend percentage in the past five years
94% 75%
Dividend to the State 117 177
Repayment of capital 0 0
Capital contributions from the State 0 0
Key figures
Capital employed
Operating margin (EBIT margin) 14% 18%
Equity ratio 6% 6%
Investments
Other key figures
Number of employees 764 723
Percentage employees in Norway 82% 82%
57% 55%43% 45%Company Management group
Gender balance 2019
Innovasjon Norge
88 CATEGORY 3

Photo: Kimen Såvarelaboratoriet AS
Board of Directors:Kåre Oskar Larsen (chair) Arnfinn Sjøseth (vice chair) Einar Strand Jostein Fjeld Jon Atle Repstad Barbro Isaksen* * elected by the employees
State ownership: 51% Ministry of Agriculture and FoodGeneral Manager: Birgitte HenriksenAuditor: Mazars Revisjon ASWebsite: www.kimen.no
State ownership The State’s rationale for ownership in Kimen Såvarelaboratoriet AS (Kimen) is to have a Norwegian provider of seed quality and seed analysis services. The State’s goal as an owner is to achieve the most resourceefficient seed and seed grain analysis in Norway.
Attainment of the State’s goalDuring 2019, the company delivered the expected quantity and quality of analyses and services and thereby fulfilled its primary objective. The laboratory is accredited by ISTA (International Seed Testing Association) for germination analysis, seed health, purity and moisture content determination of all relevant seeds and can issue international seed certificates. Participation in international tests under the direction of ISTA makes it possible to measure, and thereby safeguard, the quality of the analysis work.
About the company Kimen is a Norwegian resource centre for seed quality and seed analyses, and is the national reference laboratory for seed analyses. The undertaking has existed for more than 130 years and was converted into a limited liability company in 2004. Kimen’s head office is located in Ås.
Important events in 2019• The dry growing season in 2018 impacted on
analysis activities in spring 2019, which resulted in fewer samples from the seed businesses.
• The germination capacity in some of the oat tests was low. The cause may have been an unusually large second generation of frit flies (Oscinella spp.) from which the larvae ate the actual grain, a consequence of the hot summer in 2018.
• Publication of the analysis report for the monitoring and mapping project “Unwanted seeds (species) in imported food, feed and seeds”, on assignment from the Norwegian Food Safety Authority and participation in the report on NorGen’s “100year trial” from Svalbard. The building where Kimen rents premises from the Norwegian Food Safety Authority has been sold and will be demolished. Work on finding new premises has been of key importance to Kimen’s board and employees.
StrategyThe company's principal strategy is to utilise analysis technology and possess expertise that covers the service needs of the seed industry and the Government for services in purity, germination and health analyses of seed.
Responsible business conductIn order to achieve the objective of low greenhouse gas emissions and minimal environmental impact, Kimen has moderate travel activities and the company places an emphasis on environmental impact/use of resources when repairing equipment and purchasing goods.
Lawful working conditions are important to Kimen.
Statement of comprehensive income (NOK millions)
2019 2018
Operating revenues 11.5 12.9
Operating result (EBIT) 1.8 0.2
Result before tax and minority interests 1.7 0.3
Tax charge 0.4 0.1
- Minority interests 0 0
Result after tax and minority interests 1.4 0.2
Balance sheet
Total assets 12.8 14.2
- Of which cash reserves 8.8 11
Total equity 10.5 11.9
- Of which minority interests 0 0
Total debt and liabilities 2.3 2.3
Public procurements/grants
Procurements 0 0
Grants: Norwegian Food Safety Authority
3.6 3.6
Assets and dividend
Dividend for the financial year 0 0
Dividend share 0% 0%
Average dividend percentage in the past five years
47% 51%
Dividend to the State 0 0
Repayment of capital 0 0
Capital contributions from the State 0 0
Key figures
Capital employed 10.5 14.2
Operating margin (EBIT margin) 16% 2%
Equity ratio 82% 84%
Investments 0.2 0.1
Other key figures
Number of employees 20 21
Percentage employees in Norway 100% 100%
95% 80%5% 20%Company Management group
Gender balance 2019
Kimen Såvarelaboratoriet AS
89CATEGORY 3

Photo: Per Erik Hanevold
Auditor: PwC ASWebsite: www.kingsbay.no
Board of Directors:Tor Instanes (chair) Widar Salbuvik (vice chair) Elin Bang Tverfjeld Ellen Langeggen
State ownership: 100% Ministry of Climate and EnvironmentCEO: Per Erik Hanevold
State ownership The State’s rationale for ownership in Kings Bay is to ensure the operation, maintenance and development of infrastructure in NyÅlesund in order to develop it as a Norwegian platform for international, worldclass research collaboration. The State’s ownership also helps to maintain Norwegian communities in the archipelago, which is one of the overriding objectives of the State’s Svalbard policy. The State’s goal as owner is to ensure that Kings Bay’s properties, buildings and infrastructure are operated, maintained and developed as efficiently as possible with a view to making the best possible use of NyÅlesund as a platform for international, worldclass research collaboration.
Attainment of the State’s goalThe number of research days is a performance target for the company. There were 15,115 research days in 2019, which was the highest number of research days in Kings Bay’s history. The average number of research days in the past five years was 14,091.
About the company Kings Bay owns and is responsible for operating and developing the infrastructure in NyÅlesund in Svalbard. The company’s operations include accommodation, catering, purchasing and organising air transport services, maritime services, emergency preparedness, engineering services and water and electricity supply. Ten research communities from different nations are permanently based in NyÅlesund, and every year, close to 20 different research communities carry out research projects on the company’s property in and around NyÅlesund. Kings Bay's head office is in NyÅlesund.
Important events in 2019• The new terrestrial laboratory, Kings Bay
Vektshus, was officially opened on 2 April 2019.
• Contracts signed for the renovation of the service and administration building. This work is scheduled to commence in January 2020.
• There were 28,754 overnight stays, 15,115 of which were research days.
StrategyKings Bay's principal objective is to be a worldleading facilitator of scientific research in the Arctic. This will be achieved by optimising the operation, maintenance and development of common research infrastructure, providing necessary premises and services, and protecting NyÅlesund's cultural heritage and unique characteristics.
Responsible business conductKings Bay is a responsible stakeholder and landowner. The company works to minimize the negative impact on nature and the environment, promote gender equality, have good routines for whistleblowing and has zero tolerance for discrimination, corruption and other forms of misconduct.
Statement of comprehensive income (NOK millions)
2019 2018
Operating revenues 72.6 68.3
Operating result (EBIT) 0 1.2
Result before tax and minority interests 0 1.4
Tax charge 0 0
- Minority interests 0 0
Result after tax and minority interests 0 1.4
Balance sheet
Total assets 58.7 57
- Of which cash reserves 37.9 39
Total equity 4.6 4.6
- Of which minority interests 0 0
Total debt and liabilities 54.1 52.4
Public procurements/grants
Procurements 0 0
Grants: Ministry of Climate and Environment
32.3 50.9
Grants: Second 0.6 0.3
Assets and dividend
Dividend for the financial year 0 0
Dividend share 0% 0%
Average dividend percentage in the past five years
0% 0%
Dividend to the State 0 0
Repayment of capital 0 0
Paidin equity 0 0
Key figures
Capital employed 9.2 12.6
Operating margin (EBIT margin) 0% 2%
Equity ratio 8% 8%
Investments 29.3 36.5
Other key figures
Number of employees 25 26
Percentage employees in Norway 100% 100%
50% 33%50% 67%Company Management group
Gender balance 2019
Kings bay
90 CATEGORY 3
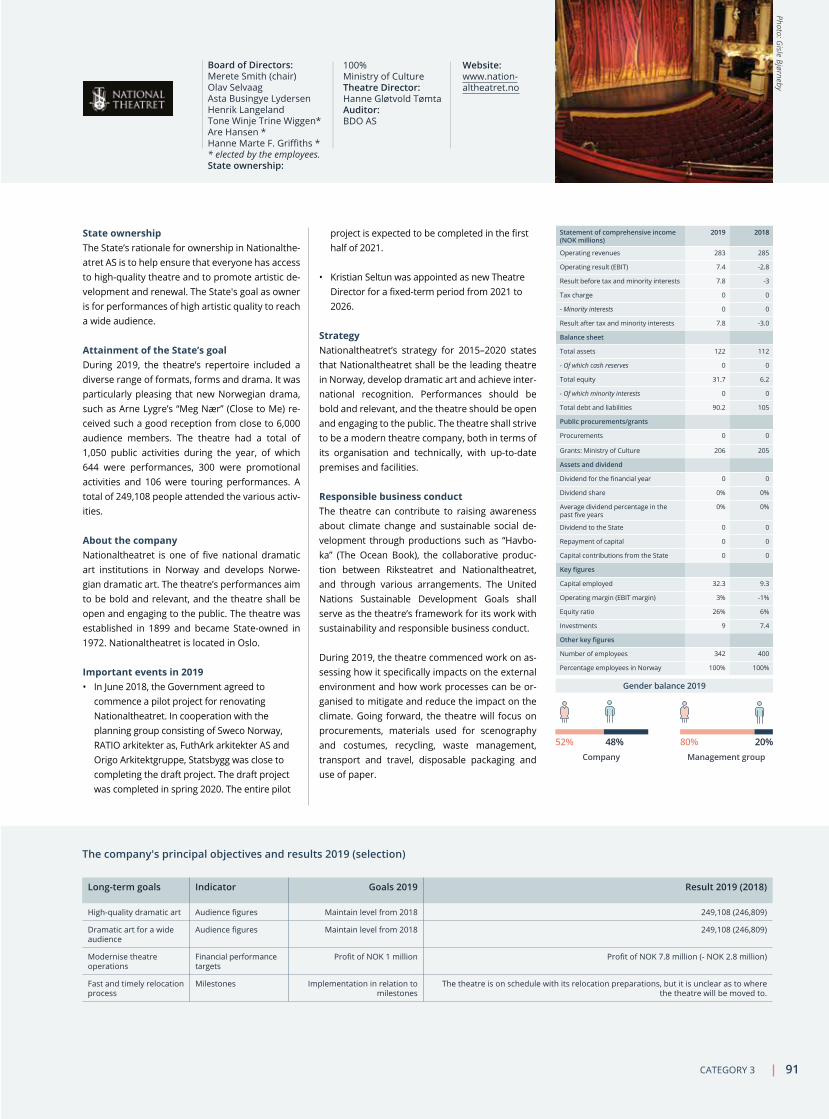
Photo: Gisle Bjørneby
The company's principal objectives and results 2019 (selection)
Long-term goals Indicator Goals 2019 Result 2019 (2018)
Highquality dramatic art Audience figures Maintain level from 2018 249,108 (246,809)
Dramatic art for a wide audience
Audience figures Maintain level from 2018 249,108 (246,809)
Modernise theatre operations
Financial performance targets
Profit of NOK 1 million Profit of NOK 7.8 million (- NOK 2.8 million)
Fast and timely relocation process
Milestones Implementation in relation to milestones
The theatre is on schedule with its relocation preparations, but it is unclear as to where the theatre will be moved to.
Website: www.nationaltheatret.no
Board of Directors:Merete Smith (chair) Olav Selvaag Asta Busingye Lydersen Henrik Langeland Tone Winje Trine Wiggen* Are Hansen * Hanne Marte F. Griffiths * * elected by the employees.State ownership:
100% Ministry of CultureTheatre Director: Hanne Gløtvold TømtaAuditor: BDO AS
State ownership The State’s rationale for ownership in Nationaltheatret AS is to help ensure that everyone has access to highquality theatre and to promote artistic development and renewal. The State's goal as owner is for performances of high artistic quality to reach a wide audience.
Attainment of the State’s goalDuring 2019, the theatre’s repertoire included a diverse range of formats, forms and drama. It was particularly pleasing that new Norwegian drama, such as Arne Lygre’s “Meg Nær” (Close to Me) received such a good reception from close to 6,000 audience members. The theatre had a total of 1,050 public activities during the year, of which 644 were performances, 300 were promotional activities and 106 were touring performances. A total of 249,108 people attended the various activities.
About the company Nationaltheatret is one of five national dramatic art institutions in Norway and develops Norwegian dramatic art. The theatre’s performances aim to be bold and relevant, and the theatre shall be open and engaging to the public. The theatre was established in 1899 and became Stateowned in 1972. Nationaltheatret is located in Oslo.
Important events in 2019• In June 2018, the Government agreed to
commence a pilot project for renovating Nationaltheatret. In cooperation with the planning group consisting of Sweco Norway, RATIO arkitekter as, FuthArk arkitekter AS and Origo Arkitektgruppe, Statsbygg was close to completing the draft project. The draft project was completed in spring 2020. The entire pilot
project is expected to be completed in the first half of 2021.
• Kristian Seltun was appointed as new Theatre Director for a fixedterm period from 2021 to 2026.
StrategyNationaltheatret’s strategy for 2015–2020 states that Nationaltheatret shall be the leading theatre in Norway, develop dramatic art and achieve international recognition. Performances should be bold and relevant, and the theatre should be open and engaging to the public. The theatre shall strive to be a modern theatre company, both in terms of its organisation and technically, with uptodate premises and facilities.
Responsible business conductThe theatre can contribute to raising awareness about climate change and sustainable social development through productions such as “Havboka” (The Ocean Book), the collaborative production between Riks teatret and Nationaltheatret, and through various arrangements. The United Nations Sustainable Development Goals shall serve as the theatre’s framework for its work with sustainability and responsible business conduct.
During 2019, the theatre commenced work on assessing how it specifically impacts on the external environment and how work processes can be organised to mitigate and reduce the impact on the climate. Going forward, the theatre will focus on procurements, materials used for scenography and costumes, recycling, waste management, transport and travel, disposable packaging and use of paper.
Statement of comprehensive income (NOK millions)
2019 2018
Operating revenues 283 285
Operating result (EBIT) 7.4 2.8
Result before tax and minority interests 7.8 3
Tax charge 0 0
- Minority interests 0 0
Result after tax and minority interests 7.8 3.0
Balance sheet
Total assets 122 112
- Of which cash reserves 0 0
Total equity 31.7 6.2
- Of which minority interests 0 0
Total debt and liabilities 90.2 105
Public procurements/grants
Procurements 0 0
Grants: Ministry of Culture 206 205
Assets and dividend
Dividend for the financial year 0 0
Dividend share 0% 0%
Average dividend percentage in the past five years
0% 0%
Dividend to the State 0 0
Repayment of capital 0 0
Capital contributions from the State 0 0
Key figures
Capital employed 32.3 9.3
Operating margin (EBIT margin) 3% 1%
Equity ratio 26% 6%
Investments 9 7.4
Other key figures
Number of employees 342 400
Percentage employees in Norway 100% 100%
52% 80%48% 20%Company Management group
Gender balance 2019
Nationaltheatret AS
91CATEGORY 3

Photo: Joe Urrutia
CEO:Øyvind FyllingJensenAuditor: Deloitte ASWebsite: www.nofima.no
Board of Directors:Olav Fjell (chair), Eirik SelmerOlsen (vice chair) Edel Storelvmo Tine Anette Grytnes Laskerud Thomas Farstad Cathrine Finne Kure* Åsa Maria O. Espmark*
Audun Iversen* * elected by the employeesState ownership: 56.8% The Ministry of Trade, Industry and Fisheries
State ownershipThe State’s rationale for ownership in Nofima AS is to have an institute that carries out research and manages research infrastructure in the aquaculture, fisheries and food industries, in areas that are not funded by the market and that are of strategic importance to Norway and different regions. The State’s goal as owner in Nofima is to contribute to value creation in the food, fisheries and aquaculture industries through longterm, strategic, industryfocussed research.
Attainment of the State’s goalThe company achieved a positive operating result in 2019 and had a positive cash flow. In addition, NOK 18.2 million was invested in companyfinanced research projects. Nofima participated in around 600 major and minor projects, and published 159 peerreviewed scientific publications, which was 20 per cent more than the previous year. There was good capacity utilisation, with average invoicing of 1,150 hours per fulltime equivalent researcher, which was in line with previous years and at the same level as other research institutions. A number of Nofima's research results have resulted in new products and innovations for the company's clients.
About the company Nofima is an industryoriented research institute that emphasises the practical application of research results. The company helps to ensure that new researchbased knowledge and ideas with commercial potential create jobs through sustainable production, new products and services. Nofima conducts research on assignment for the aquaculture industry, the fisheries industry, the onshore and offshorebased food industry, the supplier industry, the feed supplier and ingredients industry, and the public administration. The company was founded in 2008. Nofima's head office is in Tromsø.
Important events in 2019• Nofima updated and refined its strategy in line
with the United Nations Sustainable Development Goals, national research strategies and longterm plans for research, and own specialist strategies.
• Nofima clarified its target structure.
• Nofima contributed researchbased expertise to industry and the public administration.
• Nofima increased companyfinanced research activities and now has four major programmes with an annual framework of approximately NOK 20 million.
• The company is committed to responsible use and utilisation of resources.
StrategyNofirma has the ambition of being an internationally renowned applied research institute that delivers outstanding research, and creates results that benefit society and business and which contribute to valuecreation and sustainable restructuring. The company’s specialist strategies are established and followed up in relation to the relevant sustainable development goals. Nofima’s clients come from the aquaculture industry, the fisheries industry, the onshore and offshorebased food industry, the supply industry, the feed supplier and ingredients industries and the public administration.
Nofima contributes researchbased solutions along the entire value chain and carries out projects in close cooperation with clients and policy instruments. The company's projects are developed in close dialogue with the clients, and value creation is achieved by utilising the research results.
Responsible business conductNofima has implemented a number of measures to ensure that its operations and research are in compliance with the company’s ethical guidelines. Nofima has its own ethical council that reports directly to the company's board of directors. The company is committed to responsible use and utilisation of resources. The company has routines for waste management and emissions relating to
Statement of comprehensive income (NOK millions)
2019 2018
Operating revenues 676 623
Operating result (EBIT) 15.4 13.7
Result before tax and minority interests 19.6 15.5
Tax charge 0.2 2
- Minority interests 43.2 43.2
Result after tax and minority interests 19.8 17.5
Balance sheet
Total assets 418 376
- Of which cash reserves 61.2 57.4
Total equity 191 171
- Of which minority interests 82.4 73.5
Total debt and liabilities 228 205
Public procurements/grants
Procurements 0 0
Grants: The Ministry of Trade, Industry and Fisheries
106 103
Assets and dividend
Dividend for the financial year 0 0
Dividend share 0% 0%
Average dividend percentage in the past five years
0% 0%
Dividend to the State 0 0
Repayment of capital 0 0
Capital contributions from the State 0 0
Key figures
Capital employed 191 171
Operating margin (EBIT margin) 2% 2%
Equity ratio 46% 46%
Investments 19 13
Other key figures
Number of employees 394 390
Percentage employees in Norway 100% 100%
60% 43%40% 57%Company Management group
Gender balance 2019
Nofima AS
research, and works systematically to reduce the environmental impact of all of its activities. Nofima has a good working environment and good routines for ensuring gender equality and inclusion.
92 CATEGORY 3

Photo: NIO
M
CEO: Jon Einar DahlAuditor: Lundes Revisjonskontor I DAWebsite: www.niom.no
Board of Directors:Ingvild Eide Graff (chair) Steinar Meling Pål Barkvoll Nils Roar Gjerdet Tina Strømdahl Wik Ellen Berggreen Mejra Auero
Sebastian Schlafer Helga Àgùstòttir Mariana Näslund BlixtState ownership: 49% Ministry of Health and Care Services
State ownership The State’s rationale for ownership in Norsk Institutt for Odontologiske Materialer AS (NIOM) is to ensure Nordic influence in the management of the company. The State’s goal as owner is to contribute to the best possible quality and patient safety in the use of dental materials in the Nordic countries.
Attainment of the State’s goalIn 2019, the company presented 28 written publications and 35 courses and lectures as a measure of the company’s public policy goals. In terms of efficiency, the company achieved 1.2 written publications and 1.5 courses and lectures per fulltime equivalent in 2019. The average achievement of the company's public policy goals in the past five years has been 31 written publications and 28 courses and lectures. Average efficiency at the company in the past five years has been 1.5 written publications and 1.3 courses and lectures per fulltime equivalent.
About the company NIOM is a Nordic cooperative body for dental biomaterials. The company’s research, material testing, standardisation and researchbased educational activities target the dental health services and health authorities in the Nordic countries. NIOM helps to ensure that patients in the Nordic countries receive safe, wellfunctioning biomaterials. The undertaking was established in 1972 as an institute organised under the Nordic Council of Ministers and was converted into a limited liability company in 2009. NIOM’s head office is located in Oslo.
Important events in 2019• First year with NORCE Norwegian Research
Centre AS as the majority owner.
• Research focus on biocompatible materials.
• Promoted safe and wellfunctioning dental biomaterials through participation in European and international standardisation.
• Secretariat of the National Network for Research and Innovation within Oral Health.
StrategyNIOM's commitment to patient safety involves prioritising Nordic research cooperation into the biocompatibility of dental and other biomaterials. This requires interdisciplinary efforts and includes studies of the impact the materials have on the patient and the patient's impact on material quality. The company is responsible for following up the national action plan for research and innovation within oral health.
Responsible business conductThe company is transparent about the results of its research and reviews of dental biomaterials. Publication takes place in peer reviewed journals and primarily with open access. The content on the company's website is available to everyone. The company is accredited for the testing of dental materials. This involves thirdparty verification of expertise, results and suppliers in accordance with internationally standardised guidelines. NOIM is a member of an employer’s association and has collective wage agreements with trade unions.
Statement of comprehensive income (NOK millions)
2019 2018
Operating revenues 39.2 36.2
Operating result (EBIT) 0 0
Result before tax and minority interests 1.4 0.1
Tax charge 0 0
- Minority interests 0 0
Result after tax and minority interests 0 0.1
Balance sheet
Total assets 22 17.3
- Of which cash reserves 13.1 12.5
Total equity 14.6 13.2
- Of which minority interests 0 0
Total debt and liabilities 7.4 4.1
Public procurements/grants
Procurements 0 0
Grants: Ministry of Health and Care Services
26 24
Grants: Nordic Council of Ministers 11 10.9
Assets and dividend
Dividend for the financial year 0 0
Dividend share 0% 0%
Average dividend percentage in the past five years
0% 0%
Dividend to the State 0 0
Repayment of capital 0 0
Capital contributions from the State 0 0
Key figures
Capital employed 16.6 13.2
Operating margin (EBIT margin) 0% 0%
Equity ratio 66% 76%
Investments 0 0
Other key figures
Number of employees 29 27
Percentage employees in Norway 100% 100%
58% 66%42% 34%Company Management group
Gender balance 2019
Norsk Institutt for Odontologiske Materialer AS
93CATEGORY 3

Photo: Norfund
The company's principal objectives and results 2019 (selection)
Long-term goals Indicator Objectives 2019-2022 Result 2019 (2018)
Create jobs and improve living conditions in developing countries
Investments in subSaharan Africa > 50% of the portfolio 55% (55%)
Investments in "Least developed countries" > 33% of the portfolio 40% (41%)
Proportion of equity investments > 70% of all investments 80% (80%)
"Greenfield investments" > 15% of average annual commitments in the last three years
33% (33%)
Average percentage of contributed capital used for investments in renewable energy >= 50% 55% (55%)
CEO:Jan Tellef Thorleifsson Auditor: Deloitte ASWebsite: www.norfund.no
Board of Directors:Olaug Svarva (chair) Brit Kristin Sæbø Rugland Tove Stuhr Sjøblom Finn Marum Jebsen Martin Skancke Per Kristian Sbertoli
Vibeke Hammer Madsen Marianne Halvorsen* Lasse Nergaard* * elected by the employeesState ownership: 100% Ministry of Foreign Affairs
State ownership The State’s rationale for ownership in Norfund (Norwegian Investment Fund for Developing Countries) is to contribute to sustainable business development and job creation in developing countries through investments in viable businesses that would otherwise not be initiated due to the high risk involved. The State’s goal as owner is to contribute to sustainable business development in developing countries.
Attainment of the State’s goalIn 2019, Norfund created substantial positive development effects and achieved a good financial result. Norfund had a historically high level of investment in 2019. In 2019, Norfund entered into new investment commitments totalling NOK 4.015 billion. Investments in financial institutions constituted the largest share, with NOK 1.96 billion, and clean energy amounted to NOK 1.32 billion.
About the companyNorfund is the State’s investment fund for business development in developing countries. The company invests venture capital in sustainable businesses, which contributes to economic development and job creation. Returns on the investment portfolio are reinvested. Norfund's head office is in Oslo.
Important events in 2019• In 2019, Norfund's board of directors adopted a
new investment strategy for the period up until 2022.
• Green infrastructure was established as a new investment area for Norfund. Investments in waste management, water supply and electricity networks will contribute to the sustainable growth of cities and densely populated areas, reduce the negative environmental impact and improve the standard of living.
• In 2019, Norfund established a new facility for project development and risk relief after having been granted NOK 105 million for this purpose.
StrategyNorfund prioritizes investments in clean energy, financial institutions, green infrastructure and highgrowth enterprises, including in the agricultural and manufacturing industries. The new strategy slightly expands the geographical scope in West Africa, Latin America and Asia, and increases the focus on loans and fund investments.
Corporate social responsibilityNorfund's development mandate means that corporate social responsibility is at the heart of the fund's activities. The fund also sets strict requirements both for own operations and for the enterprises in the portfolio, including the crosscutting issues in development policy that cover human rights, gender equality, climate change and the environment, as well as anticorruption. Norfund requires companies in the portfolio to commit to International Finance Corporation's standards for the environment and social conditions.
Statement of comprehensive income (NOK millions)
2019 2018
Operating revenues 1,345 585
Operating result (EBIT) 1,001 217
Result before tax and minority interests 1,117 422
Tax charge 4.0 1.0
- Minority interests 0 0
Result after tax and minority interests 1,113 421
Balance sheet
Total assets 23,177 26,045
- Of which cash reserves 2,824 2,869
Total equity 23,177 26,045
- Of which minority interests 0 0
Total debt and liabilities 168 111
Public procurements/grants
Procurements 0 0
Grants: Ministry of Foreign Affairs 2,035 1,708
Assets and dividend
Dividend for the financial year 0 0
Dividend share 0% 0%
Average dividend percentage in the past five years
0% 0%
Dividend to the State 0 0
Repayment of capital 0 0
Capital contributions from the State 0 0
Key figures
Capital employed 23,177 26,045
Operating margin (EBIT margin) 74% 37%
Equity ratio 100% 100%
Investments 0 0
Other key figures
Number of employees 87 75
Percentage employees in Norway 70% 68%
43% 50%57% 50%Company Management group
Gender balance 2019
Norfund
94 CATEGORY 3

Photo: Norges sjøm
atråd AS
53% 43%47% 57%Company Management group
Gender balance 2019
CEO:Renate Larsen Auditor: KPMG ASWebsite: www.seafood.no
Board of Directors:Marianne Elisabeth Johnsen (chair) Eva Maria Kristoffersen (vice chair) Amund Drønen Ringdal Solveig Strand Knut Helge Vestre Trond Tuvstein Hallgeir Ivan Bremnes Anette Grøttland Zimowski*
Johnny Thomassen* Josefine Voraa* * elected by the employeesState ownership: 100% The Ministry of Trade, Industry and Fisheries
State ownership The rationale for the State’s ownership in Norges sjømatråd AS (Norwegian Seafood Council) is to facilitate funding of activities intended to contribute to increased demand for and knowledge about Norwegian seafood. The State’s goal as owner is to maximise the export value of Norwegian seafood.
Attainment of the State’s goal The export value of Norwegian seafood in 2019 was NOK 107.3 billion. A total of 2.7 million tonnes of seafood was exported to 149 countries. Norges sjømatråd invested NOK 431 million in 2019. Administration costs amounted to 7.9 per cent.
An analysis conducted on assignment from Norges sjømatråd in 2019 demonstrates that the effect of the company’s marketing of herring from 2003 to 2018 contributed NOK 168 million in increased annual export value, equivalent to 5.2 per cent of the export value. For mackerel, the analysis shows that Norges sjømatråd’s marketing work contributed NOK 326 million in increased export value per year, which represented 10.8 per cent of the export value. The calculations demonstrated that the respective export prices of Norwegian herring and mackerel were 31 and 99 øre higher per kilo than they would have been without marketing work.
About the company Norges sjømatråd contributes to increased value creation in the fisheries and aquaculture industry by increasing demand for and knowledge about Norwegian seafood in Norway and abroad. The company markets Norway as a country of origin and works with market information, market access and contingency planning work in the event of negative coverage of Norwegian seafood abroad. The company was founded in 1991. Norges sjømatråd’s head office is in Tromsø.
Important events in 2019 • Norsk seafood exports passed a milestone
when the export value at yearend was NOK 107.3 billion.
• Norges sjømatråd carried out activities in 28 countries and had a major campaign to promote Norwegian salmon in Japan. The measures of the effectiveness of this campaign showed that 24 million people in Japan said that they remembered the campaign, and there was a strong increase in recognition of the "Seafood from Norway" logo – up from 12.6 per cent to 42.7 per cent.
StrategyNorges sjømatråd’s principal strategy is to market Norwegian origins and promote the “Seafood from Norway” brand. The company also has separate strategies for the nine most important seafood products which take into account the unique characteristics and markets of these products.
Responsible business conductNorges sjømatråd has a separate risk management unit, an anticorruption policy and ethical guidelines, is affiliated with the Global Compact and certified as an EcoLighthouse (Miljøfyrtårn) enterprise.
Statement of comprehensive income (NOK millions)
2019 2018
Operating revenues 417 375
Operating result (EBIT) 14 51
Result before tax and minority interests 9 48.3
Tax charge 0 0
- Minority interests 0 0
Result after tax and minority interests 9 48.3
Balance sheet
Total assets 393 388
- Of which cash reserves 0 0
Total equity 285 294
- Of which minority interests 0 0
Total debt and liabilities 108 93.3
Public procurements/grants
Procurements 0 0
Grants: Ministry of Health and Care Services
4 4
Grants: Ministry of Trade, Industry and Fisheries
1 1
Assets and dividend
Dividend for the financial year 0 0
Dividend share 0% 0%
Average dividend percentage in the past five years
0% 0%
Dividend to the State 0 0
Repayment of capital 0 0
Capital contributions from the State 0 0
Key figures
Capital employed 285 294
Operating margin (EBIT margin) 3% 14%
Equity ratio 73% 76%
Investments 0 0
Other key figures
Number of employees 77 79
Percentage employees in Norway 70% 72%
Norges Sjømatråd
95CATEGORY 3

Photo: Norsk H
elsenett SF
31% 43%69% 57%Company Management group
Gender balance 2019
CEO: Johan Ronæs Auditor: Deloitte ASWebsite: www.nhn.no
Board of Directors:Herlof Nilssen (chair) Kristin Weidemann Wieland (vice chair) Cathrine M. Lofthus Kjartan Olafsson Therese Johnsen Roar Olsen
Håkon Johan Hansen* Therese Nyvold* Sindre Solem* * elected by the employeesState ownership: 100% Ministry of Health and Care Services
State ownership The State's rationale for ownership in Norsk Helsenett SF is to have direct control of the enterprise that makes necessary digital infrastructure available to the health and care sector. The State’s goal as owner is to facilitate suitable and secure infrastructure for efficient interaction between all parts of the health and care services, and to contribute to the simplification, streamlining and quality assurance of electronic services for the benefit of patients and the population in general.
Attainment of the State’s goalIn 2019, Norsk Helsenett delivered in accordance with its assignment from the Ministry of Health and Care Services.
About the company Norsk Helsenett is responsible for operating and developing secure, robust and expedient national ICT infrastructure that meets the need for efficient interaction between all of the stakeholders in the health and care sector (the Health Network). This includes the development, administration and operation of a number of national services such as www.helsenorge.no, the Core Record System, and Electronic Data Interchange (EDI). The customer group consists of all the health trusts, municipalities, general practitioners and other providers in the health and care sector, along with a number of thirdparty suppliers who provide services to them via the Health Network. The company also provides services within ICT, procurements, archiving and document management to the agencies in the health administration. The company was founded in 2009. Norsk Helsenett's head office is in Trondheim.
Important events in 2019• Norsk Helsenett prepared the establishment of
a national service provider from 1 January 2020. This involves the transfer of responsibility for the national ehealth solutions eprescription, Core Record System, basic data and helsenorge.no from the Norwegian Directorate for ehealth, including 230 employees.
• The ehealth standard, servicebased addressing, was introduced. This involves uniform and robust addressing for electronic messages and improves digital interaction.
• The area of information security was further developed. Among other things, HelseCERT has improved the vulnerability scanning service and launched new ICT security services in the sector.
• Norsk Helsenett carried out the study, design and planning for the trunk network for Helse SørØst.
StrategyNorsk Helsenett is a national service provider and shall facilitate safe and efficient electronic interaction in the health service. Norsk Helsenett shall simplify, streamline and conduct quality assurance of the design, development, operation and administration of electronic services for the Norwegian health care sector in the best interests of patients and the population in general.
Responsible business conductNorsk Helsenett exercises its corporate social responsibility in a number of ways, including apprenticeships and providing a good training environment. The company takes responsibility by being an Inclusive Working Life company (under the IA scheme) and has a good working relationship with the Norwegian Labour and Welfare Organisation (NAV) in connection with adapting workplaces and by offering internships. Norsk Helsenett is an important specialist contributor to the development of ICT tasks at national level. The company works to have operations that are as climate and environmentallyfriendly as possible.
Statement of comprehensive income (NOK millions)
2019 2018
Operating revenues 842 729
Operating result (EBIT) 32.4 0.5
Result before tax and minority interests 33.7 0
Tax charge 0 0
- Minority interests 0 0
Result after tax and minority interests 33.7 0
Balance sheet
Total assets 378 368
- Of which cash reserves 97 53.3
Total equity 142 109
- Of which minority interests 0 0
Total debt and liabilities 236 259
Public procurements/grants
Procurements 0 0
Grants: Ministry of Health and Care Services
138 145
Assets and dividend
Dividend for the financial year 0 0
Dividend share 0% 0%
Average dividend percentage in the past five years
0% 0%
Dividend to the State 0 0
Repayment of capital 0 0
Capital contributions from the State 0 0
Key figures
Capital employed 142 122
Operating margin (EBIT margin) 4% 0%
Equity ratio 38% 30%
Investments 70.9 89.6
Other key figures
Number of employees 418 373
Percentage employees in Norway 100% 100%
Norsk Helsenett SF
96 CATEGORY 3

Photo: Norsk rikskringkasting AS
Auditor: BDO ASCompany website: www.nrk.no
Board of Directors:Birger Magnus (chair) Randi B. Sætershagen (vice chair) Geir Bergkastet Silvija Seres Veslemøy Tvedt Fredriksen Lars Oscar Toverud* Tor Egelien*
Ingvild F. Fjereide* * elected by the employeesThe State’s ownership interest: 100% Ministry of CultureDirector General: Thor Gjermund Eriksen
State ownership The State’s rationale for ownership of Norsk rikskringkasting AS (NRK) is to have a noncommercial public broadcaster that meets society’s social, democratic and cultural needs. The State’s goal as owner is to ensure highquality, noncommercial public broadcasting services.
Attainment of the State’s goalThe State’s objectives for NRK are specified in chapters II and III of the company’s articles of association and contain a number of specific requirements for the content provided by NRK. NRK submits annual reports to the Norwegian Media Authority regarding how the company is performing this assignment and the Authority conducts an independent assessment of the objectives achieved in its public broadcaster report. This report is discussed at the company's annual general meeting.
89 per cent of the population of Norway uses one or more of NRK's services every day. This is two percentage points higher than in 2018 and nine percentage points higher than the goal of reaching 8 out of 10 every day. NRK's profile survey for 2019 also shows that the public generally believes that NRK does a good job in fulfilling its role as public broadcaster:
• 88 per cent believe that NRK does a “quite good” or “very good” job of broadcasting credible news, information and documentary programmes.
• 85 per cent believe NRK’s does a “quite good” or “very good” job of fulfilling its role as public broadcaster.
• 78 per cent believe NRK is "very" or "quite" important to society.
• 74 per cent of those who pay the license say that they get “excellent” or “very good” value for money.
About the company NRK provides a broad range of media services through three linear TV channels, 13 DAB radio channels, the streaming services NRK TV, NRK Super and NRK Radio, the websites www.nrk.no and www.yr.no, and mobile phone content. The company reflects the geographic diversity in Norway and has a presence at over 50 locations across Norway. NRK has 10 regional offices that provide news from across Norway to the whole country
and develop content for NRK. NRK also has ten foreign correspondents. The company was founded in 1933. NRK’s head office is located in Oslo.
Important events in 2019• In 2019, the Storting approved a new funding
arrangement for NRK. The new arrangement entails that, from and including 2020, NRK will be funded through direct grants via the national budget
• In June 2019, the general meeting consented to NRK continuing its work on a new head office and to commence the process of selling the property at Marienlyst. The general meeting approved the sale of the property at Marienlyst to Ferd Eiendom AS in May 2020, and also set conditions that need to be met for NRK’s board to have the authority to purchase a site and new head office.
• NRK and TV2 entered into an agreement with Telenor in 2019 to acquire the latter's onethird stake in the companies RiksTV and Norges Televisjon. NRK, TV 2 and Telenor previously each owned a onethird stake in RiksTV and Norges Televisjon. The transaction contributes to ensuring the continued operation of the companies and the distribution of freetoair television broadcasts to all of Norway.
StrategyNRK's longterm strategy consists of three principal strategic objectives:
• NRK strengthens and develops democracy
• NRK unites and engages everyone living in Norway
• NRK is a worldclass publisher and content producer
The measures for implementing the longterm strategy are revised annually based on analyses of developments in society, the media market, developments within the organisation, and an assessment of objectives achieved.
Responsible business conductNRK is a noncommercial public broadcaster with the objective of meeting society’s social, democratic and cultural needs. The role of public broadcaster is thus in itself a comprehensive obligation to exhibit corporate social responsibility. Further
more, in addition to the formally imposed requirements, NRK has worked for several years on applying corporate social responsibility to areas such as accessibility, purchases, HSE, diversity, security and emergency preparedness, freedom of expression and media ethics.
During 2019 NRK worked specifically to develop a comprehensive green policy for its business activities. The principal objective of this work has been to clearly prioritise goals and measures based on an analysis of NRK’s substantive impact on the climate and environment in relation to the expectations NRK’s most important stakeholders have for NRK in this area. This applies both to NRK's own productions and to external productions.
Statement of comprehensive income (NOK millions)
2019 2018
Operating revenues 6,011 5,986
Operating result (EBIT) 216 16.2
Result before tax and minority interests 196 30.9
Tax charge 2.7 2.1
- Minority interests 0 0
Result after tax and minority interests 199 28.8
Balance sheet
Total assets 2,985 3,183
- Of which cash reserves 388 516
Total equity 1,736 1,940
- Of which minority interests 0 0
Total debt and liabilities 1,249 1,243
Public procurements/grants
Procurements 0 0
Grants: Ministry of Education and Research
0.3 0
Assets and dividend
Dividend for the financial year 0 0
Dividend share 0% 0%
Average dividend percentage in the past five years
0% 0%
Dividend to the State 0 0
Repayment of capital 0 0
Capital contributions from the State 0 0
Key figures
Capital employed 1,736 1,940
Operating margin (EBIT margin) 4% 0%
Equity ratio 58% 61%
Investments 258 203
Other key figures
Number of employees 3,334 3,416
Percentage employees in Norway 100% 100%
46% 40%54% 60%Company Management group
Gender balance 2019
Norsk rikskringkasting AS
97CATEGORY 3

Photo: Norsk Tipping AS
The company's principal objectives and results 2019 (selection)
Long-term goals Indicator Goals 2019 Result 2019 (2018)
Responsible gambling Measurement of gambling behaviour Positive value and movement Negative value, positive development in 2019
Customers Number of players 2,030,000 2,040,000 (2,021,000)
Channeling Market share 65% 65% (65%)
Cost ratio Expenses/net gaming revenues Reduction 31.3% (32.8%)
Reduction in greenhouse gas emissions Tonnes of CO2equivalents Reduction 914 tonnes (1,073 tonnes)
Board of Directors:Linda Bernander Silseth (chair) Per Olav Monseth (vice chair) David Hansen Anne Lise Meyer Linda Vøllestad Westbye Andreas Egge Thorsheim Bjørn Vidar Mathisen* Linda Reinhardsen Frisvold* * elected by the employees
State ownership: 100% Ministry of CultureCEO:Åsne Havnelid Auditor: KPMG AS Website: www.norsktipping.no
State ownership The State’s rationale for ownership in Norsk Tipping is to offer acceptable forms of gambling under public control, with a view to preventing the negative consequences of gambling, while also ensuring that the proceeds from gambling go towards good causes. The State’s goal as owner is to channel the desire of Norwegians to gamble into moderate and responsible services.
Attainment of the State’s goal Figures from the Norwegian Gaming Authority show that Norsk Tipping’s gaming services channel more players yearonyear. Efficiency when measured as a share of costs went from 38.8 per cent in 2015 to 31.3 per cent in 2019. During the same period, profits distributed to good causes increased by almost NOK 1.2 billion.
About the company Pursuant to the Norwegian Gaming Act, Norsk Tipping has exclusive rights to offer a range of gambling activities in Norway. In accordance with the rules laid down by the Ministry of Culture, the company shall offer gambling in a socially acceptable form under public control, with a view to preventing the negative consequences of gambling. At the same time, through efficient operations, the company shall ensure that as much as possible of the proceeds from gambling go towards socially beneficial causes. The company was founded in 1946. Norsk Tipping's head office is in Hamar.
Important events in 2019 • The company strengthened its responsibility
framework by implementing several new measures aimed at vulnerable players. The company received international awards for its work and achieved the full score in an industry certification for responsible gambling.
• The company increased its number of customers in 2019, which indicates that Norsk Tipping’s ability to channel customers has improved.
Strategy The company's strategic objective is to be a world leader in responsible gambling and to develop Norway's best digital customer experience, as well as to develop futureoriented and customerfriendly solutions together with the trade. Norsk Tipping shall be a community builder that makes a positive contribution and is a visible presence in people's everyday lives and local community.
Responsible business conduct The company's corporate social responsibility work is based on its corporate social responsibility policy. Responsible gambling is at the heart of the corporate social responsibility work, which also includes business ethics, anticorruption, human rights, climate change and the environment. Norsk Tipping supports the United Nations Sustainable Development Goals, including goal no. 5, with the ambition of “equal opportunities for everyone at Norsk Tipping”.
Statement of comprehensive income (NOK millions)
2019 2018
Operating revenues 40,278 38,134
Operating result (EBIT) 5,604 5,473
Result before tax and minority interests 5,676 5,523
Tax charge 0 0
- Minority interests 0 0
Result after tax and minority interests 5,676 5,523
Balance sheet
Total assets 5,840 5,685
- Of which cash reserves 5,306 4,954
Total equity 496 364
- Of which minority interests 0 0
Total debt and liabilities 5,344 5,321
Public procurements/grants
Procurements 0 0
Grants 0 0
Assets and dividend
Dividend for the financial year 0 0
Dividend share 0% 0%
Average dividend percentage in the past five years
0% 0%
Dividend to the State 0 0
Repayment of capital 0 0
Capital contributions from the State 0 0
Key figures
Capital employed 496 364
Operating margin (EBIT margin) 14% 14%
Equity ratio 8% 6%
Investments 25 40
Profits distributed to good causes 5,544 5,523
Other key figures
Number of employees 423 413
Percentage employees in Norway 100% 100%
37% 43%63% 57%Company Management group
Gender balance 2019
Norsk Tipping
98 CATEGORY 3

Photo: Thomas H
augersveen
The company's principal objectives and results 2019 (selection)
Long-term goals Indicator Goals 2019 Result 2019 (2018)
Satisfied customers and passengers Customer satisfaction > 75 77 (79)
Uptodate vehicles Average technical age of vehicle pool 15 years 18.8 years (18.5 years)
Competent and satisfied employees Employee satisfaction > 75 69 (75)
Board of Directors: Annette Malm Justad (chair), Marianne Abeler, Espen Opedal, Vidar Larsen* * elected by the employeesState ownership: 100% Ministry of Transport
CEO:Øystein Risan Auditor: PwC AS Website: www.norsketog.no
State ownershipThe State’s rationale for ownership in Norske tog AS is to have a provider of rolling stock on competitionneutral terms. The State’s goal as owner is costeffective procurement and leasing of rolling stock.
Attainment of the State’s goalNorske tog provides rolling stock on competitionneutral terms to all rail operators that participate in the Norwegian Railway Directorate’s competitive tenders for passenger rail transport. Norske tog has lease agreements with GoAhead, SJ and Vygruppen. Norske tog has an A+ rating and, as of 31 December 2019, had an equity ratio of 22.5 per cent.
About the companyNorske tog procures, owns and manages rolling stock. The company enters into agreements with rail operators that have a traffic agreement with the Norwegian Railway Directorate for the lease of rolling stock. This ensures low barriers to entry for rail operators and contributes to competition on equal terms for passenger rail traffic. The company was demerged from Vygruppen in 2017. Norske tog is headquartered in Oslo.
Important events in 2019• On 10 December 2019, the Storting set the
investment framework for the purchase of 30 new trains. Norske tog has an option to purchase an additional 170 local trains.
• Norske tog took delivery of ten new FLIRT trains from Stadler in 2019. The final delivery under the present agreement for the purchase of a total of 150 trains is expected during 2022.
• In addition to Vygruppen, GoAhead became a customer of Norske tog in connection with the startup of “Traffic Package South” (Sørlandet Line and Jæren Line) on 15 December 2019.
StrategyNorske tog’s strategy is based on the objective of costefficient procurement and leasing of rolling stock. The procurement strategy shall facilitate the costeffective procurement of rolling stock, which is delivered at the agreed time and with the lowest possible environmental and carbon footprint. Clear customer information, optimised maintenance of rolling stock and a flexible financing model are important prerequisites for achieving this objective.
Responsible business conductNorske tog works systematically for more energyefficient and emissionsfree rolling stock and transport solutions, including ensuring that the rolling stock has the lowest possible environmental and carbon footprint from a life cycle perspective. Norske tog also requires that suppliers comply with explicit standards regarding ethics, integrity and corporate social responsibility. The company has several major procurements.
Statement of comprehensive income (NOK millions)
2019 2018
Operating revenues 1,256 1,217
Operating result (EBIT) 1,094 1,118
Result before tax and minority interests 285 324
Tax charge 62.6 44.2
- Minority interests 0 0
Result after tax and minority interests 222 279
Balance sheet
Total assets 13,610 13,460
- Of which cash reserves 1,734 2,372
Total equity 3,065 2,835
- Of which minority interests 0 0
Total debt and liabilities 10,545 10,625
Public procurements/grants
Procurements 0 0
Grants 0 0
Assets and dividend
Dividend for the financial year 0 0
Dividend share 0% 0%
Average dividend percentage in the past five years
0% 0%
Dividend to the State 0 0
Repayment of capital 0 0
Capital contributions from the State 0 0
Key figures
Capital employed 12,792 12,610
Operating margin (EBIT margin) 87% 92%
Equity ratio 23% 21%
Investments 1,416 842
Other key figures
Number of employees 34 32
Percentage employees in Norway 100% 100%
15% 40%85% 60%Company Management group
Gender balance 2019
Norske tog AS
99CATEGORY 3

Photo: NSD
Website: www.nsd.no
Board of Directors: Jens Petter Aasen (chair) Torstein Arne Bye Elin Haugsgjerd Allern Kjell Gunnar Salvanes Eva Stensland Vidar Wangen Rolland* Cecilie Hopland Jentoft* * elected by the employees
State ownership: 100% Ministry of Education and ResearchCEO:Vigdis Namtvedt Kvalheim Auditor: BDO AS
State ownership The State's rationale for ownership in NSD–Norsk senter for forskningsdata AS (NSD) is to have a centre that archives and adapts data and makes this available to, among others, research communities. The State’s goal as owner is to ensure the best possible data management and service provision for the higher education and research sectors.
Attainment of the State’s goalNSD provides data protection services for research to all universities and university colleges, several health trusts and a number of research institutes and other institutions that conduct research. In 2019, NSD provided data protection services to 129 enterprises. NSD also plays an important role in European research infrastructure.
NSD's data archive has achieved CoreTrustSeal international certification, which affirms that NSD has sustainable and credible data infrastructure.
About the company NSD manages data and provides services to, among others, research communities. The undertaking was established in 1971 and was organised as a limited liability company in 2003. The company’s head office is situated in Bergen.
Important events in 2019• Developed microdata.no together with
Statistics Norway, which received the Norwegian Data Protection Authority's award for best builtin privacy.
• Developed fully digitized solutions that assist in providing users with improved data management, data overview and internal controls, and that simplify archiving and access to data.
• NSD was evaluated by an expert group under the auspices of the Ministry of Education and Research and the Research Council of Norway.
StrategyNSD’s objective is to be a relevant and important instrument for Norwegian research and prioritises three strategic areas:
• National archive for research data.
• National hub for access to important research data.
• National role as data protection advisor for the university and university college sector and other research communities.
Responsible business conductNSD's ethical guidelines and values are part of its corporate governance. NSD aims to have gender balance and diversity amongst its employees and encourages suitably qualified candidates to apply for positions, irrespective of their age or cultural and ethnic background. To reduce pollution, NSD has the goal of reducing travel activities and using digital forums as much as possible.
Statement of comprehensive income (NOK millions)
2019 2018
Operating revenues 83.8 73
Operating result (EBIT) 2.3 0.2
Result before tax and minority interests 3 0.2
Tax charge 0 0
- Minority interests 0 0
Result after tax and minority interests 3 0.2
Balance sheet
Total assets 97.8 90.5
- Of which cash reserves 90 85.1
Total equity 42.6% 39.6
- Of which minority interests 0 0
Total debt and liabilities 55.2% 50.9
Public procurements/grants
Procurements 0 0
Grants: Ministry of Education and Research
19.5 21
Grants: Research Council of Norway 19 17.8
Assets and dividend
Dividend for the financial year 0 0
Dividend share 0% 0%
Average dividend percentage in the past five years
0% 0%
Dividend to the State 0 0
Repayment of capital 0 0
Capital contributions from the State 7.4 7.4
Key figures
Capital employed 42.6% 39.6
Operating margin (EBIT margin) 3% 0%
Equity ratio 44% 44%
Investments 0 0
Other key figures
Number of employees 104 92
Percentage employees in Norway 100% 100%
59% 40%41% 60%Company Management group
Gender balance 2019
Norsk senter for forskningsdata AS
100 CATEGORY 3

Photo: Nye Veier AS
The company's principal objectives and results 2019 (selection)
Long-term goals Indicator Goals 2019 Result 2019 (2018)
Rapid development Number of kilometres of opened road 50 km 50 km ()
Low development costs Percentage cost savings in the portfolio 20% 16.9% (17.3 %)
Secure development H2value* development phase 8 9.7 (10.8)
Good accessibility to the road network Annual uptime during the operating phase as a percentage 99.95% 99.89% ()
Lean and efficient builder Administration costs as a percentage of total revenue 2% 2.6% (2.1 %)
Board of Directors: Harald Vaagaasar Nikolaisen (chair) Eli Giske Dag Morten Dalen Mari Skjærstad Eva Nygren Magne A. Buaas Bye* Vivien Renell Aagre * * elected by the employees
State ownership: 100% Ministry of TransportCEO: Anette AaneslandAuditor: EY ASWebsite: www.nyeveier.no
State ownership The State’s rationale for ownership in Nye Veier AS is to safeguard national road infrastructure and contribute to faster, more efficient and comprehensive development of parts of the national road network than what can be achieved through development in the traditional sense. The State’s goal as owner is the highest possible socioeconomic profitability in the road projects for which the company has been given responsibility.
Attainment of the State’s goalThe State’s goals are operationalised in the targets of more rapid development, lower costs, increased benefit and the construction of safe roads. More rapid development primarily takes place in the form of reduced planning time. The company’s calculations at the end of 2019 support the expectation of realising NOK 28 billion in cost reductions and NOK 29 billion in increased benefit to road users.
About the companyNye Veier plans, constructs, operates and maintains sections of national roads for which the company has been delegated responsibility. The company’s development portfolio comprises approximately 700 kilometres of principally fourlane motorways, with an estimated development cost of NOK 182 billion (measured in 2019 NOK). High socioeconomic profitability is prioritised in road development. The company was founded in 2015 and has been in ordinary operation since 2016. Nye Veier’s head office is located in Kristiansand.
Important events in 2019• Nye Veier opened its first road sections: E18
Tvedestrand–Arendal (22 km) and E18 Rugtvedt–Dørdal (16 km). In addition, 12 km of new motorway was opened between Kolomoen and Kåterud as a partial opening of E6 Kolomoen–Moelv.
• The E18 Dørdal–Grimstad section underwent an intermunicipal planning process. This involved eight municipalities and two counties and resulted in approved municipal plans in the summer of 2019, approximately a year and a half after startup.
StrategyNye Veier's goal of the highest possible socioeconomic profitability is ensured in all project phases and when prioritising these. Nye Veier has developed a methodology for portfolio prioritisation whereby the road sections are assessed in accordance with socioeconomic profitability, net repercussions, traffic and societal safety, and considerations of overall development.
Responsible business conductNye Veier reports in accordance with the GRI standard for issues relating to the United Nations Global Sustainable Development Goals. Nye Veier particularly contributes to the sustainable development goals of innovation and infrastructure, decent work and economic growth and climate action. All indicators the company reports on are reflected in Nye Veier's longterm objectives and several indicators are key performance targets in the projects that the turnkey contractors report on.
Statement of comprehensive income (NOK millions)
2019 2018
Operating revenues 6,993 6,653
Operating result (EBIT) 776 1,154
Result before tax and minority interests 807 1,180
Tax charge 0 0
- Minority interests 0 0
Result after tax and minority interests 807 1,180
Balance sheet
Total assets 5,164 4,705
- Of which cash reserves 562 647
Total equity 3,886 3,078
- Of which minority interests 0 0
Total debt and liabilities 1,278 1,627
Public procurements/grants
Procurements: Ministry of Transport 5,432 5,279
Grants 0 0
Assets and dividend
Dividend for the financial year 0 0
Dividend share 0% 0%
Average dividend percentage in the past five years
0% 0%
Dividend to the State 0 0
Repayment of capital 0 0
Capital contributions from the State 0 0
Key figures
Capital employed 3,886 3,078
Operating margin (EBIT margin) 11% 17%
Equity ratio 75% 65%
Investments 13 9
Other key figures
Number of employees 162 165
Percentage employees in Norway 100% 100%
30% 25%70% 75%Company Management group
Gender balance 2019
* H2value = total number of workrelated personal injuries per million hours worked.
Nye veier AS
101CATEGORY 3

Photo: Øyvind H
agen / Statoil
The company's principal objectives and results 2019 (selection)
Long-term goals Indicator Goals 2019 Result 2019 (2018)
Maximise the value of the SDFI portfolio
Annual cash flow (NOK billion) Project
progress
NOK 119 billion 6 milestones achieved for identified projects
NOK 96 billion (NOK 120 billion) 5 milestones achieved
Managing safety and environmental concerns
Serious incident frequency1
CO2emissions
<= 0.5 3 milestones achieved for identified electrification projects
0.9 (0.7) 1 milestone achieved
Efficient operations Identified measures Implementation of 3 identified measures for the efficient operation of the company
All 3 implemented
32% 25%68% 75%Company Management group
Gender balance 2019
Website: www.petoro.no
Board of Directors: Gunn Wærsted (chair), Brian Bjordal (vice chair), Hugo Sandal, Per Arvid Schøyen, Trude Haugen Fjeldstad, Ragnar Sandvik*, AnneCathrine Nilsen*, * elected by the employees
State ownership: 100% Ministry of Petroleum and EnergyCEO:Grethe K. MoenAuditor: KPMG
State ownershipThe State’s rationale for ownership in Petoro AS is to ensure sound management of the State’s direct financial interest (SDFI). The State’s goal as owner is for the SDFI to create as much value and revenue as possible.
Attainment of the State’s goalThe net cash flow to the State from the SDFI portfolio in 2019 was NOK 96 billion. Total production from the portfolio was 964,000 barrels of oil equivalents (o.e) per day, of which fluid production was 349,000 barrels of o.e per day.
Among Petoro’s priorities in 2019 were drilling efficiency and implementing digital solutions for efficient operations across the SDFI portfolio.
About the companyPetoro AS manages the commercial aspects of the SDFI in the petroleum sector on the Norwegian continental shelf and other associated operations on behalf of the State. Under the SDFI scheme, the State participates as a direct investor in petroleum operations on the Norwegian continental shelf. Petoro is the licensee for the State’s interests in production licences, fields, pipelines and onshore facilities. The company itself is not responsible for the marketing and sale of the State’s oil and gas. Equinor has this responsibility. The company was established in 2001. Petoro's head office is in Stavanger.
Important events in 2019• Production commenced at Johan Sverdrup and
approval was granted for the plan to develop and operate phase 2 of the field.
• Decision to develop the Hywind Tampen offshore wind farm, which will help reduce CO2 emissions from the Norwegian continental shelf.
• Choice of solution for increased gas extraction at Ormen Lange and Snøhvit.
• A united Norwegian oil and gas industry launched a new climate roadmap and new climate targets. Petoro has been involved in this work.
StrategyThe mature fields in the SDFI portfolio have the highest potential value. The drilling of new wells will be the most important area for increasing revenues in the future. Safety and climate requirements constitute an important part of the strategy.
Responsible business conductThe board emphasises good corporate governance to ensure that the State’s portfolio is managed in a manner that maximises value creation and lays the foundation for trust in the company. Identifying and managing risk factors and risk exposure are part of Petoro’s commercial processes.
Guidelines for exercising corporate social responsibility have been established for the company’s board and are an integrated part of Petoro’s activities, strategy and values.
Statement of comprehensive income (NOK millions)
2019 2018
Operating revenues 292 280
Operating result (EBIT) 3.2 2.6
Result before tax and minority interests 1 5.7
Tax charge 0 0
- Minority interests 0 0
Result after tax and minority interests 1 5.7
Balance sheet
Total assets 251 250
- Of which cash reserves 232 230
Total equity 24 23
- Of which minority interests 0 0
Total debt and liabilities 227 227
Public procurements/grants
Procurements 0 0
Grants: Ministry of Petroleum and Energy
287 280.3
Assets and dividend
Dividend for the financial year 0 0
Dividend share 0% 0%
Average dividend percentage in the past five years
0% 0%
Dividend to the State 0 0
Repayment of capital 0 0
Capital contributions from the State 0 0
Key figures
Capital employed 24 23
Operating margin (EBIT margin) 1% 1%
Equity ratio 10% 9%
Investments 0.7 3.7
Other key figures
Number of employees 65 64
Percentage employees in Norway 100% 100%
1) Number of serious incidents per million hours worked.
Petoro AS
102 CATEGORY 3

Photo: Grethe N
ygaard
61% 33%39% 67%Company Management group
Gender balance 2019
Board of Directors: Inger Østensjø (chair) Morten Walderhaug (vice chair) Kåre Reiten Agathe Alexandria Ålgård Kjartan Alexander Lunde Marita Skogen* Marianne Holter* * elected by the employees
State ownership: 66.67% Ministry of CultureTheatre Director: Glenn André Kaada Auditor: EY ASWebsite: www.rogalandteater.no
State ownership The State’s rationale for ownership in Rogaland Teater AS is to help ensure that everyone has access to highquality art and culture and to promote artistic development and renewal. The State's goal as owner is a high level of artistic quality to a wide audience.
Attainment of the State’s goalThe diversity of the productions presented has continued under the new theatre director and the theatre is experiencing positive national attention and recognition for its productions. Audience numbers have remained stable at the same high level as before and the theatre is finding that talented artistic forces want to be involved in our productions. The year was devoted to contemporary drama with relevant themes, heavyweights such as Garborg, Hamsun, Shakespeare and Bergman, and the revisiting of audience favourites from 2018. 2019 was therefore a good and solid year for the theatre. 32 productions were presented in 2019 (compared with 29 in 2018), of which seven were guest performances, four were joint productions, six were takeaway performances, and 16 were inhouse productions. 93,097 tickets were sold, compared with the 88,145 tickets that were budgeted for.
In recent years, the theatre has changed its programming model to improve the services provided, increase capacity utilisation and streamline the use of resources. The theatre has succeeded in building up loyalty and increasing audience visits in recent years, however the theatre’s physical restrictions in terms of number of seats, storage space and production facilities make it difficult to further expand the repertoire in the coming year in a manner that is resourceefficient.
About the company Rogaland Teater is a regional theatre that manages theatre activities in Stavanger and the surrounding region, including tours. The children’s and youth theatre, where children perform for children in a professional setting, is an integrated part of the theatre. The theatre was established in 1883 and the State became a partowner in 1972. Rogaland Teater is located in Stavanger.
Important events in 2019• 2019 was theatre director Glenn André Kaada’s
first year as artistic director at Rogaland Teater.
• A new planning system for improved staffing solutions and more efficient logistics was in full operation from and including 2019.
StrategyThe theatre’s vision is “Make the play room bigger”! The theatre's three ambitions are to push the boundaries in the best interests of the performing arts, start construction of the recommended concept for a new theatre building in 2025, and actively reduce the theatre's negative impact on the external environment. Rogaland Teater works with five strategic areas. The most important strategic area is "Art – Artistic quality, breadth and development". The other strategic areas are directly linked to this: "Kidså" (Children' and Youth Theatre), "Kompisene” (Buddies) – which represent our surroundings in the form of customers, collaborative partners, sponsors, owners, benefactors and other stakeholders, “Kollegaene” (Colleagues) who are own employees, organisation, technology and other organisational focus areas and “Concept 6” (New theatre building) which is an important longterm strategic area. Even though a theatre building itself is only a means of achieving other objectives, the project will be of such major importance that the theatre has to think strategically regarding the challenges this entails. The theatre's values are Inquisitive, Talented and Lavish.
Responsible business conductThe theatre has publicly available guidelines for exercising corporate social responsibility. The theatre respects the fundamental human rights as laid down in international conventions in all of our activities. We also follow this up with respect to our suppliers and collaborative partners/sponsors. The theatre respects and contributes to a decent working life, where fundamental standards of work and rights are safeguarded. The theatre has adopted the ILO’s eight core conventions. The theatre has established guidelines and routines to prevent corruption and ensure transparency in financial transactions. The theatre’s operations should have the least possible negative impact on the external environment. This also applies in connection with the selection of subcontractors.
Statement of comprehensive income (NOK millions)
2019 2018
Operating revenues 117 120
Operating result (EBIT) 7.5 1.7
Result before tax and minority interests 6.3 0.3
Tax charge 0 0
- Minority interests 0 0
Result after tax and minority interests 6.3 0.3
Balance sheet
Total assets 124 117
- Of which cash reserves 22.1 27.9
Total equity 67.2 56.5
- Of which minority interests 0 0
Total debt and liabilities 56.4 60.7
Public procurements/grants
Procurements 0 0
Grants: Ministry of Culture 62.8 63.3
Grants: Rogaland County Council and Stavanger Municipality
28.7 28.4
Assets and dividend
Dividend for the financial year 0 0
Dividend share 0% 0%
Average dividend percentage in the past five years
0% 0%
Dividend to the State 0 0
Repayment of capital 0 0
Capital contributions from the State 0 0
Key figures
Capital employed 97.8 89.7
Operating margin (EBIT margin) 6% 1%
Equity ratio 54% 48%
Investments 0 0
Other key figures
Number of employees 122 124
Percentage employees in Norway 100% 100%
Rogaland teater AS
103CATEGORY 3

Photo: Bård Gudim
IICEO: Aslak TveitoAuditor: Lundes Revisjonskontor DAWebsite: www.simula.no
Board of Directors: Ingvild Myhre (chair) Mats Lundqvist Pinar Heggernes I ngolf Søreide Petter Nielsen Hilde Brunvand Nordvik Katharina Ringen Asting
Elin Backe Christophersen* Wolfgang Simon Funke * * elected by the employeesState ownership: 100% Ministry of Education and Research
State ownership The State's rationale for ownership in Simula Research Laboratory AS (Simula) is to have a stakeholder which is not part of a university or university college, that engages in research and education within ICT, including ICT security. The State’s goal as owner is the best possible research, education and innovation within ICT.
Attainment of the State’s goalIn 2019, Simula's employees published 88 articles in international journals and wrote a book, three chapters in books and 83 peerreviewed conference articles. During 2019, Simulas research staff mentored nine candidates in completing their PhDs and 26 students in completing their master’s degrees. Simula also had 24 students in various projectbased internships during the summer.
About the companySimula conducts basic research in selected areas within the field of software engineering and communications technology, and thereby contributes to innovation in business and industry. The company also educates computer scientists in collaboration with degreeconferring institutions. Simula is the host institution for a centre for researchbased innovation, the Certus Centre. The company was established in 2001. Simula's head office is in Bærum.
Important events in 2019• Simula conducted its first major sale of a
company in the group when Kalkulo AS was sold to Bluware Corp.
• Simula Consulting was established to coordinate and streamline the company’s work in relation to the labour market. Among other things, Simula Consulting offers tailored courses.
• Simula entered into a computer science partnership with BI Norwegian Business School.
StrategySimula's vision is to be an outstanding research institution that resolves important and fundamental problems, educates highly qualified experts and leaders, and contributes to innovation. The company has set strategic objectives that cover the entire organisation.
Responsible business conductSimula places strong emphasis on diversity among employees and good working conditions. The company has a target of 40 per cent female employees by 2028. Simula also actively works with management development at all levels. The company believes that a high ethical standard has an intrinsic value for both the company and individual employees. In addition, Simula believes this to be an important aspect of the company’s responsibility as a participant in society and that it helps to maintain trust from the outside world. The company has ethical guidelines that, among other things, address research ethics, working environment and conflicts of interest.
Statement of comprehensive income (NOK millions)
2019 2018
Operating revenues 236 248
Operating result (EBIT) 5.2 18.5
Result before tax and minority interests 42.2 17.4
Tax charge 0.1 0.6
- Minority interests 5.8 5.9
Result after tax and minority interests 36.3 10.9
Balance sheet
Total assets 222 175
- Of which cash reserves 92.4 58.3
Total equity 128 91.3
- Of which minority interests 19.1 13.4
Total debt and liabilities 93.5 83.9
Public procurements/grants
Procurements 0 0
Grants: Ministry of Education and Research
75.8 57.8
Grants: The Ministry of Justice and Public Security, Ministry of Trade, Industry and Fisheries, Ministry of Transport
43.5 42.9
Assets and dividend
Dividend for the financial year 0 0
Dividend share 0% 0%
Average dividend percentage in the past five years
0% 0%
Dividend to the State 0 0
Repayment of capital 0 0
Capital contributions from the State 0 0
Key figures
Capital employed 128 91.3
Operating margin (EBIT margin) 2% 7%
Equity ratio 58% 52%
Investments 22.5 3.9
Other key figures
Number of employees 155 155
Percentage employees in Norway 98% 98%
30% 46%70% 54%Company Management group
Gender balance 2019
Simula Research Laboratory AS
104 CATEGORY 3

Photo: Hans Kristian Thorbjørnsen
49% 67%51% 33%Company Management group
Gender balance 2019
Auditor: EY ASWebsite: www.siva.no
Board of Directors: Kjell Roland (chair) Mette Kamsvåg (vice chair) Heine Østby, Arve Ulriksen Tine Rørvik Bjørn Østbø Maja Adriaensen Jørgen Andersen** elected by the employees
State ownership: 100% The Ministry of Trade, Industry and FisheriesCEO:Ingrid Riddervold Lorange
State ownership The State’s rationale for ownership in Siva – Selskapet for Industrivekst SF (Industrial Development Corporation of Norway) is to have a policy instrument for facilitating ownership and development of companies and business and knowledge communities throughout Norway. Siva has a special responsibility for promoting growth in remote areas. The State’s goal as owner is to trigger profitable business development by making infrastructure and joint resources available to companies and regional business and research communities.
Attainment of the State’s goalThe governance indicators, which reflect the company’s attainment of goals, showed positive results in 2019. The average return on property activities was measured at 6.1 per cent in 2019, compared with the requirement of 3.6 per cent. In the past five years, more than half of the target companies in the business garden and incubator programmes have experienced an increase in turnover. A report published by Statistics Norway in 2018 showed that companies in Sivasupported incubators and business gardens had more growth and higher value creation than comparable enterprises in a control group.
About the companySiva is a part of the system of businessoriented policy instruments. Through its property investments, the company aims to lower entry barriers for the establishment of commercial activity in areas or industries where market mechanisms make entry especially difficult. Through its innovation activities, Siva facilitates the establishment and development of enterprises in business and knowledge communities and links them together in regional, national and international networks. The company was established in 1968. Siva’s head office is in Trondheim.
Important events in 2019• The company worked to facilitate the transfer of
responsibility as contracting authority for the business garden and incubator programme from the Ministry of Trade, Industry and Fisheries and the Ministry of Local Government and Modernisation to the county councils from 2020.
• In 2019, Siva commenced construction of an industrial building at Drag in Nordland for The Quartz Corp. Siva has invested NOK 60 million in the industrial building.
• In 2019, Siva announced pilot projects for strengthening existing centres and the selection of new centres under the Catapult scheme.
StrategySiva facilitates restructuring and innovation by providing entrepreneurs and businesses with access to capital, networks, expertise and testing facilities, as well as lowering barriers for establishing business activities in areas where the property market is demanding. The company manages property, ownership of innovation companies and has programme activities and Catapult Centres at a total of 130 different locations throughout the country and in every region. Siva's policy instruments enhance the effect of other businessoriented policy instruments.
Responsible business conductSiva has a continual focus on compliance with guidelines and standards for areas that come under the company's corporate social responsibility. Siva's ethical guidelines and values form the basis for the company’s business practices and personal conduct.
Statement of comprehensive income (NOK millions)
2019 2018
Operating revenues 598 448
Operating result (EBIT) 105 3
Result before tax and minority interests 143 4
Tax charge 45 12
- Minority interests 2 2
Result after tax and minority interests 100 18
Balance sheet
Total assets 3,191 2,955
- Of which cash reserves 0 0
Total equity 1,050 922
- Of which minority interests 59 33
Total debt and liabilities 2,141 2,033
Public procurements/grants
Procurements 0 0
Grants: Ministry of Local Government and Modernisation
145 141
Grants: Ministry of Agriculture and Food 0 5.4
Grants: Ministry of Trade, Industry and Fisheries
215 214
Assets and dividend
Dividend for the financial year 0 50
Dividend share 0% 3%
Average dividend percentage in the past five years
0% 0%
Dividend to the State 0 50
Repayment of capital 0 0
Capital contributions from the State 0 0
Key figures
Capital employed 2,058 1,852
Operating margin (EBIT margin) 18% 1%
Equity ratio 33% 31%
Investments 0 0
State loan limit 700 700
Government loan 700 700
Interest on State loans 15% 17%
Commissions on State loans 7 7
Other key figures
Number of employees 45 43
Percentage employees in Norway 100% 100%
Siva – Selskapet for Industrivekst SF
105CATEGORY 3

Photo: Space Norw
ay AS
14% 33%86% 67%Company Management group
Gender balance 2019
Board of Directors: Asbjørn Birkeland (chair) Tore Olaf Rimmereid Arild Hustad Hege Flatheim Nina FrisakState ownership:
100% Ministry of Trade, Industry and FisheriesCEO: Jostein Rønneberg
State ownership The State's rationale for ownership in Space Norway AS is to manage and further develop safetycritical, spacerelated infrastructure that covers important Norwegian societal needs. The State’s goal as owner is to offer costeffective and properly managed spacerelated infrastructure that covers important Norwegian societal needs.
Attainment of the State’s goalDuring 2019, the company identified, developed and implemented new projects within spacerelated activities. The main project in the past year has been the development work for establishing satellitebased broadband in the Arctic, including the construction of two satellites with the associated ground segment in Northern Norway (Arctic Satellite Broadband Mission (ASBM)). The project is of major importance to public policy and, when the satellites are operational, will provide broadband in the Arctic. Space Norway has delivered a secure cable connection to the Svalbard community and communication to the Troll research station. In 2019, Statsat completed its assignment related to the Norwegian Coastal Administration's need for satellitebased AIS information. As an owner and through its work on the board, Space Norway contributes to further development and value creation at Kongsberg Satellite Services, which has achieved good international growth.
About the companySpace Norway contributes to the development and operation of spacerelated infrastructure in order to meet national user requirements and facilitate value creation based on spacerelated activities in Norway. The company identifies and develops new opportunities and projects with a longterm horizon, and collaborates with other national communication and space organisations. Space Norway owns and manages the fibre optic cable between mainland Norway and Svalbard. The company was divested from the Norwegian Space Centre Foundation in 1995. Space Norway's head office is in Oslo.
Important events in 2019• Important measures were implemented to
ensure the accessibility of the fibre cable connection to Svalbard.
• On 21 June 2019, the ASBM project received approval for funding from the State and the project moved onto the construction phase in early July.
• The company is working to produce a microsatellite for radar testing and demonstration.
• In the development of the new international maritime VHF Data Exchange System (VDES), the company has, in cooperation with Norwegian operators, been awarded several ESA contracts and was allocated frequencies for the VDES satellite component during the World Radio Conference.
StrategyThe company's most important focus areas are:
• adequate safety and efficient operation of already established sociallycritical infrastructure,
• followup of agreements entered into for the ASBM programme,
• development of small satellite activities to assist with maritime surveillance, maritime safety and emergency preparedness.
Responsible business conductRisk assessments are carried out for new projects and for operations throughout the year. The company has adopted guidelines and routines for ethical conduct and corporate social responsibility, including work on responsible procurement and the relationship with suppliers. The company is committed to preventing corruption.
Statement of comprehensive income (NOK millions)
2019 2018
Operating revenues 69.7 61.3
Operating result (EBIT) 27.9 59.4
Result before tax and minority interests 110 41.8
Tax charge 0.1 0.1
- Minority interests 0 0
Result after tax and minority interests 110 41.7
Balance sheet
Total assets 1,744 759
- Of which cash reserves 295 79.8
Total equity 640 530
- Of which minority interests 0 0
Total debt and liabilities 1,104 228
Public procurements/grants
Procurements 0 0
Grants 0 0
Assets and dividend
Dividend for the financial year 0 0
Dividend share 0% 0%
Average dividend percentage in the past five years
0% 0%
Dividend to the State 0 0
Repayment of capital 0 0
Capital contributions from the State 0 0
Key figures
Capital employed 640 687
Operating margin (EBIT margin) 40% 97%
Equity ratio 37% 70%
Investments 758 57
Other key figures
Number of employees 27 21
Percentage employees in Norway 100% 100%
Auditor: KPMG AS Website: www.spacenorway.no
Space Norway AS
106 CATEGORY 3

Photo: Henrik G
lette
CEO: Auke Lont Auditor: Deloitte ASWebsite: www.statnett.no
Board of Directors: Jon Fredrik Baksaas (chair) Tove Elisabeth Pettersen (vice chair) Maria Sandsmark Egil Gjesteland Einar Strømsvåg Pernille Dørstad*
Steinar Jøråndstad* Ole Bjørn Kirstihagen* *elected by the employeesState ownership: 100% Ministry of Petroleum and Energy
State ownership The State's rationale for ownership in Statnett SF is that the company owns the transmission network and is system operator for the Norwegian power system. The State’s goal as owner is ensuring the rational operation and development of the central electricity transmission grid in accordance with socioeconomic criteria.
Attainment of the State’s goalStatnett achieves the objective by realising socioeconomically profitable projects in the transmission grid and ensuring that there is a balance at all times between the generation and consumption of electrical power in Norway.
Statnett achieved its target of a 15 per cent increase in efficiency from 2013 to 2018. Statnett established a new efficiency programme in 2019 that will continue until and including 2022 and which will combine a cost focus with goals for better system and resource utilization. Statnett has the goal of being among the 25 per cent most costeffective transmission grid operators in Europe.
About the companyStatnett is the transmission system operator in the Norwegian power system, and is responsible for socioeconomically rational operation and development of the transmission grid. The company is responsible for ensuring that there is a balance at all times between production and consumption of electrical power in Norway. Statnett has a monopoly on owning and operating the transmission grid in Norway. The company was established in 1992 when Statskraftverkene was split into Statnett and Statkraft. Statnett's head office is in Oslo.
Important events in 2019• In December 2019, Statnett and the other
transmission system operators in the Nordic region and Baltic countries entered into an agreement to sell 66 per cent of the shares in the Nordic power exchange NordPool to Euronext, which also owns the Oslo Stock Exchange.
• The power industry’s central data hub (Elhub) for processing meter readings from power customers was put into operation in 2019. Statnett has been responsible for establishing and managing Elhub.
• The subsea power cable between Norway and Germany, as well as the converter station on the Norwegian side, were tested and made ready for use in 2019. The laying of land cable on the German side is ongoing. Work on the power cable to England continued in 2019. The cable to Germany is due to be commissioned by the end of 2020 and the England cable in 2021.
• The Ministry of Petroleum and Energy decided in November 2019 that Statnett would be subject to the Norwegian Security Act.
StrategyStatnett's strategy is to develop and operate a futureoriented and costeffective power system that facilitates increased renewable energy production, new commercial and industrial activities and electrification to cut greenhouse gas emissions. The company shall ensure satisfactory delivery quality.
Responsible business conductStatnett contributes to the United Nations Sustainable Development Goals through infrastructure and enabling Norway and our neighbouring countries to increase their shares of renewable energy and reduce greenhouse gas emissions. Health, safety and working conditions are a high priority. The measures taken to achieve this include digital security work, followup of suppliers and an increased focus on corporate social responsibility in connection with purchases and through recruitment and employee development. Statnett also has the ambition of being a leader in environmental and climate work in the sector by minimising the impact its facilities have on natural diversity and landscape values, and by reducing its own greenhouse gas emissions.
Statement of comprehensive income (NOK millions)
2019 2018
Operating revenues 9,641 9,138
Operating result (EBIT) 3,027 3,120
Result before tax and minority interests 2,440 2,701
Tax charge 534 488
- Minority interests 0 0
Result after tax and minority interests 1,906 2,213
Balance sheet
Total assets 76,323 70,281
- Of which cash reserves 1,327 1,956
Total equity 17,783 16,194
- Of which minority interests 0 0
Total debt and liabilities 58,540 54,087
Public procurements/grants
Procurements 0 0
Grants 0 0
Assets and dividend
Dividend for the financial year 1,261 484
Dividend percentage 66% 22%
Average dividend percentage in the past five years
42% 33%
Dividend to the State 1,261 484
Repayment of capital 0 0
Capital contributions from the State 0 0
Key figures
Capital employed 67,982 61,931
Operating margin (EBIT margin) 31% 34%
Equity ratio 23% 23%
Investments 9,618 12,377
Other key figures
Number of employees 1,493 1,461
Percentage employees in Norway 100% 100%
26% 29%74% 71%Company Management group
Gender balance 2019
Statnett SF
107CATEGORY 3

Photo: Torkel SkoglundWebsite: www.statskog.no
Board of Directors: Gunnar Olofsson (chair) Eli Reistad Ellen Tveit Klingenberg Christine Tørklep Ole Johan Eira Øystein Sundnes* Siw Anita Kvam* * elected by the employees
State ownership: 100% Ministry of Agriculture and FoodCEO: Gunnar LienAuditor: KPMG AS
State ownership The State's rationale for ownership in Statskog SF is to ensure the sustainable management of national forest and mountain properties, and associated resources, including meeting public demand for hunting, fishing and outdoor recreational facilities, etc. The State’s goal as owner is the sustainable management of these areas through efficient operations and satisfactory financial results over time.
Attainment of the State’s goalStatskog's forestry activities are environmentally certified according to ISO 14001 in accordance with the Norwegian PEFC Forest Standard. Statskog is also certified as a group member in accordance with the FSC (Forest Stewardship Council) with the properties in Statskog Børresen AS and Statskog Sølvverket in Kongsberg. Statskog's financial results from its ongoing operations have been developing in a positive direction for many years, and this continued in 2019. High timber prices in 2019 resulted in strong profitability for forestry activities, however the felling volume was somewhat lower due to initiated preservation processes and temporary stoppages in the buying of timber from large timber purchasers at the end of 2019. In 2019, the company also managed to increase ongoing revenues from the lease of land and energy resources. Revenues from hunting and fishing were slightly lower in 2019 than the previous year. Low grouse counts meant that many hunting grounds had to be closed. Oneoff revenues from forest protection and land sales mean that Statskog SF’s annual financial result fluctuates from year to year. There were low revenues from forest protection compensation in 2019.
About the companyStatskog SF is Norway's largest landowner and manages around onefifth of mainland Norway’s surface area. This land is virtually all mountains and uncultivated wilderness. The company also safeguards and develops all assets on public land and guarantees public access to hunting, fishing and outdoor recreation in Norway. Statskog SF is also Norway's largest forest owner, with around 6 per cent of the productive forest area in Norway. Statskog's commercial activities comprise forestry, wilderness management and other land and property management. The company was established in 1993 when it was converted from the Directorate for State Forests. Statskog's head office is in Namsos.
Important events in 2019• Timber prices were high in 2019, but were lower
towards the end of the year.
• Statskog initiated partial funding of several research initiatives for forests, including research on forest plants that will better withstand climatic variations.
• Statskog closed many grouse hunting grounds due to low grouse numbers.
• Statskog entered into an agreement with the Norwegian Environment Agency for the restoration of wetlands.
StrategyStatskog’s objective is to safeguard and develop all community land and ensure the public has equal access to and conditions for hunting, fishing and outdoor recreation. The company shall be Norway’s most professional landowner and be efficient and useroriented. Longterm profitability shall be achieved through knowledgebased and sustainable utilization of the properties’ resources. Forest shall be managed effectively within a sustainable framework. The company shall identify and highlight all types of resources on the properties, and realise the development potential of the properties.
Responsible business conductStatskog's sustainability work is integrated into the company's daytoday operations. The company complies with the international standard, Global Reporting Initiative (GRI). This work includes extensive and systematic dialogue with a large number of the company’s stakeholders. Statskog's sustainability ambitions are linked to the eight United Nations Sustainable Development Goals for 2030 that are most relevant to the company. The company considers itself particularly wellequipped to have an influence on United Nations Sustainable Development Goal no. 3 “Good Health and Wellbeing” by providing access to resources for outdoor recreation, hunting and fishing, no. 13 “Climate Action”, with initiatives for increased carbon capture such as planting and fertilising, and no. 15 “Life On Land”, with environmentally certified forestry and reestablishment of siteadapted forest following logging activities.
Statement of comprehensive income (NOK millions)
2019 2018
Operating revenues 340 413
Operating result (EBIT) 77 120
Result before tax and minority interests 91 127
Tax charge 7 12
- Minority interests 0 1
Result after tax and minority interests 84 114
Balance sheet
Total assets 2,063 2,094
- Of which cash reserves 228 318
Total equity 1,878 1,836
- Of which minority interests 3 6
Total debt and liabilities 185 258
Public procurements/grants
Procurements: Ministry of Agriculture and Food
14 14
Grants 0 0
Assets and dividend
Dividend for the financial year 64 80
Dividend percentage 76% 70%
Average dividend percentage in the past five years
62% 54%
Dividend to the State 64 80
Repayment of capital 0 0
Capital contributions from the State 0 0
Key figures
Capital employed 1,878 1,836
Operating margin (EBIT margin) 23% 29%
Equity ratio 91% 88%
Investments 0 0
Other key figures
Number of employees 115 111
Percentage employees in Norway 100% 100%
33% 21%67% 79%Company Management group
Gender balance 2019
Statskog SF
108 CATEGORY 3
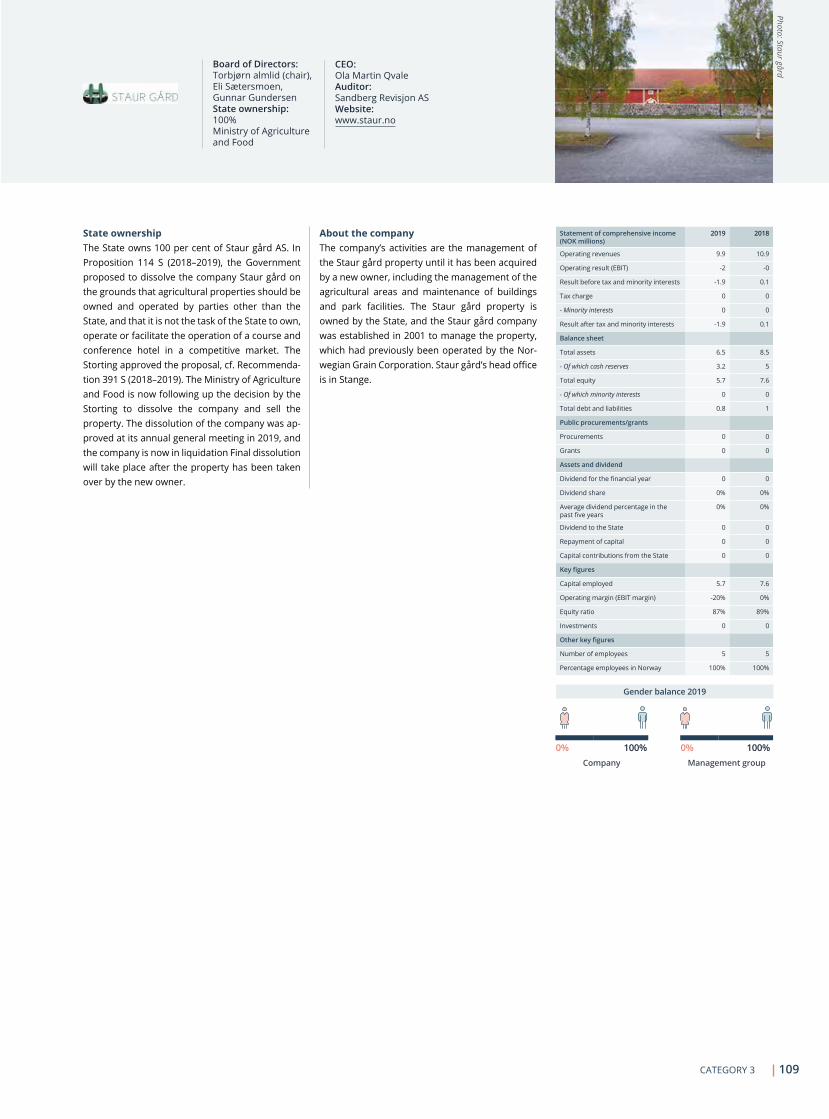
Photo: Staur gård
0% 0%100% 100%Company Management group
Gender balance 2019
Board of Directors: Torbjørn almlid (chair), Eli Sætersmoen, Gunnar GundersenState ownership: 100% Ministry of Agriculture and Food
CEO: Ola Martin Qvale Auditor: Sandberg Revisjon ASWebsite: www.staur.no
State ownership The State owns 100 per cent of Staur gård AS. In Proposition 114 S (2018–2019), the Government proposed to dissolve the company Staur gård on the grounds that agricultural properties should be owned and operated by parties other than the State, and that it is not the task of the State to own, operate or facilitate the operation of a course and conference hotel in a competitive market. The Storting approved the proposal, cf. Recommendation 391 S (2018–2019). The Ministry of Agriculture and Food is now following up the decision by the Storting to dissolve the company and sell the property. The dissolution of the company was approved at its annual general meeting in 2019, and the company is now in liquidation Final dissolution will take place after the property has been taken over by the new owner.
About the company The company’s activities are the management of the Staur gård property until it has been acquired by a new owner, including the management of the agricultural areas and maintenance of buildings and park facilities. The Staur gård property is owned by the State, and the Staur gård company was established in 2001 to manage the property, which had previously been operated by the Norwegian Grain Corporation. Staur gård’s head office is in Stange.
Statement of comprehensive income (NOK millions)
2019 2018
Operating revenues 9.9 10.9
Operating result (EBIT) 2 0
Result before tax and minority interests 1.9 0.1
Tax charge 0 0
- Minority interests 0 0
Result after tax and minority interests 1.9 0.1
Balance sheet
Total assets 6.5 8.5
- Of which cash reserves 3.2 5
Total equity 5.7 7.6
- Of which minority interests 0 0
Total debt and liabilities 0.8 1
Public procurements/grants
Procurements 0 0
Grants 0 0
Assets and dividend
Dividend for the financial year 0 0
Dividend share 0% 0%
Average dividend percentage in the past five years
0% 0%
Dividend to the State 0 0
Repayment of capital 0 0
Capital contributions from the State 0 0
Key figures
Capital employed 5.7 7.6
Operating margin (EBIT margin) 20% 0%
Equity ratio 87% 89%
Investments 0 0
Other key figures
Number of employees 5 5
Percentage employees in Norway 100% 100%
Staur gård AS
109CATEGORY 3

Photo: Ragnhild Utne
15% 13%85% 87%Company Management group
Gender balance 2019
Website: www.snsk.no
Board of Directors: Annette Malm Justad (chair ), Johnny Undeli (vice chair) , Dina Elverum Aune, Bente Lillestøl, Birger Nilsen, Rune Mjelde*, Håvard Velve * elected by the employeesState ownership:
100% Ministry of Trade, Industry and FisheriesCEO: Jan Morten ErtsaasAuditor: PwC AS
State ownership The State’s rationale for ownership in Store Norske Spitsbergen Kulkompani AS (SNSK) is to have a stakeholder in Svalbard that, through the operation of Mine 7, management of residential housing and other activities, is able to help maintain and develop the Longyearbyen community in a way that underpins the general objectives of Norway's Svalbard policy, cf. the Svalbard Report. The State’s goal as owner is to help ensure that the power station in Longyearbyen has access to a stable and secure supply of coal through the operation of Mine 7 and that by managing and developing its own residential housing in Longyearbyen, the company contributes to supporting the general objectives of Norway's Svalbard policy. Mine 7 and the housing operations must be managed efficiently. The company's other operations must be carried out on a commercial basis. The most important consideration is that all activities are carried out to support the general objectives of Norway's Svalbard policy, cf. the Svalbard Report.
Attainment of the State’s goalThe company produced 117,000 tonnes of coal in 2019 and delivered approximately 30,750 tonnes of coal to Longyearbyen Energiverk (power plant). The remaining production was primarily delivered as industrial coal to customers in Europe. Coal production takes place at the subsidiary, Store Norske Spitsbergen Grubekompani, which has efficient operations.
SNSK manages approximately 380 residential properties in Longyearbyen that are rented out to State and private tenants through the subsidiary Store Norske Boliger (SNB). SNB is operated efficiently.
About the company SNSK’s core business is coal mining in Svalbard. The group manages coal mining operations in Mine 7, which is located outside of Longyearbyen, residential property activities in Longyearbyen, a mining museum and logistical services in Svalbard. SNSK is also responsible for remediation of the former coal mining activities in Svea and Lunckefjell. The company was established in 1916 and the State became the owner in the 1930s. SNSK’s head office is in Longyearbyen.
Important events in 2019• The Svea Lunckefjell environmental project was
commenced and marked the start of a unique environmental restoration project where an entire mining community will be remediated and returned to nature.
• The Lunckefjell mine was remediated and closed in March 2019.
• Completed construction of twelve new apartments which replaced the homes lost in the 2015 avalanche.
• Based on the conclusion of the mining operations in Svea and the owner's objectives for its ownership, the company has developed and decided on a new strategy that clearly supports Norwegian Svalbard policy.
StrategySNSK is a key stakeholder in Svalbard and will:
• Be a responsible employer that provides stable, profitable and yearround Norwegian jobs, and be a leading company for good working conditions in Svalbard.
• Own and develop residential and commercial property in a manner that contributes to achieving the State's objectives in Svalbard.
• Contribute to continuing the culture in Svalbard by preserving historical artefacts and locations, and by passing on knowledge of Norwegian activities in the Arctic and in Svalbard.
• Contribute to value creation in Svalbard and actively facilitate and participate in new, local commercial development.
• Contribute to a wellfunctioning commercial structure in Longyearbyen and Svalbard by creating a diverse business sector, correcting imbalances in the market and ensuring that necessary functions are maintained.
Statement of comprehensive income (NOK millions)
2019 2018
Operating revenues 200 383
Operating result (EBIT) 294 47
Result before tax and minority interests 295 44
Tax charge 4.4 9
- Minority interests 0.4 0.2
Result after tax and minority interests 300 53.2
Balance sheet
Total assets 777 710
- Of which cash reserves 305 293
Total equity 1,500 2,183
- Of which minority interests 0 0
Total debt and liabilities 2,277 2,893
Public procurements/grants
Procurements 0 0
Grants: Ministry of Trade, Industry and Fisheries
331 162
Assets and dividend
Dividend for the financial year 0 0
Dividend share 0% 0%
Average dividend percentage in the past five years
0% 0%
Dividend to the State 0 0
Repayment of capital 0 0
Capital contributions from the State 43.0 0
Key figures
Capital employed 1,368 2,042
Operating margin (EBIT margin) 147% 12%
Equity ratio 193% 307%
Investments 40.5 0
Other key figures
Number of employees 148 124
Percentage employees in Norway 100% 100%
Responsible business conductAs a company with public policy goals, SNSK relies on a high level of trust and a good reputation among central government and local authorities, partners, the local community, interest groups and the community at large. The company’s management principles are stated in the “corporate governance report” and describe key areas such as the role of the company, principles for business operations and priorities, as well as work with corporate social responsibility, sustainability and ethical guidelines. The report is updated each year and is available at the company's website.
Store Norske Spitsbergen Kulkompani AS
110 CATEGORY 3

Photo: Jörg Wiesner
50% 100%50% 0%Company Management group
Gender balance 2019
Board of Directors: John Gordon Bernander (chair), Audhild Dahlstrøm, Cecilie Broch Knudsen, Siren Sundland, Ingrid Røynesdal, Sveinung Andreas Golimo, Bjørn Olav Ragnar Øiulfstad
State ownership: 33.3% Ministry of CultureGeneral Manager: Maria Cecilie Mediaas JørstadAuditor: Deloitte ASWebsite: www.talentnorge.no
State ownershipThe State's rationale for ownership in Talent Norge AS is to contribute to developing the best artistic talent in Norway in a collaboration between the State and private stakeholders, and in so doing contribute to an internationally renowned cultural sector and more worldclass artists. The State’s goal as owner is to contribute to the development of the best artistic talents in Norway.
Attainment of the State’s goalAt the end of 2019, Talent Norge had generated talent initiatives with a combined value of NOK 335.6 million. Of these, NOK 194.5 million was from private contributors, and NOK 141.1 million was from Talent Norge. Ties with private contributors were further strengthened through many such contributors increasing their contributions or entering into new initiatives.
Talent Norge contributes to an internationally renowned cultural sector and the broader financing of the cultural sector.
About the companyTalent Norge provides expertise, development opportunities and financial support to talented artists. The company prioritises initiatives aimed at talented artists who are either just about to complete their higher arts education or have recently graduated. The target group comprises both performing and creative artists in all forms and expressions of art. Talent Norge collaborates with influential organisations, institutions and communities within the Norwegian cultural sector. The company was established in 2015. Talent Norge’s head office is in Oslo.
Important events in 2019• In 2019, the company adopted nine new
initiatives and continued eleven ongoing initiatives. As of 31 December 2019, the company was involved in 52 talent development programmes. The programmes extend from 2015 to 2022. These initiatives represent over 600 talent places annually and are split between different genres with a wide geographic spread.
• The company’s efforts have led to the creation of an extensive network of contributors, project owners, mentors and talents and have facilitated the exchange of experiences and transfer of skills between disciplines, genres and initiatives. The initiatives engaged over 250 mentors in 2019.
• Over 500 seminars, workshops and master classes were arranged, 13 of which were organised by Talent Norge. The meetings organised by the company are open for all initiatives and contributors, and some are also open to the industry and cultural sector in general.
StrategyThe company’s principal objective is to improve the framework for talent development and contribute to a richer cultural life. The company strives to establish successful, permanent relations both artistically and financially through investments in talented artists that lead to a high level of artistic recognition and trigger substantial private investment. Talent Norge works with leading organisations, institutions and communities within the Norwegian cultural sector to offer talented artists specialist expertise, development opportunities and support. The company aims to generate at least as much private capital as public support in the project portfolio. The company prioritises initiatives aimed at talented artists who are either just about to complete their higher arts education or have recently graduated.
Responsible business conductThe board has established publicly available ethical guidelines for employees and people affiliated with the organisation. The company is a member of Balansekunst (Balanced Art) which works for an equal and diverse cultural sector. Talent Norge works to give all talented artists equal opportuni
Statement of comprehensive income (NOK millions)
2019 2018
Operating revenues 68 62
Operating result (EBIT) 1 0.4
Result before tax and minority interests 1.6 0.8
Tax charge 0 0
- Minority interests 0 0
Result after tax and minority interests 1.6 0.8
Balance sheet
Total assets 85.6 80.9
- Of which cash reserves 77
Total equity 7.8 6.2
- Of which minority interests 0 0
Total debt and liabilities 77.8 74.7
Public procurements/grants
Procurements 0 0
Grants: Ministry of Culture 36.8 38.9
Assets and dividend
Dividend for the financial year 0 0
Dividend share 0% 0%
Average dividend percentage in the past five years
0% 0%
Dividend to the State 0 0
Repayment of capital 0 0
Capital contributions from the State 0 0
Key figures
Capital employed 7.8 6.2
Operating margin (EBIT margin) 1% 1%
Equity ratio 9% 8%
Investments 0 0
Other key figures
Number of employees 4 3
Percentage employees in Norway 100% 100%
Talent Norge AS
ties to realise their full potential. A separate initiative for talented young females linked to the company’s other initiatives has the aim of changing the structures that maintain an unequal gender balance.
111CATEGORY 3

Photo: Bengt Wanselius
Website: www.trondelag teater.no
Board of Directors: Terje Roll Danielsen (chair), Tore Onshuus Sandvik (vice chair), Leif Bjerkan, Solvor Ingjerd Amdal, Turid Stenseth, Ingeborg Hopshaug*, Hallbjørn Rønning* * elected by the employees
State ownership: 66.67% Ministry of CultureTheatre Director: Elisabeth Egseth HansenAuditor: PwC AS
State ownership The State’s rationale for ownership in Trøndelag Teater AS is to help ensure that everyone has access to highquality art and culture and to promote artistic development and renewal. The State's goal as owner is a high level of artistic quality to a wide audience.
Attainment of the State’s goal2019 was a year of highquality artistic performances. The repertoire consisted of both crowd favourites and controversial productions, plays specifically for children and young people, new Norwegian dramas, classic plays and contemporary dramas. Total audience numbers were 93,764, compared with 82,382 in 2018. A total of 481 performances were staged in 2019, compared with 429 in 2018. The programming model was switched to repertoire productions and this resulted in benefits in the form of more options for audiences and more tickets sold per performance. The theatre also focussed in 2019 on efficiently utilising fixed costs to channel as much of the resources as possible into more artistic production.
About the companyTrøndelag Teater is a regional theatre that engages in theatre activities in Trondheim and the surrounding region, including tours/guest performances. The theatre was established in 1937 and the State became a partowner in 1972. Trøndelag Teater is located in Trondheim.
Important events in 2019• 2019 was Elisabeth Egseth Hansen's first year as
theatre director at Trøndelag Teater.
• The theatre’s foyer areas were converted to provide space and opportunities to expand on artistic services to the public.
StrategyTrøndelag Teater’s objective is to create relevant, challenging and innovative performing arts of a high quality. We aim to accomplish this in collaboration with the best national and international artistic resources. We will work sustainably by utilising the viewership potential of the productions over time and thereby ensure that the repertoire is accessible to a wider audience. We will strengthen and promote the theatre as the meeting place that it is, with a particular focus on a broad and diverse audience.
Responsible business conductAmong other things, Trøndelag Teater’s internal guidelines cover employee rights, climate and the environment. These guidelines are used as a basis for our productions and for raising awareness among employees and suppliers in connection with the labour we use and the procurement of materials and services.
Statement of comprehensive income (NOK millions)
2019 2018
Operating revenues 136 124
Operating result (EBIT) 0.1 3.8
Result before tax and minority interests 0.5 2.7
Tax charge 0 0
- Minority interests 0 0
Result after tax and minority interests 0.5 2.7
Balance sheet
Total assets 43.1 44.8
- Of which cash reserves 2.5 13.1
Total equity 12.6 12.1
- Of which minority interests 0 0
Total debt and liabilities 30.5 32.6
Public procurements/grants
Procurements 0 0
Grants: Ministry of Culture 74.1 72.4
Grants: Trøndelag County Council, Trondheim Municipality
31.8 31.1
Assets and dividend
Dividend for the financial year 0 0
Dividend share 0% 0%
Average dividend percentage in the past five years
0% 0%
Dividend to the State 0 0
Repayment of capital 0 0
Capital contributions from the State 0 0
Key figures
Capital employed 12.6 12.1
Operating margin (EBIT margin) 0% 3%
Equity ratio 29% 27%
Investments 7.3 8.6
Other key figures
Number of employees 170 168
Percentage employees in Norway 100% 100%
52% 50%48% 50%Company Management group
Gender balance 2019
Trøndelag Teater AS
112 CATEGORY 3

Photo: Janne SøreideCEO:Jøran MoenAuditor: PwC ASWebsite: www.unis.no
Board:Morten Hald (chair) Nina Frisak (vice chair) Arild Olsen Øyvind W. Gregersen Robert Bjerknes Kristin VinjeSiri Kalvig Malte Jochmann* Petter Wangberg Sele*
Pernille Bronken Eidesen* Lidia Luque Fernandez** * elected by the employees ** student elected board membersState ownership: 100% Ministry of Education and Research
State ownershipThe State's rationale for ownership in Universitetssenteret på Svalbard AS (UNIS) is that the institution is a key instrument in Svalbard policy, and that the company is the Government's institution for university studies and research in Svalbard. The State's objective as an owner is that there is a unique institution for higher education and research in Svalbard, with a highquality curriculum and research activities that are based on the natural advantages provided by Svalbard’s location in the High Arctic.
Attainment of the State’s goalUNIS offers study programmes and conducts research of a high international quality based on Svalbard's geographical location. UNIS focusses on Arctic biology, Arctic geophysics, Arctic technology and Arctic geology. The study programmes are intended to supplement the education offered at the mainland universities and be part of an ordinary degree course at bachelor, master and PhD level. The study programmes offered must have an international profile and teaching must be in English. There must be a balance between Norwegian and international students. Students from 43 nations produced 213 student years in 2019. Half of the students came from study programmes at Norwegian universities and 32 per cent were Norwegian citizens. The results from the final assessments were good and the proportion of students who did not pass was only 1%. During 2019, UNIS received financing for several new major research projects.
About the company UNIS offers courses and conducts research based on Svalbard’s geographic location in the High Arctic and the special advantages associated with using nature as a laboratory. The study programme is intended to supplement the education offered at universities on the mainland and to be part of an ordinary degree course. The fields of study at UNIS are Arctic biology, Arctic geology, Arctic geophysics and Arctic technology. The company was established in 2002 and replaced the former foundation, University Courses in Svalbard, established by the four Norwegian universities in 1994. UNIS’ head office is in Longyearbyen.
Important events in 2019• The commencement of major new international
research projects that will contribute to strengthening Norway as a polar research nation.
• iEarth, which is a national consortium for developing geoscientific education in Norway, was awarded the status as a Centre for Excellence in Education. UNIS participates in the consortium together with the universities of Oslo, Bergen and Tromsø.
• Sustainable Arctic Marine and Coastal Technology, which facilitated continued work on developing robust technology for industry operating in the Artic, was concluded following the end of the project period.
• During 2019, UNIS further developed the work on collecting snow data used for preparing local avalanche warnings for Longyeardalen and Nordenskiöldland.
StrategyBased on a high level of expertise in research and higher education in science and technology in the Arctic, UNIS will contribute to understanding the impact of climate change on the environment and society. UNIS will contribute to innovative solutions to achieve the United Nations Sustainable Development Goals.
Responsible business conductHealth, safety and the environment (HSE) have a high priority and the safety of students, staff and visitors is important for being able to conduct all of UNIS activities. The company is particularly committed to fieldwork and expeditions in Arctic areas. UNIS’ location in the High Arctic, an area facing the unpredictable effects of climate change, represents special challenges for HSE work. It is particularly important to proactively ensure safe and nonintrusive travel for students and staff through the Svalbard nature. Quality assurance of the planning and implementation of fieldbased projects takes place in a structured manner and with strict requirements for work procedures and methods. Work at UNIS' laboratories is quality assured in accordance with the same principles for work in the field.
Statement of comprehensive income (NOK millions)
2019 2018
Operating revenues 166 150
Operating result (EBIT) 10.9 4.1
Result before tax and minority interests 11.4 4.4
Tax charge 0 0
- Minority interests 0 0
Result after tax and minority interests 0 4.4
Balance sheet
Total assets 128 95.1
- Of which cash reserves 44.4 42.4
Total equity 27.1 15.7
- Of which minority interests 0 0
Total debt and liabilities 100.9 79.4
Public procurements/grants
Procurements 0 0
Grants: Ministry of Education and Research
136 132
Assets and dividend
Dividend for the financial year 0 0
Dividend share 0% 0%
Average dividend percentage in the past five years
0% 0%
Dividend to the State 0 0
Repayment of capital 0 0
Capital contributions from the State 0 0
Key figures
Capital employed 39.8 30.3
Operating margin (EBIT margin) 7% 3%
Equity ratio 21% 17%
Investments 0 0
Other key figures
Number of employees 103 107
Percentage employees in Norway 100% 100%
50% 38%50% 62%Company Management group
Gender balance 2019
Universitetssenteret på Svalbard AS
113CATEGORY 3

Photo: Jarle Hagen
Auditor: PricewaterhouseCoopers ASWebsite: www.vinmonopolet.no
Board of Directors: Ellen Seip (chair) Sverre Helno (vice chair) Per Arne Olsen Trine Stensen Solveig Løhaugen Lars Jacob Tynes Pedersen Helge Storvik* Turid Sundsetvik*
Svend Bang Pedersen* * elected by the employeesState ownership: 100% Ministry of Health and Care ServicesCEO:Elisabeth Hunter
State ownership The State’s rationale for ownership in Vinmonopolet is to ensure the absence of private commercial interests that motivate the sale of alcoholic beverages of more than 4.7 per cent by volume and contribute to controlled forms of trade. The State’s goal as owner is to ensure that sales of alcoholic beverages of more than 4.7 per cent by volume take place in a controlled manner, so as to limit the harmful effects of alcohol for individuals and for society.
Attainment of the State’s goalIn 2019, the company achieved 95.7 per cent of the company’s public policy goals, i.e. the result of age verification checks in stores. The average achievement of the company's public policy goals in the past five years has been 94.2 per cent.
About the company Vinmonopolet has the exclusive right to sell products containing more than 4.7 per cent alcohol by volume to consumers. The company is one of the most important instruments in Norway’s alcohol policy and contributes to limiting alcohol consumption within society by regulating availability. The alcohol policy is expressed through effective social control, measures to create positive attitudes, and the absence of promotional activities. The company was established in 1922 and the State became the owner in the 1930s. Vinmonopolet's head office is situated in Oslo.
Important events in 2019• Vinmonopolet established a comprehensive
sustainability strategy for alcohol and health, climate and the environment and social conditions in its own organisation and value chain.
• Carried out an awareness campaign for responsible alcohol consumption and caring advice aimed at students.
• No. 1 position in Kantar TNS’ reputation survey and winner of the Federation of Norwegian Enterprise’s (Virke) trade prize and KPMG’s Customer Experience Excellence 2019.
StrategyAmong other things, Vinmonopolet aims to limit the consumption of alcohol through responsible sales. This societal mission is an important part of Vinmonopolet’s new sustainability strategy. The goal is for at least 90 per cent of mystery shoppers aged between 18 and 25 to be asked to present identification.
Responsible business conductVinmonopolet has established a comprehensive sustainability strategy that is based on three issues: alcohol and health, climate and the environment and social conditions in own organisation and in the value chain. The strategy is based on Vinmonopolet's corporate strategy. United Nations Sustainable Development Goal no. 3 “Good health and wellbeing” and target 3.5 “to strengthen the prevention of harmful use of alcohol”, link the company’s sustainability strategy to its societal mission.
Statement of comprehensive income (NOK millions)
2019 2018
Operating revenues 14,321 13,883
Operating result (EBIT) 578 151
Result before tax and minority interests 601 168
Tax charge 132 37.7
- Minority interests 0 0
Result after tax and minority interests 469 130
Balance sheet
Total assets 3,513 3,629
- Of which cash reserves 1,726 1,809
Total equity 944 719
- Of which minority interests 0 0
Total debt and liabilities 2,568 2,911
Public procurements/grants
Procurements 0 0
Grants 0 0
Assets and dividend
Dividend for the financial year 234 65.2
Dividend percentage 50% 50%
Average dividend percentage in the past five years
50% 50%
Dividend to the State 234 65.2
Repayment of capital 0 0
Capital contributions from the State 0 0
Key figures
Capital employed 944 719
Operating margin (EBIT margin) 4% 1%
Equity ratio 27% 20%
Investments 0 0
Other key figures
Number of employees 1,862 1,847
Percentage employees in Norway 100% 100%
66% 29%34% 71%Company Management group
Gender balance 2019
Vinmonopolet AS
114 CATEGORY 3

Photo: Terje Borud
115CATEGORY 3
Four of the companies in the State's portfolio are not categorised.
Companies that are not categorised
Filmparken AS 118Folketrygdfondet 119Rosenkrantzgate 10 AS 119Rygge 1 AS 119

Statskog Photo: Gjøran Stenberg
117

Board of Directors: Tone Bjørnov (Chair) Nils Arnljot Dugstad, Tor Olav MørsethState ownership: 77.6% Ministry of Culture
CEO: Carina Esther Brattvik Auditor: Baker Tilly Grimsrud & Co. ANSWebsite: filmparken.no
StrategyFilmparken shall be an important resource and a preferred choice for the production of Norwegian film. The facilities shall be upgraded. Occupancy for the lease of the studios shall be increased and strategic initiatives implemented by tenants in leased offices consisting of tenants affiliated with the film, TV and music industries. In this way, Filmparken has the objective of building a strong specialist community in Jar that can enhance Norwegian motion picture production.
Filmparken has a particular focus on greener film and TV production. We can offer local services, facilities and, not least, recycling.
State ownership In the national budget for 2014, the Storting authorised the State to sell Filmparken AS. The reason given was that the facilities in Jar were not used to produce feature films and thus no longer supported cultural policy considerations. This authorisation was renewed every year until the national budget for 2019 when the Storting agreed to postpone the sale of Filmparken. The reason for this decision was a change in the market for film studios, with an increased demand for new Norwegian drama series. The Government is working on plans to develop the company in light of this market situation.
About the company The company offers facilities for recording films, including studios and offices, in Jar in Bærum. The State has been involved in film production and studio operations in Jar since 1948. Filmparken’s head office is in Jar in Bærum Municipality.
Important events in 2019• Management was strengthened with Carine
Brattvik being appointed as general manager of Filmparken.
• Merger of the parent company Filmparken with the whollyowned subsidiary Norsk Film Kostyme.
• New strategy for Filmparken prepared and new action plan implemented.
Statement of comprehensive income (NOK millions)
2019 2018
Operating revenues 15 11
Operating result (EBIT) 1 3
Result before tax and minority interests 1 3
Tax charge 0 0
- Minority interests 0 0
Result after tax and minority interests 1 3
Balance sheet
Total assets 48 48
- Of which cash reserves 0 0
Total equity 26 26
- Of which minority interests 0 0
Total debt and liabilities 21 23
Public procurements/grants
Procurements 0 0
Grants 0 0
Assets and dividend
Dividend for the financial year 0 0
Dividend share 0% 0%
Average dividend percentage in the past five years
0% 0%
Dividend to the State 0 0
Repayment of capital 0 0
Capital contributions from the State 0 0
Key figures
Capital employed 45 48
Operating margin (EBIT margin) 7% 27%
Equity ratio 55% 53%
Investments 0 0
Other key figures
Number of employees 9 4
Percentage employees in Norway 100% 100%
72% 100%28% 0%Company Management group
Gender balance 2019
Photo: Vidar Skauen
Filmparken AS
118 Other companies

Rosenkrantzgate 10 ASRosenkrantzgate 10 AS is a property company whose only asset is the property with the address Rosenkrantzgate 10 in Oslo. The company’s activities involve leasing premises in this property. The building houses Oslo Nye Teater, which has a preferential right to lease premises in the building. The State owns 3.07 per cent of the company. The City of Oslo owns 78.89% of the shares, 16.69% of the shares are in unknown ownership, and the remainder are owned by Oslo Nye Teater and private individuals. The State’s holding is the result of a previous engagement/ownership in Oslo Nye Teater, which is now wholly owned by the City of Oslo. The State no longer has any rationale for ownership in the company. The sale of the shares has been difficult in light of there being unknown shareholders in the company. In 2017, the shares of the unknown owner were deposited with Norges Bank for 20 years. During this period, these shares can be released to shareholders who can prove that they are the owners. The company can claim ownership of the shares at the end of the deposit period.
Rygge 1 ASThe company establishes and owns infrastructure (test cell) at Rygge Air Base used for post maintenance testing of engine components for F35 fighter jets. The test cell is an important part of the engine depot for the maintenance of these engines, and is leased to Kongsberg Aviation Maintenance Services AS, formerly Aerospace Industrial Maintenance Norway AS (AIM Norway), which is responsible for the engine depot and uses the test cell in its maintenance production. Rygge 1 was previously a subsidiary of AIM Norway. The State took over ownership through a distribution of all of the shares in Rygge 1 as a dividend in kind in 2019 prior to the completion of the sale of the shares in AIM Norway to Kongsberg Defence & Aerospace AS. The State is the sole shareholder. The State’s goal as owner of Rygge 1 is to contribute to enabling the establishment of an engine depot in Norway. Once the test cell has been completed and put into operation, an assessment will be made as to whether the company shall be dissolved and the test cell placed under the portfolio of the Norwegian Defence Estates Agency.
Fol ke trygd fon det Folketrygdfondet manages the Government Pension Fund Norway (GPFN) in accordance with a mandate stipulated by the Ministry of Finance. The GPFN invests in listed shares and bonds in Norway, Sweden, Denmark and Finland. At yearend 2019, the market value of the GPFN was close to NOK 269 billion. The return is added to the GPFN on an ongoing basis. Folketrygdfondet has around 50 employees and is located in Oslo. The Ministry of Finance presents annual reports to the Storting regarding the company and its management of the GPFN. Folketrygdfondet also manages the Government Bond Fund. The fund has a framework of up to NOK 50 billion. Its purpose is to contribute increased liquidity and capital to the credit bond market. The Bond Fund invests in the primary and secondary markets for interestbearing instruments issued by Norwegian companies. The Bond Fund was established on 27 March 2020 to comply with the infection control measures necessitated by the Corona virus. The Fund will remain for a few more years into the future, depending on market developments. Folketrygdfondet shall endeavour to achieve the highest possible return over time for both funds when measured in Norwegian kroner and after costs.
Photo: Rygge 1 ASPhoto: Ingrid Moe Photo: Oslo Nye Teater
Folketrygdfondet Rosenkrantzgate 10 AS Rygge 1 AS
119Other companies

Appendices
The companies’ reporting on the State’s expectations 122The companies' reporting standards and sustainability guidelines 128Remuneration to the board and auditors for 2019 132Remuneration to the CEO for 2019 134Gender balance on the board and in management 136Ownerappointed and shareholderelected board members 142

Powerhouse Brattørkaia Trondheim
. Photo: Entra
121

The companies’ reporting on the State’s expectations
By defining clear expectations of the companies through the white paper on ownership policy, the State wishes to contribute to attaining the State’s goal as an owner in a sustainable and responsible way. The State’s expectations are addressed to the companies’ boards. Some of these expectations include an expectation that the company will submit reports.

Talent Norge AS D
irigentløftet (Conductors Programm
e) Photo: Terje Trobe
123

Companies' feedback on reporting to the public in certain areas where the State has expectations
Clear goals and
strategies for the company
The company's selected risk level
Goals and measures for increasing relevant
diversity, including better gender balance
at the company
The company's view on the appropriate capital
structure and dividend level
The structure, level and development of
remuneration to senior executives
A justified tax policy
How the company identifies and manages any adverse impact to people, society and the
environment
Material areas, goals and measures within
the company’s work on responsible business
conduct.
The most important key performance indicators
Consolidated report for the company’s
corporate governance in accordance with
NUES.
Listed companies
DNB ASA Fully Fully Fully Fully Fully Fully Fully Fully Fully FullyEntra ASA Fully Fully Fully Fully Fully Fully Fully Fully FullyEquinor ASA Fully Fully Fully Fully Fully Fully Fully Fully Fully FullyKongsberg Gruppen ASA Fully Fully Fully Fully Fully Fully Fully Fully Fully FullyNorsk Hydro ASA Fully Fully To some extent Fully Fully Fully Fully Fully Fully FullyTelenor ASA Fully Fully Fully Fully Fully Fully Fully Fully Fully FullyYara International ASA Fully Fully Fully Fully Fully Fully Fully Fully Fully Fully
Non-listed companies in Categories 1–2
Ambita AS Fully To some extent Fully Fully Fully Fully Fully Fully Fully FullyArgentum Fondsinvesteringer AS Fully Not reported Fully To some extent Fully Fully To some extent Fully Fully FullyBaneservice AS To some extent Not reported To some extent Not reported Fully Not reported To some extent Fully To some extent FullyEksportfinans ASA Fully Fully Not reported Fully Fully Not reported Fully Fully Not reported FullyElectronic Chart Centre AS To some extent Fully Fully Fully Fully Not reported Not reported To some extent To some extent FullyFlytoget AS Fully To some extent Fully Fully Fully Fully Fully Fully Fully FullyInvestinor AS To some extent To some extent Fully Fully Fully Fully Fully Fully Not reported FullyKommunalbanken AS Fully Fully Fully Fully Fully Not reported To some extent Fully To some extent FullyMantena AS To some extent To some extent To some extent Fully Fully Fully Fully To some extent To some extent FullyMesta AS Fully Fully Fully To some extent To some extent To some extent Fully Fully Fully FullyNammo AS To some extent To some extent To some extent Not reported Fully Not reported Fully Fully To some extent Not reportedNysnø Klimainvesteringer AS Fully To some extent To some extent Fully Fully Fully Fully Fully Not reported FullyPosten Norge AS To some extent To some extent Fully Fully Fully Not reported Fully Fully Fully FullyStatkraft SF Fully To some extent Fully To some extent Fully Fully Fully Fully Fully FullyVYgruppen AS Fully Not reported Fully Not reported Fully Not reported Fully Fully Fully Fully
Companies in Category 3
Andøya Space Center AS To some extent To some extent Not reported Not reported Not reported Not reported To some extent To some extent Not reported To some extent Avinor AS Fully Fully Fully Fully Fully Fully Fully Fully Fully FullyBane NOR SF Fully To some extent To some extent Not reported Fully Not reported Fully Fully To some extent FullyBjørnøen AS Fully Fully Not reported Not reported Not reported Not reported Fully Fully Fully Not reportedCarte Blanche AS Fully Not reported Fully Not reported Fully Not reported To some extent To some extent Fully Not reportedAS Den Nationale Scene Fully Fully Fully Not reported Fully Not reported Fully Fully Fully Not reportedDen Norske Opera & Ballett AS Fully To some extent Fully Not reported Fully Not reported Fully To some extent To some extent Not reportedEksportkreditt Norge AS Not reported Not reported Not reported Not reported Not reported Not reported Not reported Not reported Not reported Not reported
Enova SF Fully Fully To some extent Not reported Fully Not reported To some extent Fully Fully Not reported
Entur AS To some extent To some extent Fully To some extent Fully To some extent Fully Fully To some extent Fully
As an owner, the State has expectations for how the companies work in a number of areas. See the chapter concerning how the State exercises its ownership.
The companies respond Fully / To some extent / Not reported
Appendices124

Clear goals and
strategies for the company
The company's selected risk level
Goals and measures for increasing relevant
diversity, including better gender balance
at the company
The company's view on the appropriate capital
structure and dividend level
The structure, level and development of
remuneration to senior executives
A justified tax policy
How the company identifies and manages any adverse impact to people, society and the
environment
Material areas, goals and measures within
the company’s work on responsible business
conduct.
The most important key performance indicators
Consolidated report for the company’s
corporate governance in accordance with
NUES.
Listed companies
DNB ASA Fully Fully Fully Fully Fully Fully Fully Fully Fully FullyEntra ASA Fully Fully Fully Fully Fully Fully Fully Fully FullyEquinor ASA Fully Fully Fully Fully Fully Fully Fully Fully Fully FullyKongsberg Gruppen ASA Fully Fully Fully Fully Fully Fully Fully Fully Fully FullyNorsk Hydro ASA Fully Fully To some extent Fully Fully Fully Fully Fully Fully FullyTelenor ASA Fully Fully Fully Fully Fully Fully Fully Fully Fully FullyYara International ASA Fully Fully Fully Fully Fully Fully Fully Fully Fully Fully
Non-listed companies in Categories 1–2
Ambita AS Fully To some extent Fully Fully Fully Fully Fully Fully Fully FullyArgentum Fondsinvesteringer AS Fully Not reported Fully To some extent Fully Fully To some extent Fully Fully FullyBaneservice AS To some extent Not reported To some extent Not reported Fully Not reported To some extent Fully To some extent FullyEksportfinans ASA Fully Fully Not reported Fully Fully Not reported Fully Fully Not reported FullyElectronic Chart Centre AS To some extent Fully Fully Fully Fully Not reported Not reported To some extent To some extent FullyFlytoget AS Fully To some extent Fully Fully Fully Fully Fully Fully Fully FullyInvestinor AS To some extent To some extent Fully Fully Fully Fully Fully Fully Not reported FullyKommunalbanken AS Fully Fully Fully Fully Fully Not reported To some extent Fully To some extent FullyMantena AS To some extent To some extent To some extent Fully Fully Fully Fully To some extent To some extent FullyMesta AS Fully Fully Fully To some extent To some extent To some extent Fully Fully Fully FullyNammo AS To some extent To some extent To some extent Not reported Fully Not reported Fully Fully To some extent Not reportedNysnø Klimainvesteringer AS Fully To some extent To some extent Fully Fully Fully Fully Fully Not reported FullyPosten Norge AS To some extent To some extent Fully Fully Fully Not reported Fully Fully Fully FullyStatkraft SF Fully To some extent Fully To some extent Fully Fully Fully Fully Fully FullyVYgruppen AS Fully Not reported Fully Not reported Fully Not reported Fully Fully Fully Fully
Companies in Category 3
Andøya Space Center AS To some extent To some extent Not reported Not reported Not reported Not reported To some extent To some extent Not reported To some extent Avinor AS Fully Fully Fully Fully Fully Fully Fully Fully Fully FullyBane NOR SF Fully To some extent To some extent Not reported Fully Not reported Fully Fully To some extent FullyBjørnøen AS Fully Fully Not reported Not reported Not reported Not reported Fully Fully Fully Not reportedCarte Blanche AS Fully Not reported Fully Not reported Fully Not reported To some extent To some extent Fully Not reportedAS Den Nationale Scene Fully Fully Fully Not reported Fully Not reported Fully Fully Fully Not reportedDen Norske Opera & Ballett AS Fully To some extent Fully Not reported Fully Not reported Fully To some extent To some extent Not reportedEksportkreditt Norge AS Not reported Not reported Not reported Not reported Not reported Not reported Not reported Not reported Not reported Not reported
Enova SF Fully Fully To some extent Not reported Fully Not reported To some extent Fully Fully Not reported
Entur AS To some extent To some extent Fully To some extent Fully To some extent Fully Fully To some extent Fully
Appendices 125
THE STATEOWNERSHIP
REPORT2019
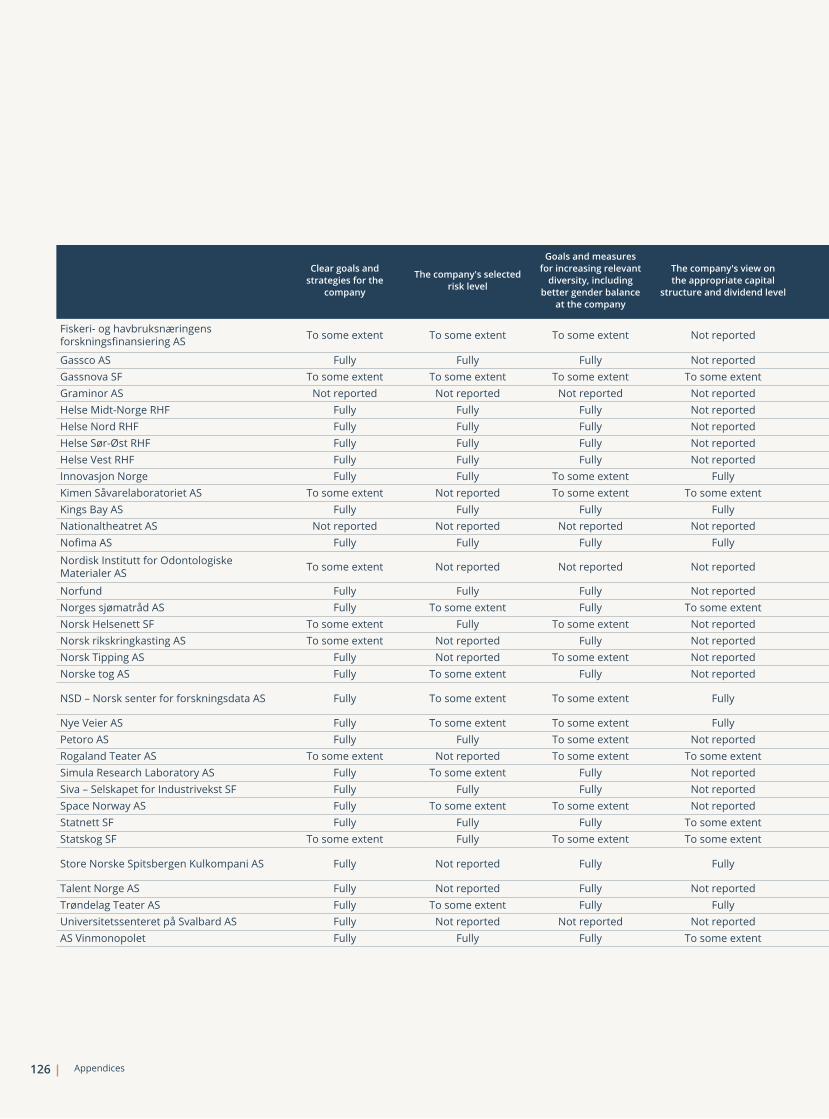
Clear goals and
strategies for the company
The company's selected risk level
Goals and measures for increasing relevant
diversity, including better gender balance
at the company
The company's view on the appropriate capital
structure and dividend level
The structure, level and development of
remuneration to senior executives
A justified tax policy
How the company identifies and manages any adverse impact to people, society and the
environment
Material areas, goals and measures within
the company’s work on responsible business
conduct.
The most important key performance indicators
Consolidated report for the company’s
corporate governance in accordance with
NUES.
Fiskeri og havbruksnæringens forskningsfinansiering AS To some extent To some extent To some extent Not reported Fully Not reported To some extent To some extent To some extent To some extent
Gassco AS Fully Fully Fully Not reported Fully Fully Fully Fully Fully FullyGassnova SF To some extent To some extent To some extent To some extent To some extent To some extent To some extent To some extent To some extent To some extent Graminor AS Not reported Not reported Not reported Not reported Not reported Not reported Not reported Not reported Not reported Not reportedHelse MidtNorge RHF Fully Fully Fully Not reported Fully Not reported Fully Fully Fully FullyHelse Nord RHF Fully Fully Fully Not reported Fully Not reported Fully Fully Fully FullyHelse SørØst RHF Fully Fully Fully Not reported Fully Not reported Fully Fully Fully FullyHelse Vest RHF Fully Fully Fully Not reported Fully Not reported Fully Fully Fully FullyInnovasjon Norge Fully Fully To some extent Fully Fully Not reported Fully To some extent Fully FullyKimen Såvarelaboratoriet AS To some extent Not reported To some extent To some extent To some extent Not reported To some extent To some extent Fully To some extent Kings Bay AS Fully Fully Fully Fully Fully Not reported Fully Fully To some extent Not reportedNationaltheatret AS Not reported Not reported Not reported Not reported Not reported Not reported Not reported Not reported Not reported Not reportedNofima AS Fully Fully Fully Fully Fully Fully Fully Fully Fully Fully
Nordisk Institutt for Odontologiske Materialer AS To some extent Not reported Not reported Not reported Not reported Not reported Not reported Not reported Not reported Not reported
Norfund Fully Fully Fully Not reported Fully Fully Fully Fully Fully To some extentNorges sjømatråd AS Fully To some extent Fully To some extent Fully Not reported Fully Fully Fully To some extentNorsk Helsenett SF To some extent Fully To some extent Not reported Fully Not reported To some extent To some extent To some extent Not reportedNorsk rikskringkasting AS To some extent Not reported Fully Not reported Not reported Not reported To some extent To some extent To some extent Not reportedNorsk Tipping AS Fully Not reported To some extent Not reported Fully Not reported Fully To some extent Fully FullyNorske tog AS Fully To some extent Fully Not reported Fully Fully To some extent To some extent Fully Fully
NSD – Norsk senter for forskningsdata AS Fully To some extent To some extent Fully Fully Not reported To some extent To some extent To some extent Not reported
Nye Veier AS Fully To some extent To some extent Fully Fully Fully Fully Fully Fully FullyPetoro AS Fully Fully To some extent Not reported Fully Not reported Fully Fully Fully To some extentRogaland Teater AS To some extent Not reported To some extent To some extent Fully Not reported To some extent To some extent To some extent Not reportedSimula Research Laboratory AS Fully To some extent Fully Not reported To some extent Not reported Not reported Not reported Fully Not reportedSiva – Selskapet for Industrivekst SF Fully Fully Fully Not reported Fully Not reported Fully Fully Fully To some extentSpace Norway AS Fully To some extent To some extent Not reported Fully Fully To some extent To some extent To some extent To some extentStatnett SF Fully Fully Fully To some extent Fully To some extent Fully Fully Fully FullyStatskog SF To some extent Fully To some extent To some extent Fully Fully To some extent To some extent To some extent Fully
Store Norske Spitsbergen Kulkompani AS Fully Not reported Fully Fully Fully Not reported Fully Fully Fully Fully
Talent Norge AS Fully Not reported Fully Not reported Not reported Not reported To some extent To some extent Fully To some extentTrøndelag Teater AS Fully To some extent Fully Fully Fully Not reported Fully Fully Fully To some extentUniversitetssenteret på Svalbard AS Fully Not reported Not reported Not reported To some extent Not reported To some extent Not reported Not reported Not reportedAS Vinmonopolet Fully Fully Fully To some extent Fully To some extent Fully Fully Fully Fully
Appendices126

Clear goals and
strategies for the company
The company's selected risk level
Goals and measures for increasing relevant
diversity, including better gender balance
at the company
The company's view on the appropriate capital
structure and dividend level
The structure, level and development of
remuneration to senior executives
A justified tax policy
How the company identifies and manages any adverse impact to people, society and the
environment
Material areas, goals and measures within
the company’s work on responsible business
conduct.
The most important key performance indicators
Consolidated report for the company’s
corporate governance in accordance with
NUES.
Fiskeri og havbruksnæringens forskningsfinansiering AS To some extent To some extent To some extent Not reported Fully Not reported To some extent To some extent To some extent To some extent
Gassco AS Fully Fully Fully Not reported Fully Fully Fully Fully Fully FullyGassnova SF To some extent To some extent To some extent To some extent To some extent To some extent To some extent To some extent To some extent To some extent Graminor AS Not reported Not reported Not reported Not reported Not reported Not reported Not reported Not reported Not reported Not reportedHelse MidtNorge RHF Fully Fully Fully Not reported Fully Not reported Fully Fully Fully FullyHelse Nord RHF Fully Fully Fully Not reported Fully Not reported Fully Fully Fully FullyHelse SørØst RHF Fully Fully Fully Not reported Fully Not reported Fully Fully Fully FullyHelse Vest RHF Fully Fully Fully Not reported Fully Not reported Fully Fully Fully FullyInnovasjon Norge Fully Fully To some extent Fully Fully Not reported Fully To some extent Fully FullyKimen Såvarelaboratoriet AS To some extent Not reported To some extent To some extent To some extent Not reported To some extent To some extent Fully To some extent Kings Bay AS Fully Fully Fully Fully Fully Not reported Fully Fully To some extent Not reportedNationaltheatret AS Not reported Not reported Not reported Not reported Not reported Not reported Not reported Not reported Not reported Not reportedNofima AS Fully Fully Fully Fully Fully Fully Fully Fully Fully Fully
Nordisk Institutt for Odontologiske Materialer AS To some extent Not reported Not reported Not reported Not reported Not reported Not reported Not reported Not reported Not reported
Norfund Fully Fully Fully Not reported Fully Fully Fully Fully Fully To some extentNorges sjømatråd AS Fully To some extent Fully To some extent Fully Not reported Fully Fully Fully To some extentNorsk Helsenett SF To some extent Fully To some extent Not reported Fully Not reported To some extent To some extent To some extent Not reportedNorsk rikskringkasting AS To some extent Not reported Fully Not reported Not reported Not reported To some extent To some extent To some extent Not reportedNorsk Tipping AS Fully Not reported To some extent Not reported Fully Not reported Fully To some extent Fully FullyNorske tog AS Fully To some extent Fully Not reported Fully Fully To some extent To some extent Fully Fully
NSD – Norsk senter for forskningsdata AS Fully To some extent To some extent Fully Fully Not reported To some extent To some extent To some extent Not reported
Nye Veier AS Fully To some extent To some extent Fully Fully Fully Fully Fully Fully FullyPetoro AS Fully Fully To some extent Not reported Fully Not reported Fully Fully Fully To some extentRogaland Teater AS To some extent Not reported To some extent To some extent Fully Not reported To some extent To some extent To some extent Not reportedSimula Research Laboratory AS Fully To some extent Fully Not reported To some extent Not reported Not reported Not reported Fully Not reportedSiva – Selskapet for Industrivekst SF Fully Fully Fully Not reported Fully Not reported Fully Fully Fully To some extentSpace Norway AS Fully To some extent To some extent Not reported Fully Fully To some extent To some extent To some extent To some extentStatnett SF Fully Fully Fully To some extent Fully To some extent Fully Fully Fully FullyStatskog SF To some extent Fully To some extent To some extent Fully Fully To some extent To some extent To some extent Fully
Store Norske Spitsbergen Kulkompani AS Fully Not reported Fully Fully Fully Not reported Fully Fully Fully Fully
Talent Norge AS Fully Not reported Fully Not reported Not reported Not reported To some extent To some extent Fully To some extentTrøndelag Teater AS Fully To some extent Fully Fully Fully Not reported Fully Fully Fully To some extentUniversitetssenteret på Svalbard AS Fully Not reported Not reported Not reported To some extent Not reported To some extent Not reported Not reported Not reportedAS Vinmonopolet Fully Fully Fully To some extent Fully To some extent Fully Fully Fully Fully
Appendices 127
THE STATEOWNERSHIP
REPORT2019
The companies' reporting standards and sustainability guidelines
The State expects that companies with a state ownership interest are transparent about and report on material matters relating to the company’s operations. The table shows the reporting standards and external guidelines, principles and/or conventions that the companies have stipulated they follow in the field of sustainability. ISO standards, the Norwegian Code of Practice for Corporate Governance (NUES) and internal guidelines are not included in the table. Large companies also report in accordance with Section 33c of the Accounting Act.
128
Flytoget Photo: Øyvind H
aug
THE STATEOWNERSHIP
REPORT2019
129

Feedback from the companies regarding the reporting standards and guidelines they follow for sustainability and responsible business conduct.
Company Reporting standards, guidelines, principles
Listed companies
DNB ASA GRI Standards, Principles of Responsible Banking
Entra ASA GRI Standards, European Public Real Estate Association Sustainability Best Practices Recommendations on Sustainability Reporting (EPRA BPR), TCFD, United Nations Sustainable Development Goals.
Equinor ASA GRI Standards, UNGC, TCFDKongsberg Gruppen ASA GRI Standards, UNGC, Oslo Stock Exchange guidance on the reporting of corporate social
responsibility
Norsk Hydro ASA GRI Standards, UNGP, United Nations Sustainable Development Goals, TCFD, CDP, industry standards ICMM and ASI, Euronext's Guidelines for ESG Reporting and GHG Protocol
Telenor ASA EU NonFinancial Reporting Directive, OECD Guidelines for Multinational Enterprises, Global Network Initiative (GNI) Guiding Principles, GRI Standards, CDP, UNGP, United Nations Sustainable Development Goals, Oslo Stock Exchange guidance on the reporting of corporate social responsibility.
Yara International ASA GRI Standards, TCFD
Non-listed companies (Categories 1–2)
Ambita AS UNGC, OECD Guidelines for Multinational EnterprisesArgentum Fondsinvesteringer ASBaneservice ASEksportfinans ASA OECD Common Approaches on the Environment and Officially Supported Export Credits,
OECD Action Statement on Bribery and Officially Supported Export CreditsElectronic Chart Centre ASFlytoget AS GRI StandardsInvestinor AS PRI Kommunalbanken AS GRI Standards, TCFDMantena ASMesta AS Greenhouse Gas Protocol InitiativeNammo AS GRI Standards, UNGC, OECD Guidelines for Multinational Enterprises, Euronext ESG reporting
guidelines
Nysnø Klimainvesteringer AS PRIPosten Norge AS GRI Standards, United Nations Sustainable Development GoalsStatkraft SF GRI Standards, UNGP, IFC Performance Standards, UNGC, OECD Guidelines for Multinational
Enterprises
VYgruppen AS GRI Standards
Companies in Category 3
Andøya Space Center ASAvinor AS GRI Standards, UNGC, OECD Guidelines for Multinational EnterprisesBane NOR SF GRI Standards, UNGC, United Nations Sustainable Development Goals, OECD Guidelines for
Multinational EnterprisesBjørnøen ASCarte Blanche AS United Nations Sustainable Development Goals.
The table below shows the feedback from the companies regarding the reporting standards and guidelines they follow for sustainability and responsible business conduct. The request to the companies leaves room for different interpretations. This entails that the companies’ responses are not necessarily comparable because the companies may have different interpretations of the request. The overview must be read in light of this.
Abbreviations and explanations of the most commonly used standards and guidelines:
GRI Standards: Global Reporting Initiative Standards TCFD: Task Force on Climaterelated Financial Disclosures
UNGC: UN Global Compact UNGP: UN Guiding Principles on Business and Human Rights PRI: Principles for Responsible Investment
Corporate governance130
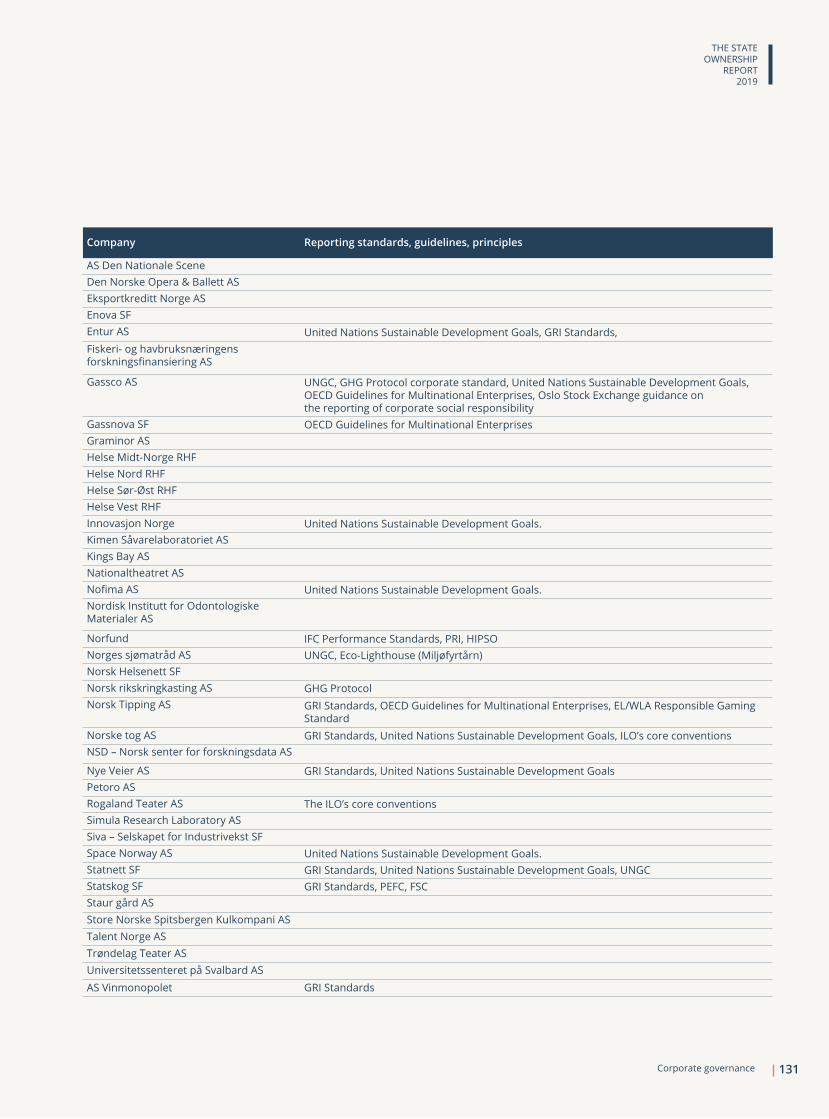
Company Reporting standards, guidelines, principles
AS Den Nationale SceneDen Norske Opera & Ballett ASEksportkreditt Norge ASEnova SFEntur AS United Nations Sustainable Development Goals, GRI Standards,Fiskeri og havbruksnæringens forskningsfinansiering AS
Gassco AS UNGC, GHG Protocol corporate standard, United Nations Sustainable Development Goals, OECD Guidelines for Multinational Enterprises, Oslo Stock Exchange guidance on the reporting of corporate social responsibility
Gassnova SF OECD Guidelines for Multinational EnterprisesGraminor ASHelse MidtNorge RHFHelse Nord RHFHelse SørØst RHFHelse Vest RHFInnovasjon Norge United Nations Sustainable Development Goals.Kimen Såvarelaboratoriet ASKings Bay ASNationaltheatret ASNofima AS United Nations Sustainable Development Goals.Nordisk Institutt for Odontologiske Materialer AS
Norfund IFC Performance Standards, PRI, HIPSONorges sjømatråd AS UNGC, EcoLighthouse (Miljøfyrtårn) Norsk Helsenett SFNorsk rikskringkasting AS GHG ProtocolNorsk Tipping AS GRI Standards, OECD Guidelines for Multinational Enterprises, EL/WLA Responsible Gaming
StandardNorske tog AS GRI Standards, United Nations Sustainable Development Goals, ILO’s core conventionsNSD – Norsk senter for forskningsdata AS
Nye Veier AS GRI Standards, United Nations Sustainable Development GoalsPetoro ASRogaland Teater AS The ILO’s core conventionsSimula Research Laboratory ASSiva – Selskapet for Industrivekst SFSpace Norway AS United Nations Sustainable Development Goals.Statnett SF GRI Standards, United Nations Sustainable Development Goals, UNGCStatskog SF GRI Standards, PEFC, FSCStaur gård ASStore Norske Spitsbergen Kulkompani ASTalent Norge ASTrøndelag Teater ASUniversitetssenteret på Svalbard ASAS Vinmonopolet GRI Standards
Corporate governance 131
THE STATEOWNERSHIP
REPORT2019
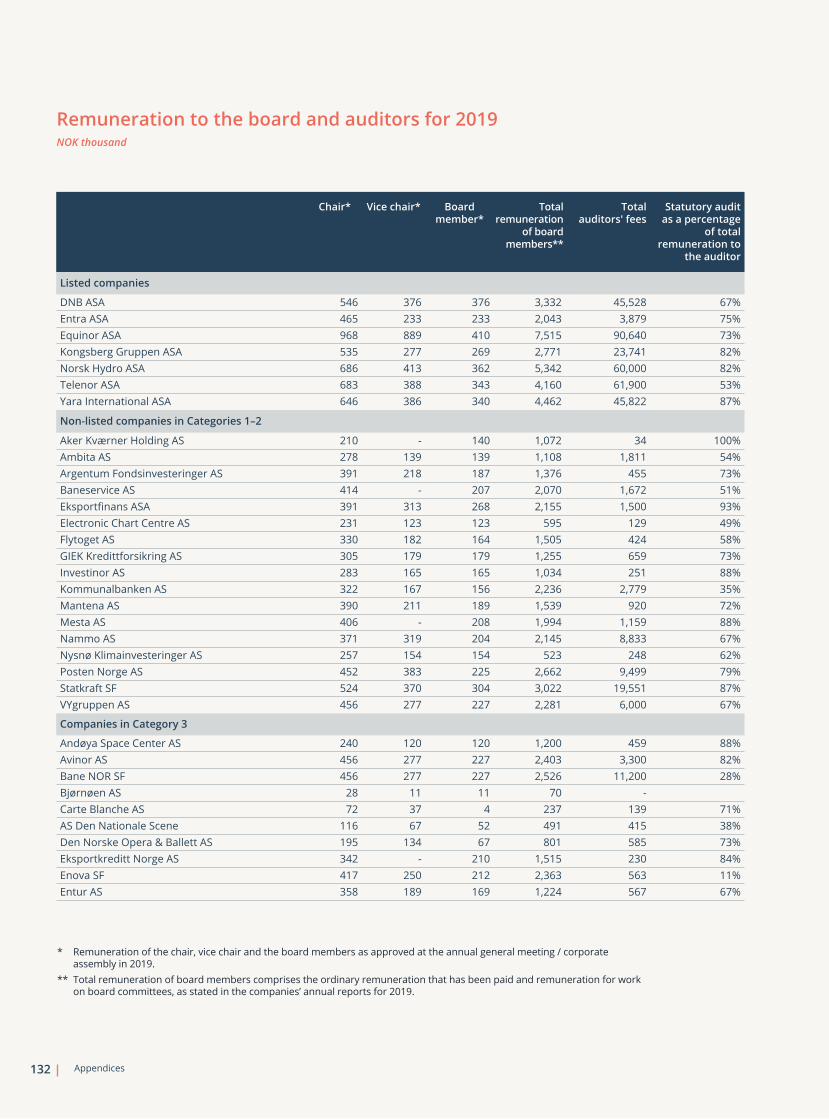
Remuneration to the board and auditors for 2019NOK thousand
Chair* Vice chair* Board member*
Total remuneration
of board members**
Total auditors' fees
Statutory audit as a percentage
of total remuneration to
the auditor
Listed companies
DNB ASA 546 376 376 3,332 45,528 67%Entra ASA 465 233 233 2,043 3,879 75%Equinor ASA 968 889 410 7,515 90,640 73%Kongsberg Gruppen ASA 535 277 269 2,771 23,741 82%Norsk Hydro ASA 686 413 362 5,342 60,000 82%Telenor ASA 683 388 343 4,160 61,900 53%Yara International ASA 646 386 340 4,462 45,822 87%
Non-listed companies in Categories 1–2
Aker Kværner Holding AS 210 140 1,072 34 100%Ambita AS 278 139 139 1,108 1,811 54%Argentum Fondsinvesteringer AS 391 218 187 1,376 455 73%Baneservice AS 414 207 2,070 1,672 51%Eksportfinans ASA 391 313 268 2,155 1,500 93%Electronic Chart Centre AS 231 123 123 595 129 49%Flytoget AS 330 182 164 1,505 424 58%GIEK Kredittforsikring AS 305 179 179 1,255 659 73%Investinor AS 283 165 165 1,034 251 88%Kommunalbanken AS 322 167 156 2,236 2,779 35%Mantena AS 390 211 189 1,539 920 72%Mesta AS 406 208 1,994 1,159 88%Nammo AS 371 319 204 2,145 8,833 67%Nysnø Klimainvesteringer AS 257 154 154 523 248 62%Posten Norge AS 452 383 225 2,662 9,499 79%Statkraft SF 524 370 304 3,022 19,551 87%VYgruppen AS 456 277 227 2,281 6,000 67%
Companies in Category 3
Andøya Space Center AS 240 120 120 1,200 459 88%Avinor AS 456 277 227 2,403 3,300 82%Bane NOR SF 456 277 227 2,526 11,200 28%Bjørnøen AS 28 11 11 70 Carte Blanche AS 72 37 4 237 139 71%AS Den Nationale Scene 116 67 52 491 415 38%Den Norske Opera & Ballett AS 195 134 67 801 585 73%Eksportkreditt Norge AS 342 210 1,515 230 84%Enova SF 417 250 212 2,363 563 11%Entur AS 358 189 169 1,224 567 67%
* Remuneration of the chair, vice chair and the board members as approved at the annual general meeting / corporate assembly in 2019.
** Total remuneration of board members comprises the ordinary remuneration that has been paid and remuneration for work on board committees, as stated in the companies’ annual reports for 2019.
Appendices132

Chair* Vice chair* Board member*
Total remuneration
of board members**
Total auditors' fees
Statutory audit as a percentage
of total remuneration to
the auditor
Fiskeri og havbruksnæringens forskningsfinansiering AS 140 70 70 560 231 58%
Gassco AS 417 265 213 1,889 2,009 91%Gassnova SF 412 247 210 1,499 428 58%Graminor AS 103 42 42 355 133 74%Helse MidtNorge RHF 263 176 128 1,350 1,981 93%Helse Nord RHF 263 176 128 1,547 1,564 67%Helse SørØst RHF 374 255 141 1,771 9,585 39%Helse Vest RHF 264 177 128 1,425 2,341 76%Innovasjon Norge 314 188 157 1,803 553 84%Kimen Såvarelaboratoriet AS 42 21 21 153 37 100%Kings Bay AS 240 135 135 760 244 36%Nationaltheatret AS 175 521 696 221 88%Nofima AS 172 78 78 729 422 45%Nordisk Institutt for Odontologiske Materialer AS 75 20 20 205 89 83%Norfund 260 128 1,028 973 71%Norges sjømatråd AS 174 124 85 974 185 78%Norsk Helsenett SF 267 173 139 1,415 236 86%Norsk rikskringkasting AS 277 164 113 1,105 934 56%Norsk Tipping AS 258 166 141 1,514 444 85%Norske tog AS 358 189 169 881 571 55%NSD – Norsk senter for forskningsdata AS 95 53 428 154 53%Nye Veier AS 456 277 227 2,087 818 67%Petoro AS 429 277 225 1,906 2,500 12%Rogaland Teater AS 90 55 40 315 175 83%Simula Research Laboratory AS 95 53 569 458 63%Siva – Selskapet for Industrivekst SF 235 166 148 1,123 702 63%Space Norway AS 240 140 800 286 61%Statnett SF 444 292 236 2,570 3,485 43%Statskog SF 225 129 110 908 496 78%Staur gård AS 100 30 30 160 30 100%Store Norske Spitsbergen Kulkompani AS 333 181 167 1,579 1,410 55%Talent Norge AS 165 82 659 179 71%Trøndelag Teater AS 101 55 48 204 162 92%Universitetssenteret på Svalbard AS 95 63 53 579 204 61%AS Vinmonopolet 240 160 130 1,326 762 59%
Not categorised
Filmparken AS 162 152 314 184 51%
Appendices 133
THE STATEOWNERSHIP
REPORT2019

Remuneration to the CEO for 2019NOK thousand
Total remuneration
Fixed salary
Long-termIncentive schemes
Earned bonus
Other remunera-
tion
Pension allow-
ance
Increase in fixed
salary in the past
year*
Increase in total
remuneration in the past
year*
DNB ASA** 9,594 5,586 767 2,254 213 774 Entra ASA** 4,759 3,090 456 950 155 108 Equinor ASA 15,286 9,416 2,702 2,482 686 0 3% 9%Kongsberg Gruppen ASA 10,383 5,502 1,048 2,594 315 924 7% 17%Norsk Hydro ASA** 1,050 5,699 407 1,589 224 6,869 Telenor ASA 14,522 6,606 1,804 1,928 469 3,715 1% 9%Yara International ASA 14,133 6,758 2,033 3,106 1,971 264 1% 8%
Non-listed companies in Categories 1-2
Ambita AS 2,645 2,046 192 150 257 5% 7%Argentum Fondsinvesteringer AS 7,544 4,958 2,404 11 171 3% 3%Baneservice AS 3,335 2,355 730 170 80 5% 13%Eksportfinans ASA 3,770 2,094 450 185 1,041 Electronic Chart Centre AS 1,345 1,300 18 26 Flytoget AS 3,443 2,388 359 217 479 6% 2%GIEK Kredittforsikring AS 2,167 1,790 105 16 256 2% 4%Investinor AS 2,601 2,298 138 47 118 Kommunalbanken AS 4,062 3,287 347 194 234 1% 7%Mantena AS 2,569 2,391 0 178 0 Mesta AS 1,069 1,033 0 4 32 Nammo AS 2,567 6,616 1,224 489 238 17% 26%Nysnø Klimainvesteringer AS 2,655 2,522 0 11 122 Posten Norge AS 5,848 5,440 289 119 18% 1%Statkraft SF 8,831 5,491 921 202 2,217 4% 2%VYgruppen AS 6,166 3,969 1,073 186 938 3% 2%
Companies in Category 3
Andøya Space Center AS 1,401 1,215 10 176 1% 2%Avinor AS 4,049 3,038 22 989 7% 9%Bane NOR SF 3,166 2,925 8 233 3% 4%Bjørnøen AS Carte Blanche AS 872 806 21 44 19% 18%AS Den Nationale Scene 1,390 1,307 1 82 1% 1%Den Norske Opera & Ballett AS 1,798 1,639 5 154 4% 4%Eksportkreditt Norge AS 3,495 3,054 267 174 136 3% 4%Enova SF 2,389 2,133 104 153 4% 4%Entur AS 2,329 1,923 400 6 5% 9%Fiskeri og havbruksnæringens forskningsfinansiering AS 1,952 1,540 219 193
* Growth in fixed salary and total remuneration in the past year is not reported for companies where the figures between 2019 and 2018 cannot be compared directly, for example, due to changes in management.
** DNB ASA, Entra ASA and Norsk Hydro ASA recruited a new CEO internally in 2019. With regard to Norsk Hydro, adjusted terms for the new CEO’s agreement relating to early retirement agreement between the ages of 62 and 65 contributed to a net negative change in value for the pension for 2019.
Appendices134

Total remuneration
Fixed salary
Long-termIncentive schemes
Earned bonus
Other remunera-
tion
Pension allow-
ance
Increase in fixed
salary in the past
year*
Increase in total
remuneration in the past
year*
Gassco AS 3,829 3,310 281 23 215 3% 4%Gassnova SF 3,010 2,302 339 369 1% 1%Graminor AS 1,232 1,155 10 67 8% 6%Helse MidtNorge RHF 2,538 2,005 165 368 2% 3%Helse Nord RHF 2,414 2,094 154 166 2% 2%Helse SørØst RHF 2,648 2,312 5 331 0% 0%Helse Vest RHF 3,161 2,482 22 657 3 4%Innovasjon Norge 1,273 1,265 8 0 Kimen Såvarelaboratoriet AS 781 753 12 16 10% 11%Kings Bay AS 1,097 1,002 95 18 18% 22%Nationaltheatret AS 1,639 1,445 9 185 2% 2%Nofima AS 2,643 2,414 43 186 4% 3%Nordisk Institutt for Odontologiske Materialer AS 1,286 1,110 6 168 4% 5%
Norfund 2,847 2,671 19 156 Norges sjømatråd AS 2,696 2,460 176 60 5% 5%Norsk Helsenett SF 744 731 14 301 Norsk rikskringkasting AS 3,413 3,169 33 128 3% 2%Norsk Tipping AS 3,201 2,744 30 427 8% 15%Norske tog AS 2,302 1,940 132 230 8% 8%NSD – Norsk senter for forskningsdata AS 1,254 1,226 24 4 2% 5%
Nye Veier AS 1,923 1,652 111 160 Petoro AS 5,850 3,477 209 180 1,984 3% 6%Rogaland Teater AS 1,273 1,101 18 154 3% 17%Simula Research Laboratory AS 3,067 2,738 155 174 2% 4%Siva – Selskapet for Industrivekst SF 2,326 2,069 97 165 Space Norway AS 1,641 1,632 95 6% 18%Statnett SF 5,742 3,142 184 2,416 3% 2%Statskog SF 1,070 1,823 11 136 3% 3%Staur gård AS 1,032 849 24 159 7% 5%
Store Norske Spitsbergen Kulkompani AS 2,423 1,749 360 155 159
Talent Norge AS 1,150 1,067 10 72 4% 2%Trøndelag Teater AS 1,183 1,042 10 131 1% 2%Universitetssenteret på Svalbard AS 1,534 1,367 0 167 3% 4%AS Vinmonopolet 2,036 1,685 158 193
Not categorised
Filmparken AS 716 616 100 0 6
Appendices 135
THE STATEOWNERSHIP
REPORT2019

Gender balance on the board and in managementFigures for the board are as of 31 March 2020. Figures for management are as of 31 December 2019.
Gender balanceon the board*
Gender balance amongowner-appointed/shareholder-
elected board members
Gender balance in group management/the company's
management group
Gender balance for execu-tives at the level below group management/the company's
management group
Gender balance for executives for the two top levels
Gender balance at the company as a whole
Chair CEO
Listed companies Women Men Women Men Women Men Women Men Women Men Women Men
DNB ASA 43% 57% 40% 60% 50% 50% 40% 60% 41% 59% 47% 53% 1 1Entra ASA 57% 43% 60% 40% 43% 57% 41% 59% 41% 59% 38% 62% 1 1Equinor ASA 36% 64% 38% 62% 27% 73% 43% 57% 43% 57% 31% 69% 0 0Kongsberg Gruppen ASA 38% 62% 40% 60% 25% 75% 34% 66% 33% 67% 20% 80% 0 0Norsk Hydro ASA 30% 70% 43% 57% 40% 60% 31% 69% 32% 68% 18% 82% 0 1Telenor ASA 44% 56% 50% 50% 30% 70% 30% 70% 30% 70% 37% 63% 1 0Yara International ASA 45% 55% 43% 57% 38% 62% 24% 76% 20% 80% 22% 78% 0 0Average for listed companies 42% 58% 45% 55% 36% 64% 35% 65% 34% 66% 30% 70% 43% 43%
Non-listed companies in Categories 1–2
Aker Kværner Holding AS 33% 67% 40% 60% - - - - - - - - 0 0Ambita AS 57% 43% 60% 40% 38% 62% 50% 50% 43% 57% 32% 68% 1 0Argentum Fondsinvesteringer AS 50% 50% 50% 50% 33% 67% - - - - 32% 68% 0 0Baneservice AS 25% 75% 40% 60% 38% 62% 10% 90% 17% 83% 7% 93% 0 1Eksportfinans ASA 33% 67% 40% 60% 25% 75% - - - - 27% 73% 0 0Electronic Chart Centre AS 50% 50% 50% 50% 40% 60% - - - - 40% 60% 1 1Flytoget AS 38% 62% 40% 60% 50% 50% 42% 58% 44% 56% 39% 61% 0 0GIEK Kredittforsikring AS 50% 50% 60% 40% 28% 72% 0% 100% 0% 100% 48% 52% 1 1Investinor AS 40% 60% 40% 60% 0% 100% - - - - 20% 80% 0 0Kommunalbanken AS 56% 44% 57% 43% 36% 64% 57% 43% 44% 56% 42% 58% 1 1Mantena AS 29% 71% 50% 50% 25% 75% 15% 85% 19% 81% 7% 93% 1 0Mesta AS 38% 62% 60% 40% 44% 56% 28% 72% 31% 69% 10% 90% 0 1Nammo AS 38% 62% 33% 67% 20% 80% 17% 83% 18% 82% 25% 75% 0 0Nysnø Klimainvesteringer AS** 25% 75% 25% 75% 50% 50% - - - - 33% 67% 0 1Posten Norge AS 50% 50% 50% 50% 50% 50% 32% 68% 34% 66% 31% 69% 0 1Statkraft SF 44% 56% 50% 50% 29% 71% 27% 73% 27% 73% 26% 74% 1 0VYgruppen AS 38% 62% 40% 60% 29% 71% 25% 75% 24% 76% 18% 82% 0 0
Average for non-listed companies in Categories 1-2 41% 59% 46% 54% 33% 67% 28% 72% 27% 73% 27% 73% 35% 41%
Companies in Category 3
Andøya Space Center AS 44% 56% 43% 57% 25% 75% 22% 78% 23% 77% 28% 72% 0 0Avinor AS 50% 50% 60% 40% 42% 58% 32% 68% 34% 66% 23% 77% 1 0Bane NOR SF 57% 43% 60% 40% 50% 50% 40% 60% 41% 59% 35% 65% 1 0Bjørnøen AS 50% 50% 50% 50% - - - - - - - - 0 0Carte Blanche AS 57% 43% 50% 50% 100% 0% 60% 40% 71% 29% 50% 50% 1 1AS Den Nationale Scene 29% 71% 40% 60% 57% 43% 33% 67% 42% 58% 50% 50% 1 0Den Norske Opera & Ballett AS 50% 50% 50% 50% 43% 57% 41% 59% 42% 58% 54% 46% 1 0Eksportkreditt Norge AS 67% 33% 60% 40% 29% 71% 67% 33% 40% 60% 57% 43% 1 0Enova SF 50% 50% 43% 57% 25% 75% 50% 50% 42% 58% 49% 51% 0 0Entur AS 50% 50% 50% 50% 43% 57% 59% 41% 54% 46% 54% 46% 1 0
Fiskeri og havbruksnæringens forskningsfinansiering AS 43% 57% 43% 57% 33% 67% - - 33% 67% 61% 39% 1 0
* I ncludes both ownerappointed/shareholderelected and employeeelected board members.** Katharina Asting resigned from the board on 17 January 2020. A replacement will be elected at
the ordinary general meeting in June 2020.
Appendices136

Gender balanceon the board*
Gender balance amongowner-appointed/shareholder-
elected board members
Gender balance in group management/the company's
management group
Gender balance for execu-tives at the level below group management/the company's
management group
Gender balance for executives for the two top levels
Gender balance at the company as a whole
Chair CEO
Listed companies Women Men Women Men Women Men Women Men Women Men Women Men
DNB ASA 43% 57% 40% 60% 50% 50% 40% 60% 41% 59% 47% 53% 1 1Entra ASA 57% 43% 60% 40% 43% 57% 41% 59% 41% 59% 38% 62% 1 1Equinor ASA 36% 64% 38% 62% 27% 73% 43% 57% 43% 57% 31% 69% 0 0Kongsberg Gruppen ASA 38% 62% 40% 60% 25% 75% 34% 66% 33% 67% 20% 80% 0 0Norsk Hydro ASA 30% 70% 43% 57% 40% 60% 31% 69% 32% 68% 18% 82% 0 1Telenor ASA 44% 56% 50% 50% 30% 70% 30% 70% 30% 70% 37% 63% 1 0Yara International ASA 45% 55% 43% 57% 38% 62% 24% 76% 20% 80% 22% 78% 0 0Average for listed companies 42% 58% 45% 55% 36% 64% 35% 65% 34% 66% 30% 70% 43% 43%
Non-listed companies in Categories 1–2
Aker Kværner Holding AS 33% 67% 40% 60% - - - - - - - - 0 0Ambita AS 57% 43% 60% 40% 38% 62% 50% 50% 43% 57% 32% 68% 1 0Argentum Fondsinvesteringer AS 50% 50% 50% 50% 33% 67% - - - - 32% 68% 0 0Baneservice AS 25% 75% 40% 60% 38% 62% 10% 90% 17% 83% 7% 93% 0 1Eksportfinans ASA 33% 67% 40% 60% 25% 75% - - - - 27% 73% 0 0Electronic Chart Centre AS 50% 50% 50% 50% 40% 60% - - - - 40% 60% 1 1Flytoget AS 38% 62% 40% 60% 50% 50% 42% 58% 44% 56% 39% 61% 0 0GIEK Kredittforsikring AS 50% 50% 60% 40% 28% 72% 0% 100% 0% 100% 48% 52% 1 1Investinor AS 40% 60% 40% 60% 0% 100% - - - - 20% 80% 0 0Kommunalbanken AS 56% 44% 57% 43% 36% 64% 57% 43% 44% 56% 42% 58% 1 1Mantena AS 29% 71% 50% 50% 25% 75% 15% 85% 19% 81% 7% 93% 1 0Mesta AS 38% 62% 60% 40% 44% 56% 28% 72% 31% 69% 10% 90% 0 1Nammo AS 38% 62% 33% 67% 20% 80% 17% 83% 18% 82% 25% 75% 0 0Nysnø Klimainvesteringer AS** 25% 75% 25% 75% 50% 50% - - - - 33% 67% 0 1Posten Norge AS 50% 50% 50% 50% 50% 50% 32% 68% 34% 66% 31% 69% 0 1Statkraft SF 44% 56% 50% 50% 29% 71% 27% 73% 27% 73% 26% 74% 1 0VYgruppen AS 38% 62% 40% 60% 29% 71% 25% 75% 24% 76% 18% 82% 0 0
Average for non-listed companies in Categories 1-2 41% 59% 46% 54% 33% 67% 28% 72% 27% 73% 27% 73% 35% 41%
Companies in Category 3
Andøya Space Center AS 44% 56% 43% 57% 25% 75% 22% 78% 23% 77% 28% 72% 0 0Avinor AS 50% 50% 60% 40% 42% 58% 32% 68% 34% 66% 23% 77% 1 0Bane NOR SF 57% 43% 60% 40% 50% 50% 40% 60% 41% 59% 35% 65% 1 0Bjørnøen AS 50% 50% 50% 50% - - - - - - - - 0 0Carte Blanche AS 57% 43% 50% 50% 100% 0% 60% 40% 71% 29% 50% 50% 1 1AS Den Nationale Scene 29% 71% 40% 60% 57% 43% 33% 67% 42% 58% 50% 50% 1 0Den Norske Opera & Ballett AS 50% 50% 50% 50% 43% 57% 41% 59% 42% 58% 54% 46% 1 0Eksportkreditt Norge AS 67% 33% 60% 40% 29% 71% 67% 33% 40% 60% 57% 43% 1 0Enova SF 50% 50% 43% 57% 25% 75% 50% 50% 42% 58% 49% 51% 0 0Entur AS 50% 50% 50% 50% 43% 57% 59% 41% 54% 46% 54% 46% 1 0
Fiskeri og havbruksnæringens forskningsfinansiering AS 43% 57% 43% 57% 33% 67% - - 33% 67% 61% 39% 1 0
Appendices 137
THE STATEOWNERSHIP
REPORT2019

Gender balanceon the board*
Gender balance amongowner-appointed/shareholder-
elected board members
Gender balance in group management/the company's
management group
Gender balance for execu-tives at the level below group management/the company's
management group
Gender balance for executives for the two top levels
Gender balance at the company as a whole
Chair CEO
Gassco AS 17% 83% 25% 75% 57% 43% 33% 67% 41% 59% 27% 73% 0 0Gassnova SF 33% 67% 40% 60% 71% 29% - - 71% 29% 35% 65% 0 1Graminor AS 43% 57% 50% 50% 67% 33% 50% 50% 58% 42% 35% 65% 0 1Helse MidtNorge RHF 56% 44% 50% 50% 43% 57% 0% 100% 33% 67% 75% 25% 1 0Helse Nord RHF 60% 40% 57% 43% 57% 43% 51% 49% 51% 49% 70% 30% 1 1Helse SørØst RHF 50% 50% 57% 43% 38% 62% 47% 53% 44% 56% 58% 42% 0 1Helse Vest RHF 56% 44% 50% 50% 33% 67% 42% 58% 41% 59% 75% 25% 0 1Innovasjon Norge 45% 55% 44% 56% 55% 45% 65% 35% 61% 39% 57% 43% 0 0Kimen Såvarelaboratoriet AS 16% 84% 0% 100% 80% 20% 100% 0% 80% 20% 95% 5% 0 1Kings Bay AS 50% 50% 50% 50% 33% 67% 3% 97% 50% 50% 36% 64% 0 0Nationaltheatret AS 63% 37% 60% 40% 80% 20% 50% 50% 54% 46% 52% 48% 1 1Nofima AS 50% 50% 40% 60% 43% 57% 81% 19% 67% 33% 60% 40% 0 0Nordisk Institutt for Odontologiske Materialer AS 60% 40% 60% 40% 67% 33% - - 66% 34% 58% 42% 1 0
Norfund 56% 44% 57% 43% 50% 50% 25% 75% 41% 59% 43% 57% 1 0
Norges sjømatråd AS 50% 50% 43% 57% 43% 57% - - - - 53% 47% 1 1
Norsk Helsenett SF 44% 56% 50% 50% 43% 57% 40% 60% 41% 59% 31% 69% 0 0
Norsk rikskringkasting AS 50% 50% 60% 40% 40% 60% 52% 48% 50% 50% 46% 54% 0 0
Norsk Tipping AS 50% 50% 50% 50% 43% 57% 31% 69% 33% 67% 37% 63% 1 1Norske tog AS 50% 50% 67% 33% 40% 60% 40% 60% 40% 60% 15% 85% 1 0NSD – Norsk senter for forskningsdata AS 43% 57% 40% 60% 40% 60% 100% 0% 67% 33% - - 0 1Nye Veier AS 57% 43% 60% 40% 25% 75% 23% 77% 23% 77% 30% 70% 0 1Petoro AS 43% 57% 40% 60% 25% 75% - - - - 32% 68% 1 1Rogaland Teater AS 57% 43% 40% 60% 33% 67% 67% 33% 47% 53% 61% 39% 1 0Simula Research Laboratory AS 56% 44% 57% 43% 46% 54% 26% 74% 34% 66% 30% 70% 1 0Siva – Selskapet for Industrivekst SF 38% 62% 43% 57% 67% 33% 33% 67% 50% 50% 49% 51% 0 1Space Norway AS 40% 60% 40% 60% 33% 67% 0% 100% 14% 86% 14% 86% 0 0Statnett SF 38% 62% 40% 60% 29% 71% 32% 68% 32% 68% 26% 74% 0 0Statskog SF 57% 43% 60% 40% 21% 79% 25% 75% 14% 86% 33% 67% 0 0Staur gård AS 33% 67% 33% 67% 0% 100% 0% 100% 0% 100% 0% 100% 0 0Store Norske Spitsbergen Kulkompani AS 43% 57% 60% 40% 13% 87% 31% 69% 24% 76% 15% 85% 1 0Talent Norge AS 57% 43% 57% 43% 100% 0% - - 100% 0% 50% 50% 0 1Trøndelag Teater AS 43% 57% 40% 60% 50% 50% 50% 50% 50% 50% 52% 48% 0 1Universitetssenteret på Svalbard AS 45% 55% 43% 57% 38% 62% 0% 100% 33% 67% 50% 50% 0 0AS Vinmonopolet 44% 56% 50% 50% 29% 71% 58% 42% 58% 42% 66% 34% 1 1Average for companies in Category 3 48% 52% 48% 52% 45% 55% 41% 59% 45% 55% 45% 55% 47% 38%
Uncategorised companies
Filmparken AS 33% 67% 33% 67% 100% 0% 100% 0% 100% 0% - 1 1
Average for all companies 45% 55% 47% 53% 42% 58% 39% 61% 42% 58% 39% 61% 44% 40%
* Includes both ownerappointed/shareholderelected and employeeelected board members.
Appendices138
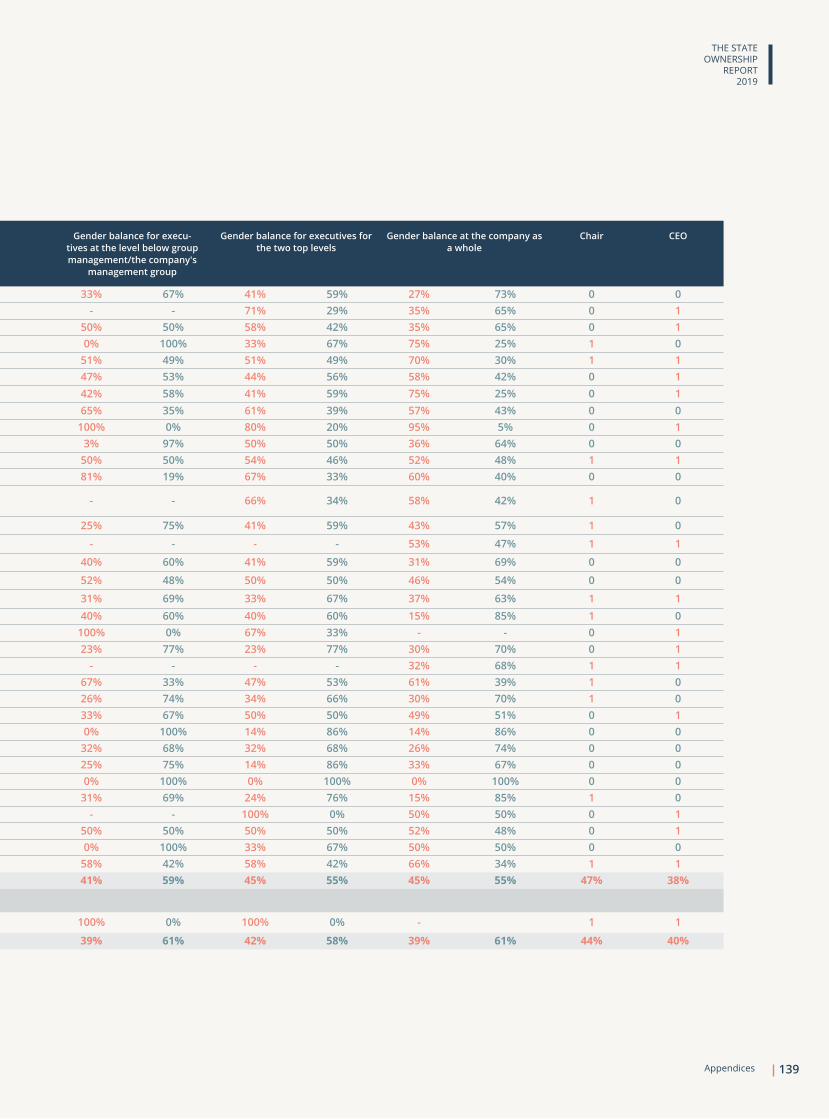
Gender balanceon the board*
Gender balance amongowner-appointed/shareholder-
elected board members
Gender balance in group management/the company's
management group
Gender balance for execu-tives at the level below group management/the company's
management group
Gender balance for executives for the two top levels
Gender balance at the company as a whole
Chair CEO
Gassco AS 17% 83% 25% 75% 57% 43% 33% 67% 41% 59% 27% 73% 0 0Gassnova SF 33% 67% 40% 60% 71% 29% - - 71% 29% 35% 65% 0 1Graminor AS 43% 57% 50% 50% 67% 33% 50% 50% 58% 42% 35% 65% 0 1Helse MidtNorge RHF 56% 44% 50% 50% 43% 57% 0% 100% 33% 67% 75% 25% 1 0Helse Nord RHF 60% 40% 57% 43% 57% 43% 51% 49% 51% 49% 70% 30% 1 1Helse SørØst RHF 50% 50% 57% 43% 38% 62% 47% 53% 44% 56% 58% 42% 0 1Helse Vest RHF 56% 44% 50% 50% 33% 67% 42% 58% 41% 59% 75% 25% 0 1Innovasjon Norge 45% 55% 44% 56% 55% 45% 65% 35% 61% 39% 57% 43% 0 0Kimen Såvarelaboratoriet AS 16% 84% 0% 100% 80% 20% 100% 0% 80% 20% 95% 5% 0 1Kings Bay AS 50% 50% 50% 50% 33% 67% 3% 97% 50% 50% 36% 64% 0 0Nationaltheatret AS 63% 37% 60% 40% 80% 20% 50% 50% 54% 46% 52% 48% 1 1Nofima AS 50% 50% 40% 60% 43% 57% 81% 19% 67% 33% 60% 40% 0 0Nordisk Institutt for Odontologiske Materialer AS 60% 40% 60% 40% 67% 33% - - 66% 34% 58% 42% 1 0
Norfund 56% 44% 57% 43% 50% 50% 25% 75% 41% 59% 43% 57% 1 0
Norges sjømatråd AS 50% 50% 43% 57% 43% 57% - - - - 53% 47% 1 1
Norsk Helsenett SF 44% 56% 50% 50% 43% 57% 40% 60% 41% 59% 31% 69% 0 0
Norsk rikskringkasting AS 50% 50% 60% 40% 40% 60% 52% 48% 50% 50% 46% 54% 0 0
Norsk Tipping AS 50% 50% 50% 50% 43% 57% 31% 69% 33% 67% 37% 63% 1 1Norske tog AS 50% 50% 67% 33% 40% 60% 40% 60% 40% 60% 15% 85% 1 0NSD – Norsk senter for forskningsdata AS 43% 57% 40% 60% 40% 60% 100% 0% 67% 33% - - 0 1Nye Veier AS 57% 43% 60% 40% 25% 75% 23% 77% 23% 77% 30% 70% 0 1Petoro AS 43% 57% 40% 60% 25% 75% - - - - 32% 68% 1 1Rogaland Teater AS 57% 43% 40% 60% 33% 67% 67% 33% 47% 53% 61% 39% 1 0Simula Research Laboratory AS 56% 44% 57% 43% 46% 54% 26% 74% 34% 66% 30% 70% 1 0Siva – Selskapet for Industrivekst SF 38% 62% 43% 57% 67% 33% 33% 67% 50% 50% 49% 51% 0 1Space Norway AS 40% 60% 40% 60% 33% 67% 0% 100% 14% 86% 14% 86% 0 0Statnett SF 38% 62% 40% 60% 29% 71% 32% 68% 32% 68% 26% 74% 0 0Statskog SF 57% 43% 60% 40% 21% 79% 25% 75% 14% 86% 33% 67% 0 0Staur gård AS 33% 67% 33% 67% 0% 100% 0% 100% 0% 100% 0% 100% 0 0Store Norske Spitsbergen Kulkompani AS 43% 57% 60% 40% 13% 87% 31% 69% 24% 76% 15% 85% 1 0Talent Norge AS 57% 43% 57% 43% 100% 0% - - 100% 0% 50% 50% 0 1Trøndelag Teater AS 43% 57% 40% 60% 50% 50% 50% 50% 50% 50% 52% 48% 0 1Universitetssenteret på Svalbard AS 45% 55% 43% 57% 38% 62% 0% 100% 33% 67% 50% 50% 0 0AS Vinmonopolet 44% 56% 50% 50% 29% 71% 58% 42% 58% 42% 66% 34% 1 1Average for companies in Category 3 48% 52% 48% 52% 45% 55% 41% 59% 45% 55% 45% 55% 47% 38%
Uncategorised companies
Filmparken AS 33% 67% 33% 67% 100% 0% 100% 0% 100% 0% - 1 1
Average for all companies 45% 55% 47% 53% 42% 58% 39% 61% 42% 58% 39% 61% 44% 40%
Appendices 139
THE STATEOWNERSHIP
REPORT2019

Gender balance on the boards as of 31 March 2008-2020
Gender balance in senior management positionsas of 31 December 2014-2019
Average proportion of women among owner-appointed / shareholder-elected board members
Average proportion of women on boards
Proportion of women among board chairs
0 %
10 %
20 %
30 %
40 %
50 %
60 %
2008 2009 2010 2011 2012 2013 2015 2016 2017 2018 2019 20202014
27 %23 %
44 %
47 % 46 %
43 % 43 % 44 %43 %44 % 44 %
44 % 44 % 46 %
44 % 46 %
43 %
45 %
30 % 29 %27 % 28 %
36 %38 %
47 %45 %
45 %
45 %
46 % 47 % 47 % 47 %47 %
46 %
47 %
43 %
49 %
45 %
44 %
Average proportion of women in group management/the company's management group
Average proportion of female executives at the level below group management/the company's management group
Proportion of women among chief executives
2014 2015 2019201820172016
20 %
32 %
33 % 35 %
40 %42 %
32 %34 %
40 %
21 %
37 %
33 %
24 %
36 %
34 %
26 %
29 %
39 %
0 %
5 %
10 %
15 %
20 %
25 %
30 %
35 %
40 %
45 %
Appendices140
Percentage of women in senior man-agement positionsas of 31 December 2014-2018.
141
Photo: Statkraft
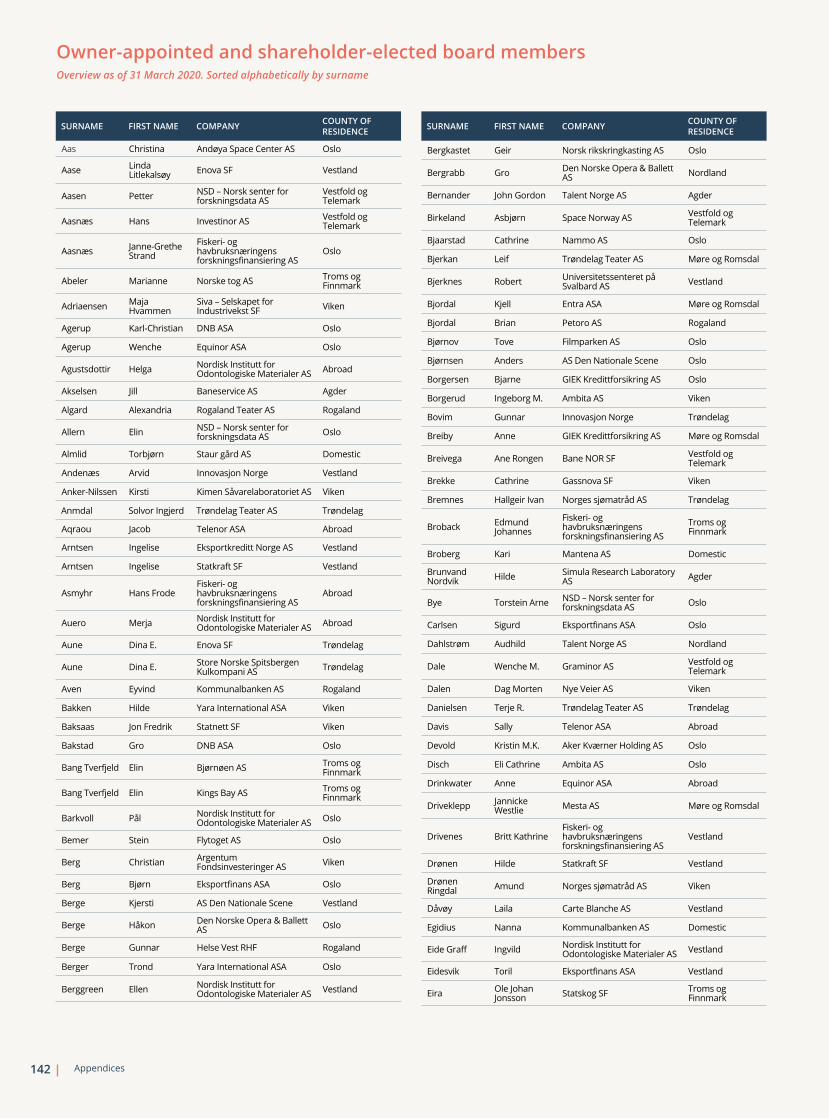
SURNAME FIRST NAME COMPANY COUNTY OF RESIDENCE
Aas Christina Andøya Space Center AS Oslo
Aase Linda Litlekalsøy Enova SF Vestland
Aasen Petter NSD – Norsk senter for forskningsdata AS
Vestfold og Telemark
Aasnæs Hans Investinor AS Vestfold og Telemark
Aasnæs JanneGrethe Strand
Fiskeri og havbruksnæringens forskningsfinansiering AS
Oslo
Abeler Marianne Norske tog AS Troms og Finnmark
Adriaensen Maja Hvammen
Siva – Selskapet for Industrivekst SF Viken
Agerup KarlChristian DNB ASA Oslo
Agerup Wenche Equinor ASA Oslo
Agustsdottir Helga Nordisk Institutt for Odontologiske Materialer AS Abroad
Akselsen Jill Baneservice AS Agder
Algard Alexandria Rogaland Teater AS Rogaland
Allern Elin NSD – Norsk senter for forskningsdata AS Oslo
Almlid Torbjørn Staur gård AS Domestic
Andenæs Arvid Innovasjon Norge Vestland
AnkerNilssen Kirsti Kimen Såvarelaboratoriet AS Viken
Anmdal Solvor Ingjerd Trøndelag Teater AS Trøndelag
Aqraou Jacob Telenor ASA Abroad
Arntsen Ingelise Eksportkreditt Norge AS Vestland
Arntsen Ingelise Statkraft SF Vestland
Asmyhr Hans FrodeFiskeri og havbruksnæringens forskningsfinansiering AS
Abroad
Auero Merja Nordisk Institutt for Odontologiske Materialer AS Abroad
Aune Dina E. Enova SF Trøndelag
Aune Dina E. Store Norske Spitsbergen Kulkompani AS Trøndelag
Aven Eyvind Kommunalbanken AS Rogaland
Bakken Hilde Yara International ASA Viken
Baksaas Jon Fredrik Statnett SF Viken
Bakstad Gro DNB ASA Oslo
Bang Tverfjeld Elin Bjørnøen AS Troms og Finnmark
Bang Tverfjeld Elin Kings Bay AS Troms og Finnmark
Barkvoll Pål Nordisk Institutt for Odontologiske Materialer AS Oslo
Bemer Stein Flytoget AS Oslo
Berg Christian Argentum Fondsinvesteringer AS Viken
Berg Bjørn Eksportfinans ASA Oslo
Berge Kjersti AS Den Nationale Scene Vestland
Berge Håkon Den Norske Opera & Ballett AS Oslo
Berge Gunnar Helse Vest RHF Rogaland
Berger Trond Yara International ASA Oslo
Berggreen Ellen Nordisk Institutt for Odontologiske Materialer AS Vestland
SURNAME FIRST NAME COMPANY COUNTY OF RESIDENCE
Bergkastet Geir Norsk rikskringkasting AS Oslo
Bergrabb Gro Den Norske Opera & Ballett AS Nordland
Bernander John Gordon Talent Norge AS Agder
Birkeland Asbjørn Space Norway AS Vestfold og Telemark
Bjaarstad Cathrine Nammo AS Oslo
Bjerkan Leif Trøndelag Teater AS Møre og Romsdal
Bjerknes Robert Universitetssenteret på Svalbard AS Vestland
Bjordal Kjell Entra ASA Møre og Romsdal
Bjordal Brian Petoro AS Rogaland
Bjørnov Tove Filmparken AS Oslo
Bjørnsen Anders AS Den Nationale Scene Oslo
Borgersen Bjarne GIEK Kredittforsikring AS Oslo
Borgerud Ingeborg M. Ambita AS Viken
Bovim Gunnar Innovasjon Norge Trøndelag
Breiby Anne GIEK Kredittforsikring AS Møre og Romsdal
Breivega Ane Rongen Bane NOR SF Vestfold og Telemark
Brekke Cathrine Gassnova SF Viken
Bremnes Hallgeir Ivan Norges sjømatråd AS Trøndelag
Broback Edmund Johannes
Fiskeri og havbruksnæringens forskningsfinansiering AS
Troms og Finnmark
Broberg Kari Mantena AS Domestic
Brunvand Nordvik Hilde Simula Research Laboratory
AS Agder
Bye Torstein Arne NSD – Norsk senter for forskningsdata AS Oslo
Carlsen Sigurd Eksportfinans ASA Oslo
Dahlstrøm Audhild Talent Norge AS Nordland
Dale Wenche M. Graminor AS Vestfold og Telemark
Dalen Dag Morten Nye Veier AS Viken
Danielsen Terje R. Trøndelag Teater AS Trøndelag
Davis Sally Telenor ASA Abroad
Devold Kristin M.K. Aker Kværner Holding AS Oslo
Disch Eli Cathrine Ambita AS Oslo
Drinkwater Anne Equinor ASA Abroad
Driveklepp Jannicke Westlie Mesta AS Møre og Romsdal
Drivenes Britt KathrineFiskeri og havbruksnæringens forskningsfinansiering AS
Vestland
Drønen Hilde Statkraft SF Vestland
Drønen Ringdal Amund Norges sjømatråd AS Viken
Dåvøy Laila Carte Blanche AS Vestland
Egidius Nanna Kommunalbanken AS Domestic
Eide Graff Ingvild Nordisk Institutt for Odontologiske Materialer AS Vestland
Eidesvik Toril Eksportfinans ASA Vestland
Eira Ole Johan Jonsson Statskog SF Troms og
Finnmark
Owner-appointed and shareholder-elected board members Overview as of 31 March 2020. Sorted alphabetically by surname
Appendices142

SURNAME FIRST NAME COMPANY COUNTY OF RESIDENCE
Ekenstierna Bengt Statkraft SF Abroad
Ellingsen Grete Andøya Space Center AS Nordland
Enger Andreas Posten Norge AS Oslo
Eriksen Tom Børje Helse Nord RHF Troms og Finnmark
Eriksen Øyvind Aker Kværner Holding AS Oslo
Espolin Johnson Ida Kommunalbanken AS Oslo
Falck Thomas Eksportfinans ASA Oslo
Falck Thomas Investinor AS Oslo
Falk Hansen Ole Baneservice AS Agder
Farstad Thomas Henning Nofima AS Oslo
Fiksdahl Liv Posten Norge AS Oslo
Five Thor Egil Investinor AS Trøndelag
Fjeld Jostein Graminor AS Domestic
Fjeld Jostein Kimen Såvarelaboratoriet AS Domestic
Fjeldstad Trude Johanne Haugen Petoro AS Oslo
Fjell Olav Nofima AS Viken
Fladmark Helene Falch Innovasjon Norge Agder
Flatheim Hege Space Norway AS Rogaland
Flåthen Knut Ole Electronic Chart Centre AS Oslo
Forså Tom Erik Helse Nord RHF Troms og Finnmark
Fosen Arne Enova SF Viken
Fougner Else B. Aker Kværner Holding AS Oslo
Fougner Else B. Eksportkreditt Norge AS Oslo
Frisak Nina Space Norway AS Viken
Frisak Nina Universitetssenteret på Svalbard AS Viken
Frøstrup Anne C. Helse SørØst RHF Viken
Fure Håkon Yara International ASA Abroad
Fyllingen Kjerstin GIEK Kredittforsikring AS Vestland
Giske Eli M. Nye Veier AS Viken
Gjedrem Svein Ingvar Helse SørØst RHF Viken
Gjerdet Nils Roar Nordisk Institutt for Odontologiske Materialer AS Vestland
Gjessing Sverre Kristian Entur AS Vestland
Gjesteland Egil Statnett SF Viken
Godal Bjørn T. Equinor ASA Oslo
Golimo Sveinung Andreas Talent Norge AS Viken
Grimeland Kjell Martin Argentum Fondsinvesteringer AS Viken
Gundersen Gunnar Staur gård AS Domestic
Gustafsson Björn Helse MidtNorge RHF Trøndelag
Hald Morten Universitetssenteret på Svalbard AS
Troms og Finnmark
Halleraker Svein Carte Blanche AS Vestland
Hansen David Norsk Tipping AS Vestfold og Telemark
Hasaas Olav Enova SF Viken
SURNAME FIRST NAME COMPANY COUNTY OF RESIDENCE
Hasaas Øyvind Mantena AS Viken
Hatlen Siri Beate Hatlen Bane NOR SF Viken
Hatlen Siri Eksportkreditt Norge AS Viken
Hatlen Siri Beate Hatlen Entra ASA Viken
Haug Kristian Dahlberg Helse MidtNorge RHF Trøndelag
Haugen Baard Bane NOR SF Oslo
Havnelid Åsne Vygruppen AS Viken
Heggernes Pinar Simula Research Laboratory AS Vestland
Hegrestad Trond Andøya Space Center AS Viken
Hellerud Catharina Mesta AS Oslo
Helno Sverre AS Vinmonopolet Oslo
Henden Olin J. Helse Vest RHF Vestland
Henriksen Morten Kongsberg Gruppen ASA Agder
Herlofsen Rebecca Glasser Equinor ASA Oslo
Hilland Jannicke Nysnø Klimainvesteringer AS Vestland
Hille Sigurd Helse Vest RHF Vestland
Hindar Jon Argentum Fondsinvesteringer AS Oslo
Holm Tore Enova SF Viken
Holmen Marianne Gassnova SF Oslo
Holte Øyvind Eksportkreditt Norge AS Vestland
Hope Ole Carte Blanche AS Vestland
Hovland Ingrid Dahl Entra ASA Agder
Hovland Ellen Margrethe Graminor AS Viken
Hustad Johan E. Gassco AS Trøndelag
Hustad Arild Space Norway AS Oslo
Höjsgaard Henrik Posten Norge AS Abroad
Ibsen MaiLill GIEK Kredittforsikring AS Oslo
Ingebrigtsen Kjell Fiskeri og havbruksnæringens forskningsfinansiering AS
Nordland
Ingerø Gyrid Skalleberg Flytoget AS Oslo
Instanes Tor Bjørnøen AS Vestland
Instanes Tor Kings Bay AS Vestland
Isaksen Barbro Kimen Såvarelaboratoriet AS Viken
Isaksen Geir Yara International ASA Viken
Ishaq Bushra Helse SørØst RHF Oslo
Jaakonsalo Ville Nammo AS Abroad
Jarlsby Nicolai Electronic Chart Centre AS Agder
Jebsen Finn Norfund Oslo
Jebsen Finn Norsk Hydro ASA Oslo
Jensen Leif Harald Entur AS Rogaland
Jenssen Svenn Are Helse Nord RHF Nordland
Johnsen Sigbjørn Innovasjon Norge Domestic
Johnsen Marianne Norges sjømatråd AS Viken
Appendices 143
THE STATEOWNERSHIP
REPORT2019

SURNAME FIRST NAME COMPANY COUNTY OF RESIDENCE
Justad Annette Malm Norske tog AS Oslo
Justad Annette M. Store Norske Spitsbergen Kulkompani AS Oslo
Jørgensen Kari Helse Nord RHF Troms og Finnmark
Kalvig Siri Universitetssenteret på Svalbard AS Rogaland
Kamsvåg Mette Siva – Selskapet for Industrivekst SF Møre og Romsdal
Kanck Bjørn Andøya Space Center AS Troms og Finnmark
Kartum Marianne Mantena AS Trøndelag
Kielland Asmyhr Hans Frode Graminor AS Viken
Kilaas Liselott Norsk Hydro ASA Oslo
Kildahl Jørgen Telenor ASA Abroad
Kinserdal Finn Posten Norge AS Vestland
Klingenberg Ellen Tveit Statskog SF Trøndelag
Knudsen Cecilie Broch Talent Norge AS Oslo
Kold Bakkevig Martha Kongsberg Gruppen ASA Rogaland
Korssjøen Jan Erik Rygge 1 AS Viken
Kristiansen Eirik G. Enova SF Vestland
Kristiansen Kjell Olav Gassnova SF Viken
Kristiansen Merete Nygaard Innovasjon Norge Troms og
Finnmark
Kristoffersen Eva M. Norges sjømatråd AS Nordland
Kukielski Peter Norsk Hydro ASA Abroad
Langeggen Ellen Bjørnøen AS Oslo
Langeggen Ellen Kings Bay AS Oslo
Langeland Henrik Helliesen Nationaltheatret AS Oslo
Larsen Kåre Oskar Kimen Såvarelaboratoriet AS Viken
Laskerud Tine Anette Grytnes Nofima AS Vestland
LeinMathisen Kimberly Yara International ASA Oslo
Lewis Jonathan Equinor ASA Abroad
LieNilsen Henrik Ambita AS Vestland
LieNilsen RoyEddy AS Den Nationale Scene Vestland
Lillestøl Bente Store Norske Spitsbergen Kulkompani AS Oslo
Limi Vibeke Helse SørØst RHF Viken
Lunde Einar Helse SørØst RHF Agder
Lunde Jørand Ø. Innovasjon Norge Domestic
Lunde Kjartan Alexander Rogaland Teater AS Rogaland
Lundin Mikael Statkraft SF Abroad
Lundqvist Mats Simula Research Laboratory AS Abroad
Lydersen Asta Busingye Nationaltheatret AS Oslo
Løhaugen Solveig AS Vinmonopolet Agder
Løkling Jan Innovasjon Norge Vestfold og Telemark
Madsen Vibeke Hammer Norfund Oslo
Magnus Birger Norsk rikskringkasting AS Viken
Marum Finn I. Eksportkreditt Norge AS Oslo
SURNAME FIRST NAME COMPANY COUNTY OF RESIDENCE
Medhus Cathrine Marie Lofhus Norsk Helsenett SF Oslo
Mejdell Dag Norsk Hydro ASA Oslo
Mejdell Dag Vygruppen AS Oslo
Melbø Olaf Trygve Bane NOR SF Domestic
Meling Steinar Nordisk Institutt for Odontologiske Materialer AS Rogaland
Mellbye Peter Statkraft SF Oslo
Meyer Anne Lise Norsk Tipping AS Oslo
Midseim AnneLene Gassco AS Oslo
Midtgaard Rune Olav Kommunalbanken AS Oslo
Misund Kristin Innovasjon Norge Viken
Moengen Trond Gassnova SF Viken
Mohn Klaus Nysnø Klimainvesteringer AS Rogaland
Monseth Per Olav Norsk Tipping AS Trøndelag
Myhre Ingvild Simula Research Laboratory AS Oslo
Nag Toril Ambita AS Rogaland
Nag Toril Bane NOR SF Rogaland
Naslund Blixt Mariana Nordisk Institutt for Odontologiske Materialer AS Abroad
Neteland Dagfinn Baneservice AS Vestland
Nielsen Petter Simula Research Laboratory AS Oslo
Nikolaisen Harald V. Baneservice AS Oslo
Nikolaisen Harald V. Nye Veier AS Vestland
Nilsen Geir Helse SørØst RHF Domestic
Nilsen Birger Store Norske Spitsbergen Kulkompani AS Viken
Nilssen Herlof Avinor AS Rogaland
Nilssen Herlof Norsk Helsenett SF Rogaland
Nilsson PerHarald Carte Blanche AS Rogaland
Njærheim Anne Beth Carte Blanche AS Vestland
Norheim Hildegunn Graminor AS Viken
Nygren Eva Nye Veier AS Abroad
Nyheim John Mesta AS Viken
Næss Bjørn Erik Aker Kværner Holding AS Oslo
Oaland ØyvindFiskeri og havbruksnæringens forskningsfinansiering AS
Vestland
Olafsson Kjartan Norsk Helsenett SF Vestland
Olofsson Gunnar Statskog SF Abroad
Olsen Dag Rune AS Den Nationale Scene Oslo
Olsen Per Arne AS Vinmonopolet Vestfold og Telemark
Olsen Roar Norsk Helsenett SF Trøndelag
Olsen Arild Universitetssenteret på Svalbard AS Nordland
Opedal Dag J. Nammo AS Oslo
Opedal Espen Norske tog AS Vestland
Orgland Karin Bing Entur AS Oslo
Panengstuen Anne Marit Mesta AS Viken
Pedersen Lars Jacob Tynes AS Vinmonopolet Vestland
Owner-appointed and shareholder-elected board members Overview as of 31 March 2020. Sorted alphabetically by surname
Appendices144

SURNAME FIRST NAME COMPANY COUNTY OF RESIDENCE
Pedersen Ann Baneservice AS Nordland
Petersen Jan Den Norske Opera & Ballett AS Oslo
Pettersen Tove Elisabeth Statnett SF Oslo
Pran Adele Bugge Norman Yara International ASA Oslo
RahkaKnutsen Beate Helse Nord RHF Nordland
Randa Audhild Andersen Entur AS Oslo
Rautalinko Esa Nammo AS Abroad
Reinemo Rikke Tobiasson
Argentum Fondsinvesteringer AS Oslo
Reinhardsen Jon Erik Equinor ASA Oslo
Reinhardsen Jon Erik Telenor ASA Oslo
Reistad Eli Statskog SF Viken
Reiten Eivind K. Kongsberg Gruppen ASA Oslo
Reiten Kåre Rogaland Teater AS Rogaland
Repstad Jon A. Kimen Såvarelaboratoriet AS Viken
Ribe Marianne Ødegaard Flytoget AS Oslo
Rimmereid Tore O. DNB ASA Oslo
Rimmereid Tore Olaf Space Norway AS Oslo
Ringen Asting Katharina Simula Research Laboratory AS Viken
Roland Kjell Siva – Selskapet for Industrivekst SF Oslo
Roverud Rolf Flytoget AS Rogaland
Rugland Brit Kommunalbanken AS Rogaland
Rugland Brit Norfund Rogaland
Rummelhoff Irene Norsk Hydro ASA Rogaland
Ruud Morten Gassnova SF Oslo
Ruyter Finn Bjørn Equinor ASA Oslo
Røkke Kjell Inge Aker Kværner Holding AS Viken
Rørvik Tine Siva – Selskapet for Industrivekst SF
Vestfold og Telemark
Røynesdal Ingrid Talent Norge AS Oslo
Salbuvik Widar Bjørnøen AS Viken
Salbuvik Widar Entra ASA Viken
Salbuvik Widar Kings Bay AS Viken
Salbuvik Widar Nysnø Klimainvesteringer AS Viken
Salvanes Kjell Gunnar NSD – Norsk senter for forskningsdata AS
Vestfold og Telemark
Sandal Hugo Petoro AS Viken
Sandsmark Maria Statnett SF Møre og Romsdal
Sandvik Tore O. Trøndelag Teater AS Trøndelag
Sbertoli Per Kristian Norfund Oslo
Schjerven Dag Nammo AS Oslo
Schlafer Sebastian Nordisk Institutt for Odontologiske Materialer AS Abroad
Schulz Thomas Norsk Hydro ASA Abroad
Schøyen Per A. Petoro AS Rogaland
Seip Ellen AS Vinmonopolet Oslo
SelmerOlsen Eirik Nofima AS Viken
SURNAME FIRST NAME COMPANY COUNTY OF RESIDENCE
Selvaag Olav H. Nationaltheatret AS Viken
Semlitsch Jaan Ivar DNB ASA Viken
Semmingsen Semming Vygruppen AS Troms og Finnmark
Seres Silvija Norsk rikskringkasting AS Viken
Silseth Linda B. Avinor AS Viken
Silseth Linda Bernander Norsk Tipping AS Viken
Sjursen Egil Herman Nysnø Klimainvesteringer AS Vestland
Sjøblom Tove Stuhr Norfund Vestfold og Telemark
Sjøseth Arnfinn Kimen Såvarelaboratoriet AS Viken
Skancke Martin Norfund Oslo
Skatteboe Rolf Andøya Space Center AS Viken
Skillingstad Beate Helse MidtNorge RHF Trøndelag
Skjærpe Tor Rasmus Gassco AS Rogaland
Skjærstad Mari Nye Veier AS Domestic
Skogseth Jan S. Gassco AS Rogaland
Skrøvset Eli Avinor AS Viken
Slungård Anne Kathrine Investinor AS Trøndelag
Smith Merete Nationaltheatret AS Oslo
Solberg Ronny Mantena AS Viken
Sormunen SirpaHelena Nammo AS Abroad
Stabbetorp Bjørn Graminor AS Viken
Steen jr. Petter Kommunalbanken AS Rogaland
Steinsvik Sund Tina Electronic Chart Centre AS Trøndelag
Steinsvåg Tone B. Helse Vest RHF Vestland
Stensen Trine AS Vinmonopolet Viken
Stenseth Turid Trøndelag Teater AS Trøndelag
Stensland Eva NSD – Norsk senter for forskningsdata AS
Troms og Finnmark
Stette Liv Helse MidtNorge RHF Møre og Romsdal
Stiegler Tina Posten Norge AS Oslo
Stokke Geir Inge Vygruppen AS Viken
Storelvmo Edel Nofima AS Nordland
Strand Ola H. Avinor AS Trøndelag
Strand Solveig Norges sjømatråd AS Møre og Romsdal
Strand Aasnæs JanneGrethe
Fiskeri og havbruksnæringens forskningsfinansiering AS
Oslo
Strøm Inger Lise Helse Nord RHF Nordland
Strømdal Wik Tina Nordisk Institutt for Odontologiske Materialer AS Trøndelag
StrømErichsen AnneGrete Carte Blanche AS Oslo
StrømErichsen AnneGrete Kongsberg Gruppen ASA Vestland
Strømsvåg Einar Anders Helse Vest RHF Rogaland
Strømsvåg Einar Statnett SF Rogaland
Støre Hege Electronic Chart Centre AS Oslo
Sund Tina S. Argentum Fondsinvesteringer AS Trøndelag
Sund Tina Steinsvik Helse MidtNorge RHF Trøndelag
Appendices 145
THE STATEOWNERSHIP
REPORT2019

SURNAME FIRST NAME COMPANY COUNTY OF RESIDENCE
Sunde Rasmus Andøya Space Center AS Oslo
Sundland Siren Talent Norge AS Vestland
Svarva Olaug DNB ASA Oslo
Svarva Olaug Investinor AS Oslo
Svarva Olaug Norfund Oslo
Sverdrup Aslak Flytoget AS Vestland
Sætershagen Randi B. Norsk rikskringkasting AS Domestic
Sætersmoen Eli Staur gård AS Domestic
Sørby Morten Karlsen Mesta AS Abroad
Søreide Ingolf Simula Research Laboratory AS Viken
Sørlie Per A. Kongsberg Gruppen ASA Viken
Takvam Martha Kommunalbanken AS Viken
Tanum Anne Carine Avinor AS Oslo
Tanum Anne Carine Den Norske Opera & Ballett AS Viken
Tanum Anne Carine Posten Norge AS Viken
Teigland Wenche Vygruppen AS Vestland
Tepfers Camilla AC Entra ASA Oslo
Thaulow Sven Størmer Ambita AS Oslo
Thore Susanne Munch
Argentum Fondsinvesteringer AS Oslo
Thorsen Rolf Den Norske Opera & Ballett AS Oslo
Thorsheim Andreas Egge Norsk Tipping AS Oslo
Thuestad John G. Yara International ASA Rogaland
Torgersen Line Hødal Eksportfinans ASA Oslo
Trovik Katrine AS Den Nationale Scene Vestland
Trovik Katrine Helse Vest RHF Rogaland
Tuvstein Trond Norges sjømatråd AS Trøndelag
Tvedt Fredriksen Veslemøy Norsk rikskringkasting AS Vestland
Tveit Sveen ElinFiskeri og havbruksnæringens forskningsfinansiering AS
Vestland
SURNAME FIRST NAME COMPANY COUNTY OF RESIDENCE
Tørklep Christine Statskog SF Viken
Ulriksen Arve Siva – Selskapet for Industrivekst SF Nordland
Undeli Johnny Store Norske Spitsbergen Kulkompani AS Domestic
Valle Paul S. Helse MidtNorge RHF Møre og Romsdal
van der Veer Jeroen Equinor ASA Abroad
Vestre Knut Helge Norges sjømatråd AS Møre og Romsdal
Viksaas Grete Telenor ASA Oslo
Vinje Kristin Universitetssenteret på Svalbard AS Oslo
Vågeng Sigrun E. Helse SørØst RHF Oslo
Walderhaug Morten Rogaland Teater AS Oslo
Weiby Gregersen Øyvind Universitetssenteret på
Svalbard AS Trøndelag
Westby Stine Andøya Space Center AS Viken
Westby Einar GIEK Kredittforsikring AS Oslo
Westbye Linda Vøllestad Norsk Tipping AS Vestland
Widvey Thorhild Statkraft SF Oslo
Wieland Kristin Weidemann Norsk Helsenett SF Oslo
Wiinholt Marianne Norsk Hydro ASA Abroad
Willand Sarah Den Norske Opera & Ballett AS Viken
Winje Tone Nationaltheatret AS Troms og Finnmark
Wærness Eirik Innovasjon Norge Rogaland
Wærsted Gunn Petoro AS Oslo
Wærsted Gunn Telenor ASA Oslo
Økland Hege Enova SF Vestland
Østby Heine Siva – Selskapet for Industrivekst SF Agder
Østbø Bjørn T. Siva – Selskapet for Industrivekst SF Vestland
Østensjø Inger Lise Rogaland Teater AS Oslo
Owner-appointed and shareholder-elected board members Overview as of 31 March 2020. Sorted alphabetically by surname
Appendices146

Photo: Øyvind Sæ
tre, Gassco
147

Ministry of FinanceTelephone: +47 22 24 90 90
Department of Asset ManagementFolketrygdfondet
Ministry of DefenceTelephone: +47 23 09 80 00
Department of Finance and ManagementRygge 1 AS
Ministry of Health and Care ServicesTelephone: +47 22 24 90 90
Department of Hospital OwnershipHelse Midt-Norge RHF, Helse Nord RHF, Helse Sør-Øst RHF, Helse Vest RHF and Norsk Helsenett SF
Department of Public HealthAS Vinmonopolet
Department of Municipal Health Care ServicesNordisk Institutt for Odontologiske Materialer AS
Ministry of Climate and EnvironmentTelephone: +47 22 24 90 90
Marine and Pollution DepartmentBjørnøen AS, Kings Bay AS
Climate DepartmentEnova SF
Contact details
The State’s direct ownership is administered by a number of ministries. Contact details for these ministries are given below.
Ministry of Local Government and ModernisationTelephone: +47 22 24 90 90
Department of Local GovernmentKommunalbanken AS
Ministry of CultureTelephone: +47 22 24 90 90
Department of Media and ArtCarte Blanche AS, AS Den Nationale Scene, Den Norske Opera & Ballett AS, Filmparken AS, Nationaltheatret AS, Norsk rikskringkasting AS, Norsk Tipping AS, Rogaland Teater AS, Rosenkrantzgate 10 AS, Talent Norge AS,Trøndelag Teater AS
Ministry of Education and ResearchTelephone: +47 22 24 90 90
Department for Governance of Higher Education and Research InstitutionsNSD – Norsk senter for forskningsdata AS,Simula Research Laboratory AS, Universitetssenteret på Svalbard AS
Ministry of Agriculture and FoodTelephone: +47 22 24 90 90
Department of Research and Administrative AffairsStaur gård AS
Department of Food PolicyKimen Såvarelaboratoriet AS
Department of Forest and Natural Resource PolicyGraminor AS, Statskog SF
Appendices148

Ministry of Trade, Industry and FisheriesTelephone: +47 22 24 90 90
Ownership DepartmentAker Kværner Holding AS, Ambita AS,Argentum Fondsinvesteringer AS, Baneservice AS, DNB ASA, Eksportfinans ASA, Electronic Chart Centre AS, Entra ASA, Flytoget AS, GIEK Kredittforsikring AS, Investinor AS, Kongsberg Gruppen ASA, Mesta AS, Mantena AS, Nammo AS, Norsk Hydro ASA, Nysnø Klimainvesteringer AS, Posten Norge AS, Statkraft SF, Store Norske Spitsbergen Kulkompani AS, Telenor ASA, Yara International ASA
Research and Innovation DepartmentAndøya Space Center AS, Fiskeri- og havbruksnæringens forskningsfinansiering AS, Innovasjon Norge, Nofima AS, Siva – Selskapet for Industrivekst SF, Space Norway AS
Trade Policy DepartmentEksportkreditt Norge AS, Norges sjømatråd AS
Ministry of Petroleum and EnergyTelephone: +47 22 24 90 90
Climate, Industry and Technology DepartmentGassnova SF
Energy and Water Resources DepartmentStatnett SF
Oil and Gas DepartmentGassco AS
Department for Economic and Administrative AffairsEquinor ASA, Petoro AS
Ministry of TransportTelephone: +47 22 24 90 90
Department of Management, Administration and Public Safety and SecurityAvinor AS, Bane NOR SF, Entur AS, Norske tog AS, Nye Veier AS, Vygruppen AS
Ministry of Foreign AffairsTelephone: +47 23 95 00 00
Department for Economic Relations and DevelopmentNorfund
Appendices 149
THE STATEOWNERSHIP
REPORT2019
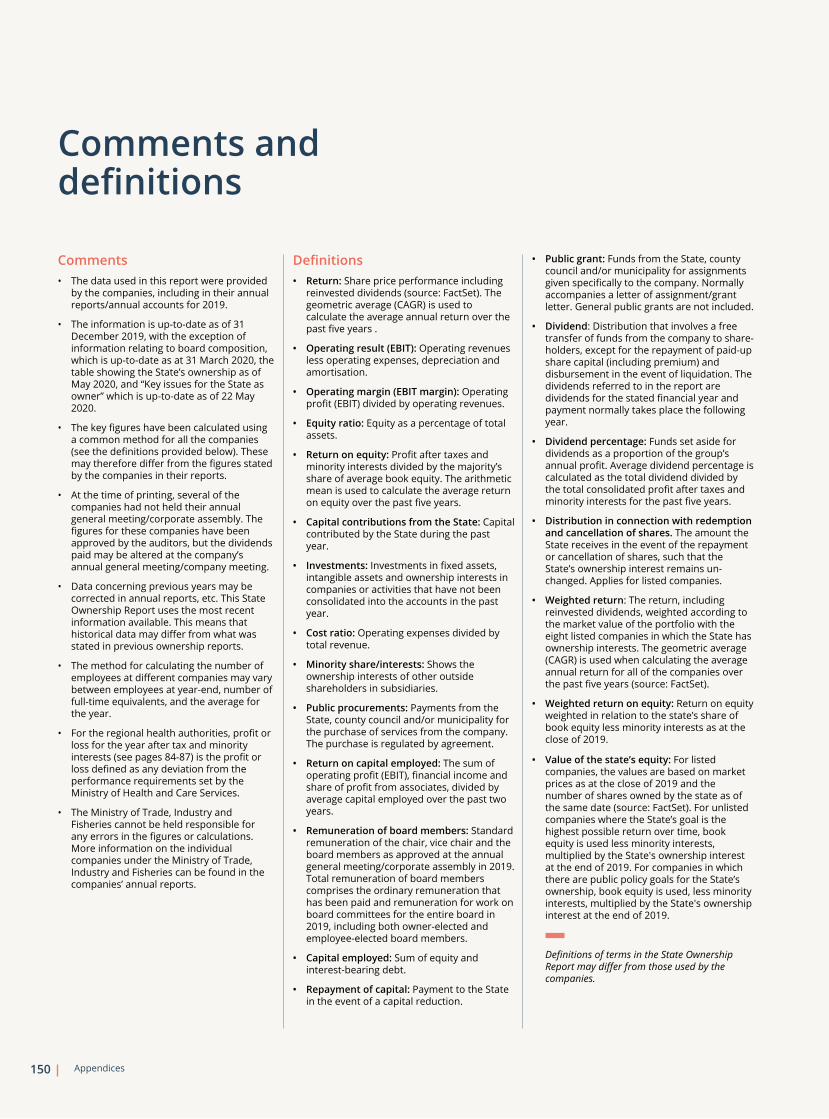
Comments• The data used in this report were provided
by the companies, including in their annual reports/annual accounts for 2019.
• The information is uptodate as of 31 December 2019, with the exception of information relating to board composition, which is uptodate as at 31 March 2020, the table showing the State’s ownership as of May 2020, and “Key issues for the State as owner” which is uptodate as of 22 May 2020.
• The key figures have been calculated using a common method for all the companies (see the definitions provided below). These may therefore differ from the figures stated by the companies in their reports.
• At the time of printing, several of the companies had not held their annual general meeting/corporate assembly. The figures for these companies have been approved by the auditors, but the dividends paid may be altered at the company’s annual general meeting/company meeting.
• Data concerning previous years may be corrected in annual reports, etc. This State Ownership Report uses the most recent information available. This means that historical data may differ from what was stated in previous ownership reports.
• The method for calculating the number of employees at different companies may vary between employees at yearend, number of fulltime equivalents, and the average for the year.
• For the regional health authorities, profit or loss for the year after tax and minority interests (see pages 8487) is the profit or loss defined as any deviation from the performance requirements set by the Ministry of Health and Care Services.
• The Ministry of Trade, Industry and Fisheries cannot be held responsible for any errors in the figures or calculations. More information on the individual companies under the Ministry of Trade, Industry and Fisheries can be found in the companies’ annual reports.
Comments and definitions
Definitions• Return: Share price performance including
reinvested dividends (source: FactSet). The geometric average (CAGR) is used to calculate the average annual return over the past five years .
• Operating result (EBIT): Operating revenues less operating expenses, depreciation and amortisation.
• Operating margin (EBIT margin): Operating profit (EBIT) divided by operating revenues.
• Equity ratio: Equity as a percentage of total assets.
• Return on equity: Profit after taxes and minority interests divided by the majority’s share of average book equity. The arithmetic mean is used to calculate the average return on equity over the past five years.
• Capital contributions from the State: Capital contributed by the State during the past year.
• Investments: Investments in fixed assets, intangible assets and ownership interests in companies or activities that have not been consolidated into the accounts in the past year.
• Cost ratio: Operating expenses divided by total revenue.
• Minority share/interests: Shows the ownership interests of other outside shareholders in subsidiaries.
• Public procurements: Payments from the State, county council and/or municipality for the purchase of services from the company. The purchase is regulated by agreement.
• Return on capital employed: The sum of operating profit (EBIT), financial income and share of profit from associates, divided by average capital employed over the past two years.
• Remuneration of board members: Standard remuneration of the chair, vice chair and the board members as approved at the annual general meeting/corporate assembly in 2019. Total remuneration of board members comprises the ordinary remuneration that has been paid and remuneration for work on board committees for the entire board in 2019, including both ownerelected and employeeelected board members.
• Capital employed: Sum of equity and interestbearing debt.
• Repayment of capital: Payment to the State in the event of a capital reduction.
• Public grant: Funds from the State, county council and/or municipality for assignments given specifically to the company. Normally accompanies a letter of assignment/grant letter. General public grants are not included.
• Dividend: Distribution that involves a free transfer of funds from the company to shareholders, except for the repayment of paidup share capital (including premium) and disbursement in the event of liquidation. The dividends referred to in the report are dividends for the stated financial year and payment normally takes place the following year.
• Dividend percentage: Funds set aside for dividends as a proportion of the group’s annual profit. Average dividend percentage is calculated as the total dividend divided by the total consolidated profit after taxes and minority interests for the past five years.
• Distribution in connection with redemption and cancellation of shares. The amount the State receives in the event of the repayment or cancellation of shares, such that the State’s ownership interest remains unchanged. Applies for listed companies.
• Weighted return: The return, including reinvested dividends, weighted according to the market value of the portfolio with the eight listed companies in which the State has ownership interests. The geometric average (CAGR) is used when calculating the average annual return for all of the companies over the past five years (source: FactSet).
• Weighted return on equity: Return on equity weighted in relation to the state’s share of book equity less minority interests as at the close of 2019.
• Value of the state’s equity: For listed companies, the values are based on market prices as at the close of 2019 and the number of shares owned by the state as of the same date (source: FactSet). For unlisted companies where the State’s goal is the highest possible return over time, book equity is used less minority interests, multiplied by the State's ownership interest at the end of 2019. For companies in which there are public policy goals for the State’s ownership, book equity is used, less minority interests, multiplied by the State's ownership interest at the end of 2019.
Definitions of terms in the State Ownership Report may differ from those used by the companies.
Appendices150
Published by the Ministry of Trade, Industry and Fisheries
Ordering of publicationsNorwegian Government Security and Service Organisation
www.publikasjoner.dep.noTelephone: 222 40 000
Publications are also available atwww.regjeringen.no
Design and layoutAnagram Design as
Printing: Norwegian Government Security and Service Organisation06/2020 – print run 100
W-0034 E
eierskap.no