State Ownership of Financial Institutions in Europe and...
58
Policy Research Working Paper 8288 State Ownership of Financial Institutions in Europe and Central Asia Aurora Ferrari Davide S. Mare Ilias Skamnelos Development Research Group Finance and Private Sector Development Team & Finance and Markets Global Practice Group December 2017 WPS8288 Public Disclosure Authorized Public Disclosure Authorized Public Disclosure Authorized Public Disclosure Authorized
-
Upload
hoangxuyen -
Category
Documents
-
view
216 -
download
2
Transcript of State Ownership of Financial Institutions in Europe and...

Policy Research Working Paper 8288
State Ownership of Financial Institutions in Europe and Central Asia
Aurora FerrariDavide S. MareIlias Skamnelos
Development Research GroupFinance and Private Sector Development Team &Finance and Markets Global Practice GroupDecember 2017
WPS8288P
ublic
Dis
clos
ure
Aut
horiz
edP
ublic
Dis
clos
ure
Aut
horiz
edP
ublic
Dis
clos
ure
Aut
horiz
edP
ublic
Dis
clos
ure
Aut
horiz
ed

Produced by the Research Support Team
Abstract
The Policy Research Working Paper Series disseminates the findings of work in progress to encourage the exchange of ideas about development issues. An objective of the series is to get the findings out quickly, even if the presentations are less than fully polished. The papers carry the names of the authors and should be cited accordingly. The findings, interpretations, and conclusions expressed in this paper are entirely those of the authors. They do not necessarily represent the views of the International Bank for Reconstruction and Development/World Bank and its affiliated organizations, or those of the Executive Directors of the World Bank or the governments they represent.
Policy Research Working Paper 8288
This paper is a product of the Finance and Private Sector Development Team, Development Research Group and the Finance and Markets Global Practice Group. It is part of a larger effort by the World Bank to provide open access to its research and make a contribution to development policy discussions around the world. Policy Research Working Papers are also posted on the Web at http://econ.worldbank.org. The authors may be contacted at [email protected].
This paper introduces key findings from a new cross-coun-try survey on state-owned financial institutions in Europe and Central Asia. It covers 41 such institutions operat-ing in the region as of end 2016, and considers variables in the areas of mandates, instruments, performance,
governance, and monitoring/evaluation. It presents results over the period following the global financial crisis up to 2015, distinguishes between state-owned commer-cial and development financial institutions, and looks at differences among three geographical sub-regions.

State Ownership of Financial Institutions
in Europe and Central Asia
Aurora Ferrari
Davide S. Mare #
Ilias Skamnelos
Keywords: Government-owned financial institutions; Performance; Banking; Europe
and Central Asia; Investment Plan for Europe.
JEL Classification: G21, G28, H81
# Corresponding author: [email protected]. Aurora Ferrari is Practice Manager at the World Bank; Davide S. Mare is a researcher with the World Bank Development Research Group and Lecturer at the University of Edinburgh Business School; Ilias Skamnelos is Lead Financial Sector Economist with the World Bank. This paper’s findings, interpretations, and conclusions are entirely those of the authors and do not necessarily represent the views of the institutions they represent, the World Bank and its Executive Directors, or the countries they represent.

1
TableofContents
1 Introduction ...................................................................................................................... 3
2 Justification and criticisms of state ownership ................................................................. 5
3 A typology of SOFIs’ institutional set-up and instruments.............................................. 7
4 Sample and classification ................................................................................................. 9
5 Survey responses ............................................................................................................ 11
5.1 General information .................................................................................................12
5.2 Accountability, mandate, and objectives .................................................................14
5.3 Instruments and portfolio .........................................................................................19
5.4 Financial structure and performance ........................................................................26
5.5 Corporate governance ..............................................................................................34
5.6 Monitoring and evaluation .......................................................................................38
6 Concluding remarks ....................................................................................................... 41
Acknowledgements ............................................................................................................. 44
References ........................................................................................................................... 45
Appendix I: The survey questionnaire ................................................................................ 48
Appendix II: Participating institutions ................................................................................ 55
2
ListofFigures
Figure 1: Number of survey respondents by geographic region and type ........................... 11
Figure 2: General information ............................................................................................. 13
Figure 3: Accountability ...................................................................................................... 15
Figure 4: Mandate and objectives ........................................................................................ 16
Figure 5: Most important target market (2015) ................................................................... 18
Figure 6: Instruments ........................................................................................................... 19
Figure 7: Product mix and introduction since the crisis (2015) .......................................... 22
Figure 8: Assets and loans growth rates (2007 through 2015) ............................................ 23
Figure 9: Ranking of lending by economic sector (2015) ................................................... 25
Figure 10: Median lending to SOEs (2015) ........................................................................ 26
Figure 11: Financing structure (2015) ................................................................................. 27
Figure 12: Profitability (2007 through 2015) ...................................................................... 29
Figure 13: Non-performing loans (2007 through 2015) ...................................................... 32
Figure 14: Capital adequacy ratios and recapitalizations (2007 through 2015) .................. 34
Figure 15: Supervisory Board and Chairman ...................................................................... 35
Figure 16: Formal minimum qualification criteria .............................................................. 36
Figure 17: Corporate governance and risk management framework .................................. 38
Figure 18: Accountability and monitoring features ............................................................. 39
Figure 19: Monitoring and evaluation features ................................................................... 40
ListofTables
Table 1: State intervention rationale ...................................................................................... 6
Table 2: Typology of SOFIs’ institutional set-up .................................................................. 8
Table 3: Typology of SOFIs instruments .............................................................................. 9
Table 4: Number of survey respondents by country and weight in the financial sector ..... 10

3
1 Introduction
The 2008 Global Financial Crisis (GFC) has prodded policy makers to reconsider the role of
the state in the financial sector, including state ownership of financial institutions. The financial
turmoil prompted extraordinary government intervention, including in addressing a set of market
failures and procyclicality in lending. One type of initiative involved using state-owned financial
institutions (SOFIs) to ramp up financing to the private sector and smooth out the credit supply
over the economic cycle. Nonetheless, the heated and long-standing debate over the rationale for
state intervention and the advantages and shortcomings associated with state ownership in finance
has continued. On one hand, such state intervention can be beneficial to address domestic market
failures, achieve social/ developmental goals (positive externalities) and mitigate procyclicality in
lending. Conversely, political capture, inefficiencies and inherent contradictions between a profit
oriented banking mandate and a social/ developmental policy mandate are often deemed as evident
shortcomings of state-ownership in the financial sector. Yet data on SOFIs are sparse and
inadequate to assess and evaluate some important aspects of their operations such as mandates,
instruments, performance, governance and monitoring.
Europe and Central Asia (ECA) is a region that offers interesting insights on the debate (see
Box 1 on a historical perspective).1 Prior to the financial crisis, several countries in the western
part of ECA encouraged a high degree of foreign entry in their banking sectors to increase access
to finance based on funding from foreign parents, improve stability and overall banking efficiency
through spillovers to domestic banks, and prepare for joining the European Union. In parallel, the
creation of a single European market led to a decrease in direct support to national economies in
the member states of the European Union and a limitation on direct government intervention. As
the regulatory powers of the European Commission (EC) increased, SOFIs in the western part of
Europe have come under increased scrutiny and have started relying more on market financing to
avoid violating state aid rules. By contrast, as they transitioned from planned to market economies,
several countries in the eastern part of ECA did not manage to attract foreign investors and actively
pursued a high degree of domestic and (often) state ownership in their financial systems. A
1 According to the World Bank definition (see for instance Gould and Melecky, 2017), the countries included in ECA are: Albania, Armenia, Austria, Azerbaijan, Belarus, Belgium, Bosnia and Herzegovina, Bulgaria, Croatia, Cyprus, Czech Republic, Denmark, Estonia, Finland, France, Georgia, Germany, Greece, Hungary, Iceland, Ireland, Italy, Kazakhstan, Kosovo, Kyrgyzstan, Latvia, Lithuania, Luxembourg, Macedonia, Moldova, Montenegro, Netherlands, Northern Cyprus, Norway, Poland, Portugal, Republic of Serbia, Romania, Russian Federation, Slovak Republic, Slovenia, Spain, Sweden, Switzerland, Tajikistan, Turkey, Turkmenistan, Ukraine, United Kingdom, Uzbekistan.

4
gradualist approach to financial sector reform proved more challenging than the privatization of
state-owned enterprises, trade and foreign exchange reforms, and price liberalization (Roaf et al.,
2014) – this reflected (in part) the high prevalence of non-performing loans (NPLs) and
unsuccessful privatizations, leading to the emergence of strong domestic interests. In addition, the
belief that some national control over the banking system was important for national security
limited political support for reform.
The GFC sparked a vivid debate among policy makers in ECA, particularly in the western
part of the region. With the high costs associated with the bail-out of privately owned financial
institutions, quantitative easing appearing to have little impact on economic growth (either failing
to expand banks’ lending portfolio or lending failing to target recipients with high propensity to
Box 1. SOFIs’ historical context in ECA
SOFIs in ECA have a long and tangled history intertwined with the major economic and political developments in the continent - ranging from the transformation of economic systems in the 1990s, to the call for SOFIs to play a significant counter-cyclical role during the GFC.
While state ownership in the western part of ECA could be traced back to efforts of public officials in the middle ages to respond to the punitive consequences of debt default creating periodic social instability, state banking became firmly established with the industrial revolution in the early 20th century. The postwar period saw a rapid expansion for a variety of reasons – from delivering banking services where none existed or developing infrastructure, to supporting militaristic goals, countering foreign dominance, or funding the government. By the 1970s, state ownership in western part of ECA ranged from 75 percent in Italy to 20 percent in Sweden, while the eastern part of ECA was almost entirely state owned.
In the past few decades, state ownership of financial institutions in ECA was, once again, jolted by global and idiosyncratic events. Market liberalization decreased state intervention in the financial sector globally and in ECA – in the eastern part of the region this took place in the context of an overall transition from planned to market economies, while in the western part of the region the process of joining the European Union (EU) emerged as the most influential driver of economic reforms.
The EU (and the process of joining the EU) fundamentally changed SOFIs. SOFIs were an alternative instrument for governments to provide support to national economies, as the number of policy tools decreased. At the same time, SOFIs were reformed in line with neoliberal policies, increasingly turning to capital markets to raise funds and the private sector to co-finance projects, while new products were introduced and governance was reformed. Concurrently, SOFIs co-existed with EU funded development programs, primarily in the form of grants.
The GFC and the oil price collapse have been the latest ‘shocks’ in the history of SOFIs in ECA. Like elsewhere, these were called upon to support credit growth as private sector bank lending came to a halt. In the western part of ECA, the sovereign debt crisis (aided by the zero-risk weight of sovereign bonds under the Basel capital requirement framework) also resulted in many SOFIs playing an active role in supporting government debt markets (De Marco and Macchiavelli, 2016). At the same time, in an attempt to promote a revival of the European economy and to spur the creation of a capital market union, the EC launched an investment plan under which EU resources can be utilized by SOFIs to crowd in private capital and SOFIs are encouraged to create special purpose vehicles to promote securitization and the deepening of capital markets.

5
consume), and many countries facing tightening fiscal constraints, policy makers increasingly
explored SOFIs as potential countercyclical instruments. For example, in the UK the publicly-
owned British Business Bank was established to assist smaller businesses and Green Investment
Bank to support and expand green investment. In the European Union, the Investment Plan for
Europe (also known as the “Juncker Plan”) entailed a prominent role for “National Promotional
Banks” induced to intermediate resources from the European Fund for Strategic Investments.2 At
the same time, state-owned banks, like Poland’s PKO BP, expanded credit at a faster pace than
private banks did. In this case, this was possible due to the bank’s conservative funding structure
that made it less dependent on wholesale funding than foreign-owned subsidiaries, which
controlled almost 75 percent of the banking system.
Given the renewed interest in SOFIs in ECA and beyond as a consequence of the GFC (and
the more recent 2014 oil price shock), we try to take stock and analyze state-ownership in the
financial sector by collecting information on SOFIs headquartered in ECA through a questionnaire.
We provide a disaggregated picture and its evolution over time for several SOFIs’ characteristics
such as mandates, instruments, performance, governance and monitoring/ evaluation. Our work
provides a comparison among different SOFI types and their key features and an understanding of
their evolution over time. The data also permit, with certain limitations, a better understanding of
trends and factors involved within sub-regions in ECA. While it may not answer them directly, the
survey also offers insights on questions such as the ECA SOFIs’ countercyclical performance, or
how conducive might EU SOFIs’ operations be for achieving the European Commission’s vision.3
The remainder of the paper proceeds as follows: Sections 2 provides the justification and
criticisms of state ownership in the financial sector, Section 3 defines a typology of SOFIs’
institutional set-up and their instruments, Section 4 illustrates the sample and different
classifications pursued, Section 5 discusses the survey responses, and Section 6 concludes.
2 Justification and criticisms of state ownership
Governments justify state ownership in the financial sector based on different grounds (see
Table 1). A frequently used justification in the academic literature is the effort to address a set of
market failures (World Bank, 2012; Cull, Martinez Peria, and Verrier, 2017). These can be
2 Likewise, in the United States, a heated debate erupted over introducing public banks modeled after the Bank of North Dakota. 3 See European Commission, 2015.

6
summarized as asymmetric information problems and externalities. State intervention has also
been justified based on its contribution to social goals, by financing projects with negative net
present value but with positive social returns (Levy-Yeyati, Micco, and Panizza, 2004), on the
ability to overcome coordination failures (de la Torre, Gozzi and Schmukler, 2017), or as a way to
promote competition in the financial sector. The recent literature has also identified the important
countercyclical and safe haven role that SOFIs can play during financial crises or economic
recessions.4 Although not frequently reflected in academic literature, governments have also
promoted SOFIs as world-class champions—a matter of national pride and global outreach—or
simply as a source of returns through their shareholding position. Notably, SOFIs may frequently
change their mandate or focus, whether because the underlying market failure has been overcome,
or because policy makers have attached different weights among competing social/ developmental
priorities.5
Table 1: State intervention rationale
State Intervention Rationale Example (i) Market failures, leading to lack of competition and underserved segments. Financing financially profitable projects that do not get financed due to market failures (e.g. asymmetric information).
SMEs, Agriculture, R&D and capital intensive sectors. International trade. Long term finance (including infrastructure). Broader commercial banking.
(ii) Social/ developmental goals. Financing financially unprofitable projects that are socially valuable. This includes socio-economic, environmental and other goals.
Rural and isolated areas.
(iii) Countercyclical/ safe haven. Financing financially profitable projects that do not get financed when private bank risk appetite overreacts to recessions. Reduce employment volatility. Provide safe haven for depositor flight and contagion circuit breaker during crisis.
Labor-intensive sectors. Wide geographic branch presence. Broader commercial banking.
(iv) State champions. Promoting the creation of globally relevant institutions as a matter of national pride and global outreach.
Broader commercial banking.
(v) Return. Provide returns to the state as shareholder. Broader commercial banking.
Several studies also convey the criticisms of state ownership in the financial sector. Agency
problems may exacerbate the efficient delivery of financial products and services (Shleifer and
4 World Bank, 2012; Rudolph, 2009; Micco and Panizza, 2006; Bertay, Demirgüç-Kunt, and Huizinga, 2015; Choi et al., 2016; Coleman and Feler, 2015; Brei and Schclarek, 2013. Nonetheless, evidence on the countercyclical role of banks is mixed (Luna-Martinez and Vicente, 2012; Cull and Peria, 2013) and, if credit allocation is poor, SOFIs’ countercyclical role becomes questionable (Bertay, Demirgüç-Kunt, and Huizinga, 2015; Coleman and Feler, 2015). 5 A recent emerging research agenda combines diverse theories to propose a new framework to understand the motives behind state intervention and how this intervention is formulated, enacted and evaluated (see for instance Mazzucato and Penna, 2016).
7
Vishny, 1998; Iannotta, Nocera, and Sironi, 2007; Dinç, 2005; Acharya et al., 2010, Iannotta et al.
2013), hurting banking system performance (Barth, Caprio, and Levine, 2006). These arguments
emphasize the need to resolve the underlying market failure directly - for example, credit or
collateral information weaknesses should be addressed by strengthening the country’s financial
infrastructure, and long-term finance should be promoted by reforms related to capital markets and
institutional investors.6
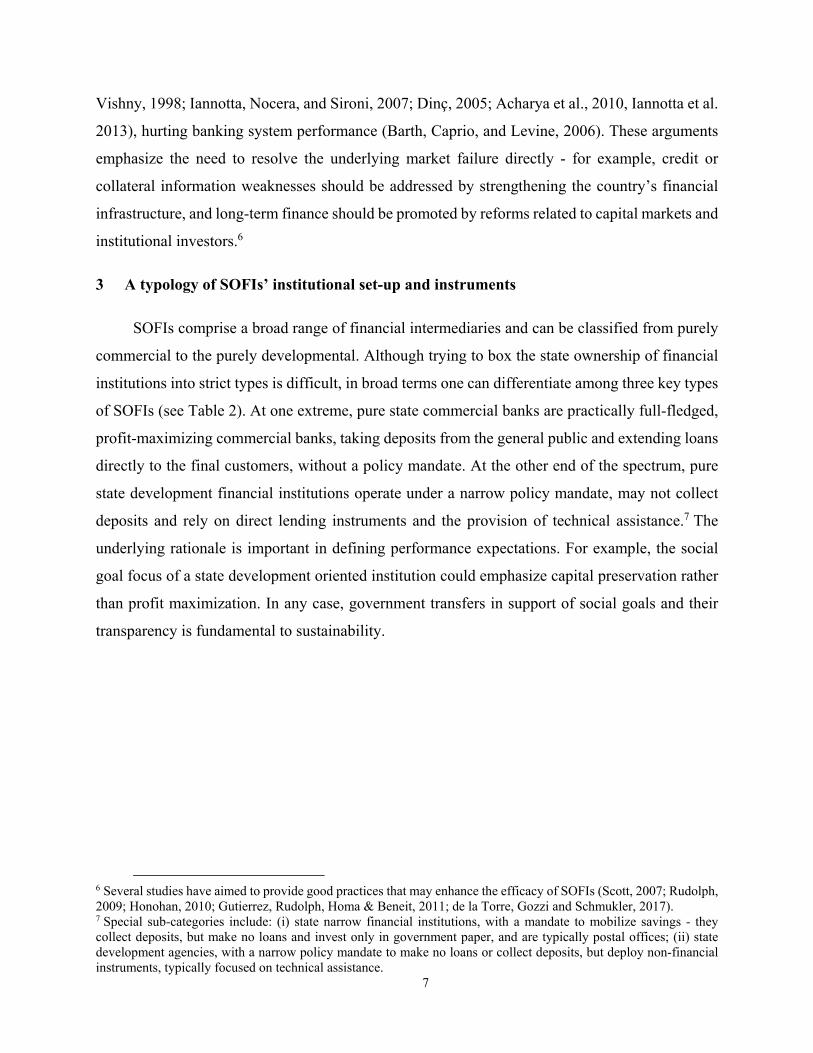
3 A typology of SOFIs’ institutional set-up and instruments
SOFIs comprise a broad range of financial intermediaries and can be classified from purely
commercial to the purely developmental. Although trying to box the state ownership of financial
institutions into strict types is difficult, in broad terms one can differentiate among three key types
of SOFIs (see Table 2). At one extreme, pure state commercial banks are practically full-fledged,
profit-maximizing commercial banks, taking deposits from the general public and extending loans
directly to the final customers, without a policy mandate. At the other end of the spectrum, pure
state development financial institutions operate under a narrow policy mandate, may not collect
deposits and rely on direct lending instruments and the provision of technical assistance.7 The
underlying rationale is important in defining performance expectations. For example, the social
goal focus of a state development oriented institution could emphasize capital preservation rather
than profit maximization. In any case, government transfers in support of social goals and their
transparency is fundamental to sustainability.
6 Several studies have aimed to provide good practices that may enhance the efficacy of SOFIs (Scott, 2007; Rudolph, 2009; Honohan, 2010; Gutierrez, Rudolph, Homa & Beneit, 2011; de la Torre, Gozzi and Schmukler, 2017). 7 Special sub-categories include: (i) state narrow financial institutions, with a mandate to mobilize savings - they collect deposits, but make no loans and invest only in government paper, and are typically postal offices; (ii) state development agencies, with a narrow policy mandate to make no loans or collect deposits, but deploy non-financial instruments, typically focused on technical assistance.

8
Table 2: Typology of SOFIs’ institutional set-up
Typology State Intervention Rationale
(i) State commercial banks. They do not have a policy mandate, and are profit maximizers with operations practically indistinguishable from those of private commercial banks. They collect deposits from the public and use them to lend directly to firms and individuals. In many cases, they are universal banks - directly or through affiliates.
(i) Return; (ii) Countercyclical/ safe haven; (iii) Competition; (iv) State champions
(ii) State hybrid banks. They have a policy mandate, and perform commercial banking activities. They collect deposits from the public and use them to lend directly to firms and individuals. They act as a government agent in administering state subsidies and other programs.
(i) Return; (ii) Countercyclical/ safe haven; (iii) Competition; (iv) State champions; (v) Market failures; (vi) Social goals
(iii) State development financial institutions. They have a policy mandate, usually do not take deposits and are funded by international financial institutions (IFIs), bonds or government transfers. They lend directly or on-lend to firms in specific sectors (SMEs, exports, agriculture, etc.), as well as deploy partial credit guarantee schemes or other financial instruments.
(i) Market failures; (ii) Social goals; (iii) Countercyclical
Table 3 summarizes a range of financial instruments. The selection of instruments by SOFIs
should depend on the intervention rationale, while the structure and degree of institutional
development of the country’s financial system is an important determinant. In general, direct
lending by state development-oriented institutions should be undertaken in market segments (e.g.
client type, location, maturity, underlying security etc.) not covered by the private sector.
Importantly, direct lending requires highly specialized risk management, strong credit
underwriting skills, and operational efficiency. On-lending by state development-oriented
institutions through other financial intermediaries, on the other hand, limits the scope for political
interference and competition distortion, and enables the channeling of a higher volume of
resources at lower costs by leveraging the infrastructure of other institutions. Risk-sharing facilities
are another indirect and market-friendly means of state intervention, with the additional benefit of
further leveraging public resources. Capacity building and training programs for existing and
prospective clients (financial intermediaries and ultimate beneficiaries) can increase the
sustainability of state financing.

9
Table 3: Typology of SOFIs instruments
Typology Benefits (i) Direct lending (also known as first-tier, retail). Direct provision of finance to the ultimate beneficiary. Finance can be a regular loan, leasing, or factoring.
Targeted approach, when ultimate beneficiary or location is too expensive for private financial intermediaries to serve.
(ii) On-lending (also known as second-tier, wholesale, apex). On-lending to financial intermediaries for their direct provision of finance to the ultimate beneficiary. Finance can be a loan, leasing, or factoring.
Lower cost and risk management burden. Limited scope for political interference and market distortion. Can promote competition among private sector participating institutions and lead to higher demonstration effect.
(iii) Partial credit guarantee schemes (also known as risk sharing facilities). Offering of partial credit guarantees that partially offset loan losses by private financial intermediaries upon the ultimate beneficiary’s default (e.g. infrastructure projects, MSMEs, gender targeting etc.).
Leverage public resources. Alleviate enterprise collateral constraints, reduce project risk, and financial intermediary risk aversion.
(iv) Grants. Direct or indirect (through third parties) provision of grants.
Achieve socially desired objectives, ensure equitable income distribution.
(v) Other financial products, such as venture capital and equity financing.
Typically deployed to develop segments of the capital markets. Targeting seed start-up and early stage enterprises.
(vi) Non-financial products. Offering advisory services, capacity building, training programs to financial intermediaries or ultimate beneficiaries, or market creation services such as reverse factoring platforms.
Strengthen financial intermediaries or ultimate beneficiaries, typically complemented by financing.
4 Sample and classification
The survey (see Appendix 1) covers a broad range of financial institutions that are
government-owned and operate in ECA.8 Government ownership is defined as ownership above
50 percent (e.g. plus 1 share with voting rights). The sample includes 41 institutions distributed
across 21 countries (see Appendix II). Quantitative information is gathered at three points in time:
2007, 2011 and 2015. It is worth mentioning that some results should be interpreted with caution,
as the sample representation in terms of sector assets or state ownership in the sector varies
considerably.
8 It excludes SOFIs that were nationalized during the GFC (or other recent crises) and the authorities’ policy intention is to privatize them in the short to medium term.

10
Table 4: Number of survey respondents by country and weight in the financial sector
Country EU (Y/N)
Assigned geography
Number of Institutions
% country banking assets
% of country state owned
banking assets
% country banking
loans Bosnia and Herz. N West ECA 3 9.4 100.0 10.3 Bulgaria Y West ECA 2 3.2 100.0 2.6 Croatia Y West ECA 1 6.6 39.5 1.5 Czech Rep. Y West ECA 1 <1 25.9 <1 France Y Benchmark Europe 2 <1 20.2 1.9 Germany Y Benchmark Europe 3 4.8 14.0 7.8 Hungary Y West ECA 2 3.7 100.0 3.3 Kyrgyz Rep. N East ECA 2 18.6 100.0 20.0 Latvia Y Benchmark Europe 1 1.3 73.7 1.0 Macedonia Y West ECA 1 4.0 100.0 5.7 Netherlands Y Benchmark Europe 2 3.6 16.3 2.8 Poland Y West ECA 1 2.6 60.7 2.4 Portugal Y Benchmark Europe 1 25.9 89.1 32.7 Rep. of Belarus N East ECA 3 5.1 80.1 3.1 Romania Y West ECA 2 7.9 100.0 7.2 Russian Federation N East ECA 3 23.1 39.5 7.3 Slovenia Y West ECA 1 43.4 82.4 85.7 Spain Y Benchmark Europe 2 1.8 36.1 2.3 Turkey N West ECA 4 11.6 55.7 13.4 Ukraine N East ECA 3 11.5 98.6 10.7 United Kingdom Y Benchmark Europe 1 <1 0.1 <1 Total 41
Note: Figures as of end 2015. Denominators for % country banking assets, % of country state owned banking assets, and % country banking loans refer to the banking sector. Nonetheless, almost 80 percent of SOFIs in our sample have a banking license.
We assign each institution to one of three granular geographic areas (see Table 4) –
Benchmark Europe, West ECA and East ECA. The West ECA sample holds the highest number
of SOFIs (18), followed by Benchmark Europe (12), and East ECA (11). We also delineate among
EU and non-EU countries, but report on this classification only when a significant relationship is
observed. The sample includes 22 SOFIs in EU countries, and 19 in non-EU countries.
Given the survey sample and to facilitate comparisons, we collapse the SOFIs typology of
Table 2 into two groups: Commercial SOFIs includes Table 2’s commercial and hybrid banks, and
Development SOFIs corresponds to Table 2’s development financial institutions. In practice, the
former group includes institutions that may or may not have a policy mandate, but perform mainly
commercial banking activities including the collection of retail deposits; the latter group is
composed of institutions that have a policy mandate and do not collect retail deposits, as well as
institutions that support the internationalization efforts of firms and international trade and

11
investment (i.e., an Exim function). Overall, as reported in Figure 1, 15 institutions have been
classified as Commercial SOFIs and 26 as Development SOFIs.9
Figure 1: Number of survey respondents by geographic region and type
By EU and non-EU regions By more granular regions
Notably, Development SOFIs dominate the EU countries sample. In addition, Development
SOFIs make up more than 80 and 60 percent of the sample in Benchmark Europe and West ECA
respectively, while Commercial SOFIs account for more than 60 percent of the East ECA sample.
As a consequence, the geographic cut of the survey results needs to be interpreted under the right
lens - results for EU are driven by Development SOFIs; and, looking at the more granular
categorization, Benchmark Europe and West ECA are mainly driven by Development SOFIs,
while East ECA by Commercial SOFIs.
5 Survey responses
Data are primarily presented by type of SOFI and, whenever relevant, by geographic region.
In most figures, percentages refer to the number of institutions within the reported category that
answered yes to the specific survey question.
9 Notice that two Development SOFIs accept retail deposits, have a social objective and are not profit maximizers (one of them performs the Exim function).
17
5
9
10
0 5 10 15 20frequency
EU
Non-EU
Development
Commercial
Development
Commercial
10
2
12
6
4
7
0 5 10 15frequency
Benchmark Europe
WEST ECA
EAST ECA
Development
Commercial
Development
Commercial
Development
Commercial

12
5.1 General information
Figure 2 reports information on the year of establishment, structural characteristics, legal
status and ownership, licensing and regulation. Institutions included in the sample were established
at different points in time, with the oldest created more than a century ago and the newest having
less than a decade of history. In terms of historical context, one could expect that the liberalization
policies that followed the collapse of the Soviet Union would result in limited establishment of
SOFIs in the period from 1990 up to the GFC, when interest in SOFIs was renewed. Nevertheless,
over 60 percent of the SOFIs in the sample were created since 1990. Among the four post-GFC
created SOFIs (i.e. after 2007), three were established in Benchmark Europe and one in East ECA,
and all of them were Development SOFIs. While almost an equal number of Commercial SOFIs
was established before and after 1990, the number of Development SOFIs increases over time -
eight were established before 1990, and 18 after 1990 (of which four after 2007). Notably,
Commercial SOFIs are less (but, nevertheless, highly) likely to have been state-owned since their
establishment.
In 60 percent of the surveyed SOFIs, there is a single shareholder (mostly driven by West
and East ECA), while the incidence of at least two shareholders is higher in Benchmark Europe at
about 60 percent. Only 12 percent of SOFIs have at least five shareholders, meaning that the
likelihood of observing disperse ownership is relatively low. For both Commercial and
Development SOFIs, around 60 percent of the institutions are financial groups. Most Commercial
SOFIs have domestic subsidiaries and 40 percent of them have foreign branches/ subsidiaries. A
lower proportion of Development SOFIs has domestic subsidiaries and just two have a foreign
presence (a SOFI with a representative office and a SOFI with Exim functions). Only four
Commercial SOFIs are listed on a stock exchange and there are no listed Development SOFIs.
Reflecting the sample composition, none of the listed SOFIs come from the EU countries or
Benchmark Europe under the more granular geographic cut.

13
Figure 2: General information
2a. Year of establishment By type By granular regions
2b. Structural characteristics By type By granular regions
2c. Legal status and ownership By type By granular regions
05
1015
Commercial Development
Before 1990 1990-2007After 2007
05
10
15
Benchmark Europe EAST ECA WEST ECA
Before 1990 1990-2007After 2007
0%
20%
40%
60%
80%
100
%
Pe
rcen
t Yes
Commercial Development
Financial group Domestic subsidiariesFx branches/subsidiaries Listed
0%
20%
40%
60%
80%
100
%
Pe
rcen
t Yes
Benchmark Europe WEST ECA EAST ECA
Financial group Domestic subsidiariesFx branches/subsidiaries Listed
0%2
0%40
%60
%80
%10
0%
Per
cent
Yes
Commercial Development
Created by Law or Act Always state owned
0%2
0%40
%60
%80
%10
0%
Per
cent
Yes
Benchmark Europe WEST ECA EAST ECA
Created by Law or Act Always state owned

14
2d. Licensing and regulation By type By granular regions
An important aspect of SOFIs’ characteristics is their licensing, especially for institutions
that collect retail deposits and extend loans (i.e. perform financial intermediation). A banking
license may favor the separation of responsibility for exercising ownership and for regulatory and
supervisory duties (Scott, 2007). Among the sample, more Development SOFIs were created by
law or act, and have always been state-owned. All Commercial SOFIs in the sample have a banking
license and are subject to commercial banking law and the prudential supervision of the banking
supervisory authority (with, on average, onsite inspections twice per year). On the contrary, about
60 percent of Development SOFIs have a banking license and about 50 percent are exempted from
parts of the commercial banking law. This is not surprising, however, given the sample categories
construction - only two Development SOFIs take deposits from the general public and both have
a banking license (but are, nevertheless, not subject to all aspects of the regular banking law). The
sample categories construction may also explain why West ECA (which is characterized by more
Development SOFIs) has a higher incidence of parts of the commercial banking law not applying
to the SOFIs.
5.2 Accountability, mandate, and objectives
SOFIs are accountable to diverse stakeholders. For instance, a Commercial SOFI is more
likely to be legally responsible or accountable directly to its shareholder, whereas a Development
SOFI might be accountable to a more diverse set of stakeholders. Moreover, almost one in ten
Commercial and Development SOFI is accountable to multiple entities (under the category
“Other” in Figure 3). Looking at the granular regions, SOFIs in Benchmark Europe are the most
likely to be accountable directly to their shareholders, whilst in West ECA there is high diversity
0%
20%
40%
60%
80%
100
%
Pe
rcen
t Yes
Commercial Development
Banking licenseParts of commercial banking law do not apply
0%20
%40
%6
0%8
0%10
0%
Per
cent
Ye
s
Benchmark Europe WEST ECA EAST ECA
Banking licenseParts of commercial banking law do not apply

15
in accountability structures, and in East ECA the Finance Minister or other cabinet level official
(category “Cabinet level official” in Figure 3) is the most likely category under accountability.
Figure 3: Accountability
By type By granular region
In terms of policy mandate characteristics, a specific policy mandate is more prevalent
among Development SOFIs compared to Commercial SOFIs, and in Benchmark Europe and West
ECA (Figure 4a). Interestingly, none of the Commercial SOFIs established after 1990 have a
specific policy mandate, whereas all established prior to 1990 had a specific purpose. Almost 40
percent of Development SOFIs and 20 percent of Commercial SOFIs have revised their policy
mandate in the last 10 years, probably due to the GFC. Over 50 percent of SOFIs in ECA have a
mandate that includes financial sustainability, and only a smaller percentage is required to achieve
a minimum rate of return.
Turning to SOFIs’ business objectives within SOFIs’ mandates (Figure 4b), Commercial
SOFIs lean toward profit maximization or pursue multiple objectives (e.g. profit maximization and
a social objective), whereas most Development SOFIs aim to achieve a social/developmental
objective. 10 This is not surprising, however, given the sample categories construction.
Nevertheless, in 2015, SOFIs that maximize profits had higher return on assets, but also higher
NPLs, significantly higher operating expenses, and lower capital adequacy ratios. SOFIs whose
mandate includes a financial sustainability objective had lower return on assets and significantly
higher operating expenses compared to those that did not have a financial sustainability objective
in their mandate.
10 Only one Development SOFI is profit maximizing, but the institution has multiple objectives and is required by the state/ government to achieve a minimum rate of return on capital.
0%
20%
40%
60%
80%
100
%
Commercial Development
Cabinet level official ShareholdersLegislative body The Head of GovernmentOther
0%
20%
40%
60%
80%
100
%
Benchmark Europe WEST ECA EAST ECA
Cabinet level official ShareholdersLegislative body The Head of GovernmentOther

16
SOFIs may have multiple sectoral objectives. Figure 4c reports the percentage of institutions
within each category (e.g., commercial) that indicated that the mandate was financing Small and
Medium Enterprises (SMEs), agriculture, infrastructure, export and import (Exim) and other.
These choices are not mutually exclusive, meaning that institutions may have indicated more than
one choice, and are summarized by the variable “multiple mandates”.
Sectoral objectives are quite heterogeneous and vary across groups and regions. SME
financing dominates irrespective of the SOFI type, and is particularly prevalent among
Commercial SOFIs compared to other objectives (Figure 5a). Development SOFIs have a wider
range of objectives, with more than half having more than one mandated (Figure 5b). Multiple
objectives may generate operational complexity and are difficult to evaluate and monitor; on the
other hand, they may allow diversification and higher operational efficiency. Development SOFI
mandates are significantly more focused on infrastructure and export compared to Commercial
SOFIs.
Figure 4: Mandate and objectives
4a. Mandate characteristics By type By granular regions
0%20
%4
0%60
%8
0%1
00%
Per
cen
t Ye
s
Commercial Development
Specific policy mandate Revised policy mandateMandate include fin. sustainability Minim rate of return
0%
20%
40%
60%
80%
100
%
Pe
rcen
t Yes
Benchmark Europe WEST ECA EAST ECA
Specific policy mandate Revised policy mandateMandate include fin. sustainability Minim rate of return

17
4b. Business objective By type By granular region
4c. Sectoral objective By type By granular regions
Looking at regions (Figure 4c), SME financing is an objective for more than half of the
SOFIs in Benchmark Europe and West ECA under the more granular regional splits, while
objectives are more balanced in East ECA (Figure 4c). The Exim function is particularly
pronounced in West ECA, possibly aiming to reap more benefits from the geographic proximity
to the EU. The mandates of SOFIs in Benchmark Europe appear to be less specific, with 4 out of
5 having a less specific – i.e. “Other” – mandate.
The ranking of target markets shows a diverse orientation of SOFIs across the three regions,
particularly exemplified by Benchmark Europe (Figure 5c). Financing SMEs is the most important
sector in West ECA. Financing in East ECA (which is driven by Commercial SOFIs) is dominated
by large private corporations – probably driven by extensive privatization in the 1990s – and state-
owned enterprises – possibly driven by common shareholding and state ownership in key strategic
0%
20%
40%
60%
80%
100
%
Commercial Development
Maximize profits Social ObjectiveOther Multiple
0%
20%
40%
60%
80%
100
%
Benchmark Europe WEST ECA EAST ECA
Maximize profits Social ObjectiveOther Multiple
0%
20%
40%
60%
80%
100
%
Commercial Development
SMEs financing AgricultureInfrastructure EximOther Multiple mandates
0%
20%
40%
60%
80%
100
%
Benchmark Europe WEST ECA EAST ECA
SMEs financing AgricultureInfrastructure EximOther Multiple mandates

18
sectors, like energy. No SOFIs indicated start-ups as a primary target market. SOFIs operating in
Benchmark EU are equally likely to target a diverse set of customers.
Figure 5: Most important target market (2015)
5a. Commercial SOFIs 5b. Development SOFIs
5c. Benchmark Europe 5d. West ECA
5e. East ECA
0%20
%40
%6
0%8
0%10
0%
Individuals and Households Micro enterprisesSMEs Large private corporationsState-owned enterprises
0%2
0%40
%6
0%8
0%1
00%
Individuals and Households Micro enterprises
SMEs Large private corporationsState-owned enterprises
0%20
%40
%6
0%8
0%1
00%
Individuals and Households Micro enterprisesSMEs Large private corporationsState-owned enterprises
0%2
0%40
%6
0%8
0%1
00%
Individuals and Households Micro enterprises
SMEs Large private corporationsState-owned enterprises
0%2
0%40
%6
0%8
0%1
00%
Individuals and Households Micro enterprises
SMEs Large private corporationsState-owned enterprises

19
With regard to SOFIs’ countercyclical policy, just one in four SOFIs in our sample has a
specific policy for increasing lending during economic recessions or financial crises and this is
predominantly among Development SOFIs. In relative terms, one in five Commercial SOFIs has
a specific counter-cyclical policy while for Development SOFIs this is almost one in three.
5.3 Instruments and portfolio
5.3.1 Instruments
About 20 percent of Commercial SOFIs do on-lending (a.k.a. wholesale lending, second tier,
or apex lending) alongside direct lending (a.k.a. retail lending), and almost 70 percent of
Development SOFIs do a combination of direct and on-lending. East ECA, characterized by more
Commercial SOFIs, has a lower incidence of on-lending compared to the other two granular
regions (Figure 6a).
Figure 6: Instruments
6a. Means of lending By type
By granular region
0%2
0%4
0%60
%80
%1
00%
Commercial Development
Direct loans On-lendingDirect and on-lend
0%
20%
40%
60%
80%
100
%
Benchmark Europe WEST ECA EAST ECA
Direct loans On-lendingDirect and on-lend

20
6b. Characteristics of lending By type By granular region
6c. Non-lending support By type By granular region
About 60 percent of Development SOFIs offer products that deviate from market conditions
(i.e. in terms of maturity or rates) compared to just 20 percent of Commercial SOFIs (Figure 6b).
Interestingly, this appears to prevail more in Benchmark Europe and West ECA rather than East
ECA. There is some correlation between SOFIs that provide products that deviate from current
market conditions and SOFIs that have a government guarantee on their debt. Of the 13 SOFIs that
are characterized by this relationship, 12 are Development SOFIs, suggesting that benefits are
possibly passed on to the ultimate beneficiary. Development SOFIs are also almost twice as likely
to risk-share with private banks compared to Commercial SOFIs. Technical assistance is offered
by just 25 percent of all SOFIs, but about 45 percent provide application assistance to enterprises
that seek EU funding support (Figure 6c).
0%20
%4
0%60
%8
0%1
00%
Per
cen
t Ye
s
Commercial Development
Risk-sharing with priv. banks Loan term > mktInterest rate < mkt
0%
20%
40%
60%
80%
100
%
Pe
rcen
t Yes
Benchmark Europe WEST ECA EAST ECA
Risk-sharing with priv. banks Loan term > mktInterest rate < mkt
0%2
0%40
%6
0%8
0%1
00%
Pe
rce
nt Y
es
Commercial Development
Consulting/tec. assistance Support for EU funds
0%2
0%4
0%6
0%8
0%1
00%
Pe
rcen
t Yes
Benchmark Europe EAST ECA WEST ECA
Consulting/tec. assistance Support for EU funds

21
5.3.2 Products
Figure 7 reports the range of financial products offered by SOFIs and whether these products
have been introduced since the 2007 crisis or not. Almost all Commercial SOFIs and over 60
percent of Development SOFIs offer credit guarantees, a product that has been long established
among both types (Figure 7a). 11 About 40 percent of Commercial SOFIs offer leasing and
factoring, and more than a third of Development SOFIs offer equity financing and venture capital.
Half of the Commercial SOFIs and almost 60 percent of the Development SOFIs offer subsidized
products. Very few SOFIs offer matching grants.
Turning to what products have been introduced since the GFC (Figure 7b), all SOFIs with
matching grants report having only introduced them as a new product since 2007. For the other
products, the crisis has also been a significant motivator, prompting their introduction in around
half of the cases.
Turning to geographic comparisons, credit guarantees prevail across all ECA, as do
subsidized products (Figure 7c). Venture capital financing is significantly more prevalent in EU
countries and Benchmark Europe under the more granular classification, as is leasing and factoring
in East ECA (possible given the higher presence of commercial banks). Benchmark Europe and
West ECA SOFIs (that have a higher mix of Development SOFIs) have introduced most of their
product mix after the 2007 crisis - mostly matching grants and venture capital financing, with West
ECA SOFIs also focusing more on leasing and factoring. More than 60 percent of East ECA SOFIs
have added subsidized products since the crisis (Figure 7d).
11 The reference to the ‘credit guarantees’ bank product here is not to be confused with the ‘partial credit guarantee schemes’ outlined in Table 3.

22
Figure 7: Product mix and introduction since the crisis (2015)
7a. Product mix by type 7b. Product introduction since the crisis by type
7c. Product mix across granular regions 7d. Product introduction since the crisis across granular regions
5.3.3 Assetandloangrowthrates
We examine asset and loan growth rates over two periods - between 2007 and 2011, and
between 2011 and 2015 - trying to capture any effects associated with the GFC. Overall, we
observe sustained median asset growth rates above 70 percent for Commercial SOFIs over the
nine-year period post 2007 (Figure 8a). Development SOFIs median asset growth has been
considerably more modest, with a significant containment in growth since 2011. Nonetheless, the
distribution of the assets growth rates is wide for both SOFI types, including negative values, and
should be interpreted with caution.12
12 For instance, 10 Commercial SOFI and 8 Development SOFIs posted asset growth rates above 100 percent in the period between 2011 and 2015.
0%2
0%4
0%6
0%8
0%1
00%
Pe
rce
nt Y
es
Commercial Development
credit guarantees matching grantssubsidized products equity financing
venture capital financing leasingfactoring
0%2
0%4
0%60
%8
0%10
0%
% o
f ins
titu
tion
s
Commercial Development
credit guarantees matching grantssubsidized products equity financingventure capital financing leasingfactoring
0%2
0%4
0%60
%8
0%1
00%
Pe
rce
nt Y
es
Benchmark Europe WEST ECA EAST ECA
credit guarantees matching grantssubsidized products equity financing
venture capital financing leasingfactoring
0%20
%40
%60
%8
0%10
0%
% o
f ins
titut
ion
s
Benchmark Europe WEST ECA EAST ECA
credit guarantees matching grantssubsidized products equity financingventure capital financing leasingfactoring

23
Turning to patterns in median loan growth rates and comparing them with the median asset
growth rates (Figure 8b), some interesting observations emerge. While Commercial SOFIs
expanded lending more in the period 2007-2011, the growth rate is roughly equal among all SOFIs
post 2011. This may reflect the ability of Commercial SOFIs to react faster to periods of crisis,
expanding and contracting their direct lending portfolio as needed (a more flexible instrument
compared to on-lending). In addition, Commercial SOFIs median asset growth rate post 2011
surpasses the 2007-2011 period, while the median loan growth rate falls – this may suggest an
expanded role in investment instruments such as government bonds etc. Meanwhile, Development
SOFIs median asset growth falls significantly post 2011, but the median loan growth rate remains
unchanged – possibly reflecting a continued focus on loans emanating from narrower policy
mandates.
The breakdown by geographic areas points to significantly higher median asset and loan
growth rates in East ECA compared to the other two regions (noting that most SOFIs operating in
East ECA are Commercial SOFIs). Benchmark Europe and West ECA, characterized more by
Development SOFIs, witnessed slowdowns in the asset growth rates post 2011 – possibly scaling
back from the immediate post GFC support (Figure 8c). However, while West ECA sustained the
median loan growth rates post 2011 (and at rates proportionally higher than that of median asset
growth), Benchmark Europe experienced negative median growth rates in the period 2011-2015
(Figure 8d).
Figure 8: Assets and loans growth rates (2007 through 2015)
By type 8a. Median asset growth rates of SOFIs 8b. Median loan growth rates of SOFIs
-20%
0%
20%
40%
60%
80%
100
%1
60%
Commercial Development
2007/2011 2011/2015
-20%
0%
40%
80%
120
%1
60%
Commercial Development
2007/2011 2011/2015

24
By granular region 8c. Median asset growth rates of SOFIs 8d. Median loan growth rates of SOFIs
Comparing the median asset and loan growth rates of SOFIs against the overall banking
sector over the same periods,13 the trends are broadly in line, but some differences do emerge.
Growth rates are higher overall for SOFIs in both periods under observation. Median asset and
loan growth rates in East ECA for the overall banking sector are higher post 2011, while for SOFIs
were higher in the period 2007/2011 compared to 2011/2015. For median loan growth rates, whilst
SOFIs in Benchmark Europe experienced a contraction post 2011, the overall banking sector
experienced positive (yet low) growth – possibly SOFIs scaled back post GFC as the private sector
picked up or had to reduce their assets following State Aid decisions from the European
Commission because of capital injections by their governments following the GFC. In West ECA,
however, median loan growth by SOFIs post 2011 continues to be significantly higher than that
observed for the overall banking sector that is subject to a growth slowdown.
Finally, considering the question of whether SOFIs with a countercyclical policy exhibited
higher median asset and loan growth rates, this does not appear to be the case at the outbreak of
the GFC – every SOFI expanded its balance sheet. However, SOFIs with an explicit
countercyclical policy appear to have maintained high growth rates in the 2011-15 period, unlike
SOFIs that lacked such a policy.
5.3.4 Lendingsectors
Figure 9 reports the ranking of lending by economic sector. Overall, both Commercial and
Development SOFIs concentrate heavily on manufacturing and energy. Commercial SOFIs do,
13 These results must be interpreted with caution, as the overall banking sector includes SOFIs.
-50%
0%
50%
100
%1
50%
200
%2
00%
300
%
Benchmark Europe WEST ECA EAST ECA
2007/2011 2011/2015
-50%
0%
50%
100
%1
50%
200
%2
00%
300
%
Benchmark Europe WEST ECA EAST ECA
2007/2011 2011/2015

25
however, appear to have higher exposures to agriculture and construction, and Development SOFIs
are exclusively present in health and real estate, including low-income housing.
At the granular geographic cut, Benchmark Europe’s top lending sector is energy, West
ECA’s is manufacturing, and East ECA’s is manufacturing and energy. Education and tourism do
not show up as a core lending sector for any of the SOFIs. Agriculture is consistently present, but
low compared to other sectors among the three regions. Finally, there appears to be a significantly
higher incidence of lending to State Owned Enterprises (SOEs) in East ECA (Figure 10).
Figure 9: Ranking of lending by economic sector (2015)
9a. Commercial 9b. Development
9c. Benchmark Europe 9d. WEST ECA
0%20
%40
%60
%8
0%10
0%
Agriculture ConstructionManufacturing EnergyMining Transportation and storageReal estate Health
0%2
0%4
0%60
%80
%10
0%
Agriculture ConstructionManufacturing EnergyMining Transportation and storageReal estate Health
0%2
0%4
0%6
0%8
0%1
00%
Agriculture ConstructionManufacturing EnergyMining Transportation and storageReal estate Health
0%20
%4
0%60
%80
%1
00%
Agriculture ConstructionManufacturing Energy
Mining Transportation and storageReal estate Health

26
9e. EAST ECA
Figure 10: Median lending to SOEs (2015)
By type By granular regions
5.4 Financial structure and performance
5.4.1 Funding
In terms of reported sources of funding (i.e. existence, not ranking of importance), slightly
more Commercial than Development SOFIs report receiving government budget allocations, yet
an overwhelmingly larger number of Development SOFIs report the use of government guarantees
(Figure 11a). Both types of SOFIs make use of Multilateral Financial Institutions’ (MFIs) funding,
as well as issue bonds denominated in domestic and foreign currencies. Government budget
allocation is more prevalent in non-EU countries probably reflecting EU restrictions on state aid
for the sake of competitive neutrality. Under the more granular geographic specification,
government budget allocation is more prevalent in East ECA compared to West ECA and
Benchmark Europe. More Benchmark EU and East ECA SOFIs (the latter driven by high
0%20
%40
%6
0%80
%10
0%
Agriculture ConstructionManufacturing EnergyMining Transportation and storageReal estate Health
0%
10%
20%
30%
40%
50%
Commercial Development
0
%1
0%2
0%3
0%4
0%5
0%
Benchmark Europe WEST ECA EAST ECA

27
concentration of Commercial SOFIs) report securities among the sources of funding. MFI funding
and government guarantees appear to be less prevalent in non-EU countries, and East ECA in
particular, under the more granular geographic cut.
In terms of SOFIs’ ranking of their use of specific sources of funding (as of end 2015),
Commercial SOFIs rank highest the deposits from the general public (as expected), while
Development SOFIs’ most important sources of funding are the government, multilaterals and
securities (Figure 11b).14 Interestingly, the four listed SOFIs (all Commercial SOFIs) only rank
deposits as the most important source of funding, while non-listed offer a fairly diversified ranking.
Turning to the more granular geographic specification, Benchmark Europe (followed by East ECA
that is dominated by commercial banks) ranks by far securities as the most significant source of
funding. East ECA ranking is dominated by deposits (retail and corporate), while West ECA ranks
roughly equally retail deposits, government and multilateral funding (Figure 11c).
Figure 11: Financing structure (2015)
11a. Reported sources of funding (i.e. existence, not ranking) By type Across granular regions
14 An Exim bank is the only Development SOFI that ranks central bank funding as top source of funding. In this specific case, the funding structure is the result of idiosyncratic central bank foreign exchange and liquidity measures.
0%
20%
40%
60%
80%
100
%
Pe
rcen
t Yes
Commercial Development
Government budget allocation Issue bondsIssue fx bonds Receive MFIGovernment guarantee
0%
20%
40%
60%
80%
100
%
Pe
rcen
t Yes
Benchmark Europe WEST ECA EAST ECA
Government budget allocation Issue bondsIssue fx bonds Receive MFIGovernment guarantee

28
11b. Most important source of funding (i.e. ranking) Commercial SOFIs Development SOFIs
11c. Most important source of funding (i.e. ranking)
Benchmark EU West ECA
East ECA
0%
20%
40%
60%
80%
100
%
Government funding Multilateral FI funding
Deposits general public Corporate depositsSecurities Interbank marketCentral Bank
0%
20%
40%
60%
80%
100
%
Government funding Multilateral FI funding
Deposits general public Corporate depositsSecurities Interbank marketCentral Bank
0%2
0%40
%6
0%80
%1
00%
Government funding Multilateral FI fundingDeposits general public Corporate depositsSecurities Interbank marketCentral Bank
0%20
%40
%6
0%8
0%10
0%
Government funding Multilateral FI fundingDeposits general public Corporate depositsSecurities Interbank marketCentral Bank
0%20
%4
0%6
0%8
0%1
00%
Government funding Multilateral FI fundingDeposits general public Corporate depositsSecurities Interbank marketCentral Bank

29
5.4.2 Profitability
Commercial SOFIs were considerably more profitable than Development SOFIs in 2007, as
measured by the median Return on Equity (ROE). There was a significant drop in median
profitability for Commercial and (less so for) Development SOFIs in the period from 2007 to 2011,
although the trend somewhat stabilized thereafter (Figure 12a). Almost two-thirds of Commercial
SOFIs distribute dividends, compared to one-third of Development SOFIs. Looking at the more
granular geographic cut reveals that Benchmark Europe experienced a temporary increase in ROE
in 2011. The stabilization in post 2011 median ROE is pronounced in West ECA, with East ECA’s
continuing to experience a declining trend.
Overall, Commercial SOFIs exhibit higher interest and (particularly) non-interest income
compared to Development SOFIs, as well as operating expenses (Figure 12b). This is expected,
given a more profit oriented mandate, deposit-taking, and a higher emphasis on direct lending
operations that requires an extended branch network. Looking at the more granular geographic
classification, SOFIs based in Benchmark Europe have significantly lower operating costs, and are
significantly more reliant on interest (rather than non-interest) income for their profitability.
Figure 12: Profitability (2007 through 2015)
12a. Median ROE By type Across granular regions
3.70
3.63
6.04
4.76
4.98
12.70
0 1 2 3 4 5 6 7 8 9 10 11 12 13 14 15
Development
Commercial
2015
2011
2007
2015
2011
2007
3.81
6.55
12.30
4.89
5.37
8.64
0.89
2.33
0.51
0 1 2 3 4 5 6 7 8 9 10 11 12 13 14 15
EAST ECA
WEST ECA
Benchmark Europe
2015
2011
2007
2015
2011
2007
2015
2011
2007

30
12b. By type Median Interest income Median non-interest income
Median operating expenses
12c. Across granular regions Median Interest income Median non-interest income
3.18
3.54
4.90
4.16
6.20
5.75
0 1 2 3 4 5 6 7 8 9 10
Development
Commercial
2015
2011
2007
2015
2011
2007
0.47
0.47
0.79
1.20
1.75
3.15
0 1 2 3 4 5 6 7 8 9 10
Development
Commercial
2015
2011
2007
2015
2011
2007
0.98
0.59
1.37
2.74
3.21
3.27
0 1 2 3 4 5 6 7 8 9 10
Development
Commercial
2015
2011
2007
2015
2011
2007
9.30
9.15
7.30
3.18
4.00
5.50
0.50
0.53
0.54
0 1 2 3 4 5 6 7 8 9 10 11 12 13 14 15
EAST ECA
WEST ECA
Benchmark Europe
2015
2011
2007
2015
2011
2007
2015
2011
2007
1.50
1.76
3.80
1.00
1.20
1.20
0.26
0.27
0.06
0 1 2 3 4 5 6 7 8 9 10 11 12 13 14 15
EAST ECA
WEST ECA
Benchmark Europe
2015
2011
2007
2015
2011
2007
2015
2011
2007

31
Median operating expenses
Interest income is lower for all SOFIs in 2015 compared to 2007, except for SOFIs in East
ECA (Figure 12c). Non-interest income is lower for all SOFIs in 2015 compared to 2007, except
for SOFIs in Benchmark Europe. The SOFIs in Benchmark Europe appear minimally affected over
the period under observation, while income appears to be dropping fast for West ECA during the
reported period. At the same time, while operating expenses have been dropping among SOFIs in
East ECA, there was only a relatively muted response in West ECA.
The overall banking sector’s profitability, as measured by the median ROE, also show a
decrease over time. Commercial SOFIs outperformed the overall banking sector in 2011, but not
in 2007 and 2015. Development SOFIs median ROE, although always positive, has always been
lower than median profitability of the banking sector.
5.4.3 Loanquality
Median NPL rates15 increased significantly both for Commercial and Development SOFIs,
driven primarily by the direct lending operations (with a late pronounced hike in East ECA from
2011 to 2015, possibly related also to the 2014 oil price decline and sanctions on the Russian
Federation). Median NPLs on direct lending do not seem consistently higher for Development
rather than Commercial SOFIs, suggesting similar risk-taking behavior. Commercial SOFIs
experienced a spike in median NPL rates earlier than the Development SOFIs (Figure 13a),
possibly as a result of the on-lending/ direct lending instrument mix (with the latter allowing a
more immediate reaction to the GFC), an issue of recognition, or reflecting their more immediate
15 The comparison of NPL rates needs to be approached with caution, as the NPL definition can vary significantly from country to country, in addition to within countries when some SOFIs are not subject to the same regulatory standards as the rest of the banking sector.
2.80
3.92
4.80
1.85
1.63
2.00
1.23
0.09
0.12
0 1 2 3 4 5 6 7 8 9 10 11 12 13 14 15
EAST ECA
WEST ECA
Benchmark Europe
2015
2011
2007
2015
2011
2007
2015
2011
2007

32
counter-cyclical reaction to the GFC. Interestingly, the median NPL rate associated with SOEs is
low, but more prevalent in West ECA followed by East ECA (Figure 13b).
Median NPL rates for SOFIs have been lower than the rates for the overall banking sector
for all the years under study. Looking at the developments by granular regions, SOFIs’ median
NPL rates are lower than the overall banking sector in all sub-regions, except for East ECA in
2015.
Figure 13: Non-performing loans (2007 through 2015)
13a. By type Median NPL Median NPL on direct lending
Median NPL on SOE
8.59
4.49
3.15
11.14
5.45
2.08
0 5 10 15
Development
Commercial
2015
2011
2007
2015
2011
2007
10.25
6.10
2.35
9.35
7.10
2.21
0 5 10 15
Development
Commercial
2015
2011
2007
2015
2011
2007
1.66
1.89
1.70
1.90
1.60
0.07
0 5 10 15
Development
Commercial
2015
2011
2007
2015
2011
2007

33
13b. By granular regions Median NPL Median NPL on direct lending
Median NPL on SOE
5.4.4 Capitaladequacy
Median capital adequacy ratios are relatively high among SOFIs, with the highest observed
among Development SOFIs that have experienced an upward trend (Figure 14a). The upward trend
is mostly driven by Benchmark Europe, whereas there is variability in the other two regions under
the granular geographic classification. SOFIs in West ECA experienced an overall drop, but
maintained high ratios. East ECA suffered a large drop in CAR after a spike in 2011, with nine
institutions having been recapitalized in the region after the crisis (notably, 2014 marks the
beginning of a dramatic drop in the oil price and remittances). Compared to the overall banking
sector, SOFIs median CAR is higher (except for Benchmark Europe in 2007 and 2011).
Since the GFC in 2007, several SOFIs - Commercial and Development, in EU and non-EU
countries - have been recapitalized with government resources (Figure 14b). The percentage is
lower in Benchmark Europe, but still stands over 40 percent (just 5 out of 12 institutions). In West
11.14
5.40
1.50
9.59
8.50
5.40
3.07
0.95
0.65
0 5 10 15
EAST ECA
WEST ECA
Benchmark Europe
2015
2011
2007
2015
2011
2007
2015
2011
2007
17.70
6.25
1.50
10.70
8.15
4.00
5.59
2.73
0.90
0 5 10 15
EAST ECA
WEST ECA
Benchmark Europe
2015
2011
2007
2015
2011
2007
2015
2011
2007
2.65
2.04
5.15
1.90
1.70
0.16
0.02
0.07
0 5 10 15
EAST ECA
WEST ECA
Benchmark Europe
2015
2011
2007
2015
2011
2007
2015
2011
2007

34
ECA, half of the institutions have been recapitalized, and in East ECA just two institutions out of
11 have not been recapitalized.
Figure 14: Capital adequacy ratios and recapitalizations (2007 through 2015)
14a. Median CAR By type By granular regions
14b. Recapitalization By type By granular regions
5.5 Corporate governance
There is wide variation in the number of Supervisory Board (SB) members, with the smallest
boards counting 2 members and the largest up to 15. The highest concentration of the number of
SB members is in the range of 5 to 11 members, and there is no difference in the medians of
Commercial versus Development SOFIs. In 30 percent of surveyed SOFIs, the SB has no
independent member, but, in also 30 percent of the cases, all the members of the SB are
independent. This difference does not appear to be driven by the SOFI type or geographical
location.
27.90
23.30
20.20
16.53
15.84
16.16
0 10 20 30
Development
Commercial
2015
2011
2007
2015
2011
2007
16.53
29.00
16.03
22.38
21.65
25.65
24.80
15.60
11.20
0 10 20 30
EAST ECA
WEST ECA
Benchmark Europe
2015
2011
2007
2015
2011
2007
2015
2011
2007
0%20
%40
%60
%8
0%10
0%
Per
cen
t Yes
Commercial Development
0%
20%
40%
60%
80%
100
%
Pe
rcen
t Yes
Benchmark Europe WEST ECA EAST ECA

35
The appointment of the SB is in 29 percent of the surveyed SOFIs by the shareholders (i.e.
direct relationship with the government body associated with the holding of SOFI shares). In
almost one-quarter of the cases responsibility lies with a legislative body and in another one-
quarter with the Minister of Finance (Figure 15a). The appointment of the Chairman is equally
split among the SB and another legislative body, with about 10 percent of the cases being with the
Minister of Finance or ‘other’ decision making bodies (Figure 15b). In 80 percent of SOFIs the
appointment is for fixed terms and the length of appointment is between 1 and 6 years.
In most of the sampled SOFIs, there is a mismatch between who appoints the SB and to
whom the SB is accountable to (Figure 15c). Commercial SOFIs are accountable either to
shareholders or a cabinet official but in most of the cases there is another body appointing the
members of the SB. Commercial SOFIs are accountable either to the Head of Government - in just
one case though – or a legislative body, or shareholders or a cabinet official but in most of the
cases there is a mismatch with the body appointing the members of the SB. Looking at the granular
regions, in 60 percent of the cases that SOFIs in East ECA are accountable to shareholders, the
shareholders also appoint the members of the SB.
Figure 15: Supervisory Board and Chairman
15a. Appointment of the Supervisory Board 15b. Appointment of the Chairman
7.9%
28.9%
23.7%
23.7%
15.8%
Other Shareholders
Legislative body Finance MinisterHead of Government
6.5%
45.2%
45.2%
3.2%
Other Supervisory BoardLegislative body Finance Minister

36
15c. Mismatch between accountability and appointment of the Supervisory Board
By type Across granular regions
Development SOFIs are only slightly less likely than Commercial SOFIs to impose formal
qualifications in hiring the members of the SBs and to offer fixed-terms contract - the percentage
difference is not wide particularly regarding formal minimum qualifications (Figure 16a).
Interestingly, not all Commercial SOFIs have minimum qualification criteria or evaluate senior
management performance. Furthermore, having formal minimum qualification criteria for the SB
members appears to almost double profitability (in terms of median ROE) and capital adequacy
(in terms of median CAR), while dropping by about a third the median of the NPL ratio (Figure
16b).
Figure 16: Formal minimum qualification criteria
16a. Supervisory Board and Senior Management By type Across granular regions
0%
20%
40%
60%
80%
100
%
Commercial Development
Head Gov. Legislative Sharehold. Official Head Gov. Legislative Sharehold. Official 0%
20%
40%
60%
80%
100
%
Benchmark Europe WEST ECA EAST ECA
Head Gov. Legis. Shar. Offic. Head Gov. Legis. Shar. Offic. Head Gov. Legis. Shar. Offic.
0%
20%
40%
60%
80%
100
%
Pe
rcen
t Yes
Commercial Development
Formal min qualif. Supervisory Board Sup. Board appointed fixed terms
Formal min qualif. Senior Management Performance evaluated Sen Mngmt
0%2
0%4
0%6
0%80
%1
00%
Per
cen
t Yes
Benchmark Europe WEST ECA EAST ECA
Formal min qualif. Supervisory Board Sup. Board appointed fixed terms
Formal min qualific. Senior Management Performance evaluated Sen Mngmt

37
16b. Formal minimum qualification criteria and impact on performance (no/ yes) Median ROE Median NPL
Median CAR
Just over 50 percent of Commercial SOFIs report having compliance systems in place (with
the highest prevalence in Benchmark Europe), but still double the percent for Development SOFIs
(Figure 17a). Only 65 percent of Development SOFIs report having the internal control function,
and just 50 percent of all SOFIs have risk committees established (mostly absent in East ECA,
Figure 17b).
01
23
45
RO
E 2
015
No Yes
01
23
45
NP
L 20
15
No Yes
0
12
34
5
CA
R 2
015
No Yes

38
Figure 17: Corporate governance and risk management framework
17a. Key features By type Across granular regions
17b. Internal review functions By type Across granular regions
5.6 Monitoring and evaluation
Monitoring appears to be similar across SOFI types, although Commercial SOFIs are less
likely to be audited by the government (Figure 19). SOFIs in Non-EU countries have the lowest
proportion of institutions with rated debt instruments.
0%2
0%4
0%60
%80
%1
00%
Per
cen
t Yes
Commercial Development
Compliance systems in place Debt sustainability limitsPeriodic stress testing Documented risk frameworkIndependence risk management
0%2
0%4
0%6
0%8
0%1
00%
Per
cent
Yes
Benchmark Europe WEST ECA EAST ECA
Compliance systems in place Debt sustainability limitsPeriodic stress testing Documented risk frameworkIndependence risk management
0%
20%
40%
60%
80%
100
%
Pe
rcen
t Yes
Commercial Development
Internal audit ComplianceRisk management Internal controlRisk Committee
0%20
%40
%60
%80
%10
0%
Per
cent
Yes
Benchmark Europe WEST ECA EAST ECA
Internal audit ComplianceRisk management Internal controlRisk Committee

39
Figure 18: Accountability and monitoring features
18a. Supervisory Board and Senior Management By type Across granular regions
Commercial and Development SOFIs define performance indicators to measure success
differently (Figure 19a). Commercial SOFIs’ most likely measure of success is by loan volume,
while the preferred success indicator for Development SOFIs is the number of clients served and
products offered. Nevertheless, more than one in five Development SOFIs do not define
performance indicators. The classification by granular region shows that in Benchmark Europe
and West ECA, the most likely performance measure is the number of clients served and products
offered, and in East ECA (dominated by Commercial SOFIs) it is the loan volume.
While most Commercial and Development SOFIs report progress against objectives in the
annual report, about 15 percent of Development SOFIs do not do so. With respect to granular
regions, progress against objectives is mostly reported in annual reports, but SOFIs in Benchmark
Europe also utilize periodic statements as a significant mean of communication (Figure 19b).
Roughly half of the Commercial SOFIs undertake impact evaluations and slightly more than
60 percent of Development SOFIs do so (Figure 19c). Impact evaluations are more common in
Benchmark Europe at about 75 percent, and equally common in West and East ECA at below 60
percent. Nevertheless, SOFIs overall do not have in house capacity to undertake impact evaluations
(Figure 19d) - impact evaluation units are scarcely present, although slightly more prevalent
among Commercial SOFIs (while the opposite would have been expected). The lack of impact
evaluation units is in EU and non-EU countries, and it is noticeable that not a single SOFI in West
ECA has one. Receiving funding from an MFI significantly increases the probability of
undertaking an impact evaluation (SOFIs are about 65 percent more likely to do so).
0%2
0%40
%6
0%80
%10
0%
Pe
rce
nt Y
es
Commercial Development
Outstanding debt rated Audited profess. ext. auditorAudited by Government
0%2
0%4
0%6
0%8
0%10
0%
Pe
rce
nt Y
es
Benchmark Europe WEST ECA EAST ECA
Outstanding debt rated Audited profess. ext. auditorAudited by Government

40
Figure 19: Monitoring and evaluation features
19a. Success indicator By type Across granular regions
19b. Reporting Success Indicator By type Across granular regions
19c. Impact evaluation undertaken By type Across granular regions
0%
20%
40%
60%
80%
100
%
Pe
rcen
t Yes
Commercial Development
Loan volume Clients/Products servedNumber of new clients Profitability
0%
20%
40%
60%
80%
100
%
Pe
rcen
t Yes
Benchmark Europe WEST ECA EAST ECA
Loan volume Clients/Products servedNumber of new clients Profitability
0%
20%
40%
60%
80%
100
%
Commercial Development
Annual Report Periodic statementTo shareholders None
0%
20%
40%
60%
80%
100
%
Benchmark Europe WEST ECA EAST ECA
Annual Report Periodic statementTo shareholders None
0%20
%4
0%6
0%80
%10
0%
Pe
rce
nt Y
es
Commercial Development
0%20
%4
0%6
0%80
%10
0%
Pe
rce
nt Y
es
Benchmark Europe WEST ECA EAST ECA

41
19d. Presence of impact unit By type Across granular regions
6 Concluding remarks
While the theoretical and empirical debate on state ownership in finance continues, the GFC
renewed the interest of policy makers in SOFIs as a policy instrument. This is particularly visible
in ECA, where the debate over SOFIs has had a long history, but recent initiatives suggest that the
policy pendulum may have swayed in favor of SOFIs. This paper presents the main take-aways of
a survey deployed to take stock and analyze Commercial and Development SOFIs in ECA and its
sub-regions. Based on the replies of 41 institutions distributed across 21 countries, some interesting
patterns emerge - although results need to be interpreted with caution as with any survey
undertaking.
Evolution. Despite the liberalization policies that followed the transition from centrally-
planned economies to market economies, over 60 percent of the SOFIs in the sample were created
after 1990, and three of the four SOFIs created post-GFC were established in Benchmark Europe.
The focus has increasingly been on Development SOFIs, as shown by the number of newly
established institutions that more than doubled after 1990 and have sustained post-2007.
Mandates. Development SOFIs tend to have narrower mandates. All Commercial SOFIs
established before 1990 had a specific policy mandate, but none did post 1990. SME financing
dominates among sectoral objectives, and Development SOFIs appear significantly more focused
on infrastructure. The Exim function is particularly pronounced in West ECA, aiming to benefit
from the EU’s geographic proximity. Furthermore, over half of ECA’s SOFIs have a mandate that
includes financial sustainability, and these SOFIs tend to have lower profitability and significantly
0%
20%
40%
60%
80%
100
%
Pe
rcen
t Yes
Commercial Development 0%
20%
40%
60%
80%
100
%
Pe
rcen
t Yes
Benchmark Europe WEST ECA EAST ECA

42
higher operating expenses. Just one out of four SOFIs has a countercyclical policy, and this is
predominantly among Development SOFIs.
Instruments. About 70 percent of Development SOFIs combine direct and on-lending and of
the remaining 30 percent only 10 percent absorb risk in other ways. About 60 percent of
Development SOFIs offer products that deviate from market conditions (compared to just 20
percent among Commercial SOFIs). Development SOFIs are also almost twice as likely to risk-
share with private banks compared to Commercial SOFIs. Technical assistance is offered by just
a quarter of all SOFIs. Only 40 percent of Commercial SOFIs offer leasing or factoring, and just a
third of Development SOFIs offer equity financing or venture capital. Very few SOFIs offer
matching grants.
Governance. There is wide variation in the number of Supervisory Board members (mostly
5 to 11 SB members) and the number of independent members, yet differences do not appear to
be driven by the SOFI type or geographical location. The responsibility for the appointment of the
SB is also widely varied and often does not match the body that the SB is accountable to. Just 20
percent of SOFIs do not have minimum qualification criteria for the SB members, and those that
do double profitability and capital adequacy levels, and cut NPL ratios by about a third. Just over
half of Commercial SOFIs report having compliance systems in place (with the highest prevalence
in Benchmark Europe), but still double the number for Development SOFIs. Only 65 percent of
Development SOFIs report having an internal control function, and just half of all SOFIs have risk
committees established (mostly absent in East ECA). Commercial SOFIs mostly measure success
by loan volume, and Development SOFIs by the number of clients served and products offered.
Nevertheless, more than one in five Development SOFIs does not define performance indicators.
Roughly half of the SOFIs undertake impact evaluations, but do not have in house capacity to do
so. Notably, receiving funding from a Multilateral Financial Institution increases the probability
of undertaking an impact evaluation by 65 percent.
Intermediation characteristics. SOFIs concentrate heavily on manufacturing and energy (the
former more prevalent in West ECA and the latter in Benchmark Europe). Commercial SOFIs
appear to have higher exposures on agriculture and construction, and Development SOFIs are
exclusively present in health and real estate. Agriculture is consistently targeted, but stands very
low compared to other sectors. There appears to be a significantly higher incidence of lending to
state-owned enterprises in East ECA. In terms of funding, Commercial SOFIs rank highest retail
deposits (as expected), while Development SOFIs’ most important sources of funding are the

43
government, multilaterals and securities. Benchmark Europe ranks by far securities as the most
significant source of funding.
The impact of the GFC. Overall, all SOFIs expanded post GFC (at rates above the total
banking sector), independent of whether their mandate included a countercyclical role.
Commercial SOFIs expanded their loan portfolio faster than Development SOFIs and appear to
have turned to investment instruments post 2011, possibly government bonds. On the other hand,
Development SOFIs’ median asset growth falls significantly post 2011, but the median loan
growth rate remains unchanged – possibly reflecting a continued drive emanating from narrower
policy mandates. Unlike other regions, Benchmark Europe experienced negative asset and loan
growth rates post 2011 – possibly from actively scaling back from the immediate post GFC
support.
The GFC impact on profitability was diverse. Commercial SOFIs were considerably more
profitable than Development SOFIs in 2007, but experienced a more dramatic drop from 2007 to
2011, although the trend somewhat stabilized thereafter. As expected, Commercial SOFIs exhibit
higher interest and (particularly) non-interest income compared to Development SOFIs, as well as
operating expenses. NPLs increased significantly for all SOFIs, driven primarily by the direct
lending operations that may also explain the earlier spike among Commercial SOFIs. Interestingly,
the NPL rate associated with SOEs is low overall, and almost non-existent in Benchmark Europe.
Median capital adequacy ratios are high among SOFIs (and above the overall banking
sector), with the highest ratios among Development SOFIs that have experienced an upward trend
(driven by Benchmark Europe). Since the GFC, several SOFIs have been recapitalized,
independent of type or location. The percentage is lower in Benchmark Europe, but still stands at
over 40 percent. In East ECA just two out of 11 institutions have not been recapitalized.

44
Acknowledgements
We would like to thank all the senior officials of the state-owned financial institutions who
participated in this survey and shared their data and valuable insights with us. We express our
gratitude to David Gould, Eva Gutierrez, Matija Laco and Karsten Klein for the constructive
suggestions on the paper. We thank Rinku Chandra, Sean Harkin, Natalie Nicolaou, and Alexander
Pankov for helpful comments on the survey questionnaire. We thank Cem Leon Menase and
Jiemin Ren for the excellent support in the design of the survey and the collection and analysis of
the responses. Moreover, we are thankful to Ruvejda Aliefendic, Mario Guadamillas, Yevhen
Hrebeniuk, Johanna Jaeger, Isfandyar Zaman Khan, Oleg Lukyanchikov, Mai Nguyen, Catalin
Pauna, Gordana Popovic, Alper Oguz, Cevdet Unal, and Vahe Vardanyan for their support in
reaching out to the relevant institutions and in providing comments during the drafting of the paper.
All the errors and omissions rest with the authors.

45
References
Acharya, V. V., Agarwal, A. & Kulkarni, N. (2010). State Ownership and Systemic Risk:
Evidence from the Indian financial sector during 2007–09. Unpublished paper, NYU–Stern, New
York.
Arrow, K. J., & Lind, R. C. (1970). Uncertainty and the evaluation of public investment
decisions. American Economic Review, 60(3), 364-378.
Barth, J., Caprio, G., & Levine, R. (2006). Rethinking bank supervision and regulation: until
angels govern. New York: Cambridge University Press.
Bertay, A., Demirgüç-Kunt, A., & Huizinga, H. (2015). Bank ownership and credit over the
business cycle: Is lending by state banks less procyclical? Journal of Banking & Finance, 50, 326-
339.
Brei, M., & Schclarek, A. (2013). Public bank lending in times of crisis. Journal of Financial
Stability, 9(4), 820-830.
Coleman, N., & Feler, L. (2015). Bank ownership, lending, and local economic performance
during the 2008–2009 financial crisis. Journal of Monetary Economics, 71, 50-66.
Choi, M. J., Gutierrez, E., & Martinez Peria, M. S. (2016). Dissecting Foreign Bank Lending
Behavior During the 2008–2009 Crisis. Financial Markets, Institutions & Instruments, 25(5), 361-
398.
Cull, R., & Martinez Peria, M.S. (2013). Bank ownership and lending patterns during the 2008–
2009 financial crisis: evidence from Latin America and Eastern Europe. Journal of Banking &
Finance, 37(12), 4861-4878.
Cull, R., Martinez Peria, M.S. & Verrier, J. (2017). Bank Ownership: Trends and Implications.
International Monetary Fund. Washington, DC, USA: IMF Working Paper 17/60.
de la Torre, A., Gozzi , J. C., & Schmukler, S. L. (2017). Innovative Experiences in Access to
Finance: Market-Friendly Roles for the Visible Hand? World Bank. Washington, DC, USA. doi:
10.1596/978-0-8213-7080-3.
De Marco, F., & Macchiavelli, M. (2016). The political origin of home bias: The case of Europe.
Available at SSRN: https://ssrn.com/abstract=2441981
Dinç, I. S. (2005). Politicians and banks: Political influences on government-owned banks in
emerging markets. Journal of financial economics, 77(2), 453-479.

46
European Commission (2015). Working together for jobs and growth: The role of National
Promotional Banks (NPBs) in supporting the Investment Plan for Europe. COM/2015/0361 final.
Gould, D. M., & Melecky, M. (2017). Risks and Returns: Managing Financial Trade-Offs for
Inclusive Growth in Europe and Central Asia. Europe and Central Asia Studies, The World Bank.
Washington, DC, USA: World Bank
Gutierrez, E., Rudolph, H., Homa, T., & Beneit, E. (2011). Development banks: role and
mechanisms to increase their efficiency. The World Bank. Washington, DC, USA: World Bank
Policy Research Working Paper 5729.
Honohan, P. (2010). Partial credit guarantees: principles and practice. Journal of Financial
Stability, 6(1), 1-9.
Iannotta, G., Nocera, G., & Sironi, A. (2007). Ownership structure, risk and performance in the
European banking industry. Journal of Banking & Finance, 31 (7), 2127-2149.
Iannotta, G., Nocera, G., & Sironi, A. (2013). The impact of government ownership on bank
risk. Journal of Financial Intermediation, 22(2), 152-176.
Levy-Yeyati, E. L., Micco, A., & Panizza, U. (2004). Should the government be in the banking
business? The role of state-owned and development banks. Inter-American Development Bank.
Washington DC, USA: Research Department Working Paper 517.
Luna-Martinez, D., & Vicente, C. (2012). Global survey of development banks. The World
Bank. Washington, DC, USA: World Bank Policy Research Working Paper 5969.
Mazzucato, M., & Penna, C. C. (2016). Beyond market failures: The market creating and
shaping roles of state investment banks. Journal of Economic Policy Reform, 19(4), 305-326.
Micco, A., & Panizza, U. (2006). Bank ownership and lending behavior. Economics Letters,
93(2), 248-254.
Roaf, J., Atoyan, R., Joshi, B., & Krzysztof Krogulski (2014). 25 Years of Transition: Post-
Communist Europe and the IMF. The International Monetary Fund. Washington, DC, USA:
Regional Economic Issues Special Report.
Rudolph, H. (2009). State financial institutions: mandates, governance, and beyond. The World
Bank. Washington, DC, USA: World Bank Policy Research Working Paper 5141.
Scott, D. (2007). Strengthening the governance and performance of state-owned financial
institutions. The World Bank. Washington, DC, USA.: World Bank Policy Research Working
Paper 4321.

47
Shleifer, A., & Vishny, R. (1997). A survey of corporate governance. Journal of Finance, 52,
737–783.
Shleifer, A., & Vishny, R. (1998). The grabbing hand: Government pathologies and their cures.
Cambridge, MA: Harvard University Press.
The World Bank (2012). Global Financial Development Report 2013: Rethinking the Role of
the State in Finance. Washington, DC. doi: 10.1596/978-0-8213-9503-5.

48
Appendix I: The survey questionnaire
I General Information
1 Name of your institution
2 Is your institution a financial group?
3 Country
4 Year of establishment
5 Total assets of your institution as at the end of (in local currency millions)
2007; 2011; 2015
6 Total gross loan portfolio as at the end of (in local currency millions)
2007; 2011; 2015
7 Total liabilities (i.e, no equity included here) as at the end of (in local currency millions)
2007; 2011; 2015
8 Number of branches as at the end of 2015
9 Number of employees as at the end of 2015
10 Do you have any domestic financial subsidiaries?
11 Please explain if these companies have a special purpose (e.g. leasing, factoring, etc.) and report the total
assets as at the end of 2015 as percentage of the consolidated total assets
12 Do you have any foreign branches or financial subsidiaries?
13 Please specify the primary purpose for the presence in the specific regions and countries (e.g. trade,
expansion, etc.).
14 Is your institution listed?
15 What percent is floated in the market as of the end of 2015?
II Legal Status and Ownership
16 Is your institution a
Commercial bank (i.e., profit maximizers without a policy mandate, collect deposits from the public and use
them to directly lend to firms and individuals)
Development bank (i.e., have a policy mandate, do not take deposits, and are funded by IFIs, bonds or
government transfers. They on-lend or lend directly to firms in specific sectors, e.g. SMEs and exports)
Hybrid (i.e, have a policy mandate but perform commercial banking activities, collect deposits from the
public and use them to directly lend to firms and individuals. They act as a government agent in
administering state subsidies and other programs)
Other (please specify)
17 Was the institution created by a specific Law or Act?
18 Has the institution been always a state-owned bank?
19 If the institution has been nationalized, what was the reason?
20 List the top five stockholders and their respective ownership stake in percent as of the end of 2015.

49
III Mandate and Mission
21 Does the institution have a specific policy mandate?
22 Has the policy mandate been revised over the last 10 years?
23 What caused the revision?
24 Does the institution have an explicit policy mandate in (multiple entries are possible)
SMEs financing
Agriculture
Infrastructure
International Trade (Exim function)
Other (please specify)
25 If you perform exim function, please rank in order of importance (1 being the most important) the geographic
scope of your institution (n/a if it is not applicable).
Africa
East Asia and Pacific
Europe
Central Asia
Latin America and the Caribbean
Middle East and North Africa
South Asia
North America
Turkey
Russia
National
26 Does the mandate include financial sustainability objectives (e.g., capital maintenance)?
27 Is your institution required by the State/Government to achieve a minimum rate of return on your capital or
equity?
28 Is the institution’s social/developmental objective to (multiple entries are possible)
maximize profits
achieve a social objective (e.g. financing projects not traditionally served due to market failures, or projects
that are unprofitable yet socially valuable)
Other (please specify)
29 Please rank the importance of the following target markets (1 being the most important).
Individuals and households
Start-ups
Micro enterprises
Small and medium sized firms
Large private corporations

50
State-owned enterprises
IV Financing Structure
30 Does your institution receive periodically government budget allocation for specific programs (e.g., interest
rate subsidies, social programmes, SME financing, environmental and climate protection, etc.)?
31 Please specify the type of program
32 Has your institution been recapitalized with public money in the last 10 years?
33 Please state the reason (e.g., financial distress, social programs, etc. ) and the amount disbursed.
34 Does your institution issue bonds?
35 Does it issue foreign currency bonds?
36 Does your institution receive funding from multilateral financial institutions (e.g. IBRD, EBRD, CEB,
ADB, etc.)?
37 Please list the names of the main MFIs (e.g. IBRD, EBRD, CEB, ADB, etc.) as of the end of 2015.
38 Please rank (1 being the highest value) key financial liabilities of your institution by amounts outstanding
(in domestic currency) as of the end of 2015.
Government funding
Multilateral financial institutions funding
Deposits from the general public
Corporate deposits
Securities
Interbank market
Central Bank
39 Does the government guarantee your institution's debt?
V Products and Services
40 Does your institution lend through? (multiple entries possible)
direct loans to final customers
on-lend to final customers through other financial intermediaries (also kwon as wholesale/ apex/ II tier)
none of the above (Please explain)
41 Do you share risk with private banks while providing loans to final customers?
42 How much of your lending as percent of total lending is provided to state owned entities (e.g., corporates)?
43 If you operate in the EU, does state aid rule negatively affect your institution?
44 Please rank the following subsectors in order of importance for direct and on lend (1 being the most
important).
Agriculture
Construction
Manufacturing
Energy
Mining
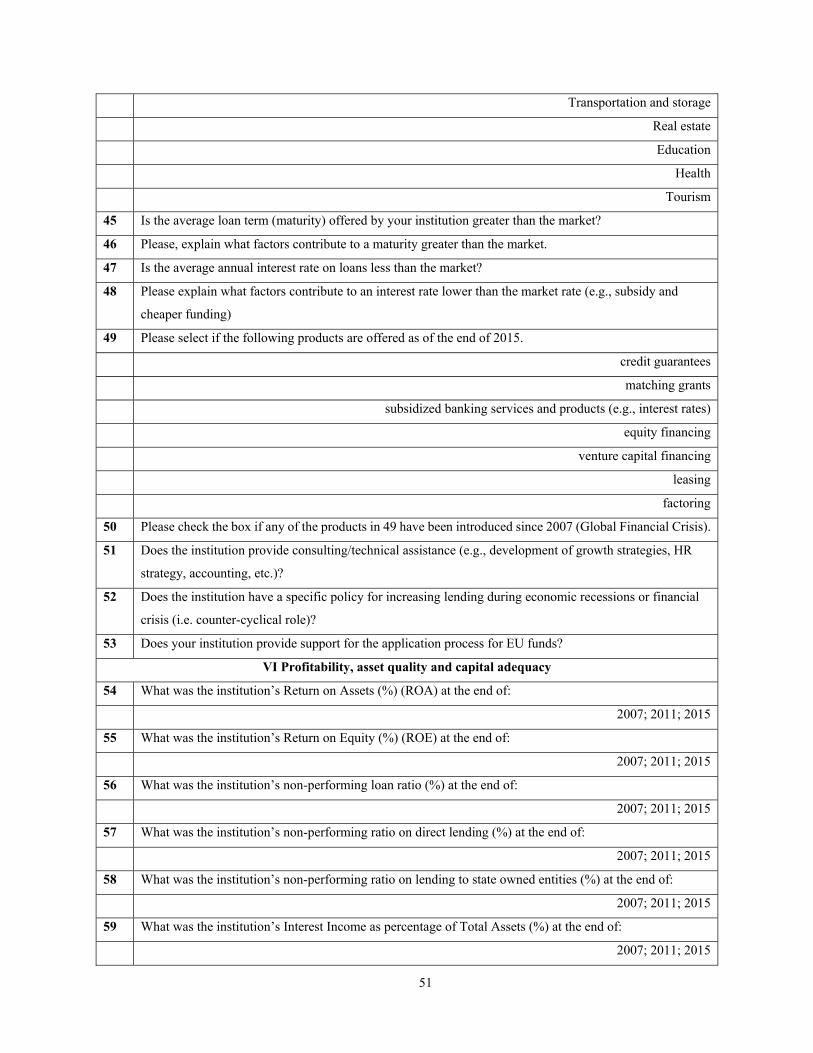
51
Transportation and storage
Real estate
Education
Health
Tourism
45 Is the average loan term (maturity) offered by your institution greater than the market?
46 Please, explain what factors contribute to a maturity greater than the market.
47 Is the average annual interest rate on loans less than the market?
48 Please explain what factors contribute to an interest rate lower than the market rate (e.g., subsidy and
cheaper funding)
49 Please select if the following products are offered as of the end of 2015.
credit guarantees
matching grants
subsidized banking services and products (e.g., interest rates)
equity financing
venture capital financing
leasing
factoring
50 Please check the box if any of the products in 49 have been introduced since 2007 (Global Financial Crisis).
51 Does the institution provide consulting/technical assistance (e.g., development of growth strategies, HR
strategy, accounting, etc.)?
52 Does the institution have a specific policy for increasing lending during economic recessions or financial
crisis (i.e. counter-cyclical role)?
53 Does your institution provide support for the application process for EU funds?
VI Profitability, asset quality and capital adequacy
54 What was the institution’s Return on Assets (%) (ROA) at the end of:
2007; 2011; 2015
55 What was the institution’s Return on Equity (%) (ROE) at the end of:
2007; 2011; 2015
56 What was the institution’s non-performing loan ratio (%) at the end of:
2007; 2011; 2015
57 What was the institution’s non-performing ratio on direct lending (%) at the end of:
2007; 2011; 2015
58 What was the institution’s non-performing ratio on lending to state owned entities (%) at the end of:
2007; 2011; 2015
59 What was the institution’s Interest Income as percentage of Total Assets (%) at the end of:
2007; 2011; 2015

52
60 What was the institution’s Non-Interest Income as percentage of Total Assets (%) at the end of:
2007; 2011; 2015
61 What was the institution’s Operating Expenses as percentage of Total Assets (%) at the end of:
2007; 2011; 2015
62 What was the institution’s overall Capital Adequacy Ratio (%) at the end of:
2007; 2011; 2015
63 Does your institution pay dividends?
VII Corporate Governance and Supervisory Board
64 How many members compose your institution’s Supervisory Board (i.e. non-managing board that oversees
the management board)?
65 Who appoints the members of the Supervisory Board?
the Head of Government (e.g., President, Prime Minister)
the Finance Minister or other cabinet level official
a legislative body such as the Parliament or Congress
Other (please specify)
66 Are there formal (i.e., recorded in an official document) minimum qualification criteria to appoint the
members of Supervisory Board?
67 Are the members of Supervisory Board appointed for fixed terms?
68 How long is their term? Please specify in number of years.
69 How many Supervisory Board members are government officials or elected by the Head of
Government/Finance Minister?
70 How many Supervisory Board members are independent (i.e., not affiliated with government agencies)?
71 Who appoints the Chairman?
the Head of Government (e.g., President, Prime Minister)
the Finance Minister or other cabinet level official
a legislative body such as the Parliament or Congress
Other (please specify)
72 Can the Chairman be removed?
73 Who can remove the Chairman?
74 Are there formal (i.e., recorded in an official document) minimum qualification criteria for the appointment
of senior management?
75 Is the performance of management and senior management evaluated?
76 Does the chief risk officer report to
Board of Directors or Board Committee
Chairman
Chief executive officer
Other (please specify)

53
77 Which internal review functions / departments exist in your institution? (multiple entries possible)
Internal audit
Compliance officer/department
Risk management
Internal control
Dedicated Risk Committee at the Supervisory Board level
Impact evaluation unit
VIII Risk Management Framework
78 Does your institution identify, monitor, and have in place compliance systems specifically dedicated to state-
owned entities (e.g. corporates)?
79 What is the limit as a percentage of total loans?
80 Does your institution have in place debt sustainability limits when making loans?
81 Are loans securitized and sold on the market?
82 Does your institution carry out periodic stress testing of credit portfolios?
83 Does your institution have a documented Risk Management Framework, approved by the Supervisory Board
or a subcommittee of the Board?
84 Are there formal structures in place to ensure independence of the Risk Management function?
85 Is there a quantification methodology for
credit / counterparty risk
for market risk
for liquidity risk
for operational risk
86 Are there risk limits set for
credit / counterparty risk
for market risk
for liquidity risk
for operational risk
IX Monitoring, Evaluation, and Accountability
87 To whom is your institution legally responsible or accountable?
the Head of Government (e.g., President, Prime Minister)
the Finance Minister or other cabinet level official
a legislative body such as the Parliament or Congress
shareholders
other (please specify)
88 Is your institution’s outstanding debt rated by the international credit rating agencies?
89 Is your institution legally required to be audited by a professional external auditor (e.g., Ernest Young,
Deloitte, KPMG, PWC) ?

54
90 Is your institution audited by the Government or a Government-related body?
91 Is the institution legally required to produce IFRS-based audit reports?
92 Does your institution disclose to the public the following information?
Annual report
Governance and risk management framework
Regulatory capital and capital adequacy ratio
Executive compensation
Related party transactions
93 What indicator do you use to define success in fulfilling your mandate of mission?
Outstanding loan volumes
Outstanding SMEs loan volumes
Clients/Products served
Number of new clients
Employment
New SMEs creation
New start-up created
Other (please specify)
94 How is this reported (e.g. annual report, special report to shareholders, etc.)?
95 Do you undertake any impact evaluation?
X Prudential Oversight
96 What institution supervises your institution (e.g. Bank Supervisory Authority and/or other)?
97 Does your institution have a banking license?
98 Are there parts of commercial banking law that do not apply to your institution (e.g., capitalization,
governance framework, reporting, etc.)?
99 How many times has your institution undergone onsite supervision by the Bank Supervisory Authority in
the last 5 years?

55
Appendix II: Participating institutions
SOFI name Country The Development Bank of The Federation of Bosnia and Herzegovina Bosnia and Herzegovina The Republic of Srpska Investment-Development Bank Bosnia and Herzegovina Union banka d.d. Sarajevo Bosnia and Herzegovina Bulgarian Development Bank Bulgaria Municipal Bank AD Bulgaria Croatian Bank for Reconstruction and Development - Hrvatska banka za obnovu i razvitak (HBOR) Croatia Czech-Moravian Guarantee and Development Bank Czech Republic Agence France Locale France Société de Financement Local France Bayerische Landesbank Germany Landeskreditbank Baden-Württemberg - Förderbank - (L-Bank) Germany NRW Bank Germany Hungarian Export-Import Bank Plc. Hungary MFB Hungarian Development Bank Plc. Hungary OJSC "Ayil Bank" Kyrgyzstan Open Joint-Stock Company "RSK Bank" Kyrgyzstan JSC Development Finance Institution Altum Latvia Macedonian Bank for Development Promotion Macedonia BNG Bank Netherlands NWB Bank Netherlands Bank Gospodarstwa Krajowego Poland Caixa Geral de Depósitos, S.A. Portugal Belinvestbank JSC Republic of Belarus Joint Stock Company ‘Savings Bank – Belarusbank” Republic of Belarus Joint-Stock Company “Development Bank of the Republic of Belarus” Republic of Belarus Banca de Export-Import a Romaniei EXIMBANK S.A. Romania CEC Bank SA Romania Eximbank of Russia Russian Federation Vnesheconomhank Russian Federation VTB Bank Russian Federation Nova Ljubljanska banka d.d., Ljubljana Slovenia ICF - Institut Català de Finances Spain Instituto de Crédito Oficial (ICO) Spain Development Bank Turkey Halk Bank Turkey T.C. ZİRAAT BANKASI A.Ş. Turkey Türkiye İhracat Kredi Bankası A.Ş. (Turk Eximbank) Turkey Joint Stock Company “The State Export-Import Bank of Ukraine” Ukraine JSB “Ukrgasbank” Ukraine Oschadbank Ukraine UK Green Investment Bank plc United Kingdom