State Ownership and Systemic Risk: Evidence from the ... · State Ownership and Systemic Risk:...
31
Viral V. Acharya NYU Stern, CEPR and NBER (with Nirupama Kulkarni, Hass School of Business, UC Berkeley) December 20, 2010 State Ownership and Systemic Risk: Evidence from the Indian Financial Sector during 2007-09
Transcript of State Ownership and Systemic Risk: Evidence from the ... · State Ownership and Systemic Risk:...

Viral V. AcharyaNYU Stern, CEPR and NBER
(with Nirupama Kulkarni, Hass School of Business, UC Berkeley)
December 20, 2010
State Ownership and Systemic Risk: Evidence from the Indian Financial Sector
during 2007-09

Introduction
We compare public and private sector performance during the crisis period of 2007-09.
Did government guarantees help PSBs outperform?
We relate systemic risk exposure of financial firms to crisis period based on Realized returnsDeposit GrowthGOI capital injections

Key Results
Ex ante systemic risk and ex post performance for the two sectors are strikingly different.
Public sector firms outperformed private sector firms.
Public sector firms with greater risk performed better.
PSBs with greater systemic risk received greater GOI support.

Crisis of 2008
0
5000
10000
15000
20000
0100020003000400050006000700080009000
1000011000120001300014000
Jan-
07Fe
b-07
Mar
-07
Apr
-07
May
-07
Jun-
07Ju
l-07
Aug
-07
Sep
-07
Oct
-07
Nov
-07
Dec
-07
Jan-
08Fe
b-08
Mar
-08
Apr
-08
May
-08
Jun-
08Ju
l-08
Aug
-08
Sep
-08
Oct
-08
Nov
-08
Dec
-08
Jan-
09Fe
b-09
Stock Index Performance for NSE NIFTY and BSE Sensex between Jan '07-Feb '09
NIFTY SENSEX

India: Crisis of 2008 Triggered by global financial crisis of August 2007
NIFTY fell nearly 60% from its peak in January 2008.
Strong performance of Indian financial firms. Capitalization: High CRAR of 13% (globally 8.2% to 17.7%).Quality of assets: NPL ratio decreased to 2.3% 2008.Profitability: Higher ROA of 1% as of March, 2008.
Attributed to high regulation preventing excessive risk taking.

Public and Private Sector Performance: Realized Returns
0
50
100
150
200
250
300
350Ja
n-07
Feb-
07
Mar
-07
Apr-
07
May
-07
Jun -
07
Jul-0
7
Aug-
07
Sep-
07
Oct
-07
Nov
-07
Dec-
07
Jan-
08
Feb-
08
Mar
-08
Apr-
08
May
-08
Jun-
08
Jul-0
8
Aug-
08
Sep-
08
Oct
-08
Nov
-08
Dec-
08
Jan-
09
Feb-
09
Aver
age
Retu
rns
Indexed Equally Weighted ReturnsIndex=100 on January 2, 2007
Public Sector Private Sector

Public and Private Sector Performance: Deposit Growth
Public Sector Banks
Private Sector Banks
Foreign Banks Scheduled Commercial
Banks
22.9%19.9%
29.1%
22.4%24.1%
8.0% 7.8%
19.8%
Deposits Growth
As on March 28, 2008 (y-o-y)
As on March 27, 2009 (y-o-y)

Case in Point: ICICI versus SBI
0
200
400
600
800
1000
1200Ja
n-07
Mar
-07
May
-07
Jul-0
7
Sep-
07
Nov
-07
Jan-
08
Mar
-08
May
-08
Jul-0
8
Sep-
08
Nov
-08
Jan-
09
Mar
-09
May
-09
Jul-0
9
Sep-
09
Nov
-09
Jan-
10
Mar
-10
CDS
Prem
ium
1 YR CDS Spread
STATE BANK OF INDIA ICICI BANK

Political Implications
The ruling party leader, Sonia Gandhi, claimed that “public sector financial institutions have given our economy the stability and resilience we are now witnessing in the face of the economic slowdown.”
Finance minister, P. Chidambaram, echoed these sentiments by claiming India’s PSBs were strong pillars in the world’s banking industry.
Source: Frontline, 2008

Motivation
PSBs more stable or more government-guaranteed?
Indian Bank Nationalization Act: Explicit guarantee for PSBs.
Outperformance of PSBs due to implicit/explicit sovereign backing?
Did capital gravitate from private banks to PSBs?

Systemic Risk measure: MES
Marginal Expected Shortfall (MES) measureCaptures tail dependence of stock return on the market as a whole. Negative of the average returns for a given bank in the 5% worst days
for the market returns (S&P CNX NIFTY index) during the pre-crisis period from Jan-Dec 2007.
Contribution of each firm to systemic risk in the event of a crisis.
Overall average MES of 3.79% for all firms in our analysis.PSB : 4.34%Private sector banks : 3.58%.
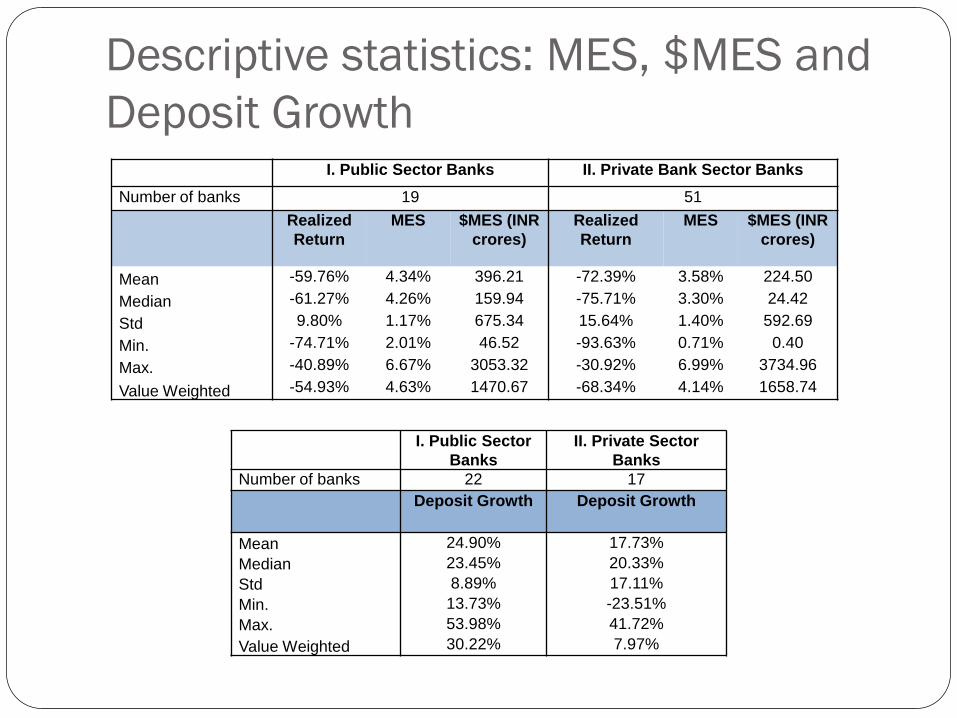
Descriptive statistics: MES, $MES and Deposit Growth
I. Public Sector Banks
II. Private Sector Banks
Number of banks 22 17Deposit Growth Deposit Growth
Mean 24.90% 17.73%Median 23.45% 20.33%Std 8.89% 17.11%Min. 13.73% -23.51%Max. 53.98% 41.72%Value Weighted 30.22% 7.97%
I. Public Sector Banks II. Private Bank Sector BanksNumber of banks 19 51
Realized Return
MES $MES (INR crores)
Realized Return
MES $MES (INR crores)
Mean -59.76% 4.34% 396.21 -72.39% 3.58% 224.50Median -61.27% 4.26% 159.94 -75.71% 3.30% 24.42Std 9.80% 1.17% 675.34 15.64% 1.40% 592.69Min. -74.71% 2.01% 46.52 -93.63% 0.71% 0.40Max. -40.89% 6.67% 3053.32 -30.92% 6.99% 3734.96Value Weighted -54.93% 4.63% 1470.67 -68.34% 4.14% 1658.74
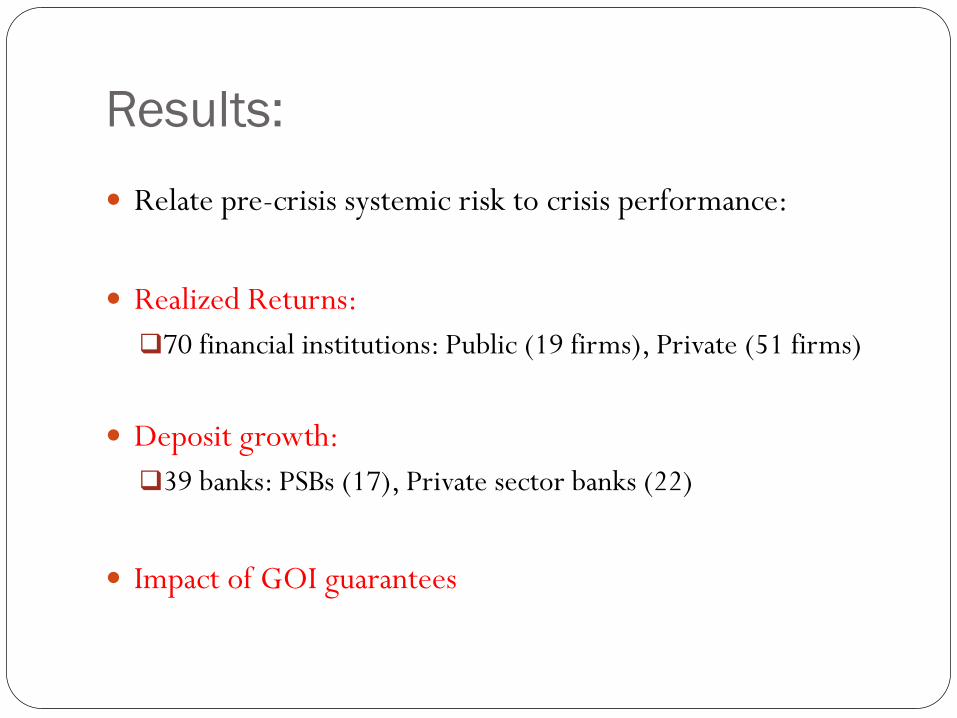
Results: Relate pre-crisis systemic risk to crisis performance:
Realized Returns:70 financial institutions: Public (19 firms), Private (51 firms)
Deposit growth:39 banks: PSBs (17), Private sector banks (22)
Impact of GOI guarantees

Realized Returns: Private Sector Firms
0.00 0.02 0.04 0.06
-1.0
-0.8
-0.6
-0.4
MES
Rea
lized
Ret
urn
ICICI
HDFC HF
HDFC
RELCAP
GMR
BAJAJ HOLD
POWERFIN
IDFC
AXIS
INDBULLSINDINFOLNETWORK18JM FIN
IFCI
KRNTKA
LIC
M&MFIN
ING V
IL&FS
KARUR
TATA INV
SUNDARAMSHRIRAM
SREIBAJAJAUTO
SOUTHINDGEOJIT
CHOLAMANDAL
DEWAN
EMKAYSHARYANS
JINDAL
BALMER
OSCAR
IL&FS INV
GIC
CAN FIN
APOLLO
TRANS
NETWORTH
GRUH
INDBANK MERMOTOR&GEN
AKCAP
VASINFRAHB
JKSYN
SUAVEJRG SECKHANDWALA
JOINDRE

Realized Returns: Private Sector Banks
Banks with higher MES fared poorly.
Pre-crisis MES explains realized returns (R2 of 14.52%). Reliance Capital: High MES (6.28%), low return (-86%). IL&FS: Low MES (1.42%), Higher return (-64%).
Pre-crisis returns (proxy for leverage) negatively impact realized returns.

Realized Returns: Public Sector Firms
0.02 0.03 0.04 0.05 0.06 0.07
-0.7
-0.6
-0.5
-0.4
MES
Rea
lized
Ret
urn
SBI
PNB
CANARA
BOI
IDBI
BOB
UNION
OBC
SYNDICATE
CORP
INDIAN
ALLHBD
ANDHRA
VIJAYA
UCO
J&K
DENA
FED
BOMAHRSHTRA

Realized Returns: Public sector financial firms
Firms with higher MES performed better.
MES* explains nearly 23.27% of returns. SBI (similar to ICICI): Low MES (4.63%), low return (-54%). Union Bank: High MES (5.41%), higher return (-42%)
Attributed to greater implicit/explicit government backing.
* With outlier IDBI excluded

Results: Realized ReturnsMES LVG
PreCrisis Returns Assets
Multiple Regression (Incl. LVG)
Multiple Regression
(Incl. Assets)
PSBs*PrivateBanks PSB
PrivateBanks PSB
PrivateBanks PSBs
PrivateBanks PSB
PrivateBanks PSB
PrivateBanks
Intercept -0.71 -0.56 -0.53 -0.72 -0.57 -0.68 -0.87 -0.85 -0.63 -0.56 -0.83 -0.71t-stat -8.04 -9.68 -7.41 -30.19 -12.46 -24.58 -3.27 -8.96 -6.58 -9.73 -3.07 -7.63MES 2.59 -4.44 3.65 -3.55 2.51 -4.51t-stat 1.31 -3.00 1.82 -2.25 1.15 -2.85
LVG (E-04) -7.17 -0.06 -9.26 -0.11t-stat -1.08 -0.21 -1.37 -0.41PreCrisis Returns -0.05 -0.02 -0.04 -0.02 -0.06 -0.01t-stat -0.83 -2.42 -0.79 -1.57 -1.04 -1.00
Assets (E-02) 2.03 1.31 1.00 2.00t-stat 1.02 1.48 0.55 2.01
Adj. R2 4.05% 14.52% 1.0% -2.08% -1.82% 9.36% 0.27% 2.46% 10.51% 15.45% 0.62% 22.27%Deg. of freedom 16 46 16 46 16 46 16 46 14 44 14 44
*With IDBI included
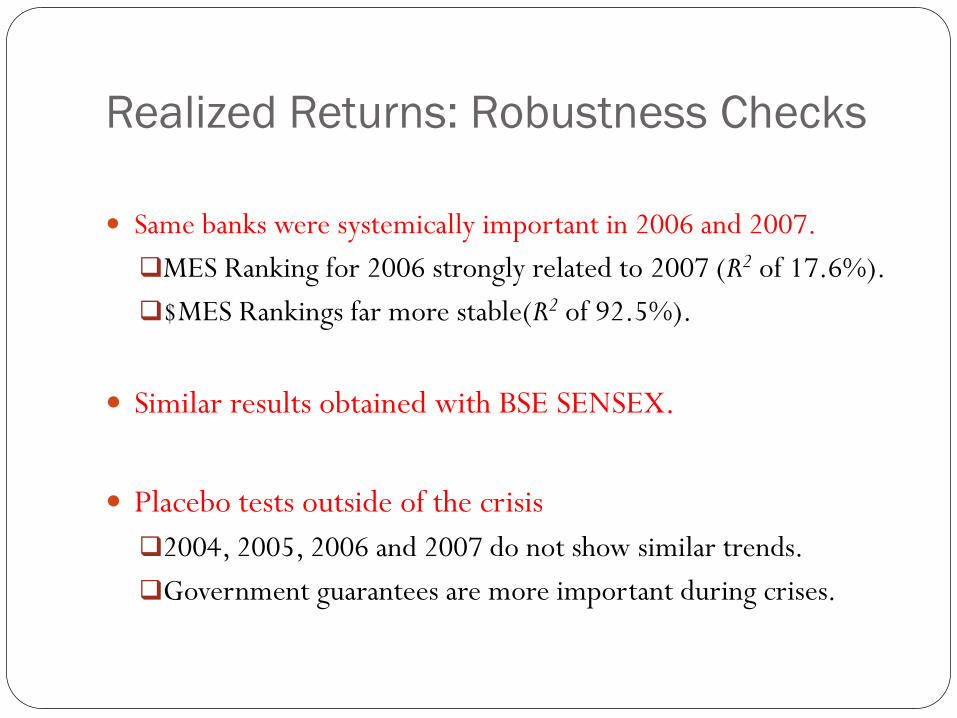
Realized Returns: Robustness Checks
Same banks were systemically important in 2006 and 2007.MES Ranking for 2006 strongly related to 2007 (R2 of 17.6%).$MES Rankings far more stable(R2 of 92.5%).
Similar results obtained with BSE SENSEX.
Placebo tests outside of the crisis2004, 2005, 2006 and 2007 do not show similar trends.Government guarantees are more important during crises.
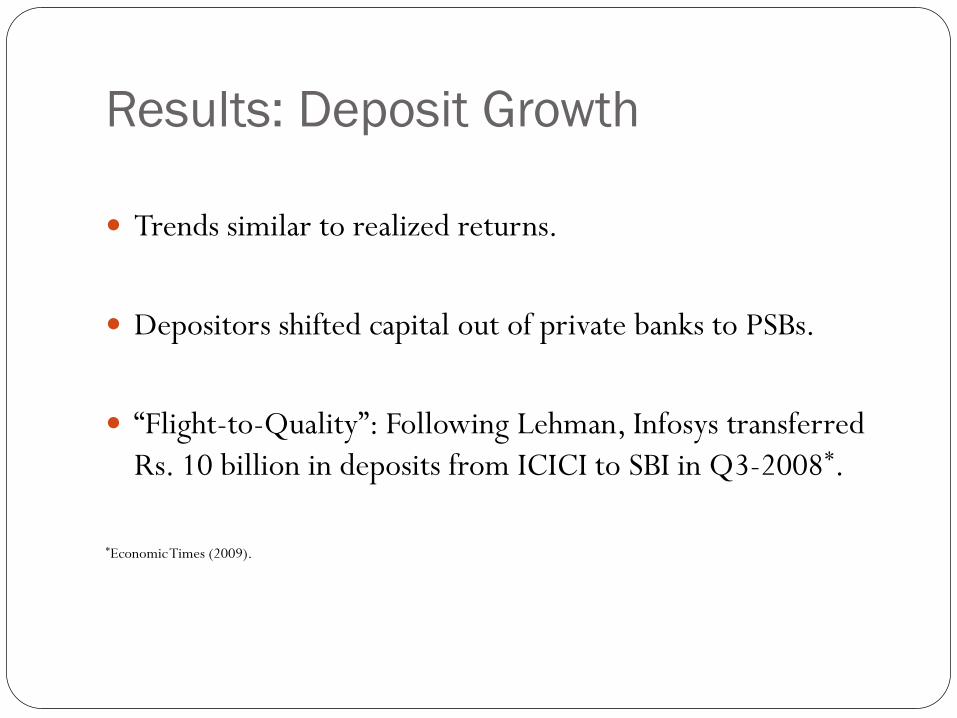
Results: Deposit Growth
Trends similar to realized returns.
Depositors shifted capital out of private banks to PSBs.
“Flight-to-Quality”: Following Lehman, Infosys transferred Rs. 10 billion in deposits from ICICI to SBI in Q3-2008*.
*Economic Times (2009).

Deposit Growth: Private Sector Firms
Axis Bank
Bank of Rajasthan
City Union Bank
Development Credit Bank
Dhanalakshmi Bank
Federal Bank
HDFC Bank
ICICI Bank
IndusInd Bank
ING Vysya Bank
Karnataka Bank
Karur Vysya Bank
Kotak Mahindra Bank
Lakshmi Vilas Bank
South Indian BankYes Bank
-30%
-20%
-10%
0%
10%
20%
30%
40%
50%
0.00% 1.00% 2.00% 3.00% 4.00% 5.00% 6.00% 7.00%Cris
is D
epos
it G
row
th
MES

Deposit Growth: Private Sector Firms
MES explains a large proportion of deposit growth (R2 of 15.19%).
Firms with high systemic risk performed poorly. Indusland bank : High MES (5.90%), Low growth (16%). Axis bank: Low MES (3.75%), High growth (34%).

Deposit Growth: Public Sector Firms
State Bank of India
State Bank of Bikaner and Jaipur
State Bank of Mysore
State Bank of Travancore
Allahabad BankAndhra Bank
Bank of Baroda Bank of IndiaBank of Maharashtra
Canara BankCentral Bank of India
Corporation Bank
Dena Bank
Indian Bank
Indian Overseas Bank
Oriental Bank of Commerce
Punjab National BankSyndicate Bank
UCO Bank
Union Bank of India
Jammu & Kashmir BankVijaya Bank
IDBI Bank Ltd.
0%
10%
20%
30%
40%
50%
60%
0.00% 1.00% 2.00% 3.00% 4.00% 5.00% 6.00% 7.00% 8.00%
Cris
is D
epos
it G
row
th
MES

Deposit Growth: Public Sector Firms
Depositors reward firms with greater systemic risk.
MES coefficient explains deposit growth (R2 of 28.78%).
High systemic risk implies greater likelihood of bailout.State Bank of India: High MES (4.63%), high growth (38%). Andhra Bank: Low MES (3.61%), low growth (20%).

Results: Deposit GrowthMES LVG
PreCrisis Returns Assets
Multiple Regression (Incl. LVG)
Multiple Regression
(Incl. Assets)
PSBPrivateBanks PSB
PrivateBanks PSB
PrivateBanks PSB
PrivateBanks PSB
PrivateBanks PSB
PrivateBanks
Intercept 0.11 0.48 0.24 0.21 0.22 0.24 -0.08 0.32 0.09 0.46 -0.11 0.50
t-stat 2.43 3.01 12.30 4.16 5.66 3.21 -0.42 0.86 1.73 2.62 -0.61 1.35MES 3.40 -8.49 3.29 -6.74 2.97 -7.71t-stat 3.08 -1.97 3.04 -1.23 2.60 -1.47
LVG (E-08) 2.01 -30.10 1.87 -13.10t-stat 1.36 -1.19 1.51 -0.47PreCrisis Returns 0.04 -0.06 0.03 -0.02 0.03 -0.02t-stat 0.92 -1.03 0.75 -0.37 0.88 -0.34
Assets (E-02) 2.46 -1.13 1.60 -0.19t-stat 1.65 -0.38 1.18 -0.07
Adj. R2 28.78% 15.19% 3.95% 2.46% -0.74% 0.37% 7.58% -5.63% 32.14% 4.61% 29.04% 3.03%Deg. of freedom 20 15 20 15 20 15 20 15 18 13 18 13

Capital Injection in PSBs GOI announced fiscal stimulus in December 2008. Promised capital to PSBs to help maintain CRAR of 12%.Dec. 2008: GOI requested Rs.1700 cr. from World BankDec .2008-Feb. 2009, announced capital injection in 4 PSBs: UCO
Bank (Rs. 450 cr.), Central Bank of India (Rs. 700 cr.) and Vijaya Bank (Rs. 500 cr.).
2008-2009: Injected Rs. 250 cr. in United Bank of India. 2010-11 budget allocates Rs. 16,500 cr. to help maintain Tier- 1
capital ratio of 8%. IDBI Bank (Rs. 3,119 cr.), Central Bank (Rs. 2,016 cr.), Bank of
Maharashtra (Rs. 590 cr.), UCO Bank (Rs. 375 cr.) and Union Bank (Rs. 111 cr.)

Explicit government guarantee: Capital injections determined based on PSB funding requirements.
Poor performing PSBs more likely to receive GOI support.
PSBs receiving capital (except Union Bank) had Tier-1 capital < 8%. Bank of Maharashtra (6.1%), Central Bank of India (7.0%), UCO
Bank (6.5%), Union Bank of India (8.2%), Vijaya Bank (7.7%), IDBI Bank (6.8%).
Among the riskier banks. MES: IDBI (6.67%), Union Bank of India (5.41%),Vijaya Bank
(5.02%), UCO (4.26%) IDBI: Received highest capital injection of Rs 3,119 crores.

Implicit government guarantees: Q-o-Q Realized Return
Q1 2008 Q2 2008 Q3 2008 Q4 2008 Q1 2009
PSBPrivate Sector PSB
Private Sector PSB
Private Sector PSB
Private Sector PSB
Private Sector
Intercept -0.27 -0.33 -0.21 0.21 -0.10 -0.16 -0.32 -0.21 -0.15 -0.08t-stat -3.80 -4.95 -2.58 1.34 -0.61 -2.07 -3.62 -3.52 -2.01 -1.53MES -2.12 -3.01 -0.82 -8.75 7.43 2.18 5.22 -1.47 -1.73 -2.99t-stat -1.34 -1.75 -0.46 -2.17 2.04 1.06 2.63 -0.95 -1.07 -2.19Adj. R-squared 4.22% 3.97% -4.57% 6.93% 14.98% 0.23% 24.77% -0.20% 0.78% 7.06%Deg. of freedom 17 49 17 49 17 49 17 49 17 49
As the crisis deepened, government guarantees became important and riskier PSBs outperformed in Q3 & Q4, 2008

Implicit government guarantees: Q-o-Q Deposit Growth
2007 Q1 2007 Q2 2007 Q3 2007 Q4 2008 Q1 2008 Q2 2008 Q3 2008 Q4 2009 Q1
9.3%
2.2%
7.2%
3.1%
10.4%
1.7%
5.5% 5.2%
12.0%13.2%
6.2%2.2%
2.6%
10.3%
0.0%
1.0%
-0.3%
8.2%
Q-o-Q Deposit Growth
Public Private

Related Literature
Bank behavior in the presence of bailouts: Penati and Protopapadakis (1988), Perotti and Suarez (2002), Cordella and Yeyati (2003).
Likelihood of bank bailouts: Brown and Dinç (2009), Acharya and Yorulmazer (2007).
Bailout of U.S. banks: Veronesi and Zingales (2009).
Our paper examines markets reaction when the guarantee is explicit (as for PSBs) and when no such guarantee exists (as for private sector banks) during crisis period.

Conclusion
Access to government guarantees provides stability.
Our analysis suggests this results in crowding out of private sector.
Policy implications: Caution against delaying privatization of Indian financial sector
Several examples of state-owned or –guaranteed “banks” going bad: GSEs in the United States, Landesbanken in Germany and Cajas in Spain