The Smart Social Report V3 - Social Video Strategy, Social Sharing Trends, Content Planning Cycle,...
58
Report: Volume Three The
-
Upload
spredfast -
Category
Social Media
-
view
26 -
download
0
Transcript of The Smart Social Report V3 - Social Video Strategy, Social Sharing Trends, Content Planning Cycle,...
Report: Volume Three
The

2The Smart Social Report: Volume Three
There was no way to anticipate, when we launched our first quarterly Smart Social report, exactly what the future might hold. Three quarters later, and Periscope users collectively watch over 40 years of video each and every day. Facebook and Pinterest users who see a product they like in a sponsored post can now click to buy it without ever leaving the app. And publishers can now feature their work directly on Facebook through its Instant Articles. The developments come as quickly as the trending moments pass, and it’s the tough job of any and every marketer to stay abreast of what’s current in order to capitalize on what’s next.
If we look back to brands’ sophistication and strategy near the beginning of the year, there are clear denotations of progress. Brands commit to best practices while experimenting in new, even risky ways. We’ve documented their efforts for you, so you can learn from the pioneers and the major players.
This quarter we’ve continued to check in with the 50 major brands that make up our State of Social report. Also included is a six-month study on how brands use video across all social networks, a collection of steal-worthy insights from the NFL, a survey whose results offer unique insight into the content planning landscape, and a view on which content strategies work for reaching different genders.
At Spredfast, we help marketers work smarter. Our software helps our customers extract meaning from data, and the insights in this report are efforts to do the same. We hope you’ll find your next great strategy or unexpected move within these pages.
It’s time to get smarter about
social.
Jim Rudden | CMO, Spredfast
3The Smart Social Report: Volume Three
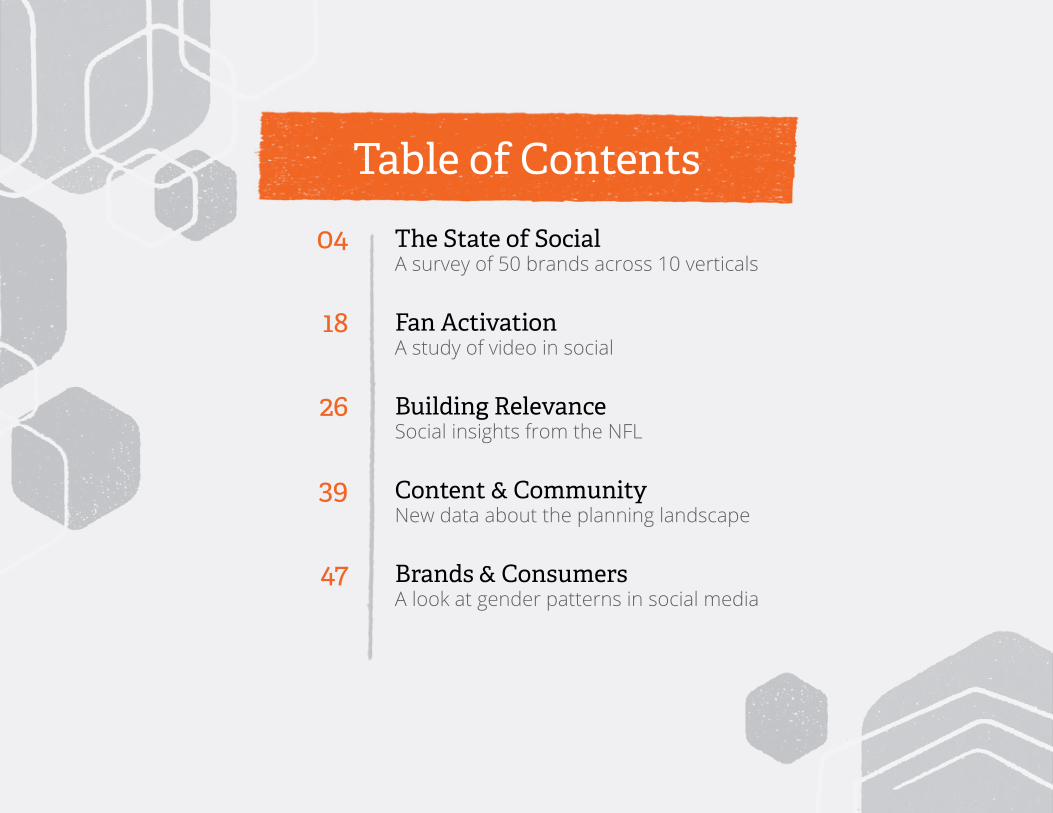
The State of Social A survey of 50 brands across 10 verticals
Fan Activation A study of video in social
Building Relevance Social insights from the NFL
Content & Community New data about the planning landscape
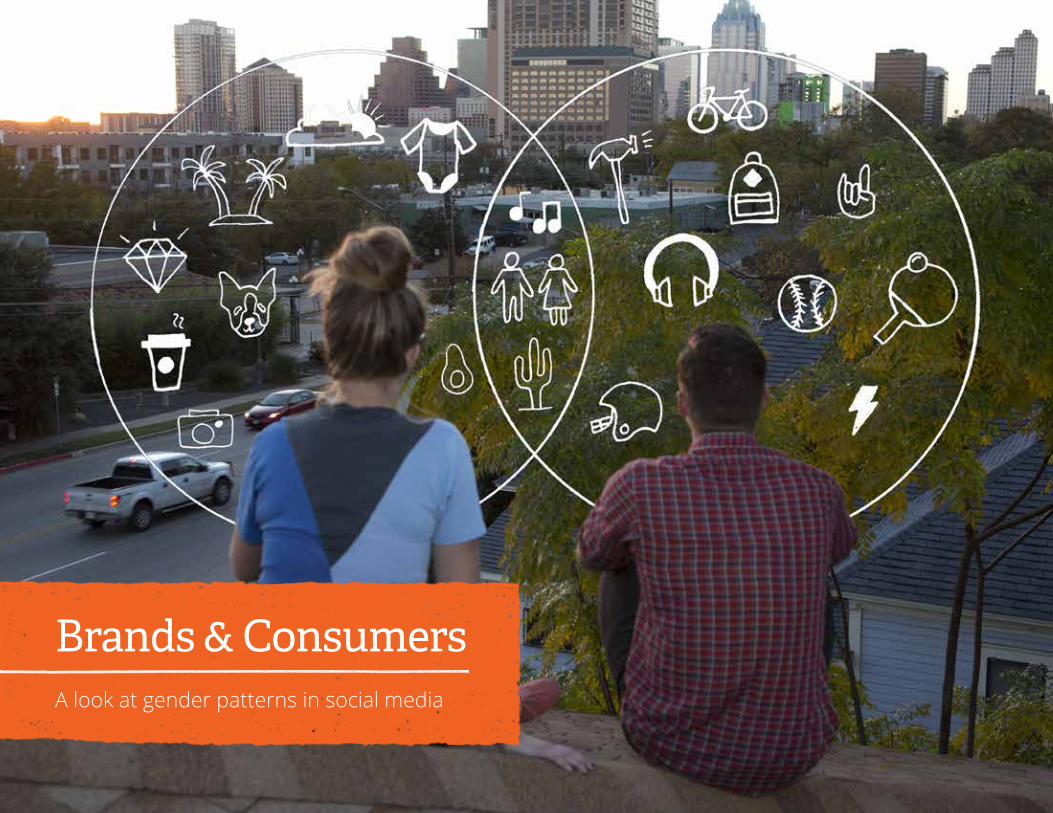
Brands & Consumers A look at gender patterns in social media
04
18
26
39
47
Table of Contents

4The Smart Social Report: Volume Three
The State of SocialA survey of 50 brands across 10 verticals
5The Smart Social Report: Volume Three
IntroductionThe State of Social report is our quarterly check-in with 50 of the top brands in the world and their sophistication across the major social properties. In Q3, we looked at the same eight channels as we’ve done in the past and researched new tactics, strategies, and campaigns to see who pushed the envelope in the social world.
Last quarter, Sports, Retail, and Automotive were the leading industries in our study. Who led the industry in Q3? Let’s dive into the data.
6The Smart Social Report: Volume Three
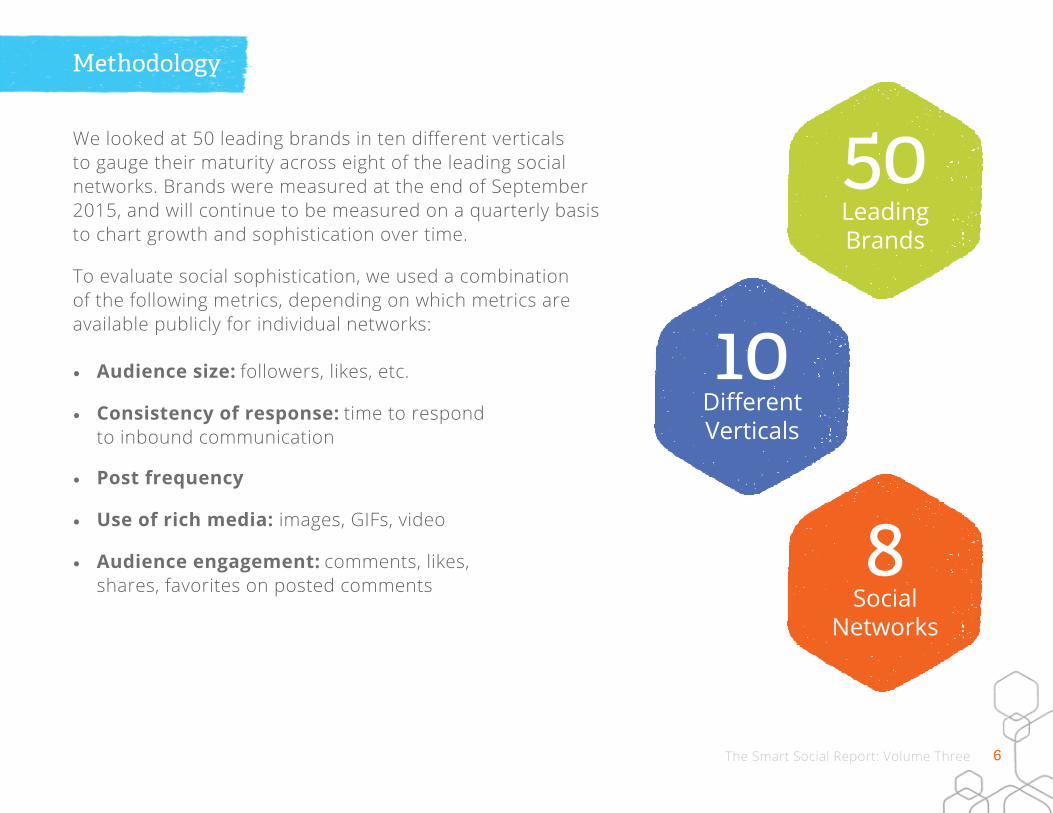
• Audience size: followers, likes, etc.
• Consistency of response: time to respond to inbound communication
• Post frequency
• Use of rich media: images, GIFs, video
• Audience engagement: comments, likes, shares, favorites on posted comments
Methodology
We looked at 50 leading brands in ten different verticals to gauge their maturity across eight of the leading social networks. Brands were measured at the end of September 2015, and will continue to be measured on a quarterly basis to chart growth and sophistication over time.
To evaluate social sophistication, we used a combination of the following metrics, depending on which metrics are available publicly for individual networks:
50Leading Brands
10Different Verticals
8Social
Networks

7The Smart Social Report: Volume Three
Growth In Social Channels Varies by VerticalThe Q1-to-Q3 growth over channels was fairly diverse—retail brands saw the most growth on YouTube, financial services saw the largest increases on Pinterest and Google+, and sports brands saw their Facebook and Snapchat sophistication grow at the highest rates.
The Gap is WideningOverall, the entire field of 50 brands in the study improved their social sophistication, but the rate of improvement was not consistent. The brands that composed the top verticals in the study (media and sports) pulled further away from their peers by showing the biggest improvements across all social properties quarter over quarter. Electronics/Tech saw the third largest increase of any vertical in sophistication from Q2 to Q3.
Key Takeaways
The leaders remain in the lead: FOR NOW
The Top Three Verticals Remained at the Top, But BarelyBrands from the sports, media, and automotive verticals in our study remained the top three verticals, just as they were in Q2. But retailers were close behind automotive, threatening to take one of the top spots back, which they held in Q1.
8The Smart Social Report: Volume Three 8
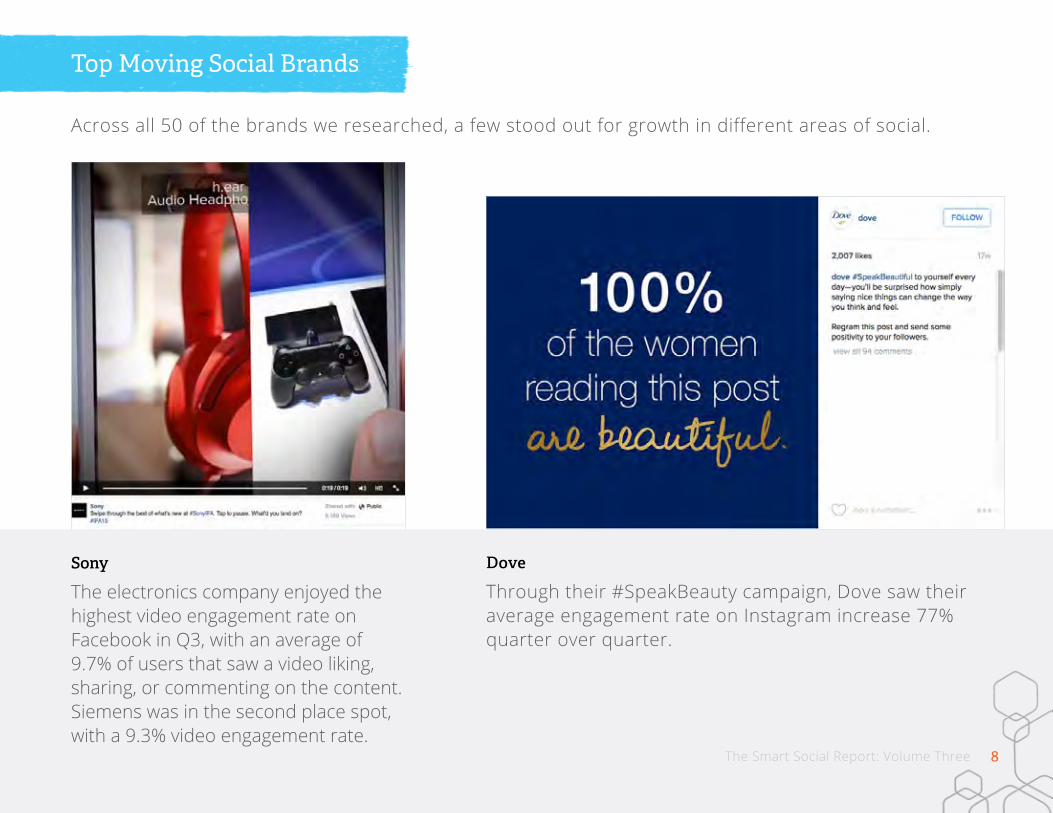
Across all 50 of the brands we researched, a few stood out for growth in different areas of social.
Top Moving Social Brands
Sony
The electronics company enjoyed the highest video engagement rate on Facebook in Q3, with an average of 9.7% of users that saw a video liking, sharing, or commenting on the content. Siemens was in the second place spot, with a 9.3% video engagement rate.
Dove
Through their #SpeakBeauty campaign, Dove saw their average engagement rate on Instagram increase 77% quarter over quarter.
The Smart Social Report: Volume Three
9The Smart Social Report: Volume Three 9
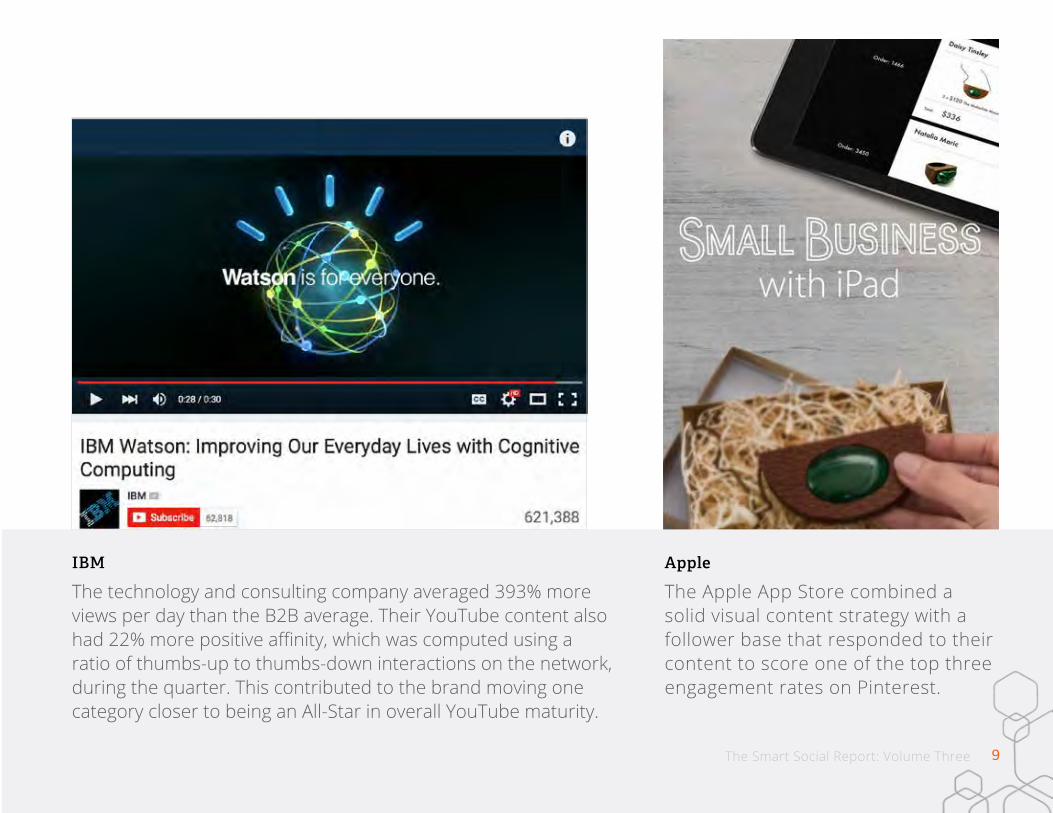
Apple
The Apple App Store combined a solid visual content strategy with a follower base that responded to their content to score one of the top three engagement rates on Pinterest.
IBM
The technology and consulting company averaged 393% more views per day than the B2B average. Their YouTube content also had 22% more positive affinity, which was computed using a ratio of thumbs-up to thumbs-down interactions on the network, during the quarter. This contributed to the brand moving one category closer to being an All-Star in overall YouTube maturity.
The Smart Social Report: Volume Three
10The Smart Social Report: Volume Three
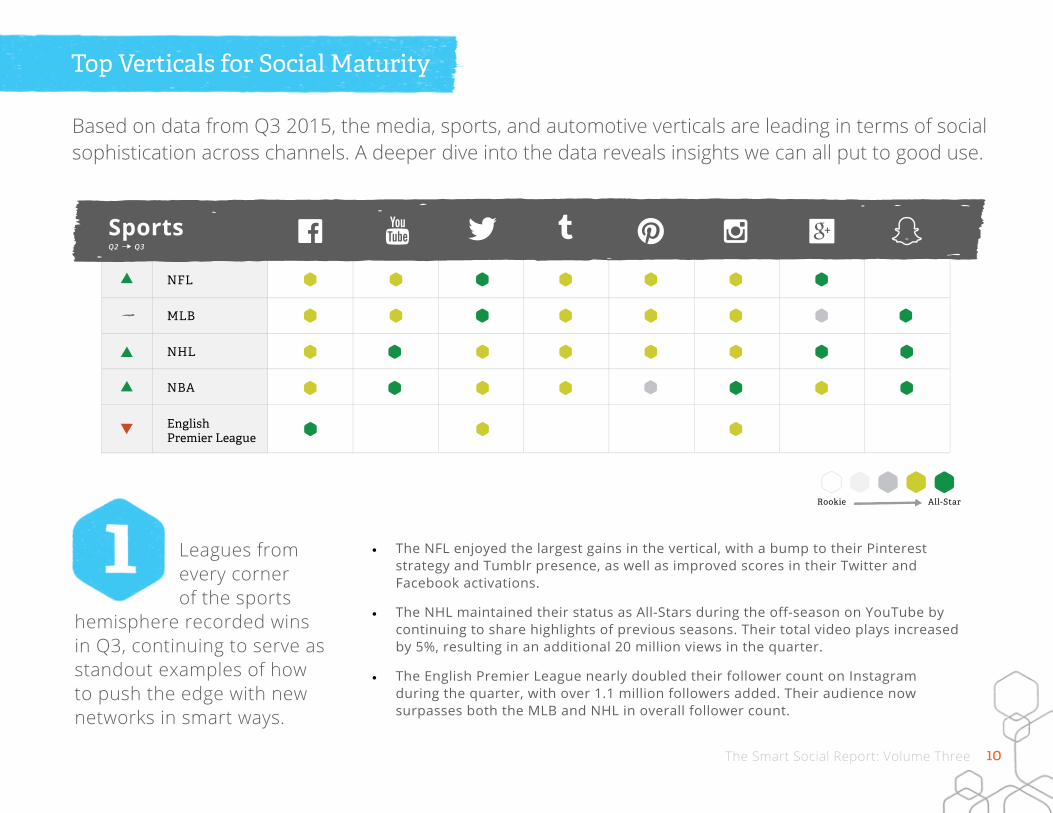
• The NFL enjoyed the largest gains in the vertical, with a bump to their Pinterest strategy and Tumblr presence, as well as improved scores in their Twitter and Facebook activations.
• The NHL maintained their status as All-Stars during the off-season on YouTube by continuing to share highlights of previous seasons. Their total video plays increased by 5%, resulting in an additional 20 million views in the quarter.
• The English Premier League nearly doubled their follower count on Instagram during the quarter, with over 1.1 million followers added. Their audience now surpasses both the MLB and NHL in overall follower count.
Leagues from every corner of the sports
hemisphere recorded wins in Q3, continuing to serve as standout examples of how to push the edge with new networks in smart ways.
Based on data from Q3 2015, the media, sports, and automotive verticals are leading in terms of social sophistication across channels. A deeper dive into the data reveals insights we can all put to good use.
Top Verticals for Social Maturity
11The Smart Social Report: Volume Three
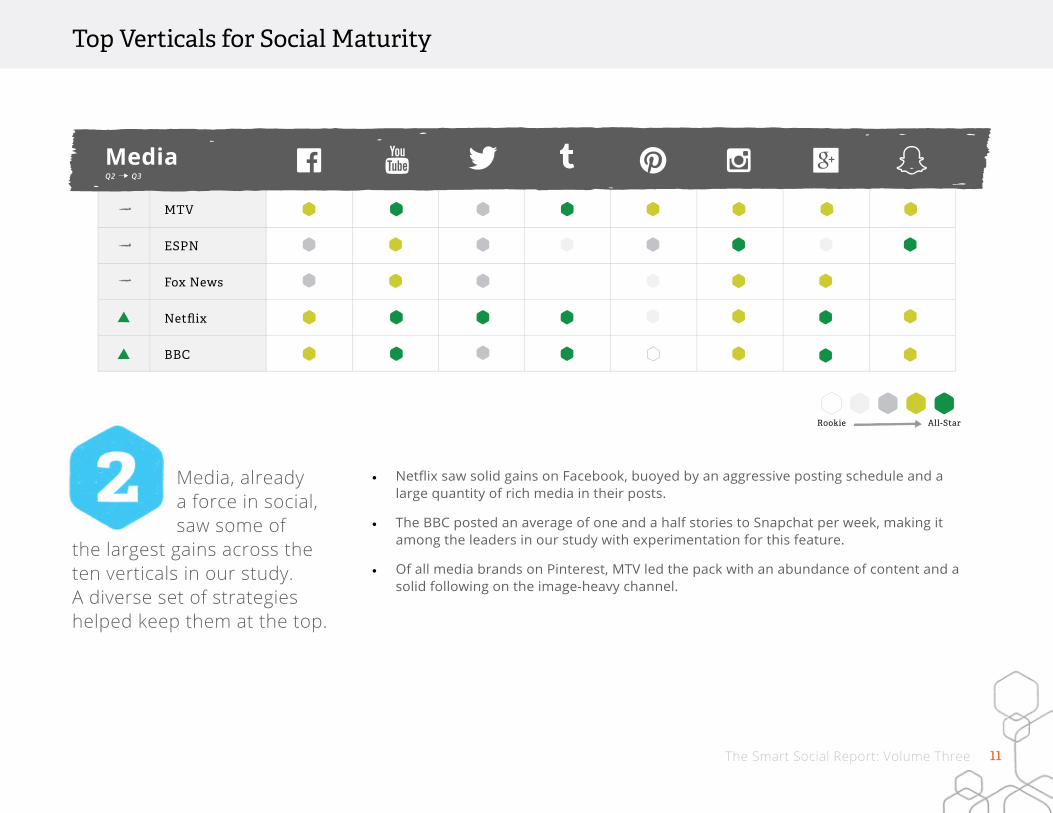
• Netflix saw solid gains on Facebook, buoyed by an aggressive posting schedule and a large quantity of rich media in their posts.
• The BBC posted an average of one and a half stories to Snapchat per week, making it among the leaders in our study with experimentation for this feature.
• Of all media brands on Pinterest, MTV led the pack with an abundance of content and a solid following on the image-heavy channel.
Top Verticals for Social Maturity
Media, already a force in social, saw some of
the largest gains across the ten verticals in our study. A diverse set of strategies helped keep them at the top.
12The Smart Social Report: Volume Three
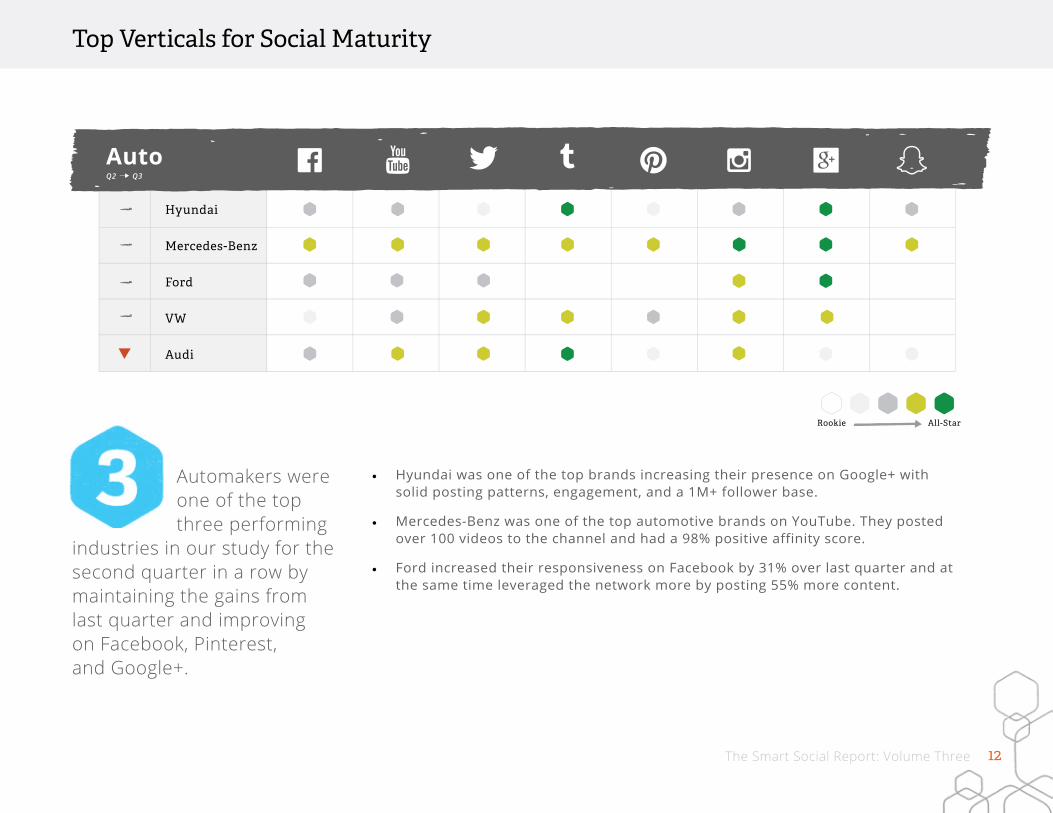
Top Verticals for Social Maturity
• Hyundai was one of the top brands increasing their presence on Google+ with solid posting patterns, engagement, and a 1M+ follower base.
• Mercedes-Benz was one of the top automotive brands on YouTube. They posted over 100 videos to the channel and had a 98% positive affinity score.
• Ford increased their responsiveness on Facebook by 31% over last quarter and at the same time leveraged the network more by posting 55% more content.
Automakers were one of the top three performing
industries in our study for the second quarter in a row by maintaining the gains from last quarter and improving on Facebook, Pinterest, and Google+.

13The Smart Social Report: Volume Three

14The Smart Social Report: Volume Three

15The Smart Social Report: Volume Three

16The Smart Social Report: Volume Three
17The Smart Social Report: Volume Three
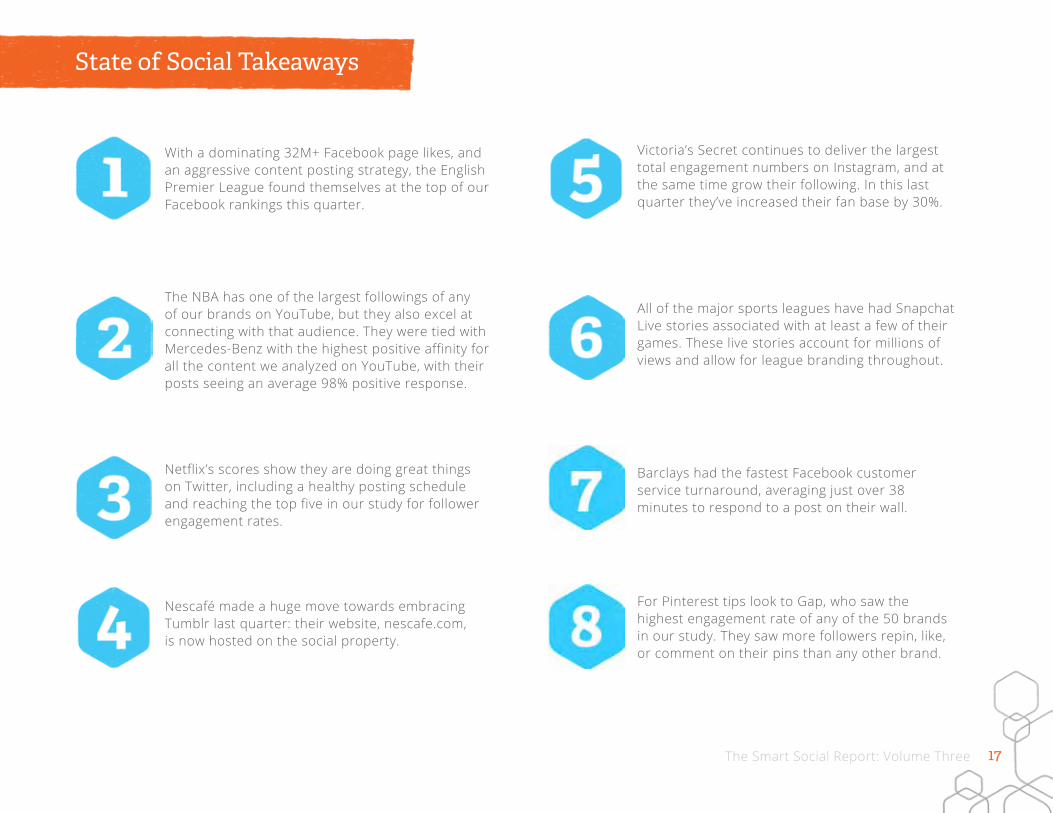
With a dominating 32M+ Facebook page likes, and an aggressive content posting strategy, the English Premier League found themselves at the top of our Facebook rankings this quarter.
The NBA has one of the largest followings of any of our brands on YouTube, but they also excel at connecting with that audience. They were tied with Mercedes-Benz with the highest positive affinity for all the content we analyzed on YouTube, with their posts seeing an average 98% positive response.
Nescafé made a huge move towards embracing Tumblr last quarter: their website, nescafe.com, is now hosted on the social property.
State of Social Takeaways
Netflix’s scores show they are doing great things on Twitter, including a healthy posting schedule and reaching the top five in our study for follower engagement rates.
Victoria’s Secret continues to deliver the largest total engagement numbers on Instagram, and at the same time grow their following. In this last quarter they’ve increased their fan base by 30%.
All of the major sports leagues have had Snapchat Live stories associated with at least a few of their games. These live stories account for millions of views and allow for league branding throughout.
For Pinterest tips look to Gap, who saw the highest engagement rate of any of the 50 brands in our study. They saw more followers repin, like, or comment on their pins than any other brand.
Barclays had the fastest Facebook customer service turnaround, averaging just over 38 minutes to respond to a post on their wall.
18The Smart Social Report: Volume Three
Fan ActivationA study of video in social

19The Smart Social Report: Volume Three
What Motion Moves Your AudienceMarketers are excited about video, and a quick look at the industry tells us why. It’s no secret that time spent watching television—traditional “video”—has fallen thanks in part to increased time spent on mobile devices. And according to venture capital firm KPCB, as consumers spend more time on their mobile devices they are also increasing the amount of time spent on social media year-over-year. In other words: social has become video’s new home. Social media companies have responded by devoting considerable resources to native video streaming.
When producing and distributing video content for an on-the-go audience, what are leading brands doing today? Which tactics are they incorporating and what trends are they setting? We researched the rise of video to map the state of video content today and provide insight into how brands should plan for and allocate resources in the new year.
20The Smart Social Report: Volume Three
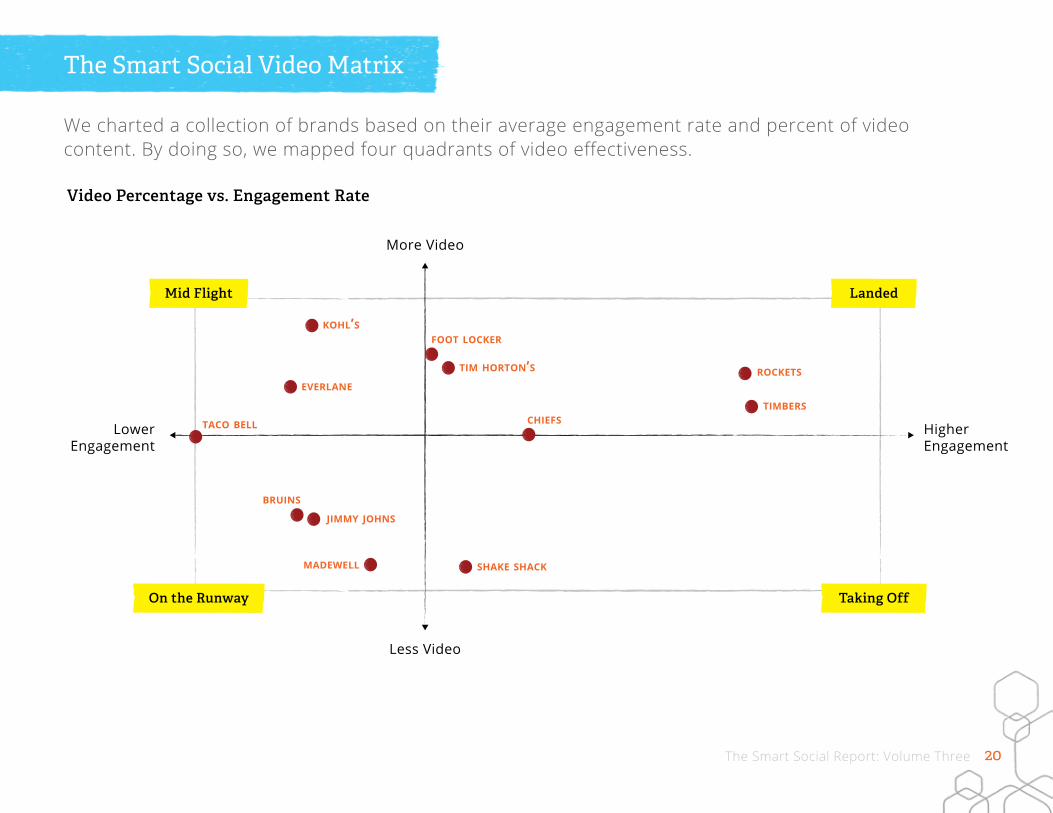
Video Percentage vs. Engagement Rate
We charted a collection of brands based on their average engagement rate and percent of video content. By doing so, we mapped four quadrants of video effectiveness.
The Smart Social Video Matrix
Landed
Taking Off
Mid Flight
On the Runway
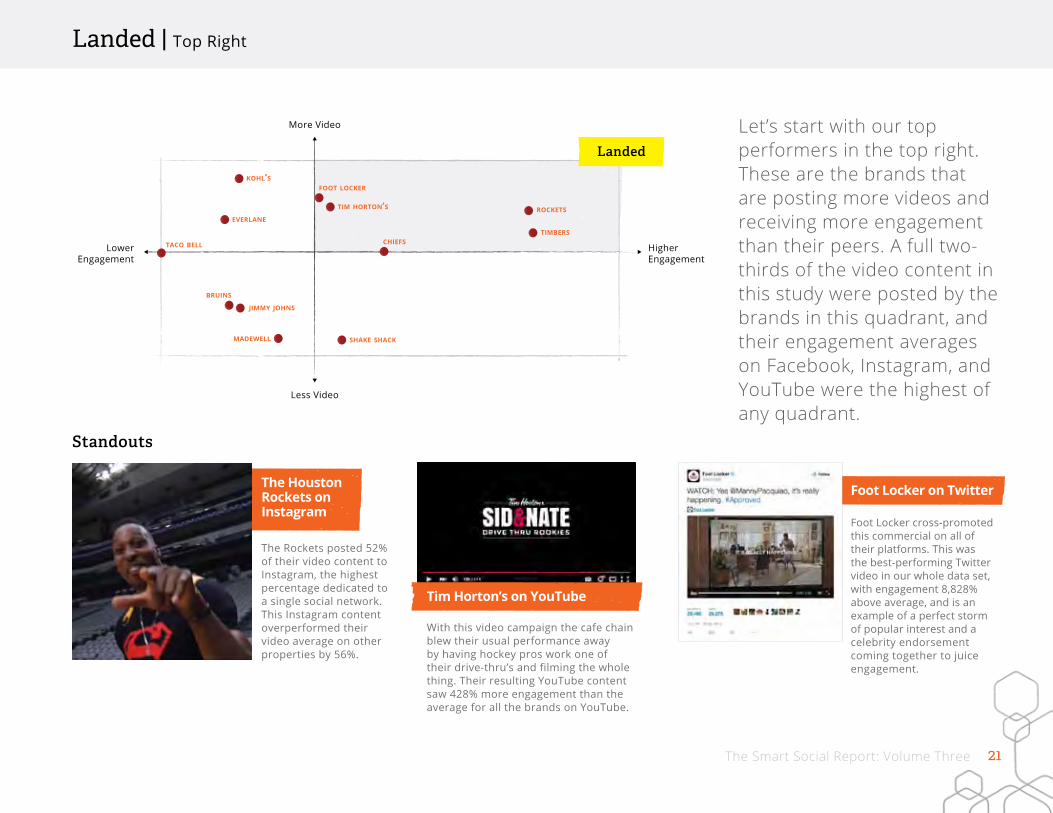
21The Smart Social Report: Volume Three
Standouts
Let’s start with our top performers in the top right. These are the brands that are posting more videos and receiving more engagement than their peers. A full two-thirds of the video content in this study were posted by the brands in this quadrant, and their engagement averages on Facebook, Instagram, and YouTube were the highest of any quadrant.
Landed | Top Right
The Houston Rockets on Instagram
Tim Horton’s on YouTube
Foot Locker on Twitter
The Rockets posted 52% of their video content to Instagram, the highest percentage dedicated to a single social network. This Instagram content overperformed their video average on other properties by 56%.
With this video campaign the cafe chain blew their usual performance away by having hockey pros work one of their drive-thru’s and filming the whole thing. Their resulting YouTube content saw 428% more engagement than the average for all the brands on YouTube.
Foot Locker cross-promoted this commercial on all of their platforms. This was the best-performing Twitter video in our whole data set, with engagement 8,828% above average, and is an example of a perfect storm of popular interest and a celebrity endorsement coming together to juice engagement.
Landed
22The Smart Social Report: Volume Three
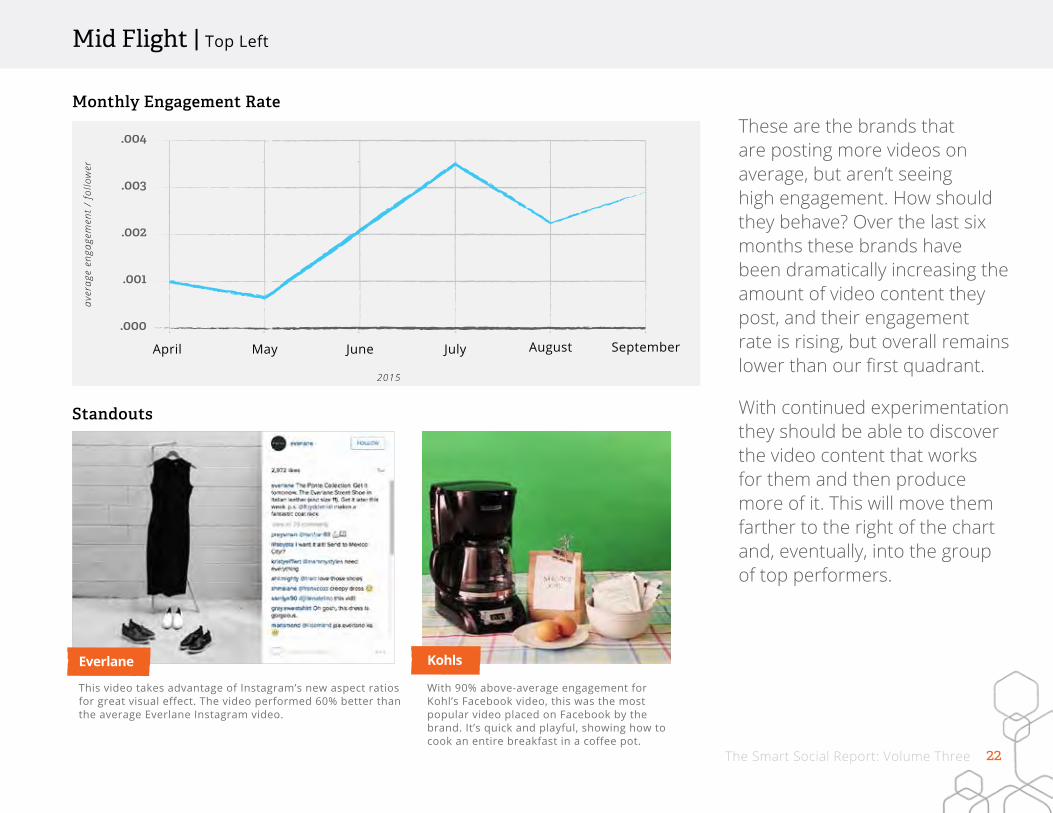
Monthly Engagement Rate
These are the brands that are posting more videos on average, but aren’t seeing high engagement. How should they behave? Over the last six months these brands have been dramatically increasing the amount of video content they post, and their engagement rate is rising, but overall remains lower than our first quadrant.
With continued experimentation they should be able to discover the video content that works for them and then produce more of it. This will move them farther to the right of the chart and, eventually, into the group of top performers.
Mid Flight | Top Left
Everlane
This video takes advantage of Instagram’s new aspect ratios for great visual effect. The video performed 60% better than the average Everlane Instagram video.
Kohls
With 90% above-average engagement for Kohl’s Facebook video, this was the most popular video placed on Facebook by the brand. It’s quick and playful, showing how to cook an entire breakfast in a coffee pot.
Standouts

23The Smart Social Report: Volume Three
There is only one brand in this category currently, and like those who are sitting on the runway, this is a hard category to stay in. The data says that Shake Shack should be posting more video. Their followers have engaged with the content they’ve provided—but they have yet to take advantage of more than one channel at once.
Posting more video would increase their video content percentage and by maintaining their engagement rate they’d move into the same category as those brands who post consistently and stand out from the shuffle.
Taking Off | Bottom Right
Standouts
Madison Square Park
Shake Shack tapped into nostalgia over their original location reopening. This is a perfect example of taking a regular business event and leveraging it for greater engagement. This delivered 31% more engagement than the average of all of Shake Shack’s video content.
Jurassic Park Fun
By engaging a popular Instagram influencer this video joined on the bandwagon for the release of the latest Jurassic Park movie. The clever play on the original resonated deeply with Shake Shack devotees and turned in 16% above average engagement for the fast food chain.
Taking Off
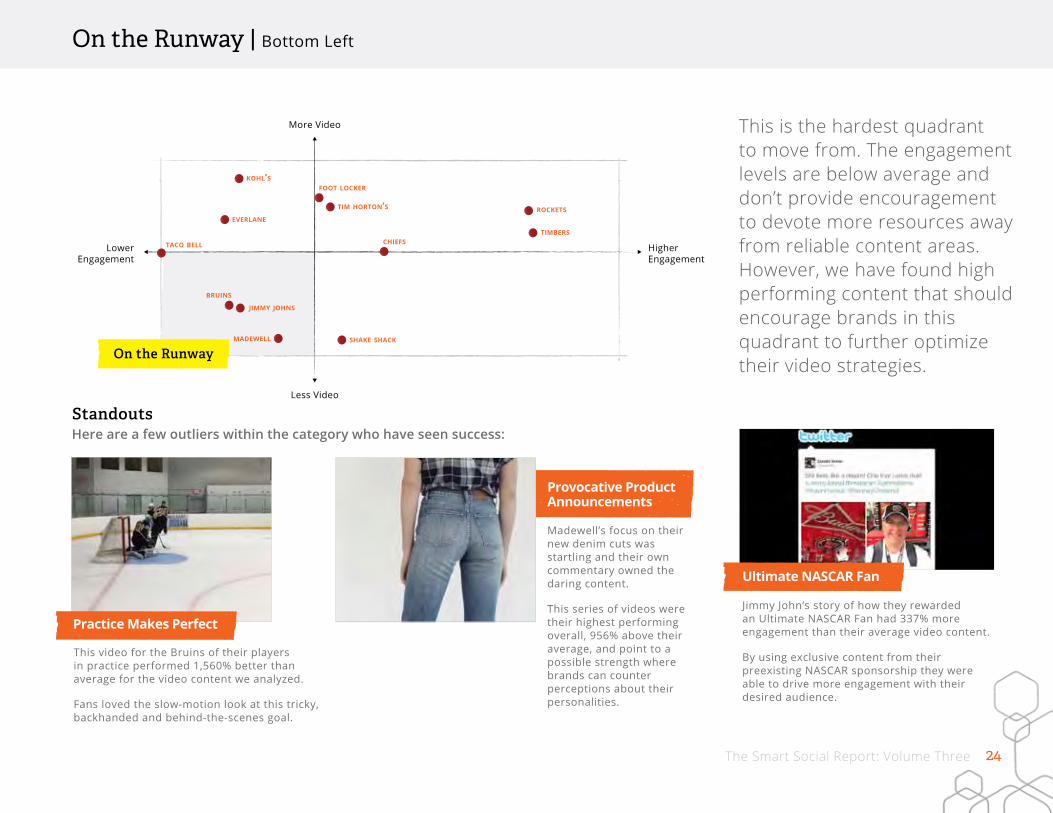
24The Smart Social Report: Volume Three
This is the hardest quadrant to move from. The engagement levels are below average and don’t provide encouragement to devote more resources away from reliable content areas. However, we have found high performing content that should encourage brands in this quadrant to further optimize their video strategies.
On the Runway | Bottom Left
Standouts
Practice Makes Perfect
Ultimate NASCAR Fan
This video for the Bruins of their players in practice performed 1,560% better than average for the video content we analyzed.
Fans loved the slow-motion look at this tricky, backhanded and behind-the-scenes goal.
Jimmy John’s story of how they rewarded an Ultimate NASCAR Fan had 337% more engagement than their average video content.
By using exclusive content from their preexisting NASCAR sponsorship they were able to drive more engagement with their desired audience.
Provocative Product Announcements
Madewell’s focus on their new denim cuts was startling and their own commentary owned the daring content.
This series of videos were their highest performing overall, 956% above their average, and point to a possible strength where brands can counter perceptions about their personalities.
On the Runway
Here are a few outliers within the category who have seen success:

25The Smart Social Report: Volume Three
We found that success in video isn’t limited to specific verticals, and that this is still a content category that’s defined first and foremost by experimentation. For brands that are new to video or haven’t seen the response they were hoping for we recommend taking these steps:
• Dig Deeper on Data Many social networks provide data on where viewership drops off within a video. Take a look at your own video content: are there common visual or narrative elements at these points? If you post the same video to multiple networks, but the drop-off point varies between them, consider producing multiple versions optimized for the intended audience.
• Cast a Wide Net However, don’t leave any social network behind: the brands we saw with higher average engagement rates distributed the videos across all available properties. We found a strong correlation between lower engagement rates and overly relying on one platform or another. Foot Locker pursued this strategy with success by sharing the same videos natively on Instagram and Facebook. Their engagement for these videos was equivalent on both platforms and was just above the average engagement seen for all brands in the study.
• Change it Up This is true for every brand, but use data to consistently check in on and take note on what works. If a strategy that previously worked has become stale, don’t be afraid to try something new. We saw Kohl’s change their strategy by beginning to post more video content month-over-month and at the same time they saw an increased average video engagement. From July to September they posted 54% more video content than from April to June and received 184% more engagement on average.
How to be a Video Vanguard
26The Smart Social Report: Volume Three
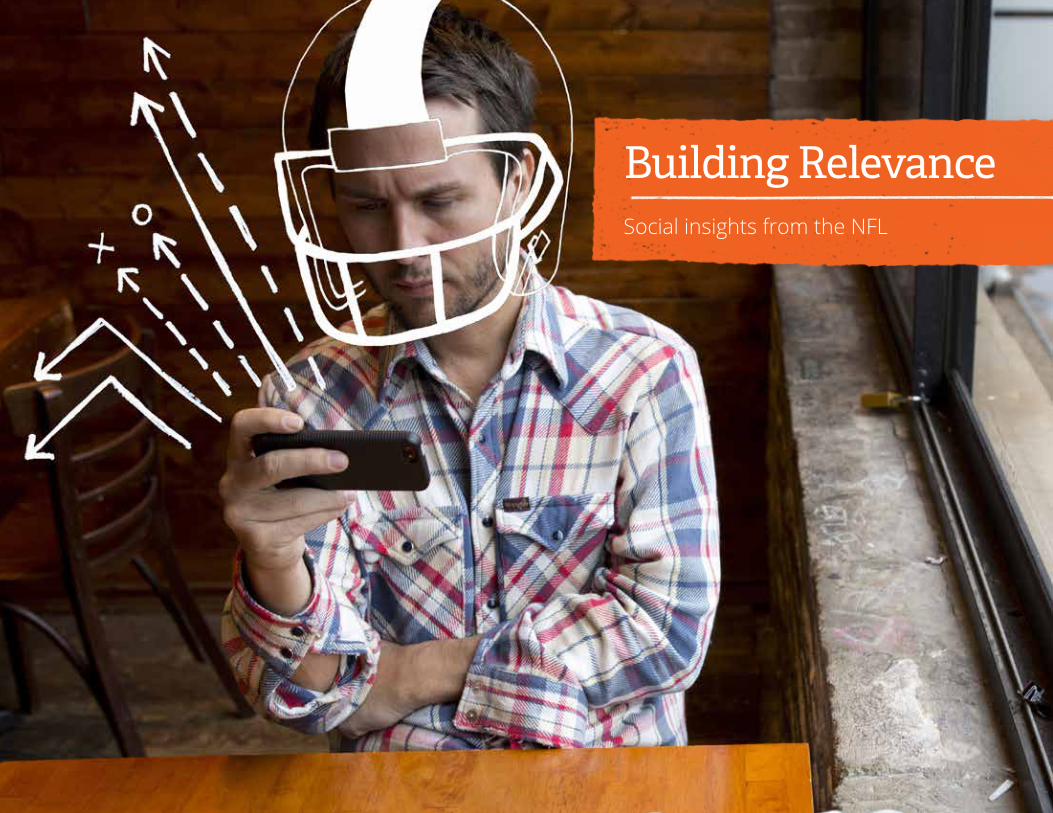
Building RelevanceSocial insights from the NFL
27The Smart Social Report: Volume Three
(Social) Team SpiritEvery fall in the US, football season greets eager fans with the promise of exciting plays, big matchups, and the renewed hope for a playoff run. But the players on the field aren’t the only ones working up a sweat to get their fan base excited— social media teams from across the league are creating content before, during, and after games to keep the social conversation flowing and, with any luck, lead their team to victory.
But with the uncertainty that comes along with every professional sport—win/loss records, players’ moves, and seasonality—how can teams make the most of their social opportunities? And what can marketers from any industry glean from the patterns of success we see within the NFL?
To answer these questions, we built a database of Tweets that reflected audience attitudes towards each team. The data included Tweets mentioning teams during the 2014 season and 2015 off-season, as well as the Tweets posted from all 32 NFL team accounts. All in all, we looked at over 100 million Tweets to find patterns from fans and teams to figure out how social media teams for pro football organizations best engage their audience.
28The Smart Social Report: Volume Three
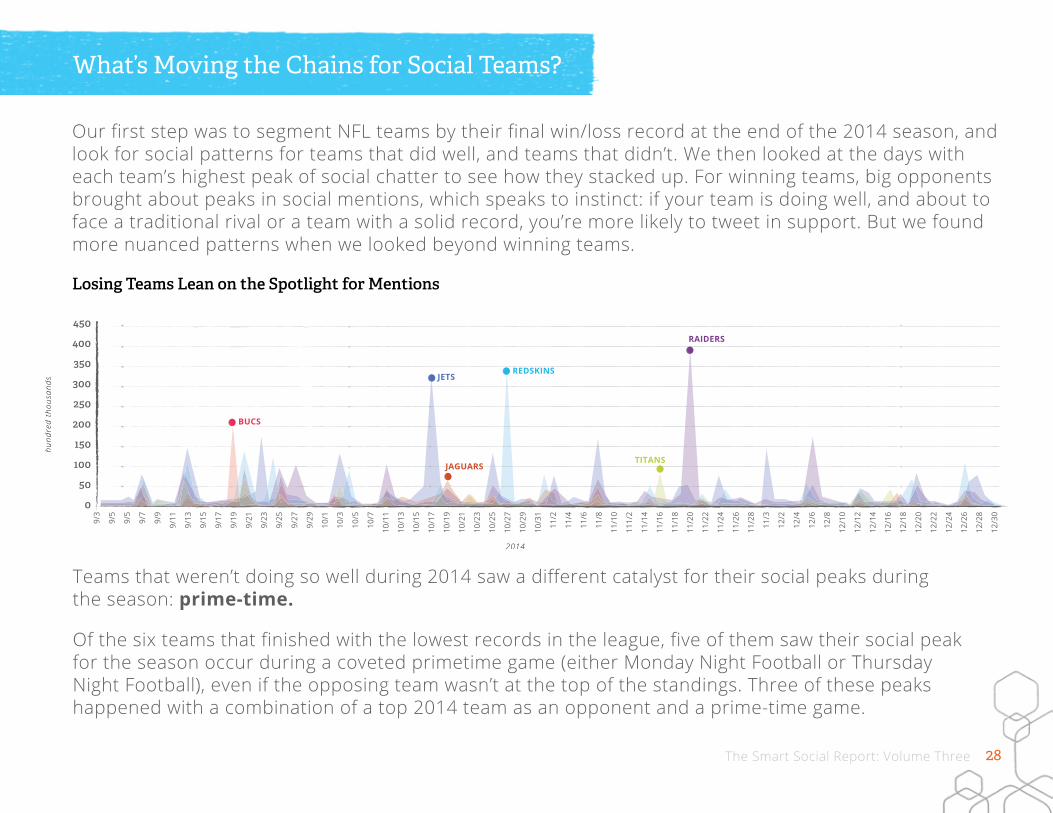
Our first step was to segment NFL teams by their final win/loss record at the end of the 2014 season, and look for social patterns for teams that did well, and teams that didn’t. We then looked at the days with each team’s highest peak of social chatter to see how they stacked up. For winning teams, big opponents brought about peaks in social mentions, which speaks to instinct: if your team is doing well, and about to face a traditional rival or a team with a solid record, you’re more likely to tweet in support. But we found more nuanced patterns when we looked beyond winning teams.
What’s Moving the Chains for Social Teams?
Losing Teams Lean on the Spotlight for Mentions
Teams that weren’t doing so well during 2014 saw a different catalyst for their social peaks during the season: prime-time.
Of the six teams that finished with the lowest records in the league, five of them saw their social peak for the season occur during a coveted primetime game (either Monday Night Football or Thursday Night Football), even if the opposing team wasn’t at the top of the standings. Three of these peaks happened with a combination of a top 2014 team as an opponent and a prime-time game.

29The Smart Social Report: Volume Three
Everyone agrees that it’s easy to rally behind a winning team, but which team’s social chatter is the most dependent on their win/loss record?
We compared the week-to-week records of every team over the 2014 NFL season with each team’s weekly Twitter mentions. We then calculated the correlation—over the entire 17-week season—of how closely social mentions matched up with a winning record.
So which teams have the biggest fair-weather social fan base?
The NY Giants had the tightest correlation between how their team was performing and social chatter week over week. It should also be noted that nine of the top ten teams showing the highest correlation between their team’s performance and social chatter had losing records (the only exception was the Green Bay Packers), which indicates that while the fans of losing teams still get excited when their team sneaks in a win, a losing season definitely quiets the social crowd.
Not All Fan Bases Are Alike
Social Correlation to W/L
30The Smart Social Report: Volume Three
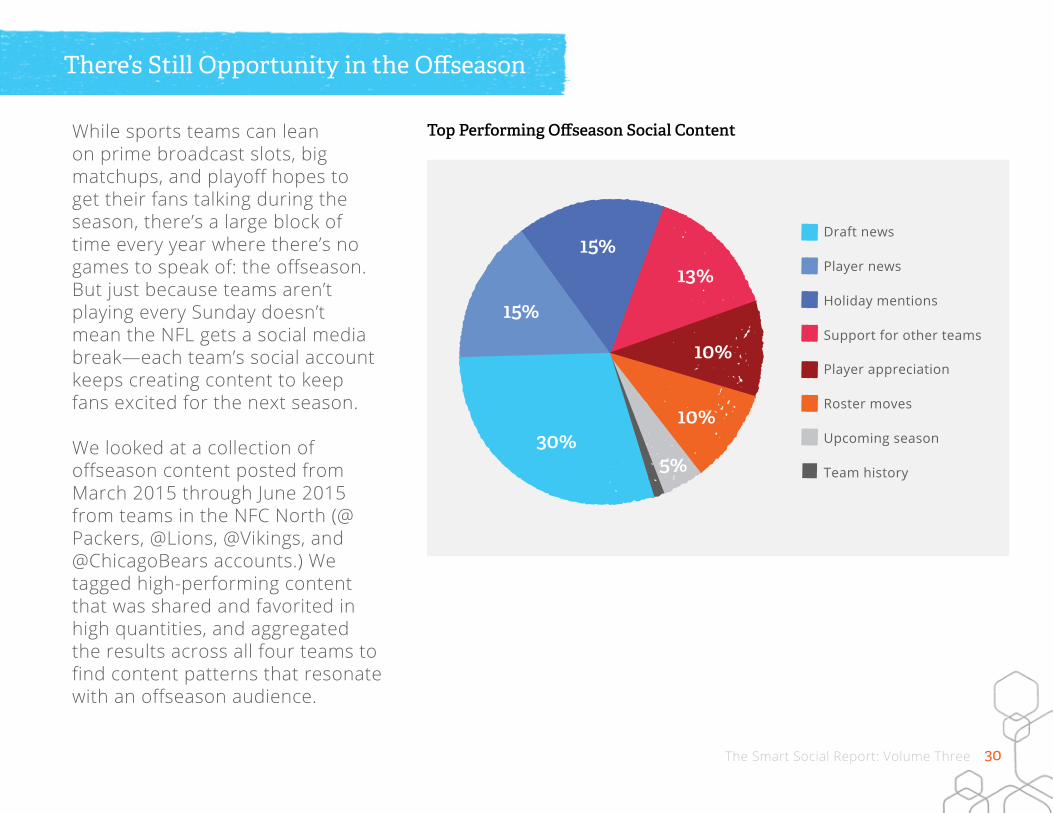
While sports teams can lean on prime broadcast slots, big matchups, and playoff hopes to get their fans talking during the season, there’s a large block of time every year where there’s no games to speak of: the offseason. But just because teams aren’t playing every Sunday doesn’t mean the NFL gets a social media break—each team’s social account keeps creating content to keep fans excited for the next season.
We looked at a collection of offseason content posted from March 2015 through June 2015 from teams in the NFC North (@Packers, @Lions, @Vikings, and @ChicagoBears accounts.) We tagged high-performing content that was shared and favorited in high quantities, and aggregated the results across all four teams to find content patterns that resonate with an offseason audience.
There’s Still Opportunity in the Offseason
Top Performing Offseason Social Content

31The Smart Social Report: Volume Three
Draft News
Retweets:Retweets:
Retweets:
In April, most of the high-performing content came from draft announcements from different teams. The audience, hungry for some good football news, shared the content in high volumes.
High-Performing Offseason Content
+2,211% over normal team levels
+2,058% over normal team levels
+1,730% over normal team levels

32The Smart Social Report: Volume Three
Player News & Appreciation
Retweets:
Retweets:
Retweets:
General news about beloved players performed well with audiences over the offseason, scoring some of the highest social performance levels by teams during May and June.
High-Performing Offseason Content
+512% over normal team levels
+387% over normal team levels
+1,892% over normal team levels

33The Smart Social Report: Volume Three
Holiday Mentions
Retweets:
Retweets:
Retweets:
Teams spent the offseason celebrating nationally recognized days of all shapes and sizes to boost their engagement numbers with some quality real-time marketing.
High-Performing Offseason Content
+541% over normal team levels
+462% over normal team levels +403%
over normal team levels

34The Smart Social Report: Volume Three
What can marketers learn from teams having a bad season to leverage when their business is fighting through a period of bad news, slow growth, or bad press?
We looked at social mentions for teams in the first six weeks of the season vs. the last six weeks, and compared the volume. We found three teams (The Cleveland Browns, the Chicago Bears, and the Oakland Raiders) that saw losing records, but increased the amount of social conversation about the team at the tail end of the season.
How did these teams that weren’t doing so well on the field keep their social chatter going through until the end of the season?
Even Teams Having a Bad Year Can Keep the Conversation Going.
35The Smart Social Report: Volume Three
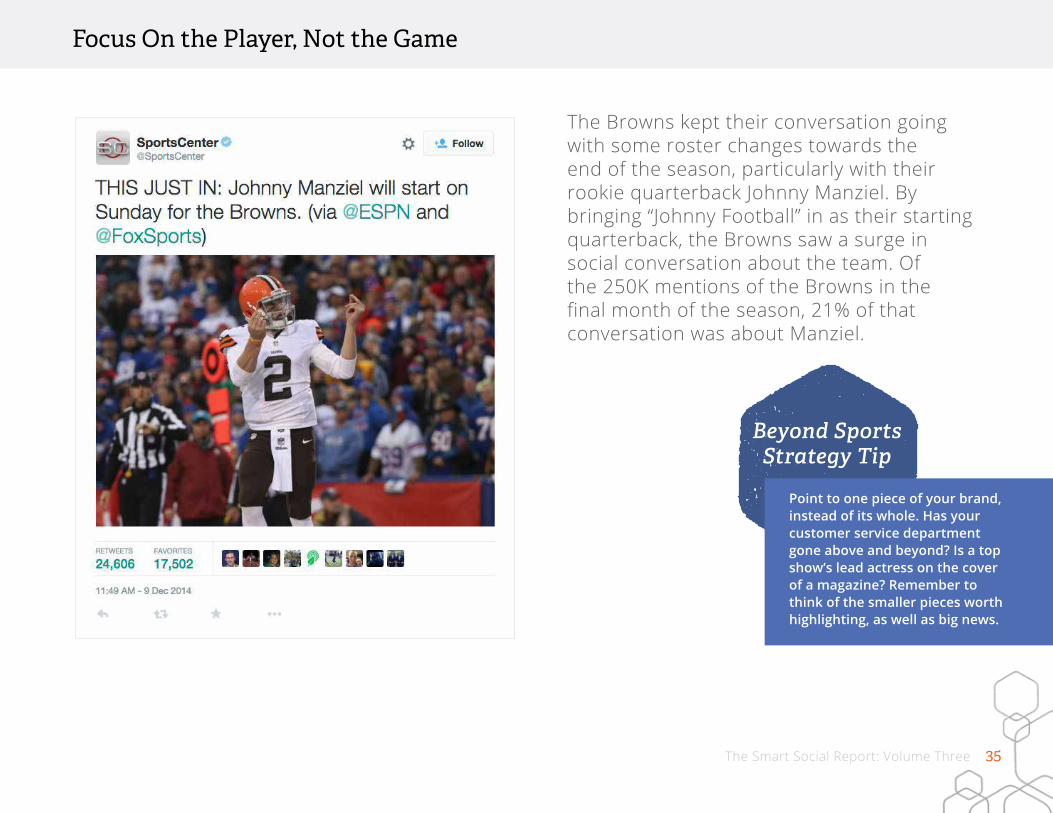
The Browns kept their conversation going with some roster changes towards the end of the season, particularly with their rookie quarterback Johnny Manziel. By bringing “Johnny Football” in as their starting quarterback, the Browns saw a surge in social conversation about the team. Of the 250K mentions of the Browns in the final month of the season, 21% of that conversation was about Manziel.
Focus On the Player, Not the Game
Point to one piece of your brand, instead of its whole. Has your customer service department gone above and beyond? Is a top show’s lead actress on the cover of a magazine? Remember to think of the smaller pieces worth highlighting, as well as big news.
Beyond Sports Strategy Tip

36The Smart Social Report: Volume Three
The @Raiders social media team received a 1,353% bump in Retweets over normal team levels for this victory Tweet.
Losing teams still see good fan engagement when the team gets an end-of-the-season victory, so don’t be afraid to celebrate those wins.
Continue to Celebrate...When You Can
All brands and media companies occasionally face lulls in consumer or viewer enthusiasm. Don’t be afraid to highlight your own “wins” or think creatively in order to find small facets of success to share socially.
Beyond Sports Strategy Tip
37The Smart Social Report: Volume Three
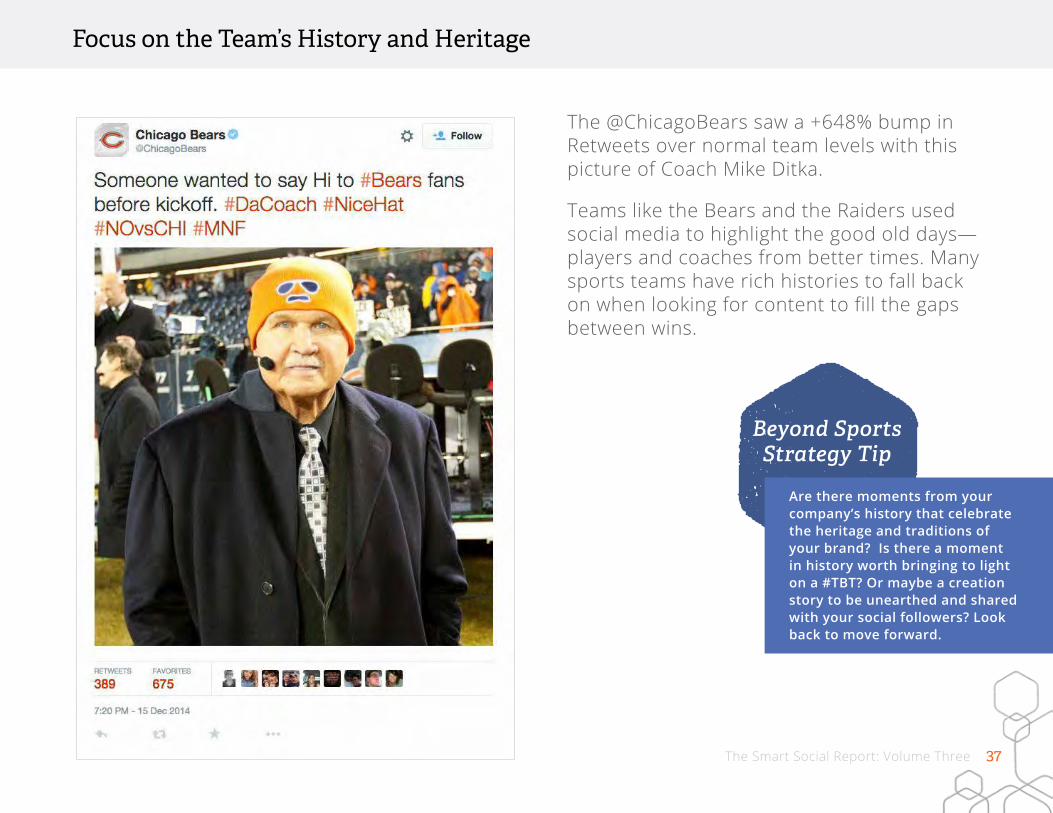
The @ChicagoBears saw a +648% bump in Retweets over normal team levels with this picture of Coach Mike Ditka.
Teams like the Bears and the Raiders used social media to highlight the good old days— players and coaches from better times. Many sports teams have rich histories to fall back on when looking for content to fill the gaps between wins.
Focus on the Team’s History and Heritage
Are there moments from your company’s history that celebrate the heritage and traditions of your brand? Is there a moment in history worth bringing to light on a #TBT? Or maybe a creation story to be unearthed and shared with your social followers? Look back to move forward.
Beyond Sports Strategy Tip

38The Smart Social Report: Volume Three
Social media teams that represent sports organizations have many advantages on their side, including the ability to create their own events each week during the season and superstars that can help draw a crowd. But through good times and bad, teams can always find a way to speak to their audience and give them the right score. As marketers, we can learn a lot from their efforts.
1. Know Your Audience The fan base for every team is different, just as any company’s followers will differ from their competition. Learn what you can from your opponents, but always make sure you’re digging into your own data to understand how your followers will respond to any good or bad news from your company and industry.
2. Always Have a Calendar of Activity Ready for Downtimes Social teams don’t have to rely only on industry news and product announcements to engage their audience. There’s plenty of opportunity to create content in down times that your audience will respond to with enthusiasm—around other events happening around the globe, highlighting individuals within your organization, or getting the audience excited for future wins.
3. Don’t Be Afraid to Change the Narrative We’ve seen teams successfully pivoting the conversation during losing seasons and still getting a good response from the crowd, and brands can use similar tactics during times of bad PR, product mishaps, or other slips. Have content ready around the history of your organization, non-profit efforts, and higher-level campaign themes to remind your followers of the different sides that make up your organization.
The Final Two-Minute Drill
39The Smart Social Report: Volume Three
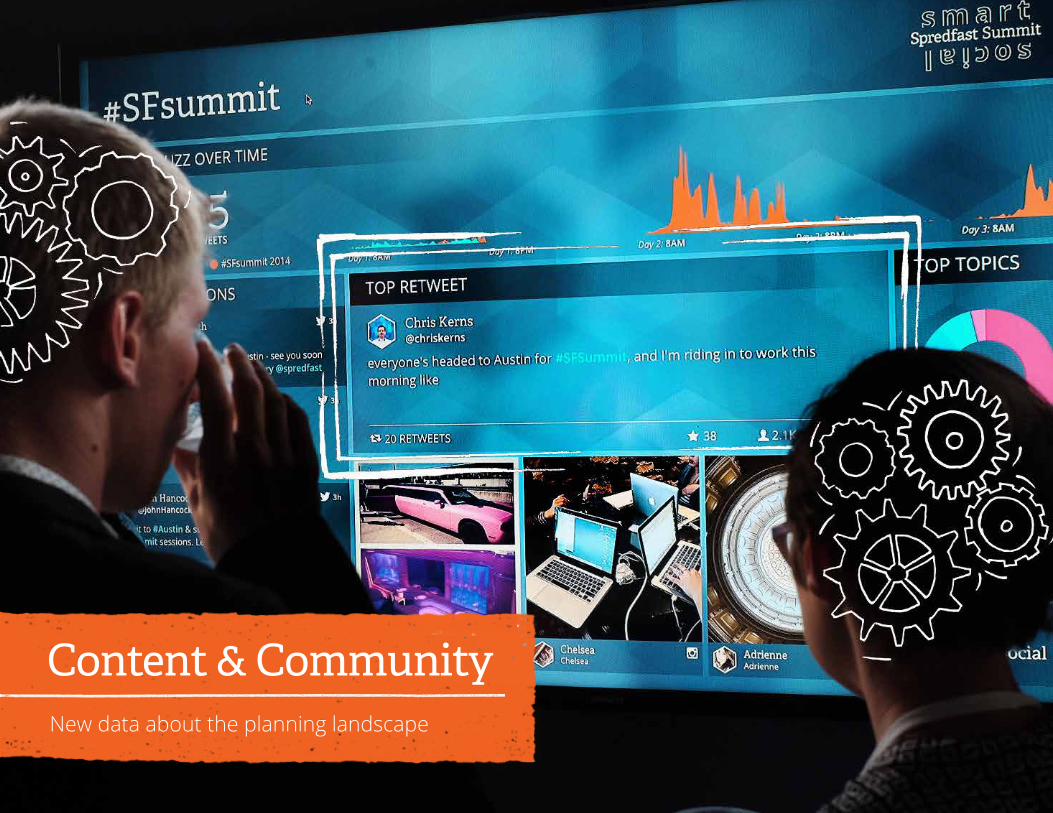
Content & CommunityNew data about the planning landscape
40The Smart Social Report: Volume Three
From Plan to PublishHere on the Research and Insights team, we spend the majority of our time counting, categorizing, and reviewing content. For a single version of this report, this can add up to hundreds of hours of analysis and millions of rows of data crunched—but before we can analyze anything, it needs to first be published.
During our 3rd annual Smart Social Summit, we had a unique opportunity to get at the motivations and influences affecting when and how and how often content marketers actually click publish. We surveyed the attendees and in this section of the report we will walk through their responses to get to a clearer picture of the state of content planning today, in hopes that it better informs marketers in their 2016 planning season.

41The Smart Social Report: Volume Three
How Many Teams Do You Plan With Today?
How Many Tools Do You Plan With Today?
When planning for social, today’s marketer has to be adept at not just understanding the tools that they use to get their jobs done—over 2/3rds of our respondents use more than three—but at communicating across their entire organizations. And this makes sense: as social has matured from a nice-to-have to a mandatory part of any organization’s marketing budget, more stakeholders are bound to become involved. “Good communication skills” has never been merely a throwaway resume line for the social industry, but it’s more essential than ever to distributing messaging effectively and in a timely manner.
Today’s Teams: Cross-Functional & Tech-Savvy
Even as you work across teams, keep your group nimble and strategic. Incorporate the most important stakeholders and your strongest team resources, allowing anyone non-essential to focus on other work.
How to Get Ahead
of the Curve

42The Smart Social Report: Volume Three
What Data Sources Do You Use for Content Planning?
Our respondents used a combination of 3.8 data sources on average to guide their planning. The content calendar is paramount to all of these efforts. However, there is some appetite for the structure to change. Several respondents noted, for example, that they couldn’t wait to “stop using Excel” as the single source of truth for their calendars. This survey also identified an opportunity to make more data-driven decisions. Social data is clearly leveraged, but there is still room to add in additional sources like competitive analyses and customer relationship management platforms.
Today’s Teams: Data Hungry
Don’t rely on social data alone in a silo. Instead, incorporate CRM platforms and competitive research to create rich data that informs and supports your content planning decisions.
How to Get Ahead
of the Curve

43The Smart Social Report: Volume Three
Today’s Teams: Planning for Uncertainty
How Often Do You Deviate from Your Content Plan?
It’s no secret that social marketers have to be nimble. 98% of our marketers deviate from their content plans frequently or occasionally. Though it would be natural to envy the sliver of marketers who “never” have to change their content plan, take note that these respondents also checked boxes explaining what caused them to change their content plan. So, we’ll just say what everyone already knows:
Content plans are like hurricane forecasts—they’re surrounded by a cone of uncertainty. The further out you get from today the more you might find you’ve deviated from where you thought you’d end up. Sometimes you miss a storm all together, and other times one catches you almost entirely by surprise.
Plan for spontaneity. Leave space and flexibility in your content calendar, planning ahead to adjust content as needed.
How to Get Ahead
of the Curve

44The Smart Social Report: Volume Three
What Causes You to Change Your Content Plan?
Breaking news was far and away the biggest reason marketers changed their plans, and this uncertainty highlights the importance of having clear response plans in place for these events. You may not need a command center with twenty screens bringing in news from around the world, but there should be a team member or members ready to modify pre-planned messaging or cancel scheduled posts in the event that they unexpectedly become tone-deaf.

45The Smart Social Report: Volume Three
Today’s Teams: Managing Increased Complexity
Has Planning Gotten Easier or More Complex in the Last Year?
In the last year the majority of marketers felt that planning has become more complex. Several responses noted, however, that planning has become both easier and more complex in the last year. This feeling is understandable: while improved management platforms can inform better decision-making, these innovations can come with a steep learning curve. Marketers have to be able to wrap their heads around the very tools that can make their jobs simpler.
Our second largest constituency, on the other hand, felt that the industry was neither more or less complex than it has been, yet these same respondents are still managing very complex processes and teams. Even if they are comfortable with the state of affairs, is such complexity ideal, or is there still room for improvement?
Research the platform and tool options to find your ultimate best practices, then instigate a culture of social marketing triage, wherever possible, to keep things simple.
How to Get Ahead
of the Curve
46The Smart Social Report: Volume Three
We believe that in many ways the content production process is just as important as the results great content yields. A commitment to cross-organizational communication, being open to multiple tool sets, and clear processes for front-line publishers can ensure that while complex, your team still operates as efficiently as possible.
This industry evolves quickly and we’re excited to be right in the middle of it. This survey-based snapshot validates what many of us already feel: day-to-day—flexibility is the key to success in content planning.
Process is the Product
47The Smart Social Report: Volume Three
Brands & ConsumersA look at gender patterns in social media

48The Smart Social Report: Volume Three
Your Audience, Divided The best marketing campaigns always start with an audience in mind. To be successful as marketers, we must first understand our audience before we attempt to persuade them. So we craft messages to make sure we’re speaking to our fans and followers with the right tone, voice, offers, and timing. But what we must also understand is that within each audience are many different groups, all of whom have different preferences and behaviors. While it may appear daunting, this concept can become an advantage if tackled with a data-driven marketing approach and a healthy appetite for experimentation.
In this study, we looked to one particular classification of an audience: gender. We wondered: how do men and women respond differently to the same content? How does the audience makeup change between different industries and brands? And how can companies use a better understanding of their audience’s gender to drive the behavior they are seeking?
49The Smart Social Report: Volume Three
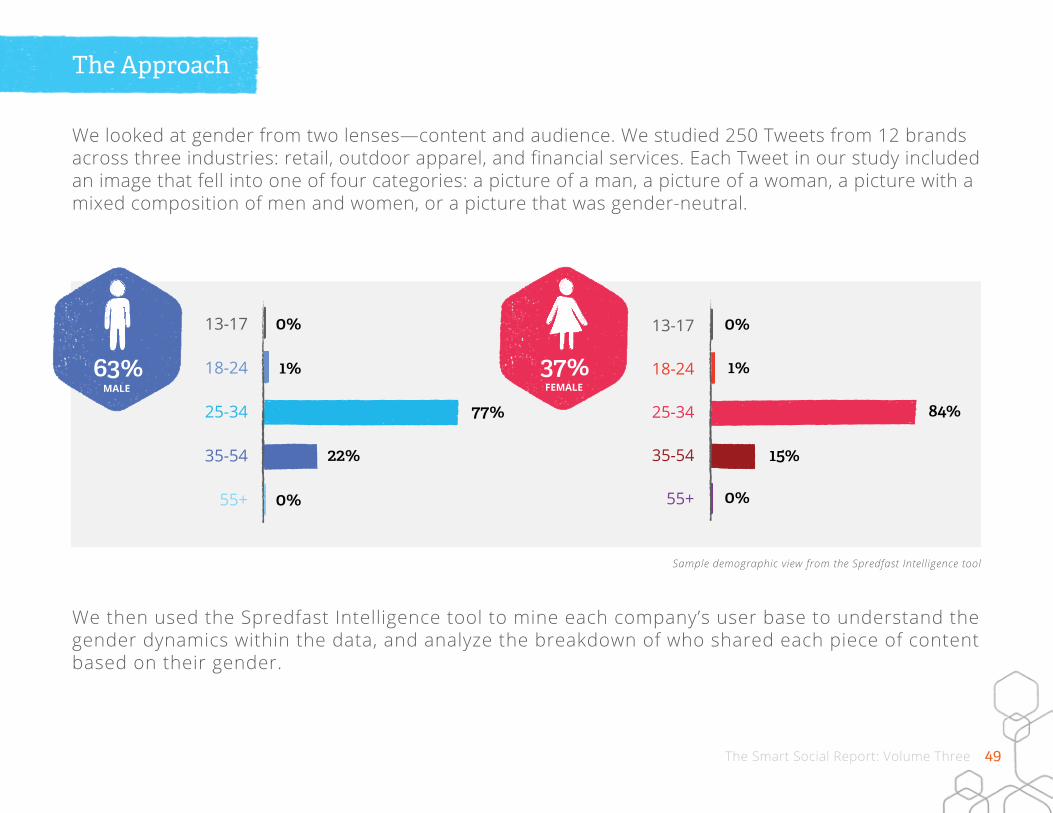
We looked at gender from two lenses—content and audience. We studied 250 Tweets from 12 brands across three industries: retail, outdoor apparel, and financial services. Each Tweet in our study included an image that fell into one of four categories: a picture of a man, a picture of a woman, a picture with a mixed composition of men and women, or a picture that was gender-neutral.
The Approach
We then used the Spredfast Intelligence tool to mine each company’s user base to understand the gender dynamics within the data, and analyze the breakdown of who shared each piece of content based on their gender.
Sample demographic view from the Spredfast Intelligence tool

50The Smart Social Report: Volume Three
Looking at the follower base for each of the 12 brands, we can see a different mix of gender in each audience, but with some stark patterns. Retail sees the highest percent of female followers, with a 68% average across the four brands. Conversely, financial services sees the highest male follower population, at close to 70% on average.
The Gender Landscape
51The Smart Social Report: Volume Three
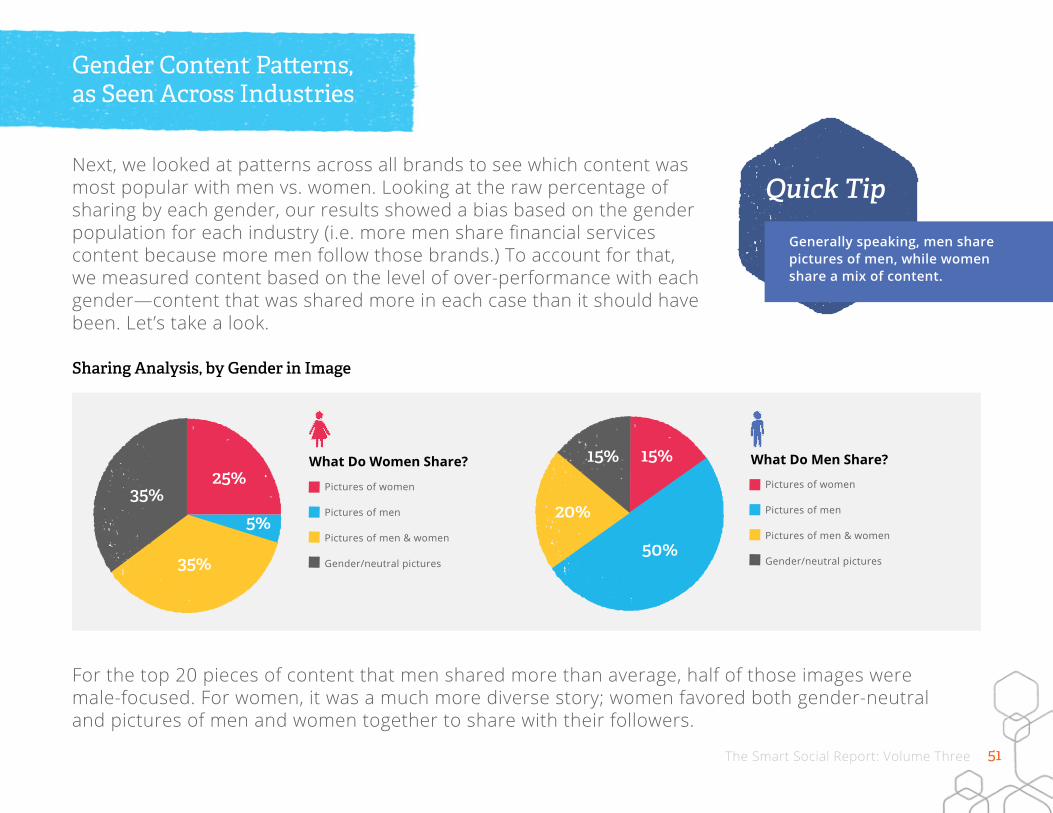
Next, we looked at patterns across all brands to see which content was most popular with men vs. women. Looking at the raw percentage of sharing by each gender, our results showed a bias based on the gender population for each industry (i.e. more men share financial services content because more men follow those brands.) To account for that, we measured content based on the level of over-performance with each gender—content that was shared more in each case than it should have been. Let’s take a look.
Gender Content Patterns, as Seen Across Industries
Sharing Analysis, by Gender in Image
What Do Women Share? What Do Men Share?
For the top 20 pieces of content that men shared more than average, half of those images were male-focused. For women, it was a much more diverse story; women favored both gender-neutral and pictures of men and women together to share with their followers.
Generally speaking, men share pictures of men, while women share a mix of content.
Quick Tip

52The Smart Social Report: Volume Three
Sharing Analysis, by Topic in Image
What Do Women Share? What Do Men Share?
Both men and women shared mostly images of people, but the two genders show different patterns when we look at the other two categories. Men share more product images, while women share more non-gender specific elements (quotes, landscape photos, etc.).
Men tend to share product images, where women share quotes or landscape photos.
Quick Tip
53The Smart Social Report: Volume Three
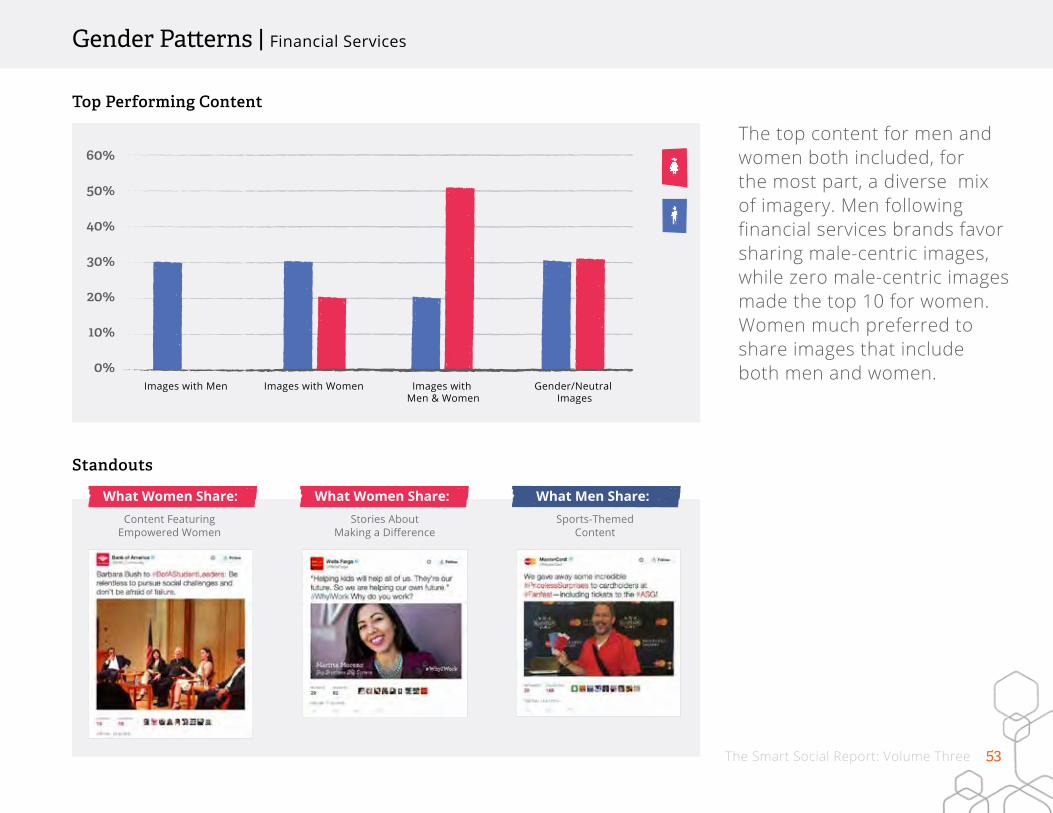
What Men Share:What Women Share: What Women Share: Sports-Themed
ContentContent Featuring
Empowered WomenStories About
Making a Difference
Top Performing Content
Standouts
The top content for men and women both included, for the most part, a diverse mix of imagery. Men following financial services brands favor sharing male-centric images, while zero male-centric images made the top 10 for women. Women much preferred to share images that include both men and women.
Gender Patterns | Financial Services
54The Smart Social Report: Volume Three
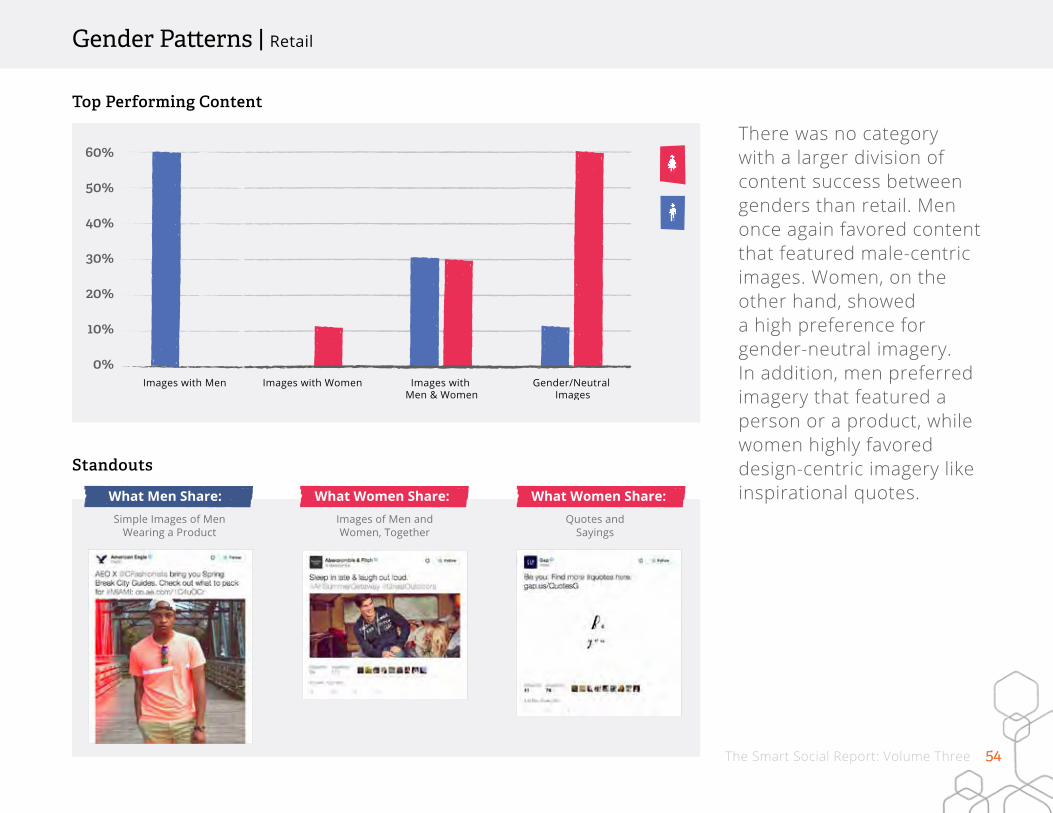
Top Performing Content
There was no category with a larger division of content success between genders than retail. Men once again favored content that featured male-centric images. Women, on the other hand, showed a high preference for gender-neutral imagery. In addition, men preferred imagery that featured a person or a product, while women highly favored design-centric imagery like inspirational quotes.
Quotes and Sayings
Simple Images of Men Wearing a Product
Images of Men and Women, Together
What Men Share: What Women Share: What Women Share:
Standouts
Gender Patterns | Retail
55The Smart Social Report: Volume Three
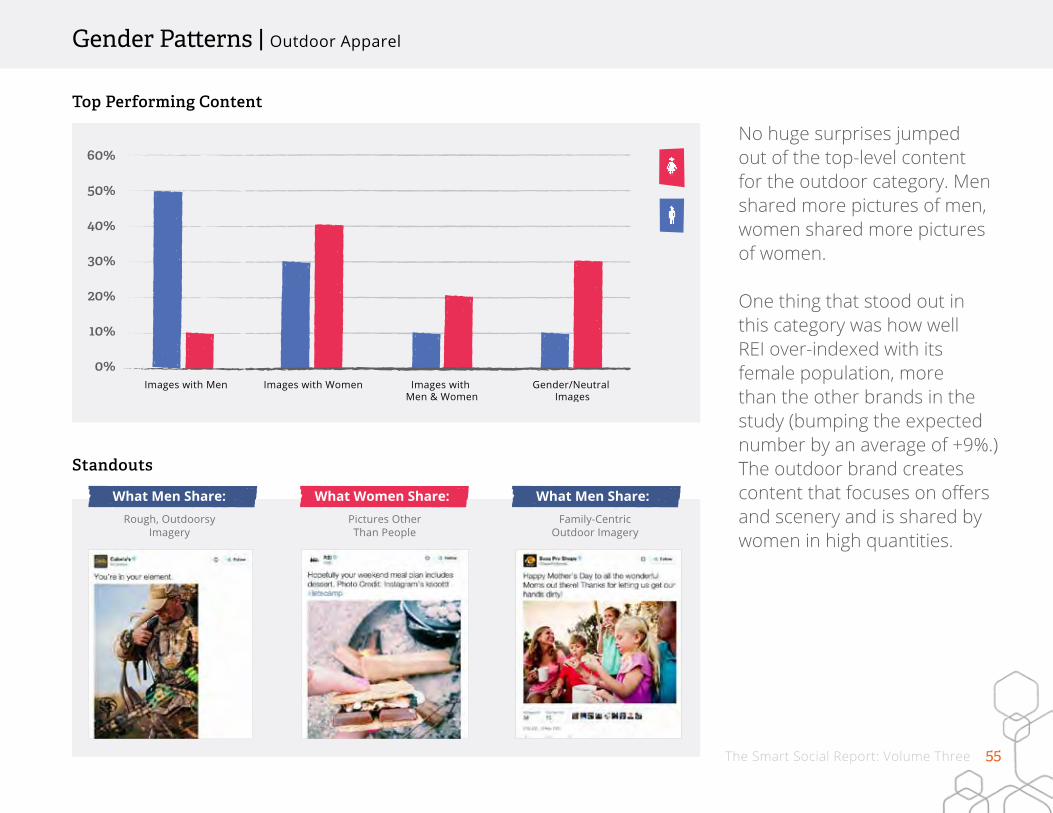
Top Performing Content
Family-Centric Outdoor Imagery
Rough, Outdoorsy Imagery
Pictures Other Than People
No huge surprises jumped out of the top-level content for the outdoor category. Men shared more pictures of men, women shared more pictures of women.
One thing that stood out in this category was how well REI over-indexed with its female population, more than the other brands in the study (bumping the expected number by an average of +9%.) The outdoor brand creates content that focuses on offers and scenery and is shared by women in high quantities.
What Men Share:What Men Share: What Women Share:
Standouts
Gender Patterns | Outdoor Apparel

56The Smart Social Report: Volume Three
BassProShops: Share Rate for Women
As we dove into the data for BassProShops, one variable impacted sharing levels for women more than any other classification we investigated. What do women who follow BassProShops love to share?
That’s right, it’s dogs. The female audience of BassProShops shares images of dogs in higher proportions than any other category we looked at.
What Do Women Share In Outdoor Apparel?
57The Smart Social Report: Volume Three
Each unique social team needs to realize that with every post, Tweet, or Snap, they are talking to and sharing with many different audiences at the same time. While each piece of your content may not resonate across all groups or genders, make sure you’re working to create a variety of targeted messaging that will accomplish your brand goals. Use the lessons from this report to drive gender-specific campaigns, to inform your broader strategy, or both. Experiment and measure how different sub-audiences (including gender, age, location, and more) are reacting to your content. BassProShops has found that dogs work for them—what works for you?
Your Content Needs to Be Built for Many Audiences
58The Smart Social Report: Volume Three
Spredfast’s smart social software enables companies to build lasting relationships with today’s digitally connected consumer. Part of that is using social data to make smarter marketing decisions when you plan, execute, and analyze your social efforts.
Spredfast Intelligence provides a searchable lens to historical and real-time insights to better understand your audience, relevant conversations, and your brand’s social performance.
Spredfast is transforming the way companies connect with consumers.
See the brands we work with: