The Short-Run Tradeoff Between Inflation and Unemployment Premium PowerPoint Slides by Ron Cronovich...
37
The Short-Run Tradeoff Between Inflation and Unemployment Premium PowerPoint Slides by Ron Cronovich © 2012 Cengage Learning. All Rights Reserved. May not be copied, scanned, or duplicated, in whole or in part, except for use as permitted in a license distributed with a certain product or service or otherwise on a password-protected website for classroom use. N. Gregory Mankiw Macroeconomic s Principles of Sixth Edition 22
-
Upload
russell-norton -
Category
Documents
-
view
244 -
download
4
Transcript of The Short-Run Tradeoff Between Inflation and Unemployment Premium PowerPoint Slides by Ron Cronovich...
The Short-Run Tradeoff Between Inflation and Unemployment
Premium PowerPoint
Slides by Ron
Cronovich© 2012 Cengage Learning. All Rights Reserved. May not be copied, scanned, or duplicated, in whole or in part, except for use as permitted in a license distributed with a certain product or service or otherwise on a password-protected website for classroom use.
N. Gregory Mankiw
Macroeconomics
Principles of
Sixth Edition
22
© 2012 Cengage Learning. All Rights Reserved. May not be copied, scanned, or duplicated, in whole or in part, except for use as permitted in a license distributed with a certain product or service or otherwise on a password-protected website for classroom use.
22
In this chapter, look for the answers to these questions:
• How are inflation and unemployment related in the short run? In the long run?
• What factors alter this relationship?
• What is the short-run cost of reducing inflation?
• Why were U.S. inflation and unemployment both so low in the 1990s?
© 2012 Cengage Learning. All Rights Reserved. May not be copied, scanned, or duplicated, in whole or in part, except for use as permitted in a license distributed with a certain product or service or otherwise on a password-protected website for classroom use.
33
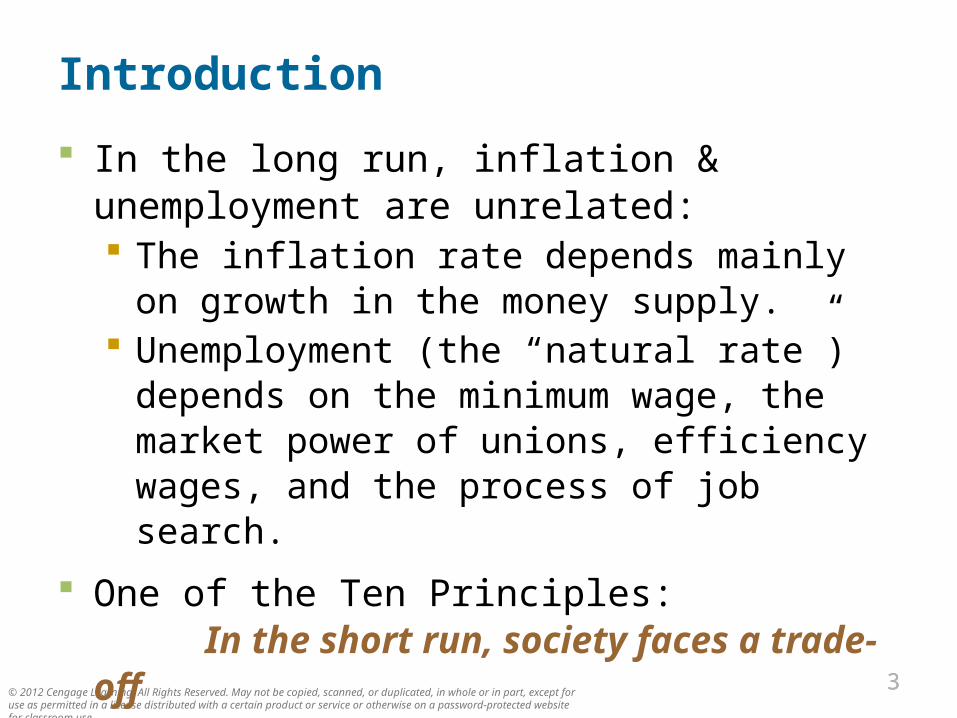
Introduction
In the long run, inflation & unemployment are unrelated: The inflation rate depends mainly on growth in
the money supply. Unemployment (the “natural rate”) depends on
the minimum wage, the market power of unions, efficiency wages, and the process of job search.
One of the Ten Principles: In the short run, society faces a trade-off between inflation and unemployment.
© 2012 Cengage Learning. All Rights Reserved. May not be copied, scanned, or duplicated, in whole or in part, except for use as permitted in a license distributed with a certain product or service or otherwise on a password-protected website for classroom use.
44
The Phillips Curve
Phillips curve: shows the short-run trade-off between inflation and unemployment
1958: A.W. Phillips showed that nominal wage growth was negatively correlated with unemployment in the U.K.
1960: Paul Samuelson & Robert Solow found a negative correlation between U.S. inflation & unemployment, named it “the Phillips Curve.”
© 2012 Cengage Learning. All Rights Reserved. May not be copied, scanned, or duplicated, in whole or in part, except for use as permitted in a license distributed with a certain product or service or otherwise on a password-protected website for classroom use.
55
Deriving the Phillips Curve
Suppose P = 100 this year.
The following graphs show two possible outcomes for next year:
A. Agg demand low, small increase in P (i.e., low inflation), low output, high unemployment.
B. Agg demand high, big increase in P (i.e., high inflation), high output, low unemployment.
© 2012 Cengage Learning. All Rights Reserved. May not be copied, scanned, or duplicated, in whole or in part, except for use as permitted in a license distributed with a certain product or service or otherwise on a password-protected website for classroom use.
66
Deriving the Phillips Curve
u-rate
inflation
PC
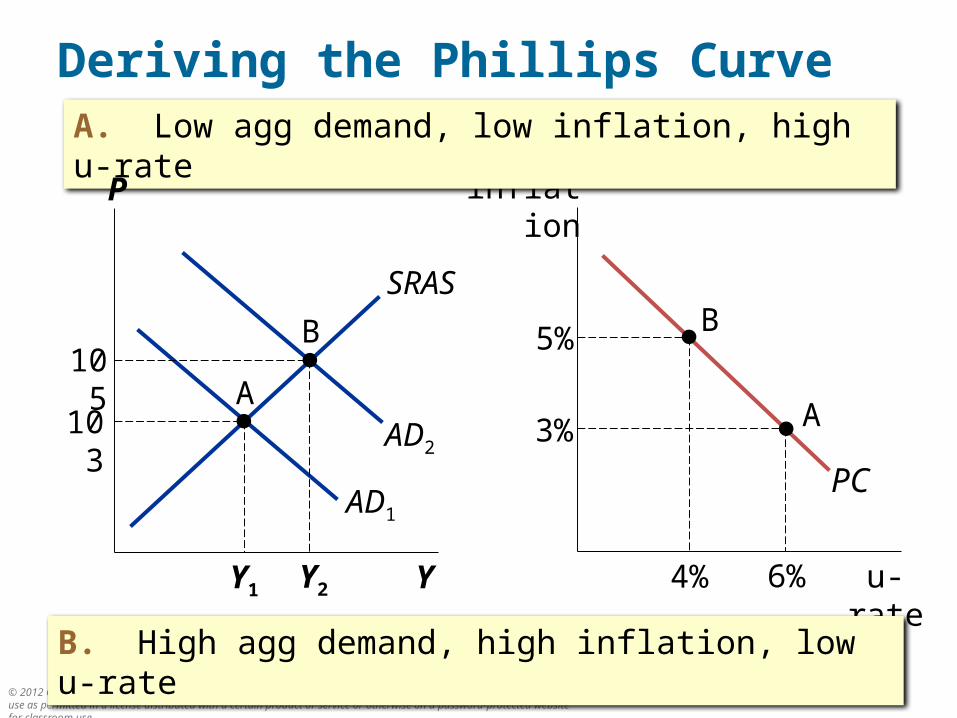
A. Low agg demand, low inflation, high u-rate
B. High agg demand, high inflation, low u-rate
Y
P
SRAS
AD1
AD2
Y1
103A
105
Y2
B
6%
3% A
4%
5%B
© 2012 Cengage Learning. All Rights Reserved. May not be copied, scanned, or duplicated, in whole or in part, except for use as permitted in a license distributed with a certain product or service or otherwise on a password-protected website for classroom use.
77
The Phillips Curve: A Policy Menu? Since fiscal and mon policy affect agg demand,
the PC appeared to offer policymakers a menu of choices: low unemployment with high inflation low inflation with high unemployment anything in between
1960s: U.S. data supported the Phillips curve. Many believed the PC was stable and reliable.
© 2012 Cengage Learning. All Rights Reserved. May not be copied, scanned, or duplicated, in whole or in part, except for use as permitted in a license distributed with a certain product or service or otherwise on a password-protected website for classroom use.
8
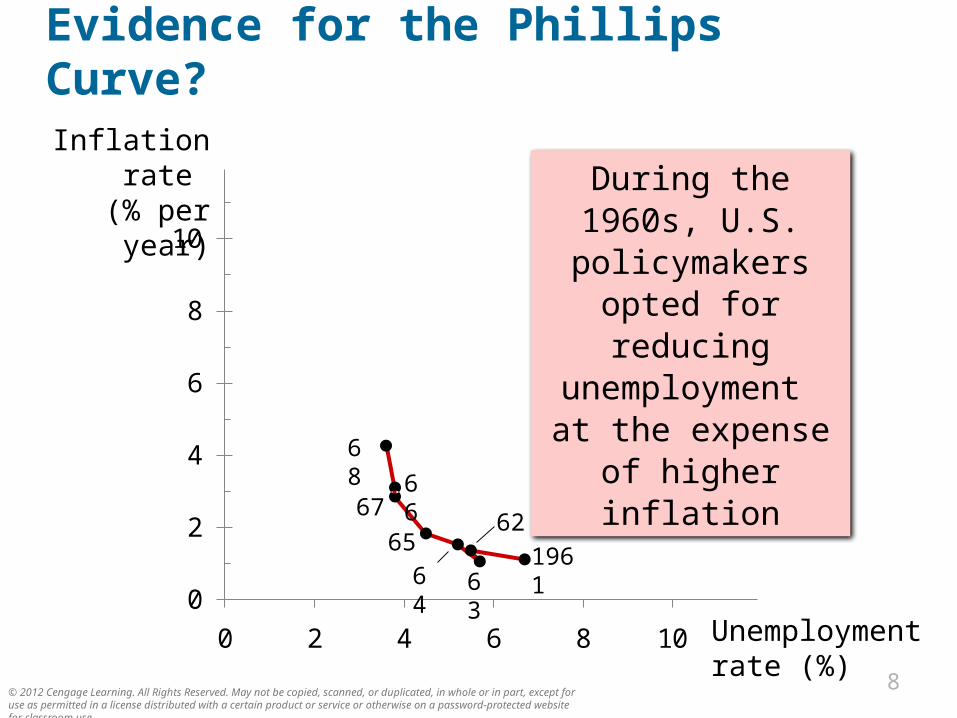
Evidence for the Phillips Curve?
Inflation rate
(% per year)
Unemployment rate (%)
0
2
4
6
8
10
0 2 4 6 8 10
During the 1960s, U.S. policymakers opted for reducing
unemployment at the expense of
higher inflation
196163
6562
64
6667
68
© 2012 Cengage Learning. All Rights Reserved. May not be copied, scanned, or duplicated, in whole or in part, except for use as permitted in a license distributed with a certain product or service or otherwise on a password-protected website for classroom use.
99
The Vertical Long-Run Phillips Curve 1968: Milton Friedman and Edmund Phelps
argued that the tradeoff was temporary.
Natural-rate hypothesis: the claim that unemployment eventually returns to its normal or “natural” rate, regardless of the inflation rate
Based on the classical dichotomy and the vertical LRAS curve (chapters 12 and 17)
© 2012 Cengage Learning. All Rights Reserved. May not be copied, scanned, or duplicated, in whole or in part, except for use as permitted in a license distributed with a certain product or service or otherwise on a password-protected website for classroom use.
1010
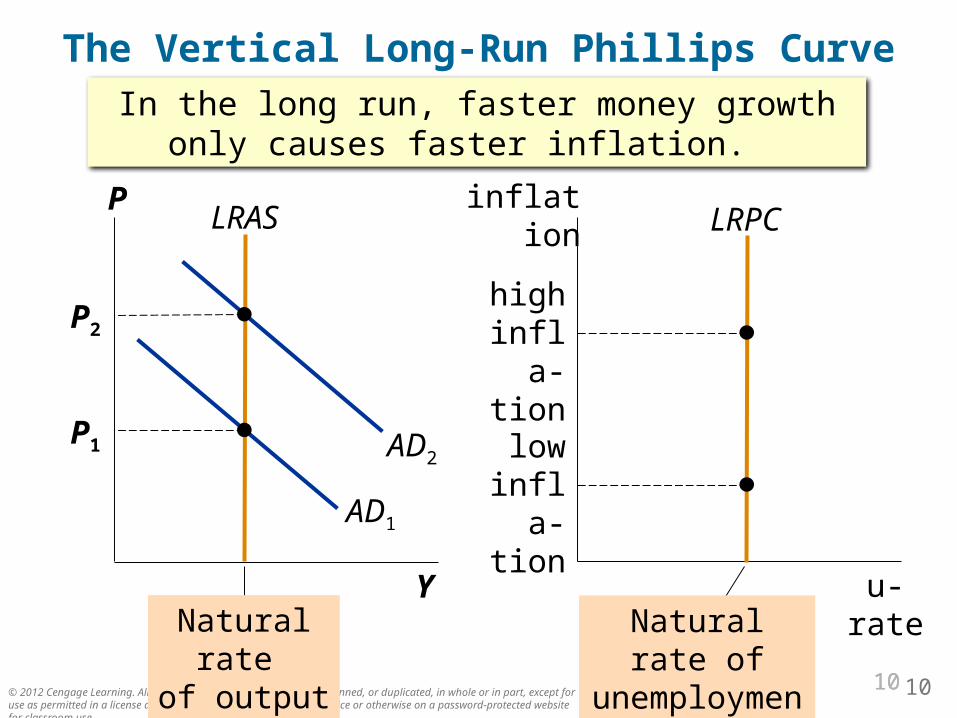
The Vertical Long-Run Phillips Curve
u-rate
inflation
In the long run, faster money growth only causes faster inflation.
Y
PLRAS
AD1
AD2
Natural rate
of output
Natural rate of unemployment
P1
P2
LRPC
low infla-
tion
high infla-
tion
10
© 2012 Cengage Learning. All Rights Reserved. May not be copied, scanned, or duplicated, in whole or in part, except for use as permitted in a license distributed with a certain product or service or otherwise on a password-protected website for classroom use.
1111
Reconciling Theory and Evidence
Evidence (from ’60s): PC slopes downward.
Theory (Friedman and Phelps): PC is vertical in the long run.
To bridge the gap between theory and evidence, Friedman and Phelps introduced a new variable: expected inflation – a measure of how much people expect the price level to change.

© 2012 Cengage Learning. All Rights Reserved. May not be copied, scanned, or duplicated, in whole or in part, except for use as permitted in a license distributed with a certain product or service or otherwise on a password-protected website for classroom use.
1212
The Phillips Curve Equation
Short run Fed can reduce u-rate below the natural u-rate by making inflation greater than expected.
Long run Expectations catch up to reality, u-rate goes back to natural u-rate whether inflation is high or low.
Unemp. rate
Natural rate of unemp.
= – a Actual inflation
Expected inflation
–
© 2012 Cengage Learning. All Rights Reserved. May not be copied, scanned, or duplicated, in whole or in part, except for use as permitted in a license distributed with a certain product or service or otherwise on a password-protected website for classroom use.
1313
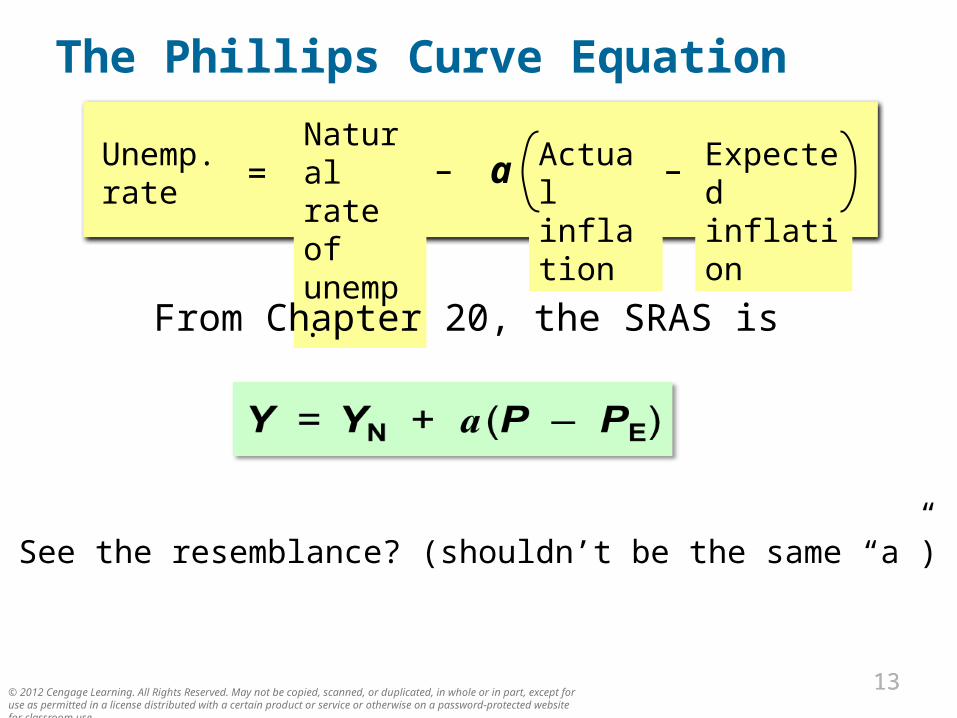
The Phillips Curve Equation
Unemp. rate
Natural rate of unemp.
= – a Actual inflation
Expected inflation
–
From Chapter 20, the SRAS is
See the resemblance? (shouldn’t be the same “a”)
© 2012 Cengage Learning. All Rights Reserved. May not be copied, scanned, or duplicated, in whole or in part, except for use as permitted in a license distributed with a certain product or service or otherwise on a password-protected website for classroom use.
1414
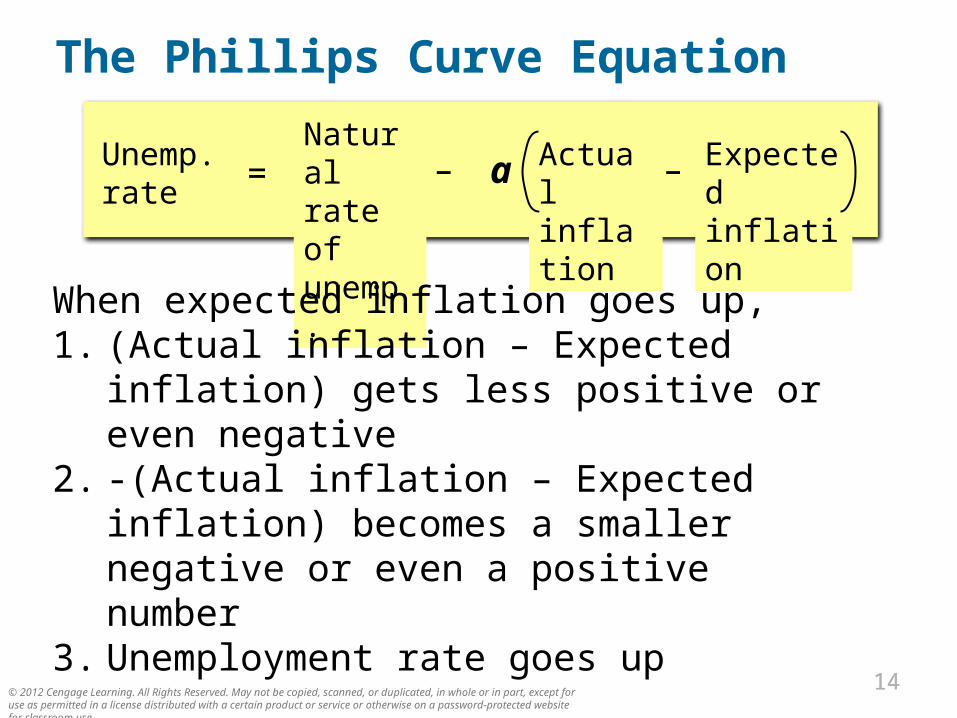
The Phillips Curve Equation
Unemp. rate
Natural rate of unemp.
= – a Actual inflation
Expected inflation
–
When expected inflation goes up,1. (Actual inflation – Expected inflation) gets
less positive or even negative2. -(Actual inflation – Expected inflation)
becomes a smaller negative or even a positive number
3. Unemployment rate goes up
© 2012 Cengage Learning. All Rights Reserved. May not be copied, scanned, or duplicated, in whole or in part, except for use as permitted in a license distributed with a certain product or service or otherwise on a password-protected website for classroom use.
1515
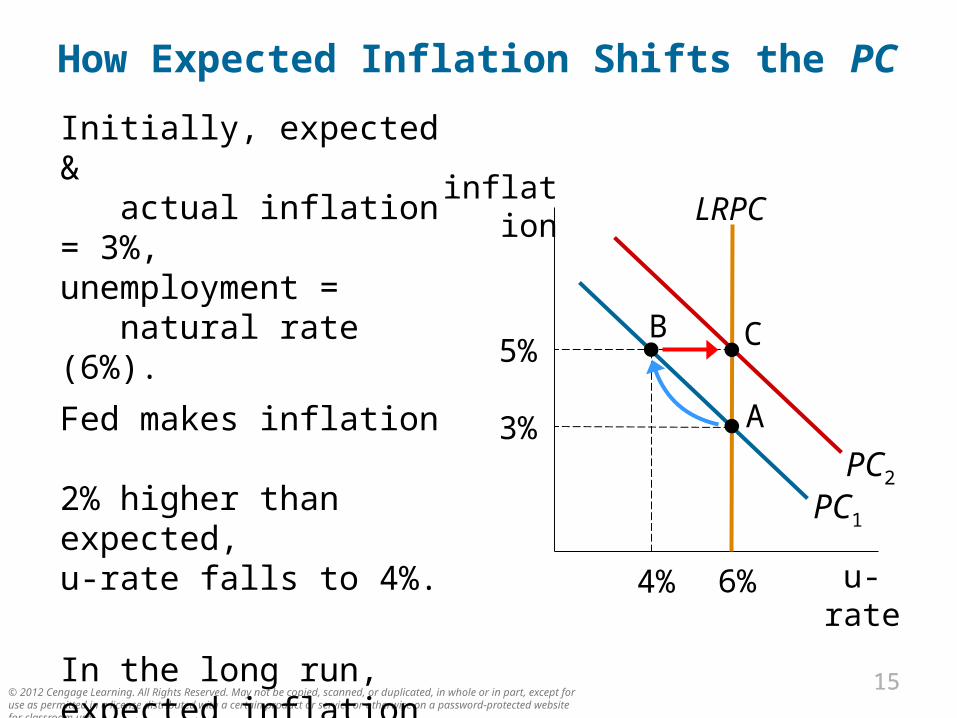
How Expected Inflation Shifts the PC
Initially, expected & actual inflation = 3%,unemployment = natural rate (6%).
Fed makes inflation 2% higher than expected,
u-rate falls to 4%.
In the long run, expected inflation increases to 5%, PC shifts upward, unemployment returns to its natural rate.
u-rate
inflation
PC1
LRPC
6%
3%PC2
4%
5%
A
B C
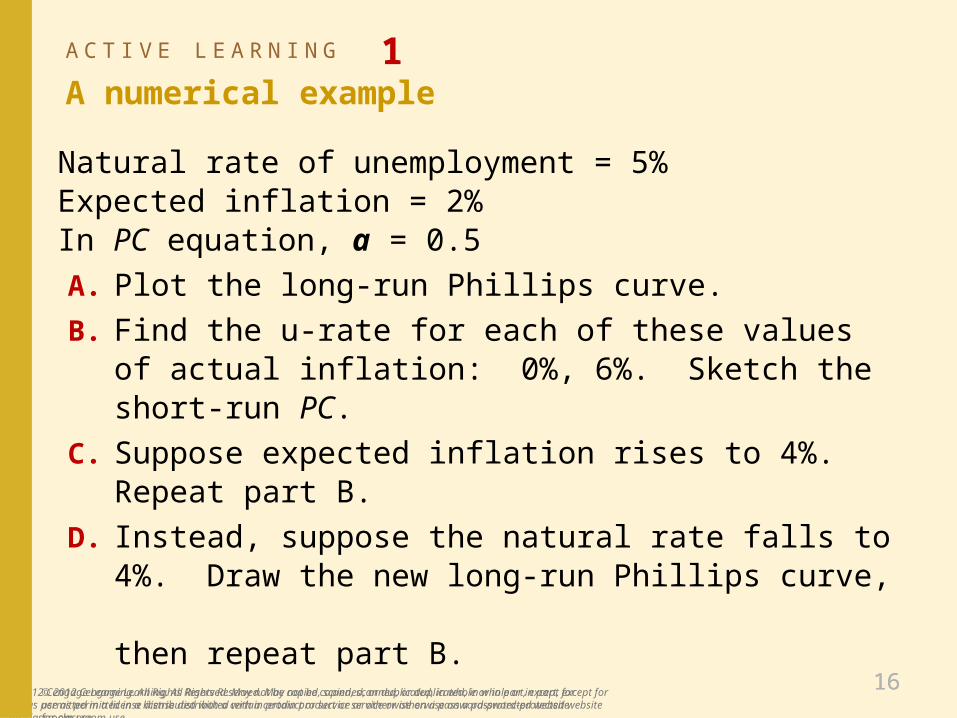
A C T I V E L E A R N I N G 1
A numerical example
Natural rate of unemployment = 5%Expected inflation = 2%In PC equation, a = 0.5
A. Plot the long-run Phillips curve.
B. Find the u-rate for each of these values of actual inflation: 0%, 6%. Sketch the short-run PC.
C. Suppose expected inflation rises to 4%. Repeat part B.
D. Instead, suppose the natural rate falls to 4%. Draw the new long-run Phillips curve, then repeat part B.
© 2012 Cengage Learning. All Rights Reserved. May not be copied, scanned, or duplicated, in whole or in part, except for use as permitted in a license distributed with a certain product or service or otherwise on a password-protected website for classroom use.

A C T I V E L E A R N I N G 1
Answers
0
1
2
3
4
5
6
7
0 1 2 3 4 5 6 7 8
unemployment rate
infl
atio
n r
ate
LRPCA
An increase in expected inflation shifts PC to the right. PCD
LRPCD
PCB
PCCA fall in the natural rate shifts both curves to the left.
© 2012 Cengage Learning. All Rights Reserved. May not be copied, scanned, or duplicated, in whole or in part, except for use as permitted in a license distributed with a certain product or service or otherwise on a password-protected website for classroom use.
18
0
2
4
6
8
10
0 2 4 6 8 10
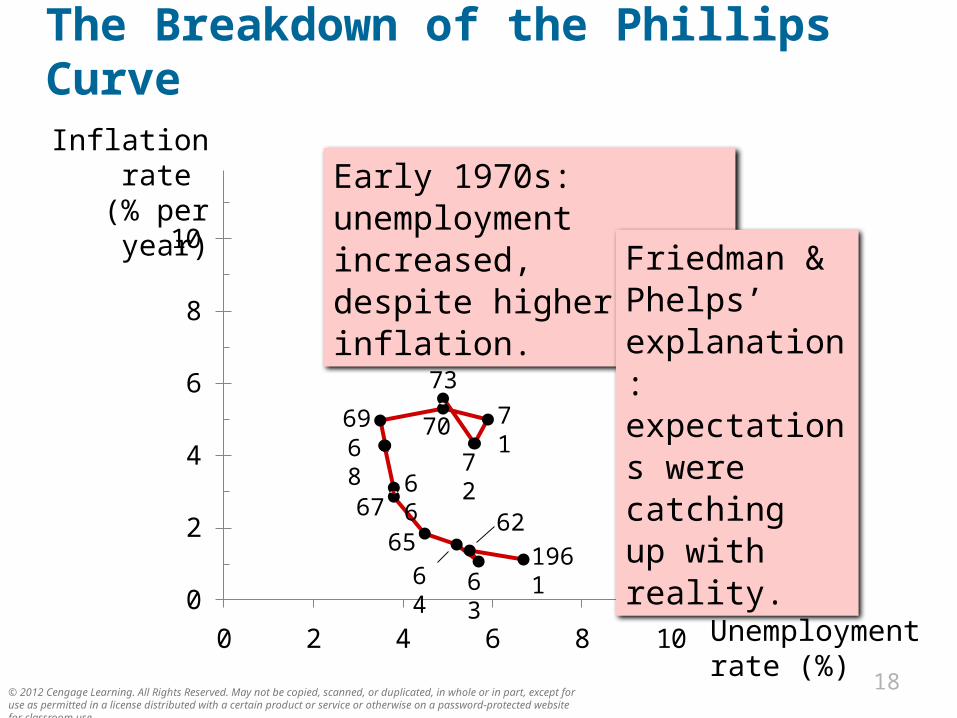
The Breakdown of the Phillips CurveInflation rate
(% per year)
Unemployment rate (%)
Early 1970s: unemployment increased, despite higher inflation. Friedman &
Phelps’ explanation: expectations were catching up with reality.
0
2
4
6
8
10
0 2 4 6 8 10
196163
6562
64
6667
6869 70 71
72
73
© 2012 Cengage Learning. All Rights Reserved. May not be copied, scanned, or duplicated, in whole or in part, except for use as permitted in a license distributed with a certain product or service or otherwise on a password-protected website for classroom use.
1919
Another PC Shifter: Supply Shocks Supply shock:
an event that directly alters firms’ costs and prices, shifting the AS and PC curves
Example: large increase in oil prices
© 2012 Cengage Learning. All Rights Reserved. May not be copied, scanned, or duplicated, in whole or in part, except for use as permitted in a license distributed with a certain product or service or otherwise on a password-protected website for classroom use.
2020
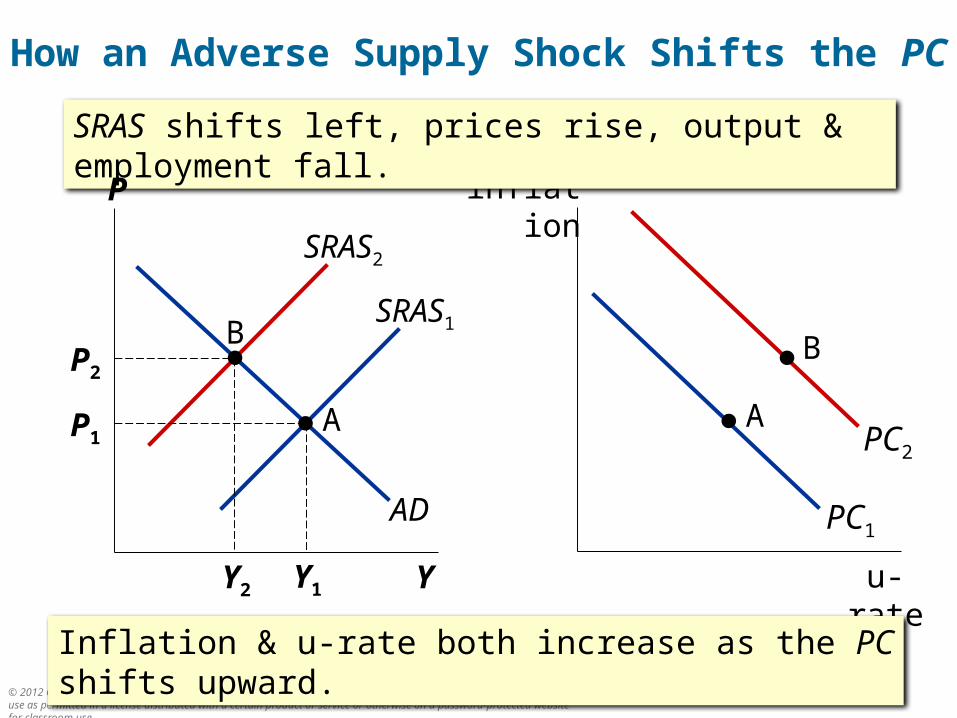
How an Adverse Supply Shock Shifts the PC
u-rate
inflation
SRAS shifts left, prices rise, output & employment fall.
Inflation & u-rate both increase as the PC shifts upward.
Y
P
SRAS1
AD PC1
PC2
A
B
SRAS2
A
Y1
P1
Y2
BP2
© 2012 Cengage Learning. All Rights Reserved. May not be copied, scanned, or duplicated, in whole or in part, except for use as permitted in a license distributed with a certain product or service or otherwise on a password-protected website for classroom use.
2121
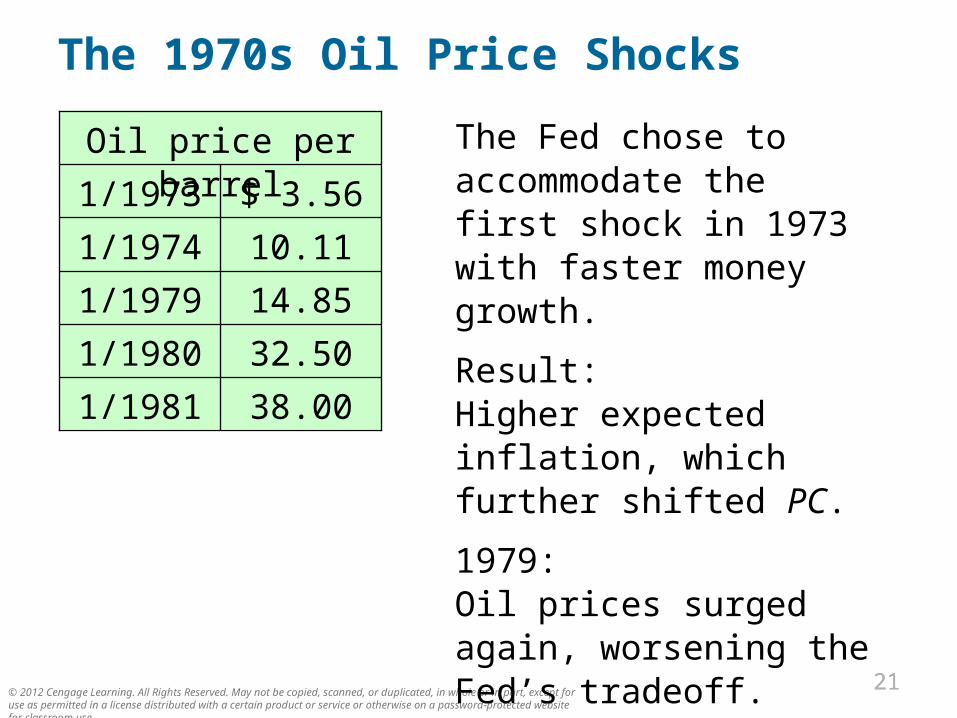
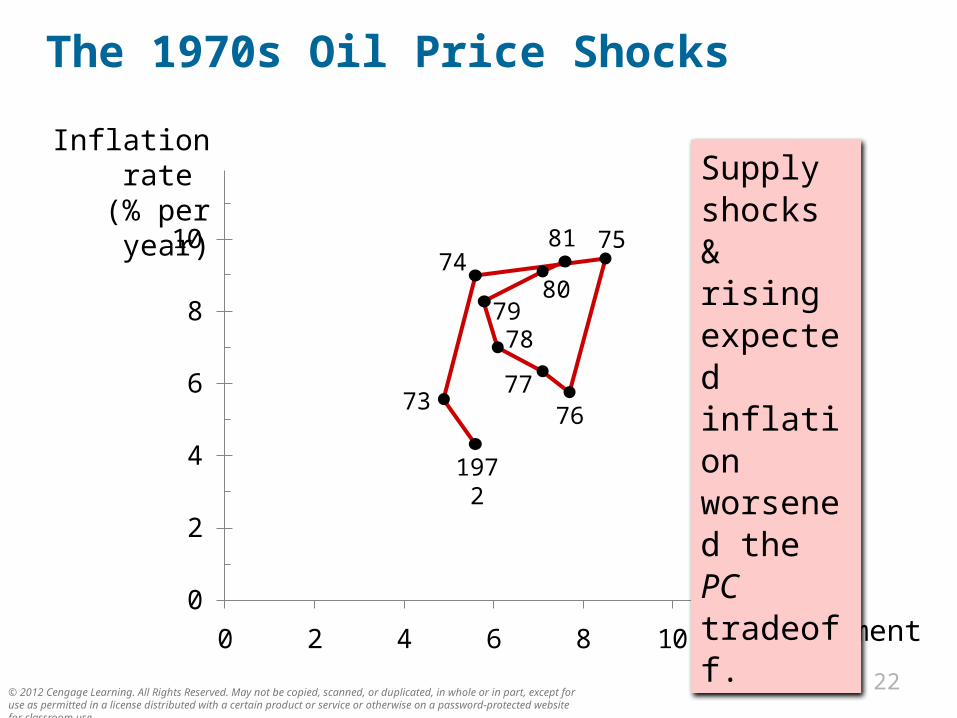
The 1970s Oil Price Shocks
The Fed chose to accommodate the first shock in 1973 with faster money growth.
Result: Higher expected inflation, which further shifted PC.
1979: Oil prices surged again, worsening the Fed’s tradeoff.
38.001/1981
32.501/1980
14.851/1979
10.111/1974
$ 3.561/1973
Oil price per barrel
© 2012 Cengage Learning. All Rights Reserved. May not be copied, scanned, or duplicated, in whole or in part, except for use as permitted in a license distributed with a certain product or service or otherwise on a password-protected website for classroom use.
22
The 1970s Oil Price Shocks
Inflation rate
(% per year)
Unemployment rate (%)
0
2
4
6
8
10
0 2 4 6 8 10
Supply shocks & rising expected inflation worsened the PC tradeoff.1972
73
7475
7677
7879
80
81

© 2012 Cengage Learning. All Rights Reserved. May not be copied, scanned, or duplicated, in whole or in part, except for use as permitted in a license distributed with a certain product or service or otherwise on a password-protected website for classroom use.
2323
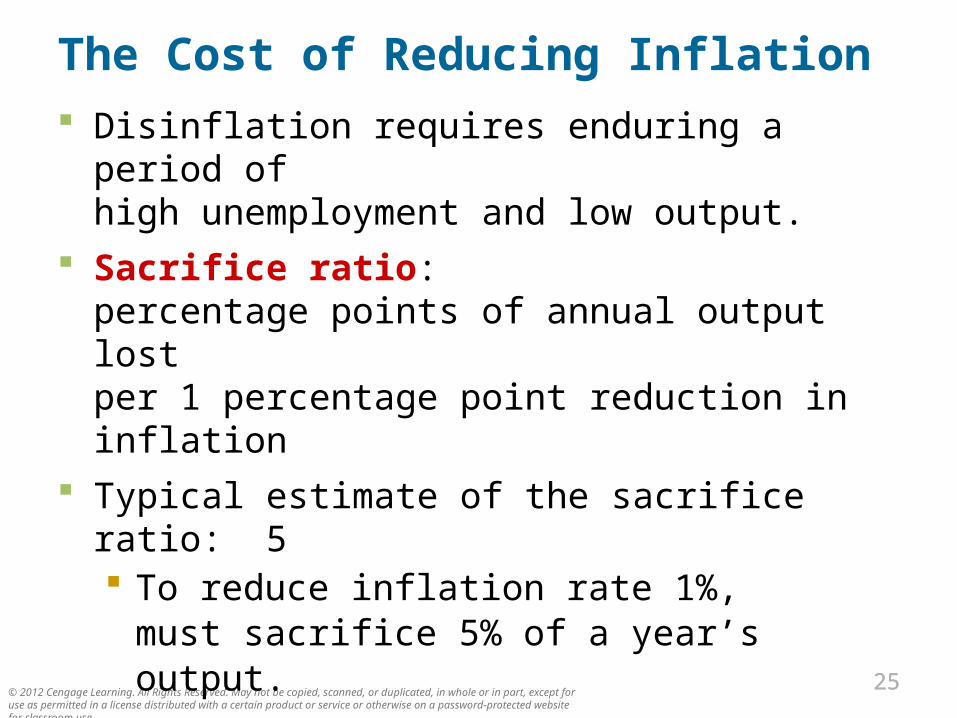
The Cost of Reducing Inflation
Disinflation: a reduction in the inflation rate
To reduce inflation, Fed must slow the rate of money growth, which reduces agg demand.
Short run: Output falls and unemployment rises.
Long run: Output & unemployment return to their natural rates.
© 2012 Cengage Learning. All Rights Reserved. May not be copied, scanned, or duplicated, in whole or in part, except for use as permitted in a license distributed with a certain product or service or otherwise on a password-protected website for classroom use.
2424
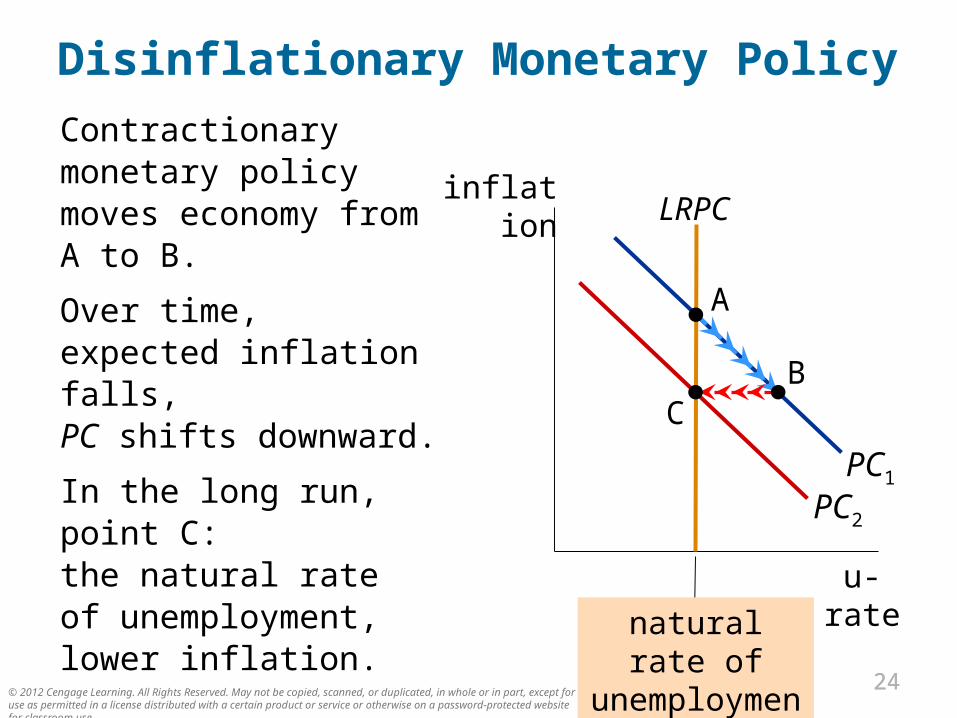
Disinflationary Monetary Policy
Contractionary monetary policy moves economy from A to B.
Over time, expected inflation falls, PC shifts downward.
In the long run, point C: the natural rate of unemployment, lower inflation. u-rate
inflationLRPC
PC1
natural rate of unemployment
A
PC2
CB
© 2012 Cengage Learning. All Rights Reserved. May not be copied, scanned, or duplicated, in whole or in part, except for use as permitted in a license distributed with a certain product or service or otherwise on a password-protected website for classroom use.
2525
The Cost of Reducing Inflation Disinflation requires enduring a period of
high unemployment and low output. Sacrifice ratio:
percentage points of annual output lost per 1 percentage point reduction in inflation
Typical estimate of the sacrifice ratio: 5 To reduce inflation rate 1%,
must sacrifice 5% of a year’s output. Can spread cost over time, e.g.
To reduce inflation by 6%, can either sacrifice 30% of GDP for one year sacrifice 10% of GDP for three years

© 2012 Cengage Learning. All Rights Reserved. May not be copied, scanned, or duplicated, in whole or in part, except for use as permitted in a license distributed with a certain product or service or otherwise on a password-protected website for classroom use.
2626
Rational Expectations, Costless Disinflation?
Rational expectations: a theory according to which people optimally use all the information they have, including info about govt policies, when forecasting the future
Early proponents: Robert Lucas, Thomas Sargent, Robert Barro
Implied that disinflation could be much less costly…

© 2012 Cengage Learning. All Rights Reserved. May not be copied, scanned, or duplicated, in whole or in part, except for use as permitted in a license distributed with a certain product or service or otherwise on a password-protected website for classroom use.
2727
Rational Expectations, Costless Disinflation?
Suppose the Fed convinces everyone it is committed to reducing inflation.
Then, expected inflation falls, the short-run PC shifts downward.
Result: Disinflations can cause less unemployment than the traditional sacrifice ratio predicts.
© 2012 Cengage Learning. All Rights Reserved. May not be copied, scanned, or duplicated, in whole or in part, except for use as permitted in a license distributed with a certain product or service or otherwise on a password-protected website for classroom use.
2828
The Volcker Disinflation
Fed Chairman Paul Volcker Appointed in late 1979 under high inflation &
unemployment Changed Fed policy to disinflation
1981–1984: Fiscal policy was expansionary,
so Fed policy had to be very contractionary to reduce inflation.
Success: Inflation fell from 10% to 4%,but at the cost of high unemployment…

© 2012 Cengage Learning. All Rights Reserved. May not be copied, scanned, or duplicated, in whole or in part, except for use as permitted in a license distributed with a certain product or service or otherwise on a password-protected website for classroom use.
29
The Volcker Disinflation
Inflation rate
(% per year)
Unemployment rate (%)
0
2
4
6
8
10
0 2 4 6 8 10
Disinflation turned out to be very costly
u-rate near 10%
in 1982–831979
8081
82
8384
85
86
87
© 2012 Cengage Learning. All Rights Reserved. May not be copied, scanned, or duplicated, in whole or in part, except for use as permitted in a license distributed with a certain product or service or otherwise on a password-protected website for classroom use.
3030
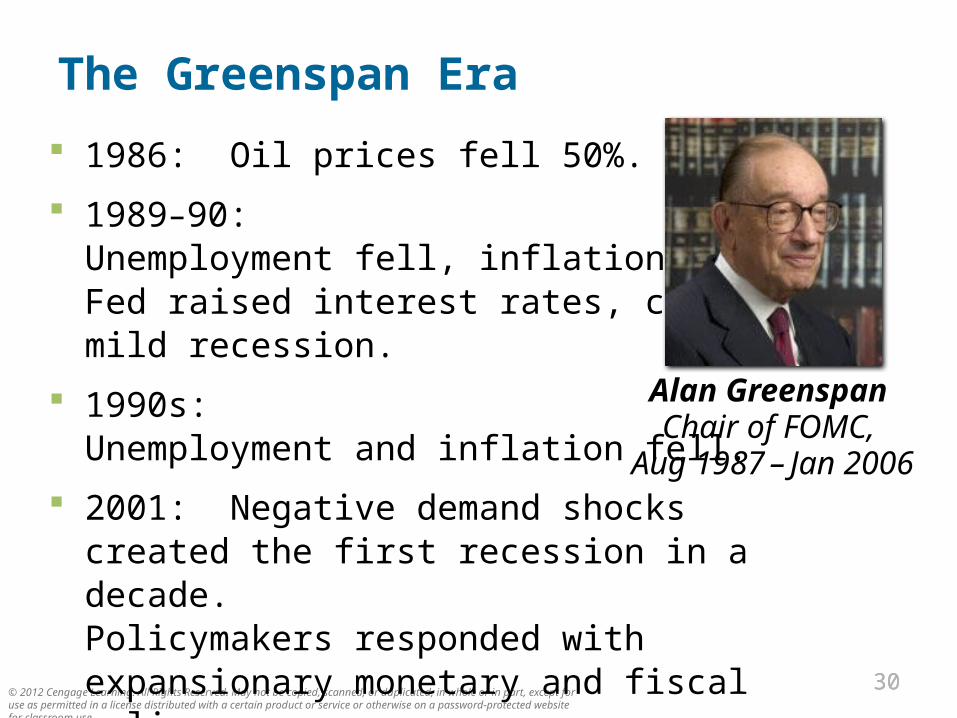
The Greenspan Era
1986: Oil prices fell 50%.
1989–90: Unemployment fell, inflation rose. Fed raised interest rates, caused a mild recession.
1990s: Unemployment and inflation fell.
2001: Negative demand shocks created the first recession in a decade. Policymakers responded with expansionary monetary and fiscal policy.
Alan Greenspan Chair of FOMC,
Aug 1987 – Jan 2006
© 2012 Cengage Learning. All Rights Reserved. May not be copied, scanned, or duplicated, in whole or in part, except for use as permitted in a license distributed with a certain product or service or otherwise on a password-protected website for classroom use.
31
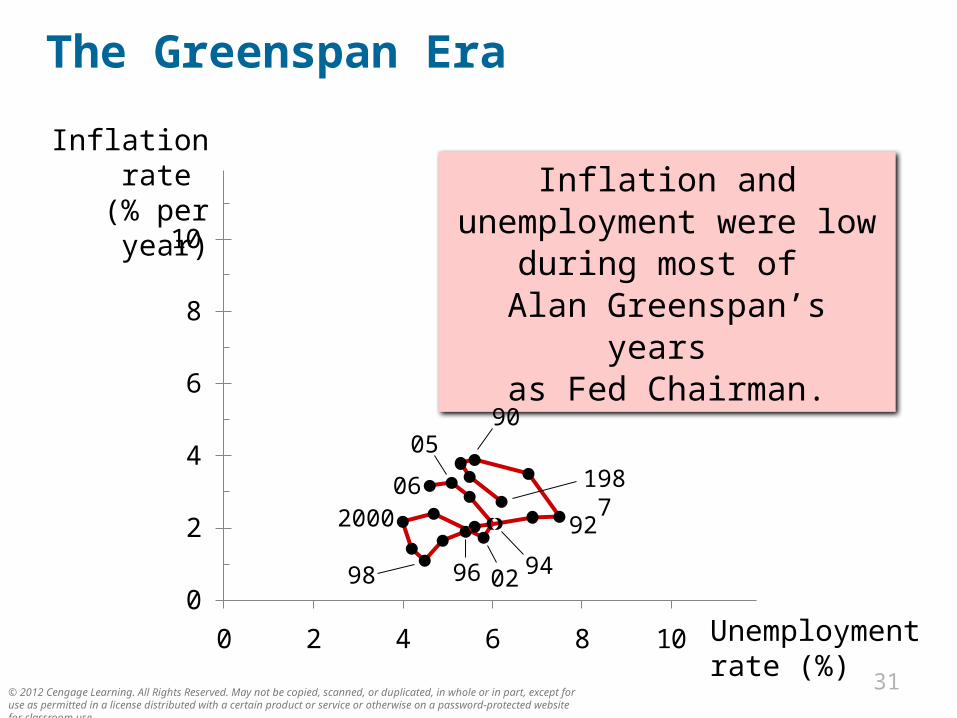
The Greenspan Era
Inflation rate
(% per year)
Unemployment rate (%)
0
2
4
6
8
10
0 2 4 6 8 10
Inflation and unemployment were low during most of Alan Greenspan’s years
as Fed Chairman.
1987
90
922000
949698
06
02
05
© 2012 Cengage Learning. All Rights Reserved. May not be copied, scanned, or duplicated, in whole or in part, except for use as permitted in a license distributed with a certain product or service or otherwise on a password-protected website for classroom use.
3232
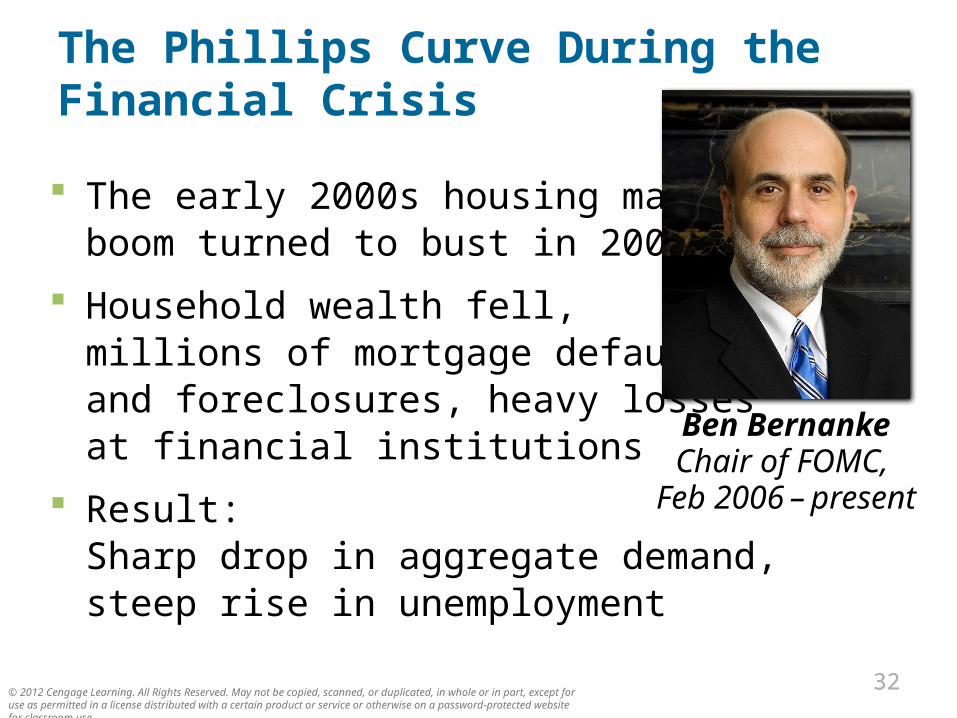
The Phillips Curve During the Financial Crisis
The early 2000s housing market boom turned to bust in 2006
Household wealth fell, millions of mortgage defaultsand foreclosures, heavy lossesat financial institutions
Result: Sharp drop in aggregate demand, steep rise in unemployment
Ben BernankeChair of FOMC,
Feb 2006 – present

© 2012 Cengage Learning. All Rights Reserved. May not be copied, scanned, or duplicated, in whole or in part, except for use as permitted in a license distributed with a certain product or service or otherwise on a password-protected website for classroom use.
3333
FINAL CLICKER QUESTION!!!!!
Who is better looking?
A. Alan Greenspan
B. Ben Bernanke
C. Prof. Zax
D. None of the above
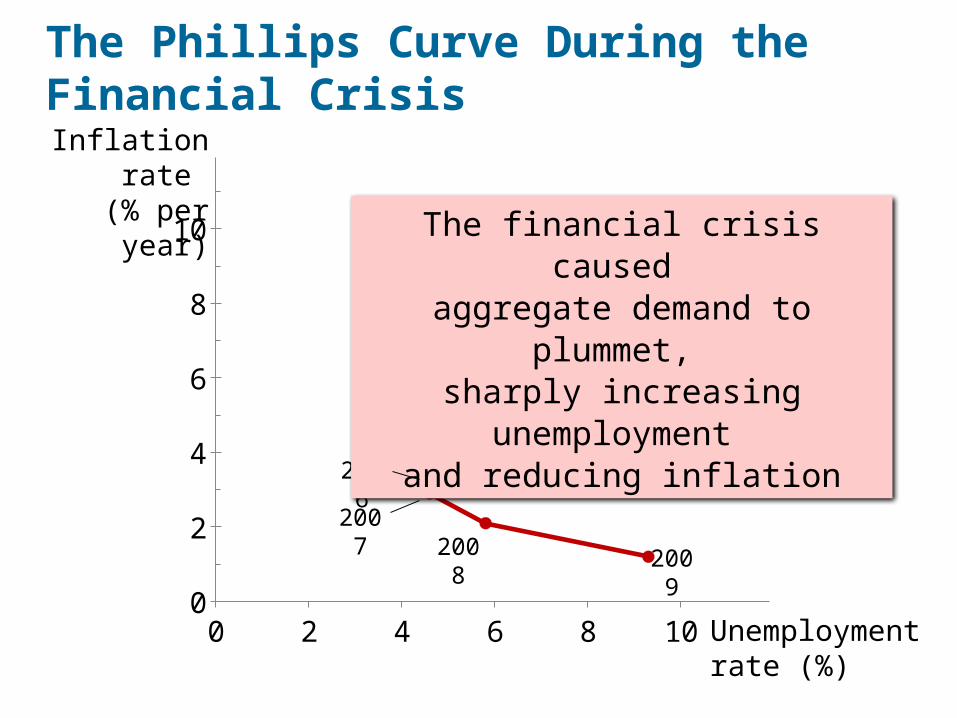
The Phillips Curve During the Financial CrisisInflation rate
(% per year)
Unemployment rate (%)
0 2 4 6 8 100
2
4
6
8
10
2006
The financial crisis caused aggregate demand to plummet,
sharply increasing unemployment and reducing inflation
20072008 2009
© 2012 Cengage Learning. All Rights Reserved. May not be copied, scanned, or duplicated, in whole or in part, except for use as permitted in a license distributed with a certain product or service or otherwise on a password-protected website for classroom use.
3535
CONCLUSION
The theories in this chapter come from some of the greatest economists of the 20th century.
They teach us that inflation and unemployment are unrelated in the long run negatively related in the short run affected by expectations,
which play an important role in the economy’s adjustment from the short-run to the long run
S U M M A RY
• The Phillips curve describes the short-run tradeoff between inflation and unemployment.
• In the long run, there is no tradeoff: inflation is determined by money growth, while unemployment equals its natural rate.
• Supply shocks and changes in expected inflation shift the short-run Phillips curve, making the tradeoff more or less favorable.
© 2012 Cengage Learning. All Rights Reserved. May not be copied, scanned, or duplicated, in whole or in part, except for use as permitted in a license distributed with a certain product or service or otherwise on a password-protected website for classroom use.
S U M M A RY
• The Fed can reduce inflation by contracting the money supply, which moves the economy along its short-run Phillips curve and raises unemployment. In the long run, though, expectations adjust and unemployment returns to its natural rate.
• Some economists argue that a credible commitment to reducing inflation can lower the costs of disinflation by inducing a rapid adjustment of expectations.
© 2012 Cengage Learning. All Rights Reserved. May not be copied, scanned, or duplicated, in whole or in part, except for use as permitted in a license distributed with a certain product or service or otherwise on a password-protected website for classroom use.