The Role of Vibration Monitoring in Predictive Maintenance · PDF fileThe Role of Vibration...
20
The Role of Vibration Monitoring in Predictive Maintenance Dr. S. J. Lacey, Engineering Manager Schaeffler (UK) Limited
Transcript of The Role of Vibration Monitoring in Predictive Maintenance · PDF fileThe Role of Vibration...

The Role of Vibration Monitoring in Predictive MaintenanceDr. S. J. Lacey, Engineering Manager Schaeffler (UK) Limited

The Role of Vibration Monitoring in Predictive MaintenanceDr. S. J. Lacey, Engineering Manager Schaeffler (UK) Limited
1. Introduction
As greater demands are placed on existing assets in terms ofhigher output or increased efficiency, the need to understandwhen things are starting to go wrong is becoming moreimportant. Add to this the increasing complexity andautomation of plant and equipment, it becomes moreimportant to have a properly structured and fundedmaintenance strategy. There is also a need to understand theoperation of equipment so that improvements in plant outputand efficiency can be realised. In today’s increasinglycompetitive world all of these issues are of key importanceand can only be achieved through a properly structured andfinanced maintenance strategy that meets the business needs.
Maintenance can often be a casualty as businesses seek tosave costs. How often have we heard the words “we have hadno problems since the equipment was installed so we don’tneed condition monitoring”. This is often borne out ofignorance and not undertaking a proper risk assessment toidentify the criticality of existing assets so that the potentialreturn on investment (ROI) of a properly funded maintenancestrategy can be determined.
The need to run a plant at a higher efficiency yet often withfewer people puts increasing pressure on all concerned whenequipment fails prematurely. When equipment does fail it isoften at the most inconvenient time, either in the middle of akey process, at a weekend or in the middle of the night, whenobtaining replacement parts may be difficult and labour costsare high due to overtime. While there is never a good time forequipment to fail, the technology available today means thatthere is simply no excuse for not taking the necessary stepsto protect key assets. This can be achieved by minimising therisk of early and unexpected failures through a properlystructured and funded maintenance strategy which willultimately reduce overall operational costs.
The cost of not having a robust maintenance strategy shouldnot be underestimated. It should not be looked at simply asan upfront cost, but viewed as an investment to safeguard andprotect key assets, reducing the need for costly repairs andprotecting the output of key processes. In some industries,maintenance is now the second largest or even the largestelement of operating costs. As a result, it has moved fromalmost nowhere to the top of the league as a cost controlpriority in the last two or three decades.
The need to contain costs and run plant for longer morereliably means that there is a growing awareness of the needto prevent unnecessary equipment failures. Central to this is amaintenance strategy which is based on monitoring key assetsto detect when things are starting to go wrong, enabling plantoutage to be better planned in terms of resource availability,spare components, repairs etc. As a result, the risk of missingimportant contract deadlines is reduced and customerconfidence is improved.
Until recently, many industries have and still do take thereactive approach to maintenance since this has no upfrontcosts but can result in many hours or days of plant downtimeand/or lost production. While this may have been acceptablein the past, the increasing complexity and automation ofequipment has meant this is not now a cost-effective option.
Having a clear and robust maintenance strategy fullysupported by senior management is becoming more important,particularly in industries where it not only has a major impacton costs but also on the health and safety of employees andin situations where secondary damage and a catastrophicfailure may result.
SummaryUnexpected equipment failures can be expensive and potentially catastrophic, resulting in unplannedproduction downtime, costly replacement of parts and safety and environmental concerns. Predictive Maintenance (PdM) is a process for monitoring equipment during operation in order to identifyany deterioration, enabling maintenance to be planned and operational costs reduced. Rolling bearings are critical components used extensively in rotating equipment and, if they fail unexpectedly, can result ina catastrophic failure with associated high repair and replacement costs. Vibration based conditionmonitoring can be used to detect and diagnose machine faults and form the basis of a PredictiveMaintenance strategy.
Page 2
2. Maintenance Approach
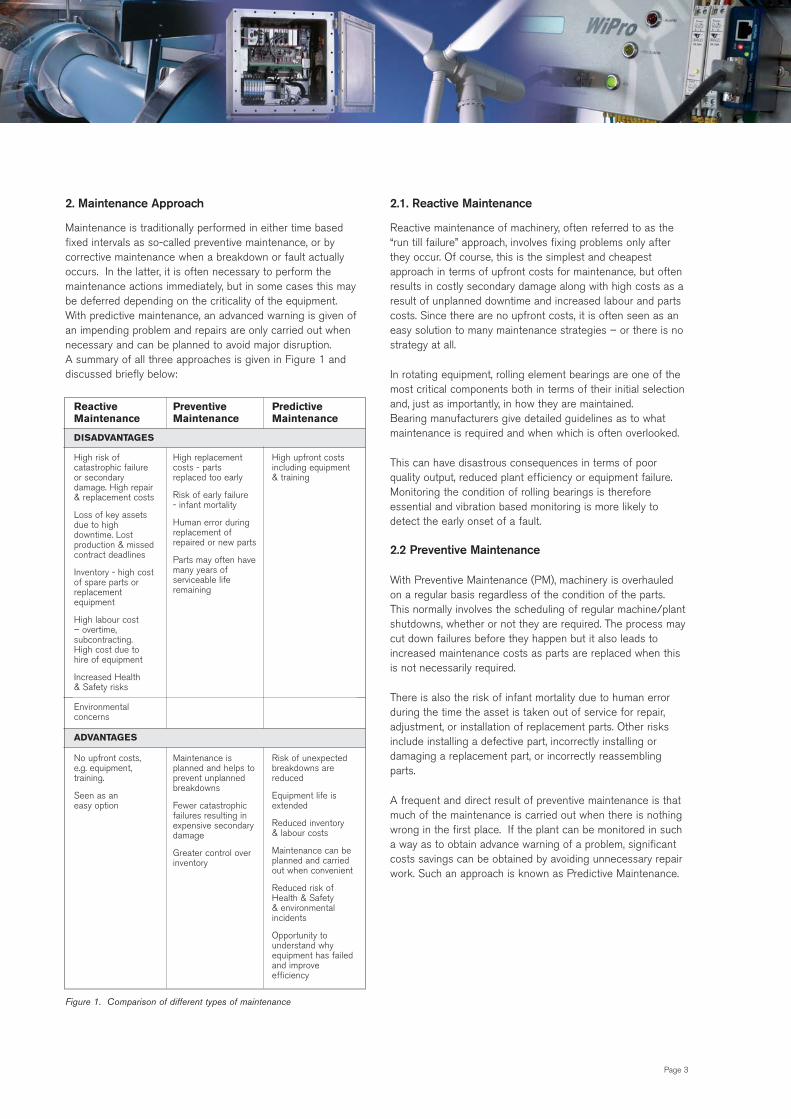
Maintenance is traditionally performed in either time basedfixed intervals as so-called preventive maintenance, or bycorrective maintenance when a breakdown or fault actuallyoccurs. In the latter, it is often necessary to perform themaintenance actions immediately, but in some cases this maybe deferred depending on the criticality of the equipment.With predictive maintenance, an advanced warning is given ofan impending problem and repairs are only carried out whennecessary and can be planned to avoid major disruption. A summary of all three approaches is given in Figure 1 anddiscussed briefly below:
Figure 1. Comparison of different types of maintenance
2.1. Reactive Maintenance
Reactive maintenance of machinery, often referred to as the“run till failure” approach, involves fixing problems only afterthey occur. Of course, this is the simplest and cheapestapproach in terms of upfront costs for maintenance, but oftenresults in costly secondary damage along with high costs as aresult of unplanned downtime and increased labour and partscosts. Since there are no upfront costs, it is often seen as aneasy solution to many maintenance strategies – or there is nostrategy at all.
In rotating equipment, rolling element bearings are one of themost critical components both in terms of their initial selectionand, just as importantly, in how they are maintained. Bearing manufacturers give detailed guidelines as to whatmaintenance is required and when which is often overlooked.
This can have disastrous consequences in terms of poorquality output, reduced plant efficiency or equipment failure.Monitoring the condition of rolling bearings is thereforeessential and vibration based monitoring is more likely todetect the early onset of a fault.
2.2 Preventive Maintenance
With Preventive Maintenance (PM), machinery is overhauledon a regular basis regardless of the condition of the parts.This normally involves the scheduling of regular machine/plantshutdowns, whether or not they are required. The process maycut down failures before they happen but it also leads toincreased maintenance costs as parts are replaced when thisis not necessarily required.
There is also the risk of infant mortality due to human errorduring the time the asset is taken out of service for repair,adjustment, or installation of replacement parts. Other risksinclude installing a defective part, incorrectly installing ordamaging a replacement part, or incorrectly reassemblingparts.
A frequent and direct result of preventive maintenance is thatmuch of the maintenance is carried out when there is nothingwrong in the first place. If the plant can be monitored in sucha way as to obtain advance warning of a problem, significantcosts savings can be obtained by avoiding unnecessary repairwork. Such an approach is known as Predictive Maintenance.
Page 3
DISADVANTAGES
ReactiveMaintenance
PreventiveMaintenance
PredictiveMaintenance
High risk ofcatastrophic failureor secondarydamage. High repair& replacement costs
Loss of key assetsdue to highdowntime. Lostproduction & missedcontract deadlines
Inventory - high costof spare parts orreplacementequipment
High labour cost – overtime,subcontracting. High cost due to hire of equipment
Increased Health & Safety risks
Environmentalconcerns
High replacementcosts - partsreplaced too early
Risk of early failure - infant mortality
Human error duringreplacement ofrepaired or new parts
Parts may often havemany years ofserviceable liferemaining
High upfront costsincluding equipment& training
No upfront costs, e.g. equipment,training.
Seen as an easy option
Maintenance isplanned and helps toprevent unplannedbreakdowns
Fewer catastrophicfailures resulting inexpensive secondarydamage
Greater control overinventory
Risk of unexpectedbreakdowns arereduced
Equipment life isextended
Reduced inventory & labour costs
Maintenance can beplanned and carriedout when convenient
Reduced risk ofHealth & Safety & environmentalincidents
Opportunity tounderstand whyequipment has failedand improveefficiency
ADVANTAGES

2.3 Predictive Maintenance
Predictive Maintenance (PdM) is the process of monitoring thecondition of machinery as it operates in order to predict whichparts are likely to fail and when. In this way, maintenance canbe planned and there is an opportunity to change only thoseparts that are showing signs of deterioration or damage. The basic principle of predictive maintenance is to takemeasurements that allow for the prediction of which parts willbreak down and when. These measurements include machinevibration and plant operating data such as flow, temperature, or pressure.
Continuous monitoring detects the onset of componentproblems in advance, which means that maintenance isperformed only when needed. With this type of approach,unplanned downtime is reduced or eliminated and the risk ofcatastrophic failure is mitigated. It allows parts to be orderedmore effectively, thereby minimising inventory items, andmanpower can be scheduled, thereby increasing efficiency andreducing the costs of overtime.
The main benefits of PdM are:
Improved machine reliability through the effective predictionof equipment failures.
Reduced maintenance costs by minimising downtimethrough the scheduling of repairs
Increased production through greater machine availability
Lower energy consumption
Extended bearing service life
Improved product quality
Rolling bearings are often a key element in many differenttypes of plant and equipment spanning all market sectors. On one hand they can be of a standard design, readilyavailable and low cost commodity items costing only a fewpounds, such as those in electric motors, fans and gearboxes,while on the other hand they can be of bespoke design withlong lead times and cost hundreds of thousands of pounds, asis the case in wind turbines, steelmaking plant etc.
However, they have one thing in common: if they failunexpectedly, they can result in plant and equipment outageresulting in lost production costing from a few thousand tomany millions of pounds. With a Predictive Maintenancestrategy, such large costs can be avoided by giving advancewarning of a potential problem, enabling remedial action to beplanned and taken at a convenient time.
Replacing a bearing in a gearbox is preferable to replacing thewhole gearbox, and replacing a motor bearing is better thanhaving to send the motor to a rewinder to make expensiverepairs and replace parts.
At the heart of many Predictive Maintenance strategies isCondition Monitoring which detects potential defects in criticalcomponents e.g. bearings, gears etc at the early stage therebyenabling the maintenance activity to be planned, saving bothtime and money and preventing secondary damage toequipment which can often be catastrophic.
3. Identifying Asset Criticality
Rolling bearings are used extensively in almost every type ofrotating equipment whose successful and reliable operation ishighly dependent on the bearing type, bearing fits andinstallation and maintenance requirements, such asrelubrication.
When rolling bearings deteriorate it can result in expensiveequipment failures with high associated costs. Unplanneddowntime, the costly replacement of equipment, health andsafety issues and environmental concerns are all potentialconsequences of a maintenance strategy that fails to monitorand predict equipment problems before they escalate into amore serious situation.
Assessing the criticality of an asset to the overall operation ofthe plant is therefore essential in terms of determining thetype of condition monitoring required and whether it isnecessary at all. In some cases where a plant has a largenumber of low cost assets, where replacements are readilyavailable and/or are not deemed critical, a reactive orpreventive approach may well be appropriate.
Even if an asset does warrant condition monitoring, a decisionmust be made not only on the technology but also on whetherthe asset warrants continuous (online system) or noncontinuous (patrol) monitoring. To help with this decision,assets are often assigned to one of three categoriesdepending on their criticality, Figure 2
(1).
Page 4

Figure 2. Asset categorisation
Category A assets are deemed to be critical and generallyfulfil one or all of the following criteria:
Failure results in total or major interruption of the process
Failure represents a significant safety risk, such as fire, toxic leak, or explosion
Long lead times and/or significant repair costs.
A good example of this type of asset would be the mainturbine-generator trains in a large power plant. For suchassets, it is the cost of failure that is of primary concern.Other examples would be the main rotor bearing or gearboxbearings in a wind turbine. Due to the generally remotelocation, failure of the main rotor bearing or gearbox bearings,which may lead, to secondary damage makes replacementcostly in terms of replacement parts, hire of equipment and labour.
Category B assets are, on the other hand, essential assets andinclude, for example, pumps or compressors where, in theevent of a fault, a standby unit is available; this may thenbecome a category A asset.
Category C or non-essential assets are at the far end of thespectrum and the reasons for monitoring these, if indeed theyare monitored at all, might be to prevent failure by eliminatingroot cause and allow more effective maintenance planning.
4. Return on Investment (ROI)
As already discussed, equipment failure can be expensive and potentially catastrophic resulting in unplanned downtime,missed customer schedules, costly machinereplacements/repairs as well as safety and environmentalconcerns. By initiating a Predictive Maintenance strategy,unforeseen failures are minimised and this can yield animpressive ROI. Another major benefit of introducing CM aspart of a Predictive Maintenance program is that it enables agreater understanding of the equipment critical to the processand also allows more time to be spent on improving the overallcondition of the assets and improving the efficiency of keyprocesses.
When justifying PdM, the following should be taken intoconsideration:
(1) Direct CostsLabour
- Normal and overtime labour for- planned repair activities- unplanned repairs
Materials- Parts replaced- Machinery replaced
(2) Indirect Costs- Lost production (£ per hour)- Outside services- Insurance costs- Parts inventory
Total Potential Cost Reduction (1+2)
(3) PdM Program Costs- Site survey- Cost of capital equipment- Cost of any additional labour- Cost of training- Initial setup and baseline- Scheduled data collection
(visits per year at £ per visit)Total PdM Costs for One Year (3)
Page 5
Equipment assets having alarge impact on plantoutput; equipment thatrepresents significantrepair costs; equipmentwith significant health &safety impacts. Failurescan occur very suddenlyand do not always giveadvance warning.
Failures are veryexpensive due to lostproduction, health & safetyimpacts or environmentalimpact. Examples includelarge horsepower, highenergy density machineswith very high replacementand maintenance costs.
Financial justification:prevention of lostproduction, reducedmaintenance costs,protection of life and environment
A
B
C
Equipment assets having a lesser impact on plantoutput; equipment withmoderate repair costs;equipment that can havehealth & safetyimplications if failureoccurs. Failures can occur relatively quickly, but usually with someadvance warning
Similar to economics ofcritical equipment assets,but of smaller magnitude.Typical examples includemedium horsepowermachines with moderatereplacement andmaintenance costs
Equipment assets havinglittle or no direct impact onplant output; equipmentthat represents limitedrepair costs; equipmentthat has minor safetyramifications
Typically include smallerassets with small individualreplacement & repaircosts & little or no costsrelated to lost production.However, they collectivelycomprise a largepercentage of annualmaintenance costs.
Small individual repair &replacement costs. Costsof failure do not exceedcosts to monitor (orexcessive payback periods)
Category Description Economics

By contracting out PdM, there will be no capital equipment andtraining costs and the benefits tend to be more immediatebecause of the use of highly trained staff. However, it is oftenmore beneficial to keep the activities in-house, which allowsgreater familiarity with plant, equipment and processes andgives the benefits not only of preventing unplanned downtimebut also enables more time to be spent on mitigating potentialfailure modes and improving process efficiency.
The cement industry is a good example where CM has beenimplemented and saved money both in terms of repair costsand lost production. In one case, the failure of a large gearboxcaused a three week shutdown and extensive repair costs aretypically €50,000 to €100,000. To prevent such damage, F’IS(FAG Industrial Services, Schaeffler Group) installed an eightchannel FAG DTECT X1 system and trained the customer’sstaff who received three months’ support at a total cost of€18,000. Detecting deterioration of the gearbox earlyresulted in a repair cost of €5000, saving the customer atleast €27,000. More importantly, the company avoided lostproduction amounting to around €6000/hour.
5. Condition Monitoring
Condition monitoring is a process where the condition ofequipment is monitored for early signs of deterioration so thatthe maintenance activity can be better planned, reducing down time and costs. This is particularly important incontinuous process plants, where failure and downtime can be extremely costly.
The monitoring of vibration, temperature, voltage or currentand oil analysis are probably the most common. Vibration isthe most widely used and not only has the ability to detect anddiagnose problems but potentially give a prognosis i.e. theremaining useful life and possible failure mode of the machine.However, prognosis is much more difficult and often relies onthe continued monitoring of the fault to determine a suitabletime when the equipment can be taken out of service or relieson known experience with similar problems.
5.1. Vibration Monitoring
Vibration monitoring is probably the most widely usedpredictive maintenance technique and, with few exceptions,can be applied to a wide variety of rotating equipment. Sincethe mass of the rolling elements is generally small comparedto that of the machine, the velocities generated are generallysmall and result in even smaller movements of the bearinghousing, making it difficult for the vibration sensor to detect.
Machine vibration comes from many sources e.g. bearings,gears, unbalance etc and even small amplitudes can have asevere effect on the overall machine vibration depending onthe transfer function, damping and resonances, Figure 3. Each source of vibration will have its own characteristicfrequencies and can manifest itself as a discrete frequency or as a sum and/or difference frequency.
Figure 3. Simple machine model
At low speeds, it is still possible to use vibration but a greaterdegree of care and experience is required and othertechniques such as measuring shaft displacement or AcousticEmission (AE) may yield more meaningful results although theformer is not always easy to apply. Furthermore, AE maydetect a change in condition but has limited diagnosticcapability. Vibration is used successfully on wind turbineswhere the main rotor speed is typically between 5 and 30 rpm.In a wind turbine, there are two main groups of vibrationfrequencies generated - gear mesh and bearing defectfrequencies. This can result in complex vibration signals, whichcan make frequency analysis a formidable task. However,techniques such as enveloping (see section 5.1.3), which has ahigh sensitivity to faults that cause impacting, can help reducethe complexity of the analysis. Bearing defects can excitehigher frequencies, which can be used as a basis for detectingincipient damage.
Vibration measurement can generally be characterised asfalling into one of three categories – detection, diagnosis andprognosis.
Detection generally uses the most basic form of vibrationmeasurement, where the overall vibration level is measured ona broadband basis in a range, for example, of 10-1000Hz or10-10000Hz. In machines where there is little vibration otherthan from the bearings, the spikiness of the vibration signalindicated by the Crest Factor (peak/RMS) may imply incipientdefects, whereas the high energy level given by the RMS levelmay indicate severe defects.
This type of measurement generally gives limited information(other than to an experienced operator) but can be useful fortrending, where an increasing vibration level is an indicator ofdeteriorating machine condition. Trend analysis involvesplotting the vibration level as a function of time and using thisto predict when the machine must be taken out of service forrepair or at least a more in depth survey must be performed.
Page 6

Another way of using the measurement is to compare thelevels with published vibration criteria for different types ofequipment.
Although broadband vibration measurement may provide agood starting point for fault detection, it has limited diagnosticcapability and, while a fault may be identified, it may not give areliable indication of where the fault lies, for example inbearing deterioration/damage, unbalance, misalignment etc.Where an improved diagnostic capability is required, frequencyanalysis is normally employed which usually gives a muchearlier indication of the development of a fault and also itssource.
Having detected and diagnosed a fault, it is much moredifficult to give a prognosis on the remaining useful life andpossible failure mode of the machine or equipment. This oftenrelies on continued monitoring of the fault, to determine asuitable time when the equipment can be taken out of service,and/or on experience with similar problems.
In general, rolling bearings produce very little vibration whenthey are free of faults and have distinctive characteristicfrequencies when faults develop. A fault that begins as asingle defect, such as a spall on a raceway, is normallydominated by impulsive events at the raceway pass frequency,resulting in a narrow band frequency spectrum. As the damageincreases, there is likely to be an increase in the characteristicdefect frequencies and sidebands, followed by a drop in theseamplitudes and an increase in the broadband noise withconsiderable vibration at shaft rotational frequency. Wheremachine speeds are very low, the bearings generate lowenergy signals, which may also be difficult to detect.Furthermore, bearings located within a gearbox can be difficultto monitor because of the high energy at the gear meshingfrequencies, which can mask the bearing defect frequencies.
5.1.1 Overall Vibration Level
This is the simplest way of measuring vibration and usuallyinvolves measuring the RMS (Root Mean Square) vibration ofthe bearing housing or some other point on the machine withthe transducer located as close to the bearing as possible.The vibration is measured over a wide frequency range, suchas 10-1000Hz or 10-10000Hz.
The measurements can be trended over time and comparedwith known levels of vibration, or pre-alarm and alarm levelscan be set to indicate a change in the machine condition.Alternatively, measurements can be compared with generalstandards.
Although this method represents a quick and low cost methodof vibration monitoring, it is less sensitive to incipient defectsi.e. it is only really suitable for detecting defects in theadvanced condition and has limited diagnostic capability.
It is also easily influenced by other sources of vibration, suchas unbalance, misalignment, looseness, electromagneticvibration etc.
In some situations, the Crest Factor (Peak-to-RMS ratio) ofthe vibration is capable of giving an earlier warning of bearingdefects.
As a local fault develops, this produces short bursts of highenergy, which increase the peak level of the vibration signalbut have little influence on the overall RMS level. As the faultprogresses, more peaks will be generated until finally theCrest Factor decreases but the RMS vibration increases.
The main disadvantage of this method is that, in the earlystages of a bearing defect, the vibration is normally lowcompared with other sources of vibration present and istherefore easily influenced, so any changes in bearingcondition are difficult to detect.
5.1.2 Frequency Spectrum
Frequency analysis plays an important part in the detectionand diagnosis of machine faults. In the time domain, theindividual contributions such as unbalance, bearings, gears etcto the overall machine vibration are difficult to identify. In thefrequency domain, they become much easier to identify andcan therefore be much more easily related to individualsources of vibration.
It is not always possible to rely on the amplitude of bearingdiscrete frequencies to provide defect severity because eachmachine will have different mass, stiffness and dampingproperties. Even identical machines can have different systemproperties and this can affect the amplitudes of bearingdefects of similar size.
It is often the pattern of the bearing defect frequencies that is most significant in determining the defect severity. The number of bearing related harmonic frequencies,frequency sidebands and characteristic features within thetime waveform data can be much more reliable than amplitudealone as a method of determining when action needs to betaken.
As already discussed, a fault developing in a bearing will showup as increasing vibration at frequencies related to the bearingcharacteristic frequencies, making detection possible at amuch earlier stage than with overall vibration.
Page 7
5.1.3 Envelope Spectrum
When a bearing starts to deteriorate, the resulting time signaloften exhibits characteristic features that can be used todetect a fault. Furthermore, bearing condition can rapidlyprogress from a very small defect to complete failure in arelatively short period of time, so early detection requiressensitivity to very small changes in the vibration signature. As already discussed, the vibration signal from the early stageof a defective bearing may be masked by machine noise,making it difficult to detect the fault by spectrum analysis alone.
The main advantage of envelope analysis is its ability to extractthe periodic impacts from the modulated random noise of adeteriorating rolling bearing. This is even possible when thesignal from the rolling bearing is relatively low in energy and“buried” within other vibration from the machine.
Like any other structure with mass and stiffness, the bearinginner and outer rings have their own natural frequencies whichare often in the kilohertz range. However, it is more likely thatthe natural frequency of the outer ring will be detected due tothe small interference or clearance fit in the housing.
If there is a fault on the outer ring, the natural frequency of thering may be excited as the rolling element hits the fault andthis will result in a high frequency burst of energy whichdecays and is then excited again as the next rolling elementhits the defect. In other words, the resulting time signal willcontain a high frequency component amplitude modulated atthe ball/roller pass frequency of the outer raceway. In practicethis vibration will be very small and almost impossible to detectin a base spectrum, so a method of enhancing the signal isrequired.
By removing the low frequency components through a suitablehigh pass filter, rectifying the output and then using a low passfilter, this leaves the envelope of the signal whose frequencycorresponds to the repetition rate of the defect. This techniqueis often used to detect early damage in rolling elementbearings and is also often referred to as the High FrequencyResonance Technique (HFRT) or Envelope Spectrum.
5.1.4 Cepstrum Analysis
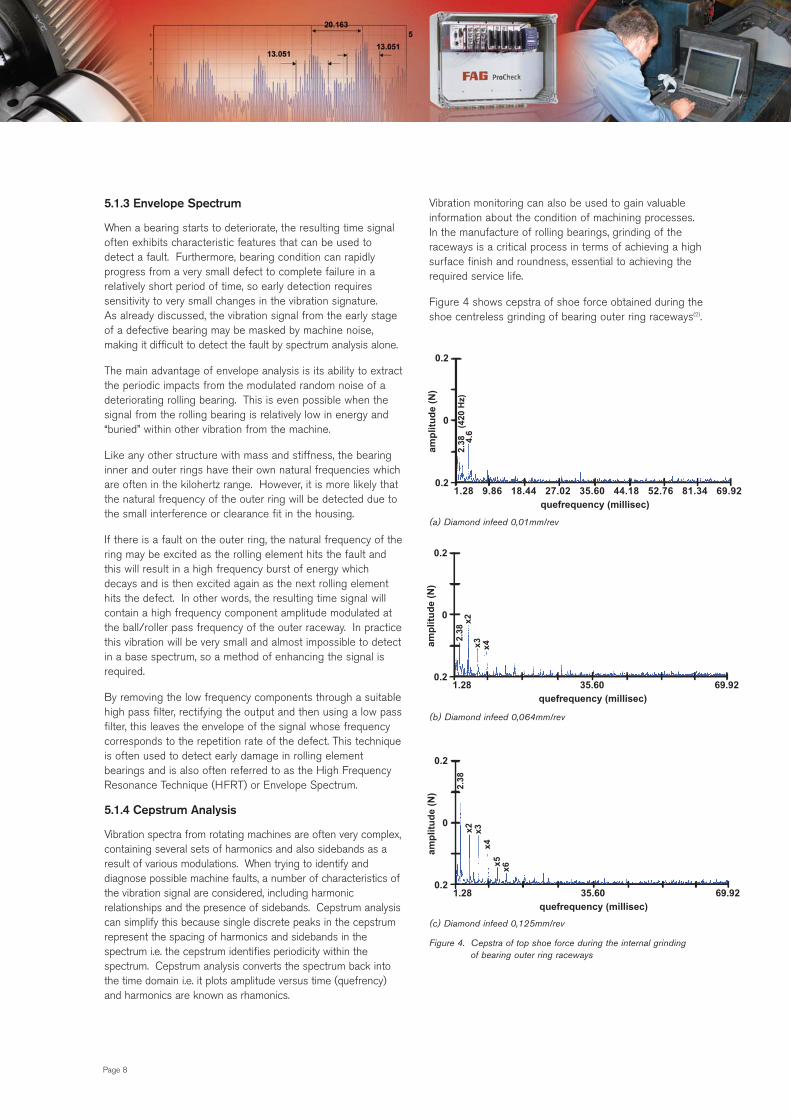
Vibration spectra from rotating machines are often very complex,containing several sets of harmonics and also sidebands as aresult of various modulations. When trying to identify anddiagnose possible machine faults, a number of characteristics ofthe vibration signal are considered, including harmonicrelationships and the presence of sidebands. Cepstrum analysiscan simplify this because single discrete peaks in the cepstrumrepresent the spacing of harmonics and sidebands in thespectrum i.e. the cepstrum identifies periodicity within thespectrum. Cepstrum analysis converts the spectrum back intothe time domain i.e. it plots amplitude versus time (quefrency)and harmonics are known as rhamonics.
Vibration monitoring can also be used to gain valuableinformation about the condition of machining processes. In the manufacture of rolling bearings, grinding of theraceways is a critical process in terms of achieving a highsurface finish and roundness, essential to achieving therequired service life.
Figure 4 shows cepstra of shoe force obtained during theshoe centreless grinding of bearing outer ring raceways(2).
(a) Diamond infeed 0,01mm/rev
(b) Diamond infeed 0,064mm/rev
(c) Diamond infeed 0,125mm/rev
Figure 4. Cepstra of top shoe force during the internal grinding of bearing outer ring raceways
Page 8
1.28 9.86 18.44 27.02 35.60 44.18 52.76 81.34 69.92
0.2
0
0.2
quefrequency (millisec)
amp
litu
de
(N)
2.38
(4
20 H
z)4.
6
1.28 35.60 69.92
0.2
0
0.2
quefrequency (millisec)
amp
litu
de
(N)
2.38
x2x3 x4
1.28 35.60 69.92
0.2
0
0.2
quefrequency (millisec)
amp
litu
de
(N)
2.38
x2 x3x4
x5x6

In this case, as the severity of the dressing process increasesi.e. increasing diamond infeed, the amplitude of the first peakat 2.38ms increases along with the number of rhamonics. The quefrency of 2.38ms corresponds to the wheel rotationalfrequency of 420Hz. This is because, as the severity of thedressing operation increases, it has a significant effect onwheel form, hence workpiece quality, and the vibration signalbecomes more highly modulated at wheel rotational speed.
6. Rolling Element Bearings
Rolling contact bearings are used in almost every type ofrotating machinery, whose successful and reliable operation isvery dependent on the type of bearing selected as well as theprecision of all associated components e.g. shaft, housing,spacers, nuts etc. Bearing engineers generally use fatigue asthe normal failure mode on the assumption that the bearingsare properly installed, operated and maintained. Thanks toimprovements in manufacturing technology and materials,bearing fatigue life, which is related to sub surface stresses, is generally no longer the limiting factor and probably accountsfor less than 3% of failures in service.
Unfortunately, many bearings fail prematurely in service due to contamination, poor lubrication, misalignment, temperatureextremes, poor fitting/fits, unbalance and misalignment. All these factors lead to an increase in bearing vibration andcondition monitoring has been used for many years to detectdegrading bearings before they catastrophically fail with theassociated costs of downtime or significant damage to otherparts of the machine.
Rolling element bearings of small to medium size are oftenused in electric motors for noise sensitive applications e.g.household appliances. Bearing vibration is therefore becomingincreasingly important from both an environmental perspectiveand because it is synonymous with quality.
Vibration monitoring has now become a well accepted part ofmany Predictive Maintenance regimes and relies on the wellknown characteristic vibration signatures which rollingbearings exhibit as the rolling surfaces degrade. In mostsituations, however, bearing vibration cannot be measureddirectly and the bearing vibration signature is modified by themachine structure. This situation is further complicated byvibration from other equipment on the machine, such aselectric motors, gears, belts, hydraulics, structural resonancesetc (Figure 3).
This often makes interpretation of vibration data difficult otherthan by a trained specialist and can, in some situations, lead toa misdiagnosis resulting in unnecessary machine downtimeand costs.
6.1 Bearing Characteristic Frequencies
Although the fundamental frequencies generated by rollingbearings are related to relatively simple formulae, they cover awide frequency range and can interact to give very complexsignals. This is often further complicated by the presence ofother sources of mechanical, structural or electromechanicalvibration on the equipment.
For a stationary outer ring and rotating inner ring, thefundamental frequencies are derived from the bearinggeometry as follows:
fc/o = fr/2 [1 – d/D Cos α ]
fc/i = fr/2 [1 + d/D Cos α ]
fb/o = Z fc/o
fb/i = Z fc/i
fb = D/2d fr [1 – (d/D Cos α)2 ]
fr = Inner ring rotational frequency
fc/o = Fundamental train (cage) frequency relative to outer ring
fc/i = Fundamental train frequency relative to inner ring
fb/o = Ball/Roller pass frequency of outer raceway (BPFO)
fb/i = Ball/Roller pass frequency ofinner raceway (BPFI)
fb = Rolling element rotational frequency
D = Pitch circle diameter
d = Diameter of roller elements
Z = Number of rolling elements
α = Contact angle
The bearing equations assume that there is no sliding and that the rolling elements roll over the raceway surfaces. In practice, however, this is rarely the case and, due to anumber of factors, the rolling elements undergo a combinationof rolling and sliding. In addition, the operating contact angle may be different to the nominal value. As a consequence, theactual characteristic defect frequencies may differ slightly fromthose predicted, but this is very dependent on the type ofbearing, operating conditions and fits. Generally, the bearingcharacteristic frequencies will not be integer multiples of theinner ring rotational frequency, which helps to distinguish themfrom other sources of vibration.
Since most vibration frequencies are proportional to speed, it is important that data is obtained at identical speeds whencomparing vibration signatures. Speed changes will causeshifts in the frequency spectrum, leading to inaccuracies inboth amplitude and frequency measurement. In variable speedequipment, spectral orders may sometimes be used where allthe frequencies are normalised relative to the fundamentalrotational speed. This is generally called “order normalisation”,in which the fundamental frequency of rotation is called thefirst order.
Page 9

Ball pass frequencies can be generated as a result of elasticproperties of the raceway materials due to variable complianceor as the rolling elements pass over a defect on the raceways.The frequency generated at the outer and inner ring racewaycan be estimated in approximate terms as 40% (0.4) and 60%(0.6) respectively of the inner ring speed multiplied by thenumber of rolling elements.
Unfortunately, bearing vibration signals are rarelystraightforward and are further complicated by the interactionof the various component parts, but this can be often used inorder to detect a deterioration of or damage to the rollingsurfaces.
Analysis of bearing vibration signals is usually complex and thefrequencies generated will add and subtract and are almostalways present in bearing vibration spectra. This is particularlytrue where multiple defects are present. Depending upon thedynamic range of the equipment, however, background noiselevels and other sources of vibration bearing frequencies canbe difficult to detect in the early stages of a defect.
Over the years, however, a number of diagnostic algorithmshave been developed to detect bearing faults by measuringthe vibration signatures on the bearing housing. Thesemethods usually take advantage of both the characteristicfrequencies and the “ringing frequencies” (i.e. naturalfrequencies) of the bearing.
By measuring the frequencies generated by a bearing, it isoften possible to identify not only the existence of a problembut also its cause. While it may be only be necessary toidentify that a bearing is starting to deteriorate and plan whenit should be changed, a more detailed analysis of the vibrationcan often give some vital clues as to what caused the problemin the first place. This can be further enhanced by inspectingthe bearing after removal from the equipment, especially if thefault has been identified at an early stage.
6.2 Bearing Defects
Rolling contact bearings represent a complex vibration systemwhose components e.g. rolling elements, inner raceway, outerraceway and cage interact to generate complex vibrationsignatures(3). Although rolling bearings are manufacturedusing high precision machine tools and under strict cleanlinessand quality controls, they have degrees of imperfection like anyother manufactured part and generate vibration as thesurfaces interact through a combination of rolling and sliding.Although the amplitudes of surface imperfections are now ofthe order of nanometres, vibrations can still be produced in theentire audible frequency range (20Hz-20kHz).
Whereas surface roughness and waviness result directly fromthe bearing component manufacturing processes, discretedefects refer to damage of the rolling surfaces due toassembly, contamination, operation, mounting, poormaintenance etc.
These defects can be extremely small and difficult to detect,yet they can have a significant impact on vibration criticalequipment or can result in reduced bearing life. This type ofdefect can take a variety of forms: indentations, scratchesalong and across the rolling surfaces, pits, debris and particlesin the lubricant. During the early development of the fault, thevibration tends to be impulsive but changes as the defectprogresses and becomes larger.
The type of vibration signal generated depends on manyfactors including the loads, internal clearance, lubrication,installation and type of bearing. Since defects on the innerring raceway must travel across a number of interfaces, suchas the lubricant film between the inner ring raceway and therolling elements, between the rolling elements and the outerring raceway and between the outer ring and the housing, theytend to be more attenuated than outer ring defects and cantherefore sometimes be more difficult to detect.
When a defect starts, a single spectral line can be generatedat the ball pass frequency and, as the defect becomes larger, it allows movement of the rotating shaft and the ball passfrequency becomes modulated at shaft rotational speed. This modulation generates a sideband at shaft speed. As thedefect increases in size, more sidebands may be generated,until at some point the ball pass frequency may no longer begenerated, but a series of spectral lines spaced at shaftrotational speed occurs.
A defective rolling element may generate vibration at twice the rotational speed as the defect strikes the inner and outerraceways. The vibration produced by a defective ball may notbe very high, or may not be generated at all, as it is not alwaysin the load zone when the defect strikes the raceway. As the defect contacts the cage, it can often modulate otherfrequencies i.e. ball defect frequency, ball pass frequency orshaft rotational frequency and show up as a sideband. The cage rotational frequency can be generated in a badlyworn or damaged cage. In a ball bearing, the rolling elementsmay never generate ball rotational frequency or twice the ballrotational frequency due to the combination of rolling andsliding and the constant changing of the ball rotational axis. In cylindrical roller bearings, the damage often occurs all theway around the majority of the rolling element surface, so therolling element rotational frequency may never be generated.
6.3 Variable Compliance
This occurs under radial or misaligned loads, is an inherentfeature of rolling bearings and is completely independent ofquality. Radial or misaligned loads are supported by a fewrolling elements confined to a narrow region and the radialposition of the inner ring with respect to the outer ringdepends on the elastic deflections at the rollingelement/raceway contacts, Figure 5. The outer ring of thebearing is usually supported by a flexible housing whichgenerally has asymmetric stiffness properties described by thelinear springs of varying stiffness.
Page 10

Figure 5. Simple model of a bearing under radial load
As the bearing rotates, the individual ball loads and hence theelastic deflections change to produce a relative movementbetween the inner and outer rings. The movement takes theform of a locus which is two dimensional and contained in aradial plane under radial load, while it is three dimensionalunder misalignment. The movement is also periodic, with abase frequency equal to the rate at which the rolling elementspass through the load zone. Frequency analysis of themovement yields the base frequency and a series ofharmonics. So even a geometrically perfect bearing willproduce vibration because of the relative periodic movementbetween the inner and outer rings due to raceway elasticdeflections.
Variable compliance vibration is heavily dependent on thenumber of rolling elements supporting the externally appliedloads; the greater the number of loaded rolling elements, theless the vibration. For radially loaded or misaligned bearings,“running clearance” determines the extent of the load region,hence variable compliance generally increases with radialinternal clearance. A distinction is made between “runningclearance” and radial internal clearance (RIC). When fitted to amachine, the former is normally smaller than the RIC due todifferential thermal expansion and interference fit of the rings.In high speed applications, the effect of centrifugal forceshould also be considered.
Variable compliance vibration levels can exceed thoseproduced by roughness and waviness of the rolling surfaces.In applications where vibration is critical, however, it can bereduced to a negligible level by using ball bearings with thecorrect level of axial preload.
6.4 Bearing Speed Ratio
The bearing speed ratio (ball pass frequency divided by theshaft rotational frequency) is a function of the bearing loadsand clearances and can therefore give some indication of thebearing operating performance.
When abnormal or unsatisfactory lubrication conditions areencountered, or when skidding occurs, the bearing speed ratiowill deviate from the normal or predicted values. If the bearingspeed ratio is below predicted values, this may indicateinsufficient loading, excessive lubrication or insufficient bearingradial internal clearance, which could result in higher operatingtemperatures and premature failure. Conversely, a higher thanpredicted bearing speed ratio may indicate excessive loading,excessive bearing radial internal clearance or insufficientlubrication.
For an experienced analyst, vibration can be used not only todetect deterioration in bearing condition but also to make aninitial assessment of whether the equipment is operatingsatisfactorily at initial start-up.
In electrical machines, two deep groove radial ball bearings arecommonly used to support the shaft; one is a locating bearingwhile the other is a non-locating bearing that can be displacedin the housing to compensate for axial thermal expansion ofthe shaft. It is not unusual for bearings to fail catastrophicallydue to thermal preloading or cross-location where there isinsufficient clearance between the bearing outer ring andhousing resulting in the non-locating or “floating” bearingfailing to move in the housing i.e. the bearings become axiallyloaded.
The effect of this axial load is to increase the operatingcontact angle, which in turn increases the BPFO. For a ballbearing, the contact angle can be estimated as follows:
α = Cos-1 [1 – RIC / [(2 (ro+ri-D)] ]
α = Contact angle
RIC = Radial internal clearance
ro = Raceway groove radius of outer ring
ri = Raceway groove radius of inner ring
D = Ball diameter
Since a deep groove ball bearing is designed to have a radialinternal clearance in the unloaded condition, it can alsoexperience axial play. Under an axial load, this results in theball/raceway contact having an angle other than zero. As thebearing radial internal clearance and thus the axial playincreases, so does the contact angle. For a correctlyassembled motor under pure radial load, the contact angle willbe zero and the BPFO will be given by:
fb/o = Zfr/2 [1 – d/D ]
Page 11
On the other hand, if cross-location occurs (the outer ringcannot move axially in the housing) the bearing radial internalclearance will be lost by the relative axial movement betweenthe inner and outer rings, the bearings become axially loadedand the BPFO will increase due to the increase in contactangle. The amplitude of BPFO is likely to be small until thebearing becomes distressed and it may not always be possibleto detect the BPFO, particularly if using a linear amplitudescale. A log or dB amplitude scale may be better, but careshould also be exercised here because there may be otherfrequencies that may be close to the BPFO.
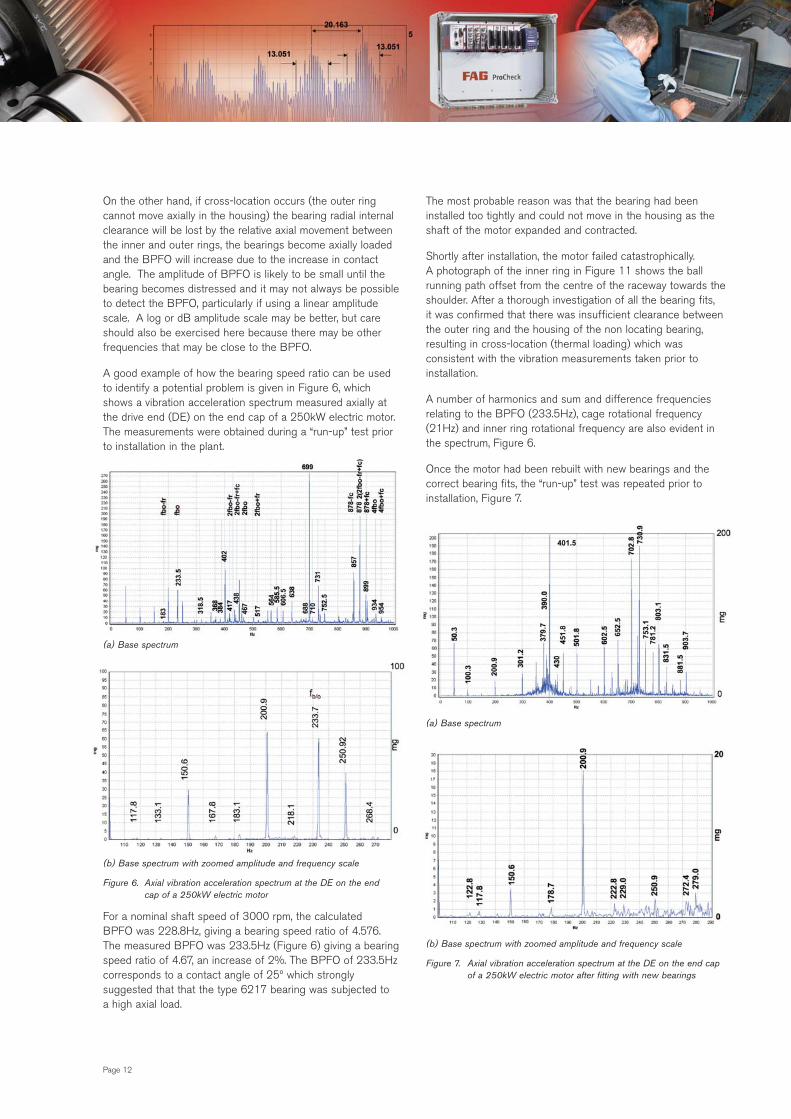
A good example of how the bearing speed ratio can be usedto identify a potential problem is given in Figure 6, whichshows a vibration acceleration spectrum measured axially atthe drive end (DE) on the end cap of a 250kW electric motor.The measurements were obtained during a “run-up” test priorto installation in the plant.
(a) Base spectrum
(b) Base spectrum with zoomed amplitude and frequency scale
Figure 6. Axial vibration acceleration spectrum at the DE on the end cap of a 250kW electric motor
For a nominal shaft speed of 3000 rpm, the calculated BPFO was 228.8Hz, giving a bearing speed ratio of 4.576.The measured BPFO was 233.5Hz (Figure 6) giving a bearingspeed ratio of 4.67, an increase of 2%. The BPFO of 233.5Hzcorresponds to a contact angle of 25º which stronglysuggested that that the type 6217 bearing was subjected to a high axial load.
The most probable reason was that the bearing had beeninstalled too tightly and could not move in the housing as theshaft of the motor expanded and contracted.
Shortly after installation, the motor failed catastrophically. A photograph of the inner ring in Figure 11 shows the ballrunning path offset from the centre of the raceway towards theshoulder. After a thorough investigation of all the bearing fits, it was confirmed that there was insufficient clearance betweenthe outer ring and the housing of the non locating bearing,resulting in cross-location (thermal loading) which wasconsistent with the vibration measurements taken prior toinstallation.
A number of harmonics and sum and difference frequenciesrelating to the BPFO (233.5Hz), cage rotational frequency(21Hz) and inner ring rotational frequency are also evident inthe spectrum, Figure 6.
Once the motor had been rebuilt with new bearings and thecorrect bearing fits, the “run-up” test was repeated prior toinstallation, Figure 7.
(a) Base spectrum
(b) Base spectrum with zoomed amplitude and frequency scale
Figure 7. Axial vibration acceleration spectrum at the DE on the end cap of a 250kW electric motor after fitting with new bearings
Page 12

The base spectrum shows no characteristic bearingfrequencies but, when both the amplitude and frequencyscales are expanded, a discrete peak at 229Hz becomesevident, Figure 6(b), which matches very closely with thepredicted BPFO, fb/o , of 228.8Hz. This motor went on tooperate successfully.
7. Examples of Vibration Monitoring
In this section, some examples are given of how vibration canbe used to detect and diagnose problems on rotatingequipment, ranging from electric motors to large crushingmachines used for mining and processing. Examples are alsotaken from the FAG WiPro Condition Monitoring System usedfor monitoring the condition of wind turbine drive trains.
7.1 Electric Motor
An example of a vibration spectra measured axially on the DE of a 250kW electric motor is shown in Figure 8.
Figure 8. Vibration acceleration spectra measured axially on the DE of a250kW electric motor
The nominal rotational speed was 3000 rpm and the rotor was supported by two type 6217 C4 deep groove ballbearings (85mm bore) with grease lubrication. The vibrationspectra are dominated by vibration at both harmonics and subharmonics of the rotor speed (49.7Hz). The spectrum 0-1kHzshows a number of harmonics and sub harmonics of the rotorspeed with no bearing characteristic frequencies being evident.
In the 0-5kHz spectrum there is a dominant discrete peak at1141.8Hz which neither corresponds with a harmonic of therotor speed i.e. 1141.8/49.98 = 22.84 nor with any of thebearing generated frequencies. On either side of 1141.8Hzpeak are sidebands spaced at the rotor speed (49.98Hz) i.e. the1141.8Hz frequency is amplitude modulated at the rotor speed.
This is shown more clearly in Figure 9(a), which shows that inthe range 0-650ms the signal is amplitude modulated at20.2ms which, within the measurement accuracy, correspondsto 49.98Hz, i.e. the rotor speed. Expanding the time scale from500-600ms, Figure 9(b), shows that the time between peaksis 0.87ms i.e. 13.051ms divided by 15 cycles whichcorresponds to a carrier frequency of approximately 1149Hz.Within the measurement accuracy of 0.0796ms, thiscorresponds to the frequency of 1141.8Hz (0.876ms) shown in Figure 8.
Dividing 1141.8Hz by the rotational speed of 49.98Hz gives22.85, which is not close enough for the frequency to be aharmonic of the rotational speed. One of the extensionalvibration modes of the outer ring was estimated to be 1158Hz,which is very close to the measured value of 1141.8Hz. One possible explanation is that the discrete peak at 1141.8Hzis an excited natural frequency of the outer ring.
(a) Vibration acceleration 0-650ms
(b) Vibration acceleration 500-600ms
Figure 9. Time signals of vibration acceleration measured axially on the DE of a 250kW electric motor.
Page 13
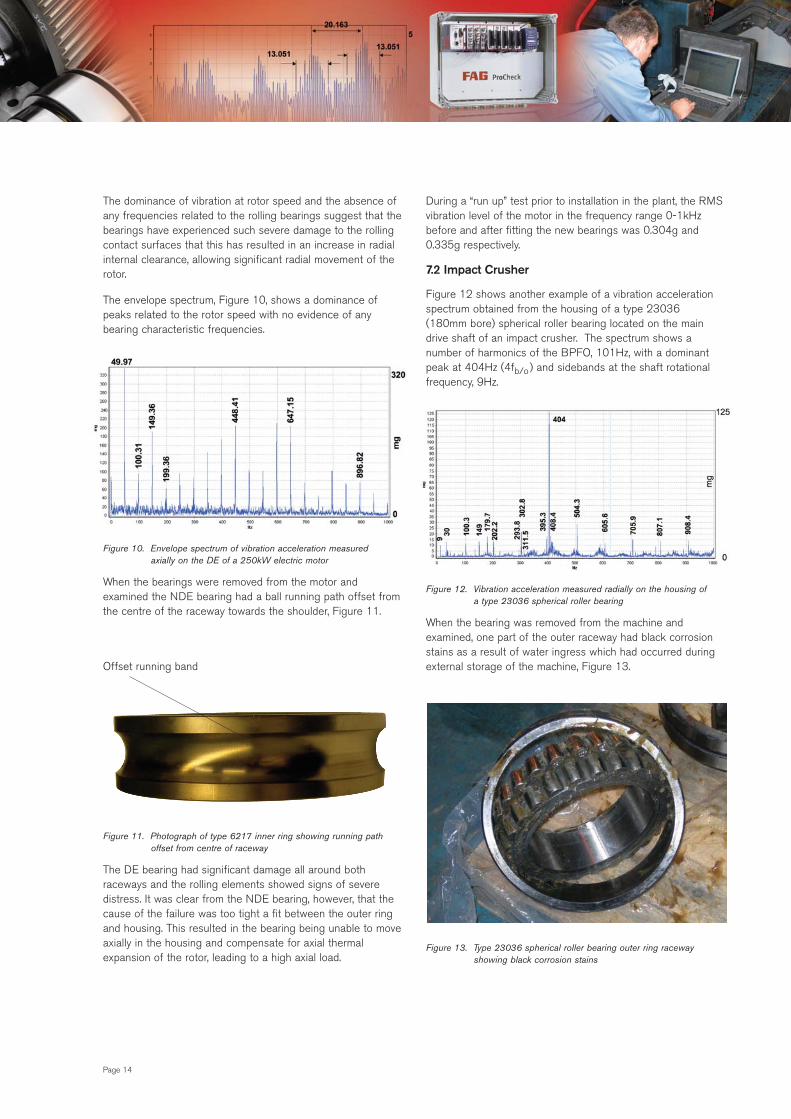
The dominance of vibration at rotor speed and the absence ofany frequencies related to the rolling bearings suggest that thebearings have experienced such severe damage to the rollingcontact surfaces that this has resulted in an increase in radialinternal clearance, allowing significant radial movement of therotor.
The envelope spectrum, Figure 10, shows a dominance ofpeaks related to the rotor speed with no evidence of anybearing characteristic frequencies.
Figure 10. Envelope spectrum of vibration acceleration measured axially on the DE of a 250kW electric motor
When the bearings were removed from the motor andexamined the NDE bearing had a ball running path offset fromthe centre of the raceway towards the shoulder, Figure 11.
Figure 11. Photograph of type 6217 inner ring showing running path offset from centre of raceway
The DE bearing had significant damage all around bothraceways and the rolling elements showed signs of severedistress. It was clear from the NDE bearing, however, that thecause of the failure was too tight a fit between the outer ringand housing. This resulted in the bearing being unable to moveaxially in the housing and compensate for axial thermalexpansion of the rotor, leading to a high axial load.
During a “run up” test prior to installation in the plant, the RMSvibration level of the motor in the frequency range 0-1kHzbefore and after fitting the new bearings was 0.304g and0.335g respectively.
7.2 Impact Crusher
Figure 12 shows another example of a vibration accelerationspectrum obtained from the housing of a type 23036 (180mm bore) spherical roller bearing located on the maindrive shaft of an impact crusher. The spectrum shows anumber of harmonics of the BPFO, 101Hz, with a dominantpeak at 404Hz (4fb/o) and sidebands at the shaft rotationalfrequency, 9Hz.
Figure 12. Vibration acceleration measured radially on the housing of a type 23036 spherical roller bearing
When the bearing was removed from the machine andexamined, one part of the outer raceway had black corrosionstains as a result of water ingress which had occurred duringexternal storage of the machine, Figure 13.
Figure 13. Type 23036 spherical roller bearing outer ring raceway showing black corrosion stains
Page 14
Offset running band

A number of the rollers also had black corrosion stains whichwas consistent with the vibration at the cage rotationalfrequency, fc=4Hz, in the envelope spectrum, Figure 14.
Figure 14. Envelope spectrum of the type 23036 spherical roller bearing (suspect machine)
The modulation of the time signal at the cage rotationalfrequency can be clearly seen in the time signal, Figure 15.
Figure 15. Acceleration time signal of the type 23036 spherical roller bearing (suspect machine)
Figure 16. shows vibration measurements obtained from anidentical machine considered to be operating satisfactorily.Both the base and envelope spectrum show no indication ofany vibration related to the type 23036 spherical roller bearing.
(a) Base spectrum
(b) Envelope spectrum
Figure 16. Vibration acceleration measured radially on the housing of a type 23036 spherical roller bearing (good machine)
7.3 Generator
During the initial running-in phase of a 2MW generator on a test bed, an intermittent rattling noise was evident. The generator was fitted with a type 6232 deep groove ballbearing at the DE and a cylindrical roller bearing at the non-drive end (NDE). Both bearings were grease lubricated.The initial suspicion was that the rattling noise was related tothe cage because it was intermittent and became worse as the bearings reached operating temperature.
Vibration measurements obtained from the DE of thegenerator are shown in Figure 17.
Figure 17. Radial vibration acceleration measured at the DE end cap
The acceleration time signal shows what appears to be randombursts of high frequency vibration but, on closer inspection, thiswas in fact modulation at the cage rotational frequency. The time period between the pulses corresponds to therevolution of the cage, 84ms (fc/o=11.9Hz). Also present are pulses spaced at 9.3ms which correspond to the BPFO(fb/o =107.9Hz) of the type 6232 deep groove ball bearing.Dividing the time period for one revolution of the cage, 84ms,by 9.3ms gives the number of rolling elements i.e. 84/9.3=9.
Page 15

Although vibration at cage speed is evident in the time signal,there are no peaks evident in the spectrum at cage speed,Figure 18(a). This is because the energy produced by thecage is very small and evidence of any vibration related to thecage is contained within the overall carpet levels of thespectrum. By reducing the amplitude scale, Figure 18(b), someevidence of cage vibration starts to appear with discrete peaksbecoming just noticeable at 11.9, 24, 36Hz i.e. the first threeharmonics of the cage speed. The 6th (72Hz) and 7th (84Hz)harmonics of the cage speed are also evident.
(a) Base spectrum
(b) Base spectrum with zoomed amplitude
Figure 18. Vibration acceleration measured radially at the DE of a 2MW generator
While the base spectrum shows evidence of cage vibration, oncloser examination vibration at the cage speed is readily seenin the envelope spectrum at 10.9Hz along with the BPFO,which was not evident in the base spectrum, Figure 19. The envelope spectrum was obtained by using a highersampling frequency giving a frequency resolution of 1.56Hzand the cage frequency of 10,9Hz is within the measurementaccuracy.
Figure 19. Envelope spectrum obtained from the DE end cap of a 2MW generator with rattling noise present
Vibration measurements were also obtained when the rattlingnoise was absent and vibration at both the cage rotationalfrequency and BPFO were not evident in the envelopespectrum, Figure 20.
Figure 20. Envelope spectrum obtained from the DE end cap of a 2MW generator when the rattling noise was absent
The presence of vibration at the cage speed and BPFO does not necessarily mean the bearing is in distress. Even a geometrically perfect bearing will generate vibration (3).
Cage noise, which can be loosely described as rattling, is notuncommon in ball bearings fitted with pressed steel cages. This isparticularly true under minimal lubrication conditions, where thelubricant cannot provide sufficient damping as the cage interactswith the rolling elements and, in the case of ring guided cages, withthe cage guiding surface as the rolling elements speed up and slowdown when entering and leaving the load zone. The cage motion isoften erratic; the cage may rise and fall in slow running bearingswhile it may run eccentrically in high speed bearings due to theeffects of centrifugal force. The first bending mode of the cage mayalso be excited giving rise to a squeal or squeak which may be inthe low kilohertz range for a 25mm bore bearing.
Cage noise is not uncommon especially in grease lubricatedbearings and is often symptomatic of the running-in process asthe grease is worked or “milled” and disperses itself withinthe bearing.
Page 16

Similarly, the presence of vibration at the BPFO does notnecessarily indicate a problem and may be a result of variablecompliance (section 6.3).
7.4 Vertical Impact Crusher
A vibration assessment was made on a vertical impact crusherprior to undergoing field trials. The main aim was to verify thatthe new bearing arrangement, comprising a type NU2230Ecylindrical roller bearing and a type QJ326 duplex bearing atthe DE and a type NU2230E cylindrical roller bearing at theNDE, was operating satisfactorily. The shaft rotational speedwas 1750 rpm and it was driven by a pair of bevel gears with a ratio of 1:1 (36 teeth), giving a gear mesh frequency of1050Hz.
Vibration acceleration was measured radially on the rotor geardrive housing, Figure 21.
Figure 21. Radial vibration acceleration spectrum on the housing of a vertical impact crusher
Vibration at shaft rotational frequency (29.2Hz) is evident alongwith a number of harmonics. Vibration is also present at237Hz, which corresponds to the BPFO of the cylindrical rollerbearing, along with harmonics at 474Hz and 711Hz which arejust evident on the linear amplitude scale.
The predominant vibration is at the gear mesh frequency, fgm,of 1048Hz, along with a number of sidebands at the shaftrotational frequency, fs. The presence of sidebands at rotationalfrequency is not unusual, especially in the case of sidebands at fgm±fs.
As more sidebands appear at higher amplitude, however, this is normally an indication of gear eccentricity or backlash. It was therefore decided to remove the drive shaft, inspect thebearings and adjust the gear backlash.
All the bearings appeared in generally good condition, althoughit should be emphasised that because the bearings were notremoved from the housing it was not possible to inspect theouter ring raceways, especially those of the cylindrical rollerbearings where vibration at fb/o had been detected albeit at arelatively low amplitude.
Due to variable compliance effects, bearings will always exhibitvibration at their characteristic frequencies, so the detection ofa discrete peak is not necessarily an indication of a problem.Conversely, a bearing in an advanced failure condition will notnecessarily generate vibration at the characteristic frequencies.It is therefore important to interpret vibration data with a greatdeal of caution until experience has been built up.
After reassembly, the vibration measurements were repeatedand the results are shown in Figure 22.
Figure 22. Radial vibration acceleration spectrum on the housing of a vertical impact crusher after adjustment of gear backlash
Page 17

After resetting of the machine, the gear backlash was reducedand the running speed sidebands around the gear meshfrequency were significantly reduced in both number andamplitude, Figure 23.
(a) Before adjustment of gear backlash
(b) After adjustment of gear backlash
Figure 23. Comparison of sidebands around gear mesh frequency
Figure 24 shows the corresponding time signals, bothmodulated at the rotational frequency, 29Hz (34.4ms); the RMS of the raw signal and enveloped signal decreasedfrom 1.08g and 1.59g to 0.70g and 1.06g respectively afterresetting of the machine.
(a) Before resetting of gear backlash
(b) After resetting of gear backlash
Figure 24. Acceleration time signal on the housing before and after resetting of the gear backlash
7.5 Wind Turbines
Wind power is a rapidly growing form of renewable energy inmany parts of the world. As an established source ofrenewable electricity generation, they are set to play animportant role in future energy supply around the world. In the UK, there is increasing interest in placing wind turbinesoffshore, which offers a number of advantages includingimproved wind conditions and reduced planning restrictions.However, the environment in which offshore wind turbinesmust operate is more demanding and often extreme,demanding a higher degree of integrity and reliability if costsare to be minimised.
Due to the remote location and poor accessibility of windturbines, it is important that faults are detected early andconsequential damage reduced or avoided and repair costsminimised. This will lead to shorter downtimes and reducedloss of revenue. Detecting bearing damage early could meanthe difference between replacing the gearbox at a cost ofaround €250,000 and replacing the bearing at a cost of€5000.
Wind turbine gearboxes are subject to high dynamic loads and,due to changing wind conditions, the load spectrum variesgreatly and includes high peak loads and low load operatingconditions. The high static safety required for maximum loadmeans that bearings with high load carrying capacity arerequired. When there is little wind, however, loads are low andthis can lead to damage due to sliding of the rolling elementset. As a result, many field operating failures are aconsequence of gearbox bearing failure. Misalignment, poorlubrication and maintenance also contribute towards this trend.
Page 18

Figure 25 shows the spectrum from a gearbox output shaftwhere the BPFO, 183Hz, and the harmonics are clearlyevident. Sidebands at the rotational speed, 18.7Hz, are also present.
Figure 25. Frequency spectrum from gearbox output shaft
The gearbox was taken out of service for inspection and aphotograph of the damaged inner ring raceway of thecylindrical roller bearing located on the high speed shaft isshown in Figure 26.
Figure 26. Damage on the bearing inner ring raceway of a gearbox output shaft
An example of an envelope spectrum obtained from a windturbine gearbox is shown in Figure 27. Vibration at 227.1Hz,which corresponded to the BPFI of the type NU2326cylindrical roller bearing located on the gearbox output shaft, is clearly evident along with sidebands at the shaft rotationalspeed. Inspection of the bearing revealed an inner ring raceway defect.
Figure 27. Envelope spectrum obtained from the gearbox output shaft of a wind turbine
This data was obtained from the FAG WiPro online ConditionMonitoring system which was monitoring a VESTAS V90 turbine.
8. Summary
In some industries, maintenance is the second largest or eventhe largest element of operating costs and as such asbecomes a cost control priority. Equipment failure not onlyaffects plant availability but also safety, the environment andproduct quality. It can also impact on customer service interms of missed deadlines and loss of confidence.
The complexity and cost of modern day plant and equipmentmeans that plant condition monitoring is now becoming a muchmore cost-effective option. Although many industries have andstill do take a reactive approach to maintenance, since thereare no upfront costs, they pay the price in terms of increasedplant downtime or lost production.
Vibration monitoring is still probably the most widely usedpredictive maintenance technique and, with few exceptions,can be applied to a wide variety of rotating equipment.Vibration monitoring allows the condition of machinery to bedetermined as it operates and detects those elements whichstart to show signs of deterioration before they actually fail,sometimes catastrophically. With this type of approach,unplanned downtime is reduced or eliminated, therebyincreasing plant availability and efficiency and reducing costs.
Rolling bearings are a critical element in many rotatingmachines and generate characteristic vibration frequencieswhich can combine to give complex vibration spectra which attimes may be difficult to interpret other than by an experiencedvibration analyst. In the case of rolling bearings, however,characteristic vibration signatures are often generated in theform of modulation of the fundamental bearing frequencies.This can be used to advantage and vibration conditionmonitoring software is often designed to identify thesecharacteristic features and provide early warning of animpending problem. This usually takes the form of signaldemodulation and the envelope spectrum which indicates earlydeterioration of the rolling/sliding contact surfaces.
Page 19
Schaeffler (UK) Ltd
Forge Lane, Minworth, Sutton Coldfield,
West Midlands B76 1AP
E-mail: [email protected]
Web: www.schaeffler.co.uk
References
1. Bentley Nevada. Application Note, Asset Categorisation
2. Lacey S J. Vibration Monitoring of the Internal CentrelessGrinding process Part 2: experimental results, Proc Instn Mech Engrs Vol 24, 1990.
3. Lacey S J.An Overview of Bearing Vibration Analysis,Schaeffler (UK) Technical Publication.