REPORT DOCUMENTATION V OMB No. 0704-0188 - … · REPORT DOCUMENTATION VAGE ... FEASIBILITY OF...
82
REPORT DOCUMENTATION VAGE OMB No. 0704-0188 Public reporting burden for Dai collection of iirformotion it estimated to average 1 hour ptr response, including the lima for reviewing inttructiont, »»arching «lilting data teuren, gatharing and maintaining the data naadad, and completing and rwMwing tha collection of information. Sand comments regarding thit burden estimate or any other aspect of thil collection of information, including suggestions for reducing this burden, to Washington Headquarters Services, Directorate for Information Operations and Reports, 1215 Jefferson Davis Highway, Suite 1204, Arlington, VA 222024302, and to the Office of Management and Budget, Paperwork Reduction Project (07044186), Washington, DC 20503. 1. AGENCY USE ONLY (Leave blank) 2. REPORT DATE 21 May 98 I 3. REPORT TYPE AND DATES COVERED 4. TITLE AND SUBTITLE FEASIBILITY OF VIBRATION ANALYSIS AS A PREDICTIVE MAINTENANCE TOOL ON HEATING, VENTILATION, AND AIR CONDITIONING EQUIPMENT IN U. S. AIR FORCE MEDICAL FACILITIES 6. AUTHOR(S) Jon W. Yow S. FUNDING NUMBERS 7. PERFORMING ORGANIZATION NAME(S) AND ADDRESS(ES) University of Florida 8. PERFORMING ORGANIZATION REPORT NUMBER 98-017 9. SPONSORING/MONITORING AGENCY NAME(S) AND ADDRESS(ES) THE DEPARTMENT OF THE AIR FORCE AFIT/CIA, BLDG 125 2950 P STREET WPAFB OH 45433 10. SPONSORING/MONITORING AGENCY REPORT NUMBER 11. SUPPLEMENTARY NOTES 12a. DISTRIBUTION AVAILABILITY STATEMENT Unlimited distribution In Accordance With AFI35-205/AFIT Sup 1 12b. DISTRIBUTION CODE WlO ©tjAXiIiT It :.'-.. •-- '' < 19980527 033 14. SUBJECT TERMS 15. NUMBER OF PAGES 67 16. PRICE CODE 20. LIMITATION 6P ABSTRACT 17. SECURITY CLASSIFICATION OF REPORT 18. SECURITY CLASSIFICATION OF THIS PAGE 19. SECURITY CLASSIFICATION OF ABSTRACT Standard Form 298 (Rev. 2-89) (EG) Prescribed by ANSI Std. 238.18 Designed using Perform Pro, WHS1U0R, Oct 84
-
Upload
phungkhuong -
Category
Documents
-
view
232 -
download
1
Transcript of REPORT DOCUMENTATION V OMB No. 0704-0188 - … · REPORT DOCUMENTATION VAGE ... FEASIBILITY OF...
REPORT DOCUMENTATION VAGE OMB No. 0704-0188
Public reporting burden for Dai collection of iirformotion it estimated to average 1 hour ptr response, including the lima for reviewing inttructiont, »»arching «lilting data teuren, gatharing and maintaining the data naadad, and completing and rwMwing tha collection of information. Sand comments regarding thit burden estimate or any other aspect of thil collection of information, including suggestions for reducing this burden, to Washington Headquarters Services, Directorate for Information Operations and Reports, 1215 Jefferson Davis Highway, Suite 1204, Arlington, VA 222024302, and to the Office of Management and Budget, Paperwork Reduction Project (07044186), Washington, DC 20503.
1. AGENCY USE ONLY (Leave blank) 2. REPORT DATE
21 May 98
I 3. REPORT TYPE AND DATES COVERED
4. TITLE AND SUBTITLE
FEASIBILITY OF VIBRATION ANALYSIS AS A PREDICTIVE MAINTENANCE TOOL ON HEATING, VENTILATION, AND AIR CONDITIONING EQUIPMENT IN U. S. AIR FORCE MEDICAL FACILITIES 6. AUTHOR(S)
Jon W. Yow
S. FUNDING NUMBERS
7. PERFORMING ORGANIZATION NAME(S) AND ADDRESS(ES)
University of Florida
8. PERFORMING ORGANIZATION REPORT NUMBER
98-017
9. SPONSORING/MONITORING AGENCY NAME(S) AND ADDRESS(ES)
THE DEPARTMENT OF THE AIR FORCE AFIT/CIA, BLDG 125 2950 P STREET WPAFB OH 45433
10. SPONSORING/MONITORING AGENCY REPORT NUMBER
11. SUPPLEMENTARY NOTES
12a. DISTRIBUTION AVAILABILITY STATEMENT
Unlimited distribution In Accordance With AFI35-205/AFIT Sup 1
12b. DISTRIBUTION CODE
WlO ©tjAXiIiT It :.'-..■•-- ■ '' <■ 19980527 033
14. SUBJECT TERMS 15. NUMBER OF PAGES
67 16. PRICE CODE
20. LIMITATION 6P ABSTRACT 17. SECURITY CLASSIFICATION OF REPORT
18. SECURITY CLASSIFICATION OF THIS PAGE
19. SECURITY CLASSIFICATION OF ABSTRACT
Standard Form 298 (Rev. 2-89) (EG) Prescribed by ANSI Std. 238.18 Designed using Perform Pro, WHS1U0R, Oct 84
FEASIBILITY OF VIBRATION ANALYSIS AS A PREDICTIVE MAINTENANCE TOOL ON HEATING, VENTILATION, AND AIR CONDITIONING EQUIPMENT
IN U.S. AIR FORCE MEDICAL FACILITIES
By
JON W. YOW
A THESIS PRESENTED TO THE GRADUATE SCHOOL OF THE UNIVERSITY OF FLORIDA IN PARTIAL FULFILLMENT OF THE REQUIREMENTS FOR THE
DEGREE OF MASTER OF SCIENCE IN BUILDING CONSTRUCTION
UNIVERSITY OF FLORIDA
1998
I certify that I have read this study and that in my opinion it conforms to acceptable standards of scholarly presentation and is fully adequate, in scope and quality, for a thesis for the degree of Master of Science in Building Constructioa
Paul Oppenheim; Chair Paul Oppenher Associate Professor of Building Construction
I certify that I have read this study and that in my opinion it conforms to acceptable standards of scholarly presentation and is fully adequate, in scope and quality, for a thesis for the degree of Master of Science in Building Construction.
~Z^ UJ£A Felix Uhlik Associate Professor of Building Construction
I certify that I have read this study and that in my opinion it conforms to acceptable standards of scholarly presentation and is fully adequate, in scope and quality, for a thesis for the degree of Master of Science in Building Construction
Ralph^ Swain Professor/Industrial and Systems Engineering
This thesis was submitted to the Graduate Faculty of the College of Architecture and to the Graduate School and was accepted as partial fulfillment of the requirements for the degree of Master of Science in Building Construction-
May, 1998 Dean, Colleg'
Dean, Graduate School
ACKNOWLEDGMENTS
I wish to thank the my family for their never ending support through my academic
endeavors, and the U.S. Air Force for graciously sending me to a master's program. I
wish "to extend my deepest gratitude to the professors of the M.E. Rinker Sr. School for
their guidance, inspiration, and sharing of knowledge in and out of the classroom
Special thanks go to J.W. Willingham and Don Glaser of the Shands Facility
Operations office for the many hours spent helping to sort through the information and
discussing maintenance strategies. Without their assistance, this study would not have
been possible.
Finally, a large amount of credit must be given to Dr. Paul Oppenheim who
inspired me to seek out knowledge from unfamiliar territory. His constant prodding and
direction were instrumental in completing this report on time.
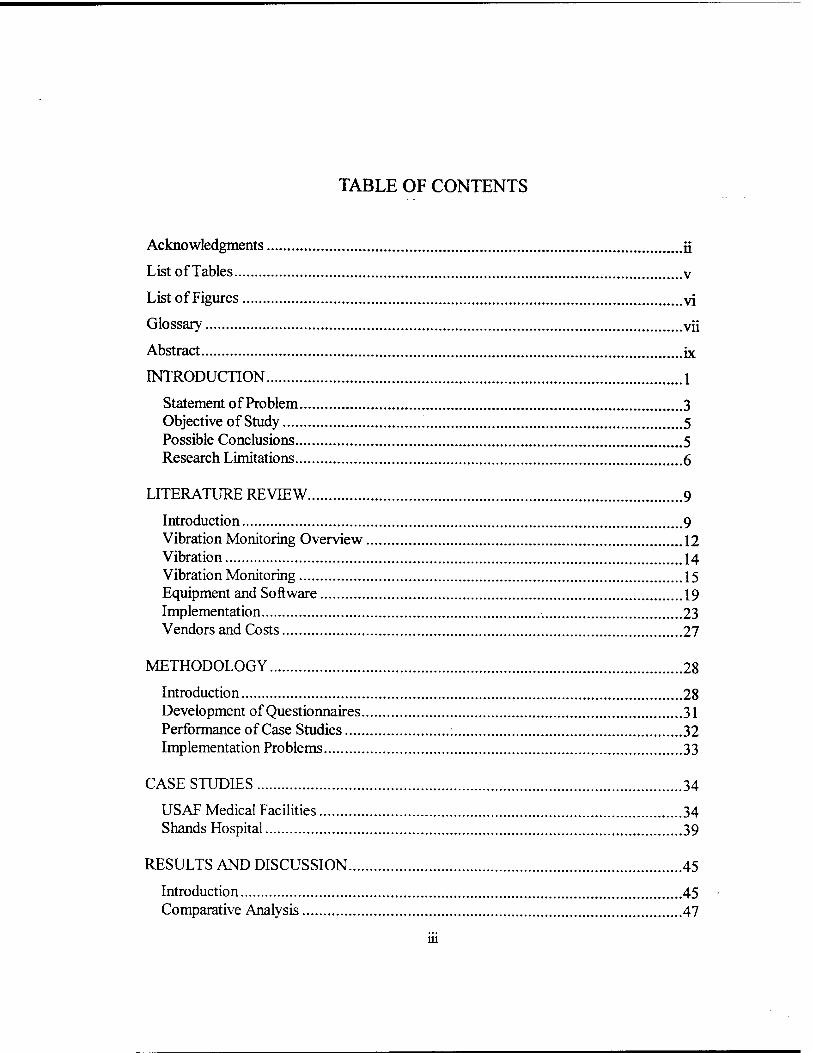
TABLE OF CONTENTS
Acknowledgments ü
List of Tables v
List of Figures vi
Glossary vii
Abstract ix
INTRODUCTION 1
Statement of Problem 3 Objective of Study 5 Possible Conclusions 5 Research Limitations 6
LITERATURE REVIEW 9
Introduction 9 Vibration Monitoring Overview 12 Vibration ...14 Vibration Monitoring 15 Equipment and Software 19 Implementation 23 Vendors and Costs 27
METHODOLOGY 28
Introduction 28 Development of Questionnaires 31 Performance of Case Studies 32 Implementation Problems 33
CASE STUDIES 34
USAF Medical Facilities 34 Shands Hospital 39
RESULTS AND DISCUSSION 45
Introduction 45 Comparative Analysis 47
iii
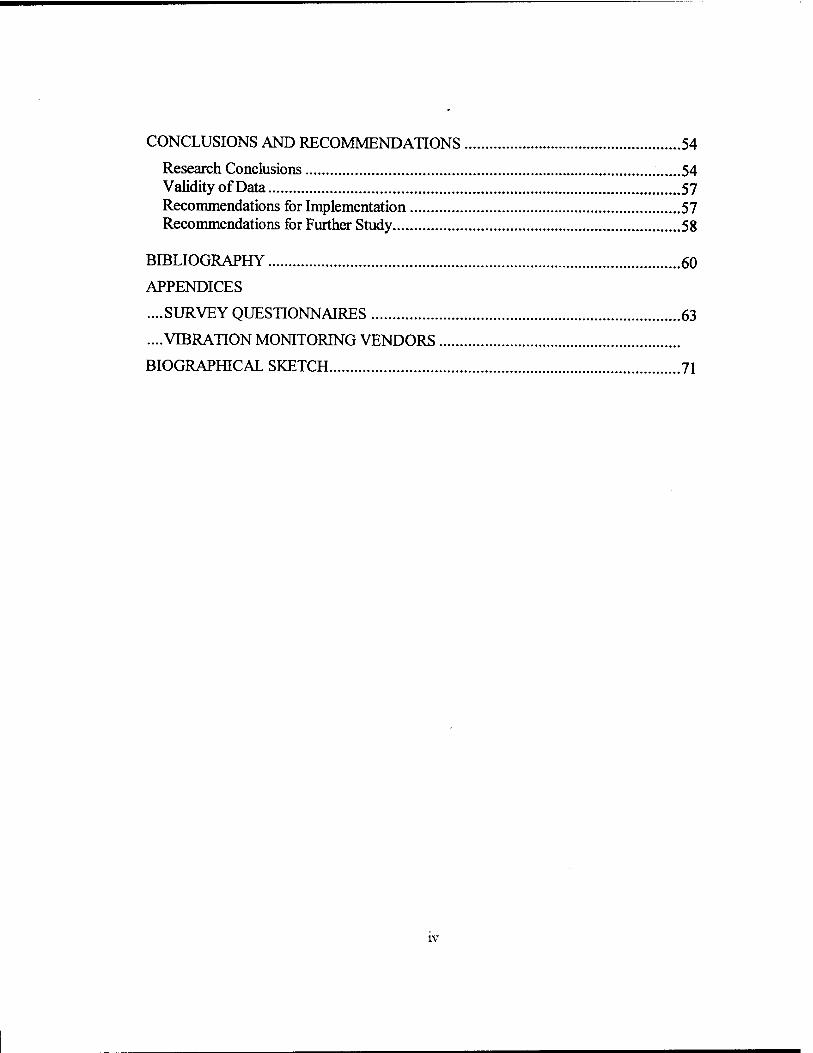
CONCLUSIONS AND RECOMMENDATIONS 54
Research Conclusions 54 Validity of Data 57 Recommendations for Implementation 57 Recommendations for Further Study 58
BIBLIOGRAPHY 60
APPENDICES
....SURVEY QUESTIONNAIRES 63
....VIBRATION MONITORING VENDORS
BIOGRAPHICAL SKETCH 71
IV
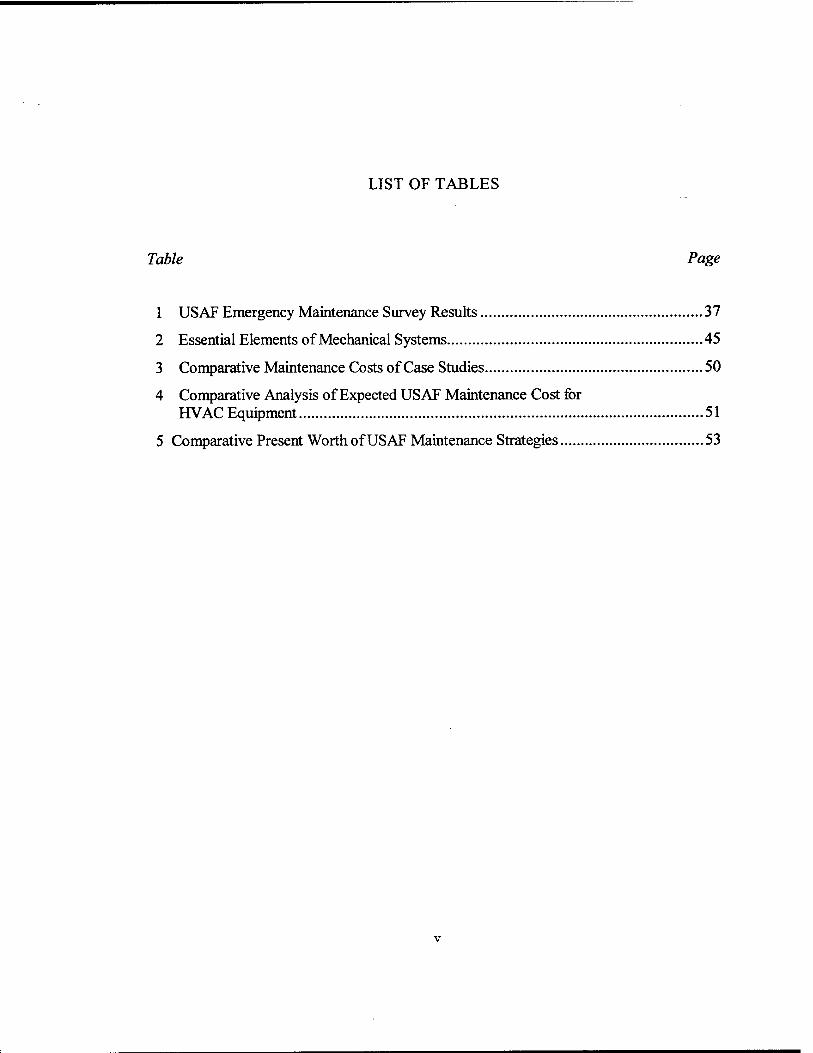
LIST OF TABLES
Table Page
1 USAF Emergency Maintenance Survey Results 37
2 Essential Elements of Mechanical Systems 45
3 Comparative Maintenance Costs of Case Studies 50
4 Comparative Analysis of Expected USAF Maintenance Cost for HVAC Equipment 51
5 Comparative Present Worth of USAF Maintenance Strategies 53
LIST OF FIGURES
Figure Page
1 Time Domain Chart 18
2 Frequency Domain 18
3 Portable Vibration Meter 20
4 Accelerometers (Wilcoxon Research) 22
5 Bathtub Curve 47
6 Shands' AHU Cost Trends 48
VI
GLOSSARY
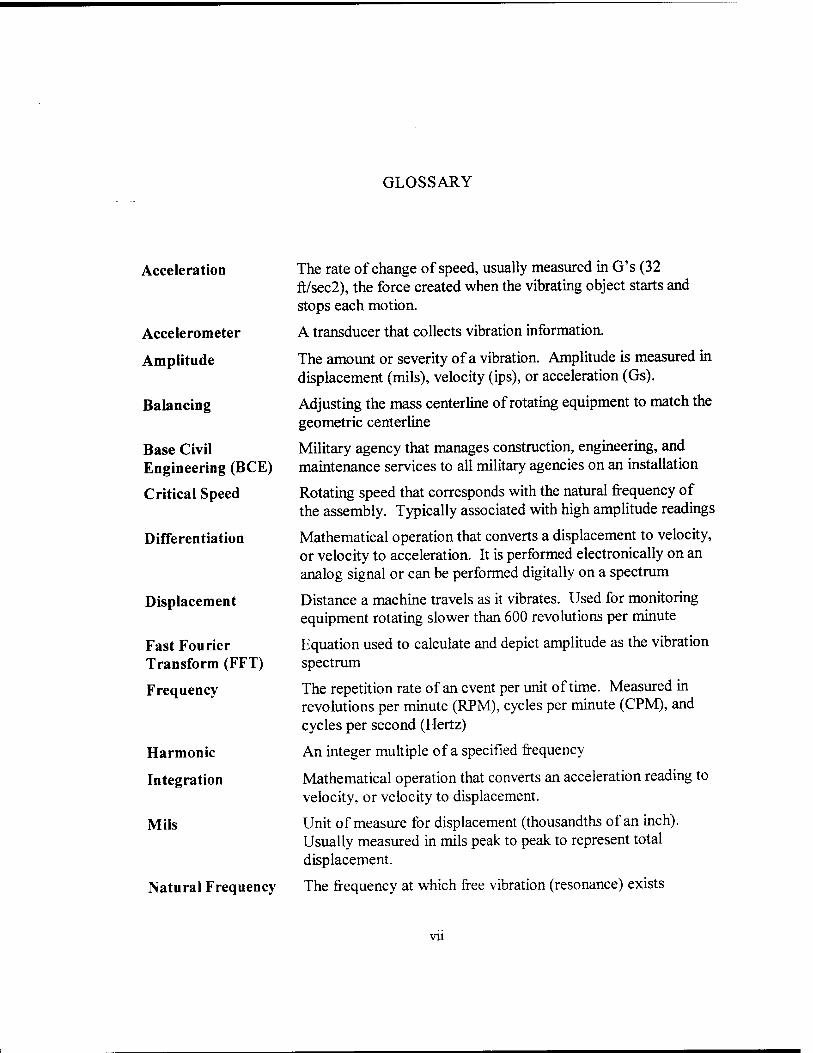
Acceleration
Accelerometer
Amplitude
Balancing
Base Civil Engineering (BCE)
Critical Speed
Differentiation
Displacement
Fast Fourier Transform (FFT)
Frequency
Harmonic
Integration
Mils
Natural Frequency
The rate of change of speed, usually measured in G's (32 ft/sec2), the force created when the vibrating object starts and stops each motion.
A transducer that collects vibration information.
The amount or severity of a vibration. Amplitude is measured in displacement (mils), velocity (ips), or acceleration (Gs).
Adjusting the mass centerline of rotating equipment to match the geometric centerline
Military agency that manages construction, engineering, and maintenance services to all military agencies on an installation
Rotating speed that corresponds with the natural frequency of the assembly. Typically associated with high amplitude readings
Mathematical operation that converts a displacement to velocity, or velocity to acceleration. It is performed electronically on an analog signal or can be performed digitally on a spectrum
Distance a machine travels as it vibrates. Used for monitoring equipment rotating slower than 600 revolutions per minute
Equation used to calculate and depict amplitude as the vibration spectrum
The repetition rate of an event per unit of time. Measured in revolutions per minute (RPM), cycles per minute (CPM), and cycles per second (Hertz)
An integer multiple of a specified frequency
Mathematical operation that converts an acceleration reading to velocity, or velocity to displacement.
Unit of measure for displacement (thousandths of an inch). Usually measured in mils peak to peak to represent total displacement.
The frequency at which free vibration (resonance) exists
vu
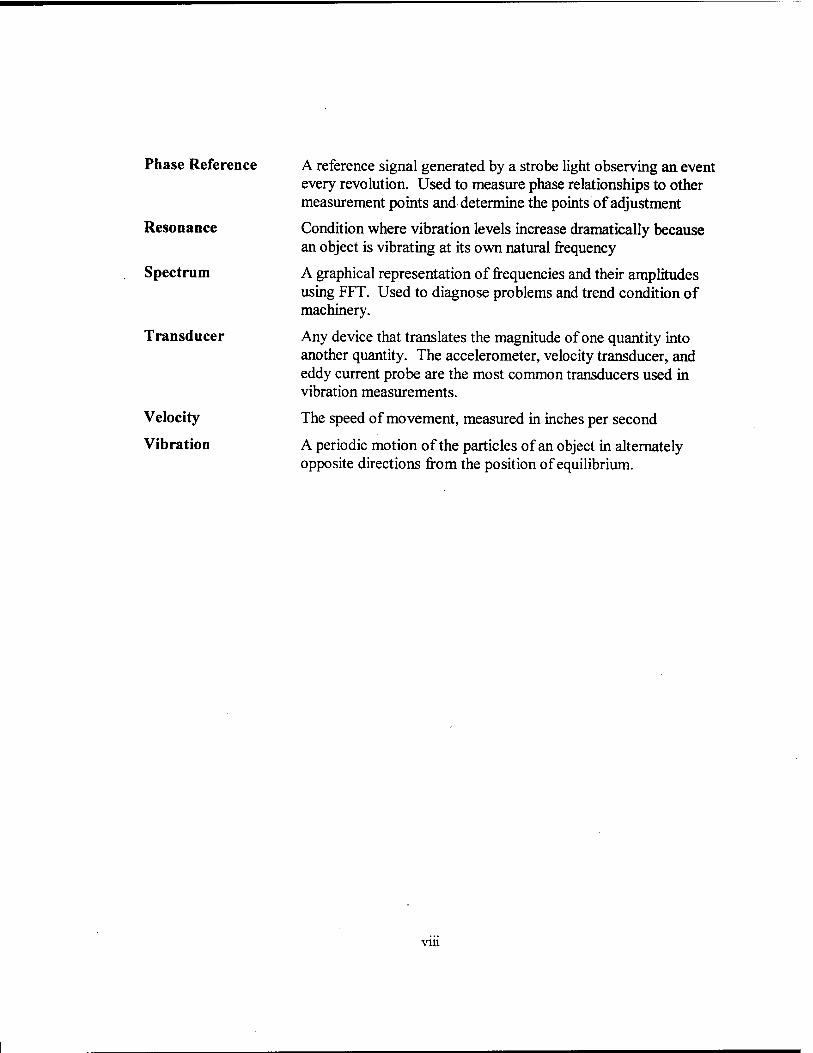
Phase Reference
Resonance
Spectrum
Transducer
Velocity
Vibration
A reference signal generated by a strobe light observing an event every revolution. Used to measure phase relationships to other measurement points and determine the points of adjustment
Condition where vibration levels increase dramatically because an object is vibrating at its own natural frequency
A graphical representation of frequencies and their amplitudes using FFT. Used to diagnose problems and trend condition of machinery.
Any device that translates the magnitude of one quantity into another quantity. The accelerometer, velocity transducer, and eddy current probe are the most common transducers used in vibration measurements.
The speed of movement, measured in inches per second
A periodic motion of the particles of an object in alternately opposite directions from the position of equilibrium.
Vlll
Abstract of Thesis Presented to the Graduate School Of the University of Florida in Partial Fulfillment of the requirements for the Degree of Master of Science in Building Construction
FEASIBILITY OF VIBRATION ANALYSIS AS A PREDICTIVE MAINTENANCE TOOL ON HEATING. VENTILATION, AND AIR CONDITIONING EQUIPMENT IN
U.S. AIR FORCE MEDICAL FACILITIES
By
Jon W. Yow
May 1998
Chair: Paul Oppenheim Major Department: ME. Rinker Sr., School of Building Construction
Health care costs have dramatically risen over the last 10 years and there are
persistent requests by administrators and government officials to keep these costs under
control. As the overall health care costs have risen, there has been increasing demand to
keep facilities costs low. The United States Air Force (USAF) Medical Service is
suffering from reductions of funds and maintenance personnel for their facilities. Some
military administrators have found it necessary to divert funds from maintenance to
support other programs. To ensure the reliability of our mechanical systems for climate
control and a quality indoor environment, the USAF medical service must make a
paradigm shift in its maintenance strategy. This report addresses the feasibility of using
vibration monitoring as a predictive maintenance tool to assess the condition of
equipment, develop new preventive maintenance plans, and reduce the number of
breakdowns that impact operation of facilities.
IX
CHAPTER 1
INTRODUCTION
The four basic approaches to equipment maintenance are reactive maintenance,
preventive maintenance, predictive maintenance, and pro-active maintenance. A well-
developed maintenance philosophy will address and encompass all these approaches in
establishing the optimum maintenance program.
Reactive maintenance is based on the philosophy of repair or replace after failure,
and is known as reactive or emergency maintenance. This is adequate for inexpensive
and non-critical equipment; however, using this method for critical or expensive
equipment has proven to be the most disruptive and least cost effective strategy.
Preventive maintenance (PM) is also known as time-interval maintenance,
scheduled maintenance, and time-based maintenance. It is based on calendar time or
equipment running hours. Intervals are based on the worst, or the average time to failure,
as reported by the manufacturer or on operator experience. If intervals are based on the
anticipated worst case, the maintenance performed will be redundant and resuh in
unnecessary repairs or replacements. However, if maintenance is based on the average
deterioration rate, some reactive maintenance and breakdowns must be accepted. In
either case, the preventive maintenance program has some inherent inefficiency.
Predictive maintenance programs are based on periodic or constant monitoring the
condition of the equipment. It is also known as condition-based and performance-based
2 determine the level of maintenance required and discover problems before the possibility
of breakdown, thereby eliminating redundant maintenance, reactive maintenance, and
reducing breakdowns. Predictive maintenance techniques monitor deterioration,
processing conditions, and specific events that precede the development of equipment
faults or failures. Unlike physical inspection techniques normally used in PM, condition
monitoring provides information about the component or system without requiring
shutdown and dismantling which can sometimes introduce defects in efficiently operating
equipment. In the late 1970s, preventive maintenance based on mean time to failure data
was referred to as predictive maintenance and for this reason, there still exists some
confusion of the definition of predictive maintenance.
Pro-Active maintenance is based on taking predictive maintenance one step
further and is known as reliability or productive maintenance. Pro-Active maintenance is
a strategy where maximum equipment operating time and availability are achieved
through precision installations, precision repair requirements, training, and root cause
failure analysis. Root cause failure analysis, requires that you always determine the
answer to the question "Why did this equipment fail?" Once this question is answered,
long term solutions can be implemented. Precision installation, precision repair, and
training are maintenance practices designed to prevent failures before they occur. The
first step in moving toward a pro-active maintenance program is to effectively implement
both preventive and predictive maintenance techniques.
3
Statement of Problem
The United States Air Force (USAF) Medical Service is suffering from reductions
of funds and maintenance personnel for their facilities. Health care costs have
dramatically risen over the last 10 years and there is constant pressure by administrators
and government officials to keep health care costs under control. Health care facilities
are not immune from cost control methods, meaning many facilities have found then-
budgets cut, and some military administrators have even found it necessary to divert
dollars from facility programs to provide certain medical services. No one questions that
the medical services are more important than the facility or that they may have a higher
return on investment; however something must be done to ensure these facilities remain
in operational condition.
Efficient use of maintenance dollars is demanded in these facilities more than
ever. For this reason, there have been many efforts over the last ten years to standardize
and revamp the existing preventive maintenance programs throughout all the facilities.
These efforts have proven successful and the improvements have resulted in the increased
levels and quality of the preventive maintenance performed. However, these efforts are
directed at the symptoms of the problems, and not at the root cause.
Failures that cause a high impact on the operation of the facility and the ability to
provide services are referred to as catastrophic failures. There have been several
catastrophic failures in the past, which have temporarily caused facilities to reduce or
even eliminate some services until corrective actions were accomplished. While reducing
4 maintenance costs is a major objective of all medical facilities, an even more critical
objective is the reduced impact to services caused from equipment failure.
The heating, ventilation, and air conditioning (HVAC) system in a healthcare
facility is one of its most important systems. Not only does the HVAC system provide a
comfortable environment, but in a health care facility, the HVAC system is essential to
introduce filtered fresh air at the high volumes necessary to meet sanitary requirements
and to control humidity. For this reason, the HVAC system is intensively designed with
maximum redundancy. This redundancy, however, has led to the apathetic approach
taken with maintenance over the years, as a failure in a redundant system causes minimal
disruption. The additional costs of redundant equipment, though, including their
maintenance, operating costs, and life expectancy, substantially impact the overall cost of
providing healthcare. While redundant systems may appear a necessity, modern pro-
active maintenance systems can reduce much of the risk in operating a non-redundant
system thereby allowing considerable cost savings.
In the last three years there has been an increasing number of reports linking
disease and sickness to the quality of the air inside the building, but no study has proven
the direct relationship between the spread of infection in a healthcare facility and its air
quality. The quality of the air distribution system and standards for design of systems
have continued to increase in an attempt to contain the problem, causing even more
expensive redundant systems in an era of decreasing budgets. While the risk of the
spread of infection outweighs any cost savings achievable through lowering HVAC
5 Standards, eliminating redundancies through pro-active maintenance practices can
dramatically decrease overall HVAC costs.
Objective of Study
The objective of this study is to evaluate vibration analysis as a predictive
maintenance tool and determine if implementing it for HVAC systems in USAF Medical
Facilities would be cost effective. The evaluation will address reasons for
implementation, the issues of implementation costs, monitoring equipment, potential cost
savings, availability of contracting services, and technical expertise required. The study
will only consider rotating equipment such as fans and motors of the HVAC system
For predictive maintenance to be an effective tool there must be a potential for
cost savings. Industry has accepted that proper use of condition monitoring will extend
the useful life of machinery and provide information that can locate problems before they
threaten the operation of the machinery. The questions that still arise relate to verifiable
cost savings. An economic analysis of the cost required to implement various levels of
vibration analysis will determine the most effective level for the U.S. Medical Service.
Possible Conclusions
Possible Conclusion #1: Vibration analysis is not cost effective for U.S. Air
Force medical facilities.
Possible Conclusion #2: The potential return on investment in vibration analysis
fully justifies immediate implementation in all US Air Force Medical Facilities.
Possible Conclusion #3: Vibration analysis is effective, but the marginal
potential for return on investment determines that it should only be considered for newly
constructed facilities.
Possible Conclusion #4: Vibration analysis is only warranted for expensive and
critical equipment and used in conjunction with preventive maintenance practices.
Possible Conclusion #5: Vibration analysis should be included in the statement of
work for all contract maintenance.
Possible Conclusion #6: If Vibration analysis is successful, will it have an impact
on the design of future health care facilities.
Research Limitations
The main research limitation on this project was the inability to witness the
vibration analysis programs at a larger sampling of medical facilities. This required some
of the comparative analysis portion of this study to be based on case studies reported by
other individuals. The research was further limited to the lack of documentation showing
costs associated with the catastrophic breakdowns throughout both study groups. The
only medical facilities located that were using vibration analysis were all being
maintained by the same firm, Tampa Armature Works (TAW) Engineering. All facilities
are using a similar scope of work and the main differences in their programs are the
amount and efficiency of their preventive maintenance program.
The second critical limitation was defining a cost base to provide comparison.
Not all medical facilities use the same accounting methods to track their cost
expenditures on maintenance. This fact made it difficult to establish a benchmark for
7
comparison between facilities and to determine the exact direct cost savings for facilities.
To account for the different maintenance philosophies and the accounting measures, a
comparison was performed using the ratios of expenditures within different categories of
maintenance. This provides a more accurate comparison of the programs than looking at
the direct costs. The analysis of the data assumes that the information provided is
accurate and representative of the remainder of the facilities. These assumptions provide
a margin of error to the analysis. The conclusions consider this subjectivity and use the
calculations that are most critical to implementing a vibration monitoring program.
Case studies located throughout the literature search provided cost savings from
vibration monitoring programs that could not be considered totally objective. Many of
these case studies reported estimated costs for run to failure scenarios' of equipment
based on assumed failure rates. Since there is no guarantee that the equipment would fail
at this arbitrary time, this is not an acceptable comparison. Many case studies; however,
were dedicated to the cost savings from one particular piece of equipment. Of the units
in the case studies, many had failed in the past and the cost required for emergency
replacement along with equipment downtime was well documented. Avoidance of these
costs is a justifiable cost saving.
Many predictive maintenance programs are using two or three condition
monitoring techniques to offset their reduced levels of preventive maintenance. This
provides justifiable cost savings if there is no increase in breakdowns and the overall
costs of the program are reduced. However, the health care facilities studied were using
vibration analysis only on critical and high-speed equipment. Vibration analysis is being
8
used as an additional tool to discover problems with machinery at an early stage before a
breakdown occurred. The facilities are not reducing their preventive maintenance
requirements and vibration analysis is an additional part of their maintenance strategy.
Economic justification is difficult since medical facilities are using vibration
analysis mainly to identify emerging problems to avoid equipment failure. The majority
of the justification rests in the intangible costs associated with providing a healthy
environment for patients and staff. The cost associated with the avoidance of
maintenance are significant, but are not easily or objectively quantified.
CHAPTER 2
LITERATURE REVIEW
Introduction
Vibration Monitoring has been used in design and production of most types of
mechanical machinery for many years. Vibration Monitoring as a part of a maintenance
strategy has been on the rise the last ten years with the development of computer
technology. Vibration monitoring would not be effective without the microprocessor and
the ability to do the enormous amount of calculations required for analysis. This report
discusses the basics of vibration monitoring, its benefits, and methods for its
implementation. The analysis of vibration data, spectral analysis, and troubleshooting
techniques of vibration problems exceed the scope of this report and will not be discussed
beyond their impact on implementation and cost savings.
R. Keith Mobley in An Introduction to Predictive Maintenance describes the need
for predictive maintenance programs in facilities with the following.
Recent surveys of maintenance management effectiveness indicate that one third of all maintenance costs is wasted as the result of unnecessary or improperly carried out maintenance. This represents a loss of more than 60 billion dollars each year. . . . The dominant reason for this ineffective management is the lack of factual data that quantifies the actual need for repair or maintenance of plant machinery, equipment, and systems. Maintenance scheduling has been and, in many instances, is predicated on statistical trend data or on the actual failure of plant equipment. (Mobley, An Introduction to Predictive Maintenance. 1990, p. 1)
10 An initial search was done on the Internet and within the University of Florida
Library System to determine what information was available on Vibration Analysis.
There was little information available from the Library that was applicable to this study.
Almost all information through mechanical engineering and HVAC texts related to
vibration dealt with the attempt to control noise transmitted to the occupied areas of
facilities. Only the 1993 U.S. Corps of Engineers Technical report titled, "Vibration
Monitoring for Predictive Maintenance in Central Energy Plants" was germane. This
study recommended use of vibration analysis for all critical equipment and the majority
of the report detailed how to implement a vibration monitoring program and specific
analysis techniques.
In the spring of 1997, the Internet search provided 10 companies providing the
service and two training organizations. The amount of information available for research
was very limited. The majority of the initial investigation was done through books
purchased from the Vibration Institute and information provided by Tel-A-Train, both of
whom specialize in training on equipment condition monitoring. As time progressed, the
Internet became a primary source of information and an introduction to people involved
in the field of vibration analysis. Later Internet searches performed in December 1997
provided over 100 potential contacts and information sources.
An initial literature review was performed to obtain an understanding of the
maintenance process and the differences between the most common maintenance
strategies. At the same time, information was reviewed on the current problems of
medical facilities dealing with indoor air quality. Due to the problems associated with
11 indoor air quality in hospitals and the critical nature of HVAC equipment in medical
facilities, a decision was made to concentrate this study on the benefits of vibration
analysis in maintaining HVAC equipment.
Indoor air quality in health care facilities is quickly becoming a topic of
discussion and controversy. The Joint Commission for Accreditation of Hospitals
(JCAHO) strongly suggests health care facilities have an IAQ program to insure a healthy
environment. In implementing an IAQ compliant program, Wayne Hansen suggests in
the January 1998 issue of Health Facilities Management Journal that constant ventilation
is a key to the quality of indoor air by stating:
Ensure that all HVAC and exhaust systems are operating during all hours of occupancy. This step primarily refers to medical office buildings and other non-critical care patient areas that do not require 24-hour operation, where evening shutdown of the HVAC system may occur. For evening operation or janitorial activities, boilers and chillers may be set back or shut down, but ventilation must remain active, (p. 23)
An essential aspect in maintaining a healthy, healing environment is the control of
relative humidity. Relative humidity (RH) varies with temperature and the amount of
water vapor in the air. RH is important because it plays a role in individual comfort. If
RH levels exceed 70 percent, then bacteria, fungus, yeast, and mold growth can occur in
air ducts, heat exchangers, and on other exposed surfaces. These growths have been
found in the ductwork of facilities and are the reason for many agencies instituting duct
cleaning standards and requirements. If RH levels are low, 10 to 20 percent, burning
eyes and dryness in the nose and throat can result. According to ASHRAE 55-1981, RH
12 levels should be maintained, whenever possible, between 40 and 55 percent for comfort
purposes; however, 30 to 55 percent is tolerable for most individuals.
All of these issues can be interpreted to mean any reduced ventilation, whether
caused deliberately or accidentally, affects the quality of the indoor environment. In the
"Economic Consequences of Poor IAQ", Facilities Management Journal,
September/October 1997, Sten Olaf Hansen states that studies by the National Energy
Management Institute (NEMI) in 1994 reported workers' productivity changed by 1.5 to
6 percent when the IAQ level of a facility changed. The levels were described as a
healthy, generally healthy, unhealthy - source unknown, unhealthy - source known, and
suffering from sick building syndrome or experiencing building related illness. A healthy
facility that experiences a loss of HVAC service (unhealthy - source known) would be
affected by a 4.5% reduction in productivity. If the average employee cost is assumed to
be $100 per day, then the impact to labor cost can be estimated as $4.50 per day for each
employee. While this does not appear to be a dramatic cost, it does have a substantial
impact when multiplied by 300 employees and shows a cost of $1350 per day. If the
equipment is out of service for one week, then the lost productivity attributed to the
HVAC system can be estimated as $ 6,750.
Vibration Monitoring Overview
HVAC motors and fans constructed up until the early 1970s usually had very high
mass that provided substantial damping of vibration forces. Since the vibrations sources
were often small in magnitude, the vibration levels of these highly damped machines was
relatively low. However, with the development and use of strong lightweight materials in
13
HVAC equipment, the mass of machines has decreased and the level of vibration has
increased. With the increase in vibration has come the associated problems of noise and
vibration related problems. The demands made on HVAC equipment performance and
reliability are constantly increasing.
Sometimes it may be necessary to reduce the vibration of an existing machine
because of inadequate initial design, a change in function of the machine, or a revision of
acceptable noise levels. Techniques for the analysis of vibration in dynamic systems
used in the design process are also applicable to existing systems. Similar problems of
vibration or noise are detected by the same analytical methods regardless of whether the
machine is existing or being designed, but the corrective actions may be different.
Equipment maintenance and unexpected downtime resulting from equipment
failure can make up a significant part of the cost of running a facility. Unexpected
downtime of HVAC equipment in a medical facility can be even more costly. Cancelled
medical procedures and the lost of productivity and inconvenience can result in an even
higher cost than the cost to repair the machinery and damage the reputation of the
medical facility itself.
Vibration analysis uses electronic hardware and software to monitor vibration
trends and to distinguish between normal vibration signals and those indicating problems
in equipment operation. Vibration Analysis is a non-intrusive diagnostic tool used in a
variety of levels throughout the industry. It may be used to only locate problems with
machinery or it can be used to troubleshoot, fine tune, and predict operational problems
with machinery. Vibration analysis is rapidly becoming standard practice in most
14
industrial predictive maintenance programs and appears to be the most widely accepted
method overall.
Since vibration analysis is a tool that predicts component failure, those parts
identified as needing corrective action are scheduled for repair or replacement during
planned shutdowns, rather than during costly emergency outages that are a result of
equipment failure. Vibration analysis can also be used as a tuning device for all rotating
equipment and as a way to diagnose and reduce machine inefficiencies, thus reducing
operating cost and energy utilization. Properly aligned and balanced equipment performs
more efficiently and uses less energy.
Vibration
Vibration is a rapid, periodic, oscillation of an object. The vibration occurring in
most machines is undesirable because the dynamic stresses influence fatigue and failure
of the machine, cause energy losses, reduce its performance, and produce excessive noise
that can be transmitted to habitable spaces. HVAC motors and fans, like most rotating
equipment, suffer from the effects of vibration. Some vibration is unavoidable, but
excessive vibration must be minimized before it can lead to premature deterioration of
equipment components and eventually result in failure of the unit. Vibration analysis of
machines, therefore, is often a necessary prerequisite for controlling not only vibration,
but also energy usage and noise.
A review of the basic terms and definitions in vibration is given in the glossary.
15
Vibration Monitoring
Vibration level in equipment directly impacts its efficient performance and life
expectancy. It is essential to minimize vibration levels in order to realize effective life
cycle cost management of the equipment.
Computational Systems Inc., which sponsors the Preventive Maintenance
Program of the Year Award, stated that in 1990, approximately 35% of all U.S. industrial
companies had implemented a predictive maintenance strategy that used some form of
condition monitoring. Vibration monitoring was the predominate method used by 99%
of the companies followed by oil analysis and infrared thermography. Computational
Systems reported that well documented programs reported savings of over ten dollars per
dollar spent, yielding a ten to one savings to cost ratio.
Vibration can sometimes be subtle. A mechanic may visually inspect a piece of
running machinery and not detect any significant vibration, but by touching the same
piece of running equipment a definite periodic vibration can be felt. Even lesser
vibrations can be detected by holding a metal tool against the piece of running machinery
and listening closely for any sounds made as the tool bounces against the machine casing.
Additional resources assist the mechanic in locating less obvious sources of vibration,
which could adversely affect the life of the equipment.
If a newly installed piece of equipment obviously vibrates erratically, the
mechanic assumes that, without correction, the machine will probably fail in a relatively
short period. The mechanic will tune the equipment to run smoother and more efficiently
by making adjustments. Decreasing excessive vibrations provides less wear on the
16
individual parts of the equipment, increases the operating efficiency, reduces energy
consumption, and increases the chance for a longer life expectancy of the equipment.
Modern vibration monitoring equipment can improve maintenance personnel's
ability to recognize problems and prevent machinery breakdown. Just as the mechanic
used the metal tool to reveal vibrations invisible to the visual inspection, modern
technicians can use improved resources in data collection and analysis to estimate the
condition of the equipment.
The fundamental element of a vibration analyzer is the transducer or probe. The
probe contains the accelerometer, which converts vibration into an electronic signal,
which can be analyzed by the computer software. This transducer consists of a spring
mass system (with a damping factor of virtually zero) which, under the influence of
acceleration, generates a force that presses against a piezoelectric crystal. These crystals
(such as quartz or barium titanate) allow accurate measurement of vibration frequencies
up to 3000Hz.
To ensure higher accuracy in the measured vibration data, readings should not be
taken while a machine is operating at or near resonance. Resonance is a condition that
arises when a machine is being operated at or near its natural frequency. Any
measurement taken while a machine operates at or near resonance will contain large
errors in the vibration amplitude data.
There are two principal methods of displaying vibration signals, time domain and
frequency domain. Time domain (figure 1) is a two dimensional display in which
amplitude appear on the vertical axis and time on the horizontal. Both the oscilloscope
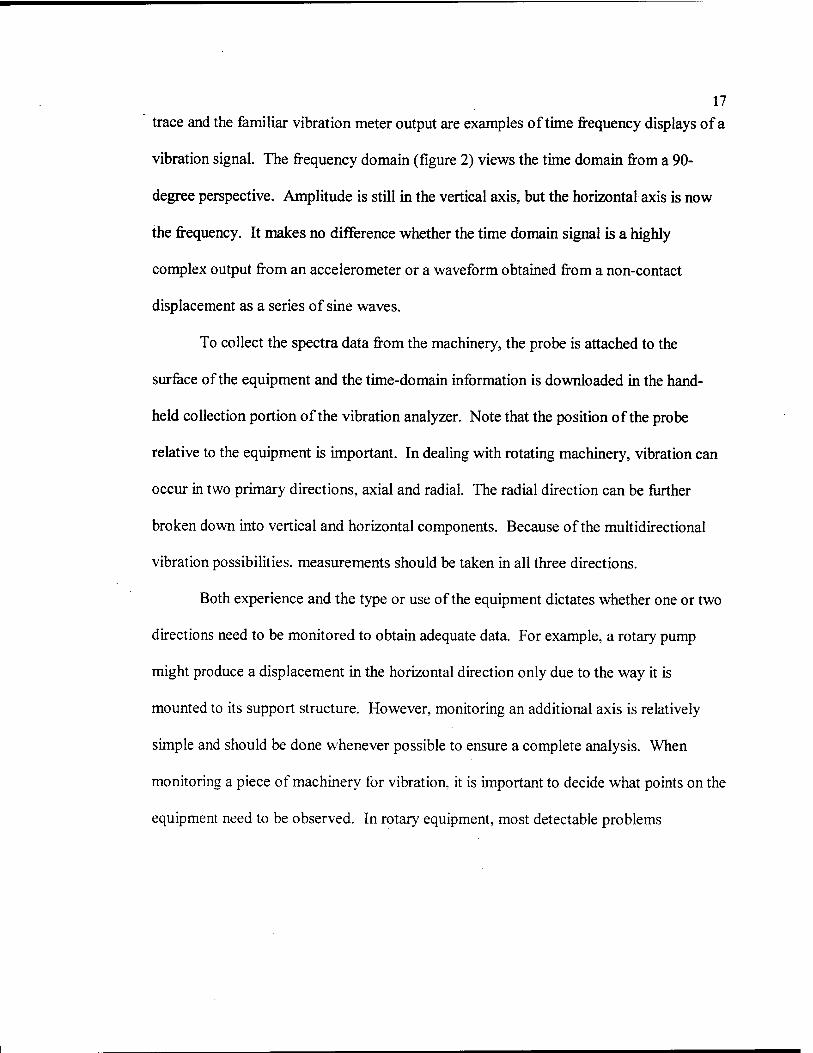
17
trace and the familiar vibration meter output are examples of time frequency displays of a
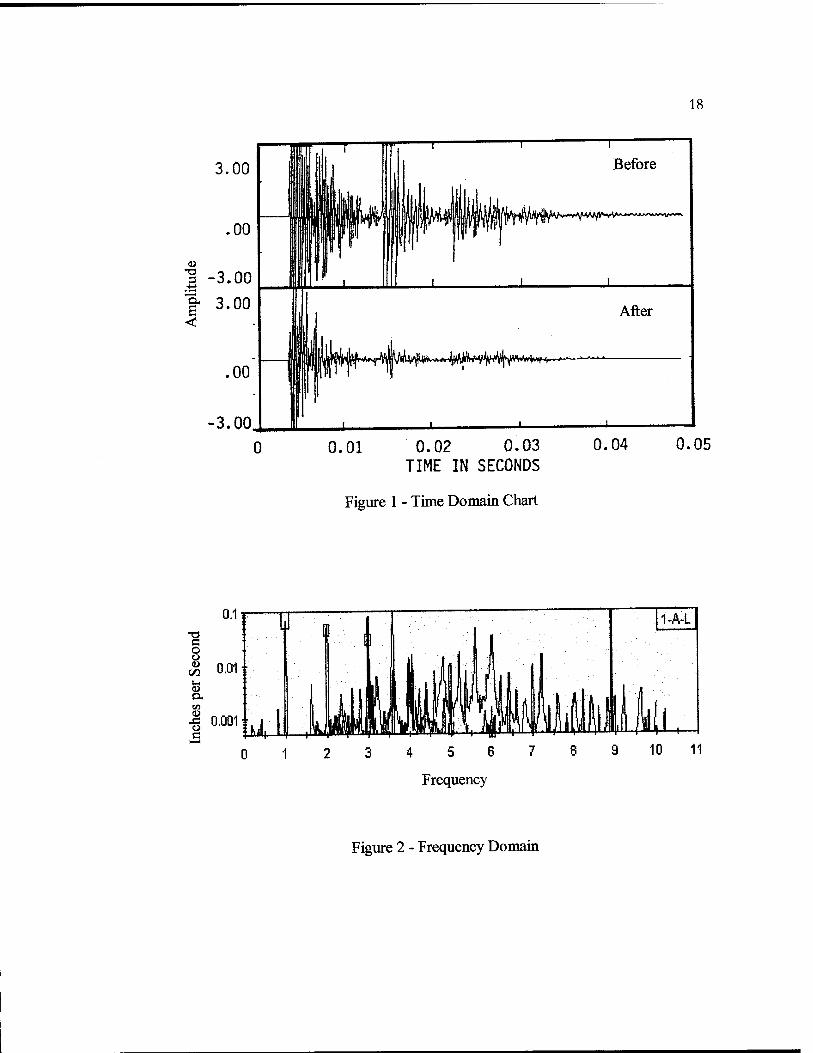
vibration signal. The frequency domain (figure 2) views the time domain from a 90-
degree perspective. Amplitude is still in the vertical axis, but the horizontal axis is now
the frequency. It makes no difference whether the time domain signal is a highly
complex output from an accelerometer or a waveform obtained from a non-contact
displacement as a series of sine waves.
To collect the spectra data from the machinery, the probe is attached to the
surface of the equipment and the time-domain information is downloaded in the hand-
held collection portion of the vibration analyzer. Note that the position of the probe
relative to the equipment is important. In dealing with rotating machinery, vibration can
occur in two primary directions, axial and radial. The radial direction can be further
broken down into vertical and horizontal components. Because of the multidirectional
vibration possibilities, measurements should be taken in all three directions.
Both experience and the type or use of the equipment dictates whether one or two
directions need to be monitored to obtain adequate data. For example, a rotary pump
might produce a displacement in the horizontal direction only due to the way it is
mounted to its support structure. However, monitoring an additional axis is relatively
simple and should be done whenever possible to ensure a complete analysis. When
monitoring a piece of machinery for vibration, it is important to decide what points on the
equipment need to be observed. In rotary equipment, most detectable problems
18
3.00
I -3.00 g- 3.00
-3.00 0 0.01 0.02 0.03
TIME IN SECONDS
Figure 1 - Time Domain Chart
0.04 0.05
0.1 r
0.01 ■■
•a o o
% 0.001 f
¥
hi ■t-—t1
10 11
Figure 2 - Frequency Domain
19
occur in the shafts of rotors; thus, an obvious examination point is the bearing housing.
Good bearing condition is essential for optimum performance of a machine, especially in
equipment that operates at high speed. Bearing faults are the most common and easiest to
detect faults found in equipment monitoring. To insure accurate spectrum analysis,
measurements should be taken in the typical three locations to provide data in both axial
and radial dimensions.
Typical faults in machinery that are detectable by routine vibration analysis
include the following:
Imbalance Misalignment Bent or bowed shafts Bearing faults of any nature Structural degradation Aerodynamic-related effects Various coupling problems Drive-related problems
To ensure consistency in data and to improve the effectiveness of the analysis,
vibration data must always be collected from the machinery at or near the same point.
Equipment and Software
Vibration monitoring may either be done on a constant or periodic basis. The
start up cost for a constant monitoring program is substantially more expensive and will
require a longer payback period. Typically, facilities using constant monitoring cannot
afford any breakdowns due to lost production. It is doubtful, that a constant monitoring
program can be economically justified and there appears to be little additional benefit
over implementing a periodic monitoring system. Therefore, this section will concentrate
on portable equipment used for periodic monitoring programs.
20
Most non-industrial facilities with vibration monitoring programs use portable
vibration monitoring and collection equipment for periodic monitoring. Such a program
uses a hand-held data collector and vibration data are obtained from several points and
then uploaded to a computer for analysis.
The first portable vibration monitor and collector was introduced in 1983. The
unit was capable of measuring vibration with fast Fourier transform (FFT) analysis and
featured automatic storage and transfer of measurements.
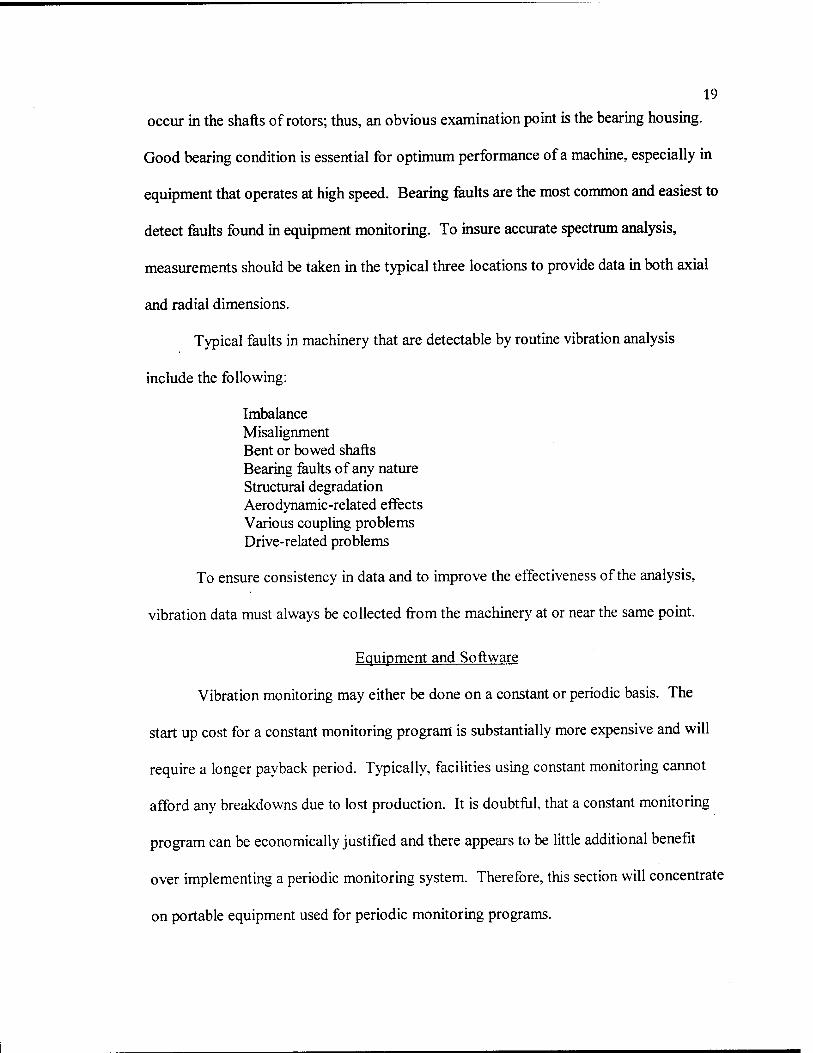
A typical vibration meter (figure 3) consists of a selectable amplitude range
circuit, an integrator to transform the vibration signal from the pickup to velocity or
displacement, and an AC-to-DC converter to change the signal to a DC value that can be
read on the display. This same typical vibration meter is battery powered, uses a seismic
pickup, displays the results on a liquid crystal display (LCD), and allows detailed
analysis of unusual or suspect conditions before leaving the machine.
Figure 3 - Portable Vibration Meter
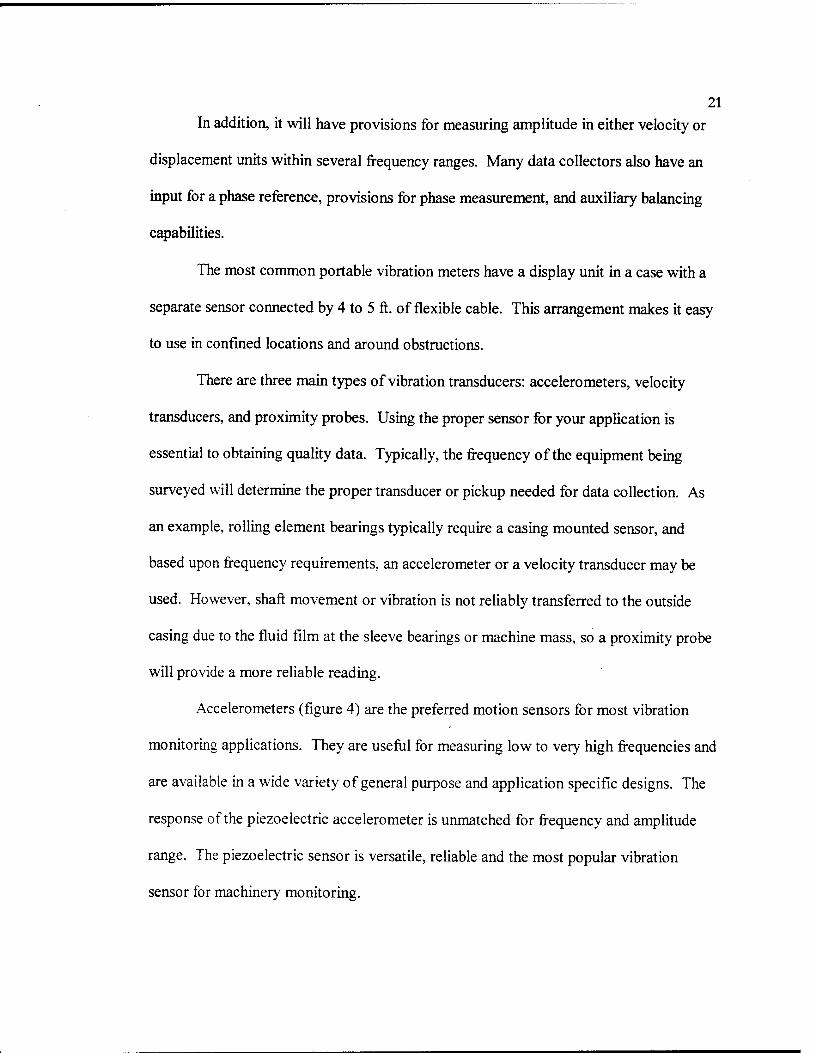
21 In addition, it will have provisions for measuring amplitude in either velocity or
displacement units within several frequency ranges. Many data collectors also have an
input for a phase reference, provisions for phase measurement, and auxiliary balancing
capabilities.
The most common portable vibration meters have a display unit in a case with a
separate sensor connected by 4 to 5 ft. of flexible cable. This arrangement makes it easy
to use in confined locations and around obstructions.
There are three main types of vibration transducers: accelerometers, velocity
transducers, and proximity probes. Using the proper sensor for your application is
essential to obtaining quality data. Typically, the frequency of the equipment being
surveyed will determine the proper transducer or pickup needed for data collection. As
an example, rolling element bearings typically require a casing mounted sensor, and
based upon frequency requirements, an accelerometer or a velocity transducer may be
used. However, shaft movement or vibration is not reliably transferred to the outside
casing due to the fluid film at the sleeve bearings or machine mass, so a proximity probe
will provide a more reliable reading.
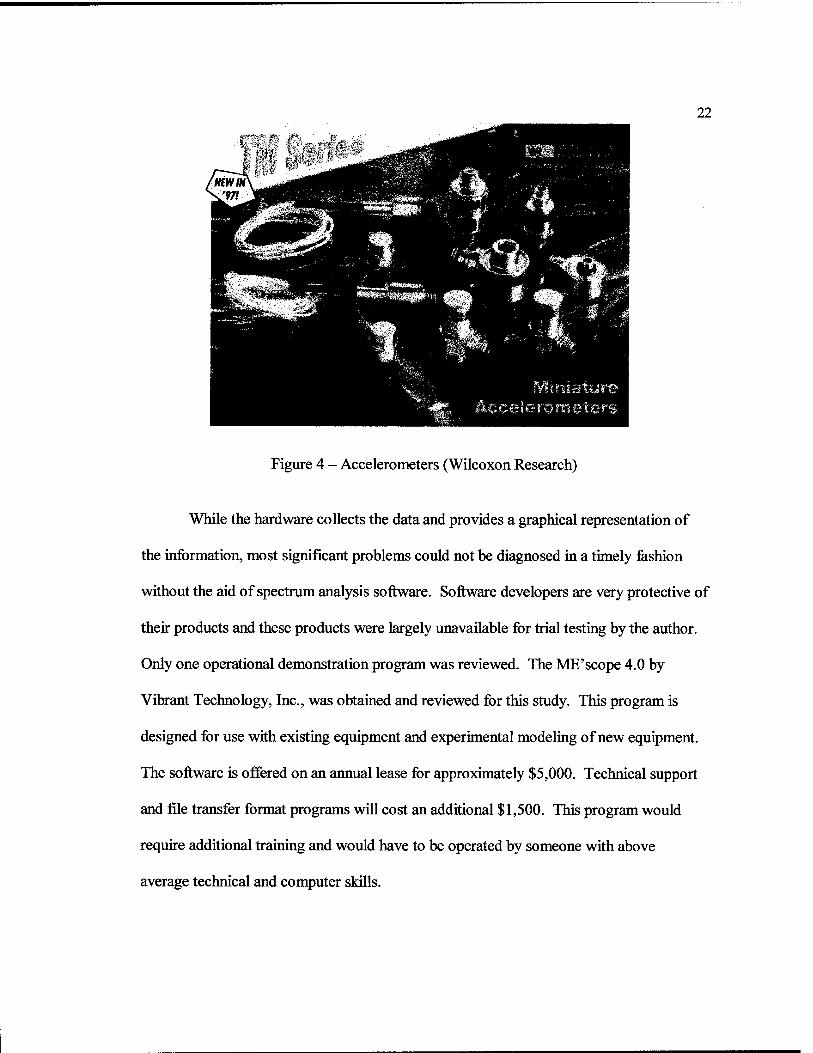
Accelerometers (figure 4) are the preferred motion sensors for most vibration
monitoring applications. They are useful for measuring low to very high frequencies and
are available in a wide variety of general purpose and application specific designs. The
response of the piezoelectric accelerometer is unmatched for frequency and amplitude
range. The piezoelectric sensor is versatile, reliable and the most popular vibration
sensor for machinery monitoring.
22
Figure 4 - Accelerometers (Wilcoxon Research)
While the hardware collects the data and provides a graphical representation of
the information, most significant problems could not be diagnosed in a timely fashion
without the aid of spectrum analysis software. Software developers are very protective of
their products and these products were largely unavailable for trial testing by the author.
Only one operational demonstration program was reviewed. The ME'scope 4.0 by
Vibrant Technology, Inc., was obtained and reviewed for this study. This program is
designed for use with existing equipment and experimental modeling of new equipment.
The software is offered on an annual lease for approximately $5,000. Technical support
and file transfer format programs will cost an additional $1,500. This program would
require additional training and would have to be operated by someone with above
average technical and computer skills.
23
The computer program screens the incoming measurements to detect violations of
preset criteria, which include the following:
• Overall measurements in violation of setpoints • Frequency band and high resolution envelope (FFT spectrum, spectrum and
time domain) violations • Projected trends crossing an alarm setpoint within a given time period • Percentage change from the previous measurement in excess of a
predetermined value • Statistical violations-mean plus standard deviation, in excess of a
predetermined amount.
Trend analysis with condition monitoring software allows the computer to
automatically recognize small but significant changes that would require a vast
expenditure of time for the most skilled analysis. Most software systems provide an
exception report which lists all measurements that are out of limits just minutes after the
data has been loaded into the computer and analyzed by the software.
Implementation
Implementing a predictive maintenance program requires a sizable initial
investment, but proper program management can recover this initial investment and allow
continued annual savings. This has been repeatedly demonstrated throughout the
industry, especially in the past eight years.
Several previous studies illustrate the feasibility of investing in a predictive
maintenance program. One of these studies (Machinery Vibration Analysis 1990)
showed that the cost savings of a predictive maintenance program versus a run-to-failure
program will save most industrial facilities approximately $10/year/hp and recover the
cost of implementation within the first year. The study also noted that the success of the
24
program was expected to increase each year as technicians gain experience with the
equipment and increase their accuracy in predicting component failure. In his 1989 study
of maintenance costs for industrial rotating equipment, V.R. Dodd of Chevron Inc.
measured run-to failure mode cost at $18 per horsepower per year, preventive
maintenance at $13 per horsepower per year, and predictive maintenance at $8 per
horsepower per year.
There were hundreds of testimonials available in articles, books, and Web pages
echoing these levels of cost savings. These must be evaluated with some criticism
"because they were not independently verified. However, one aspect of the review of the
publications did attract attention. Not one case was found expressing dissatisfaction or
absence of cost savings by using vibration monitoring. Discussions on other conditioning
monitoring systems showed at least one case of customer dissatisfaction with each
program. Poor management of the program and lack of executive support in
implementation explained most of these cases of dissatisfaction. These case studies show
how an established predictive maintenance program can yield many cost benefits,
including
Preventing catastrophic equipment failures Increasing equipment on-line reliability Effectively scheduling of maintenance downtime Performing maintenance only when required Prioritizing and scheduling maintenance Reducing costs by eliminating emergency repairs Ensuring new equipment meets specifications at start up Ensuring all problems are corrected during warranty period Reducing spare parts inventory.
25
There are two options for implementing a vibration monitoring program. The
program may be done by facility staff or through a separate contract. Almost all facilities
with similar HVAC systems that were reviewed in other case studies began with a
separate contract for critical equipment only. They gradually extended the scope of the
program as they realized savings associated with the program and eventually trained their
own maintenance personnel until they were able to perform the vibration monitoring
program.
This gradual implementation by facilities is caused by two major issues: the
substantial initial investment for a self performed program and facility management's
inability to convince executives of the anticipated cost savings from a vibration
monitoring program. Implementing a program executed by facility maintenance
personnel requires a substantial initial investment in both hardware and training.
Hardware, software, and training of personnel can easily exceed $100,000 for the first
year's costs. The majority of this cost will be in the wages and training of the
technicians. The facility can not realistically expect a return on this investment until the
second year when the technicians become proficient with the equipment and spectra
analysis. The major cost savings from vibration monitoring are in cost avoidance of
maintenance and impacts to the facility. Cost avoidance is subjective, difficult to prove,
and assumed to be inflated to justify the program. It is difficult to prove a certain piece
of equipment will breakdown sooner or will perform more efficiently with predictive
maintenance. Some equipment may function very efficiently and trouble free without
any maintenance. However, vibration monitoring targets the majority of machines that
26
will develop problems and with proper use will find those machines that are developing
problems before substantial damage occurs.
Facility managers' difficulty in convincing executives of the expected returns on
this investment have resulted in them implementing vibration analysis contracts and
documenting the savings over time. Facilities documenting returns on the cost of the
contract greater than $20:1 typically implement internally performed vibration programs
within two years. Facilities experiencing moderate returns of $10-20:$1 typically
perform some monitoring by staff, but continue to rely on external firms for periodic
monitoring and trend analysis. Those facilities showing less than a $10:1 return normally
implemented only a partial vibration monitoring program and no monitoring was
performed by the staff of the facilities.
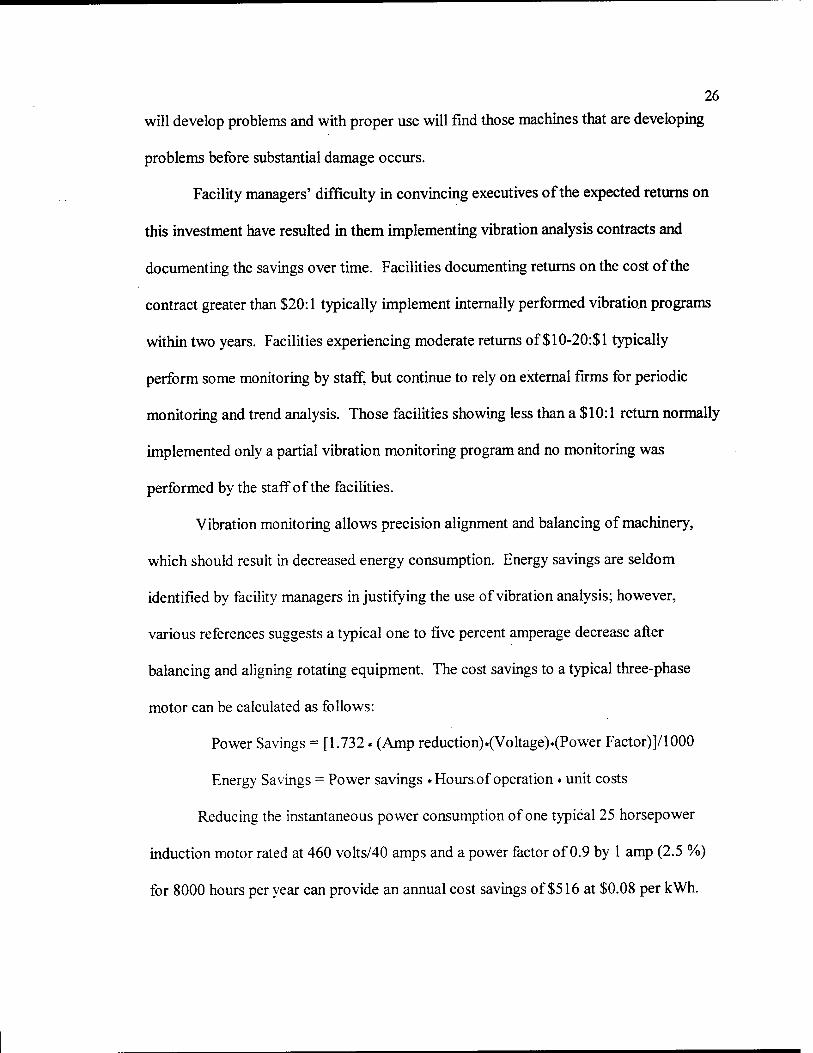
Vibration monitoring allows precision alignment and balancing of machinery,
which should result in decreased energy consumption. Energy savings are seldom
identified by facility managers in justifying the use of vibration analysis; however,
various references suggests a typical one to five percent amperage decrease after
balancing and aligning rotating equipment. The cost savings to a typical three-phase
motor can be calculated as follows:
Power Savings = [1.732. (Amp reduction) .(Voltage)*(Po wer Factor)]/1000
Energy Savings = Power savings *Hours.of operation * unit costs
Reducing the instantaneous power consumption of one typical 25 horsepower
induction motor rated at 460 volts/40 amps and a power factor of 0.9 by 1 amp (2.5 %)
for 8000 hours per year can provide an annual cost savings of $516 at $0.08 per kWh.
27
An estimated $15,000 additional savings bonus for a facility using 30 comparable motors
could offset a major portion of the labor or contract cost associated with a vibration
monitoring program and increase the return on investment.
Vendors and Costs
There are numerous vendors of hardware and software equipment, however the
majority of the hardware is manufactured by only a few companies. A list of vendors and
addresses is supplied in the appendices. The most recognized names of vibration
equipment and software are Bentley and Entek/IRD (Formerly International Research and
Development Corporation). The majority of the companies offering vibration monitoring
services use equipment manufactured by these two companies. There are numerous new
software programs available and all appear to offer the same attributes.
Service contractors and consulting engineering firms that offer vibration
monitoring and analysis exceed 100 and the number is growing quickly. Most
organizations will start with a service contract for vibration monitoring until there are
some actual savings to convince the customer the investment will be worthwhile. The
cost of these services is extremely variable between companies.
CHAPTER 3
METHODOLOGY
Introduction
Is there a potential cost saving for using vibration monitoring as a predictive
maintenance tool with HVAC equipment in USAF health care facilities? This study will
analyze the potential benefits and methods of implementation. An eight-step process was
used to research the feasibility and costs saving potential of vibration-monitoring and
problems associated with implementing a predictive maintenance program. The steps
taken were
Define the Problem
Gather Applicable Information
Determine Goals
Formulate Possible Levels of Implementation and Conclusions
Compare Data
Analyzing Results
State Conclusions
Make Recommendations
These steps are not specifically followed in the formulation of the report. Instead,
a more succinct outline is used to present the information.
28
29 The USAF has defined the problem of insufficient maintenance and quality
control many times in the past. Many facilities lack coordinated maintenance programs
and the amount of reactive maintenance has been escalating over time. The USAF
medical service has increased funding for PM (time based) programs over the last 5
years. They have also made an effort to improve the level of service provided by
contractors and technicians through improved statements of work and providing more
detailed requirements to facility level technicians. These have helped diminish the
problem slightly, but overall, facilities are expending an excessive amount of funds on
reactive (emergency) maintenance.
In the second step, discussions with USAF Medical Facilities Program Managers
and individual facility managers provided an understanding of the USAF health care
facilities current maintenance philosophy and applicable information related to
maintenance costs and impact of FTVAC system downtime. This step also included
gathering information about the vibration-monitoring program at Shands Hospital, which
was the model for comparative analysis. Shands was selected due to its convenient
location and the fact that it was the only medical facility found within a reasonable travel
distance which met the requirements of having used vibration analysis as part of its
maintenance program for at least two years. Shands initially implemented vibration
analysis in 1991, but only began using it as part of a predictive maintenance program in
1995.
The second step also required investigation of vibration monitoring as a predictive
maintenance tool. A thorough literature search of current articles and companies from
30
the Internet provided the information and contacts for obtaining this information. Tel-A-
Train Incorporated, a company that specializes in maintenance training, provided their
nine part video series used in their vibration monitoring certification course for review.
This provided the background information of vibration monitoring procedures.
Concurrent with the initial literature review, there were numerous conversations
with personnel from both the USAF and Shands to determine if there was similar
information that could be used to perform a realistic comparative analysis to insure
objectivity.
The next step was to perform the case studies on the actual expenditures by the
USAF Medical Service and Shands Hospital, Gainesville, Florida on HVAC
maintenance. The USAF and Shands have different tracking methods for financial and
maintenance information that was not adequate for direct comparison. The cost and
frequency of maintenance data were collected through questionnaires sent to all USAF
medical facility managers and Shands' maintenance personnel. Being familiar with the
USAF methods, only the specific information required from Shands for direct
comparison was extracted from files and through interviews.
The fourth step was to determine the desired objectives of implementing a
predictive maintenance program prioritize them, and develop an accepted criterion for
measuring the benefits of vibration monitoring.
The fifth step was to forecast possible conclusions associated with various levels
of implementation. This was primarily based on the literature review and previous
knowledge of the USAF health facilities maintenance program.
31 The sixth step was to compare the information gathered from the case studies and
analyze the possible benefits the USAF health facilities could reasonably expect to
achieve from implementing various levels of vibration monitoring.
The sixth through eighth steps were to analyze the comparisons, state conclusions
and prepare recommendations on implementing vibration monitoring.
Development of Questionnaires
The development of the USAF questionnaire (Appendix A) was done based on a
personal background knowledge of the Air Force Medical Service's documentation
system and the pertinent information needed to perform a valid economic analysis of the
potential for cost savings. The Air Force does not track detailed information on
maintenance; therefore, the information requested was based on information that most
experienced facility managers would be able to answer.
The Shands questionnaire (Appendix A) was developed after numerous
discussions about their maintenance strategy and its execution. Shands tracks their
maintenance history and the cost associated with equipment in a more detailed manner
than the USAF. However, Shands also tracks their assets by different methods and they
use a different classification system for the type of work performed on equipment. The
questionnaire also addressed the reasons for wanting to implement vibration analysis and
the benefits observed since implementation.
32
Performance of Case Studies
The US AF case study was accomplished through conversations and
questionnaires with the officers assigned to the Air Force Medical Logistics Office -
Facilities Management Division in Ft Detrick, Maryland, the Air Force Health Facilities
Division, Brooks AFB, Texas, Headquarters Major Commands, and individual facilities
at Air Force Bases throughout the world. Costs expenditures were obtained
independently from three sources and compared for accuracy. All facilities that
responded to having an emergency maintenance procedure that temporarily curtailed
medical services were contacted for additional information to assess the indirect financial
impact to the facility. The considerations for costs associated with the information
obtained was compiled and sorted using an Access database and Excel spreadsheets.
The Shands Case Study was accomplished with the cooperation of their
maintenance office and included detailed interviews with the managers and the
maintenance staff. The study also included visual observation of the vibration
monitoring data collection and balancing. Shands' historical data were entered into an
Excel spreadsheet to allow comparison with the USAF data.
The main problem noted with compiling the case studies was the different
methods of classifying maintenance work and the financial accounting of the work.
Since the objective of this study is to justify implementation in USAF facilities, the
Shands information and terminology was converted to the USAF methods and
terminology in all comparisons.
33
Implementation Problems
Investigation of the problems associated with implementing a vibration
monitoring program was restricted to the literature review and discussions with the
facility maintenance staff at Shands Hospital. The Shands' program was studied in detail
and it is gradually implementing vibration analysis into its total maintenance strategy.
Most non-industrial facilities follow this type of pattern of implementation to determine
the most cost-effective level of vibration monitoring. The Air Force Medical Logistics
Office (AFMLO) Facilities Branch was consulted to determine the minimum
requirements for implementing a condition monitoring system in US AF Medical
Facilities.
CHAPTER 4
CASE STUDIES
The analysis of the maintenance cost of both the USAF Medical Facilities and
Shands Hospital was restricted to HVAC rotating equipment. Most hospitals use built up
air handling units (AHU) containing similar components. The equipment used in AHU at
Shands is similar to those installed at USAF Facilities and sufficient for comparison.
USAF Medical Facilities
The USAF Medical Service maintains over 300 facilities totaling over 19,400,000
square feet of gross square footage at over 100 installations around the world. The USAF
currently employs only a preventive maintenance (time based) program based on the
manufacturer's recommendations for maintenance. Overall, the programs are averaging
approximately $4 per gross square foot of facility for maintenance and repair. This cost
is hard to define due to the ambiguities in the accounting systems at different locations.
The only accurate costs for facility maintenance only costs were from those facilities
under contract maintenance. Preventive maintenance standards are also better defined
and implemented at facilities with contract maintenance. The overall costs per square
foot varied negligibly between Civil Engineering Squadron (CES) and Contract
performed maintenance. However, most facility managers rate the quality of service
34
35 from contract maintenance to be slightly higher than identical services performed by the
Civil Engineering Squadrons.
Surveys were sent to 45 major installations that had composite medical facilities
or substantial stand alone outpatient clinics. Northern bases with very small cooling
loads were not surveyed. Of these 45, 17 (38 %) responded with information adequate
for analysis and the results are shown in figure 5. All the facilities that responded are of
average size and provide general clinical services. No large hospitals comparable to
Shands responded to the survey; however, information obtained from the two major
commands includes the cost information of two large medical centers. Fourteen of
seventeen facilities reported breakdowns in the last 3 years. Of these fourteen, ten
reported multiple breakdowns. Only five breakdowns were reported that impacted
medical services, but two of these were catastrophic failures that resulted in the
temporary curtailment of services exceeding 3 days. The Air Force Medical Logistics
Office (AFMLO) reports the total maintenance cost for all facilities in 1996 was
$85,084,226. This number is known to have some capital improvement projects and they
were estimated at 10% of the total expenditures based on a recommendation by the
AFMLO facilities officers. The HVAC budget was estimated at 15% of the total
maintenance budget based on an average of cost relationships reported by Shands and the
International Facility Management Association (IFMA). Multiplying the reduced
maintenance cost (Total - Capital improvements) of $76,575,803 by .15 provided the
estimated annual mechanical maintenance cost of $11,486,371. This would equate to
36 approximately $0.58 per square foot. This is a high cost per square foot, but considered
feasible once the amount of emergency maintenance was determined.
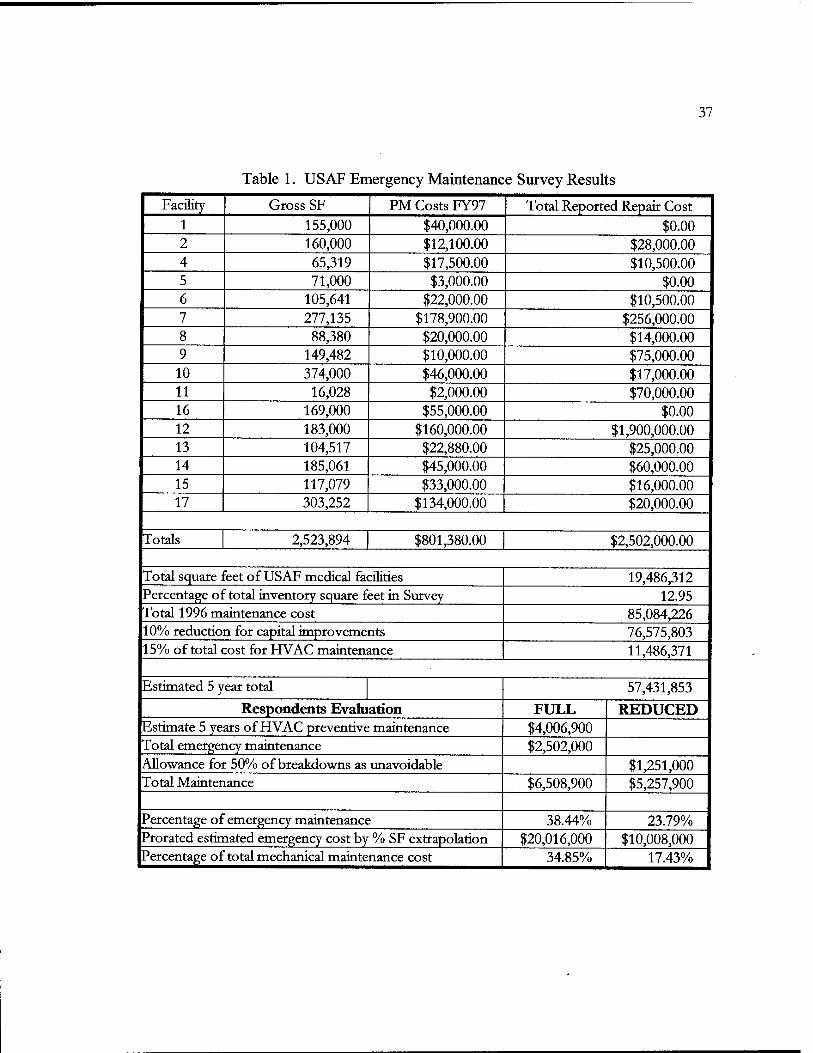
The seventeen installations responding to the survey represented 2,523,894 square
feet or 12.5% of total health care facility space for the USAF. Linear extrapolation of
their data supplied for the mechanical budget for fiscal years of 1995, 1996, and 1997
provided an estimate of $4,006,900 total mechanical preventive maintenance cost for the
last five years. The emergency maintenance costs reported for the five years was
$2,502,000 and the total mechanical maintenance costs was $6,508,900. Roughly, 38.5%
of the total expenditures were for emergency maintenance. Two of these facilities
accounted for 75% of the total emergency repair costs. However, three of the facilities
did not report any unscheduled maintenance. Projecting the reported square footage costs
to the total USAF facility square footage provides an estimated $20,016, 000 cost of
emergency repairs over the last 5 years or $4,004,000 per year. This is 34.85% of the
survey's estimated total annual mechanical budget of $11,486,371.
Cost information was also obtained from two major commands, which are a
headquarters operation for supervising the expenditures of a group of facilities, and
analyzed to provide a secondary set of cost evaluations for comparison. This provided a
quality check to strengthen the validity of any estimates made in the original calculations.
The two major commands representing approximately 7.000.000 SF (35%) of the entire
inventory reported spending over $3,500,000 on emergency FfVAC repairs since 1993. If
the median expenditure reported by Dohrmann and Alereza in 1986 (ASHRAE
Applications Manual, 1995) a median expenditure of $0.24 per square foot for
37
Table 1. USAF Emergency Maintenance Survey Results
Facility Gross SF PM Costs FY97 Total Reported Repair Cost 1 155,000 $40,000.00 $0.00 2 160,000 $12,100.00 $28,000.00 4 65,319 $17,500.00 $10,500.00 5 71,000 $3,000.00 $0.00 6 105,641 $22,000.00 $10,500.00 7 277,135 $178,900.00 $256,000.00 8 88,380 $20,000.00 $14,000.00 9 149,482 $10,000.00 $75,000.00
10 374,000 $46,000.00 $17,000.00 11 16,028 $2,000.00 $70,000.00 16 169,000 $55,000.00 $0.00 12 183,000 $160,000.00 $1,900,000.00 13 104,517 $22,880.00 $25,000.00 14 185,061 $45,000.00 $60,000.00 15 117,079 $33,000.00 $16,000.00 17 303,252 $134,000.00 $20,000.00
Totals 2,523,894 $801,380.00 $2,502,000.00
Total square feet of USAF medical facilities 19,486,312 Percentage of total inventory square feet in Survey 12.95 Total 1996 maintenance cost 85,084,226 10% reduction for capital improvements 76,575,803 15% of total cost for HVAC maintenance 11,486,371
Estimated 5 year total 57,431,853
Respondents Evaluation FULL REDUCED Estimate 5 years of HVAC preventive maintenance $4,006,900 Total emergency maintenance $2,502,000 Allowance for 50% of breakdowns as unavoidable $1,251,000 Total Maintenance $6,508,900 $5,257,900
Percentage of emergency maintenance 38.44% 23.79% Prorated estimated emergency cost by % SF extrapolation $20,016,000 $10,008,000 Percentage of total mechanical maintenance cost 34.85% 17.43%
38
HVAC equipment maintenance. If this were converted to 1996 costs using standard
present worth equations and a straight 4.5% annual inflation ($0.24 x 1.04510), the cost
factor would be $0,373 per square foot. Using this cost factor, the mechanical
maintenance budget of these facilities during that same period would be $2,600,000
(7,000,000 x $0,373). Comparison of these cost reveals that the facilities are spending
approximately 57% ($3.5M-s-($3.5M + $2.6M)) of the expected mechanical maintenance
budget on emergency HVAC repairs. If this is typical of the entire USAF Medical
Service, then approximately $3,560,000 is spent on emergency maintenance of HVAC
equipment every year. These two commands contained two facilities that experienced
major repairs that can not be expected at every facility. However, records show that a
major breakdown within the USAF Medical Service facilities has occurs at least once
every three years.
Approximately 15% of the emergency cost were on equipment that was near or
exceeded its life expectancy. These failures should have been anticipated and facility
management scheduled the equipment for replacement. Even using a reduced number in
the calculations, still leaves an estimated 30% of the total expenditures for emergency
repairs.
The conservative approach of these calculations insures that these numbers are
within a 10% margin of error against potential savings. Reducing the results to the
lowest expected results of 20% still allows an anticipated improvement of 10-15%
($1,000,000 to $1,500,000) reduction in expenditures from implementing vibration
analysis. These calculations prove the current USAF preventive maintenance strategy is
39
not cost effective and must be replaced by a strategy that targets the reduction of
emergency repair costs and improves the reliability and life expectancy of equipment.
Shands Hospital
Shands is a not-for-profit hospital occupying approximately 1,300,000 gross
square feet. Approximately 150,000 square feet is combined mechanical and electrical
service space. The facility was constructed in 1981 with additions and major renovations
through 1990. The majority of critical HVAC equipment and those under vibration
monitoring contract are approximately 8 to 10 years of age. Shands reports a yearly
budget for maintenance of AHU equipment as approximately $170,000. This is
approximately 40 % of their HVAC and five percent of their total maintenance
expenditures. Both the overall maintenance costs and the HVAC maintenance cost are
below industry averages. The primary goal of Shands' Predictive Maintenance Program
(vibration analysis) is to identify impending problems with rotating equipment, such as
fans, motors and pumps, before they turn into costly catastrophic failures and impact the
clinical operations of the facility. There has been no reduction in the scheduled
preventive maintenance program although they have reduced their expenditures over the
last 5 years. Some of the reduction in expenditures is attributed to increased management
efficiency, but the primary source of these savings is the reduction in repair cost and the
increased productivity of technicians. The AHU technicians state the vibration
monitoring helps them locate and correct problems with machinery more efficiently.
Vibration Monitoring began at Shands in 1991 with an engineering firm providing
some analysis and service free of charge to allow the staff to see the benefits of a
40 predictive maintenance system. A formal program of routine analysis began in 1995.
Until that time, the VM was used to primarily to diagnose the problems in equipment.
While this saved time and effort in locating the causes of problems, it was not realizing
the full benefits of VM. Currently, approximately 45 pieces of equipment in the hospital
and 15 pieces of equipment at the chiller plant are on the bi-monthly predictive
maintenance inspection schedule. The majority of these pieces of equipment are part of
the overall HVAC system. Tampa Armature Works (TAW) Engineering provides this
service over a three day period at a cost of approximately $500/day. TAW breaks down
the priority of their work based on four categories as described below from their
statement of work performed:
Category #1- Most critical equipment including all chiller plant equipment.
All of this equipment will be checked during each inspection period unless the
equipment is out of service and cannot be started. All high-speed fans that have
experienced problems since the last inspection period will also be checked.
Category #2 - Supply fans of AHUs servicing critical areas.
Past history has shown that breakdowns most often occur on the higher speed
units. For this reason, the fans of these AHUs as well as any other fans operating above
1800 rpm will be analyzed.
Category #3 - Lower speed units.
Lower speed units such as return fans, exhaust fans, and units serving less
critical areas have not had a history of problems and have a lower priority.
41
Category #4 - Any other lower speed units including pumps and fans that have a
history of relative trouble free operation.
The vibration monitoring follows the basic guidelines described in most texts.
TAW's general description of their work is as follows:
The first day - recording and analyzing the vibration levels on all of the
equipment in categories #1 and #2. If time permits some of the equipment in categories #
3 and # will be checked.
The second day - making any repairs or adjustments needed based on the analysis
of the vibration levels taken on day #1. Repairs included balancing of fans or sheaves,
coupling alignment of motors and pumps or motors and gearboxes, or any other repairs
that Shands personal were not trained to perform.
The third day - Time remaining on day three is spent checking the vibration
levels on any equipment in categories # 3 and # 4 that were not checked on day # 1 or
other equipment Shands' personnel believe may be developing a problem.
Work orders are written on all problems identified as needing specialized services
to correct them (i.e. bad belts, worn sheaves, damaged bearings, loose bolts, etc.) to
ensure Shands personal make the necessary correction and repairs.
A prime example of the benefits of VM was observed on 7 February 1998. Based
on initial vibration levels taken by Shands' mechanics, a non-scheduled service call was
initiated for TAW Engineering to check two fan units that were registering excessive
vibration. On 7 February 1998, a TAW technician investigated the source of the
vibration. The technician used an IRD 885 "Mechanalysis" portable vibration monitor
42
with a velocity probe pickup and a strobe light. The initial vibration levels of the first
unit were oscillating from 10 to 14 mils. After adding balance weights, vibration
readings did not correspond to the expected levels. The fan unit was siting on a spring
isolation base that was providing some resonance readings on the time domain graph.
The belts were removed and the motor was balanced from 2.9 mils to .75 mils. The belts
were reattached and a stabilizer rod was added to the framework of the fan to reduce
vibration. The fan was balanced to approximately 2.5 mils by adding clip on weights to
the four fan blades. The total time for the investigation and balancing was approximately
two hours. An additional hour was spent manufacturing and installing the stabilizer rod.
The second unit had recently experienced an increase in vibration from less than
two mils displacement to over four mils displacement. While four mils was still within
the limitations of the equipment, this increase happened very quickly. The initial
readings at the time of the investigation were oscillating between 12 and 21 mils in both
the horizontal and vertical directions. The technician noticed that the shroud and turning
vanes on both sides of the fan were damaged. The fan was shut down and the access
doors were removed for physical inspection. Removal of the access panels confirmed the
technicians suspicions that minor damage to the fan had already occurred. Several welds
to the fan blades had already separated. The maintenance supervisor was informed of the
damage and the TAW recommended that the fan remain out of service until the fan could
be repaired. In discussing this occurrence with the Shands supervisor and the TAW
technician, it was estimated that the fan could have failed within the next 72 hours. This
fan is part of a parallel system with each fan capable of supporting approximately 75% of
43
the load. This unit was down for approximately one week and while no clinical services
were impacted, there was a substantial increase in complaints. This unit serves the
cystology operating suite among other areas. This area must maintain strict airflow
requirements to continue operating. In order to provide adequate air to the suite, dampers
had to be closed and air diverted from clinical and administrative areas. An cost estimate
for accomplishing this, answering complaints, and resetting the system was based on 4
mechanics spending 4 hours per day for 3 days times labor costs of $16/hour (wage and
benefits). An indirect labor cost for maintenance personnel associated with this failure is
$864. Combined with the possible loss productivity of staff occupying these areas, a
conservative estimate of loss is $1500. Luckily, this outage occurred at a time when the
outside air temperature was a moderate 50-55 degrees and the temperature could be
moderately controlled or productivity losses could have been higher. If the unit had not
been shutdown and had failed, it would have caused extensive damage to other
equipment within the distribution system, resulting in a catastrophic failure of the system.
Failure of the system would have resulted in cancellation of surgeries, loss productivity
of high salary individuals, lowered morale, and patient's lower perception of quality of
medical care. If you address these items of cost avoidance as savings, then the amount of
savings accumulated between the two scenarios easily justifies the total yearly investment
by Shands in Vibration Monitoring.
The experience confirms that while technology can provide an abundance of
information, if the personnel are not trained, or do not have the experience, then the
information cannot be effectively utilized.
44
Shands' maintenance staff fully supports the vibration monitoring program and
believes the program should be expanded to be used on additional equipment and to
provide trend analysis for critical equipment. However, they are experiencing difficulty
in convincing management of the total benefits achieved.
Trend analysis would be beneficial in establishing the life expectancy of the
HVAC equipment. Considering the current age of the majority of the HVAC equipment,
(8-10 years) this could be beneficial in targeting equipment for planned replacement over
the next five years and would recoup the additional cost of approximately $2,000 per year
cost with only one avoidance of equipment failure. Don Glaser also noted that there were
problems with the equipment within the first two years that had could be associated with
excessive vibration. It is his belief that many of these problems could have been avoided
if they had been balanced using vibration analysis during installation and prior to the end
of the warranty period.
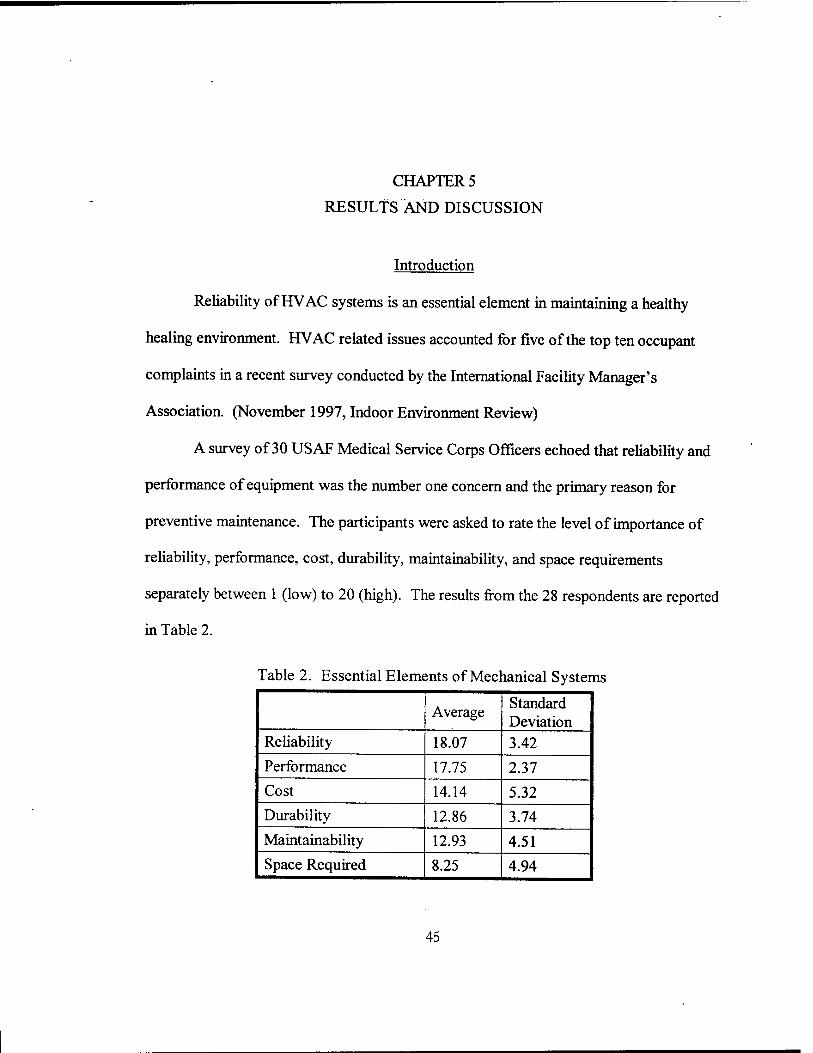
CHAPTER 5
RESULTS AND DISCUSSION
Introduction
Reliability of HVAC systems is an essential element in maintaining a healthy
healing environment. HVAC related issues accounted for five of the top ten occupant
complaints in a recent survey conducted by the International Facility Manager's
Association. (November 1997, Indoor Environment Review)
A survey of 30 USAF Medical Service Corps Officers echoed that reliability and
performance of equipment was the number one concern and the primary reason for
preventive maintenance. The participants were asked to rate the level of importance of
reliability, performance, cost, durability, maintainability, and space requirements
separately between 1 (low) to 20 (high). The results from the 28 respondents are reported
in Table 2.
Table 2. Essential Elements of Mechanical Systems
Average Standard Deviation
Reliability 18.07 3.42
Performance 17.75 2.37
Cost 14.14 5.32
Durability 12.86 3.74
Maintainability 12.93 4.51
Space Required 8.25 4.94
45
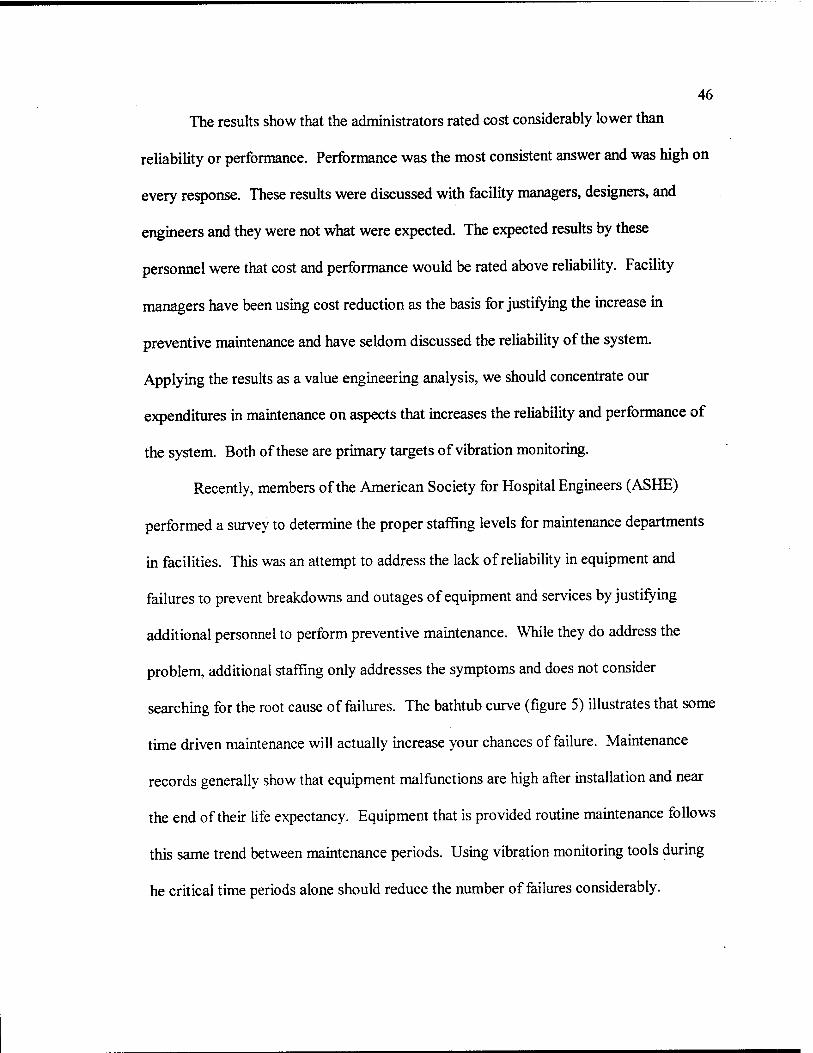
46
The results show that the administrators rated cost considerably lower than
reliability or performance. Performance was the most consistent answer and was high on
every response. These results were discussed with facility managers, designers, and
engineers and they were not what were expected. The expected results by these
personnel were that cost and performance would be rated above reliability. Facility
managers have been using cost reduction as the basis for justifying the increase in
preventive maintenance and have seldom discussed the reliability of the system
Applying the results as a value engineering analysis, we should concentrate our
expenditures in maintenance on aspects that increases the reliability and performance of
the system. Both of these are primary targets of vibration monitoring.
Recently, members of the American Society for Hospital Engineers (ASHE)
performed a survey to determine the proper staffing levels for maintenance departments
in facilities. This was an attempt to address the lack of reliability in equipment and
failures to prevent breakdowns and outages of equipment and services by justifying
additional personnel to perform preventive maintenance. While they do address the
problem additional staffing only addresses the symptoms and does not consider
searching for the root cause of failures. The bathtub curve (figure 5) illustrates that some
time driven maintenance will actually increase your chances of failure. Maintenance
records generally show that equipment malfunctions are high after installation and near
the end of their life expectancy. Equipment that is provided routine maintenance follows
this same trend between maintenance periods. Using vibration monitoring tools during
he critical time periods alone should reduce the number of failures considerably.
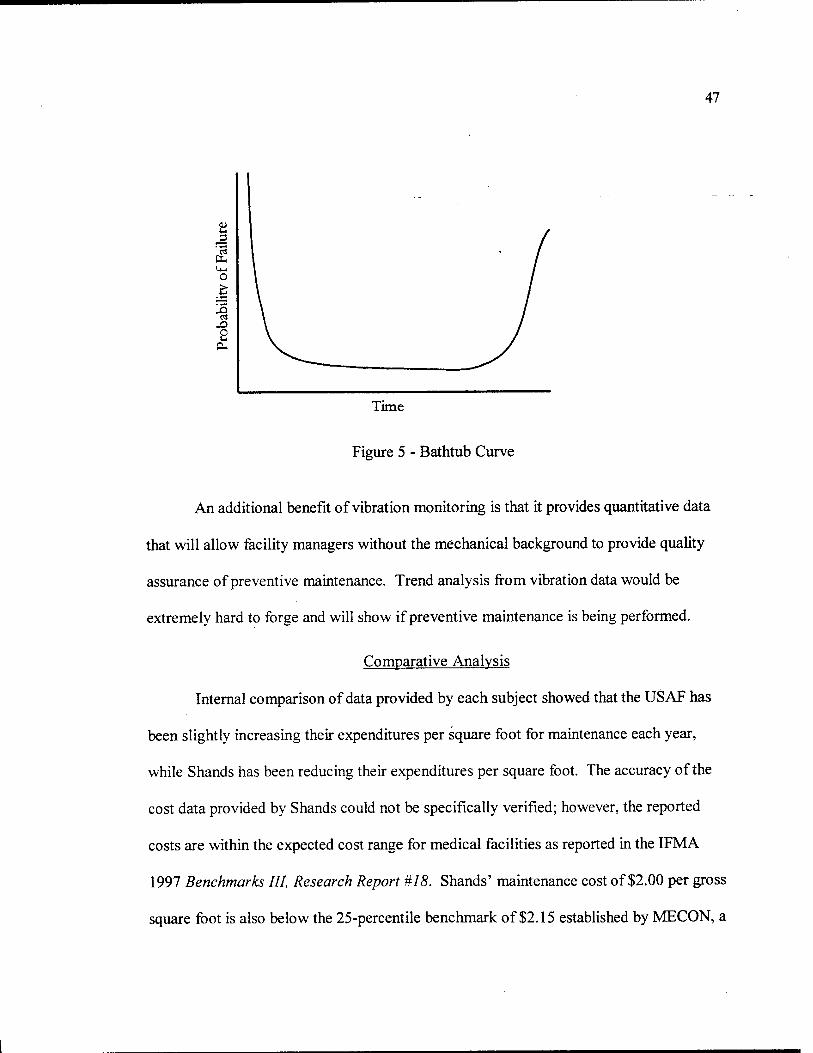
47
3
Et tu o
J5 '4 a
Time
Figure 5 - Bathtub Curve
An additional benefit of vibration monitoring is that it provides quantitative data
that will allow facility managers without the mechanical background to provide quality
assurance of preventive maintenance. Trend analysis from vibration data would be
extremely hard to forge and will show if preventive maintenance is being performed.
Comparative Analysis
Internal comparison of data provided by each subject showed that the USAF has
been slightly increasing their expenditures per square foot for maintenance each year,
while Shands has been reducing their expenditures per square foot. The accuracy of the
cost data provided by Shands could not be specifically verified; however, the reported
costs are within the expected cost range for medical facilities as reported in the IFMA
1997 Benchmarks III, Research Report #18. Shands' maintenance cost of $2.00 per gross
square foot is also below the 25-percentile benchmark of $2.15 established by MECON, a
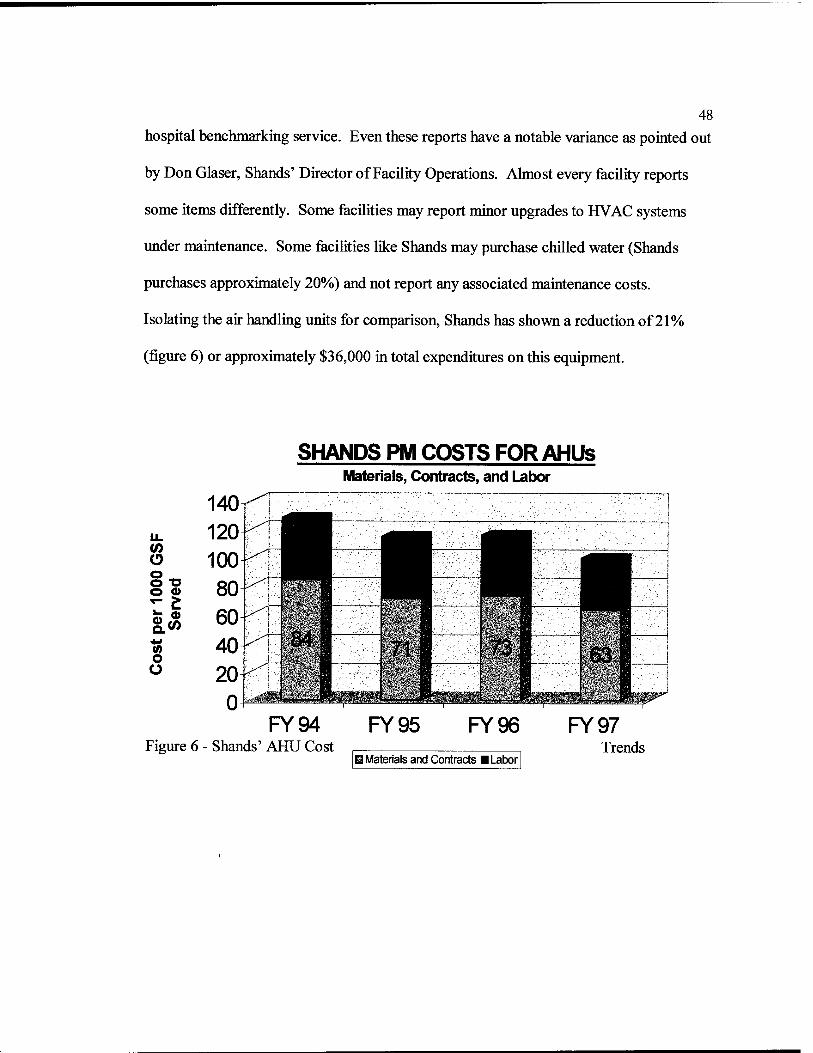
48 hospital benchmarking service. Even these reports have a notable variance as pointed out
by Don Glaser, Shands' Director of Facility Operations. Almost every facility reports
some items differently. Some facilities may report minor upgrades to HVAC systems
under maintenance. Some facilities like Shands may purchase chilled water (Shands
purchases approximately 20%) and not report any associated maintenance costs.
Isolating the air handling units for comparison, Shands has shown a reduction of 21%
(figure 6) or approximately $36,000 in total expenditures on this equipment.
w o S^ o o
CO o Ü
Figure
SHANDS PM COSTS FOR AHUs Materials, Contracts, and Labor
FY94 6 - Shands' AHU Cost
FY95 FY96 0 Materials and Contracts ■ Labor
FY97 Trends
49
Shands personnel attribute most of these savings to the vibration monitoring
program and the reduction in emergency maintenance.
In contrast, USAF Medical Facilities are showing an increase in cost expenditures
for the same level of maintenance. This is primarily due to the different levels of
emergency maintenance. The results of the USAF survey revealed that the USAF is
spending 30 to 38% of their mechanical maintenance budget on emergency maintenance.
Two of the seventeen facilities responding accounted for approximately 75% of the total
emergency maintenance cost, but four facilities also reported no emergency maintenance.
The average cost per square foot of emergency maintenance reported multiplied by the
total USAF inventory showed that this was approximately 34% of the total mechanical
budget. Prorating the total maintenance cost to the square footage of the survey facilities
provided an average expected cost of $55,092,000 (85,084,226 * 12.95% of facilities * 5
years) of total maintenance for these facilities for the last three years. The total reported
expenditures of $2,502,000 for HVAC emergency maintenance is approximately 4.5% of
the total expected maintenance costs of these same facilities.
In 1994, prior to full implementation of vibration analysis, Shands was reporting a
similar cost per square foot for AHU Maintenance as the 1997 estimates shown for the
USAF. Shands is reporting a substantial reduction in AHU maintenance costs over the
last 3 years with only one failure. The cost savings associated with maintenance alone
have been approximately $31,000 per year. The cost of vibration monitoring associated
with the AHUs is approximately $10,000. The vibration monitoring system has provided
approximately 3 to 1 return on investment.
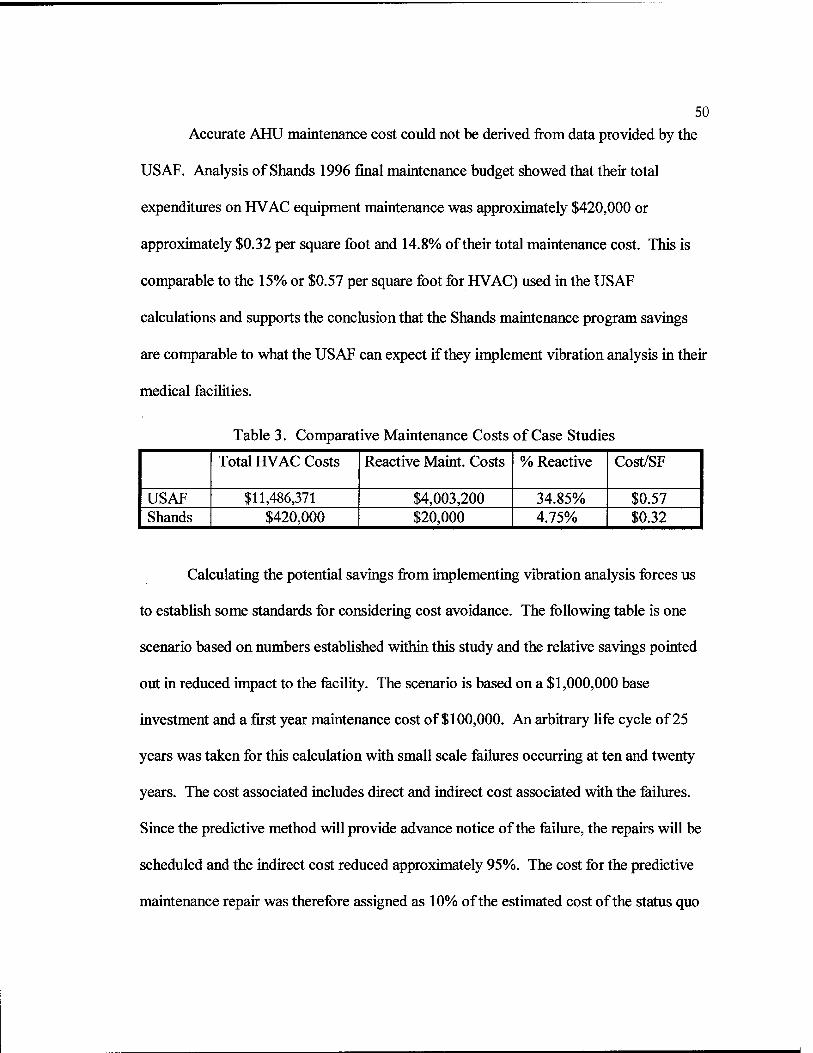
50
Accurate AHU maintenance cost could not be derived from data provided by the
USAF. Analysis of Shands 1996 final maintenance budget showed that their total
expenditures on HVAC equipment maintenance was approximately $420,000 or
approximately $0.32 per square foot and 14.8% of their total maintenance cost. This is
comparable to the 15% or $0.57 per square foot for HVAC) used in the USAF
calculations and supports the conclusion that the Shands maintenance program savings
are comparable to what the USAF can expect if they implement vibration analysis in their
medical facilities.
Table 3. Comparative Maintenance Costs of Case Studies
Total HVAC Costs Reactive Maint. Costs % Reactive Cost/SF
USAF $11,486,371 $4,003,200 34.85% $0.57 Shands $420,000 $20,000 4.75% $0.32
Calculating the potential savings from implementing vibration analysis forces us
to establish some standards for considering cost avoidance. The following table is one
scenario based on numbers established within this study and the relative savings pointed
out in reduced impact to the facility. The scenario is based on a $1,000,000 base
investment and a first year maintenance cost of $100,000. An arbitrary life cycle of 25
years was taken for this calculation with small scale failures occurring at ten and twenty
years. The cost associated includes direct and indirect cost associated with the failures.
Since the predictive method will provide advance notice of the failure, the repairs will be
scheduled and the indirect cost reduced approximately 95%. The cost for the predictive
maintenance repair was therefore assigned as 10% of the estimated cost of the status quo
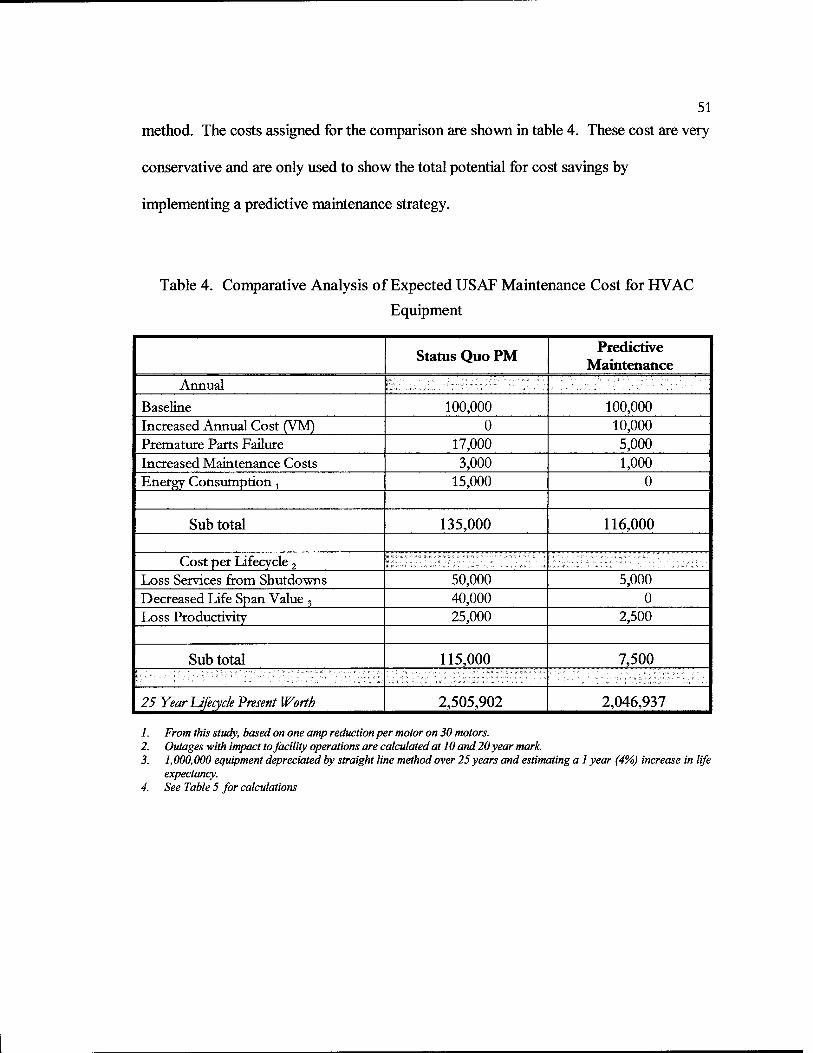
51 method. The costs assigned for the comparison are shown in table 4. These cost are very
conservative and are only used to show the total potential for cost savings by
implementing a predictive maintenance strategy.
Table 4. Comparative Analysis of Expected USAF Maintenance Cost for HVAC
Equipment
Status Quo PM Predictive
Maintenance Annual
Baseline 100,000 100,000 Increased Annual Cost (VM) 0 10,000 Premature Parts Failure 17,000 5,000 Increased Maintenance Costs 3,000 1,000 Energy Consumption j 15,000 0
Sub total 135,000 116,000
Cost per Lifecycle 2
Loss Services from Shutdowns 50,000 5,000 Decreased Life Span Value 3 40,000 0 Loss Productivity 25,000 2,500
Sub total 115,000 7,500
25 YearlJfecycle Present Worth 2,505,902 2,046,937
1. From this study, based on one amp reduction per motor on 30 motors. 2. Outages with impact to facility operations are calculated at 10 and 20 year mark. 3. 1,000,000 equipment depreciated by straight line method over 25 years and estimating a 1 year (4%) increase in life
expectancy. 4. See Table 5 for calculations
52 Calculating the life cycle cost of these over a 25 year life span (see figure 11)
shows vibration monitoring and predictive maintenance can reduce the present worth of
the system and its performance by $458,965. The present worth of the implementation
cost was calculated as $ 184,244. This would provide an approximate return on
investment of 2.5 to 1. This is a conservative result for an average sized facility and the
case studies reviewed in the literature review reported significantly higher returns.
Implementing vibration monitoring in the 78 major facilities will provide a substantial
savings valued at over $35,000,000 in lifecycle cost.
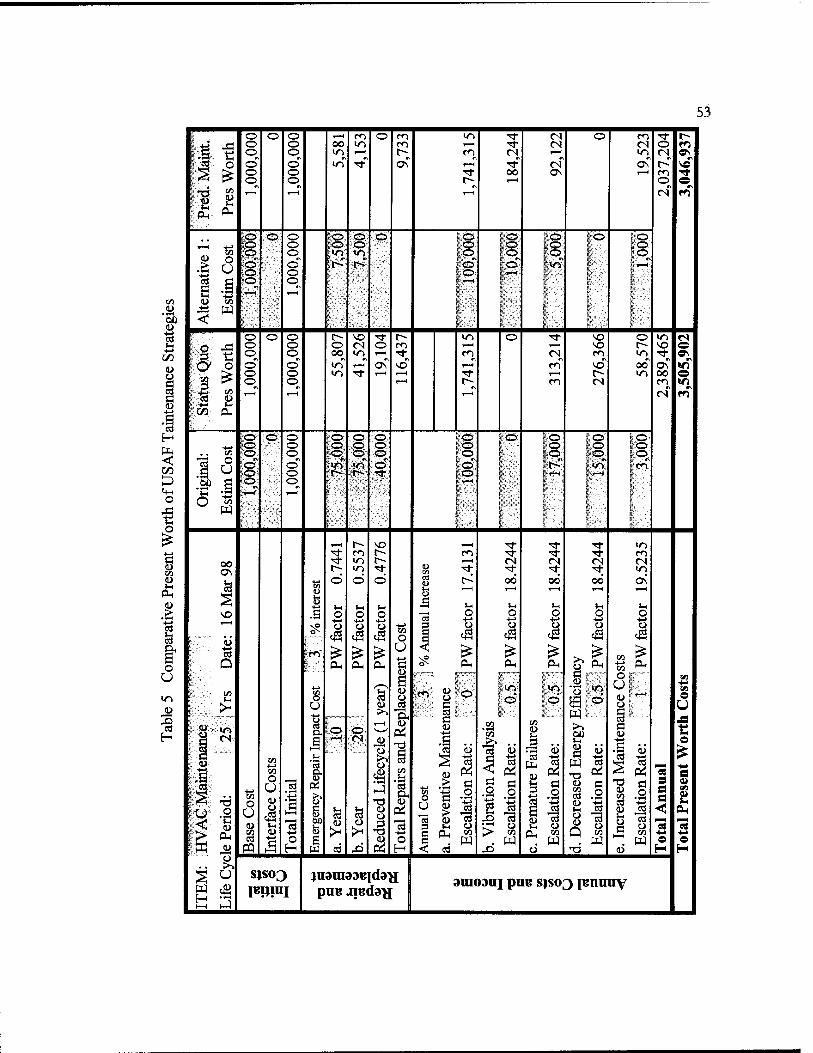
53
o o O i—i en o m in ■* (N o en TT r~- fe>e: X o O 00 to en i—i rf (N CN o m i# •e o © m »—t f- m CN 1—( m CN «^ »\ ^ o o o in "3- o\ r-H ■* CN as l> so .s £ o © ^f 00 ON i—i en ■*
<o ©_ I> »—1 o^ ©
1*53 8
:,PH-
co *—1 *—1 ^ CN rn
PH
US' ;:%; o 1© t© © s© © ;•© 1©' i© T-H tS o
o o 1© <n
!©: in o
o o 1© o 1© 1© 4) o
U Wi ■" *^
_>; o o |tv r» hd> t©j m" i'^1- <*>*> !©; o E© i-> i 1" r
§ *-*-> o
S~-i <o ^
co <u to |, i^:-:". ; .2 GO n> %
W 1 1 I; |
f
"8 OIL... ..
O o o r» SO "* r- «n o ^f SO o >n CN S-t
■ S X o o o CN o m T-H 1—1 SO r-- SO ©
t/5 ■e © ©^ c» in t-H ■* en CN en in ■* C?\
^ o o ©" </-f r-H oT so" i—( rn so" oo" as ID
£ o © m Tf 1—1 »—i ,^- ?-H r-> m 00 ©
: B o o T—H r-~ m CN en *n «h
c ?"S CO '-' T—1 i—i CN fn 1) r -*j
Ut
1 F:CQ" PH
H o .©, o E© ;© ©. © fc© ft© |;©' 1©
3 . . o o 1©- J© :©: • O IS. -v:'; !©: 1© 1©
JJ 72 o © ©^ am ^q 1© o o^ 1©^ s U SeT o" in lo ©" 1©: r^ - in |'«TV CZ3 .3 ©' © r» r- ■^i- t© * i*^' p*"*
.£P .§ <3 r—1
Ir-^.
1= ' i' i ¥' "•■■' I
O O to |:/ i
43 w B.:i. ■'■
■c i 1 1 '.*; 1 i—i t- ^o i—1 ^1- ■* ^~ m -M TJ- r«-> t~- m Tf ■t ^1" en C 00 ^f <o o *—i CN (N CN CN VI
i> in Tf ■«t ■<* ■* ^ in
PH 3 S
ö ö Ö as a> b 5
00*
l-H
00 00
S-4
> V£> .g o o o ,-H o O O o o
8 1—1
8
-4-*
£ -*-»
£ -*-*
J VI o
C3 1 +-> 1 1 1 o
M' & & ^ u •sjO ^ ^ £
G* PH « * Q PH PH PH 'S o^ PH PH PH +i PH CO "^
U
m
•8 H u
-.1 "f., «s
IS -u .<
w H
VI
u PH
CO
O U
CO cd
VI to O U
ä u
■s
"3
1—1
"3 o
to O u 'S es
B
f s 00 b g
!©■■ :-©i
c3
i-H
O
°3
1 J a.
PÜ
"I P4 "e3 +-> o
:en
w o U 'S 3
ö k';"'"
'3 ü
?S a> co
O , CO
|in- I©
CO
"co >» ..
•2 .2
L> CO
. w
IF0- i ©
CO
1 * fe pi
i -2 2 S ri, co
o "^ ©■'°
CD (H
S o CO -Ä
i-H _cg
Q CO
CO -£»
8 .2 cd *i 0) CO
iS co . w
"öS s a a <
•♦* o
•♦-» CO
© Ü
©
-** a V en
"04 ■**
O 0>
U
sS
PQ H w cd .0 Pi H <, eg X3 U 13 (L> H H
S|S03
P*!Jrai IB SJS03 iBnuuy
CHAPTER 6
CONCLUSIONS AND RECOMMENDATIONS
Research Conclusions
The US Air Force Medical Service and all medical facilities could benefit from
the use of vibration analysis to monitor heating, ventilation, and air conditioning (HVAC)
equipment. Periodic vibration analysis is inexpensive and easy to implement. A
Predictive maintenance program is essential to ensure HVAC equipment continues to
operate efficiently and reliably and vibration analysis is a vital component. Vibration
analysis can assist the maintenance staff in locating problems that cause abnormal
vibrations and correct the problem before damage or failure. The analysis in the study
show that vibration monitoring can provide enough cost savings in energy efficiency and
reduced maintenance expense to recover the cost of implementation. Therefore, there is
no financial risk in implementing a predictive maintenance program with vibration
analysis. These savings are small compared to the cost avoidance associated with failure
of equipment. The greatest benefit of using predictive maintenance techniques comes
from cost avoidance of downtime in the facility. The reduction in lost time, comfort,
productivity, and medical services as well as the avoidance of potential lawsuits from
poor IAQ associated with infection control are major considerations for medical facilities
in determining what maintenance strategy to employ. Condition monitoring reduces the
54
55
risk of these occurrences and saves money through cost avoidance. The savings through
cost avoidance are difficult to quantify and are always challenged.
Vibration monitoring is an industry proven tool for reducing the cost of
preventive and emergency maintenance. Most healthcare facility mangers are not
completely convinced of the total reliability of vibration monitoring and have not reduced
their levels of preventive maintenance. Effective use of vibration analysis to ensure
efficient performance of equipment can also reduce the energy cost of the facility. Most
facilities can expect the savings from these two items to equal or exceed the cost of
implementing a vibration-monitoring program.
The USAF Medical Service must make a paradigm shift in their maintenance
strategy. Their facilities are prime candidates for the use of a proactive maintenance
strategy using a form of condition monitoring. This study shows that a proactive
maintenance strategy consisting of vibration monitoring, preventive maintenance, and
trend analysis will increase maintenance efficiency, ensure the quality of the indoor
environment, and minimize infection risks to patients and staff.
Vibration Monitoring of critical HVAC equipment will provide both a direct and
indirect return on investment. All facilities with contract maintenance should add this
requirement to the contract's scope of work. There are many firms offering this service
throughout the country and monthly monitoring of an average facility could be estimated
at approximately $500 per day for 18 days per year. This would mean an increase in
approximately $9,000 for data collection and another $2,000 for trend analysis and
56
reporting for this level of service. If the system saves one piece of equipment or prevents
one outage in 5 years, this will more than pay for its cost.
The US AF medical service should spend less than 5% of their mechanical
maintenance budget on reactive maintenance. However, their expenditures on emergency
maintenance reported from the survey results are estimated at over 34% of the USAF
Medical Service's mechanical budget and over 12% of the mechanical budget for a
median sized average sized medical facility. Many of these facilities are serviced by on-
base government agencies, which do not charge premium prices for most emergency
services. If they did, the costs associated with their emergency maintenance would be
substantially higher.
If half of the emergency costs reported were unavoidable (age or defective parts)
and removed from consideration, the cost available for reduction by Vibration monitoring
would be lowered by approximately $2,000,000 or 17% of the total yearly mechanical
expenditures. If vibration monitoring only reduces this percentage of emergency
maintenance costs by a conservative 5 percentage points (17% to 12%) per year, it will be
saving an estimated $622,000. The estimated cost of implementing a contract vibration
monitoring system for the entire inventory of the 78 major facilities would be
approximately $1,000,000 ($12,500 per facility). If the reduction were increased to, 10%
(17% to 7%), then the savings would exceed $1,200,000. Effective implementation and
management of a vibration program at selected facilities could provide significant
savings and the program will pay for itself with the cost savings resulting from reduced
emergency maintenance. Energy savings, reduced preventive maintenance costs,
57
improved risk management of the indoor environment, and diminished impact of outages
on medical operations are all additional benefits that will add to the justification and
return on investment.
Validity of Data
The data compared in this study are based on historical data that comes from
different accounting and tracking methods. Determination of the actual numbers being
compared required some interpolation of data and assumptions of exactly what type of
work was done. When interpolation was required, the most conservative approach that
would not favor implementation of vibration monitoring was taken. The USAF study
data are very broad based and the study assumes that the reported data are factual and
accurately documented. The actual costs of maintenance for different facilities were
widely divergent. However, the reported trends in the increased amounts of both
preventive and reactive maintenance performed by individual facility managers, provides
validity to the recommendation for condition monitoring. Comparison of data reported
by the bases to the data reported by the major commands showed the same trends. The
most significant result of the survey analysis is that the USAF medical service has at least
$1,200,000 of annual mechanical maintenance expenditures that can potentially be
eliminated.
Recommendations for Implementation
This study recommends the USAF Medical Service implement a predictive
maintenance strategy using vibration monitoring to monitor equipment condition. The
requirement to perform vibration monitoring and trend analysis should be added to the
58
Statement of work of maintenance contracts at hospitals. The estimated cost of this
additional service will be less than $20,000 for the largest facility and $11,000 for an
average facility. Providing an additional contract to facilities being serviced by CES will
be less beneficial due to the time lag for service. Unless they can be convinced to
implement a vibration monitoring program across the entire installation, it will be
difficult to document actual cost savings. To ensure the quality of service, the USAF
medical service's facility management class should include an approximately two hour
block on vibration monitoring. An orientation of essential concepts required to provide
quality assurance capability and the benefits derived from the program must be provided
to insure successful implementation.
Recommendations for Further Study
Recognizing the benefits of a proactive maintenance strategy is difficult without
financial justification. This study has shows that vibration analysis can pay for itself with
increased energy efficiency and maintenance productivity. This study also shows that
there is a potential for significant savings in cost avoidance associated with equipment
failures, but the amount of savings can not be objectively determined without obtaining
more extensive data on USAF facilities.
This study will be presented to the USAF Medical Logistics Office with the
recommendations that vibration analysis be immediately implemented at all facilities
with contract maintenance. Vibration analysis will also be recommended for inclusion in
the testing and certification of equipment prior to facility acceptance on major
construction projects and be repeated prior to the warranty expiration.
59
The facility managers do not need to know the details of vibration analysis, but
they will need an orientation on how it works and what they should expect from the
vibration analysis contractor. If the USAF implements vibration analysis, the USAF
medical facility managers training course at Sheppard AFB, Texas should add a 4 hour
training period on vibration analysis and predictive maintenance. The interactive training
programs and video tapes provided by Tel-A-Train, Inc., provide an excellent resource to
orient facility managers on the process and what to expect from the vibration analysis
contract.
It is recommend that this study be continued by implementing vibration
monitoring at three USAF health care facilities for a minimum of three years to further
determine the actual level of savings that can be obtained. All facilities should have a
documented preventive maintenance program and an accurate accounting of maintenance
and performance of levels of individual equipment for the last three years. This is
essential to establish trends for comparison and removing subjectivity from the study.
Additionally, the government agencies supervising the study must decide the following
aspects of the program.
Determine the specific objectives (e.g. reliability) and how to measure them.
Establish standards for measuring the value of each intangible component that impacts the operation of the facility.
Determine the data collection and analysis procedures
Determine how cost avoidance will be calculated.
Determine the potential for cost savings prior to implementation
Set a specific period for analyzing and reporting benefits.
Determine the technical qualification for personnel involved.
BIBLIOGRAPHY
American Society of Heating, Refrigerating and Air-Conditioning Engineers (ASHRAE), Inc., The ASHRAE Handbook CD, Vol. 2. Atlanta, 1997.
Beards, C.F., Engineering Vibration Analysis with Application to Control Systems, New York, Halstead Press, 1996.
Colen, Harold R., HVAC Systems Evaluation, R.S. Means Company, Inc., 1990.
Computational Systems Inc., Pro-active Maintenance, December 1997
Cooper, Patrick, and Roberts, Dwayne, Vibration Monitoring Justification Based on "Saves, " Predictive Maintenance Technology National Conference, 1996.
Cybolsky, Gord, and Panth, Pat, Precision Alignment Provides Big Reduction in Electricity Consumption, Reliability Magazine, May/June 1995
Dodd, V.R., Maintenance Costs for General Industrial Rotating Equipment, Chevron Inc. Houston, TX. 1989
Gladstone, John, and Bevirt, W. David, HVAC Testing, Adjusting, and Balancing Manual, McGraw-Hill, New York, 1996.
Hansen, Sten Olaf, Economic Consequences of Poor IAQ, Facilities Management Journal, pages 29-35, September/October 1997
Hansen, Wayne, Air Power - How to Craft an IAQ Program That Will Fly, Health Facilities Management Journal, pages 22-24, January 1998
Harris, CM., Shock and Vibration Handbook, 3rd ed. New York, McGraw-Hill, 1988
International Facility Management Association (IFMA), Benchmarks III, Research Report #18, Houston, TX: 1997.
Mitchell, John S., Profit Centered Maintenance - A New Vision, P/PM Technology Journal, pages 44-48, August 1994.
Mobley, R. Keith, An Introduction to Predictive Maintenance. New York, Van Nostrand Reinhold. 1990.
60
61
Moubray, John, Reliability-centered Maintenance, 2nd ed. New York, Industrial Press, 1997.
Spectral Dynamics, Machine Vibration Analysis, 1990
Tel-A-Train, Inc., Applied Vibration Analysis, 1996
U.S. Army Corps of Engineers Construction Engineering Research Laboratories, Vibration Monitoring for Predictive Maintenance in Central Energy Plants, FE 93- 25. Champaign, IL: September 1993.
Wilcoxon Research, Test & Measurement Vibration Products, 1996
Williamson, Dick, Not so Good Vibrations, Engineering Systems Magazine, pages 56-66, March 1998.
Wright, John F., Unleashing a Maintenance Department's Full Potential Through Reliability Centered Maintenance, P/PM Technology Journal, pages 50-60, February 1996.
APPENDIX A SURVEY QUESTIONAIRES
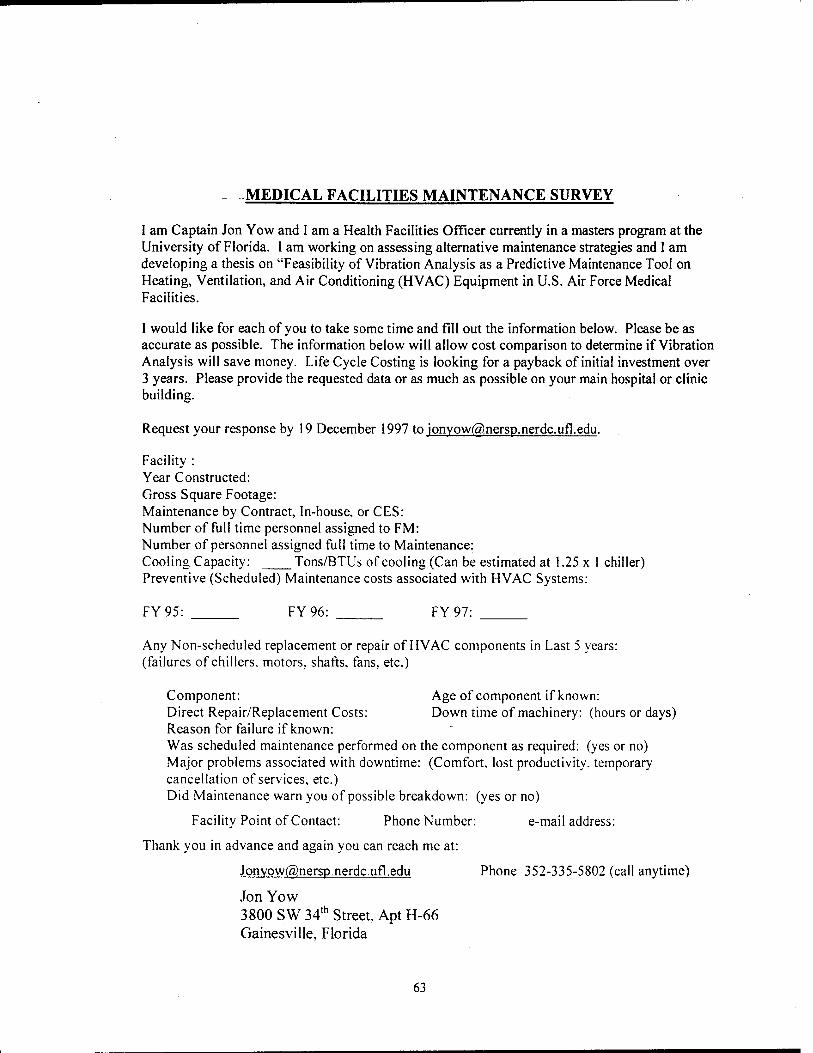
MEDICAL FACILITIES MAINTENANCE SURVEY
I am Captain Jon Yow and I am a Health Facilities Officer currently in a masters program at the University of Florida. I am working on assessing alternative maintenance strategies and I am developing a thesis on "Feasibility of Vibration Analysis as a Predictive Maintenance Tool on Heating, Ventilation, and Air Conditioning (HVAC) Equipment in U.S. Air Force Medical Facilities.
I would like for each of you to take some time and fill out the information below. Please be as accurate as possible. The information below will allow cost comparison to determine if Vibration Analysis will save money. Life Cycle Costing is looking for a payback of initial investment over 3 years. Please provide the requested data or as much as possible on your main hospital or clinic building.
Request your response by 19 December 1997 to ionyow(a),nersp.nerdc.ufl.edu.
Facility : Year Constructed: Gross Square Footage: Maintenance by Contract, In-house, or CES: Number of full time personnel assigned to FM: Number of personnel assigned full time to Maintenance: Cooling Capacity: Tons/BTUs of cooling (Can be estimated at 1.25 x 1 chiller) Preventive (Scheduled) Maintenance costs associated with HVAC Systems:
FY95: FY96: FY 97:
Any Non-scheduled replacement or repair of HVAC components in Last 5 years: (failures of chillers, motors, shafts, fans, etc.)
Component: Age of component if known: Direct Repair/Replacement Costs: Down time of machinery: (hours or days) Reason for failure if known: Was scheduled maintenance performed on the component as required: (yes or no) Major problems associated with downtime: (Comfort, lost productivity, temporary cancellation of services, etc.) Did Maintenance warn you of possible breakdown: (yes or no)
Facility Point of Contact: Phone Number: e-mail address:
Thank you in advance and again you can reach me at:
[email protected] Phone 352-335-5802 (call anytime)
Jon Yow 3800 SW 34th Street. Apt H-66 Gainesville, Florida
63
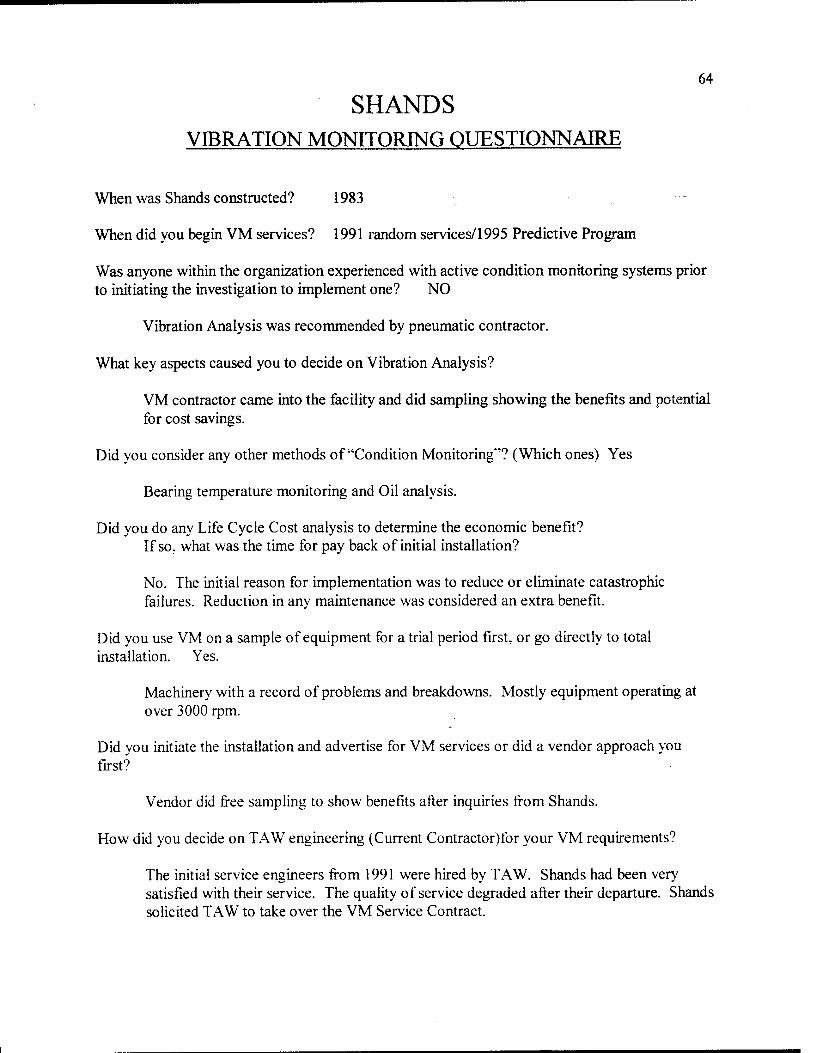
64
SHANDS VIBRATION MONITORING QUESTIONNAIRE
When was Shands constructed? 1983
When did you begin VM services? 1991 random services/1995 Predictive Program
Was anyone within the organization experienced with active condition monitoring systems prior to initiating the investigation to implement one? NO
Vibration Analysis was recommended by pneumatic contractor.
What key aspects caused you to decide on Vibration Analysis?
VM contractor came into the facility and did sampling showing the benefits and potential for cost savings.
Did you consider any other methods of "Condition Monitoring"? (Which ones) Yes
Bearing temperature monitoring and Oil analysis.
Did you do any Life Cycle Cost analysis to determine the economic benefit? If so. what was the time for pay back of initial installation?
No. The initial reason for implementation was to reduce or eliminate catastrophic failures. Reduction in any maintenance was considered an extra benefit.
Did you use VM on a sample of equipment for a trial period first, or go directly to total installation. Yes.
Machinery with a record of problems and breakdowns. Mostly equipment operating at over 3000 rpm.
Did you initiate the installation and advertise for VM services or did a vendor approach you first?
Vendor did free sampling to show benefits after inquiries from Shands.
How did you decide on TAW engineering (Current Contractor)for your VM requirements?
The initial service engineers from 1991 were hired by TAW. Shands had been very satisfied with their service. The quality of service degraded after their departure. Shands solicited TAW to take over the VM Service Contract.
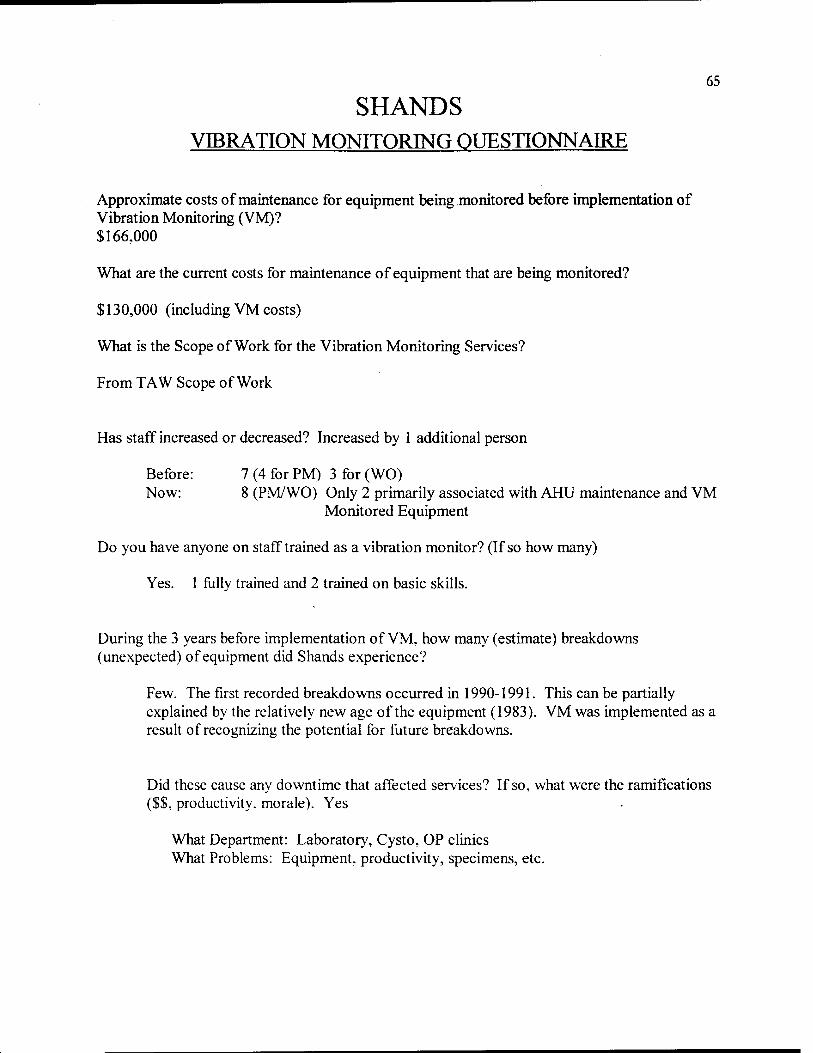
65
SHANDS VIBRATION MONITORING QUESTIONNAIRE
Approximate costs of maintenance for equipment being monitored before implementation of Vibration Monitoring (VM)? $166,000
What are the current costs for maintenance of equipment that are being monitored?
$130,000 (including VM costs)
What is the Scope of Work for the Vibration Monitoring Services?
From TAW Scope of Work
Has staff increased or decreased? Increased by 1 additional person
Before: 7 (4 for PM) 3 for (WO) Now: 8 (PM/WO) Only 2 primarily associated with AHU maintenance and VM
Monitored Equipment
Do you have anyone on staff trained as a vibration monitor? (If so how many)
Yes. 1 fully trained and 2 trained on basic skills.
During the 3 years before implementation of VM, how many (estimate) breakdowns (unexpected) of equipment did Shands experience?
Few. The first recorded breakdowns occurred in 1990-1991. This can be partially explained by the relatively new age of the equipment (1983). VM was implemented as a result of recognizing the potential for future breakdowns.
Did these cause any downtime that affected services? If so, what were the ramifications ($$, productivity, morale). Yes
What Department: Laboratory, Cysto, OP clinics What Problems: Equipment, productivity, specimens, etc.
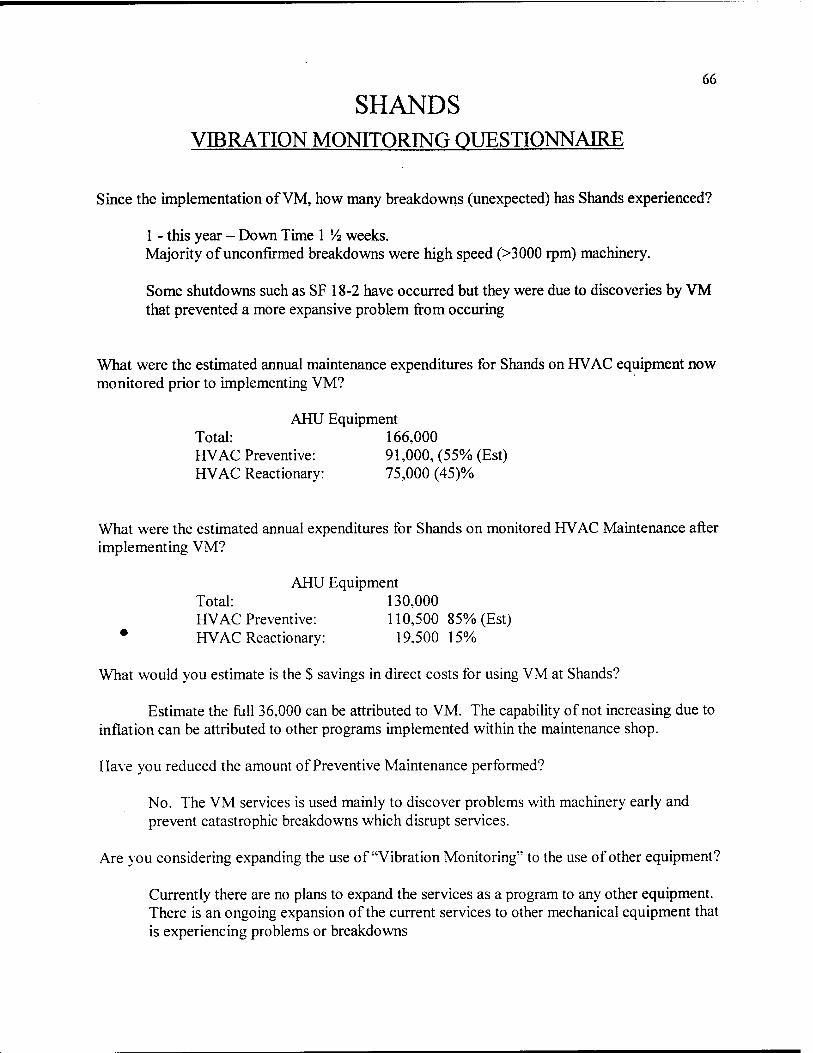
66
SHANDS VIBRATION MONITORING QUESTIONNAIRE
Since the implementation of VM, how many breakdowns (unexpected) has Shands experienced?
1 - this year - Down Time 1 !4 weeks. Majority of unconfirmed breakdowns were high speed (>3000 rpm) machinery.
Some shutdowns such as SF 18-2 have occurred but they were due to discoveries by VM that prevented a more expansive problem from occuring
What were the estimated annual maintenance expenditures for Shands on HVAC equipment now monitored prior to implementing VM?
AHU Equipment Total: 166,000 HVAC Preventive: 91,000, (55% (Est) HVAC Reactionary: 75,000 (45)%
What were the estimated annual expenditures for Shands on monitored HVAC Maintenance after implementing VM?
AHU Equipment Total: 130,000 HVAC Preventive: 110,500 85% (Est)
• HVAC Reactionary: 19,500 15%
What would you estimate is the $ savings in direct costs for using VM at Shands?
Estimate the full 36,000 can be attributed to VM. The capability of not increasing due to inflation can be attributed to other programs implemented within the maintenance shop.
Have you reduced the amount of Preventive Maintenance performed?
No. The VM services is used mainly to discover problems with machinery early and prevent catastrophic breakdowns which disrupt services.
Are you considering expanding the use of "Vibration Monitoring" to the use of other equipment?
Currently there are no plans to expand the services as a program to any other equipment. There is an ongoing expansion of the current services to other mechanical equipment that is experiencing problems or breakdowns
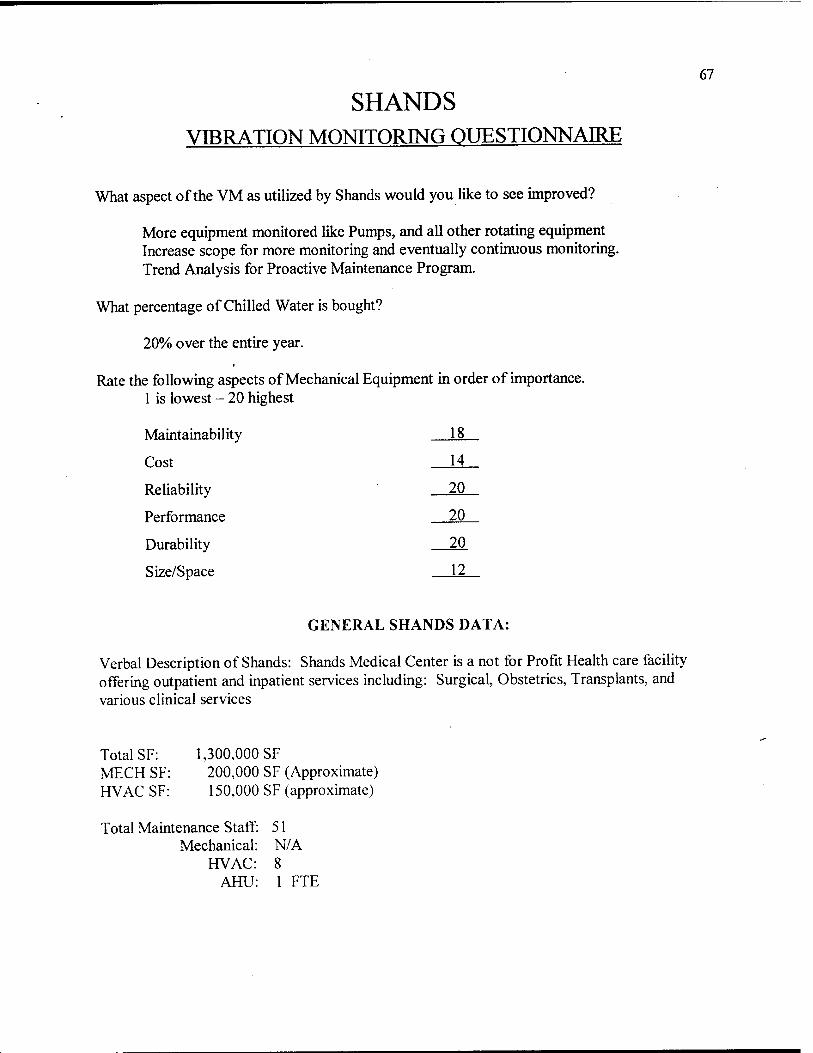
67
SHANDS VIBRATION MONITORING QUESTIONNAIRE
What aspect of the VM as utilized by Shands would you like to see improved?
More equipment monitored like Pumps, and all other rotating equipment Increase scope for more monitoring and eventually continuous monitoring. Trend Analysis for Proactive Maintenance Program.
What percentage of Chilled Water is bought?
20% over the entire year.
Rate the following aspects of Mechanical Equipment in order of importance. 1 is lowest - 20 highest
Maintainability 18
Cost 14
Reliability 20
Performance 20
Durability 20
Size/Space 12
GENERAL SHANDS DATA:
Verbal Description of Shands: Shands Medical Center is a not for Profit Health care facility offering outpatient and inpatient services including: Surgical, Obstetrics, Transplants, and various clinical services
Total SF: 1,300,000 SF MECH SF: 200,000 SF (Approximate) HVAC SF: 150,000 SF (approximate)
Total Maintenance Staff: 51 Mechanical: N/A
HVAC: 8 AHU: 1 FTE
APPENDIX B VIBRATION MONITORING VENDORS
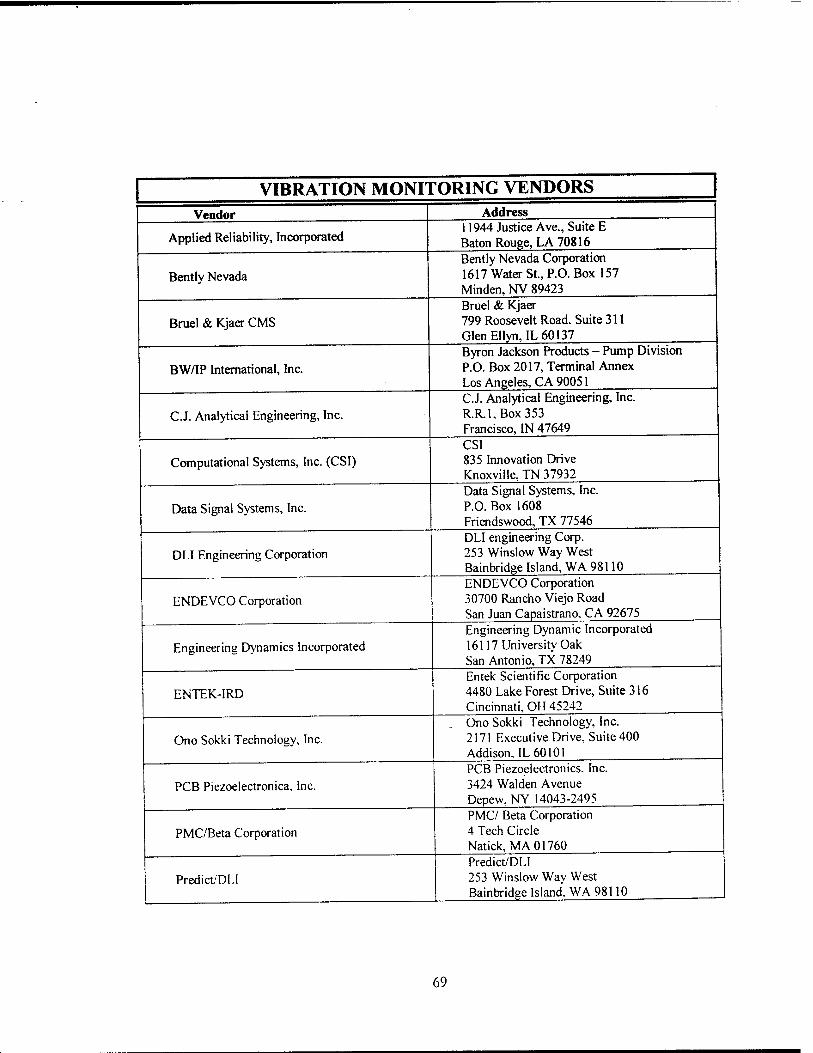
VIBRATION MONITORING VENDORS Vendor
Applied Reliability, Incorporated
Bently Nevada
Bruel & Kjaer CMS
BW/IP Internarional, Inc.
C.J. Analytical Engineering, Inc.
Computational Systems, Inc. (CSI)
Data Signal Systems, Inc.
DLI Engineering Corporation
ENDEVCO Corporation
Engineering Dynamics Incorporated
ENTEK-IRD
Ono Sokki Technology, Inc.
PCB Piezoelectronica, Inc.
PMC/Beta Corporation
Predict/DI.I
Address 11944 Justice Ave., Suite E Baton Rouge, LA 70816 Bently Nevada Corporation 1617 Water St., P.O. Box 157 Minden, NV 89423 Bruel & Kjaer 799 Roosevelt Road. Suite 311 Glen Ellyn, IL 60137 Byron Jackson Products - Pump Division P.O. Box 2017, Terminal Annex Los Angeles, CA 90051 C.J. Analytical Engineering, Inc. R.Rl,Box353 Francisco, IN 47649 CSI 835 Innovation Drive Knoxville, TN 37932 Data Signal Systems, Inc. P.O.Box 1608 Friendswood, TX 77546 DLI engineering Corp. 253 Winslow Way West Bainbridge Island, WA 98110 ENDEVCO Corporation 30700 Rancho Viejo Road San Juan Capaistrano. CA 92675 Engineering Dynamic Incorporated 16117 University Oak San Antonio, TX 78249 Entek Scientific Corporation 4480 Lake Forest Drive, Suite 316 Cincinnati, OH 45242 Ono Sokki Technology, Inc. 2171 Executive Drive, Suite 400 Addison.IL 60101 PCB Piezoelectronics. Inc. 3424 Waiden Avenue Depew, NY 14043-2495 PMC/ Beta Corporation 4 Tech Circle Natick, MA 01760 Predict/DLI 253 Winslow Way West Bainbridee Island. WA 98110
69
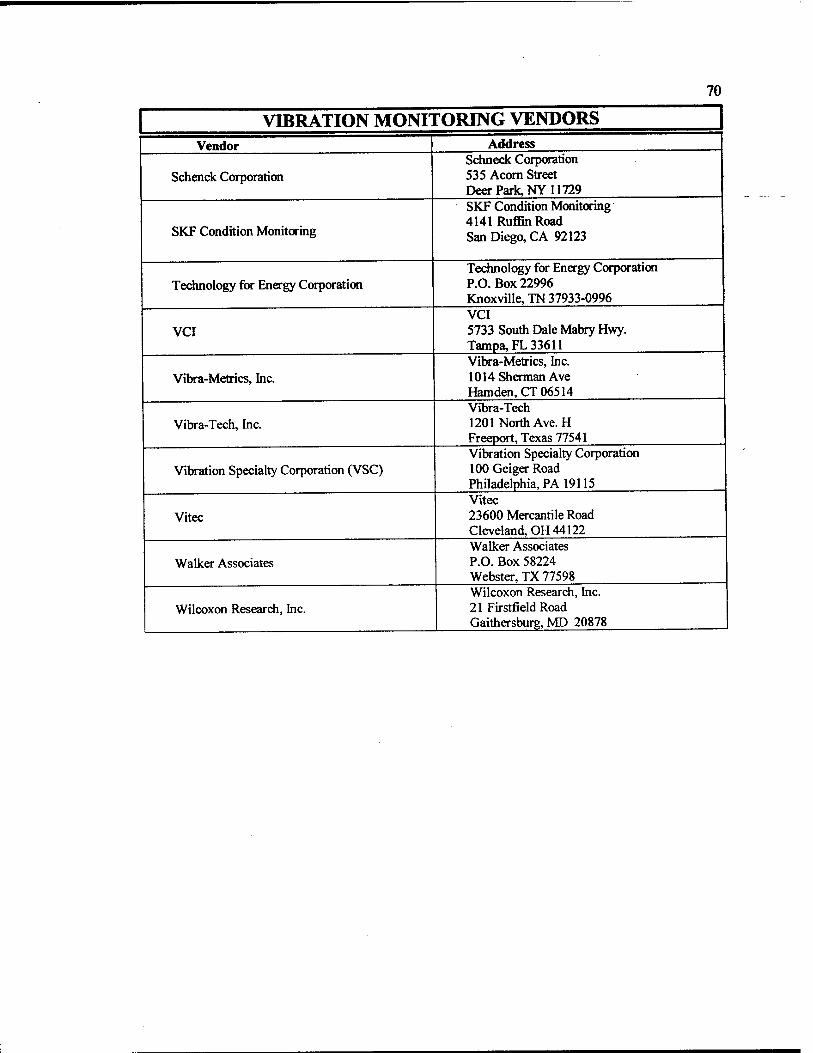
70
VIBRATION MONITORING VENDORS Vendor
Schenck Corporation
SKF Condition Monitoring
Technology for Energy Corporation
VCI
Vibra-Metrics, Inc.
Vibra-Tech, Inc.
Vibration Specialty Corporation (VSC)
Vitec
Walker Associates
Wilcoxon Research, Inc.
Address Schneck Corporation 535 Acorn Street Peer Park, NY 11729 SKF Condition Monitoring 4141 Ruffin Road San Diego, CA 92123
Technology for Energy Corporation P.O. Box 22996 Knoxville, TN 37933-0996 VCI 5733 South Dale Mabry Hwy. Tampa,FL 33611 Vibra-Metrics, Inc. 1014 Sherman Ave Hamden,CT06514 Vibra-Tech 1201 North Ave. H Freeport, Texas 77541 Vibration Specialty Corporation 100 Geiger Road Philadelphia, PA 19115 Vitec 23600 Mercantile Road Cleveland, OH 44122 Walker Associates P.O. Box 58224 Webster, TX 77598 Wilcoxon Research, Inc. 21 Firstfield Road Gaithersburg, MD 20878
BIOGRAPHICAL SKETCH
Jon Yow graduated from Tennessee State University (TSU) in August 1986 with
a Bachelor of Science in Architectural Engineering. At TSU, he was selected as the most
outstanding architectural engineering student for both his sophomore and senior classes.
Following graduation he was commissioned as an officer by the United State Air
Force and worked as a project manager for the Air Force Surgeon General's Facilities
Division supervising the planning, programming, design, construction, and maintenance
of Air Force medical facilities. He has worked with facilities across the U.S., in Japan,
and in Korea.
In 1995, Captain Yow was competitively selected by the Air Force to attend
graduate school. He selected the University of Florida's M.E. Rinker Sr. School of
Building Construction and entered the graduate program in the Fall of 1996. Captain
Yow expects to graduate in Spring 1998 and will continue employment with the U.S. Air
Force as a Medical Facilities Liaison assigned to HQ Air Force Civil Engineering,
Pentagon, Washington D.C.
Captain Yow is currently a member of The National Fire Protection Association
(NFPA), Health Care Section, Health Facility Institute (HFI), American Society of
Hospital Engineers (ASHE), International Facility Manager's Association (IFMA),
American Society of Heating Refrigeration and Air Conditioning (ASHRAE), and the
Vibration Institute.
71