The role of insurance in the achievement of universal coverage within a developing country context:...
13
PROCEEDINGS Open Access The role of insurance in the achievement of universal coverage within a developing country context: South Africa as a case study Alex M van den Heever From Universal Coverage: Can We Guarantee Health For All? Bandar Sunway, Malaysia. 3-4 October 2011 Abstract Background: Achieving universal coverage as an objective needs to confront the reality of multiple mechanisms, with healthcare financing and provision occurring in both public and private settings. South Africa has both large and mature public and private health systems offering useful insights into how they can be effectively harmonized to optimise coverage. Private healthcare in South Africa has also gone through many phases and regulatory regimes which, through careful review, can help identify potential policy frameworks that can optimise their ability to deepen coverage in a manner that complements the basic coverage of public arrangements. Research question: Using South Africa as a case study, this review examines whether private health systems are susceptible to regulation and therefore able to support an extension and deepening of coverage when complementing a pre-existing publicly funded and delivered health system? Methods: The approach involves a review of different stages in the development of the South African private health system and its response to policy changes. The focus is on the time-bound characteristics of the health system and associated policy responses and opportunities. A distinction is consequently made between the early, largely unregulated, phases of development and more mature phases with alternative regulatory regimes. Results: The private health system in South Africa has played an important supplementary role in achieving universal coverage throughout its history, but more especially in the post-Apartheid period. However, the quality of this role has been erratic, influenced predominantly by policy vacillation. The private system expanded rapidly during the 1980s mainly due to the pre-existence of a mature health insurance system and a weakening public hospital system which could accommodate and facilitate an increased demand for private hospital services. This growth served to expand commercial interest in health insurance, in the form of regulated medical schemes, which until this point took the form of non-commercial occupational (employer-based) schemes. During the 1980s government acquiesced to industry lobbies arguing for the deregulation of health insurance from 1989, with an extreme deregulation occurring in 1994, evidently in anticipation of the change of government associated with the democratic dispensation. Dramatic unintended consequences followed, with substantial increases in provider and funder costs coinciding with uncontrolled discrimination against poor health risks. Against significant industry opposition, including legal challenges, partial re-regulation took effect from 2000 which removed the discretion of schemes to discriminate against poor health risks. This included: the implementation of a strong regulator of health insurance; the establishment of one allowable vehicle able to provide health insurance; open enrolment, whereby schemes could not refuse membership applications; mandatory minimum benefit Correspondence: [email protected] Old Mutual Chair of Social Security Policy Management and Administration, Graduate School of Public and development Management, University of the Witwatersrand, Johannesburg, South Africa van den Heever BMC Public Health 2012, 12(Suppl 1):S5 http://www.biomedcentral.com/1471-2458/12/S1/S5 © 2012 van den Heever; licensee BioMed Central Ltd. This is an Open Access article distributed under the terms of the Creative Commons Attribution License (http://creativecommons.org/licenses/by/2.0), which permits unrestricted use, distribution, and reproduction in any medium, provided the original work is properly cited.
Transcript of The role of insurance in the achievement of universal coverage within a developing country context:...

PROCEEDINGS Open Access
The role of insurance in the achievement ofuniversal coverage within a developing countrycontext: South Africa as a case studyAlex M van den Heever
From Universal Coverage: Can We Guarantee Health For All?Bandar Sunway, Malaysia. 3-4 October 2011
Abstract
Background: Achieving universal coverage as an objective needs to confront the reality of multiple mechanisms,with healthcare financing and provision occurring in both public and private settings. South Africa has both largeand mature public and private health systems offering useful insights into how they can be effectively harmonizedto optimise coverage. Private healthcare in South Africa has also gone through many phases and regulatoryregimes which, through careful review, can help identify potential policy frameworks that can optimise their abilityto deepen coverage in a manner that complements the basic coverage of public arrangements.
Research question: Using South Africa as a case study, this review examines whether private health systems aresusceptible to regulation and therefore able to support an extension and deepening of coverage whencomplementing a pre-existing publicly funded and delivered health system?
Methods: The approach involves a review of different stages in the development of the South African privatehealth system and its response to policy changes. The focus is on the time-bound characteristics of the healthsystem and associated policy responses and opportunities. A distinction is consequently made between the early,largely unregulated, phases of development and more mature phases with alternative regulatory regimes.
Results: The private health system in South Africa has played an important supplementary role in achievinguniversal coverage throughout its history, but more especially in the post-Apartheid period. However, the quality ofthis role has been erratic, influenced predominantly by policy vacillation.The private system expanded rapidly during the 1980s mainly due to the pre-existence of a mature healthinsurance system and a weakening public hospital system which could accommodate and facilitate an increaseddemand for private hospital services. This growth served to expand commercial interest in health insurance, in theform of regulated medical schemes, which until this point took the form of non-commercial occupational(employer-based) schemes. During the 1980s government acquiesced to industry lobbies arguing for thederegulation of health insurance from 1989, with an extreme deregulation occurring in 1994, evidently inanticipation of the change of government associated with the democratic dispensation. Dramatic unintendedconsequences followed, with substantial increases in provider and funder costs coinciding with uncontrolleddiscrimination against poor health risks.Against significant industry opposition, including legal challenges, partial re-regulation took effect from 2000 whichremoved the discretion of schemes to discriminate against poor health risks. This included: the implementation ofa strong regulator of health insurance; the establishment of one allowable vehicle able to provide health insurance;open enrolment, whereby schemes could not refuse membership applications; mandatory minimum benefit
Correspondence: [email protected] Mutual Chair of Social Security Policy Management and Administration,Graduate School of Public and development Management, University of theWitwatersrand, Johannesburg, South Africa
van den Heever BMC Public Health 2012, 12(Suppl 1):S5http://www.biomedcentral.com/1471-2458/12/S1/S5
© 2012 van den Heever; licensee BioMed Central Ltd. This is an Open Access article distributed under the terms of the CreativeCommons Attribution License (http://creativecommons.org/licenses/by/2.0), which permits unrestricted use, distribution, andreproduction in any medium, provided the original work is properly cited.
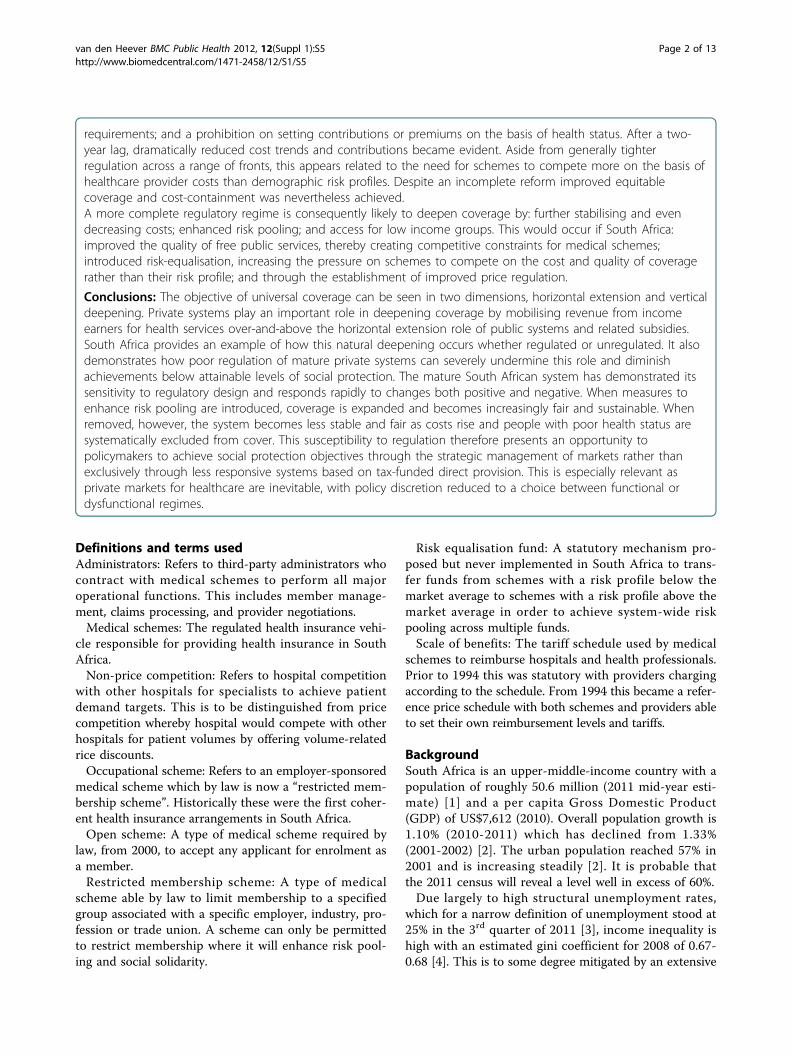
requirements; and a prohibition on setting contributions or premiums on the basis of health status. After a two-year lag, dramatically reduced cost trends and contributions became evident. Aside from generally tighterregulation across a range of fronts, this appears related to the need for schemes to compete more on the basis ofhealthcare provider costs than demographic risk profiles. Despite an incomplete reform improved equitablecoverage and cost-containment was nevertheless achieved.A more complete regulatory regime is consequently likely to deepen coverage by: further stabilising and evendecreasing costs; enhanced risk pooling; and access for low income groups. This would occur if South Africa:improved the quality of free public services, thereby creating competitive constraints for medical schemes;introduced risk-equalisation, increasing the pressure on schemes to compete on the cost and quality of coveragerather than their risk profile; and through the establishment of improved price regulation.
Conclusions: The objective of universal coverage can be seen in two dimensions, horizontal extension and verticaldeepening. Private systems play an important role in deepening coverage by mobilising revenue from incomeearners for health services over-and-above the horizontal extension role of public systems and related subsidies.South Africa provides an example of how this natural deepening occurs whether regulated or unregulated. It alsodemonstrates how poor regulation of mature private systems can severely undermine this role and diminishachievements below attainable levels of social protection. The mature South African system has demonstrated itssensitivity to regulatory design and responds rapidly to changes both positive and negative. When measures toenhance risk pooling are introduced, coverage is expanded and becomes increasingly fair and sustainable. Whenremoved, however, the system becomes less stable and fair as costs rise and people with poor health status aresystematically excluded from cover. This susceptibility to regulation therefore presents an opportunity topolicymakers to achieve social protection objectives through the strategic management of markets rather thanexclusively through less responsive systems based on tax-funded direct provision. This is especially relevant asprivate markets for healthcare are inevitable, with policy discretion reduced to a choice between functional ordysfunctional regimes.
Definitions and terms usedAdministrators: Refers to third-party administrators whocontract with medical schemes to perform all majoroperational functions. This includes member manage-ment, claims processing, and provider negotiations.Medical schemes: The regulated health insurance vehi-
cle responsible for providing health insurance in SouthAfrica.Non-price competition: Refers to hospital competition
with other hospitals for specialists to achieve patientdemand targets. This is to be distinguished from pricecompetition whereby hospital would compete with otherhospitals for patient volumes by offering volume-relatedrice discounts.Occupational scheme: Refers to an employer-sponsored
medical scheme which by law is now a “restricted mem-bership scheme”. Historically these were the first coher-ent health insurance arrangements in South Africa.Open scheme: A type of medical scheme required by
law, from 2000, to accept any applicant for enrolment asa member.Restricted membership scheme: A type of medical
scheme able by law to limit membership to a specifiedgroup associated with a specific employer, industry, pro-fession or trade union. A scheme can only be permittedto restrict membership where it will enhance risk pool-ing and social solidarity.
Risk equalisation fund: A statutory mechanism pro-posed but never implemented in South Africa to trans-fer funds from schemes with a risk profile below themarket average to schemes with a risk profile above themarket average in order to achieve system-wide riskpooling across multiple funds.Scale of benefits: The tariff schedule used by medical
schemes to reimburse hospitals and health professionals.Prior to 1994 this was statutory with providers chargingaccording to the schedule. From 1994 this became a refer-ence price schedule with both schemes and providers ableto set their own reimbursement levels and tariffs.
BackgroundSouth Africa is an upper-middle-income country with apopulation of roughly 50.6 million (2011 mid-year esti-mate) [1] and a per capita Gross Domestic Product(GDP) of US$7,612 (2010). Overall population growth is1.10% (2010-2011) which has declined from 1.33%(2001-2002) [2]. The urban population reached 57% in2001 and is increasing steadily [2]. It is probable thatthe 2011 census will reveal a level well in excess of 60%.Due largely to high structural unemployment rates,
which for a narrow definition of unemployment stood at25% in the 3rd quarter of 2011 [3], income inequality ishigh with an estimated gini coefficient for 2008 of 0.67-0.68 [4]. This is to some degree mitigated by an extensive
van den Heever BMC Public Health 2012, 12(Suppl 1):S5http://www.biomedcentral.com/1471-2458/12/S1/S5
Page 2 of 13

system of social assistance grants reaching upward of 15million people by 2011, with expenditure equivalent to3.6% of Gross Domestic Product (GDP) [5].South Africa’s burden of disease has deteriorated since
1994 due largely to HIV and AIDS and associated co-morbidities such as tuberculosis (TB). In 2011 HIV andAIDS prevalence is estimated at 10.6%, with life expec-tancy for males and females at 54.9 and 59.1 respectively[1]. However, maternal mortality ratios (MMRs) wellbelow expectations for country of South Africa’s level ofdevelopment, estimated at 300 out of 100,000 live birthswith a confidence interval of 15 to 500 [6], suggest thatpublic sector clinical services are underperforming atexisting levels of investment [7]. Although 43.7% of allmaternal deaths involve AIDS, patient-related avoidablefactors were recorded in 46.5% of maternal deaths with38.4% clearly avoidable [8]. Human Rights Watch inves-tigations have also revealed that pregnant women areabused by nurses in public facilities with inadequate for-mal accountability mechanisms to protect patients [9].South Africa has large public and private health systems,
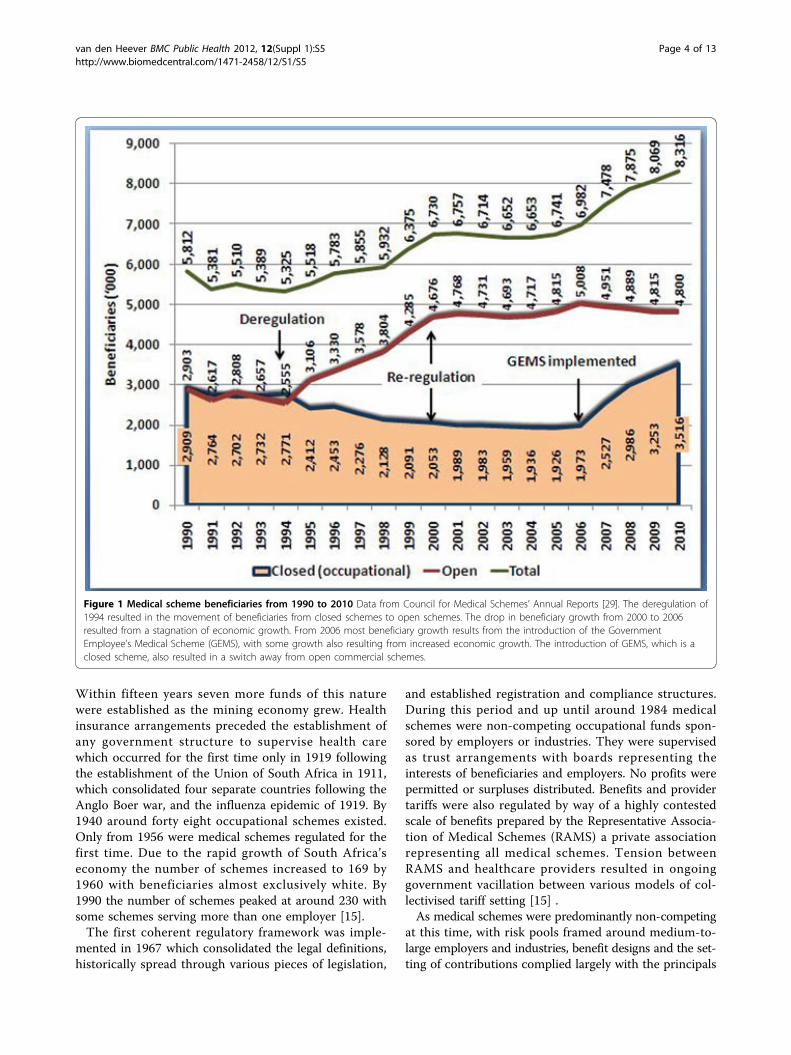
with the former funded by general taxes for nine provin-cial health departments and the national department, withspending equivalent to 3.8% of GDP in 2010 [10], and thelatter through regulated voluntary not-for-profit privatehealth insurance arrangements, referred to as medicalschemes, equivalent to 3.4% of GDP in 2010 [11]. In 2010there were 8.3 million medical scheme beneficiariesequivalent to 16.6% of the total population. This numberis also growing continuously (figure 1). Overall healthexpenditure is consequently around 8.8% of GDP includ-ing out-of-pocket (OOP) expenditure estimated at 1.5% ofGDP in 2009 [12].Out-of-pocket expenditure, which is well within inter-
national norms, predominantly occurs in the top incomedecile, although spending on private general practitionersand specialists occurs across all income groups despiteaccess to free public services [13]. As public hospital ser-vices are free for low-income groups while medicalschemes prioritise insurance for catastrophic expenses,most OOP expenditure is for basic doctor-based primarycare services and some medicines.Given this configuration of protection, South Africa
technically complies with the goal of universal coverageas a comprehensive package of health services is availableon a pre-paid basis either through the public sector orregulated health insurance (medical schemes). However,poor policy development and implementation in thepost-apartheid period (from 1994) have exacerbatedrather than addressed historical institutional weaknesses[7,9,30].Government critics argue that inadequate atten-tion has been given to the correct mix of institutionalmechanisms to permit both the public and private sys-tems to realise their full potential. Whereas much can be
said about the public system, this article focuses exclu-sively on the potential role of the private system and itscontribution to extending and deepening universalcoverage.Whereas the role of public subsidies, whether to fund
in-kind health services or to finance private provision, isto maximise the horizontal extension of health servicesto those without adequate income, privately fundedhealthcare complements this role through the mobilisa-tion of additional revenue. This funding can extend thereach of government-subsidised services where incomeearners use private services, or fund supplementary pro-vision where coverage is highly rationed. South Africa’sexperience is more consistent with the former. However,full advantage may not have been taken of the opportu-nities presented over time. This review therefore makesuse of an historical analysis of the South African privatehealth system and its regulation to identify whether pri-vate markets are susceptible to intervention such thatcoverage is extended and deepened in a sustainablemanner.
Research questionUsing South Africa as a case study, this review examineswhether private health systems are susceptible to regula-tion and therefore able to support an extension and dee-pening of coverage when complementing a pre-existingpublicly funded and delivered health system?
MethodsThe approach involves a review of different stages in thedevelopment of the South African private health systemand its response to policy changes. The focus is on thetime-bound characteristics of the health system andassociated policy responses and opportunities.The review is divided broadly into two periods:• From 1889 to 1999: where the system moves from
an immature non-commercial regime into a highly com-mercialised insurance and provision in the final tenyears and where the latter period is heavily affected by amajor deregulation of health insurance; and• From 2000 to 2010: where the mature system is sub-
jected to new regulatory interventions.The periods and regulatory regimes are evaluated quali-
tatively with the relevant drivers of change identified,focusing on their susceptibility to regulatory interventions.
The history of medical schemes to 1999The emergence of occupational and industry schemesWhat are today regulated in law as medical schemes hadtheir origins in various forms of occupational healthinsurance beginning as early as 1889 with the De BeersConsolidated Mines Limited Benefit Society BenefitSociety within the territory of what is now South Africa.
van den Heever BMC Public Health 2012, 12(Suppl 1):S5http://www.biomedcentral.com/1471-2458/12/S1/S5
Page 3 of 13
Within fifteen years seven more funds of this naturewere established as the mining economy grew. Healthinsurance arrangements preceded the establishment ofany government structure to supervise health carewhich occurred for the first time only in 1919 followingthe establishment of the Union of South Africa in 1911,which consolidated four separate countries following theAnglo Boer war, and the influenza epidemic of 1919. By1940 around forty eight occupational schemes existed.Only from 1956 were medical schemes regulated for thefirst time. Due to the rapid growth of South Africa’seconomy the number of schemes increased to 169 by1960 with beneficiaries almost exclusively white. By1990 the number of schemes peaked at around 230 withsome schemes serving more than one employer [15].The first coherent regulatory framework was imple-
mented in 1967 which consolidated the legal definitions,historically spread through various pieces of legislation,
and established registration and compliance structures.During this period and up until around 1984 medicalschemes were non-competing occupational funds spon-sored by employers or industries. They were supervisedas trust arrangements with boards representing theinterests of beneficiaries and employers. No profits werepermitted or surpluses distributed. Benefits and providertariffs were also regulated by way of a highly contestedscale of benefits prepared by the Representative Associa-tion of Medical Schemes (RAMS) a private associationrepresenting all medical schemes. Tension betweenRAMS and healthcare providers resulted in ongoinggovernment vacillation between various models of col-lectivised tariff setting [15] .As medical schemes were predominantly non-competing
at this time, with risk pools framed around medium-to-large employers and industries, benefit designs and the set-ting of contributions complied largely with the principals
Figure 1 Medical scheme beneficiaries from 1990 to 2010 Data from Council for Medical Schemes’ Annual Reports [29]. The deregulation of1994 resulted in the movement of beneficiaries from closed schemes to open schemes. The drop in beneficiary growth from 2000 to 2006resulted from a stagnation of economic growth. From 2006 most beneficiary growth results from the introduction of the GovernmentEmployee’s Medical Scheme (GEMS), with some growth also resulting from increased economic growth. The introduction of GEMS, which is aclosed scheme, also resulted in a switch away from open commercial schemes.
van den Heever BMC Public Health 2012, 12(Suppl 1):S5http://www.biomedcentral.com/1471-2458/12/S1/S5
Page 4 of 13

of social solidarity. Contributions were differentiated on thebasis of income, with higher income groups paying more.Differentiation on the basis of health status was prohibitedby law. Schemes also needed to comply with a system ofmandatory minimum benefits based on the scale of bene-fits, which specified the proportion of reimbursementrequired of a consultation, procedure, or tariff. From 1980schemes were required to pay in full any invoice submitteddirectly by registered medical practitioners compliant withthe scale of benefits. Where an invoice exceeded the scaleof benefits schemes reimbursed the member only afterthey had initially settled the account. This mechanismserved as an incentive for healthcare service providers tocomply with the scale of benefits as members could beslow and irregular in settling accounts [15].Over this period medical schemes primarily reim-
bursed the expenses of private health professionals andhospital services located in the public sector. Access topublic hospitals was, and still is, subject to a means testaffecting everyone over the tax threshold and quite afew below [15]. For anyone over the tax threshold amedical scheme was therefore essential to avoid cata-strophic health expenses associated with private specia-list and public hospital services.To encourage employers to provide medical scheme
coverage a tax subsidy was available where an employerpaid the medical scheme contribution. This has sincebeen altered to an allowable deduction in the hands of anemployee to cater for the self-employed. All low-incomegroups have always had access to a free public health ser-vice which, apart from a few exceptions, was formallysegregated on the basis of race from 1948. Interestingly,due to this configuration white taxpayers did not havefree access to public services, although they did have aportion of their contribution indirectly subsidisedthrough the tax rebate.
The emergence of private hospitalsInternational sanctions, together with the financing ofwars in Angola and Mozambique, reduced South Afri-ca’s economic growth rate from 1982 with a negativeimpact on government finances. Roughly from that per-iod the tax-based funding of public health servicesbegan to worsen. This coincided with the emergence ofprivate hospitals owned largely by medical specialistsalready working in the public sector. Many specialistsworking part-time in the private sector during the 1980swere also in a position to divert medical scheme coveredpatients into their private practices and associated pri-vate hospital services. By the end of the 1980s thedecline in the quality of public hospitals together withthe financial incentives of private specialists had helpedthe rapid creation of a fairly substantial private doctor-owned hospital system.
From 1986 to 1989 private hospitals increased from 65(6,125 beds or 5% of the total) to 101 (10,908 beds or 9%of the total). By 2010 private hospitals had increased to216 with 31,067 beds or 26% of the total. The number ofpublic hospital beds have however always far exceededthe private sector with 117 842 (91% of all beds) availablein 1986. They have however declined to 88 920 beds (or74% of the total) by 2010. The decline in the number ofpublic sector beds was consequently matched byincreased beds in the private sector (Table 1).The shift of treatment into private hospitals dramati-
cally increased the cost of medical schemes as publichospitals did not charge full cost recovery (implicitlysubsidising medical scheme members) and had noincentives to over-service. Private hospitals howeverpriced for both cost-recovery and profit, and benefitedfrom the incentives of private specialists to over-service.The resulting cost changes during the 1980s began toalter the market dynamics of medical schemes. Theyalso increased the turnover and complexity of funders,incentivising increased commercial interest in the provi-sion of health insurance.
The emergence of commercial competing open schemesDuring the 1980s medical scheme administrators, whocontracted with occupational medical schemes to managetheir operations, developed sufficient expertise in healthinsurance to expand into commercial insurance modelsindependent of employers. Coverage was offered to multi-ple employers reflecting a natural evolution of the system.However, they were constrained by the occupational-scheme orientation of the legislative framework. Commer-cial schemes consequently lobbied for the ability to designcontribution tables for different employers and even indi-viduals, while keeping benefit arrangements common. Forthis to happen the strict legislative regime, which limitedthe manner in which contributions could be set, cameunder pressure from the commercial arm of medicalschemes, the third-party administrators contracted toschemes to perform their operational functions. Proposalsto liberalise the health insurance market surfaced from
Table 1 Private and public hospitals and bed estimatesfrom 1976 to 2010
Year Private Public
Hospitals Beds Hospitals Beds
1976 251 2 3461
1986 651 6 1252 117 8423
1989 1011 10 9361
19984 162 20 908 343 107 634
20105 216 31 067 410 88 9201 Hospital Association of South Africa [32], 2 Estimated using the bed tohospital ratio for 1976 from the other data in the table, 3Estimated fromZwaranstein et al [33], 4Health Systems Trust [34], 5Health Systems Trust [35].
van den Heever BMC Public Health 2012, 12(Suppl 1):S5http://www.biomedcentral.com/1471-2458/12/S1/S5
Page 5 of 13

1984, couched in the pro-market language prevalent at thetime, which argued that this would make medical schemesmore affordable. The objectives underpinning the amend-ments to the Medical Schemes Act of 1967 stressed these“positive” intentions: “To have a medical scheme theordinary person will be able to afford”; and “To preventthe socialisation of medicine” [15]. This led to the first sig-nificant deregulation of health insurance in South Africa.
Medical scheme deregulation – the period from 1989 to1999In accepting the “pro-market” arguments, the ability toset premiums on the basis of the risk of claiming wereimplemented by government in 1989. From this periodcontributions could be set on the grounds of the num-ber of dependents, income, age, geographic area, claimsexperience, extent of cover provided, period of member-ship, and the size of the participating group [15].This remarkable deregulation however was not suffi-
cient to permit commercial or open medical schemes(which serve multiple employers and sometimes indivi-duals) to emerge. The requirement to comply with man-datory minimum benefits determined in relation to thescale of benefits constrained their ability to undercut theoccupational schemes. Risk rating was not enough.Industry lobbies successfully influenced the govern-
ment to implement a material further deregulation from1 January 1994, just prior to the new democratic dispen-sation that would bring in a new government from May1994. This removed the requirement for mandatoryminimum benefits [15]. In 1993 government also mademembership of a medical scheme voluntary for govern-ment employees, allowing them to choose their ownopen scheme. The former mandatory government-spon-sored schemes, of which there were four, were conse-quently converted into open commercial schemes.Three other public sector medical schemes remainedclosed and mandatory: the police force scheme; the par-liamentary scheme which includes all judges; and thescheme for correctional services (prisons) staff.The changes rapidly transformed the system of medical
schemes with inter alia.: a substantial shift away fromoccupational schemes into open commercial schemes(from 50% of all beneficiaries in 1994 to over 70% by1999) (figure 1); the use of illegal commissions to incenti-vise employers to close their occupational schemes andshift to open schemes [16]; and the explicit discrimina-tion against older and sicker members within open com-peting medical schemes [15].Price competition between commercial medical schemes
occurred on the basis of risk-selection (the selection ofbeneficiaries on the basis of health status) and risk-rating(the pricing of contributions on the basis of health status).Contributions paid through open schemes were flat-rate
(apart from variations due to health status) and eliminatedthe income cross-subsidies that characterised occupationalschemes. Social solidarity principles inherent within medi-cal schemes were consequently wiped out in a mere fiveyears.Although medical schemes could not lawfully distribute
profits, open commercial medical schemes, dominated bytheir administration companies, began introducing rein-surance contracts to siphon off underwriting surplusesinto entities, that colluded with administrators or wereowned by them, and to pay brokers [17]. Anothermechanism to circumvent the laws prohibiting the distri-bution of profits and the funding of brokers involved thecommission-based co-selling of short- and long-term (forprofit) health insurance products packaged together withmedical schemes in collusion with the administrators.This intensified the commercial incentives to discrimi-nate against people and groups with a higher risk ofclaiming benefits.
Risk-based scheme competition and costsContradicting the apparent rationale for deregulation,that price competition through risk rating (and selec-tion) will bring down prices and increase membership,the opposite occurred. The period from 1994 saw atrend break in medical scheme per capita contributionincreases (figure 2). Non-health care expenditure(administration expenses and net reinsurance losses) bymedical schemes also demonstrate a break in trendfrom 1994 [15]. Importantly, new expenses over-and-above basic administration suddenly made their appear-ance from 1994.Over this period regulation involved little more than
the registration of medical schemes and some low-keyprudential supervision. The regulator itself was a low-level official in the National Department of Health witha staff of seven, none of whom were professionally qua-lified [18]. Although a Council existed to supervise theregulator, the majority of appointments were of indivi-duals working directly within medical schemes or medi-cal scheme administrators. It could be argued that themarket was essentially self-regulated at this stage.Dramatic contribution increases from 1994 to 1999
consequently resulted from two sources: trend changesin the cost of healthcare services; and trend changes innon-health costs. Whereas the latter is explained by thelatitude given to medical schemes and their administra-tors to profit from schemes, the former was driven largelyby the nature of scheme price competition. As schemescould compete by passing risk onto members and benefi-ciaries (through risk-selection and risk-rating) they hadno incentive to control underlying medical expenses. Theinelastic nature of demand for medical scheme coveragefurthermore meant that cost increases did not result in
van den Heever BMC Public Health 2012, 12(Suppl 1):S5http://www.biomedcentral.com/1471-2458/12/S1/S5
Page 6 of 13

membership declines. Competing medical schemes there-fore faced no market-related penalties for passing costincreases on to contributors, provided they kept theirincreases in line with those of other schemes. The pricingstrategies therefore focused exclusively on gaining marketshare from occupational schemes rather than competi-tion amongst commercial schemes, further dulling incen-tives to be cost-efficient.The incentive-driven behavioural change of schemes
affected the behaviour of medical service providers dur-ing this period as schemes had little interest in seriouscost containment. Poor regulation of specialists from acompetition perspective allowed successful horizontalcollusion (between specialists) to foreclose earlyattempts by schemes in 1997 to introduce forms ofselective contracting [19]. Such scheme initiatives couldhave influenced subsequent hospital and specialist costtrends.
Whereas doctor-owned hospitals emerged during the1980s, corporate ownership of hospitals became a majortrend only during the 1990s, with significant and rapidmarket consolidation into three corporate groups by1999, a period of roughly ten years. Although the hospi-tal market was technically not an oligopoly in 1999, itwas a mere two years thereafter [16]. From 1994 onlythree hospital groups bought independent hospitals. Atsome point during the early 1990s a market powerthreshold was crossed which accelerated the consolida-tion by the three groups. (Figures 2 and 3).This market power was initially directed at indepen-
dent hospitals who were vulnerable to non-price compe-tition against the more revenue secure hospital groups.Their increasing and stable surpluses were used to chasedemand by competing for specialists rather than com-peting for patient volumes (demand) though price dis-counts. Specialists, who operate independently of
Figure 2 Private hospital and other medical schemes claims costs per person per annum, South African Rands (2010 prices) Data fromCouncil for Medical Schemes’ Annual Reports [29]. Medical scheme claims costs increased more steeply during the 1990s than during the post-reform period which was implemented from 2000. Private hospital costs initially increased more steeply during the post reform phase after themarket became concentrated from 2000. Private hospitals returned to the pre-2000 trend in 2004 but at a structurally higher cost.
van den Heever BMC Public Health 2012, 12(Suppl 1):S5http://www.biomedcentral.com/1471-2458/12/S1/S5
Page 7 of 13

hospitals in the private sector (they are not employed byhospitals), are actively attracted to hospital groups bycapital investments in specialised medical equipmentand practice management support. As certain hospitalgroups achieved sustainable revenue flows through thepredictable demand provided by the specialist referrals,they were better positioned than independent hospitalsto invest in the capital equipment required to attractmore specialists. As independent hospitals lost theirability to retain specialists, demand for their servicesdeclined, exposing them to inevitable takeover by anyone of the cash flush large hospital groups. As a resultwhereas in 1998 44.7% of private hospital beds were stillin independent hands, by 2002 only 30.2% remained. By2006 this had dropped to 16.2% (figure 3) [16].Once the hospital consolidation passed an important
concentration threshold in 1999, their market power,initially directed against independent hospitals (competi-tors), could now be directed against medical schemes
who became price takers. Thus although a trend breakin rising private hospital costs occurs only from 2000,the conditions for this trend break were established dur-ing the 1990s. (Figures 2 and 3).
Scheme demographicsThe demographic make-up of medical schemes alsobecame more inclusive from the mid-1980s to 1999 witha surging black middle class taking up coverage. Whereasin 1984 only 14.8% of scheme beneficiaries were black[20], by 1995 it improved significantly to 37.6% withwhites at 48.6% [21]. These positive trends continuedthrough 2000, with black beneficiaries substantiallyexceeding whites by 2007 with proportions at 42.8% and39.8% respectively. By 2010 black beneficiaries consti-tuted nearly half of all beneficiaries at 46.3% (3.8 millionbeneficiaries) with whites now well below at 35.7% (3million beneficiaries) [22]. The differential improvementin black membership from 1995 is attributable to
Figure 3 Private hospital changes in market share from 1996 to 2006 for the three main hospital groups: Life Health, Netcare, andMedi-clinic Data from Council for Medical Schemes [16] From 2000 the market for private hospital acute beds was concentrated in the handsof only three hospital groups.
van den Heever BMC Public Health 2012, 12(Suppl 1):S5http://www.biomedcentral.com/1471-2458/12/S1/S5
Page 8 of 13

growing black middle class. It is likely that by 2012 blackbeneficiaries will exceed 50% of the total.
Medical scheme re-regulation – the period from2000Policy positionsDuring the 1990s plans were made to reintroduce a reg-ulatory regime framed around a preferred private healthinsurance entity that had evolved to date, the medicalscheme. Parallel insurance operating through more con-ventional insurance regimes were regarded as unregula-table as they had no standard institutional structure orregulatory regime. Short- and long-term insurancearrangements were also subject to much lighter regula-tory supervision through the Financial Service Boardreporting to the Minister of Finance.However, a return to the pre-1994 framework could
no longer accommodate the altered and rapidly evolvingnature of the private health system. The existence ofcompeting commercial medical schemes, together with asupportive broker system, was now an unavoidable rea-lity. The continuous decline in occupational schemes,particularly the smaller ones, was now systemic. Costcontainment had also become an evident problem, withnon-health costs also reaching alarming levels [16].The new regulatory model now needed to reconstitute
social solidarity that also generated incentives to managecosts. A policy framework tabled in 1995 talked to newmeasures (that had never existed before) as well as somethat had been removed in 1989 and 1994 including: com-munity rating (contributions that could not be differen-tiated on the basis of health status); open enrolment,whereby open commercial medical schemes would notbe able to deny membership to applicants (removingtheir ability to risk-select); mandatory minimum benefitswith an emphasis on catastrophic health expenses; inter-scheme risk-equalisation, which sought to affect inter-scheme financial transfers to ensure that all schemesfaced the same prospective demographic risk profile; andmandatory membership to deal with anti-selection(where people only take up cover when needing healthcare). The proposed framework also incorporated recom-mendations for income-based cross-subsidies, to beachieved through a risk-equalisation mechanism, andmandatory participation for income earners [23].
What was eventually implemented?In the face of significant industry opposition, whichincluded a failed legal challenge to stop the legislation, aless comprehensive framework than originally proposedwas eventually legislated in 1998, taking effect from2000. Important provisions included the establishmentof an independent regulator separate from government;open enrolment; community rating; minimum solvency
requirements; the accreditation of brokers and the regu-lation of their commissions; and mandatory minimumbenefits focusing on catastrophic medical expenses.However, the framework did not mandate membershipand nor did it introduce risk-equalisation. To mitigatethe inevitable anti-selection within a voluntary environ-ment, a system of waiting periods and late-joiner penal-ties were introduced. In both instances the penaltyframework incorporated rewards for continuity of mem-bership within the system of medical schemes. All sig-nificant barriers to free movement between schemes wasremoved.The recommendations regarding mandatory member-
ship and risk-equalisation were taken up in a subsequentcommittee of inquiry which concluded its work in 2002but was never implemented [24].
The impact of re-regulationEven the partial framework, which really started impact-ing after 2001, systematically altered important trends.From 2002 non-health real per capita expenditure lar-gely flattened with only a 4.6% real increase over theentire period to 2010. Demonstrating the extent of thebehavioural change, in the two years leading to 2002 theannual real per capita increases were 28.2% and 21.8%respectively [11].Contribution increases also flattened from 2002 with a
19.3% real per capita increase over the entire period to2010 [11]. However, a more definitive trend breakoccurred after 2004 with the increase over the whole per-iod to 2010 only 4.7%. This can largely be attributed to theflattening of claims cost increases from 2004 (figure 2),and schemes achieving their new statutory solvency levelsby 2005 (these had to be phased in from 2001 for a periodof five years). Regulatory action to remove all inappropri-ate reinsurance agreements also took effect from 2004.The altered year-on-year trends in medical costs,
although remaining structurally high, resulted from anumber of measures that came to a head during 2004.This included new price legislation for medicines, inplace from August 2004, which inter alia introduced asingle-exit pricing mechanism. This together with otherstatutory provisions prohibited the “discounting” of med-icines, effectively outlawing a number of cost-inducingkick-back arrangements operating between private hospi-tals and medicine manufacturers as well as doctors andmedicine manufacturers [16]. Per capita medicine costssubsequently declined for three consecutive years andremaining largely flat thereafter.Several measures aimed at medical schemes also
altered their incentives and capability to manage costsfrom 2001. As open commercial schemes could no longercompete using risk-rated contributions or risk-selection,they had to compete on healthcare costs. In the case of
van den Heever BMC Public Health 2012, 12(Suppl 1):S5http://www.biomedcentral.com/1471-2458/12/S1/S5
Page 9 of 13

medicines the mandatory minimum benefits for chronicconditions, which took effect from 2004, incentivisedimmediate efficiencies through scheme-developed clinicalprotocols and medicine formularies.Generalised improvements in administration from
1999, which saw electronic claims processing introduceduniversally, also improved the capacity to manage costs.This capability was further enhanced from 2005 with astatutory requirement placed on healthcare providers tosupply clinical codes together with invoices.
Scheme consolidationThe regulatory framework (through new minimum mem-bership requirements), together with commercial incen-tives already prevalent in the 1990s, saw schemesconsolidate, with over 220 schemes in 1998 reducing toonly 100 by 2010. The consolidation was also given aboost from 2005 with the introduction of the GovernmentEmployees Medical Scheme (GEMS) reversing the 1993decision liberalising medical cover for governmentemployees with significant implications for the market. Asthere are approximately 1.3 million general governmentemployees, a maximum potential membership exists,when dependents are included, of around 3 million.GEMS is presently at around half this number andremains the fastest growing scheme in the country.Roughly coinciding with this period one commercial
open scheme, Discovery Health Medical Scheme, alsogrew rapidly from around 250,000 beneficiaries at thebeginning of 2000 to approximately 2.1 million benefici-aries by 2010. By 2010 just two medical schemes thereforecovered 41% of all beneficiaries (3.4 million out of 8.3 mil-lion). Although the consolidation holds out some possibi-lity of better contracting with providers, it also reducesmarket penalties for over-priced scheme contributions.The consolidation of membership into a few nationalschemes reflects an apparent systemic trend resultingfrom the emergence of multi-employer commercialschemes in the 1980s.
Differential pricing by group sizeOpen enrolment, which required that all open schemesaccept all applicants, eliminated contribution-based pricediscrimination based on the size of group joining an openscheme. Prior to 2000 open schemes would, at their dis-cretion, differentiate contributions on the basis of groupsize, with individuals and smaller groups paying more thanlarger groups. This practice prejudices small employersand the self-employed. The introduction of open enrol-ment together with community rated contributions (wherethe community is a plan or option offered by a scheme)eliminated this differential pricing according to group sizewithout undermining financial sustainability, which hasimportant implications for enhanced social solidarity.
Gaps in medical scheme regulation and itsconsequencesRisk poolingThe legislative framework of 1998 and implementedfrom 2000 enhanced the social protection possiblethrough a voluntary (predominantly) competing healthinsurance environment, but retained significant andimportant gaps.The removal of discrimination on the basis of health sta-
tus in the absence of inter-scheme risk-equalisationexposes competing health insurers to their demographicrisk profile which they cannot control. Competing healthinsurers with poor risk profiles consequently need to bepriced in excess of those with good risk profiles regardlessof how efficiently they manage claims costs. This drivesyounger and healthier beneficiaries to schemes with betterrisk profiles, giving rise to a price-related death spiral andscheme failure. Given open enrolment, beneficiariesmigrate to surviving schemes resulting in systemic schemeconsolidation.Although unable to explicitly introduce risk-rated con-
tributions, schemes have been able to manage this contin-gency by offering multiple plans, specified in law asoptions, with different levels of benefit. The limited rangeof mandatory minimum benefits (amounting to around35% of a comprehensive package) allowed schemes toachieve milder forms of risk-rating by leveraging off theanti-selective conduct of younger and healthier familiesand groups who self-select benefit packages that reflecttheir risk profile. Options offering only catastrophic healthcover therefore predominantly attract younger and heal-thier groups, while comprehensive benefit options attractolder and sicker groups. As each option (or benefit plan)is priced separately, cross-subsidies between optionswithin the same scheme can be set at the discretion of thescheme, allowing contribution rates to vary betweenoptions on two factors: the risk of claiming; and benefitlevels. Despite community rating, therefore, comprehen-sive options implicitly include a risk-related loading, whilecatastrophic cover options benefit from a risk-relateddiscount.The risk-sifting options designs remove scheme incen-
tives to aggressively risk-select in exchange for an implicitcontribution penalty for those choosing comprehensiveoptions. However, the penalty is more subdued thanoccurred during the deregulations of 1989 and 1994 for anumber of market-related reasons. Schemes have to bal-ance two factors in setting contributions: the average risk ofclaiming and income-based preferences. In a flat-rate con-tribution environment (i.e. no income differentiation), asincomes rise contribution rates decline as a proportion ofincome. Higher income groups, regardless of health status,prefer and can consequently afford more comprehensivebenefits. Comprehensive options consequently attract
van den Heever BMC Public Health 2012, 12(Suppl 1):S5http://www.biomedcentral.com/1471-2458/12/S1/S5
Page 10 of 13

multiple risk groups, even if there are disproportionatelymore poor risks.Significant market pressure consequently exists to
keep the better risk groups in the comprehensiveoptions as they stabilise the pricing for their lucrativecorporate clients who demand comprehensive coverage.Virtually all open schemes therefore deliberately over-price their low-cover options to cross-subsidise theircomprehensive options.Without risk-equalisation, however, government cannot
easily expand the package of mandatory minimum benefitsas this would compel schemes to consolidate options anddestabilise the pricing of schemes with older and sickerdemographic profiles. Scheme consolidation would alsoaccelerate through the death spiral mentioned earlier, witha market equilibrium reached only when all the remainingschemes are broadly similar in demographic profile, whichis most likely after significant consolidation. Althoughtechnically the expanded package with and without risk-equalisation at the new equilibrium point could beregarded as equivalent from an equity perspective, themarket dynamics should be different. The extent ofscheme consolidation likely in the without risk-equalisa-tion scenario, while increasing the capability to manageprovider costs, may reduce competition to such an extentthat medical scheme contribution increases would have tobe regulated.
Cost containmentAlthough risk-equalisation would have incentivisedschemes to manage healthcare provider costs more effec-tively (by forcing them to compete on price rather thanrisk), a degree of government involvement in the man-agement of cost is inevitable due to the market power ofprivate providers. Although cost increases have stabilisedduring the 2000s, the market power of hospitals and spe-cialists in particular are able to apply systemic upwardpressure for some time to come. Other health providersand medicines are unlikely to impact on cost as the for-mer have limited market power and the latter are subjectto increasing price regulation.As three hospital groups dominate the private health
system, schemes presently acquiesce to their pricedemands or face the threat of having their members bal-ance-billed (required to pay the difference between whatthe scheme pays and hospital charges). As hospital cover-age is the essential driver of demand for medical schemecoverage, short payments on catastrophic cover willresult in members quickly switching their scheme (facili-tated by open enrolment and brokers) to one willing tocapitulate to the hospital groups. As schemes are prohib-ited from colluding amongst themselves by competitionlegislation, a collective stand against a threat to balancebill is not possible. Threats to cherry pick hospitals into
networks are also easily repelled as the market for suchcontracts are small, and kept that way by the hospitalgroups. The hospital groups express their market powerby preventing the emergence of price competition in themarket for hospital services, thereby giving them nearcomplete control over their revenue flows, constrainedonly by the number of specialists [16].Although specialists are essential to the development of
a selective contracting market for both their own and hos-pital services, were they to begin to enter in to sucharrangements the hospital groups are likely to retaliatethrough the denial of hospital privileges. Thus althoughspecialists have market power in relation to schemes, theirpower over the concentrated hospital system is weak. Hos-pital groups consequently compete, but not on price. Theycompete for specialists. This non-price competition drivescosts up and not down, and constitutes a form of marketfailure quite unique to health markets.A strategy that would have gone a long way toward bal-
ancing the market, recommended by the Taylor Commit-tee of Inquiry in 2002 but never implemented, was toboost the autonomy and capability of public hospitalsand to permit them to compete with private hospitalsand specialists for the patronage of medical schemes.Unfortunately, over the past fifteen years public hospitalshave deteriorated. The general low regard for public hos-pitals consequently makes them unattractive for medicalscheme members and removes the leverage schemescould otherwise exercise over private hospitals.
Managing non-price competitionResolving price determination within the non-price com-petition market for hospitals and specialists would go along way toward cost management within medicalschemes. Proposals in this regard [25] involve the estab-lishment of an independent (both of government and theprivate sector) price regulator to coordinate centralisednegotiations between medical schemes, final consumers ofhealthcare, and all providers. The resulting prices and tar-iffs would apply exclusively to the non-price competitionmarket. Any market participants willing to negotiateagreements on a selective contract basis (between schemesand non-colluding healthcare providers and suppliers)would be permitted to do so provided they complied withexisting competition laws.The proposed centralised negotiations would therefore
balance out market power differences between funders,consumers and healthcare service providers resulting inmore balanced pricing. Irresolvable disputes in the nego-tiations would be managed by automatic referral to anindependent arbitrator who would decide which com-peting bid to accept. The arbitrator would not be free tomake a separate proposal. The final decision by the arbi-trator would be required to take account of factual
van den Heever BMC Public Health 2012, 12(Suppl 1):S5http://www.biomedcentral.com/1471-2458/12/S1/S5
Page 11 of 13

motivations provided by the relevant parties to theinitial negotiations. The overall process would generateprice transparency and reasonableness in the biddingprocess. It would also systematically remove the abuseof market power as a basis for price setting. Importantlyprices remain determined by way of negotiation betweenthe principals rather than by government (i.e. an admi-nistered price) with government’s role to design a fairprocess for the negotiations [25].
The relationship between regulated medicalschemes and the public sectorThe performance of the public sector has deterioratedconsiderably over the past fifteen years, for reasons unre-lated to resourcing [7], although some have argued onthe basis of crude per capita expenditure differentialsbetween medical schemes and the public system are toblame [26]. However, health workforce differentialsbetween the public and private sectors, apart from spe-cialists, do not reflect an equity problem or a resourcingproblem when the official registration data is correctedfor errors [27-29]. Per capita expenditure differentialsonly suggest different cost-efficiencies and preferencesbetween the two sectors and no plausible relationship topublic health system outcomes is detectible.Both the 1995 and 2002 committees of inquiry dealing
with health reform took the view that the relationshipbetween the non-contributory and contributory regimesof the health system should be harmonized, recognisingthat both offered strong mechanisms which togethercould efficiently achieve universal coverage. However, forthe complete system to be in place specific reforms inboth the public and private sectors are required. The for-mer requires a better structuring of its institutions toenhance accountability and decision-making, while thelatter inter alia requires risk-equalisation and cost man-agement. It was furthermore proposed that the publicand private sector providers need to be available for con-tracting by both the public sector and medical schemes.However, although medical schemes have the capabilityto purchase public sector services, the public sector isunable to manage complex contractual arrangements ormeet requirements regarding quality.
ConclusionsThe South African health system provides an importantcase study for developing countries on mixed models forthe expansion and deepening of coverage. Although it isan upper-middle-income country its experiences arenevertheless relevant to a much wider category of countrycontexts. Both the successes and failures are instructive.Whereas industrialised (high-income) countries have theoption of achieving far deeper universal coverage via
predominantly universal mechanisms and entitlements,developing countries need to confront the reality of multi-ple financing and service-delivery mechanisms. Privatemarkets will also emerge regardless of their desirability.Explicitly designed mixed system models are able to com-bine publicly provided and subsidised services togetherwith regulated insurance markets to effectively achievemultiple social and public goals, while leveraging off pri-vate incentives and preferences. However, achieving socialprotection objectives through private markets requiresstrong regulators and an understanding of marketdynamics that are not universally well understood ordocumented.The objective of universal coverage can be seen in two
dimensions, horizontal extension and vertical deepening.Private systems play an important role in deepening cover-age by mobilising revenue from income earners for healthservices over-and-above the horizontal extension role ofpublic systems and related subsidies. South Africa providesan example of how this natural deepening occurs whetherregulated or unregulated. It also demonstrates how poorregulation of mature private systems can severely under-mine this role and diminish achievements below attainablelevels of social protection.The mature South African system has demonstrated
its sensitivity to regulatory design and responds rapidlyto changes both positive and negative. When measuresto enhance risk pooling are introduced, coverage isexpanded and becomes increasingly fair and sustainable.When removed, however, the system becomes lessstable and fair as costs rise and people with poor healthstatus are systematically excluded from cover. This sus-ceptibility to regulation therefore presents an opportu-nity to policymakers to achieve social protectionobjectives through the strategic management of marketsrather than exclusively through less responsive systemsbased on tax-funded direct provision.As private markets will emerge regardless of government
policy, any failure to effectively regulate, encouraged bythe belief that commercialised health markets are inher-ently in opposition to the public interest, will prove coun-terproductive as cost spirals occur and coverage fails todeepen. Understanding the specific requirements for awell-regulated private health system within developingcountry contexts therefore needs to become better under-stood if the objectives of universal coverage are to be ade-quately met in the next two decades. This is especiallyrelevant for those developing countries experiencing rapideconomic growth where burgeoning unregulated privatehealth systems are likely to emerge. This should howevergo hand in hand with the development of a consensus onthe essential ingredients for a well-functioning general taxfunded publicly provided or funded health service.
van den Heever BMC Public Health 2012, 12(Suppl 1):S5http://www.biomedcentral.com/1471-2458/12/S1/S5
Page 12 of 13

AcknowledgementsThe author would like to thank the School of Medicine and Public HealthSciences at Monash University, Sunway Campus in Malaysia for funding theconference that supported this paper.The support of Old Mutual South Africa in funding the Chair of SocialSecurity Systems Administration and Management Studies and at theGraduate School of Public and Development Management within theUniversity of the Witwatersrand is also acknowledged.This article has been published as part of BMC Public Health Volume 12Supplement 1, 2012: Universal Coverage: Can We Guarantee Health For All?.The full contents of the supplement are available online at http://www.biomedcentral.com/bmcpublichealth/supplements/12/S1.
Authors’ contributionsOnly one author was responsible for full manuscript.
Competing interestsThe author declares no competing interests.
Published: 22 June 2012
References1. Statistics South Africa: Mid-year population estimate 2011. 2011, P0302.2. Statistics South Africa: Migration and urbanisation in South Africa. Report
no. 03-04-02 2006.3. Statistics South Africa: Quarterly Labour Force Survey. 3rd Quarter 2011
2011.4. The Presidency, Republic of South Africa: Development Indicators. 2009.5. National Treasury: Budget Review 2011. 2011.6. World Health Organisation: Maternal Mortality Ratio (per 100 000 live
births) - Interagency estimates. [http://apps.who.int/ghodata/?vid=240#].7. Development Bank of South Africa: A Roadmap for the Reform of the
South African Health System. unpublished discussion document 2008.8. National Committee on Confidential Enquiries into Maternal Deaths: Saving
Mothers 2005-2007. Fourth Report on Confidential Enquiries into MaternalDeaths in South Africa 2007.
9. Human Rights Watch: “Stop Making Excuses” Accountability for MaternalHealth Care in South Africa.1-56432-798-1 2011, printed in the US.
10. Quantified by aggregating the information from all the 2011/12 budgetstatements for all provincial and national health budget votes for the2010/11 financial year. [http://www.treasury.gov.za/documents/national%20budget/default.aspx].
11. Council for Medical Schemes: Annual Report 2010/11.978 0 621 40011 32011.
12. Calculated from World Health Organisation. [http://www.who.int/nha/country/zaf/en].
13. van den Heever AM: Fiscal Incidence Analysis, Healthcare. Report Producedfor National Treasury 2009 [http://www.treasury.gov.za/publications/other/Fiscal%20Incidence%20Study/Addendum%20B.pdf].
14. Department of Health: National Health Insurance in South Africa. policypaper 2011.
15. Department of Health: Inquiry into various Social Security Aspects of theSouth African Health System. based on the health subcommittee findings ofthe Committee of Inquiry into a Comprehensive System of Social Security 2002.
16. Council for Medical Schemes: Evaluation of Medical Schemes’ CostIncreases: findings and recommendations. Research Brief Number 1 2008.
17. McLeod HD, Slattery PG, van den Heever AM: “The Use and Abuse ofReinsurance in Medical Schemes”. South African Actuarial Journal 2001, 1.
18. Melamet Commission: Commission of Inquiry into the Manner ofProviding for Medical Expenses. 1994.
19. van den Heever AM: Expert Affidavit in the Competition Tribunal, CaseNo.122/LMM/Dec05, Phodiclinics (PTY) Ltd et al and Protector GroupMedical Services (PTY) Ltd (in Liquidation) and the Council for MedicalSchemes (intervener). 2005.
20. Council for Medical Schemes: Annual Report. 1984.21. Statistics South Africa: October Household Survey. 1995.22. Statistics South Africa: General Household Survey. 2010.23. Committee of Inquiry into a National Health Insurance System:
Restructuring the National health System for Universal Primary HealthCare. 1995.
24. Committee of Inquiry into a Comprehensive System of Social Security:Transforming the Present – Protecting the Future. 2002.
25. Department of Health: The Determination of Health Prices in the PrivateSector. 2010 [http://www.medicalschemes.com/files/Health%20Price%20Determination/DiscussionDocOnPriceDetermination.pdf].
26. McIntyre D, Thiede M, Nkosi M, Mutyambizi V, Castillo-Riquelme M, Gilson L,Erasmus E, Goudge J: A Critical Analysis of the Current South AfricanHealth System. Shield Work Package 1 Report 2002.
27. Econex: Updated GP and Specialist Numbers for SA. Health Reform Note 72010.
28. Econex: The Human Resource Supply Constraint: The Case of Doctors.Health Reform Note 8 2010.
29. Econex: The Human Resource Supply Constraint: The Case of Nurses.Health Reform Note 9 2010.
30. van den Heever AM: Evaluation of the Green Paper on National HealthInsurance. 2011.
31. Council for Medical Schemes: Annual Reports for all years. [http://www.medicalschemes.com/Publications.aspx].
32. Hospital Association of South Africa: History of the Hospital Association ofSouth Africa. 2010 [http://www.hasa.co.za/media/uploads/documents/file/2010-06-07/HASA_History_by_Sharon_Slabbert.doc].
33. Zwaranstein MF, Price MR: The 1983 Distribution of Hospitals andHospital Beds in the RSA by Area, Race, Ownership and Type. SAMJ 1980,77:448-452.
34. Health Systems Trust. [http://indicators.hst.org.za/healthstats/108/data].35. Health Systems Trust. [http://indicators.hst.org.za/healthstats/112/data].
doi:10.1186/1471-2458-12-S1-S5Cite this article as: van den Heever: The role of insurance in theachievement of universal coverage within a developing countrycontext: South Africa as a case study. BMC Public Health 2012 12(Suppl1):S5.
Submit your next manuscript to BioMed Centraland take full advantage of:
• Convenient online submission
• Thorough peer review
• No space constraints or color figure charges
• Immediate publication on acceptance
• Inclusion in PubMed, CAS, Scopus and Google Scholar
• Research which is freely available for redistribution
Submit your manuscript at www.biomedcentral.com/submit
van den Heever BMC Public Health 2012, 12(Suppl 1):S5http://www.biomedcentral.com/1471-2458/12/S1/S5
Page 13 of 13