Universal Health Coverage in Iran
Universal Health Coverage in Iran Observatory Report of Islamic Republic of Iran’s Naonal Instute of Health Research 2014
Transcript of Universal Health Coverage in Iran

II
Universal Health Coverage in Iran
Observatory Report of Islamic Republic of Iran’s
National Institute of Health Research
2014

IIII

III
Contributors
The idea of preparing the observatory report of Islamic Republic of Iran’s National Institute of Health Research, titled as “Universal Health Coverage” was initiated from August 2014 by a team led by Dr. Omid Barati as the technical manager with the assistance of Mis. Elham Elahi.
Then an expert committee was set up to do the following actions:
• Determining the framework of report, title of chapters and headings, informational resources, research group and authors;
• Reviewing the draft reports, denoting the overlays and informational gaps;
• Reviewing the final content and assimilating the texts.
This resulted in the present report as a joint work. However, the following people were responsible for preparing the specified chapters.
Chapter 1 Theoretical Concepts and Principles of Universal Health Coverage
Dr Leila Doshmangir (Assistant Professor, Department of Health Services Management, Iranian Center of Excellence in Health Management, School of Management and Medical Informatics, Tabriz University of Medical Sciences)
Dr Arash Rashidian (Professor, Department of Health Management and Economics, School of Public Health, Tehran University of Medical Sciences)
Minoo Alipoori Sakha (PhD candidate, Department of Health Management and Economics, School of Public Health, Tehran University of Medical Sciences)
Parinaz Doshmangir(PhD candidate, Department of Health Services Management, School of Public Health, Tabriz University of Medical Sciences)
Chapter 2 Effective Health Service Coverage
Dr Hossein Ebrahimi Poor (Associate Professor, Research Center for Health Sciences, School of Public Health, Mashhad University of Medical Sciences)
Dr Mehdi Yousefi (Assistant Professor, Research Center for Health Sciences, School of Public Health, Mashhad University of Medical Sciences)
Salman Shojai (Msc Student, Department of Health and Management, School of Public Health, Mashhad University of Medical Sciences)
Roghieh Bayrami, (PhD Student in Reproductive Health, School of Nursing and Midwifery, Mashhad University of Medical Sciences)

IVIV
Chapter 3 Range Of Services
Dr Ali Jannati (Associate Professor, Department of Health Services Management, School of Management and Medical Informatics, Tabriz University of Medical Sciences)
Dr Ali Imani (Assistant Professor, Department of Pharmacoeconomics Management, School of Management and Medical Informatics, Tabriz University of Medical Sciences)
Vahideh Sadeghi (PhD candidate, Department of Health Service Management, School of Management and Medical Informatics, Tabriz University of Medical Sciences)
Chapter 4 Quality of Services
Dr Reza Dehnavieh (Associate Professor, Department of Health Service Management, Institute for Futures Studies in Health, Kerman University of Medical Sciences)
Dr Ali-Akbar Haghdoost (Professor, Institute for Futures Studies in Health, Kerman University of Medical Sciences)
Dr Somayeh Nouri-Hakmat (Assistant Professor, Department of Health Service Management, Think Tank of Kerman University of Medical Sciences)
Dr Hamid Ravaghi (Assistant Professor, Department of Health Service Management, Iran University of Medical Sciences)
Dr MohammadHossein Mehrolhasani (Assistant Professor, Department of Health Service Management, Institute for Futures Studies in Health, Kerman University of Medical Sciences)
Hedayat Salari (PhD Candidate, Department of Health Management and Economics, School of Public Health, Tehran University of Medical Sciences)
Atefeh Esfandiari (PhD Candidate, Department of Health Management and Economics, School Of Public Health, Tehran University of Medical Sciences)
Chapter 5 Household Financial Protection in the Health System
Dr Zahra Kavousi (Associate Professor, Department of Health Services Management, School of Management and Medical Informatics, Shiraz University of Medical Sciences)
Dr Peivand Bastani (Assistant Professor, Department of Health Services Management, School of Management and Medical Informatics, Shiraz University of Medical Sciences)
Azimeh Ghorbanian (PhD Candidate Department of Health Services Management, School of Management and Medical Informatics, Shiraz University of Medical Sciences)
Elham Elahi (PhD Candidate in Health Education and Health Promotion, School of Public Health, Shahid Beheshti University of Medical Sciences)

V
Chapter 6 Establishment of Universal Health Coverage in Iran
Dr Omid Barati (Assistant Professor, Department of Health Services Management, School of Management and Medical Informatics, Shiraz University of Medical Sciences)
Dr Shahram Ghaffari (PhD, Social Security Research Institute, Social Security Organization)
Dr Bahareh Yazdi Zadeh (Assistant Professor, Health Knowledge Utilization Research Center, Tehran University of Medical Sciences)
Farideh Mohtasham (MSc, Health Knowledge Utilization Research Center, Tehran University of Medical Sciences)
Sajad Delavari (PhD candidate, Department of Health Management and Economics, School of Public Health, Tehran University of Medical Sciences)
Mohsen Bayati (PhD Candidate, Department of Health Management and Economics, School Of Public Health, Tehran University of Medical Sciences)
In addition to feedbacks of all individuals and institution for chapters, Dr Elham Shakibazadeh, Assistant Professor of Zanjan University of Medical Sciences, did final edition of the text.
She has edited and finalized all contents.

VIVI
Foreword (1)
Equity is one of the main pillars of divine religions and Iran’s rich culture. The glorious Islamic Revolution and formation of Islamic Republic of Iran was a turning point in the path to equity achievement. After the Islamic Revolution, the dominant utopian thinking of the government, led to main and effective efforts in the direction of equity, of which we can mention special attention to the outreach and rural areas in different fields like development of the modern healthcare system. However, the health needs change quickly and sometimes provoke to the different social layers gap. Poverty, illiteracy, deprivation and socio-economic differences often make the inequity even worse, besides those, diagnostic and treatment expenditures (in the event of illness), different expectations (either appropriate or inappropriate), uneven distribution of facilities and human resources are other influential factors.
Now the phenomenon of squatter settlement with residents who are unable to meet their most primary needs and basic health rights, brought the “health inequality and inequity” from an abstract expression to a tangible reality, A reality which all the nations and governments should seriously think and launch to solve it. Health system of Islamic Republic of Iran is not an exception in this regard and needs urgent and effective actions to solve its’ special problems. This subject as one of the pivotal elements of the health system is tracked in current health system transformation plan. We hope to improve the situation relying on serious efforts of all who are committed to nation’s health and our deer Iran’s development.
Universal health services coverage (that is one of the main health interventions and is a response to the people needs in a way that catastrophic health care costs don’t bring them lots of problems such as poverty) is completely coincide with the wide concept of social equity.
Achieving universal health coverage is closely related to the local conditions of each country, as well as its economic, social, political and cultural development. Hence, we should pay enough attention to our knowledge in addition to reviewing the global experiences in order to choose the most appropriate actions. This report tries to reflect part of present situation and, necessary actions for universal health coverage to achieve equity in health. In other words, this collection should tell us what our present situation in this field is, what we know, what we should pay attention to and which way we should choose? This is what we expect from country’s scientific centers such as National Institute of Health Research of Islamic Republic of Iran to light the future path by presenting realistic analysis of the conditions through periodical, realistic, analytical and regular reports.
I appreciate the institutions colleagues and experts who worked to provide this report (which is the first annual Observatory Report from National Institute of Health Research). I hope such reports can play effective role to make right decisions and to help us in the way to achieve equity.
Dr Seyyed Hassan HashemiMinister, Ministry of Health and Medical Education

VII
Foreword (2)
Foreword by director of Islamic Republic of Iran’s National Institute of health Research:
I use this opportunity to discuss “why” and a little “how” of the present report.
The title -”Observatory Report of Universal Health Coverage”- consists of two parts: observatory and universal health coverage.
Islamic Republic of Iran’s National Institute of Health Research holds two main missions, one is health observatory and the other is to do applied health research. Observatory means continuous and systematic observation of health conditions and issues to use the information to select policy, plan, decision making and “efficient and evidence informed” implementation. That’s why National Institute of Health Research has predicted different monitoring reports in its’ planning, one can see lists of some finished subjects on the back cover of this collection. We additionally are going to publish at least one annual observatory report on any of our related subjects; the present volume is the first of this kind.
About the second part which is “Universal Health Coverage”, health system in all countries have been formed on the basis of morality framework with equity as the most pivotal of its principles. For this reason, equity and the way of health care provision for people is one of the main issues of the health systems around the globe. Achieving equity in health is a common national and international issue.
The issue of equity in health has been considered in different ways in Iran (which is part of the present report), which indicates that this issue has long been discussed and there is still a long way to achieve it. At the time of providing this report, “health transformation Plan” is the principal new plan in the field of social interventions that has caught the attention of both insiders and outsiders of the health sector. The reason is its’ formation and its’ most impact is on equity. In the other hand, the closest concept with “Health Transformation Plan” in public health literature is “Universal Health Coverage”. So the first reason of choosing the topic of annual report was National Institute of Health Research’s accountability to the key issues in the country that has been pursued through this report.
The second reason of choosing this topic was that “Universal Health Coverage” is a global approach which has gained double importance as we approach the setting of new Global Development Goals after 2015. In this year, which is basis for global change in this filed: we intended to gather national data to play role both as a basis for next actions and to show information gaps which should be filled.
Finally, a little about how the report was developed: the institution tried a lot to make use of the available wide expertise capacity in the country to provide this report. In the contributors’ list, you can see the names of different groups from different parts of Iran. But surely there were experts and intellectuals who was not possible to take advantage of their knowledge and experiences. We emphasize that the institution is looking for using all human capital of the country and their convergence. We hope, whether in the implication of applied researches in the health system or in observatory fields, to address this issue deservedly and to benefit us by providing their guidance and supports.
Dr. Reza MajdzadehDirector, National Institute of Health Research

VIIIVIII
Abbreviations:
UHC: Universal Health Coverage
HTP: Health Transformation Plan
WHO: World Health Organization
PHC: Primary Healthcare
OOP: Out of Pocket
SSO: Social Security Organization
WHA: World Health Account
AIDS: Acquired Immune Deficiency Syndrome
EFQM: European Foundation for Quality Management
FDA: Food and Drug Administration

IX
XX
Table of Contents
Executive Summary 1
Chapter 1. Theoretical Concepts and Principles of Universal Health Coverage 5
Abstract 7
Introduction 8
Concept of UHC 9
Dimensions of UHC 11
All Population Coverage 11
High Quality Services Provision 11
Financial Protections 12
UHC Financing 13
Solving some Ambiguities about Universal Health Coverage 15
Efforts to Reach UHC in Different Countries around the World 15
Efforts to Reach UHC in Iran 16
References 18
Chapter 2. Effective Health Service Coverage 20
Abstract 23
Introduction 24
Important Points at High Level Documents 26
Effective Health Services Coverage Status in Iran 29
Challenges in Iran and Analysis of Health Services Effective Coverage 39
Usefulness of the Indicator for Judgment about Effective Services Coverage Situation 39
Usefulness of the Indicator for Judgment about Equity Situation 41
Lessons Learnt from other Countries 45
Future Orientations for Iran 46
Practical Considerations to Develop Effective Services Coverage in Iran 46
References 48
Chapter 3. Range of Services 50
Abstract 51
Introduction 52
Range of Health Services 52
Range of Services Selection Criteria 53
.......................................................................................................................................................
................................................................................................................................................
........................................................................................................................................
................................................................................................................................
......................................................................................................................
........................................................................................................
.............................................................................................................................
..........................................................................................................................................
...........................................
.....................................
..............................................................................................................
..................................................................................................................................................
.........................................................................
.......................................................................................................................................................
...............................................................................................................................................
...............................................................................
...................................................................
.......................
.................................
...........................................................................................
..............................................................................................................
...................
...................................................................................................................................................
...........................................................................................................
.......................................................................................................................................................
................................................................................................................................................
.....................................................................................................................
..............................................................................................
.............................................................................................................................

XI
Benefit Packages Status and Important Actions about Health Range of Services in Iran 55
Health Benefit Packages in Iran 58
Basic and first Level Services Package 58
Secondary and Tertiary Service Packages 61
Range of Services in Higher Level Documents 62
Existing Challenges Regarding Range of Health Services in Iran 63
Lessons Learnt from other Countries 64
Future Orientations 69
Practical and Executive Considerations in Developing Services Package in Iran 69
References 71
Chapter 4. Quality of Services 74
Abstract 75
Introduction 77
Status of Selected Indices in Iran 81Indices of quality of treatment services 81
Indices of Quality of Prevention Services 90
Indices Related to Supervising Quality of Services 90
Preparation Conditions of Evidence-Based Guidelines in Health Sector 93
A Glance at Equitable Access to the Service and its Impact on Quality 94
Analysis of Higher Level Documents and Programs of Quality of Health Services in Iran 94
Quality Challenges of Health Services in Iran and Future Effective Trends 99
Trends Affecting the Quality of Health Services in Iran 103
Lessons Learned from other Countries 105
Orientation for the Future 108
Operational Considerations in Iran in order to Improve Quality of Health
Services in Iran 111
References 114
Chapter 5. Household Financial Protection in the Health System 118
Abstract 119
Introduction 120
Status of Household Financial Contribution Indicators in Iran 124
Financial Protection in Higher Level Documents 131
........................................................................................................
...........................................................................................
...................................................................................
.........................................................................
.....................................
.............................................................................................
...............................................................................................................................
.....
....................................................................................................................................................
..........................................................................................................
..........................................................................................................................................................
.................................................................................................................................................
..................................................................................................
....................................................................................
.................................................................
.....................
.....................
........................................................................................
........................................................................................................................................
..................................................................................................................................................
........................................................................................................................................................
...............................................................................................................................................
..............................
.........................................
...................................................................
.......
.......................................................
................................................................................................................
..............
......................................................................................
XIIXII
Lessons Learned from other Countries 132
Recommended Strategies for Iran 137
References 141
Chapter 6. Establishment of Universal Health Coverage in Iran 146
Abstract 147
Introduction 148
UHC in Iran 149
The Role of Research in the UHC 151
International Experience in UHC 152
Challenges of Achieving the UHC in Iran 155
Challenges Outside the Health System 155
Challenges Inside the Health System 156
Policy Requirements and Prerequisites of Deploying UHC in Iran 159
Recommendations to Achieve UHC in Iran 162
Increasing the Share of Insurance in Financing 163
Optimal Use of Existing Resources 165
Service Coverage 166
Scope of Services 167
Organizing Research 168
Quality of Services 170
Conclusions and Recommendations for the Future 172
References 173
..................................................................................................
....................................................................................................................................................
.................................
.......................................................................................................................................................
..............................................................................................................................................
..................................................................................................................................................
.....................................................................................................
.....................................................................................................
....................................................................................
........................................................................................
........................................................................................
..............................
.............................................................................
......................................................................
................................................................................................
....................................................................................................................................
....................................................................................................................................
..........................................................................................................................
..................................................................................................................................
.............................................................
..................................................................................................................................................
........................................................................................
1
Executive Summary
Effort to achieve Universal Health Coverage (UHC) has a long history in Iran. Perhaps the first step in Iran to achieve UHC could be attributed to about 80 years ago. Actions toward UHC in Iran initiated after the approval of the railway workers’ cautionary funds formation plan in 1930. From 1930 to 1972, Iran underwent several plans to overcome problems of health services provision and medical human resources distribution.
Health Corps Plan, Rural Paramedic Education Plan, Selseleh Plan in Aleshtar of Lorestan and Research Project on how to develop Medical and Health Services known as Rezaieh Plan are important actions in the direction of training and using non-physician manpower in Primary Health Care (PHC) provision and better public access to these services. from 1981 to 1987, Health Care Networks Plan and Health Services Leveling was implemented as one of the world’s most successful experiences regarding public access to health services.
After the approval of the obligation of social security in November 1989, the responsibility of providing curative services for workers and those subject to work and social security laws was entrusted to Social Security Organization. Medical Services Insurance Organization (MSIO) was established in 1995 and according to the law, provision of health insurance for government employees, the poor, the villagers, self-employed and other social groups entrusted to this Organization. Social Security Insurance Organization and Iran’s Health Insurance Organization now cover the majority of the population. Then another step was taken to provide services for villagers in 2005 when the Rural Family Physician Plan was implemented. Finally, when the government implemented the Health Transformation Plan (HTP) for the first time in the country in 2014, it took a big stride to achieve different aspects of UHC including reducing Out of Pocket Payments (OOP) and trying to improve the quality of service provision at medical centers.
Despite All the efforts done in previous years to ensure UHC in Iran, Islamic Republic of Iran still has a way ahead to achieve this goal. In this report, UHC had been analyzed on the basis of available data in four pillars of Coverage, Range, Health Service Quality and Financial Protection in Islamic Republic of Iran.
Effective Health Services Coverage
Health service coverage progress is usually measured by indicators which show raw amount of service coverage while UHC is accessible when this coverage is effective, so indicators which are used in this regard should measure effective coverage. In addition, to above feature the indicator which is used to assess the effective coverage should show the distributional equity in health service coverage on the basis of income level, gender, urban and rural areas. However, in many cases the gathered information is not comprehensive in Iran or lacks an

22
important part of above mentioned features. To solve this, various interventions should be undertaken, the most important ones are: 1) Considering the effective service coverage instead of the rate of service utilization when developing health system policies and plans; 2) Codification of comprehensive system of observing the access to UHC i.e. UHC observatory; 3) Integration of data collection system at the health ministry level as the health steward; 4) Identification and definition of indicators for assessing the effective service coverage achievement at five levels of health service provision; 5) Incorporating equity indicators in effective health service coverage; 6) Culture-building and training for indicator compilation; 7) Assessment of health system performance based on the concept of effective coverage at the university of medical sciences headquarters level.
Range of Services:
Iran’s health system has tried to provide services according to local needs and cost effectiveness criteria by providing primary health services components (whose number has gradually increased overtime), followed by provision of first level basic services package via family physician services package.
Now, with the implementation of HTP and consideration of the financial protection in health service coverage, steps have been taken to support vulnerable groups but it should be noted that how much the executive programs cover the range of health services including preventive, promoting, curative, rehabilitative and palliative services and how much these programs can be implemented in non-governmental and private sectors in coordination with services provided at the second and third level packages.
However, it is necessary to know that developing and defining the basic health services precisely, priority setting, choosing services according to recognized criteria and putting them in the health service packages needs to take significant advantage of informational, scientific-technical and ecological capacities, which has not been ideally or acceptably feasible in Iran and is an important challenge in the way to achieving the UHC. Thus, paying attention to the global common prioritizing criteria and adjusting basic and treatment packages services and interventions according to the national and international data and patterns can be helpful in filling the available gap of using national capacities in the current status.
Quality of Services:
Reviewing the available finite data about the health service quality status

3
shows that less attention has been paid to the outcome aspect compared with structural and process ones. Also Iran’s health system has often hastily applied quality management tools without taking full advantage of them. Monitoring health services quality requires a comprehensive framework because of having various aspects and complexities. However, our health system lacks such framework, so preparing the necessary conditions to achieve it and gathering data at provincial and national level is very important. The changing nature of diseases and stakeholders expectations including patients, providers and policy makers on the services quality coupled with an increase in global concern make coherent planning for quality improvement more serious. Hence, it is necessary to engage Ministry of Health and Medical Education (MOH), Insurer Organizations, Legislative Institutions, Universities of Medical Sciences, National Boards for Examination and Evaluation, Media and other related institutions.
Household Financial Protection in the Health System:
Although available data is not able to absolutely clear the financial protections of health system in Iran, two points can be taken from them. First, surveys show relatively unfavorable financial protections indicators against health costs in the years of study which express the need for changing the approaches or health system policies in this regard. Second, because of the difference between the results of Statistical Center of Iran and other studies, we need a national center responsible for gathering information and monitoring indicators at the MOH level.
On the basis of challenges in the way to UHC in Iran and relying on lessons learned from other countries and interviewing experts, political options to achieve UHC in Iran are introduced. With regard to the functions of health system, following suggestions are presented to achieve and to deploy UHC in Iran:
Stewardship:
• Clear orientation toward a model for achieving UHC, sustained policies, evidence informed policy making and avoiding individual oriented policy making;
• Incorporating the role of different stakeholders, structures, available infrastructures, socio-economic and cultural aspects;
• Improve planning and intersectoral cooperation and unified tariff setting for public and private sector with precise supervision;
• Implementing electronic health records.

44
Financing:
• Unified policy making or merging multiple insurance organizations, exact identification of the covered population and providing compulsory health insurance;
• Determining progressive prepayments and identifying new funds like taxation;
• Regarding service purchasing: Scientifically defining and updating benefit package incorporating criteria such as cost-effectiveness, priority setting according to the role of various beneficiaries specially purchasers. Determining contractual arrangements and optimized payment mechanisms to improve efficiency and access.
Resource Generation:
• Needs oriented and health centered human resource generation and education;
• Operationalizing health technology assessment for pharmaceuticals and medical equipment production and import;
• Providing firm evidence for UHC by means of scientific researches.
Service Provision:
• Precise implementation of health services priority setting;
• Proper and fair distribution of health facilities and human resources throughout the country;
• Recruiting less paid human resources with the same function for service provision;
• Developing and using clinical guidelines to improve service quality and optimal resources use.
Social and Economic Infrastructures:
• It is worth mentioning that although the followings are out of health sector domain, but they are important in the path to achieve UHC:
• Considering health in all policies;• Increasing and sustaining public resources allocated to health; • Improving transparency and efficiency of tax system;• Promoting and strengthening the social security structures;
• Improving production, employment, economic growth and economic stability

5
66
Theoretical Concepts and Principles
of Universal Health Coverage Dr Leila Doshmangir
Dr Arash Rashidian
Minoo Alipoori Sakha
Parinaz Doshmangir
Chapter 1

7
Abstract:Everybody’s enjoyment of health services is one of the pivotal policies of health system in any country. Universal Health Coverage (UHC) means access to the main health interventions including promotion, prevention, treatment and rehabilitation in an affordable cost for individuals. Determinants of UHC are commitment to providing all population groups with access to various health services on the basis of need, protection against catastrophic health care expenditures and poverty prevention. Achieving and maintaining UHC is a complicated process which requests financial and political commitments, civil services of public utility, active organization of civil society, technical capacity for generating and utilizing research evidence, economic growth and adopting policies to increase fiscal room. Lack of precision in defining concepts and principles of UHC seems to cause confusion in each of its three dimensions which will lead to a trade-off among its components. Therefore, a clear and explicit definition of universal coverage components will facilitate identifying barriers against achieving it. Also, due to the different processes of achieving universal coverage in various countries, investigating general models of achieving universal coverage and economic, demographic, technological and political factors can be beneficial.
88
Introduction:
Public health provision and ensuring all citizens access to primary and main services without financial burden are important functions of the governments. Therefore, maintenance and promotion of people’s health have always been one of the goals and also one of the serious challenges of different governments. Governments are aware that a healthy society is the cornerstone and agent of economic growth, development and prosperity of a country. Accordingly, in every country, providing health services for all population has always been at the heart of policies and policy makers’ plans. Universal Health Coverage (UHC) is an important step toward achieving and utilizing health services (1-2).
UHC is an expression used by World Health Organization (WHO) to describe its’ proposed strategy for “Health for All”. UHC is the basis of ensuring community’s health safety and is based on the constitution of WHO (1948) which regards health as a basic human right and has committed to ensure the highest possible level of health for all. WHO in the policy of “Health for All” approved in 1978, has stressed the enjoyment of all people from health services at the highest possible level. Also, in 2008 World Health Report, the principle of universal coverage and achieving social health indicators was emphasized (3).
According to WHO, UHC means “ensuring that all people can use the promotive, preventive, curative, rehabilitative and palliative health services they need at a sufficient quality, while also ensuring that the use of these services does not expose the user to financial hardship (4). Moving toward UHC throughout the world has increased in recent years. Accordingly, efforts to progress UHC as a series of policy reforms have been initiated in many countries since several years ago. Several evidences have been resulted on their performance regarding how much they have reached their goals and their actions and political decisions. Reforms experiences in countries such as Thailand, China, South Korea and Turkey provide valuable lessons about how to achieve UHC. Experience of different countries shows that achieving and maintaining UHC is a complicated process and requests long term political commitment and continuous adjustment in many components of health system to adapt with transient socio-economic and demographic conditions, therefore incorporating views and perspectives of individuals, groups and different stakeholders is very important in the direction of attaining UHC. Otherwise, this policy would be endangered at the stage of formulation and would be stopped by those stakeholders who feel threatened and who resist against change. Countries need a tough program to manage reform process. In addition, capacity building is necessary not only for policy formulation of universal coverage, but also for policy implementation which includes capacity building for learning from experience and accelerating the implementation. Many factors contribute in successful deployment of UHC policy, including financial and political commitments, civil public utility services, active

9
organization of civil society and technical capacity for production and making use of research evidence, economic growth and policy adoption to increase financial resources. Although, it is probable that some countries look at all these factors doubtfully, we should accept that governments in the direction of finding correct path to UHC, are able to develop all of these elements over the time (5).
Due to the increasing demand for evidence, for experiences and for methods to measure moving toward universal coverage, studying the trends of achieving universal coverage to learn from other countries’ experiences and to analyze the country’s situation can be an effective step in the direction of identifying the gap in evidence, UHC barriers and the reasons of successes and failures of each country in transition from incomplete coverage to universal coverage period. It seems that lack of precision in defining concepts and principles of UHC will cause confusion in each of its three dimensions and a trade-off among its components. Hence, explicit and clear definition of UHC components will facilitate identifying barriers to access them. Also, since the process of achieving UHC is different in each country because of their different social, economic and political factors, investigating general models of countries who have reached UHC and investigating economic, demographic, technical and political factors can be useful. Results of these surveys can serve as a practical guide to explain the policy making process influenced by evidence of UHC.
Concept of UHC:
According to WHO, UHC means “ensuring that all people can use the promotive, preventive, curative, rehabilitative and palliative health services they need, of sufficient quality to be effective, while also ensuring that the use of these services does not expose the user to financial hardship in order to achieve equity in access (6). It seems necessary to provide an exact definition of UHC, in order not to have the same fate as the “Health for All” plan, which could not lead to an extensive political and financial shift to achieve its goals despite of strong political support (7). UHC includes three aspects of costs, services, and population which is called as UHC cube. In this regard, health systems should work to cover most of health expenditures and health services and at the same time, try to prevent people to suffer from catastrophic health expenditures (4). According to this cube, health systems efforts should be directed toward covering full spectrum of essential health services for the majority of the population. Of course, access to quality health services can be regarded as the fourth dimension. Therefore, on the basis of what is expressed in the definition of UHC cube, final goal of UHC is ensuring universal utilization of health services (essential and basic) without taking financial risks or impoverishment due to health expenditures. In other words, under the UHC, individuals’ health costs should not be higher than their

1010
financial threshold ability (8).
Determinant concepts of UHC are taking appropriate legal measures regarding commitment to provide access for all population groups (In the form of a comprehensive definition of citizenship) to required health services, equity in access to all types of health services on the basis of need, protection against financial risks and catastrophic health expenditures and preventing people from falling in the poverty (3, 9, 10).
Direct payments at the time of receiving health services are still common in many countries. This issue in turn, reduces people ability to utilize services. Therefore, one of the most important challenges is moving away from OOP payments to prepayment mechanisms. Reform in financing should ensure every body’s access to health services. If people do not have access to local services or if the access to services outside their living place is very expensive, there will be no financial protections for people in practice (11).
Applying appropriate mechanisms for cost containment is essential, if not, covering the whole population and providing adequate services would be hard and long-term financial stability will not be achieved (12). Such features of UHC, emphasize on Primary Health Care as the first level of care and use global budget rather than capitation or fee for service in order to keep the whole health costs fixed. The other element is designing strategic purchase to ration health services and to direct health care provision to areas with the greatest need.
Nowadays, there is sufficient evidence about the potential of prepayment financing mechanisms and insurance to reduce these catastrophic health expenditures. Therefore, change in financing of health systems into prepayment mechanisms in a way that it can provide health care access for public is the way to meet Primary Health Care goals particularly the equity goal (11).
Different countries around the world each with different health systems and income levels, have followed various strategies to achieve UHC. Malaysia, South Korea, Mexico, and Brazil have taken general taxation, compulsory pay role participation, concentration on poor and outreach communication and family health plan development as their strategy to reach UHC respectively (13). Appropriate combination of these strategies depends on the background and context of each country including social values, economic conditions, industrial structure and their implementation power.
Relative rough path of achieving UHC holds three main features include: 1) It is a political process with various social forces providing programs and laws to assure accessibility, equity and risk pooling; 2) Health services purchasing increases when the population and income increase; 3) Causes an increase in health costs through prepayment and pooling.

11
High and middle income countries that had achieved UHC, still seek to reform their health system to combat inequities, and to improve efficiency and to reduce costs. Also, twenty two low and middle income countries are seeking UHC through resource mobilization and policy reforms. These countries intend to reform their healthcare systems as a part of UHC program to fulfill their political commitment for reducing inequity to access health services and supporting people against health care expenditures (14, 15). Therefore, in current situations paving the way of UHC deployment is one of the main concerns of different levels of health systems.
Dimensions of UHC:
Three main dimensions are defined in achieving UHC:
There are population coverage, services coverage and financial coverage.
All Population Coverage:
Ideally, all of the people of a country should be covered, at the same time, all preventive, therapeutic and rehabilitative interventions should be delivered in a manner to achieve the highest possible health standards. Also, people must not be exposed to catastrophic health expenditures or financial hardship while receiving required medical services. Figure 1.1 depicts the dimensions of UHC (16).
High Quality Services Provision:
One of the main goals of UHC is providing quality health services in order to improve health of service recipients. Quality in healthcare depends on various factors such as health care organization and wider surrounding context (5).
Figure 1.1. Three dimensions of UHC

1212
Developing appropriate indicators to observe services’ quality status and their continuous measurement can be a suitable approach to ensure quality services provision.
Financial Protections:
The willingness of all individuals to receive high quality and affordable health services has stimulated UHC movement. Although it is believed that UHC movement origins from PHC movement, but World Health Assembly (WHA) 2005 asked the governments to develop their health systems in a way that people can access health services without financial hardship. As this definition implies, UHC movement has been initiated focusing on households’ protection against diseases expenditures. Therefore, one of the key dimensions of the models introduced for UHC is that access to services for illnesses or injuries should not lead to financial difficulties. WHO report (2000) on the performance of health systems introduced household financial protection against disease costs called “Fair Financial Contribution” as one of the main goals of health systems (17, 18).
If people have to pay most of services costs out of their pocket, the poor will not be able to receive most of required health services and even rich in case of severe or long term illness will suffer heavy costs. Various forms of protections against financial risks pool funds (for example tax, other governmental incomes or insurances share), distribute financial risks of diseases and allow cross subsidy from rich to poor and from healthy to ill. This increases access to required services and protection against financial risks.
Necessity of households’ protection against catastrophic health expenditures is determined by the following main factors:
• There is no certainty about time and intensity of an illness or event, in the condition of unpredictable health services need, financial resources which were for other necessary needs of family will be consumed for health costs.
• Healthcare whether in relative or absolute terms can be very expensive, in other words, even cheap health services may be catastrophic for poor. In such conditions people might either forgo using required health services or they might pay health services costs and take the risk of poverty.
• Illnesses or events can coincide with income reductions which in turn, increase risk of poverty (12, 13).
Different studies show that financial protections can result from financial risk sharing among different group of people (pooling) and risk distribution overtime (prepayment). Pooling and prepayment help plummeting financial problems caused by uncertain health care needs, removing financial barriers of access to

13
health services and reducing disease related financial issues (19, 20).
Although, the pool size and prepayments have the main effect on the depth (proportion of costs which are covered by pooled resources) of the UHC cube, they also effects breadth of UHC (comprehensiveness of health benefits) and range (the extent of benefits which are covered). On the one hand, financial protection plays a significant role in two political goals of efficiency and equity. On the other hand, financial protection brings welfare for individuals and makes health system and macro-economic more efficient. Additionally, sufficient financial protection makes it possible for all households including the poor to readily use required health services which in turn improves equity.
In different countries, policy makers have various tools to manipulate depth of universal coverage or financial protection. In fact, the financing function of health system is very influential on this aspect of UHC. All of health systems collect, manage, and use funds. In order to reach the goal of better health, it is necessary that financing function of health systems produces adequate resources and allocates them to services in a way that leads to good performance. It is necessary to ensure risks are pooled effectively. In order to monitor health system financial performance, indicators are defined for each of financing functions. For example, to assess the effectiveness of fund collection, it is necessary to use indicators expressing the amount of potential resources available for health services. A good health financing system helps to improve health status through providing adequate resources. In addition to this, financing influences health condition through revising incentives of payers and receivers when providing and utilizing services. Financial health system, in addition to improving health status influences a range of social goals which are solidarity (fairness in payment for health system proportionate to income), financial protections (the people right regarding health system obligation to protect them against disease costs) and responsiveness (responsible use of resources). Anyway, health system financing through functions such as collecting, risk pooling and services purchasing, has a lot of effects on households’ fair financial contribution in health system and also on health outcomes and responsiveness. Changes in financing system should consider the existing financing mechanisms and social organizations which have been formed historically and also the beliefs and expectations of people about payment for health services (5, 13, 21).
UHC Financing:
UHC is the basis of ensuring community’s health security. On the one hand, the lowest economic class of the society often encounters the highest health risks and needs more health services. On the other hand, OOP make people unwilling

1414
to use health services specially promotive and preventive services and delay seeking health services. It is estimated that about 1.3 billion people around the world do not have access to health services because of poverty and disability to pay for health services or disability to pay for their subsistence costs. Decreasing reliance on direct payments lessens the financing barriers and reduces poverty generating effects of health payment systems (3).
One of the key elements of UHC financing is sharing resources to distribute financial risk of disease among the population. Health system should provide required financial credits to finance health needs of needy people and collect required funds regardless of their ability to pay (2). Countries with the most progress in achieving UHC have provided required funds through compulsory contribution of individuals who can pay, taxation, or compulsory contribution for health insurance. To reach UHC, it is necessary to use prepayment system. Prepayment means that people pay before they become ill and at the time of illness they benefit from pooled funds.
In addition, to those who can pay, there are also individuals who cannot take part in payment. Countries which are reaching UHC use tax incomes to cover the recent groups’ needs in order to ensure that all individuals have access to health services when they need.
To support low income countries where prepayment systems are not efficient and health needs are great, international aids are necessary. Investment on developing prepayment systems and resource pooling to finance health programs and projects is one of the best methods for helping the countries to get away from consumer direct payments and to provide better access to services and financial risk protection through international grants (22-25).
To sum up, there is no unique method for establishing a specific financing system for UHC. Each country should decide on the basis of methods used to utilize pooled funds and permanently adjust its priorities; because the resources are always scarce and people demands and health services technologies are increasing continuously. Such conflicts and challenges make policymakers to concentrate their decisions on three main contexts, proportion of the population to be covered, range of services to be provided, proportion of the cost to be covered (6, 22 ). Different countries go through different paths according to the types of decisions they make based on these three pillars. For example, in a system which all individuals are unable to receive health services except the rich, immediate shift to a system which cover all individuals whether poor or rich is a priority, even if health services and covered cost proportions is relatively low. Meanwhile, in a comprehensive and wide system with few exceptions, the government may select a purposeful approach to identify and to cover these cases. In such cases, we can provide more services for the poor or cover more costs (4).

15
Solving some Ambiguities about UHC:
There are the following solving:
• UHC is not just health sector financing, rather it should cover all parts of health system to succeed. Some of them are health service provision systems, health workforce, health sector facilities and communication networks, health sector technologies, information systems, and quality assurance mechanisms;
• UHC is not just ensuring a minimum health benefits package, but also ensuring rapid health services coverage progress and financial risk protection;
• UHC does not mean to cover all possible health interventions for free with no attention to their costs, no country can provide all services for free;
• UHC is not limited only to health sector. Moving toward UHC means moving toward equity, priorities development and social solidarity;
• UHC not only concentrates on covered services but also emphasizes on their coverage status, through focusing on people oriented health services and services integration. Health systems should be organized on the basis of people needs and expectations and long-term comprehensive health, to make it possible for people to better realize their health needs (3, 5, 6).
Efforts to Reach UHC in Different Countries around the World:
Currently most of European and Western and developed countries which have a high level of financial resources, have already reached UHC. Countries such as Germany based on Bismarck Insurance System, Canada based on National Insurance System and the United Kingdom on the basis of National Health Service, have reached a desirable level of UHC. Different countries are increasingly developing their health coverage as a part of efforts to improve their population social protection as determined in No. 102 Social Security Convention (minimum standards) by International Labor Organization (26-29).
Over the last decade, many low and middle income countries demonstrated that achieving and approaching to UHC is not a right of just developed and high-income countries. For example, Chile, China, Brazil, Mexico, Rwanda, Turkey and Thailand are developing countries which have taken effective actions to overcome challenges of further development of UHC. Learning from their experiences can serve as a good guide for Iran’s health system.
Thailand is one of the first low and middle income countries which has reached UHC since 2002. Countries such as China, Ghana, India, the Philippines, Rwanda,

1616
South Africa and Vietnam have used the experience of Thailand regarding health system reform and achieving UHC. Thailand constitution has emphasized all citizens’ right specifically the poor, to access health services. This important issue was included in the eighth socio-economic development plan of Thailand (1997-2001). Socio-economic development of last decades and the 25 years of experience with health financing reform have contributed in UHC success.
Turkey has reached UHC in 2014. Political commitment to healthcare system, developing a strong electronic information registry, strengthening the central system of health ministry through an increase in number and technical power of human resources, public engagement in program implementation, providing incentives to overcome resistance to change were some keys to Turkey’s success in reaching UHC.
Efforts to Reach UHC in Iran:
UHC in Iran as a developing country is one of the final goals of health system and of the most important principles of the constitution and also provisions of the general health policies which was announced by the Supreme Leader. Five years Development Plans including fourth and fifth plans have emphasized this necessity. The twenty-ninth principle of the Constitution of Islamic Republic of Iran has considered healthcare and medical care as a public right for all citizens. Accordingly, Islamic Republic of Iran has done various efforts toward UHC and achieving it is one of health system goals. Introduction of issues regarding patients’ financial protection, providing health services for all regions and similar cases in the fourth and fifth Development Plans and also in general policies for health announced by the Supreme Leader, implementation of Health Transformation Plan (HTP) and so are some evidences which prove attention to UHC in Iran’s health system. Nevertheless, these actions might be the result of years of work to achieve UHC. Hence, the next section reviews the history of Iran’s efforts to reach UHC.
Perhaps the first step to achieve UHC in Iran can be attributed to about 80 years ago. Action toward UHC in Iran initiated after the approval of the railway workers’ cautions funds formation plan in 1930. After the approval of the obligation of social security in November 1989, the responsibility of providing curative services for workers and those subject to work and social security law was entrusted to Social Security Organization (SSO). Medical Services Insurance Organization (MSIO) was established in 1995 and according to the law, healthcare insurance provision of government employees, the poor, the villagers, self-employed and other social groups entrusted to this organization (34, 35). According to 38th article of the fifth Development Plan in 2010, MISO was renamed to Iran’s Health Insurance Organization after pooling several funds. Currently, SSO and Iran’s

17
Health Insurance Organization cover the majority of the population.
Providing insurance services and covering population is one aspect of UHC and health services provision for the public is another aspect. For this, Iran has done several endeavors since about 70 years ago. Some effective ones which were carried out before introducing Primary Health Care (PHC) in Alma-Ata conference, was the development of PHC in some cities and villages of Iran (36).
It is near forty years since WHO introduced PHC as the strategy to achieve health for all at Alma-Ata Declaration in Kazakhstan. Meanwhile, many countries around the world tried to develop their health systems on the basis of PHC. Also, Iran from 1940 to 1972 underwent different actions to solve the problems about health services provision and the country’s medical human resources distribution.
Health Corps Plan from 1964, Rural Paramedic Education Plan from 1940 in Mashhad and from 1946 in Isfahan and Shiraz, Selseleh Plan in Aleshtar of Lorestan. Another important plan for developing PHC was the research project called”How to Develop Medical and Health Services” also known as Razaieh Plan which was carried out in Urmia in 1972. The main strategy of the Rezaieh Plan was training and using non-physician manpower for PHC provision and better public access to these services. In 1977, the Ministry of Health officially approved Rezaieh Plan as the main strategy to develop health services. Finally, from 1981 to 1987, Healthcare Networks Plan and health services leveling was implemented as one of the world’s most successful experiences regarding public access to health services. Then, another step was taken to provide services for villagers in 2005 when the Rural Family Physician Plan was implemented. Many studies indicate the success of family physician Plan in securing access to health services for most villagers and residents of less than twenty thousand population cities (37, 38). Finally, in early 2014, general policies which were announced by the Supreme Leader had implicit and explicit emphasis on UHC. In this year, the government strode in the direction of achieving some aspects of UHC, like lowering OOP and tried to increase the quality of services in medical centers, when it implemented the HTP. In this year and with the introduction of the second phase of targeted subsidies, a main part of revenue from targeted subsidies and also from one percent of value added tax was allocated to the health sector. On the basis of resulted resources, a Plan known as HTP has been carried out in various steps in the country. The common goal of these steps and executive plans was to reach UHC. Among executive HTP, we can name reducing inpatients cost sharing at public hospitals, supporting retention of physicians in underserved areas plan and financial protection of patients with special diseases, refractory and needy patients, which can have direct impact on UHC.
Despite the efforts done for UHC in Iran from long years ago until now, Islamic Republic of Iran still has a rough way ahead. To shorten this path we can carry out effective actions on the basis of experiences of different countries which passed the path to UHC in a short time.

1818
References:
1. Bump JB. The long road to universal health coverage: a century of lessons for development strategy: Rockefeller foundation, 2010.
2. Fendall N. Declaration of Alma-Ata. The Lancet 1978, 312 (8103): 1308.
3. Boerma T, Eozenou P, Evans D, Evans T, Kieny MP, Wagstaff A. Monitoring progress towards Universal Health Coverage at country and global levels. Plos Med 2014, 11(9): e1001731. Doi: 10.1371/journal.pmed.
4. Fried ST, Khurshid A, Tarlton D, Webb D, Gloss S, Paz C, et al. universal health coverage: necessary but not sufficient. Reproductive health matters 2013, 21(42):50-60.
5. Carrin G, Xu K, Evans DB. Exploring the features of universal coverage. Bull World Health Organ 2008,86 (11): 818.
6. Evans DB, Etienne C. Health systems financing and the path to universal coverage. Bulletin of the World Health Organization 2010, 88 (6): 402-3.
7. O’Connell T, Rasanathan K, Chopra M. What does universal health coverage mean? The Lancet 2014, 383 (9913): 277-9.
8. Lagomarsino G, Garabrant A, Adyas A, Muga R, Otoo N. Moving towards universal health coverage: health insurance reforms in nine developing countries in Africa and Asia. The Lancet 2012, 380 (9845): 933-43.
9. Carrin G, James C. Reaching universal coverage via social health insurance: key design features in the transition period. [Discussion paper no. 2]. Geneva: WHO, 2004.
10. Atun R, Aydın S, Chakraborty S, Sümer S, Aran M, Gürol I, et al. Universal health coverage in Turkey: enhancement of equity. The Lancet 2013, 382 (9886):65-99.
11. Preker AS, Lindner ME, Chernichovsky D, Schellekens OP. Scaling Up Affordable Health Insurance: Staying the Course: Washington, DC: World Bank, 2013.
12. World Health Organization. Measurement of trends and equity in coverage of health interventions in the context of universal health coverage. Meeting Report, Rockefeller Foundation Center, Bellagio, 2012.
13. Savedoff WD, de Ferranti D, Smith AL, Fan V. Political and economic aspects of the transition to universal health coverage. The Lancet 2012, 380 (9845): 924-32.
14. Mulupi S, Kirigia D, Chuma J. Community perceptions of health insurance and their preferred design features: implications for the design of universal health coverage reforms in Kenya. BMC health services research 2013, 13 (1): 474.
15. World Health Organization. The World Health Report, 2000: Health systems: improving performance, 2000.
16. Temkin LS. universal health coverage: Solution or Siren? Some Preliminary Thoughts. Journal of Applied Philosophy 2014, 31 (1): 1-22.
17. Aran M, Ozceli EA. universal health coverage for Inclusive and Sustainable Development:

19
Country Summary Report for Turkey, 2014.
18. Savedoff WD, Smith AL. Achieving universal health coverage: learning from Chile, Japan, Malaysia and Sweden. Washington DC: Results for Development Institute, 2011.
19. Anell A, Glenngård AH, Merkur S. Health Systems in Transition: Sweden: Health System Review: European Observatory on Health Systems and Policies, 2012.
20. Yip WC-M, Hsiao WC, Chen W, Hu S, Ma J, Maynard A. Early appraisal of China’s huge and complex health-care reforms. The Lancet 2012, 379 (9818): 833-42.
21. Knaul FM, González-Pier E, Gómez-Dantés O, García-Junco D, Arreola-Ornelas H, Barraza-Lloréns M, et al. The quest for universal health coverage: achieving social protection for all in Mexico. The Lancet, 2012,380(9849):1259-79.
22. Bonilla-Chacín ME, Aguilera N. The Mexican social protection system in health. universal health coverage (UNICO) Studies Series No 1. Washington, DC: The World Bank, 2013. [Cited 9 June 2014]. Available from: http:// documents.worldbank.org/curated/en/2013/01/17286333/Mexican social protection-system health
23. Patcharanarumol W, Tangcharoensathien V, Wibulpolprasert S, Suthiwisesak P. universal health coverage for Inclusive and Sustainable Development: Country Summary Report for Thailand, 2014.
24. Detsky AS, Naylor CD. Canada’s health care system-reform delayed. New England Journal of Medicine 2003, 349 (8): 804-10.
25. Docteur E, Oxley H. Health-care systems: lessons from the reform experience. OECD Economics Department Working Papers No. 374, 2003. Available from: http://dx.doi.org/10.2139/ssrn.1329305
26. Ham C, Brommels M. Health care reform in the Netherlands, Sweden and the United Kingdom. Health Affairs 1994, 13 (5): 106-19.
27. Busse R, Blümel M. Health Systems in Transition. Health 2014, 16 (2).
28. Yu S-H anderson GF. Achieving universal health insurance in Korea: A model for other developing countries? Health Policy 1992, 20 (3): 289-99.
29. Kwon S. Thirty years of national health insurance in South Korea: lessons for achieving universal health care coverage. Health Policy and Planning 2009, 24 (1): 63-71.
30. Barroy H, Or Z, Kumar A. Universal Health Coverage for Inclusive and Sustainable Development: Country Summary Report for France, 2014.
31. Universal Health Coverage for Inclusive and Sustainable Development: Country Summary Report for Brazil, 2014.
32. Elias P, Cohn A. Health reform in Brazil: lessons to consider. American Journal of Public Health 2003, 93 (1): 44-8.
33. Gragnolati M, Lindelow M, Couttolenc B. Twenty years of health system reform in Brazil: an assessment of the sistema unico de saude: World Bank Publications, 2013.

2020
34. Doshmangir L, Rashidian A, Ravaghi H, Takian A, Jafari M. The experience of implementing the board of trustees’ policy in teaching hospitals in Iran: an example of health system decentralization. International Journal of Health Policy and Management, 2014.
35. Doshmangir L, Rashidian A, Jafari M, Takian AH, Ravaghi H. Opening the Black Box: The Experiences and Lessons From the Public Hospitals Autonomy Policy in Iran. Archives of Iranian Medicine,Vol. 18, No. 07, July 2015.
36. Doshmangir L, Fakhri A. Universal health coverage and policy decisions to achieve it. Ayandehpajooh Press [In Farsi], Tehran, Iran. June 2014.
37. Takian A, Rashidian A, Doshmangir L. The experience of purchaser–provider split in the implementation of family physician and rural health insurance in Iran: an institutional approach. Health Policy and Planning. 2015:czu135.
38. Takian A, Doshmangir L, Rashidian A. Implementing family physician programme in rural Iran: exploring the role of an existing primary health care network. Family practice. 2013:cmt025.

21

2222
Effective Health Service CoverageDr Hossein Ebrahimi Poor
Dr Mehdi Yousefi
Salman Shojai
Roghieh Bayrami,
Chapter 2

23
Abstract:Many countries use crude indicators to evaluate access to health services. This cannot reflect the true story of achieving Universal Health Coverage (UHC) goal, i.e. the improvement of people’s health. Changing this approach creates a new concept for evaluation of health services access known as effective services coverage. Effective coverage as a standard and flexible tool assesses the health system performance at different levels and can measure the potential benefits which are provided by health system. The present section investigates indicators used for evaluating essential health services in Iran -which are extracted from different reports of WHO and burden of diseases report of Islamic Republic of Iran -through the lens of effective coverage of the services. Review of the findings suggests that preset structure of measuring the degree of access to UHC in Iran‚ mostly emphasizes on services coverage‚ and data collection arrangements is in a way that some of the important indicators of services coverage are not obtained. Particularly information on indicators reflecting distributional equity of health services coverage according to income‚ gender‚ residence area are incomplete which overshadows monitoring different services provision. Developing observatory system for UHC at the five levels of care provision can facilitate country’s actions to achieve universal health services coverage. This system should include:
services provision, identifying and defining indicators to assess achieving universal coverage; using effective coverage indicators instead of crude services coverage; integration of universal coverage data collection system at the Ministry of Health and Medical Education; and considering equity indicators in effective services coverage.

2424
Introduction:
Effective coverage is a fraction of potential benefits of health system that is actually provided for people through health system given its capacity. Effective coverage as a standard and flexible metric can evaluate the performance of health system at different levels. In reality, it integrates three health services components of need‚ use‚ and quality in order to evaluate health system performance (12). The component means are the following:
• Need to an intervention is measured through research information, biomarkers or alternative methods like symptoms diagnosis;
• Use indicator shows that whether the person in need of a special intervention, has received and used it or not? Related information are extracted from official registries and households studies;
• Quality measures show that whether the intended intervention has led to health improvement for the user or not (effectiveness)? Intervention quality can measure health consequences of interventions by different approaches like risk-adjusted outcomes and statistical methods.
Measuring effective coverage is more beneficial and effective than measuring crude coverage which only shows access to services, because utilizing a service does not reflect the amount of benefits achieved of that service. It is very important for health systems to measure quality in addition to services coverage. Effective coverage reflecting health needs and priorities is used as auxiliary indicator to improve plans and to assess performance. Effective coverage can reveal gaps in access and inadequacy in service delivery at local levels. WHO introduced effective coverage as an indicator for health system assessment in 2001 and stressed its assessment at the national and international level (1).
Little discrepancy between crude and effective intervention coverage in a population shows the high quality of the intervention. Considerable lower value of effective coverage than crude coverage, indicates that the system is able to provide access to the intervention but expected benefits are not achieved and quality of interventions is low (Figure 2.1.)

25
Figure 2.1. Illustration of the concepts of need, use and quality and how they relate to each other (14)
Health needs of a country are those guiding principles that determine what should be prioritized to determine effective coverage. The study of burden of disease in (2010) has shown many of these needs (3). For example in high income and developed countries, chronic and non-communicable diseases and in low income countries communicable diseases are prioritized. In order to estimate effective coverage, three components including Need, Use, and Quality should be measured at the overall level and disaggregated by the fairness of distribution. Necessary information on individual needs to an intervention, using the intervention and effects of that intervention are followed through a chain of data. Different approaches for measuring effective coverage are shown in tabl2.1.

2626
Table 2.1 Approaches to measuring effective coverage (1)
Source:Ng M, Fullman N, Dieleman JL, Flaxman AD, Murray CJL, et al. (2014) Effective Coverage: A Metric for Monitoring Universal Health Coverage. Plos Med 11(9): e1001730. Doi:10.1371/journal.pmed.1001730
Important Points at High Level Documents:
In this section analysis of the Iran’s high level documents including the Constitution (4), twenty-year vision of Islamic Republic of Iran (5), Health Transformation Plan (HTC) (6) and general health policies communicated by the Supreme Leader (7) are summarized. Totally, orientations of mentioned documents regarding effective and fair services coverage can be mentioned as following.
Health Promotion
Every person is entitled to the enjoyment of social security. This covers retirement, unemployment, old age, being laid off, being without a guardian, casual misfortune, accidents and occurrences giving rise to the need for health services and medical care and treatment, through insurance etc. Iran has people

27
who enjoy highest level of health through the most equitable and the most developed health system in the region. Health Promotion includes the following:
• Promoting physical, psychological, social and spiritual health for all;• Providing suitable facilities for human health provision during all stages of life;
• Maximum health as a right, promotion, maintenance and restoring the health and quality of life for all at the highest possible level;
• Promotion of health indicators to reach the first position in the southwest Asia.Promoting Access to Services:This item includes:
• Providing efficient physical and psychological health services;• Paying attention to social health and moving toward spiritual health;
• Providing basic needs including health, universal coverage and public enjoyment from comprehensive basic health services package;
• Improving access to health services with special emphasis on the access of squatter settlers and rural areas;
• Health provision for all;• Fair access to other services.
EquityEquity includes the following:
• The most equitable health system in the region;
• Multilateral equity in health provision and achievement, people benefit from healthcare according to their needs;
• Equity in health services utilization;• Equitable access to other services;• Equity in health outcomes;• Equity in all policies;• Equal opportunity to live safe;
• Improving vertical and horizontal equity in health services provision;
• Separation of stewardship, financing and services provision tasks in health field to attain accountability‚ equity and suitable healthcare services provision for people;
• Health distribution in the society;

2828
• Achieving health equity until 2025;
• Achieving equity in health sector;
• Increasing and improving the quality and safety of services. Comprehensive and integrated healthcare with equity orientation and emphasis on accountability;
• Public equitable access to services‚ goods and effective medicines;
• Universal access to mental health services specially in cities;
• Iran has the Most equitable and developed health system in the region;
• Regular monitoring and measuring equity in health;
• Efficiency and social equity as the main criteria for evaluating health system performance.
Investigating items of the high level documents about UHC indicates that health promotion issue and its overall promotion in proportion to other countries‚ equity in utilization of high quality health services for different population groups and different regions of the country‚ and also fair health coverage are the most important items that policymakers has considered in this section.
This section of the report aimed to determine indicators of effective coverage of health services. To determine the indicators, besides investigating the present situation of indicators in Iran, the most important indicators to study UHC around the world were identified. For this goal, the following reports and studies were selected after interviewing experts and searching databases:
• Monitoring progress towards universal health coverage (2);
• Handbook on health inequity monitoring (8);
• Managerial panel of health deputy of Ministry of Health and Medical Education1 (MOH) (10);
• Islamic Republic of Iran’s report on burden of diseases (3).
Then, the indices were entered in comparative tables. Common indices or those with more thematic relationship with the present report were selected (table 2.1.). Proper level for reporting each of the indices (such as geographical region and gender) was determined. In this stage, identified indicators were checked for data availability (both at overall and indicators distribution levels). According to identified indicators, available data in related fields of health ministry, were grouped and analyzed in three main categories:
1-most of the present data has been taken from health information management panel of Ministry of Health and Medical Education

29
• Indicators showing effective services coverage;
• Indicators by which effective services coverage can be calculated after some modifications;
• Indicators which just show the amount of services use and can be used as supplementary indicators.
Effective Health Services Coverage Status in Iran:
Table 2.2 provides the list of studied indicators and related explanations of each one. Other tables and diagrams of this section (Tables 2.3, 2.4, 2.5, and 2.6 and Figure 2.1, 2.2, and 2.3), illustrate the value of each indicator disaggregated by different provinces -if related data exist. Indicators for which data of the distribution by gender or place (rural/ urban) was available, are presented separately.

3030
Table 2.2 Studied indicators and their descriptions
Main indicator Description
Planned pregnancies percentage
Prenatal care coverage (at least 6 times) This indicator is four times care according to WHO report, however in Iran, it is collected as the minimum of six times care.
Maternal mortality rate
(per hundred thousand live births)
To some extent, this index demonstrates effectiveness of prenatal care services
Measles, Mumps and Rubella vaccination coverage percentage
Being sure about the receipt of this vaccine by the targeted population, it is possible to extract this service effectiveness out of the reported effectiveness
Confirmed incidence of Measles per one million This can be used as a complementary indicator for Measles vaccination
Percentage of rural families who access safe drinking water
In this index, access means families who are in 1 km or 20 minutes distant from the safe drinking water source.
Rural families rate who access hygienic toilet This index is based on the definition by the office of the environmental and occupational health of health ministry
Non-smoker percentage Studying the trend of this index provides good information on services effectiveness.
Childbirth percentage by trained person Trained person definition matches with that of health ministry
Percentage of (AIDS) positive HIV covered by triangular centers
Studying the trend of this indicator provides good information on services effectiveness.
Tuberculosis Overall case finding rate per one hundred thousand(New incidence of tuberculosis per one hundred thousand population)
-
The percent of treated smear positive tubercular patients
This indicators shows the effectiveness of provided services to cure TB.
The percent of hypertension individuals receiving care We have information of people with hypertension by each province separately. Data

31
...are collected every few years through surveys.
The percent of diabetic individuals receiving care We have information of people with diabetes by each province separately. Data are collected every few years through surveys.
High blood sugar ( 25-70 years old individuals whose FBS is higher than 126 )
Percent of mammography performed (women aged 35 and above)
This index and breast cancer incidence index can be used to show the effectiveness of services
Breast cancer (crude cancer incidence rate in women per one hundred thousand)
-
Pap smears percentage (18-65 years aged married women)
This index and cervical cancer incidence index can be used to show the effectiveness of services
Cervical cancer (crude cancer incidence rate in women per one hundred thousand)
-
12-years old children percentage with decayed, missing or filled teeth
This index is provided as a representative for oral services
Individuals' percentage in need of cataract surgery who had been operated.
-
The percentage of natural child birth Studying this index trend shows effectiveness of services related to natural childbirth promotion
Slight mental disorders ( new identified patients per thousand covered population)
Studying this index trend shows some information about these services effectiveness
Severe mental illness(new identified patients per thousand covered population)
Studying this index trend shows some information about these services effectiveness
Exclusive breast feeding percentage Studying this index trend shows some information about these services effectiveness
High blood cholesterol(the percent of25-70 year aged people with cholesterol higher than 126 in 2011)
-
Micronutrients status This index includes percentage of Zinc, vitamin A, vitamin D deficiency and anemia
Percentage of Overweight or obese People -

3232
Ta
ble
2.3
se
lecte
d h
ea
lth in
dic
ato
rs d
isa
gg
reg
ate
d b
y p
rov
ince
in 2
01
3
Pro
vin
ce
Pla
nn
ed
p
reg
na
ncy
(%
)
Pre
na
tal c
are
co
ve
rag
e (%
)
MM
R (M
ea
sle
s,
Mu
mp
s a
nd
R
ub
ella
co
ve
rag
e
(%)
Acce
ss to
sa
fe
drin
kin
g w
ate
r
in r
ura
l are
as
(%)
Acce
ss to
h
yg
ien
ic to
ilet
in r
ura
l are
as
(%)
La
bo
r b
y
train
ed
p
ers
on
(%)
Ove
rall
TB
ca
se
fi
nd
ing
p
er
10
0,0
00
Alb
orz
-9
0.8
99
10
09
5.8
97
13
.52
Te
hra
n-
90
.59
99
9.9
99
49
7.4
14
.5Is
fah
an
-9
6.5
99
99
.87
91
99
.76
.87
Gh
azv
in7
6.4
92
.72
99
99
.79
91
98
.46
.1G
uila
n7
4.9
97
.59
98
9.6
88
8.6
10
02
4.1
6Fa
rs-
83
.69
99
9.3
38
19
7.4
4.6
4Ya
zd
67
.59
2.6
99
99
.58
94
.39
5.5
11
.63
Bu
sh
eh
r7
2.1
96
.59
99
9.2
29
2.5
10
07
.51
Se
mn
an
-9
4.4
99
99
.94
92
.19
7.4
11
.88
Kh
uze
sta
n6
8.4
86
.49
99
8.3
29
19
8.9
19
.68
Ma
za
nd
ara
n-
93
.99
99
9.7
78
29
8.3
12
.27
Ma
rka
zi
61
.49
5.9
99
99
.96
86
.99
8.8
12
.76
Qo
m5
7.8
89
.49
49
9.3
99
3.6
10
01
5.7
8C
ha
ha
rm
ah
al a
nd
B
ak
hti
ary
7
0.5
96
.79
99
9.3
59
9.8
10
02
.33
Ilam
68
.79
4.2
99
99
.88
79
.71
00
8.7
5G
ole
sta
n7
2.1
88
.19
99
8.7
77
4.6
99
.15
0.8
2R
aza
vi-K
ho
rasa
n-
-9
99
9.8
48
4-
17
.65
So
utt
h-K
ho
rasa
n6
4.7
93
.69
99
6.8
86
.61
00
18
.26
No
urth
-Kh
ora
sa
n-
82
.19
99
8.8
76
4.4
98
.61
2.6
2K
erm
an
-8
3.8
99
97
.91
64
92
.91
2.0
7
Ho
rm
ozg
an
66
.28
1.4
99
96
.78
5.9
94
.11
4.8
6
Ea
st-A
za
rb
aye
jan
74
.68
9.9
99
99
.71
80
99
.57
.36
Za
nja
n6
6.5
94
.99
99
9.9
87
1.2
10
08
.09
Ha
me
da
n-
94
.39
99
9.7
97
1.3
10
06
.33
Ke
rm
an
sh
ah
74
90
.29
99
9.4
87
3.1
96
.81
4.8
1K
oh
gilu
ye
h a
nd
Bo
uye
r-A
hm
ad
65
.49
6.1
99
98
.97
79
98
.35
.12
Ard
ab
il7
0.2
88
.79
99
7.3
58
01
00
13
.49
Lo
resta
n7
2.6
92
.99
99
7.2
87
7.1
10
01
1.3
5W
est-A
za
rb
aye
jan
71
.48
9.2
99
98
.97
81
.91
00
7.2
Ko
rde
sta
n5
9.5
90
.39
99
9.8
77
69
7.3
11
.1S
ista
n a
nd
B
alu
ch
esta
n-
96
.59
98
4.2
77
37
0.3
47
.98
Esa
st-M
ed
iterra
ne
an
-a
ve
rag
e-
39
83
87
68
58
10
9
Glo
ba
l ave
rag
e-
56
84
90
64
72
12
2N
ati
on
al a
ve
rag
e 2
01
1-
--
--
--
Na
tio
na
l ave
rag
e 2
01
2-
-9
89
7.5
38
0.4
-7
.09
Na
tio
na
l ave
rag
e
20
13
--
99
97
.86
81
.2-
-

33
Table4.selected health indicators disaggregated by provinces in 2013
Province High blood sugar (%
) Breast cancer (%
) Natural Childbirth (%
) Slight m
ental diseases (%
) Severe m
ental disease (%
) Exclusive breast feeding (%
) High blood cholesterol (%
)
Alborz 11.15
19 37
5.2 1.26
52.25 -
Tehran 6.09
35 33.4
1.8 0.07
49.93 35.01
Isfahan 35.8
27 44
0.2 0.03
43.07 37.09
Ghazvin 27.7
15 40.1
1.3 0.23
39.12 34.35
Gilan 8.45
22 26.2
0.17 0.07
85.65 42.03
Fars 10.08
27 44.8
0.6 0.11
47.17 40.01
Yazd -
26 47.9
0.08 0.03
33.11 29.65
Bushehr 8.65
18 47.3
0.05 0.05
45.57 25.01
Semnan
10.65 20
39.4 0.56
0.12 55.47
49.08
Khuzestan 8.85
24 53.6
0.45 0.35
34.3 22.75
Mazandaran
6.95 25
30.9 1
0.11 64.87
42.09
Markazi
12.05 28
45.9 0.4
0.09 41.52
37.06
Qom
7.55 10
43.4 0.1
0.14 63.64
49.95
Chaharmahal and Bakhtiary
5.75 16
55.7 0.6
0.1 70.42
31
Ilam
5.02 10
44 0.3
0.1 38.56
28.02
Golestan 10.09
15 49
0.2 0.6
61.07 35.08
Razavi-Khorasan 7.05
19 56.5
1.5 0.1
55.32 31.07
South-Khorasan 5.15
11 58.9
0.24 0.07
54.86 32.65
Nourth-Khorasan 15.55
9 64.4
0.8 0.25
52.88 39.45
Kerman
7.06 17
53.6 1
0.01 59.7
23.85
Table2.4 selected health indicators disaggregated by provinces in 2013

3434
Hormozgan
4.01 8
57.8 0.19
0.04 51.71
37.06
East-Azarbayejan 12.08
22 34.1
- -
58.76 27.05
Zanjan 9.95
10 60.7
1.34 0.1
71.89 49.05
Hamedan
11.03 18
56 -
- 64.18
23.07
Kermanshah
85.6 19
46.8 0.15
0.09 42.56
22.08
Kohgiluyeh and Bouyer-Ahmad
9.06 11
55.9 8.1
1.2 42.45
28.35
Ardabil 4.07
10 35.3
0.5 0.05
68.75 40.04
Lorestan 10.55
15 57.8
0.06 0.02
69.84 50.09
West-Azarbayejan
5.55 22
55.5 1.04
0.2 67.99
25.95
Kordestan 8.95
14 61.7
0.18 0.07
74.82 29.03
Sistan and Baluchestan 65.9
5 76
0.69 0.21
47.44 33.65
Esast-Mediterranean-average
22.6 -
84 -
- 36
-
Global average 11
- 84
- -
37 -
National average 2011 13.79
- -
0.85 0.14
- 27.97
National average 2012 -
21 44
0.84 0.15
53.1 -
National average 2013 -
- 46
- -
- -
- : Data is not available
...

35
Table5. M
icronutrient deficiency percentage in different age groups disaggregated by climates
Micronutrients
status(11) Targeted population
National
Climate
area 1 Clim
ate area 2
Climate
area 3 Clim
ate area 4
Climate
area 5 Clim
ate area 6
Climate
area 7 Clim
ate area 8
Climate
area 9 Clim
ate area 10
Climate
area 11
Zinc deficiency percentage
15-23 months
old children 20
14 15
14 20
19 30
30 14
20 11
31
6 years old children
13 9
14 9
9 19
17 18
17 13
8 17
14-20 years old teenagers
11 7
19 5
9 14
12 20
15 12
6 13
Percentage of vitam
in A deficiency(slight and severe)
Pregnant w
omen
28 24
23 16
34 23
41 40
30 21
16 36
15-23 months
old children 20
11 18
28 22
23 29
36 20
21 31
23
Percentage of vitam
in D deficiency
Pregnant w
omen
86 82
76 95
88 81
86 92
89 87
78 91
15-23 months
old children 24
11 18
28 22
23 29
36 20
20 31
23
6 years old children
62 66
71 51
72 66
68 75
57 42
59 51
Teenagers 76
84 86
79 87
75 68
71 71
63 77
78
Middle-aged
61 64
72 68
73 59
59 68
47 45
54 62
Anemia
percentage (low
Hem
oglobin)
Pregnant w
omen
16 17
11 23
11 26
10 29
11 9
15 15
15-23 months
old children 20.7
15.1 15.4
39.7 18.5
42 13
28 8
17 15
17
6 years old children
11 13
7 16
9 23
7 18
7 6
12 7
Teenagers 10
10 7
13 8
21 5
18 6
8 9
9
Middle-aged
11 14
7 15
8 19
8 19
9 7
12 8
*Climate1:Guilan and Mazandaran, clim
ate2: East and West Azarbayejan‚ Ardabil, clim
ate3:Golestan‚ North of
Khorasan, climate4:Sem
nan‚ Center of Khorasan, climate5: Sistan and baluchestan‚ South of Khorasan‚ East of
Kerman, clim
ate7:bushehr‚ Hormozgan‚ Khozestan, clim
ate8: Tehran‚Alborz, climate9: Zanjan‚ Ghazvin‚ Q
om‚
Markazi clim
ate10: Ilam‚ Kordestan‚ Kerm
anshah‚Lorestan‚ Hamedan‚ Kuzestan, clim
ate11:Fars‚ Kerman‚
Kohgiluyeh and Bouyer-Ahmad
Table2.5 Micronutrient deficiency percentage in different age groups disaggregated by clim
ates

3636
Figure 2.1 Nonsmokers aged 15-65 by province, 2013

37
Figure 2.2 People without overweigh aged 15-65 by province, 2013

3838
Figure 2.3 Comparing 15-65 aged individuals with high blood pressure in different provinces by gender, 2013

39
Table 2.6 Selected risk factors of non-communicable diseases over the country disaggregated by age, 2006-2009
Findings about treatment of patient with tuberculosis showed that treatment success rate for smear positive individuals in Iran is equal to 85%, in Eastern Mediterranean Region (EMR) equal to 88% and the global average of this indicator is 87%.
Challenges in Iran and Analysis of Health Services Effective Coverage:
Tables and Figures which were illustrated in previous sections provided an image of present situation of the studied indicators. However, we should be careful while using these indicators to judge on effective services coverage situation, because it is possible that questions or ambiguities still remain about these indicators and their role in proper judgments on real health services coverage.
Indicators which were presented in previous sections are subject to scrutiny from two aspects:
• Usefulness of the indicators for judgment about effective services coverage situation;
• Usefulness of the indicators for judgment about equity situation.
Usefulness of Indicators for Judgment about Effective Services Coverage Situation
As mentioned in the introduction, measuring crude coverage just shows the amount of services used and is unable to show acquired benefits by users. Therefore, health systems should measure services quality (effectiveness) in addition to crude coverage. Hence, in this section it is tried to discuss the indicators presented in the previous section on the basis of their ability to show services impact. Generally, we can study the indicators in the following three groups:
• Indicators which show effective service coverage;
• Indicators by which we can calculate effective service coverage after some modifications;
• Indicators which just show the amount of service use and can be used as complementary indicators.
Year Percentage of daily smokers
Percentage of overweigh individuals
Percentage of individuals with hypertension
Male Female Male Female Male Female2006 20.82 0.86 24.11 22.75 18.56 16.142007 21.65 0.88 40.39 51.75 17.63 17.122008 21.19 0.81 38.78 49.85 16.55 17.12009 20.39 1.02 39.04 48.99 16.07 16.12

4040
On this basis, the first category consists of indicators such as planned pregnancy percentage, number of annual confirmed measles cases, incidents of measles, number of identified HIV positive cases, and incidence of Tuberculosis which can evaluate some health services impact. Each of them has operational considerations regarding their collection and verification, which should be incorporated in their related planning. For example, planned pregnancy percentage indicator shows level of effective services which are related to training and consultation etc. Now, required data for calculating this indicator in rural regions of the country are gathered and recorded accurately, although it is not the case for some provinces. In urban areas, this indicator is not covered completely. Since the indicator of childbirth has done by trained person is more than 95% in most provinces, it is possible to achieve at least 95% information about planned or unplanned pregnancies in this way or trough appropriate instruction. Maternal mortality and stillbirth rate may be considered as suitable indicators to show good coverage of prenatal care and childbirth services by a trained person. The index of low birth weight rate (birth weight less than 2500g), is another indicator which provides information about effective services coverage level which relate to improvement of nutritional status of pregnant women and prenatal trainings. This indicator can be analyzed according to socio-economic status or living area.
Second category of indicators is those which can be used to show effective coverage of some health or health-related services. These indicators include vaccination coverage, cancer incidence in community, percentage of Zinc deficiency, percentage of anemia, vitamin D deficiency, vitamin A deficiency, percentage of smokers, prevalence of overweight and obesity, prevalence of high blood pressure, high blood sugar, and high blood cholesterol. Although, Measles, Mumps and Rubella vaccination seems to reflect services coverage, but in fact they just show services use. Probably proper index to show effective coverage is the annual incidence of Measles, Mumps and Rubella per one million populations. However, in the case of vaccination, lack of immune response can be resulted from the effectiveness of vaccine itself. Since the information on vaccine effectiveness can be achieved from related studies and producer companies, this indicator can be used indirectly to show immunization effectiveness against a disease –such as Measles. The information about these indicators can be extracted from Iran Disease Management Portal (Communicable Diseases) in MOH. Some other indicators in the second category are Zinc deficiency percentage, anemia percentage, vitamin D deficiency, vitamin A deficiency and cigarette smoking rate. Studying these indicators over the time - time series shows the effectiveness of provided services to improve their situation. The third category consists of indicators such as prenatal care coverage, access to safe drinking water and delivery by trained person and shows use of services as mentioned and can be used as complementary indicators. Prenatal care coverage indicator -fraction of women who have received prenatal care at least six times- does not directly show effective services coverage and just shows a percentage of targeted population

41
who have received services. But, this indicator is among indicators which have been considered as a key indicator in WHO report -monitoring progress toward universal health coverage (2). However, analyzing the usefulness of this indicator is helpful, just when other related indicators like maternal and neonatal mortality rate be used. The next indicator of this category is access to safe drinking water which shows using this service. Like previous indicators, there are questions about its effectiveness. These are indicators which are included in WHO report to show progress toward in UHC. Lack of access to safe drinking water causes diseases such as diarrhea and dysentery. But it does not mean the only cause of these diseases is lack of access to safe water, therefore studying all related disease and linking them to lack of access to related services will have lots of problems and limitations. Accordingly, standard definitions for drinking water and access to it make it possible for these indicators to provide a good image of service effectiveness status. Delivery by a trained person although cannot indicate the reduction of complications resulted from failure in providing or receiving service, but it can be used with other indicators such as maternal mortality rate. Of course, this indicator can be regarded as prenatal care impact on increasing pregnant women awareness.
Usefulness of Indicators for Judgment about Equity Situation
Findings showed Iran is in a good condition in most of studied indicators compared with the EMR countries and the global average. However, Iran is weaker in some indicators such as natural childbirth rate, overweight, high blood pressure compared with EMR and global average. Changing pattern of diseases to non-communicable ones on the one hand and policymakers need to judge about indicators distribution in terms of socio-economic, geographical and gender on the other hand, necessitates appropriate data. Now two key questions are raised:
• Are diseases pattern changes monitored well? For example, does required data to determine non-communicable disease coverage gathered regularly?
• Does available indicators are useful to judge about their distribution (from equity point of view)?
About the first question, despite appropriate status of Iran’s health indicators compared with the region (of course overall), we should know that all required indicators for health situation monitoring in the country are not collected systematically, especially with the consideration of disease pattern change to non-communicable disease. In other words, there is no specific system to collect routine data about these diseases. In the other hand, studying the indicators presented in previous section shows that some of them are not being gathered comprehensively or there is not a determined system to collect them. For example, mammography or eye surgery rate are indicators that WHO suggested to study them, but related data are not collected specifically in Iran. This issue shows that we do not have a certain system to monitor part of diseases. Because

4242
Iran’s health network system does not coincide with these requirements. In another words, health network system from its inception has worked very well for coverage and monitoring of many diseases especially communicable ones which were dominant epidemiologic pattern of the country. With the change of diseases pattern to non-communicable diseases over time, this system was not able to adopt with coverage and monitoring requirements. Therefore, modifications in health network of the country, according to these needs, can create appropriate opportunities for better coverage and monitoring.
About the second question, it should be mentioned that according to WHO report, equity in effective services coverage should be studied in three dimensions; 1) accessibility on the basis of geographical regions (provincial or rural and urban areas); 2) gender; 3) and different income levels. Effective services coverage in different income groups of the population is one of the most important indicators of equity in access to health services. Present study shows that data related to service coverage are not gathered on the basis of income. Importance of this indicator necessitates regular data collection on the basis of income.
Analyzing existing data shows a deep gap in most of the indicators between the provinces with best and worst performance‚ including Twenty percent gap in planned pregnancies, 33 percent gap in prenatal care coverage, considerable gap in maternal mortality rate and incidence of measles, 16 percent gap in access to safe drinking water, 30 percent gap in access to hygienic toilet, 30 percent gap in access to delivery by a trained person, 11 percent gap in diabetes incidence, 30 percent gap in breast cancer incidence, 45 percent gap in natural labor rate, 50 percent gap in exclusive breast feeding, 30 percent gap in people with high blood cholesterol.
There is a large gap in micronutrient deficiency distribution status, for example there is more Zinc micronutrient deficiency in Kermanshah, Kurdistan, Lorestan, Hamadan and Khuzestan and more vitamin A deficiency in Golestan compared with other provinces. However, we should be more cautious when analyzing some indicators such as breast cancer and maternal mortality in provinces such as Tehran, because this province is the referral of many provinces of the country. Findings show that data about some indicators are not available exactly at provincial level such as percentage of HIV positive (AIDS) individuals covered by triangular centers, percentage of people with high blood pressure or cared diabetes in urban population, Pap smear percentage, and 12-years-old children with decayed, missing or filled teeth.
A significant part of required data for effective coverage are not separately available for urban and rural areas, this mainly results from the lack of active data collection system in urban areas. Currently, an important part of health data is gathered at the rural level with an acceptable accuracy, therefore it seems necessary to develop specific system of data collection in cities. Table 2.7 shows availability status of surveyed indicators over the country on the basis of income, province, urban/ rural areas, and male/ female.

43
Table7. Availability of studied indicators in Iran and information gap related to each one
M
ain indicator Total country
Provincial Urban and rural areas
Male and fem
ale Incom
e level
Planned pregnancies percentage Available
Available Not available
- Not available
Prenatal care coverage (at least 6 times)
Available Available
Not available -
Not available
Maternal m
ortality rate (Per one hundred thousand live birth) Available
Available Not available
- Not available
MM
R vaccination coverage percentage Available
Available Not available
- Not available
Incidence of confirmed m
easles in million
Available Available
Not available Not available
Not available
Rural families rate w
ho access safe water
Available Available
- -
Not available
Rural families rate w
ho access hygienic toilet Available
Available -
- Not available
Non-smokers percentage
Available Available
Not available Available
Not available
Labor by trained person percentage Available
Available Not available
- Not available
Percentage of HIV positive(AIDS) individuals covered by triangular centers
Available Not available
Not available Not available
Not available
Tuberculosis Overall case finding rate in each one hundred
thousand Available
Available Available
Available Not available
Treated smear positive individuals rate
Available Not available
Available Available
Not available
Percentage of people with hypertension
Available Not available
Not available Not available
Not available
Cared diabetic patients percentage Available
Not available Not available
Not available Not available
High blood sugar Available
Available Not available
Not available Not available
Mam
mography rate
Not available Not available
Not available -
Not available
Breast cancer Available
Available Not available
- Not available
Pap smear percentage
Available Not available
Not available -
Not available
Table2.7 selected health indicators disaggregated by provinces in 2013

4444
Cervical cancer Available
Not available Not available
- Not available
12-years-old children percentage with decayed, m
issing or filled teeth
Available Not available
Not available Not available
Not available
Individuals' percentage in need of cataract surgery who has
been operated. Not available
Not available Not available
Not available Not available
Natural labor percentage Available
Available Not available
- Not available
Slight mental disorders
Available Available
Not available Not available
Not available
Severe mental illness
Available Available
Not available Not available
Not available
Exclusive breast feeding percentage Available
Available Not available
- Not available
High blood cholesterol Available
Available Not available
Not available Not available
Micronutrients status
Available Available
Not available Not available
Not available
Percentage of overweight or obese People
Available Available
Not available Available
Not available
...

45
Challenges
• The previous discussion reveals the following challenges in effective coverage of services:
• Data that are currently gathered in healthcare system, generally shows crude services coverage and amount of services use;
• In spite of disease pattern change, health system of the country has not coincided properly for services coverage;
• The observatory of services coverage of non-communicable diseases is not done systematically;
• Distribution condition of many indicators by geographical, population and socio-economic characteristics are not reported;
• Health services coverage reports show that health system of the country is not commensurate with its stewardship role i.e. comprehensive observatory of health situation and effective factors in all fields;
• Registry system for some diseases is not reliable at the health centers level;
• Available data are generally about the first and second level of services provision, collected from health centers of the health network and there is not coherent data in effective services coverage at the third to fifth level of service provision system.
Lessons Learnt from other Countries:
Although, essential health services coverage is desirable in many countries, results of some studies show there is no evidence about effectiveness and usefulness of these services. For example, access to antiretroviral therapy in Africa is high but few studies has been done to show their effectiveness. A study on effective coverage of antiretroviral therapy for treating 4,775 patients which was carried out through a retrospective cohort study in eastern regions of Uganda from 2004 to 2009 indicated that despite national report on antiretroviral therapy coverage, service effective coverage was low. Low access to services, poor follow-ups and low quality registered data were some of problems that caused low effectiveness of service coverage. The results of the mentioned study helped Uganda’s Ministry of Health to plan for bridging the gap in treatment of this illness (12).
Mexico’s Ministry of Health set health priorities to test health system

4646
performance. The priorities consisted from maternal and child health interventions (vaccinations, prenatal care and delivery by a trained person) and interventions for non-communicable diseases (cancer screening and high blood pressure treatment). Although, selected interventions did not cover all health needs, but it could reflect health needs and priorities at a desirable level (13). Mexico’s Ministry of Health used effective coverage to show progress in health services improvements and to evaluate the health reform of that country in 2002. This helped ministry of health to identify available gaps in people access to effective interventions and helped the regions which were in an undesirable level of coverage (13). Available gap in access to services and inadequate service provision demonstrate people still could not treat hypertension effectively despite good access.
Future Orientations for Iran:
There are future orientations are the following:
• Considering effective services coverage instead of level of service use in policies development and health system programs;
• Development of a comprehensive system for monitoring level of achieving to UHC as means that UHC observatory;
• Integrating data collection system at MOH level as the health steward;
• Identifying and defining evaluation indicators of access to effective services coverage in five levels of health services provision;
• Paying attention to equity indices in effective services coverage;
• Culture-building and training about developing indicators and health system evaluation on the basis of effective coverage concept at the university of medical sciences headquarters level (local level).
Practical Considerations to Develop Effective Services Coverage in Iran:
The Practical Considerations are the following:
• Training professional Human resources for assessing effective health services coverage;
• Creating appropriate atmosphere to criticize findings of effective health

47
services coverage assessments;
• Developing a single website for information dissemination and access to required data for effective health services coverage assessments;
• Devoting financial resources to support information collecting system launch;
• Using national media for culture-building for effective health services coverage;
• Creating an incentive mechanism for successful universities and organizations to manage information in the field of effective health services coverage;
• Creating integrated infrastructure for data collection at health ministry level;
• Supporting revision projects and national health indicators development;
• Revising health information panel at the national level using effective health coverage approach;
• Developing the reporting system on the basis of knowledge translation system;
• Developing legal requirements concerning data collection and dissemination at different levels of health system;
• Reviewing other countries experiences concerning health system monitoring indicators.

4848
References:
1. Ng M, Fullman N, Dieleman JL, Flaxman AD, Murray CJ, Lim SS. Effective coverage: a metric for monitoring universal health coverage. Plos Medicine 2014, 11 (9): e1001730.
2. World Health Organization. Monitoring progress towards universal health coverage at country and global levels: framework, measures and targets, 2014.
3. Naghavi M, Abolhassani F, Pourmalek F, Lakeh MM, Jafari N, Vaseghi S, et al. The burden of disease and injury in Iran 2003. Population Health Metrics 2009, 7(1):9.
4. Constitution of the Islamic Republic of Iran, 24 October 1979. {Cited 6 April 2015]. Available from: http://www.refworld.org/docid/3ae6b56710.html.
5. Vision of Islamic Republic of Iran in 2025. [Cited 17 Jan. 2012]. Available from: http://rc.majlis.ir/fa/law/show/132295.
6. Ministry of Health and Medical Education. Health Reform Map. Tehran: Ministry of Health and Medical Education, 2012.
7. The Leaders Office. Health Main Policies, Tehran. The Office of Supreme Leader, 2014. [Cited 4 March 2015]. Available from: http://www.leader.ir/langs/fa/index.php?P=contentshow&id=11651.
8. World Health Organization. Millennium development goals, 2008.
9. World Health Organization. Handbook on health inequality monitoring with a special focus on low-and middle-income countries. Geneva: World Health Organization, 2013.
10. Ministry of Health and Medical Education (mohme). Management of Health National Center for Statistics and Information Technology. National indicators of health 2009 [Cited 12 Jan. 2014]. Available from: http://it.behdasht.gov.ir/page/%D8%B4%D8%A7%D8%AE%D8%B5%D9%87%D8%A7%DB%8C+%D9%85%D9%84%DB%8C+%D8%B3%D9%84%D8%A7%D9%85%D8%AA+
11. Nutrition Office of Ministry of Health and Medical Education, National Integrated Micronutrients Survey-2012 (NIMS2), Terhan, Ministry of Health and Medical Education, 2013.
12. Scheibe FJ, Waiswa P, Kadobera D, Müller O, Ekström AM, Sarker M, et al. Effective Coverage for Antiretroviral Therapy in a Ugandan District with a Decentralized Model of Care. Plos one 2013,8(7):e69433.
13. Lozano R, Soliz P, Gakidou E, Abbott-Klafter J, Feehan DM, Vidal C, et al. Benchmarking of performance of Mexican states with effective coverage. The Lancet 2006, 368 (9548): 1729-41.

49

5050
Chapter 3Range Of Services
Dr Ali Jannati Dr Ali Imani
Vahideh Sadeghi

51
Abstract:Universal health coverage (UHC) to promote health systems and to improve health and its distribution is at the heart of governments efforts. In the way to reach UHC‚ we should ensure providing a proper service mix. Therefore, countries should prioritize and select services based on explicit criteria.
One of the UHC aspects is giving priority to services which benefit more people and reduce the amount of direct out of pocket payments (OOP). It is necessary for countries and health systems to answer basic questions such as: “which services should be developed first, who should be prioritized and how can we shift from direct payments to compulsory prepayments?”
This chapter intends to identify and categorize the most important criteria used in selecting range of services toward achieving UHC. For this purpose‚ according to the most well-known available criteria‚ available service packages situation in Iran (basic and curative)‚ are analyzed and related topics are presented. Then‚ according to available models in different countries‚ present and future challenges will be discussed and practical considerations will be provided.

5252
Introduction:
Health and access to health services is indisputable right of every human. Maintaining and promoting health is necessary for human socio-economic development and welfare. Therefore the states should provide minimum set of essential health services for everybody.
Universal health coverage (UHC) to promote health systems and to improve health and its distribution is at the heart of governments efforts. In the way to reach UHC‚ we should ensure providing a proper service mix. Therefore, countries should prioritize and select services based on explicit criteria.
World Health Assembly (WHA) resolution in 2005 declares everyone should be able to access to health services free from financial limitations. However timely access to health services consisting from preventive‚ promoting‚ curative and rehabilitative services are also essential. For achieving this goal, we should focus on key questions like: what services should be provided? For who should be provided? If required, how they should be rationed? What is the best strategy or combination of strategies for services provision? And so on.
Range of Health Services:
Combination of services to be covered is one of the most basic factors which relates directly with population health and protection against financial risks. Selected services should include an extensive range of services in four level of preventive‚ promotive‚ rehabilitative and palliative care (1).
Preventive and promotive services should include individual services built on population-based interventions. When different types of services are funded from different budgets, mechanisms must be in place to ensure optimal allocation of resources. Regardless of different types of services‚ UHC needs to consider important causes of morbidity and mortality. UHC also requires services to respond effective treatment of non-communicable diseases including mental disorders and injuries.
Achieving UHC requires people to access services they need without fear of financial effects. Therefore it is necessary to answer two following questions:
• Do people receive services which they need?
• Do people enjoy good protection against financial risks?
For answering these questions we should remember that there is no agreement on range of measures which are used in different countries. Some of the

53
countries use implicit measures in addition to explicit ones, for example some countries explicitly focus on a range of services aimed to the whole population or part of it with the least coverage. Anyway‚ choosing a range of services should not be limited to service development at times when the country access to new resources.
According to World Health Organization (WHO) guideline‚ measurement principles of range of health services at the countries level are depicted in Figure 3.1.
The aim is to monitor coverage with interventions addressing the main causes of ill health, ranging from promotion to palliative care. The interventions should also cover a mix of health services delivered at the different levels of care (1).
Range of Services Selection Criteria:
Health services and interventions have a great range. A large collection of indicators and criteria can be chosen for priority setting and services selection and observatory of health services. Nevertheless‚ according to WHO each country should choose a set of criteria on the basis of mentioned framework in accordance with monitoring capacity of UHC and data system.
Figure 3.1 Framework for measurement and monitoring of the health services coverage component of UHC
In order to achieve UHC‚ careful services selection plays an important role. Now‚ at national level‚ there are a range of various criteria to choose prioritized services

5454
and optimal service mix. Most of common criteria in different countries basically use two main goals of health system including population health improvement and equitable access to effective services and healthcare distribution.
According to WHO‚ priority setting‚ selecting and developing services should be carried out systematically and on the basis of explicit predetermined criteria including (1):
• Cost-effectiveness ;
• Severity of illness (need‚ intensity and urgency);
• Protection against financial risks.
All criteria should be adjusted based on conditions and requirements of any country. Therefore‚ social responsibility and collaborative contribution are inevitable. Nevertheless‚ there is a collective agreement on a main criterion which is cost-effectiveness.
Services priority setting by cost-effectiveness evidence is a common method over the world to provide the most possible health benefits using a specific amount of budget. On this basis‚ many national and international initiatives suggest that health services should be prioritized primarily based on cost-effectiveness evidence.
Exclusive focus on cost-effectiveness is generally found to be indefensible. Cost-effectiveness criterion is concerned solely with the number of healthy life years. This analysis thus counts every additional healthy life year as equally important, no matter whether the additional benefit would accrue to a person with very bad health or to someone with only a small reduction in health state. Fairness, however suggests that providing a health improvement of a fixed size to someone who (without it) would have less health takes priority over providing that health improvement to someone who would have more health. In other words, fairness recommends priority to services benefiting the worse off. Priority to the worse off —as one among other criteria— also has a firm grounding in the theory of fair distribution. As for policy, priority to the worse off —often with reference to “need,” “severity,” or “urgency”— has also figured centrally in many national guidelines on priority setting, including those in the Netherlands, Norway and Sweden.
Furthermore, health systems are able to give higher priority to services and interventions which affect the poor. Protection against financial risks is a key reason to follow UHC. Large OOP for health services can cause severe financial strain on a patient and his or her family. Therefore‚ reducing OOP is essential for progress toward universal coverage. Financial protections can be relevant when choosing services (1). In the next part we will study available interventions and

55
services in present Iranian basic and curative benefit packages and will assess content of the packages on the basis of mentioned criteria.
Benefit Packages Status and Important Actions about Health Range of Services in Iran:
Prioritization and selection of the most cost-effective services.
Services and Interventions in Public Health and Primary Health Care (PHC) —promotive and preventive domains— are highly cost-effective. According to WHO estimation‚ some interventions such as enriching children’s food with vitamin A and Zinc (about 60 years healthy life save per 1000 dollar)‚ Tuberculosis test and treatment are highly cost-effective.
Also‚ according to WHO-CHOICE project, interventions related to Tuberculosis‚ maternal and child health‚ childhood diseases‚ smoking‚ depression and mental disorders are among the most cost-effective interventions in Eastern Mediterranean Region (EMR).
As mentioned‚ it is necessary that the main approach for services provision at first level and primary health care to be providing services and interventions with the highest cost-effectiveness. Although cost-effectiveness studies has not been done to develop basic services package in Iran‚ provided services at first level services package format are mostly very cost-effective. We can study present status of basic services package in Iran in two ways:
Among available services in basic package with high cost-effectiveness, we can mention Tuberculosis test and treatment‚ Malaria prevention and treatment‚ maternal and infants’ health related interventions. In the country prevalence of Tuberculosis from 39 in 2000 reached to 32 in 2012 (per 100 thousands individuals) which is more than 80% success in Tuberculosis treatment. Malaria incidence reduced from 2.9 in 2010 to 1.2 in 2012 (per 100 thousands individuals). About prevention and treatment of childhood diseases, the percentage of vaccination coverage for childhood major diseases including measles, triple (Whooping cough, Diphtheria, Tetanus and Hepatitis B were respectively 98‚ 99 and 98 percent in 2012. Number of death caused by major childhood diseases including diarrhea, pneumonia and prematurity changed, diarrhea cases reduced from 8 to 4 (per 100 thousand individuals) and pneumonia reduced from 16 to 13 between the year 2000 and 2010. But prematurity increased from 24 to 28. Number of death caused by malaria and measles in children is zero. These primary care and treatments are covered for free at PHC level in basic services packages format. Most of these interventions relates to communicable diseases control for which we have remarkably progressed in recent decades. The goal of these interventions should be protecting and promoting the available achievements.
The condition differs about some other services and interventions such as

5656
preventing smoking‚ curative or preventive services of mental disorders and depression‚ primary prevention and medical treatments of heart attacks and cardiovascular disease (CVD), which are some of the most cost-effective interventions. These types of interventions often relates to non-communicable diseases and chronic conditions, which currently impose the highest burden of diseases and contribute high percentage of adults’ death causes. Statistics show smoking incidence among 13-15 years aged teenagers from 2005 to 2010 was 33% among boys and 20% among girls, in the year 2011 this figure was 26% and 1% among male and female adults respectively. Cardiovascular diseases are the most death causes (46%) and the depression incidence is 4.1% which is more than many other countries.
About the above condition, despite preventive and promotive services at PHC level (now they are provided through basic services packages by family physician plan in cities under twenty thousand population or services provided at urban healthcare centers) people seems not to utilize primary services very much rather they are looking for curative and rehabilitative services. Public belief and trust is very weak in seeking services from healthcare system at primary level which makes people to seek these services from specialized levels. Despite these conditions‚ to increase cost-effectiveness of interventions including screening and preventing services for chronic conditions, improving public trust is inevitable.
Therefore‚ due to the increasing costs of technology, equipment, pharmaceuticals and various interventions‚ it is necessary to use local capacities to perform cost-effectiveness studies relying on reasonable and valid data and evidence to prioritize and to provide new services in all promotive, preventive, curative and rehabilitative fields‚ especially at the first level and in the basic benefit package format.
Prioritizing interventions which benefit the worse off illnesses
An option to help choosing services according to this criterion is to identify severity and intensity of diseases for a condition which imposes the most Individual burden of disease2 during the life.
To cover conditions with the highest burden of disease in the world and in Iran, (modifications should be done on the basis of mortality data at national level, however these can be often generalized) basic and curative packages of available services should be revised. New services should be chosen and prioritized based on this criterion using national data and evidence.
2- Individual burden of diseases can be calculated by several methods. Burden of disease estimation is counted in above image‚ considering to just “life years lost” not” healthy life years lost”.

57
As we mentioned previously‚ despite the desirable coverage of diseases such as Tuberculosis and Malaria‚ continuous interventions is still necessary to reduce prevalence and incidence rates. According to the main infants mortality causes in Iran‚ premature infants needs greater services provision in basic benefit package during pregnancy and more specialized services in curative and medical packages. In this field it is very important to consider range of services from promotive to rehabilitative services.
Chronic and non-communicable conditions such as cancers (for example blood cancer), asthma, diabetes and cardiovascular diseases cause a remarkable burden of diseases (76% of the deaths in the year 2012 caused by non-communicable diseases). In most cases‚ it seems screening‚ promotive and preventive capacities require increased consideration. For these conditions‚ it is important to shift resources from very low cost-effective specialized and subspecialized treatments to services in basic packages and taking preventive- centered approach.
About mortalities and burden of diseases caused by road accidents, if health system wants to reduce their heavy burden as well as their curative and rehabilitative expenditures, it should look forward providing promotive and preventive services via intra sectoral collaborations.
Prioritizing services which coverage provides protection against financial risks:
Several factors increase direct protection against financial risks connected to covering a particular service. These factors include high OOP for a certain disease, costly diseases, low predictability of needs‚ urgency and severity of target condition and high incidence of the target condition among the poor.
Figure 3.2 shows the results of an analysis of nine services. The figure indicates how much of each type of benefit that would be produced if we spent $100,000 on each listed service. A service yields greater health benefit the further to the right it is and more financial protection the further toward the top it is. The findings demonstrate how the aim of averting deaths and the aim of averting poverty can conflict. For example, the Meningococcal vaccine averts more than 300 deaths per $100,000 spent but averts few poverty cases. In contrast, high blood pressure treatment averts fewer deaths but many more cases of poverty.

5858
Figure3.2 Health and financial risk benefits afforded, per $100,000 spent
While selecting and putting services in basic and especially curative packages‚ there should be a tradeoff between financial risk protections and other criteria such as individual burden of diseases. Any way‚ UHC aims to access services which do not expose an individual to financial risks. This would never practically occur without providing strategies which aims to design special service packages to cover costly services‚ services regarding chronic conditions such as diabetes‚ cardiovascular diseases‚ cancers which erode patient’s financial power and costly drugs and laboratory tests.
It seems this criterion needs a lot of modifications in curative packages of specialized levels. Before the implementation of Health Transformation Plan (HTP)‚ OOP was more than 50% for most of inpatient services. This rate reduced remarkably after the implementation of HTP. But it should not be ignored that now OOP reduction is just about inpatient services in public centers. Developing strategies for reducing OOP for services and costly outpatient tests‚ diagnostic‚ drugs‚ rehabilitation services in other centers should be a priority among Iran’s health system’s goals.
Development of basic services package through services provided at the primary level can be regarded as a turning point for Iran’s health services provision system regarding range of health services which is briefly studied in the next section.
Health Benefit Packages in Iran
Basic and first level services package
After establishment of the health network system in Iran‚ PHC was provided for

59
people through health network system. These services include health education‚ preventive services and basic treatments. Gradually more services were added to the key elements of PHC when necessary.
In the beginning of Family Physician Plan in 2005 in villages and less than twenty thousand population cities, according to fourth development plan law, basic services package were provided for free in these regions by family physician team (3).
In providing benefit package‚ revision of health plans and new approach of services provision began for the first time. The revision focused on health team with the family physician at the charge. According to article 91 paragraph (B) of the fourth socio-economic and cultural development plan law‚ it was supposed the arrangements of establishing health insurance with family physician and referral system at its heart to be provided by the end of the fourth development plan. In this field we can name some indicators and quantitative goals‚ such as defining the basic services and complementary packages of insurance organization on the basis of cost-effectiveness assessments of interventions.
First level services (health team):
Basic benefit package provided by health team includes:
• Health management of the covered population;
• Health education and promotion;
o Health education;
o Healthy life style promotion.
• Taking care of covered population by implementing the communicated health plans:
o Ch ildren car e;
o Integrated health care for teenagers and youth (6-25 year age groups);
o Integrated health care for middle aged (25-60 year age groups);
o Integrated health c are for the elderly (more than 60 years old);
o Integrated health care for pregnant women;
o Population and family planning;
o Caring and treatment of special diseases (the necessity of preventing these diseases does not have anything to do with people’s age) with priority given to diseases incidence in the region.
• Environmental and occupational health:

6060
o Community environmental health
− Safe drinking water;
− Air pollution;
− Community-centered initiatives;
− Emergency actions in natural disasters;
− Radiation health;
− Waste collection and disposal;
− Controlling disease vectors;
− Waste;
− Chemicals and toxins.
o Work environment health
− Occupational health;
− PHC provision for workers;
− Establishing Behgar’s stations3;
− Preventing and treating occupational diseases;
− Preventing and reducing physical and chemical factors of Work environment.
o Household environmental health
− Community-based initiatives;
− Food safety(food hygiene, proper cooking system);
− Accidents and events;
− Housing physical environment.
o Health of Communities environments
− Communal living environment’s health(casern, dormitory, prison and nursing home);
− Environmental health of health facilities;
− Health of beauty salons and similar centers;
3 - Behgar 3stations are established in workshops with 20-49 workers to provide occupational health services. One of the workers who is trained and aware of occupational health measures is in charge of the station.

61
− Health of preparation, distribution, storage and sale of foods;
− Health of educational environments;
− Health of entertainment centers.
• Primary treatment and emergencies;
• Timely and proper referral‚ following up referred cases‚ receiving feedbacks from higher level and accordingly carrying out suitable actions.
According to documents review‚ the approach to develop services package for health team includes education‚ primary prevention‚ taking care‚ screening‚ public outpatient treatment‚ referral and receiving feedbacks from higher level and carrying out suitable actions on this basis (4).
Protecting the comprehensiveness and integrity of services and access to services packages are among prerequisites of benefit package at this level and the followings should be considered:
• Service recipient should access to all services (except para-clinics and pharmacy) in a way that primary services would be received in minimum possible time‚ in the health post which implement the family physician plan (office which is adjusted with requirements) or the center implementing the Family Physician Plan;
• Service provider should have the capacity to ensure the comprehensiveness of services‚ in order to provide defined services with the least service recipient refer;
Specific consideration on cost-effectiveness and cost-benefit is being emphasized in this level (4).
Secondary and tertiary benefit packages:
According to law‚ secondary and tertiary services provision in Iran is equivalent with basic insurance benefit package (now called Iranian health insurance). This is affected by basic and complementary insurance liabilities including the way and kind of public contribution in costs compensation‚ reimbursement rate‚ availability of specialized services‚ pharmaceuticals and medical devices (3).
When health care insurance funds are pooled and national health insurance fund is established‚ benefit package of all funds would be provided in a coordinated and integrated manner‚ under the title of “Iranian Health Insurance Benefit Package” with a determined tariff for diagnostic‚ curative‚ pharmaceutical and medical equipment. Currently‚ health insurance does not cover 16 service groups. The most important ones include heart, liver and bone marrow transplant‚ dental care (artificial teeth, filling and orthodontics)‚ infertility treatment surgeries,

6262
cosmetic surgeries, screening test and joints replacement. It seems that most of the services not covered by Health Insurance Organization relates to preventive and rehabilitative services with most covered services relates to curative services.
Range of Services in Higher Level Documents:
In higher level documents of Iran, basic benefit package issue is obvious. In the third cultural and socio-economic plan law of Iran, main regulation provisions regarding health services are health services provision for villagers and citizens for free by governmental providers with governmental financing, secondary and tertiary services levels with private and governmental cooperation, basic and complementary insurances coverage. This regulation also implies briefly in several articles about specific pharmaceuticals’ subsidies and rehabilitative services provisions by Welfare Organization for chronic mental illnesses (5).
In the fourth cultural and socio-economic plan law of Islamic Republic of Iran‚ services package is mainly discussed. According to article 91 of executive by law in the fourth cultural and socio-economic plan law of Islamic Republic of Iran‚ approved in 2004‚ services provision in Iran is provided at three levels considering priority setting mechanism. According to article 6 of this law‚ family physician is obliged to provide basic first level services to the covered population on the basis of basic benefit package. Access to the other referral levels is possible only through family physician. These services descriptions published in a book named “explanation of services of health team and family physician” by Ministry of Health and Medical Education (MOH).
Also article 12 of the mentioned law regarding specialized and curative level of services package suggests: “MOH is obliged to provide required facilities for health insurance services package provision using governmental and non-governmental contributions according to health services leveling framework in a way that all services of basic health services insurance for the villagers and nomads are defined similar to the urban areas and made available for them (3).
The fifth development plan and paragraph G of article 38 of executive by law‚ has a specialized approach to health benefit package. Cases associated with services coverage and health benefit package development are mentioned in this bylaw such as: strategic services purchasing approach to create competitive room to increase services quality and to reduce costs with the health insurance organization responsibilities (articles 3 and 4), revision of list of basic health insurance liabilities services based on scientific criteria and adopted methodology with the priority of referral system and priority setting as the joint responsibility of Ministry of Cooperatives, Labor and Social Welfare and MOH and Vice President

63
for Planning and strategic Monitoring (article 7), providing and developing clinical guidelines and health services standards to improve quality of basic health insurance committed services with the responsibility of MOH (article 8) and issues regarding new services entrance to the list of basic health insurance committed services (6).
As observed, there is a growing trend concerning services coverage issues in terms of creation and development of legal mechanisms‚ in recent development plans. It seems that recent law provisions are adequately comprehensive. Nevertheless‚ a considerable point is issues related to implementation of these provisions, monitoring and surveillance. This is as an important challenge in most of the studies.
Existing Challenges Regarding Range of Health Services in Iran:
Studying health system‚ Health and Social Security Insurance Organizations (SSIO) in various countries shows that various reforms were implemented in recent decades. Although each country experienced different approach, because of its economic, political, health, social, demographic, and cultural conditions. These reforms mainly aimed at improving access, providing quality care and finally holding healthcare costs (7).
Meanwhile‚ defining health benefit package has always been one of the main challenges of policymakers and health organizations (8, 9). In other words‚ these organizations always are faced with this question that which criteria should be considered to define services of this package‚ due to resources scarcity. Without incorporating criteria of those influential parties in basic package development and without considering their real role, a package would be determined which is politically unacceptable‚ financially impossible‚ technically inefficient or is faced with a combination of these issues (8).
A major part of macro barriers‚ problems‚ weaknesses and challenges which Iran’s health system always face‚ affect services coverage component, Including fading health stewardship‚ inadequate tools for cost management in health sector‚ limited health resources‚ inadequate evidence for effective interventions in healthcare system‚ inadequate policies to coordinate Insurer Organizations and MOH (10).
Currently most of services are focused on treatment dimension rather than prevention and promotion. We can mention following as the reasons: remarkable increase of curative budgets and expenditures compared with promotive and preventive services‚ unregulated presence of active private sector in curative services coverage field in a market with a weak control on services quality and

6464
regulations‚ increasing use of outpatient and hospital services (11).
Determining the criteria and benefit package development process has been among main problems. Some of these issues relate to ignoring scientific evidence in services formulation and intervention coverage and essential drugs and excessive reliance on experts’ judgment and attitudes and using nonscientific criteria such as political pressures‚ past performance and previous information and experiences of Insurer Organizations for services entrance and exit. Criteria such as cost-effectiveness and services effectiveness and giving priority to local needs are even used as criteria for including and excluding services to benefit packages in most of developing countries. It seems that in Iran despite legal support and formal process and structures‚ it has not been practically led to desirable results and targets.
It seems that preventive and promotive oriented services provided at the first level by health team, are adequately comprehensive. However‚ some aspects should be considered including “how much these services are provided similarly to whatever was expressed? How much these services are utilized? How much these services are acceptable and reliable for people? How will be the condition of new and recurrent diseases and how will we face them?” Finally‚ acceptability of the quality of the services should be studied deeply.
Lessons Learnt from other Countries:
Basic benefit package‚ clearly includes various interventions in various countries which reflects differences in economic‚ epidemiologic and social conditions. In a low income country‚ usually basic services package consists of a limited set of public health services and clinical interventions which are provided at primary and secondary levels (12). For example in Afghanistan, Sudan and the Republic of Liberia basic services package is defined to cover those services (13-15). In contrast‚ richer countries such as South Korea‚ often define services which are not covered (negative list) (16). In addition‚ there is a series of detailed or specific services for specific diseases or specific demographic groups. Countries such as China and Turkey defined a separate services package for specific patients and the poor groups (17, 18).
UHC for developed countries is not a new issue. The UHC term has been coupled with health system in countries such as Canada, United Kingdom, Sweden, Germany and France since 21th century when they provided access to some basic healthcare services for their population (19).
Despite varieties in kinds of health and financing systems‚ these countries

65
provided a comprehensive package of health services while services reception for their population. Now‚ in most of these countries there is not a health benefit package which is completely defined with a list of services. Instead, these countries provide a range of services from preventive to rehabilitative services according to their population requirements. The only difference is their financing method and the way their people contribute in financing i.e. through paying taxes and participating in social insurance schemes and reimbursement rate. Important point about these countries is an advanced economic evaluation system‚ services priority setting and great use of cost-effectiveness and cost-benefit analysis in formal processes to develop services packages (table 3.1). Developing countries such as China (16, 17), Turkey (18), Thailand (20, 21)‚ South Korea (24), Mexico (22-25) and Brazil (15) have undergone major reforms concerning all three dimensions of universal coverage (including range of services‚ range of population and financial protections) toward UHC. The experiences of these countries in the direction to achieve UHC show that changes and reforms of health system to reach the final goal which is public health promotion and protection should be comprehensive and multilateral, so scattered and unplanned efforts would be useless or lead to only temporal development.
Most of these countries have improved both range and depth of covered services in order to improve services coverage. Mexico and Thailand have provided their population with comprehensive benefit package including preventive‚ promotive‚ curative and rehabilitative services by means of new universal insurance plan and covering the relatively many uninsured people (20, 24).
All three Thai’s insurance schemes (formal private sector‚ government’s employees and rest of the population coverage) provide comprehensive benefits packages approximately without any contribution in payment (26). In Mexico reform development has been an interrelated process which encompassed covering more people‚ more interventions and better quality health conditions (27). Benefit package development and quality improvement are vital and essential issues in reforms (28).
Establishing capacities for economic evaluation of health technologies and interventions‚ has become common in defining benefit package in countries like Thailand (19), Brazil (25), and South Korea (16). They have improved the quality of covered services by means of strategic purchasing. Evidence shows that several key components of strategic purchasing (covering the poorest deciles‚ covering medications and outpatient services‚ and including a package of catastrophic expenditures) are effective approaches to deal with catastrophic expenditures and to reduce health costs (28). Strategic purchasing especially in designing services packages and payment systems‚ create an efficient system which reduces out of pocket and catastrophic expenditures (25), this is what really happened in South Korea (29).

6666
However, the important issue is range of services which should cover all services from promotive to rehabilitative ones. Countries such as India, Kenya and the Philippines which at first just covered inpatient services are now moving toward widening benefit package to cover primary and preventive services, realizing the fact that although outpatient services may be costly but they can greatly affect health outcomes (30). Table 3.1 and Table 3.2 show different characteristics of benefit package in selected developed and developing countries.

67
Table3.1 Range of services and their characteristics in developed countries
Table1. Range of services and their characteristics in developed countries
Country Services coverage
Range of services M
ain criteria for services selection Other characteristics
Germany
Comprehensive
Inpatient, outpatient and pharmaceutical services
Quality
Efficiency
Cost-benefit analysis(for specific medicines)
Have formal process for
services selection
France Com
prehensive Outpatient, inpatient, rehabilitation,
Diagnostic and paramedical services
Pharmaceutical services
Have form
al process for services selection through expert com
mittees
England Com
prehensive All services
Cost-effectiveness
Effectiveness
Developing Clinical guidelines
According national institute for health and care excellence(NICE) recom
mendations from
1999
Sweden
Comprehensive
Prevention and rehabilitation of politically and clinically/ adm
inistratively prioritized groups:
Life-threatening acute diseases, Intensive chronic diseases, palliative care of dying people,
Less deteriorated Acute illness, care for reasons other than illness,
Generic medications Coverage
On the basis of ethical principles:
The principle of human dignity,
Principle of need and solidarity,
Principle of cost-effectiveness
Without clear basic and
essential healthcare and pharm
aceutical packages definition
Canada Com
prehensive All services
Effectiveness
Cost-effectiveness
Clinical impact
Evidence-based interventions and decisions
Without benefit package for
health and pharmaceutical
services at national level
Official process for decision m
aking and selection

6868
Table3.2 Range of services and their characteristics in developing countries
Country Services coverage
Range of services M
ain criteria for services selection O
ther characteristics
Thailand Com
prehensive O
utpatient and inpatient services for prom
otion, prevention, treatment and
rehabilitation
Cost-effectiveness Ability to pay Budgetary effects N
umber of affected population
Severity of illness Ethical and equity considerations
Formal services priority setting
process and services package developm
ent and inclusion and exclusion criteria of services
By technical comm
ittees and stakeholders representatives
Mexico
Approximately
comprehensive
Three explicit packages including comm
unity centered services, essential services including prim
ary and secondary interventions
For promotion, prevention, treatm
ent, rehabilitation and as w
ell as maternity
services
High cost tertiary care
Morbidity patterns
Cost-effectiveness Ability to pay Financial protection Values and social acceptability Scientific society perspectives
Benefit packages development
process jointly by the state and social security
China
Mainly inpatient
and outpatient There are three m
ajor benefit packages: reim
bursement for inpatient and outpatient
services, Reimbursem
ent for inpatient and outpatient but lim
ited to selected chronic diseases and M
edical savings accounts to pay for outpatient visits.
Financial protection Burden of diseases Local needs Locally available resources
Packages variety in proportion to different areas covered on the basis of reim
bursement
Turkey
Comprehensive
basic benefit package
Preventive, outpatient, hospital, maternity,
pharmaceutical and laboratory health care
services
Financial protection A form
al process through technical com
mittee for services
selection
Brazil From
basic to com
prehensive All kinds and all levels of services
More em
phasis on primary level services.
Epidemiological consideration
Quality for patients budgetary effects
Brazilian market considerations
Without clear services package
Chile
Approximately
comprehensive
Prevention, promotion, treatm
ent and rehabilitation
Burden of diseases Experts perspectives Citizen's dem
and Interventions im
proving quality of life Effectiveness Cost-effectiveness(If possible)
Priority setting by AUG
E (U
niversal Access with Explicit
Guarantees) from
2003
South Korea Com
prehensive D
iagnostic services
Healthcare (outpatient, inpatient, m
edical and dental) and em
ergency services
Prevention, promotion and rehabilitation
services
Different groups and com
mittees and
finally health ministry for drugs:
Effectiveness
Safety Econom
ic evaluation
According to priority setting by health insurance policy advisory com
mittee
Separate comm
ittees for available and new
interventions and technologies evaluation for services, m
edications and m
edical accessories groups
Table2. Range of services and their characteristics in developing countries

69
Future Orientations:
It is clear that having a reasonable and scientific model to design health benefits at different levels of health system can result in better allocation and management of available health resources (10). Promotion and improvement of scientific capacity for decision making and evidence-based policy making are prerequisites to succeed in this filed which themselves are dependent to a reliable information system and setting local priorities based on needs. At all these stages, what is the most important is that the people should be at the heart of all affairs (31).
It is necessary to have this point in mind that operational definition of packages in each country are affected by political, economic, social, specialized groups’ influences, pharmaceutical industries, financial resources and public pressures. Reforms in various countries targeted to better services access, population coverage extension and ensuring equal availability of every required service, using strategies to provide quality care and holding dawn health costs, have resulted from interaction or conflict of these perspectives (32).
Role of basic and complementary insurance coverage should not be ignored when defining benefit packages. Views related to “defining services to be covered”, “defining services not to be covered” and “combination of both systems” are current views, consequently, “covered services” and “not covered services” or “services which are covered by complementary insurance” are determined.
It is expected that criteria used for services definition, to consider range of services coverage, kinds and levels of utilization, targeted population and to consider alternative treatments beside third parties’ views and could apply economic techniques in benefit packages definitions according to health economic principles. This issue is expected from health and insurance policy makers. It is obvious that paying attention to effects of excluding and including commitments on other parts of society and organizations is required (33).
Practical and Executive Considerations in Developing Services Package in Iran:
Despite the necessity of economic evaluation as an input for health planning when faced with resource scarcity, accurate use of information in various health interventions cost-effectiveness to informed priority setting is limited in most of developing countries (33). There is a pertinent concern that simplistic extraction and generalization of international estimates may be inveigler in decisions regarding international resources. On the other hand, cost-effectiveness analysis for the country needs great, reliable and credible information and analytical

7070
technical local capacities which are not always available (33).
Services coverage, as one of the components and dimensions of UHC, focuses on promotive, preventive, curative, rehabilitative and palliative care and considers person-centered and community-centered interventions at different levels of health system including community, primary, secondary and tertiary levels and should think of quality concerns as a general concept whose importance is often forgotten.
Decisions related to health interventions have not been free from political pressures. Stakeholders groups always make extensive changes to health system at various stages such as designing services packages and inclusion and exclusion criteria especially for pharmaceuticals, legislation and operationalizing the regulations.

71
References1. Evans DB, Saksena P, Elovainio R, Boerma T. Measuring progress towards universal
coverage. Geneva: World Health Organization, 2012.
2. Ottersen T, Norheim OF. Making fair choices on the path to universal health coverage. Bulletin of the World Health Organization 2014, 92 (6): 389.
3. The Forth Plan for Economic, Social and Cultural Development of Islamic Republic of Iran, Implementing Regulations, Article 91, 2007.
4. Services of Family Medicine team. Ministry of Health and Medical Education. Health Deputy. Network Development and Health Promotion Center, 2007.
5. The Third Plan for Economic, Social and Cultural Development of IR Iran, 2006.
6. The Fifth Plan for Economic, Social and Cultural Development of Islamic Republic of Iran, Implementing Regulations, Article 38, 2014.
7. Zare H, Barzegar, M, Kashef-Ghorbanpour E, Samet A. The methods of determining the health services packages in the world, 2012: 352.
8. Dehnavieh R, Tabibi S, Maleki M, Rashidian A, Noorihekmat S. Information criteria for basic health insurance package in Iran from health insurance organization’s view. Health Information Management 2010,7(2):109-18.
9. Dehnavieh R, Rashidiyan, A., Maleki, MR. Challenges of defining basic health insurance package in Iran. Payesh 2010,10(2):273-83. (in Persian)
10. Kabir MJ, Vatankhah S, Delgoshaei B, Ravaghei H, Jafari N, Heidari A, Behnampour N, et al. Determinant Criteria for Designing Health Benefit Package in Selected Countries. Life Sciences Journal 2013, 10 (3).
11. Moghadam MN, Sadeghi V, Parva S. Weaknesses and challenges of primary healthcare system in Iran: a review. The International Journal of Health Planning and Management 2012, 27 (2): e121-e31.
12. Essential Health Packages: What are they for? What do they change? DRAFT Technical Brief No. 2, 3 WHO Service Delivery Seminar Series, July 2008.
13. Hansen PM, Peters DH, Niayesh H, Singh LP, Dwivedi V, Burnham G. Measuring and managing progress in the establishment of basic health services: the Afghanistan health sector balanced scorecard. The International Journal of Health Planning and Management 2008, 23 (2): 107-17.
14. Basic Package of Health and Social Welfare Services for Liberia. Ministry of Health and Social Welfare Republic of Liberia, 2008.
15. Basic Package of Health and Nutrition Services for Southern Sudan. Final Draft Ministry of Health, Government of Southern Sudan, January 2009.
16. Chun CB, Kim SY, Lee JY, Lee SY. Republic of Korea: Health system review, Health Systems in Transition, 2009.
17. Liang L, Langenbrunner JC. The long march to universal coverage: lessons from China,2013.

7272
18. Menon R, Mollahaliloglu S, Postolovska I. Toward Universal Coverage: Turkey’s Green Card Program for the Poor, 2013.
19. Savedoff WD, de Ferranti D, Smith AL, Fan V. Political and economic aspects of the transition to universal health coverage. The Lancet 2012, 380 (9845): 924-32.
20. Hanvoravongchai P. Health financing reform in Thailand: toward universal coverage under fiscal constraints, 2013.
21. Sakunphanit T. Universal health care coverage through pluralistic approaches: experience from Thailand. Bangkok, ILO Subregional Office for East Asia, 2006.
22. Bonilla-Chacín ME, Aguilera N. The Mexican social protection system in health, 2013.
23. González-Pier E, Gutiérrez-Delgado C, Stevens G, Barraza-Lloréns M, Porras-Condey R, Carvalho N, et al. Priority setting for health interventions in Mexico’s System of socialprotection in Health. The Lancet 2006, 368 (9547): 1608-18.
24. Knaul FM, González-Pier E, Gómez-Dantés O, García-Junco D, Arreola-Ornelas H, Barraza-Lloréns M, et al. The quest for universal health coverage: achieving social protection for all in Mexico. The Lancet 2012, 380 (9849): 1259-79.
25. Marten R, Mcintyre D, Travassos C, Shishkin S, Longde W, Reddy S, et al. An assessment of progress towards universal health coverage in Brazil, Russia, India, China and South Africa (BRICS). The Lancet 2014, 384 (9960): 2164-71.
26. Tangcharoensathien V, Patcharanarumol W, Ir P, Aljunid SM, Mukti AG, Akkhavong K, et al. Health-financing reforms in southeast Asia: challenges in achieving universal coverage. The Lancet 2011, 377 (9768): 863-73.
27. Frenk J, González-piere, Gómez-Dantés O, Lezana MA, Knaul FM. Comprehensive reform to improve health system performance in Mexico. The Lancet 2006,368(9546):1524-34.
28. Knaul FM, Arreola-Ornelas H, Méndez-Carniado O, Bryson-Cahn C, Barofsky J, Maguire R, et al. Evidence isgood for your health system: policy reform to remedy catastrophic and impoverishing health spending in Mexico. The Lancet 2006,368(9549):1828-41.
29. Kwon S. Payment system reform for health care providers in Korea. Health Policy and Planning 2003, 18 (1): 84-92.
30. Lagomarsino G, Garabrant A, Adyas A, Muga R, Otoo N. Moving towards universal health coverage: health insurance reforms in nine developing countries in Africa and Asia. The Lancet 2012, 380 (9845): 933-43.
31. The World Health Report: Health Systems Financing, the Path to Universal Coverage: World Health Organization, 2010.
32. Zare H, Goudarzi, AM. Organization and managementof health care organizations offering medical service packages (The first part: Comparative Study). Journal of Social Security 2009,9(28):135-7. (in Persian)
33. Lea RA. World Development Report 1993: Investing in Health, 1993.

73

7474
Chapter 4Quality of Services

75
Abstract: Global experience about universal health coverage (UHC) programs shows that paying attention to the quality of services plays an important role in achieving the program goals. It is difficult to define quality and to identify its various aspects in health care. Although, various indices have been proposed for monitoring the quality of health services in the world, but making appropriate use of them is not possible in the current situation of Iran due to the shortage of information. It has been tried in this chapter to select and report some indices from the existing databases according to the limited information available in Iran in the field of some aspects of quality of services. Donabedian quality improvement framework was selected to report these indices. The following indices have been proposed in therapeutic services sectors: rate of nosocomial infections and mortality resulted from them, results of treatment actions, observing patients’ rights, time spent to receive the services, quality of emergency services, preparedness of health units against disasters, and health conditions of centers that provide services and quality of delivery care. Owing to the specific nature of quality in this level and limitations of data, the indices “percentage of 5-star schools and appropriate knowledge of women about HIV prevention” have been reported in prevention services sector. The following indices have also been reported: monitoring the quality of service, average pharmaceutical prescriptions, per capita referral to diagnostic centers, conditions of hospitals according to self-assessments, conditions of compiling and codifying evidence-based guidelines in Iran and finally equity in access to health care.
Findings of this chapter show that to monitor the quality of health services appropriately, suitable indices must be defined and necessary conditions must be provided to collect information at national and provincial levels. Some indices are related to the quality have been mentioned in this chapter. However, following the issue in subsequent reports requires deeper studies on the appropriate framework in Iran and on increasing data accuracy. Since the majority of the indices related to quality of service is based on comments and opinions of service providers, their accuracy cannot be confirmed, it doubles the importance of more suitable planning to achieve more valid and reliable data.

7676
Reviewing records about making use of quality tools in the health sector shows that these tools have been used hastily. Concerning changes in the nature of diseases at the community level, changes in expectations of various groups of people and service providers and policy makers about the quality of services, increased international attention to this issue and comprehensive planning to improve the quality at different levels seems necessary. Therefore, necessary interventions to improve the quality of services are provided in the form of health system control knobs and the role of main beneficiaries is explained at the end of this chapter.

77
Introduction:
Universal health coverage (UHC) programs, regardless of the requirements of quality of services, will have difficulty in achieving their objectives (1). Quality of services has been taken into huge consideration in major studies which aimed to determine appropriate indices to monitor the conditions of UHC (2, 3). In the World Health Organization (WHO) report in 2013, it was emphasized that UHC should cover a full range of services including health promotion services, prevention and treatment, rehabilitation and palliative care with good quality. In other words, one of the main goals of UHC is that the quality of care must be so high that the public health improves (4). Many countries have concluded that improving the quality of care can have a significant impact on achieving UHC (5). This means that in the UHC program, receiving interventions is not enough, but rather the provided interventions must have high quality (6).
It is hard to define quality and its dimensions. This concept is complex and multi-dimensional in healthcare; there is little agreement on its definition (7). In definitions proposed by the American Medical Association and the WHO, some dimensions such as safety, efficiency, patient-oriented, acceptability, accessibility, timely provision, effectiveness and justice are considered for the quality of healthcare (8, 9).
To monitor the conditions of the quality of health services, various frameworks are used in the world, but it is not possible to use them in Iran due to lack of appropriate information. Concerning limited information available in Iran, this chapter tries to select some indices from the existing databases and report their levels with regard to some aspects of quality of service. Donabedian model is the framework used to report the indices. Although, various models have been proposed by different organizations to assess the quality, Donabedian model is still considered the best model in assessing the quality of healthcare (10). One of the features of this model is that it is easy to understand. This model regards quality in three dimensions of “structure, process and outcome”. Indices reported in this chapter have been provided based on indices related to quality in the existing reports and Donabedian three-dimension framework. Table 4.1 shows indices reported in this chapter (information source and quality coverage). The following provides a brief description of the reported indices.
Infections caused by health and treatment care are global concern for the safety of patients who undergo treatment in hospitals (11). These infections result in illness, long stay, mortality and increased health costs (11, 12). Nosocomial infection is an infection which appears at least 48 to 72 hours after admission to the hospital (13). Infection control is an important quality standard and is essential for the safety of patients and others (14). According to the WHO reports, the incidence of these infections is between 6% and 11% in industrialized developed countries, while it is up to 27% in developing countries. In 2007, nosocomial infections
7878
surveillance system was established in Iran in order to record infections (13).
Result of inpatient and outpatient treatment is another index which has been reported by the people who receive services. The following are two indices related to quality of maternal and child care, owing to their impact on the health of mothers and children, these two indices are observed in different countries as indices of quality of services (15).

79
Table 1: reported indexes, pointing to the information resource and coverage of the quality aspect
Quality aspect
Level of services Selected index group
Existing information source
Outcom
e Process
Structure
*
Treatm
ent (inpatient)
Rate of nosocomial infections and m
ortality resulted from
them
Nosocom
ial Infections Surveillance
*
Treatm
ent (inpatient and outpatient)
Results of treatment actions/ observing patients’
rights/ time spent to receive the services
Report of plan of utilizing health services
* *
Treatm
ent (inpatient)
Quality of em
ergency services General and specific indexes of treatm
ent deputy
* *
* Prevention/ treatm
ent Preparedness of health units against disasters/ health conditions of centres that provide services/quality of delivery care/ percentage of 5-star schools and appropriate know
ledge of w
omen about HIV prevention
Information related to health deputy
panel/ health indexes in the Islamic
Republic of Iran /health and population aspect in Iran
* Treatm
ent (inpatient)/ rehabilitation
Conditions of service-providing centres in terms of
legal permits
Examining the provision of
outpatient and rehabilitative health services
* *
* Treatm
ent (inpatient)
Conditions of hospitals in different criteria of EFQ
M m
ode System
atic review and m
eta-analysis self-assessm
ent of hospitals
* *
* Treatm
ent (inpatient and outpatient)
Rating conditions- number of pharm
aceuticals- using diagnostic services
Report of performance of Iran
Health Insurance Organization
*
Rehabilitation
Ratio of number of disabled people participating
in social activities Specific indexes of Iran W
elfare O
rganization
*
* All levels
Conditions of developing evidence-based guidelines in Iran
Report of Technology Assessment and
Standard and Tariff Codification Office
* Treatm
ent Som
e indexes of equal access to services Existing studies
- Table 4.1 Reported indexes, pointing to the information resource and coverage of the quality aspect

8080
Other available and related index is “the treatment success rate” of new cases of smear positive pulmonary tuberculosis whose formula is as follows.
The number of new cases of smear positive pulmonary tuberculosis (recorded in a period of time) which has been cured or which has finished treatment course to the total number of new cases of smear positive pulmonary tuberculosis recorded in one hundred. The next group of indices is related to the quality of pre-hospital and hospital emergency services. Pre-hospital emergency medical services are some actions that meet special health needs of people outside the hospital units (16). Given the importance of disaster care in Iran, indices related to the quality of this type of service are mentioned in this chapter. Owing to data limitations in this field, indices related to functional preparedness of health units against disasters has been reported here. The desirability of conditions of different aspects of environmental health in centers providing services is another index that has been mentioned. Reviewing indices available in Iranian Welfare Organization, an index that is more closely connected to the quality is the ratio of the total number of disabled people participating in social activities to the total number of disabled people who are covered by the organization. Service accountability aspects such as showing respect, relationship between patient and hospital personnel, security and hoteling services are important aspects of quality (15). Some indices related to this issue have been noted in this chapter. In implementing the national program for establishing health management system in schools, the index of 5-star schools is measured in Iran (17), which can express the quality of health services at schools. Another index related to the quality of prevention services is the index “proper awareness of 15 to 54-years-old women about the prevention of AIDS4. EFQM5 model has recently been used in some hospitals for self-assessment. Its results can show the strengths and weaknesses of aspects of quality of services. This model measures structural and process aspects in the form of enablers and measures outcome aspects in the form of results (18). Here is a summary of the results of self-assessments done in Iran hospitals based on this model. Indices related to monitoring quality of services in institutions providing services include available and related data and conditions of quality of services in centers providing services from the viewpoint of the main purchasers of services, i.e. Iran Health Insurance Organization. Therefore, here is a summary of the results of the current evaluation of service providers who have a contract with the organization. Moreover, average pharmaceutics prescribed by physicians and average referrals to diagnostic centers are also mentioned. Given the importance of evidence-based guidelines in improving the quality of services, a brief explanation has been presented about the conditions of the evidence-based guidelines in Iran. Two indices of equitable access to services are briefly explained as a factor affecting the quality of services. 4- Acquired Deficiency Syndrome (AIDS) 5- European Foundation for Quality Management

81
Status of Selected Indices in IranIndices of quality of treatment services Nosocomial infections: According to the data of the last eight years, the average incidence of nosocomial infections is about one percent. Table 4.2 shows number and percentage of cases and mortality of patients with nosocomial infections, table 4.3 shows the rate of nosocomial infections in terms of type of infection (in the case of surgery, patients are not included by the hospitals after their discharge from the hospital, so its statistics are in the third place with a big difference). Nosocomial infection is one of the most important indices of monitoring the quality of services in different countries. Differences between the reported level of this index in Iran and other countries such as developed countries show that Iran treatment sector seriously needs to document and collect accurate and sufficient information in this respect.
Table 4.2 Rate of nosocomial infections and mortality (in years) based on cases reported in nosocomial infections surveillance system
Table 4.3 Rate of nosocomial infections in terms of type of infection based on reports of nosocomial infections surveillance system in 394 hospitals in 2013
Type of nosocomial
infectionsUrinary Respiratory Surgical Blood Other Total
Number 17018 14803 9606 7400 11705 60532
Percentage 28.1 24.5 15.9 12.2 19.3 100
Results of inpatient and outpatient interventions
Table 4.4 shows the results of hospitalization and table 4.5 shows the results of referring and receiving different outpatient services from recipient’s point of view viewpoints
Year (No. Of hospital)
No. Of nosocomial infection
Ratio of infection to No. Of inpatient cases
No. Of mortality among infected people
Ratio of mortality of infected people to infectious cases
Ratioofmortality of nfectedpeople to all mortalities in the hospital
2009(100) 15387 0.95 2283 14.84 5.96
2010(100) 19541 1.13 2696 13.80 6.20
2011 (366) 38635 0.73 4261 11 4.8
2012 (388) 52038 0.92 5015 9.6 5.6
2013 (394) 60532 1.06 4848 8 4.9
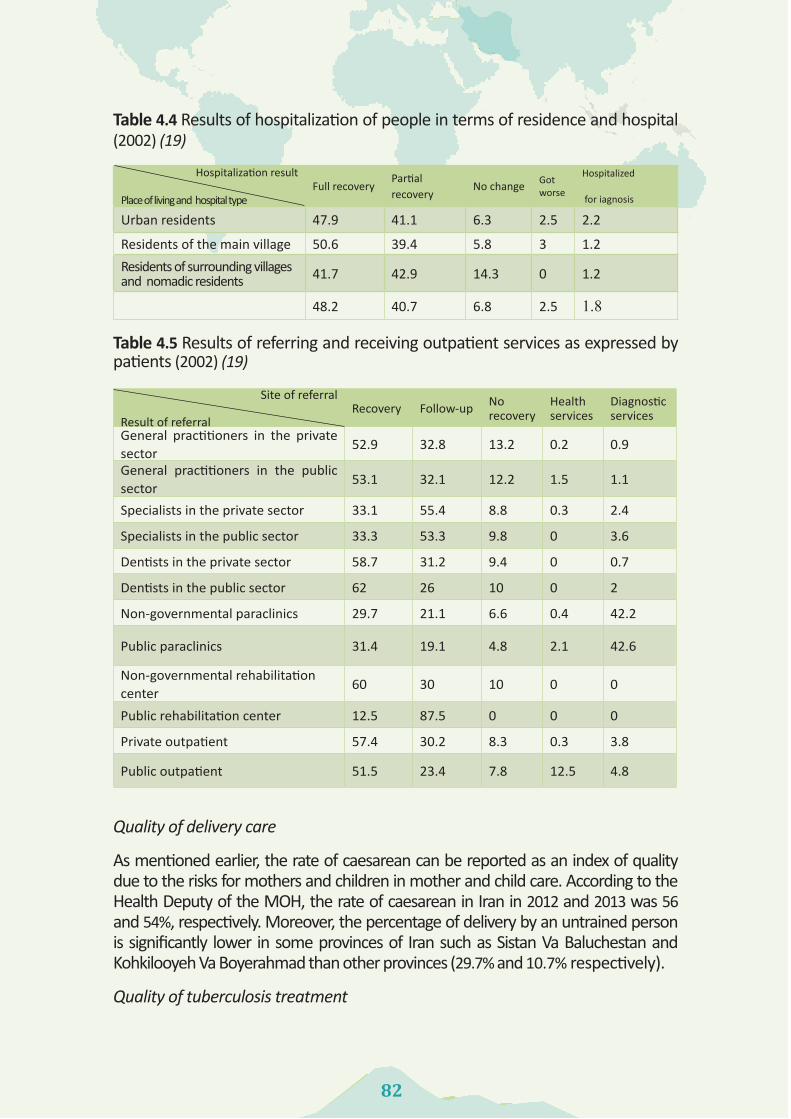
8282
Table 4.4 Results of hospitalization of people in terms of residence and hospital (2002) (19)
Hospitalization result
Place of living and hospital typeFull recovery
Partial recovery
No change Got worse
Hospitalized
for iagnosis
Urban residents 47.9 41.1 6.3 2.5 2.2
Residents of the main village 50.6 39.4 5.8 3 1.2Residents of surrounding villages and nomadic residents 41.7 42.9 14.3 0 1.2
48.2 40.7 6.8 2.5 1.8
Table 4.5 Results of referring and receiving outpatient services as expressed by patients (2002) (19)
Quality of delivery care
As mentioned earlier, the rate of caesarean can be reported as an index of quality due to the risks for mothers and children in mother and child care. According to the Health Deputy of the MOH, the rate of caesarean in Iran in 2012 and 2013 was 56 and 54%, respectively. Moreover, the percentage of delivery by an untrained person is significantly lower in some provinces of Iran such as Sistan Va Baluchestan and Kohkilooyeh Va Boyerahmad than other provinces (29.7% and 10.7% respectively).
Quality of tuberculosis treatment
Site of referral
Result of referralRecovery Follow-up No
recoveryHealth services
Diagnostic services
General practitioners in the private sector
52.9 32.8 13.2 0.2 0.9
General practitioners in the public sector
53.1 32.1 12.2 1.5 1.1
Specialists in the private sector 33.1 55.4 8.8 0.3 2.4
Specialists in the public sector 33.3 53.3 9.8 0 3.6
Dentists in the private sector 58.7 31.2 9.4 0 0.7
Dentists in the public sector 62 26 10 0 2
Non-governmental paraclinics 29.7 21.1 6.6 0.4 42.2
Public paraclinics 31.4 19.1 4.8 2.1 42.6
Non-governmental rehabilitation center
60 30 10 0 0
Public rehabilitation center 12.5 87.5 0 0 0
Private outpatient 57.4 30.2 8.3 0.3 3.8
Public outpatient 51.5 23.4 7.8 12.5 4.8

83
Quality of emergency services
Table 4.7 shows the most important indices of quality of emergency services according to information of Iran Emergency Center.
Table 4.7 Available indices in the field of quality of emergency services in Iran in 2013
Index Scale National average National StandardThe mean on-scene time in the cities Minute 10 8
The mean on-scene time on the interurban roads Minute 15 14
Decision-making for patients in less than 6 hours Percentage 8
Data not availablePatients discharged from the emergency departments within 12 hours
Percentage 6
Leaving hospital against medical advice Percentage 1
Preparedness of health units against disasters
Province Percentage Province Percentage Province Percentage Province Percentage
East Azerbaijan 83.6Charmahal Va
Bakhtyiari90.9 Qazvin 74.3 Mazandaran 89.5
West Azerbaijan 71.6 South Khorasan 79.4 Qom 90.1 Markazi 88.3
Ardebil 92.3 Razavi Khorasan 87.8 Kordestan 82.9 Hormozgan 86
Esfahan 75.5 Khoozestan 89.5 Kerman 65.8 Hamedan 74.1
Alborz 81.1 Zanjan 80 Kermanshah 80 Yazd 80
Ilam 75 Semnan 91.7Kohkilooyeh Va
Boyerahmad75.9 National Average 83.3
Boushehr 63.2Sistan Va
Balouchestan86.3 Gilan 82.9
Tehran 82.1 Fars 77.7 Lorestan 74.5
Table4. 6 Treatment success rate of new cases of smear positive pulmonary tuberculosis in terms of provinces in 2010 (20)

8484
Table 4.8 shows the functional preparedness of health units against disasters according to information of Health Deputy of MOH.
Moreover, structural and non-structural safety of health units against disasters was 14% and 31% respectively in 2013.
Conditions of environmental health of service providing centers
Tables 4.9 and 4.10 show the conditions of environmental health of health and treatment units.
Table 4.9 Indices of environmental health of hospitals throughout Iran (%) between 2006 and 2010 (20)
20102009200820072006 Year
Index 99.699.699.699.698.9Hospitals with desirable drinking water
75.574.175.475.269.4Hospitals with desirable garbage collection
78.276.269.87776.3Hospitals with desirable wastewater collection system
77.778.479.379.579Hospitals with desirable laundry services
80.976.588.976.178.4Hospitals with desirable food services
78.773.9---Hospitals with environmental health expert
Table 4.8. Functional preparedness of health units of medical universities against disasters (%) in 2013University Percentage University Percentage University Percentage University Percentage
Tabriz 42.7 Birjand 17.6 Zabol 62 Yasouj 2.3
Maraghe 4.6 Torbat 12 Zahedan 22 Gorgan 3
Urmia 16 Sabzevar 4.6 Jahrom 5.8 Rasht 17
Ardabil 6.6 Gonabad 25 Shiraz 44 Khoramabad 26
Esfahan 16 Mashhad 21.6 Fasa 1.8 Babel 13
Kashan 18 Neyshabour 42 Qom 32 Mazanderan 23
Karaj 37 Bojnord 25 Kordestan 6 Arak 8.8
Ilam 16 Ahvaz 8 Bam 15 Bandar abbas 56
Booshehr 23 Dezfool 63 Jiroft 13 Hamedan 22
Tehran 18.6 Zanjan 15 Rafsanjan 22 Yazd 14.4
Shahid
Beheshti25 Semnan 9.2 Kerman 36 Iran 21
Shahre
Kord26 Shahrood 48 Kermanshah 4.4
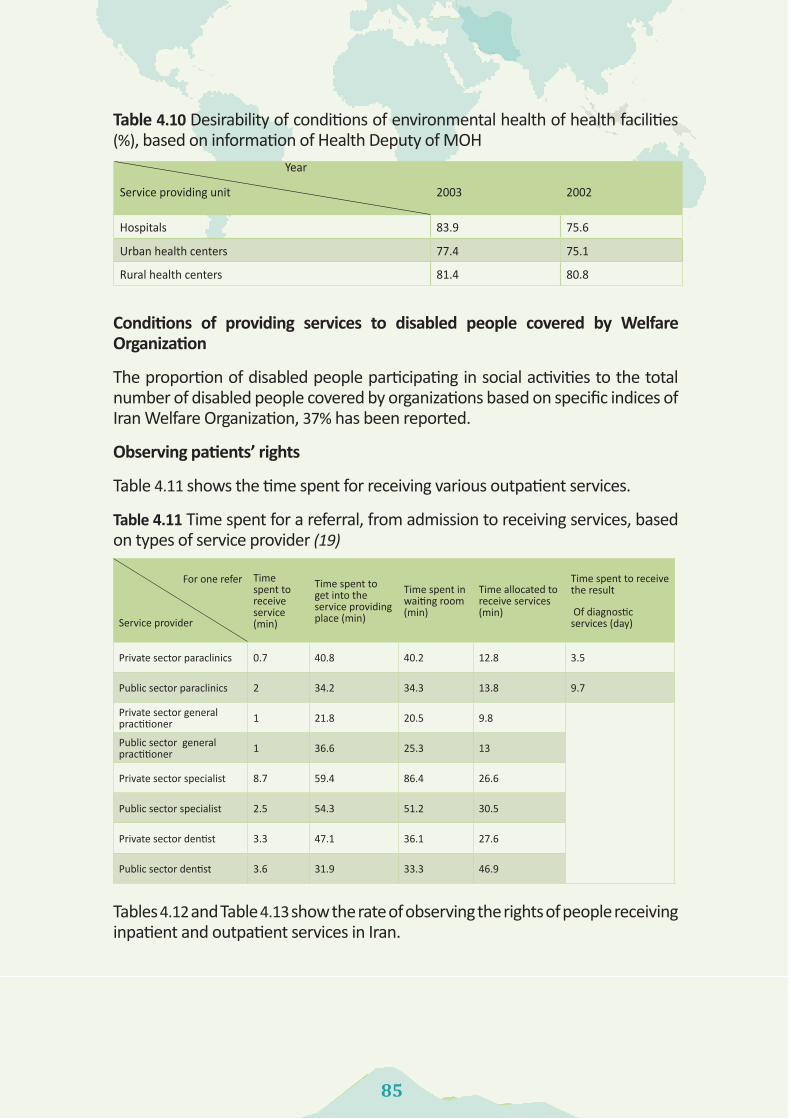
85
Table 4.10 Desirability of conditions of environmental health of health facilities (%), based on information of Health Deputy of MOH
20022003
Year
Service providing unit
75.683.9Hospitals
75.177.4Urban health centers
80.881.4Rural health centers
Conditions of providing services to disabled people covered by Welfare Organization
The proportion of disabled people participating in social activities to the total number of disabled people covered by organizations based on specific indices of Iran Welfare Organization, 37% has been reported.
Observing patients’ rights
Table 4.11 shows the time spent for receiving various outpatient services.
Table 4.11 Time spent for a referral, from admission to receiving services, based on types of service provider (19)
Tables 4.12 and Table 4.13 show the rate of observing the rights of people receiving inpatient and outpatient services in Iran.
For one refer
Service provider
Time spent to receive service (min)
Time spent to get into the service providing place (min)
Time spent in waiting room (min)
Time allocated to receive services (min)
Time spent to receive the result
Of diagnostic services (day)
Private sector paraclinics 0.7 40.8 40.2 12.8 3.5
Public sector paraclinics 2 34.2 34.3 13.8 9.7
Private sector general practitioner 1 21.8 20.5 9.8
Public sector general practitioner 1 36.6 25.3 13
Private sector specialist 8.7 59.4 86.4 26.6
Public sector specialist 2.5 54.3 51.2 30.5
Private sector dentist 3.3 47.1 36.1 27.6
Public sector dentist 3.6 31.9 33.3 46.9

8686
Table 4.12 observing the rights of patients receiving inpatient services in Iran, in terms of gender, residence, place of stay and type of support (19)
Features of the hospitalized patient
Levels of observing rights
Residence Gender
Insurance statusHospital type
Total
Urban Rural
Male
Female
Does not have insurance
Has insurance
PrivateSocial security
Affiliated to
Ministry of
HealthO
thers
Prompt
attentionGood
79.679
78.180.4
7879.7
82.684.7
76.886.5
79.4Average and less
20.421
21.919.6
2220.3
17.415.3
23.213.5
20.6Respect and dignity
Good 80.5
7780.2
78.480.5
78.986
83.275.5
91.579.2
Average and less
19.523
19.821.6
19.521.5
1416.1
24.59.5
20.8Com
municating
Good 75.2
74.375.1
74.773.5
75.279.8
81.871.3
83.874.9
Average and less
24.825.7
24.925.3
26.524.8
20.218.2
28.716.2
25.1Involving in decision m
akingGood
67.565.3
70.363.9
65.566.9
77.573.7
6271.6
66.7Average and less
32.534.7
29.736.1
34.533.1
22.526.3
3828.4
33.3Confidentiality of inform
ation Good
84.885
85.284.6
8584.9
22.591.2
82.685.1
84.8Average and less
15.215
14.815.4
1515.1
11.88.8
18.414.9
15.2Right to choose
Good 64.8
62.867.3
61.565.5
63.773.6
71.559.3
71.664
Average and less
35.237.2
32.738.5
34.536.3
26.428.5
40.728.4
21.1Q
uality of environm
entGood
71.973.6
71.973
7372.5
83.183.2
66.386.5
72.6Average and less
28.126.4
28.127
2727.5
16.916.8
33.713.5
27.4Social support
Good 77.8
76.579.7
75.480
76.780.3
87.674.6
7777.3
Average and less
22.223.5
20.324.5
2023.3
19.712.4
25.423
22.7

87
Table 4.12 observing the rights of patients receiving inpatient services in Iran, in terms of gender, residence, place of stay and type of support (19)
Features of the hospitalized patient
Levels of observing rights
Residence Gender
Insurance statusHospital type
Total
Urban Rural
Male
Female
Does not have insurance
Has insurance
PrivateSocial security
Affiliated to
Ministry of
HealthO
thers
Prompt
attentionGood
79.679
78.180.4
7879.7
82.684.7
76.886.5
79.4Average and less
20.421
21.919.6
2220.3
17.415.3
23.213.5
20.6Respect and dignity
Good 80.5
7780.2
78.480.5
78.986
83.275.5
91.579.2
Average and less
19.523
19.821.6
19.521.5
1416.1
24.59.5
20.8Com
municating
Good 75.2
74.375.1
74.773.5
75.279.8
81.871.3
83.874.9
Average and less
24.825.7
24.925.3
26.524.8
20.218.2
28.716.2
25.1Involving in decision m
akingGood
67.565.3
70.363.9
65.566.9
77.573.7
6271.6
66.7Average and less
32.534.7
29.736.1
34.533.1
22.526.3
3828.4
33.3Confidentiality of inform
ation Good
84.885
85.284.6
8584.9
22.591.2
82.685.1
84.8Average and less
15.215
14.815.4
1515.1
11.88.8
18.414.9
15.2Right to choose
Good 64.8
62.867.3
61.565.5
63.773.6
71.559.3
71.664
Average and less
35.237.2
32.738.5
34.536.3
26.428.5
40.728.4
21.1Q
uality of environm
entGood
71.973.6
71.973
7372.5
83.183.2
66.386.5
72.6Average and less
28.126.4
28.127
2727.5
16.916.8
33.713.5
27.4Social support
Good 77.8
76.579.7
75.480
76.780.3
87.674.6
7777.3
Average and less
22.223.5
20.324.5
2023.3
19.712.4
25.423
22.7
- Table 4.13 observing the rights of patients receiving outpatient services in Iran, disaggregated by place of residence, public or private and type of provider (19)
Pharmacy
Midw
ife Dentist
Specialist General practitioner
Public sector
Private sector
Village dw
ellerCity dw
eller Total
Seven aspects of rights of service receivers
89.187.7
87.680
8182.4
81.783.8
80.982.1
GoodProm
pt attention
10.912.3
12.420
1917.6
18.316.2
19.117.9
Average and less
89.194.7
72,287.9
87.783.9
89.189.8
88.489
GoodRespect and dignity
10.95.3
27.812.1
12.316.1
10.910.2
11.611
Average and less
8089.5
6884.8
84.981.6
8688.8
84.185.9
GoodCom
municating
2020.5
3215.2
15.118.4
1411.2
15.914.1
Average and less
72.780.7
61.574.5
74.173.9
75.777.4
76.576.9
GoodInvolving in decision m
aking 27.3
19.338.5
25.525.9
26.124.3
22.623.5
23.1Average and less
76.493
72.888.9
89.483.9
89.889.6
88.889.1
GoodConfidentiality of inform
ation 23.6
727.2
11.110.6
16.110.2
10.411.2
10.9Average and less
85.582.5
62.177
75.368.8
78.474.3
78.877
GoodRight to choose
14.517.5
37.923
24.731.2
21.625.7
21.223
Average and less
85.573.7
65.779.9
78.774.6
80.783
78.680.3
GoodQ
uality of environm
ent14.5
26.334.3
20.121.3
25.419.3
1721.4
19.7Average and less

8888
Summarizing results of self-assessments done in Iran’s selected hospitals
One of the most applicable models which have recently been used voluntarily to evaluate quality performance of hospitals is the EFQM. This model is the basis of Iran’s quality award. Using this model, several hospitals have been awarded different certificates of quality award. Systematic review of previous studies shows that self-assessment results of 21 hospitals have been reported based on this model. Table 4.14 shows a summary of the most important results of these studies and a combination of them. A meta-analysis of findings extracted from the studies examined with the random effect model shows that the criterion “resources and participation” has the highest score among the nine criteria of EFQM model, the cumulative estimate of score percentage of this criterion is also more than others (46.02%). Moreover, this criterion has obtained the most points in eight studies. On the other hand, the criterion “employees’ results” has the lowest score, the cumulative estimate of score percentage of this criterion is less than others (35.31%). Evaluating criteria with the highest and lowest points in hospitals indicates a significant difference between scores of criteria related to “enabler” group and criteria related to “results” group. Thus, one of the enabler criteria has received the highest score in most of hospitals (18 hospitals out of 21 hospitals), while one of the results criteria has received the lowest score (14 hospitals out of 21 hospitals). These findings reveal that most of hospitals have better performance in the field of “enabler criterion” (structure and process) than in the field of “results criterion”, actually, these hospitals are weaker in attaining the “results criterion”.
Table 4.14 score of each of 9 criteria of Iran Quality Prize M
odel in the studied hospitals
Results Enablers
Final resultsPerform
ance key results
Society results
Employees’
resultsCustom
er’s results
Processes Resources &
partnership
Employees
Policy &
strategyLeadership
Corresponding author
No.
Score Score
%Score
%Score
%Score
%Score
%Score
%Score
%Score
%Score
%Score
%Score
209238
44.744.7
42.463.7
4426.4
38.634.8
42.184.3
46.465
49.544.6
48.643.7
44.935.9
48.448.4
M. Parham
1
299300
59.959.9
6191.5
6337.8
6054
58116
5678.4
6054
6861.2
5846.4
6060
F. Eghbal2
6270
13.0132.0
18.828.3
9.55.7
12.511.3
8.316.6
20.829.1
13.812.4
11.810.6
7.15.7
12.312.3
M. H. Im
ani3
247269
52.0516.0
49.073.5
47.028.2
47.042.3
52.0103.0
51.071.0
56.050.4
57.051.3
50.040.0
56.056.0
H. Sajadi4
320332
65.2652.0
68.6102.9
63.638.2
60.654.5
62.3124.6
63.989.5
70.463.4
65.559.0
66.052.8
66.866.8
A. Torabipour5
281334
61.5615.0
45.968.9
59.535.7
56.450.8
62.7125.5
65.191.1
63.457.1
66.459.8
67.453.9
72.272.2
A. Torabipour6
348391
73.8738.0
53.079.5
80.048.0
60.054.0
83.0166.0
79.0110.6
77.069.3
84.075.6
80.064.0
71.071.0
A. Sadeghi7
321324
64.5645.0
70.0105.0
63.037.8
47.042.3
68.0136.0
70.098.0
75.067.5
52.046.8
63.050.4
61.061.0
A. Sadeghi8
184183
36.7367.0
43.064.5
35.021.0
25.022.5
37.875.6
36.150.5
45.040.5
34.130.7
33.927.1
35.135.1
S. Vali9
212260
47.2471.6
48.172.2
31.118.7
24.831.4
45.090.0
61.185.5
46.141.5
45.340.8
50.640.5
41.641.6
M. R. M
aleki10
236204
44.0439.6
56.384.4
40.624.4
39.135.2
46.192.2
50.070.0
49.544.6
47.442.7
50.240.2
38.138.1
M. R. M
aleki11
380393
77.3773.0
82.1123.2
63.338.0
71.364.2
77.5155.0
76.9107.7
82.374.1
77.669.8
75.860.6
80.680.6
R. Dehnaviye12
5776
13.2132.9
7.010.5
28.016.8
11.09.9
10.020.0
15.021.0
20.018.0
9.98.9
16.012.8
15.015.0
N. Hatam
13
162197
35.9359
46.846.8
28.528.5
33.233.2
53.353.3
33.733.7
33.133.1
38.638.6
43.743.7
47.947.9
V. Yazdi14
0185
37.1185.4
0.00.0
0.00.0
0.00.0
0.00.0
37.152.0
39.835.9
34.731.3
38.931.1
34.934.9
S. M. Younesi
15
243260
50.3502.8
55.783.6
51.130.7
35.031.5
48.897.0
50.670.0
56.050.0
47.042.0
54.043.0
52.052.0
M. Javadi
16
240229
47.0469.5
60.490.7
41.825.1
48.343.5
40.581.0
38.754.2
60.954.8
52.447.2
40.432.3
40.740.7
S. Tabatabaie17
258271
52.9529.0
44.666.9
45.727.4
48.443.6
60.1120.2
59.583.3
47.342.6
49.044.1
55.844.6
56.456.4
R. Dehnavieh18
290305
59.5595.0
56.084.0
58.435.0
53.848.4
61.5123.0
66.092.4
55.349.8
55.650.0
59.447.5
65.065.0
R. Dehnaveh19
265287
55.2552.0
48.873.2
46.427.8
51.546.4
58.6117.2
61.085.4
53.247.9
51.045.9
58.246.6
61.461.4
R. Dehnavieh20
315324
63.9639.0
60.590.8
64.438.6
61.155.0
65.6131.2
67.093.8
60.654.5
65.659.0
61.649.3
67.067.0
R. Dehnavieh21
252.2641.37
435.545.08
54.6241.83
25.6935.31
31.8237.39
75.9943.88
60.546.02
41.6238.10
34.4040.82
32.7442.31
42.3142.31
The cumulative estim
ate (meta-analysis of
random effect m
odel)
95.83104.32
23.18187.26
19.9829.61
23.3914.65
20.1418.37
21.1439.68
24.9033.13
25.9423.72
21.9120.00
23.2819.12
24.0724.07
Lower lim
itRange of changes
437.89486.42
73.8313.03
61.60100.76
74.8245.04
61.9055.14
66.13145.51
77.33110.50
81.6473.21
66.2659.16
71.5756.03
74.3674.36
Upper lim
it
Q=1.62
Q=3.58
Q=1.47
Q=5.62
Q=5.99
Q=2.56
Q=2.45
Q=4.16
Q=4.38
Q=6.13
Q=4.50
Q=2.77
Q=2.58
Q=2.38
Q=2.45
Q=5.32
Q=5.71
Q=4.56
Q=5.09
Q=3.4
Q=3.4
Q=3.4
Heterogeneity test

89
Table 4.14 score of each of 9 criteria of Iran Quality Prize M
odel in the studied hospitals
Results Enablers
Final resultsPerform
ance key results
Society results
Employees’
resultsCustom
er’s results
Processes Resources &
partnership
Employees
Policy &
strategyLeadership
Corresponding author
No.
Score Score
%Score
%Score
%Score
%Score
%Score
%Score
%Score
%Score
%Score
%Score
209238
44.744.7
42.463.7
4426.4
38.634.8
42.184.3
46.465
49.544.6
48.643.7
44.935.9
48.448.4
M. Parham
1
299300
59.959.9
6191.5
6337.8
6054
58116
5678.4
6054
6861.2
5846.4
6060
F. Eghbal2
6270
13.0132.0
18.828.3
9.55.7
12.511.3
8.316.6
20.829.1
13.812.4
11.810.6
7.15.7
12.312.3
M. H. Im
ani3
247269
52.0516.0
49.073.5
47.028.2
47.042.3
52.0103.0
51.071.0
56.050.4
57.051.3
50.040.0
56.056.0
H. Sajadi4
320332
65.2652.0
68.6102.9
63.638.2
60.654.5
62.3124.6
63.989.5
70.463.4
65.559.0
66.052.8
66.866.8
A. Torabipour5
281334
61.5615.0
45.968.9
59.535.7
56.450.8
62.7125.5
65.191.1
63.457.1
66.459.8
67.453.9
72.272.2
A. Torabipour6
348391
73.8738.0
53.079.5
80.048.0
60.054.0
83.0166.0
79.0110.6
77.069.3
84.075.6
80.064.0
71.071.0
A. Sadeghi7
321324
64.5645.0
70.0105.0
63.037.8
47.042.3
68.0136.0
70.098.0
75.067.5
52.046.8
63.050.4
61.061.0
A. Sadeghi8
184183
36.7367.0
43.064.5
35.021.0
25.022.5
37.875.6
36.150.5
45.040.5
34.130.7
33.927.1
35.135.1
S. Vali9
212260
47.2471.6
48.172.2
31.118.7
24.831.4
45.090.0
61.185.5
46.141.5
45.340.8
50.640.5
41.641.6
M. R. M
aleki10
236204
44.0439.6
56.384.4
40.624.4
39.135.2
46.192.2
50.070.0
49.544.6
47.442.7
50.240.2
38.138.1
M. R. M
aleki11
380393
77.3773.0
82.1123.2
63.338.0
71.364.2
77.5155.0
76.9107.7
82.374.1
77.669.8
75.860.6
80.680.6
R. Dehnaviye12
5776
13.2132.9
7.010.5
28.016.8
11.09.9
10.020.0
15.021.0
20.018.0
9.98.9
16.012.8
15.015.0
N. Hatam
13
162197
35.9359
46.846.8
28.528.5
33.233.2
53.353.3
33.733.7
33.133.1
38.638.6
43.743.7
47.947.9
V. Yazdi14
0185
37.1185.4
0.00.0
0.00.0
0.00.0
0.00.0
37.152.0
39.835.9
34.731.3
38.931.1
34.934.9
S. M. Younesi
15
243260
50.3502.8
55.783.6
51.130.7
35.031.5
48.897.0
50.670.0
56.050.0
47.042.0
54.043.0
52.052.0
M. Javadi
16
240229
47.0469.5
60.490.7
41.825.1
48.343.5
40.581.0
38.754.2
60.954.8
52.447.2
40.432.3
40.740.7
S. Tabatabaie17
258271
52.9529.0
44.666.9
45.727.4
48.443.6
60.1120.2
59.583.3
47.342.6
49.044.1
55.844.6
56.456.4
R. Dehnavieh18
290305
59.5595.0
56.084.0
58.435.0
53.848.4
61.5123.0
66.092.4
55.349.8
55.650.0
59.447.5
65.065.0
R. Dehnaveh19
265287
55.2552.0
48.873.2
46.427.8
51.546.4
58.6117.2
61.085.4
53.247.9
51.045.9
58.246.6
61.461.4
R. Dehnavieh20
315324
63.9639.0
60.590.8
64.438.6
61.155.0
65.6131.2
67.093.8
60.654.5
65.659.0
61.649.3
67.067.0
R. Dehnavieh21
252.2641.37
435.545.08
54.6241.83
25.6935.31
31.8237.39
75.9943.88
60.546.02
41.6238.10
34.4040.82
32.7442.31
42.3142.31
The cumulative estim
ate (meta-analysis of
random effect m
odel)
95.83104.32
23.18187.26
19.9829.61
23.3914.65
20.1418.37
21.1439.68
24.9033.13
25.9423.72
21.9120.00
23.2819.12
24.0724.07
Lower lim
itRange of changes
437.89486.42
73.8313.03
61.60100.76
74.8245.04
61.9055.14
66.13145.51
77.33110.50
81.6473.21
66.2659.16
71.5756.03
74.3674.36
Upper lim
it
Q=1.62
Q=3.58
Q=1.47
Q=5.62
Q=5.99
Q=2.56
Q=2.45
Q=4.16
Q=4.38
Q=6.13
Q=4.50
Q=2.77
Q=2.58
Q=2.38
Q=2.45
Q=5.32
Q=5.71
Q=4.56
Q=5.09
Q=3.4
Q=3.4
Q=3.4
Heterogeneity test

9090
Indices of quality of prevention services
Concerning quality of prevention services, two indices related to appropriate knowledge of 15 to 24-year-old women about HIV prevention and percentage of 5-star schools are selected from information available at Health Deputy are reported in Figure 4.1 and Table 15.
Figure 4.1 appropriate knowledge of 15- to 24-year-old women about HIV prevention (2010) (21)
Table 4.15 Percentage of 5-star schools in provinces in 2013 according to Health Deputy
Province % Province % Province % Province %East Azerbaijan 8 Charmahal Va
Bakhtyiari - Qazvin 29 Mazandaran 2.8West Azerbaijan 5 South Khorasan - Qom - Markazi 8.1
Ardebil - Razavi Khorasan 3 Kordestan 2.1 Hormozgan 4
Esfahan 13 Khoozestan 7.9 Kerman 1 Hamedan 2
Alborz 42.7 Zanjan 4 Kermanshah 8 Yazd 1
Ilam 3.5 Semnan 9.6 Kohkilooyeh Va Boyerahmad 3.1 Whole Iran 10
Boushehr - Sistan Va Balouchestan 1 Gilan 2.6 0.7
Tehran 26 Fars 1 Lorestan 6.1 8.5
Indices related to supervising quality of services
In this part, data is presented in three sections, namely conditions of service providing centers in terms of legal permits, average number of pharmaceuticals and referrals to diagnostic centers (Table 4.16) and results of the evaluation of centers and various service providers by Iran Health Insurance Organization (Tables 4.17, 4.18, and 4.19). Obtaining a legal license for service providers needs some qualitative requirements which must be addressed by these providers.

91
Some evidences suggest that not all service providers have this license in Iran. Based on this evidence, 7.1% of rehabilitation centers and 9.8% of dentistry services lack this license (22). As shown in Table 4.16, the average number of some special pharmaceuticals in some provinces is twice more than that in other provinces. Moreover, referral to diagnostic centers in some provinces is five times more than that in other provinces.
Table 4.16 Average number of specialists’ pharmaceuticals and referral per capita to diagnostic centers contracting with Health Service Insurance Organization (23, 24)
Table 4.17 Ranking conditions of service proving institutes contracting with Health Service Insurance Organization (25)
Table 4.18. Number of active beds under contract with Iran Health Insurance Organization, disaggregated by current hospital evaluation score and the average assessment (25)
Average evaluationTotal%Grade 4%Grade 3%Grade 2%Grade 1
1.210378802202187716167328284959
Referral per capita to diagnostic centresAverage number of specialist pharmaceuticals
Min. Province Mix. Province
Average index
Diagnostic services
Min. Province
Mix. Province
Average index Specialty
0.010.050.02MRI2.43.42.9Pediatrics
0.010.040.01CT Scan1.83.83.2Internal
0.040.220.11Sonography 2.13.42.7Surgery
0.040.220.09Radiology 2.12.92.4Gynecology and Obstetrics
Index A % B % C % Total Ranking status of diagnostic and treatment institutions contracting with the organization (country)
3960 77 1113 22 84 2 5157
Ranking status of general practitioners contracting with the organization 987 79 245 20 8 1 1250
Specialists contracting with the organization 1098 77 296 21 28 2 1422
Dentists contracting with the organization 287 81 63 18 5 1 355
Pharmacies contracting with the organization 621 71 240 27 15 2 876
Laboratories contracting with the organization 134 73 48 26 2 1 184
Rehabilitation centres contracting with the organization 296 80 72 19 4 1 372
Surgical centres contracting with the organization 24 52 22 48 0 0 46
Hospitals contracting with the organization 68 64 38 36 1 1 107

9292
Table 4.19 Number of hospitals contracting with Iran Health Insurance Organization, in terms of current evaluation level and average evaluation in each province (25)
Province Grade 1 % Grade 2 % Grade 3 % Grade 4 % TotalAverage
Average
ranking
East Azerbaijan 21 49 18 42 4 9 0 0 43 1.6 23
West Azerbaijan 14 47 11 37 4 13 1 3 30 1.7 25
Ardabil 9 60 4 27 1 7 1 7 15 1.6 21
Esfahan 44 72 15 25 1 2 1 2 61 1.3 13
Alborz 13 87 2 13 0 0 0 0 15 1.1 6
Ilam 3 27 8 73 0 0 0 0 11 1.7 24
Boushehr 7 50 3 21 4 29 0 0 14 1.8 28
Tehran 87 87 12 12 1 1 0 0 100 1.1 7
Charmahal Va Bakhtyiari 6 75 2 25 0 0 0 0 8 1.3 11
South Khorasan 3 33 5 56 1 11 0 0 9 1.8 27
Razavi Khorasan 38 67 14 25 4 7 1 2 57 1.4 17
North Khorasan 7 78 2 22 0 0 0 0 9 1.2 10
Khoozestan 31 63 15 31 3 6 0 0 49 1.4 16
Zanjan 12 92 1 8 0 0 0 0 13 1.1 4
Semnan 9 90 1 10 0 0 0 0 10 1.1 5
Sistan and Balouchestan 12 67 5 28 1 6 0 0 18 1.4 15
Fars 44 68 20 31 1 2 0 0 65 1.3 14
Qazvin 13 100 0 0 0 0 0 0 13 1.0 1
Qom 10 100 0 0 0 0 0 0 10 1.0 1
Kordestan 7 44 9 56 0 0 0 0 16 1.6 20
Kerman 23 79 6 21 0 0 0 0 29 1.2 8
Kermanshah 6 26 1 61 3 13 0 0 23 1.9 29Kohkilooyeh and Boyerahmad
100 0 0 0 0 0 0 5 1.0 1
Golestan 13 59 8 36 1 5 0 0 22 1.5 19
Gilan 10 33 13 43 7 23 0 0 30 1.9 30
Lorestan 9 41 6 27 7 32 0 0 22 1.9 31

93
Mazandaran 31 74 10 24 1 2 0 0 42 1.3 12
Markazi 8 42 8 42 3 16 0 0 19 1.7 26
Hormozgan 13 65 6 30 0 0 1 5 20 1.5 18
Hamedan 9 45 10 50 1 5 0 0 20 1.6 21
Yazd 15 79 4 21 0 0 0 0 19 1.2 9
Whole Iran 532 65 232 28 48 6 5 1 817 1.4
Preparation Conditions of Evidence-Based Guidelines in Health Sector:
“Health Technology Assessment, Standards and Tariffs Office” was established in 2010 as one of the offices of the treatment deputy of MOH. Functions and activities of its two offices (Clinical Guideline Standardization and Codification Office and Health Technology Assessment Office) have a special relationship with quality of health services in Iran. Clinical Guideline Standardization and Codification Office prepare scientific evidence for all services provided in the health system of Iran. Type and number of scientific products of this office are shown in the following table.
Table 4.20 Production status of clinical guidelines, clinical policies and service standards according to statistics of Health Technology Assessment Office, Standards and Tariffs, 2014
Service standardClinical policyClinical guidelineType of knowledge product
1201520No. Of products produced up to now
- Codified standards are related to the fields of jaw, mouth and face radiology, infertility, optometry, obstetrics, intensive care, plasmapheresis, radiotherapy, nutrition, PET scan, traditional medicine, cardiac rehabilitation, infertility and acupuncture. Activities of Health Technology Assessment Office have started at a secretariat in the MOH since 2007, it started its activity with a new structure at Technology Assessment, Standard and Tariff Codification Office in 2010. Some institutions such as Food and Drug Administration (FDA), Medical Equipment Department, Article 20 Commission and private organizations mainly need technology assessment. Selection of technologies to study health technology assessment is prioritized based on some principles such as the disease burden associated with technology, the affected population and the severity of the related disease.
So far 22 reports have been prepared for Health Technology Assessment and

9494
have been presented to policy makers. About 36 other new technologies have also been given to researchers to study health technology assessment through the National Institute for Health Research (NIHR). This department examines products such as rapid assessments of some technologies and short reports about technology. Health Technology Assessment is a new field in Iran and thus it has its own problems. Some of its most important problems are poor understanding of how to use results of health technology assessment, little knowledge of how to implement projects in Iran, political pressures and lobby groups, beneficiaries’ disagreement on the problem and lack of systematic and network connections between researchers.
A Glance at Equitable Access to the Service and Its Impact on Quality
As defined by WHO equitable access to services affects the quality of services. Since this issue is limited, we do not go into detail and only two factors are mentioned in this regard. Table 4.21 shows the distribution of the average index of specialists to population.
Table 4.21 Distribution of average index of specialists to population (100 thousand people) in Iran public hospitals and its distribution in provinces in 2010 (26).
Moreover, adjusting number of hospital beds to population throughout Iran and in each province shows that the average number of hospital beds is 1.6 for every 1000 population in Iran. Yazd has the highest number of beds (2.5 beds), while Kohkilooye and Boyerahmad has the lowest number of beds (0.9 beds) per population (27).
Analysis of Higher Level Documents and Programs of Quality of Health Services in Iran
In this section, results of review and analysis of higher level documents related to the subject (comprehensive scientific health plan in Iran, health system evolution plan, fourth development plan, fifth development plan and general health policies announced by the Supreme Leader) have been briefly mentioned. In general, the
Specialty Average index Max. Province Min. Province
Pediatrics 1.72 2.66 1.02
Internal 1.45 2.97 0.92
General Surgery 1.07 1.64 0.67
Obstetrics and Gynecology 1.61 2.47 1.06

95
orientation of higher level documents concerning quality dimensions is as follows:
• Structural dimension of quality of services: The following orientations are notable in this aspect of quality:
Stewardship of quality of services: the government is responsible for promoting, maintaining and providing quality at the highest possible level and is in charge of ensuring that the general public receive high quality health services;
o Selecting appropriate models to improve the quality of services: in this regard, making use of comprehensive and localized models (such as clinical governance), new knowledge-based models and methods, implementation of models in all service-providing centers, measuring and codifying standards and targeting them at international standard levels are important;
o Promoting manpower: necessity to change the educational system in order to achieve the quality of services at different levels of health system, estimating and planning quantity and quality of trained manpower and codifying the related standards are emphasized here;
o Increasing financial resources for quality: increasing the share of health in proportion to the quality of services has been mentioned in documents;
o ppropriate definition of basic services: vagueness of basic and supplementary benefit package is one of the main problems of quality of services which particularly damages the quality of basic services. These concerns have been addressed in higher level documents. “Providing services beyond the basic insurance by complementary insurance within the framework of clear instructions in a way that the quality of basic treatment services is always desirable” has been emphasized;
o Quality of health products: public access to effective and high quality drugs, guarantying quality, efficiency and safety of existing drugs, enhancing the reporting system and monitoring the quality of products effectively, strengthening the infrastructures needed for producing pharmaceutical raw materials and products, vaccines, bio-products and medical supplies and equipment with international quality and standard, developing systems which monitor the quality of medical products and improving the quality of medical products produced in Iran are the most important orientations of higher level documents in this sector;
o Infrastructure for the quality of services: establishing infrastructures

9696
to provide some services such as pre-hospital emergency services with acceptable quality throughout Iran has been mentioned in this regard;
o Quality-based payment: guiding the payment system towards improving the quality of services has been emphasized in higher level documents;
o Quality-accreditation organizations: formation of organizations accrediting and certifying quality in health sector to improve the allocation of financial resources has been emphasized here;
• Process dimension of quality of services: higher level documents have the following orientations in this aspect of quality:
o Using appropriate models: in the structural aspect, features of a selected model were mentioned, using this model has been emphasized in this section;
o Feedback to beneficiaries: “informing people of quality of services” has been emphasized here;
• Outcome dimension of quality of services: in this aspect of quality, higher level documents have the following orientations:
o Desirable levels of results: global levels of standardization of activities, improving the quality and achieving target measures have been emphasized here;
o Necessity of assessing results: the importance of “assessing the quality of performance in the health sector” has been mentioned here;
o Stressing the importance of specific results: excellent quality and safety of services including diagnostic services, care, medicine, qualitative development of health and treatment insurance and development of quality of health and nutritional care in health and treatment networks are some cases emphasized in higher level documents in the field of emphasizing the importance of specific results. Table 4.22 shows analysis of higher level documents in three aspects of structure, process and outcome of quality of health services.

97
Table 4. 22 Higher level documents analysis in three dimensions of structure, process and outcome of quality of health services
Concepts extracted from higher level documentQuality dimension
-Quality stewardship
-Selection of appropriate models
-Promoting manpower
-Increasing financial resources for quality
-Appropriate definition of basic services
-Quality of health products
- Quality-based payment
-Infrastructures for quality of certain services
- Quality-accreditation institutions
Structure
- Using proper models
- Feedback to beneficiariesProcess
- Desirable levels of results
- Necessity of assessing results
- Stressing the importance of specific results
Outcome
In the Fifth Development Plan, sixty indices have been considered to monitor the achievement of the program objectives. Some of the appropriate indices in this sector include: mortality from Myocardial Infarction within a month after a heart attack, portion of mortality from Myocardial Infarction below the age of 70 to total death from heart attack, decreased incidence of diabetes in pre-diabetic people and increased awareness of risk groups and patients of the disease;
Important programs in managing the quality of health services: Table 4.23 shows important national events and programs affecting the quality in health sector. These events have been proposed since 1997 by formation of hospital evaluation standards and criteria. It worth mentioning that most of these programs will become useless after they are proposed and used for several years and more modern programs will be used to manage quality of services.
The followings are some effects of the latest events related to the quality, i.e. Health Transformation Plan (HTP) on the quality of health services.
Improving the quality of health services in the health system evolution plan
Eight executive packages are provided in the HTP. These packages have repeatedly examined the subject of improving the quality of services, of them; the packages “natural vaginal delivery plan, hoteling quality improvement in public hospitals, improving the quality of outpatient services in public hospitals, supporting the retention of specialists in the deprived areas and presence of specialists in public hospitals” are the most important ones.

9898
Improving quality and natural childbirth promotion package: Main strategies to improve the quality of natural vaginal delivery in HTP include training mothers, enabling the service providers, codifying manpower standards, equipment, physical space, codifying standards of midwifery services and natural delivery and promotion of natural childbirth. Moreover, to make delivery process pleasant, keep mothers’ privacy and provide the opportunities for trained companions to be with the pregnant women, public hospitals must provide private delivery rooms with one by one care. According to these guidelines, in order to optimize the physical space of delivery rooms, some financial resources will be given to the hospitals to make private rooms in the labor ward.
Table 4.23 Major events in managing quality of health services in Iran
Year Implemented programs
1997 Formation of hospital evaluation criteria and standards in Treatment Deputy of Ministry of Health
1999 Beginning to use ISO standards in some hospitals and other centers providing health services
1999 Establishing a national secretariat to improve quality/making use of FOCUS-PDCA based on TQM (Total Quality Management) philosophy, especially in health deputies
2001 Holding the first conference on quality management in the health sector
2003 Beginning to use EFQM model in some hospitals
2004 Assessing and promoting quality indexes in evaluations at Health Deputy of Ministry of Health
2009 Implementing clinical governance plan in Iran hospitals
2010 Beginning to use EFQM model in assessing performance in some health deputies
2010 Beginning the “patients’ safety friendly hospital” plan in 10 hospitals of Iran
2011 Holding the first national festival on clinical governance
2012 Beginning to evaluate hospitals based on new accreditation standards in Iran hospitals
2014 Beginning the health system evolution plan by focusing on increasing the quality of services
Hoteling quality improvement package in public hospitals:It is perhaps the most important package in satisfying patients of inpatient services at MOH hospitals. This package has mentioned that patient’s satisfaction cannot be achieved only by providing professional services; however, a major part of this satisfaction is affected by the quality and variety of hoteling services and employees’ behavior. Seven main aspects of hoteling quality package include buildings and facilities, equipment, utilities, services, hygienic services, feeding patients, administrative affairs and workflow, and human resources.
Outpatient service quality improvement package in public hospitals: Visiting up to eight patients per hour, observing visiting standards such as recording detailed history of disease and physical examination, recording para-clinical findings by physicians and registering in and training treatment program and the way how prescribed medicines must be taken are some of the cases related to this package.

99
Quality improvement and supporting the retention of specialists in the deprived areas: supporting the retention of specialists in the deprived areas and presence of specialists in public hospitals are two guidelines designed to increase patients’ access to specialists in different regions of Iran and to improve the quality of treatment services.
Quality improvement by presence of specialists in public hospitals: this package has been also implemented to encourage physicians to be present in hospitals 24 hours a day and to meet patients’ needs rapidly. Providing timely services, accountability of educational-treatment centers, diagnosing patients by specialists in the emergency rooms in the shortest possible time, patients’ timely visits, surgeries and emergency procedures and increasing peoples’ satisfaction are the main objectives of this package.
Quality Challenges of Health Services in Iran and Future Effective Trends
In this section, the challenges of quality of health services are mentioned from two aspects: in the first dimension, some problems can be mentioned on different service levels in structural, process and outcome aspects affecting the quality of services, in the second part, some challenges are notable in the field of extending quality management models at different service levels. The following are some of the challenges related to the quality of services in the health system evolution plan. Table 4.24 shows the challenges that exist at different service levels in structural, process and outcome aspects and challenges that prevent the improvement of quality of services.

100100
Table 4.24 Existing challenges at different service levels in structural, process and outcome aspects
Service level Some challenges of quality of services
Health improvement services
Paying less attention to this part and thus allocating less resources, poor teamwork especially at this level, lack of up-to-date, valid and reliable laws, poor necessary infrastructures, complexity of service quality measurement at this level, disagreement over indices of quality of services, lack of a comprehensive mechanism to monitor the quality of services, lack of a system to regulate reward and punishment laws for strong and weak performance
Primary health care
Lack of an updated model to provide primary health care services, presence of numerous laws and regulations, conflicts in some programs, different interpretations of laws and regulations, poor coordination between the activities, poor implementation of primary health care programs and facilities, low self-assessment in primary health care, unaccountability to new care needs, failure to define the tasks of various professions, not using patients’ electronic health records, lack of appropriate tools for assessing the quality of care, integrating new programs in the network system without deleting or modifying the old program, changing programs constantly as the ministry officials change, the lack of a benefit package for suburb dwellers, lack of care system for many network system programs,
Lack of health economic analysis about pricing and rationing the services,lack of social marketing for primary health care services in cities, poor participation of society to create environments that support health, poor record of statistics, poor monitoring and evaluation system, lack of agreed quantitative and qualitative indices and standards, the shortage of expert evaluators, lack of regulatory actions to reward and punish, failure to provide constructive feedbacks, low motivation of health employees as a result of increased workload and lack of certain programs to guide operations at higher levels, poor relationship between manpower training system and needs of service providing systems, out-of-date benefit packages, necessity of increasing attractiveness of activities in preventing and health promotion sectors, moving towards creating and implementing telemedicine and necessity of creating and applying home care
Outpatient treatment care
Training general practitioners about inpatient treatment in specialized hospitals and low attention to outpatient treatment training, poor distribution of human resources who provide services, inappropriate distribution of centers and clinics, poor place and equipment of outpatient service centers, poor codification of clinical guidelines and their usage, inappropriate and unnecessary referrals, confusion and wasting patients’ time, induced demands, poor accountability to non-clinical needs, lack of a comprehensive system monitoring the observation of standards in outpatient services, inability of systems to track patients

101
Inpatient treatment care
Inadequate distribution of human resources who provide services, poor distribution of hospital beds in Iran, the shortage of beds for some patients, poor definition and use of clinical guidelines, significant presence of nosocomial infections and the lack of their statistics, providing unnecessary services, medical errors, illogical expansion of very small hospitals with high costs, lack of structured and meaningful relationship between public and private sectors, lack of a real referral system, the shortage of manpower in some groups, lack of an appropriate response to the real needs of the system, inappropriate role of insurance in monitoring quality of services, poor scientific management of hospitals
Rehabilitative care
Most challenges proposed in the inpatient sector, poor mental preparedness of families in facing the issue, incoherence and lack of communication with the outpatient sector, poor follow-ups, lack of guidelines providing rehabilitation services, induced demands, lack of accurate and official tariffs, abandonment and rejection of alternative methods such as acupuncture, massage therapy and hydrotherapy in insurance system
Palliative care
Lack of detailed information on the exact status of trained staff and available facilities, little attention of health policy makers and decision makers on the importance of this issue, lack of a precise definition of the benefit package and a standard identification of palliative medicine for health and treatment system, functional interdisciplinary interventions, poor communication in showing palliative medicine to different groups, lack of experts in three fields of cancer nursing, cancer nutrition and intellectual and supportive issues for patients with cancer, burnouts of groups providing services for the related patients
Improving the quality of services requires adherence to comprehensive models in order to create consistency in quality improvement activities. As mentioned in table 4.23, Iran’s health sector has the experience of using different quality improvement models, especially in treatment sector, but it has had some serious problems in using them. Table 4.25 shows some of them.

102102
Table 4.25. Challenges in using quality management models at different service levels
Challenges Concept
- Managers’ low commitment
- Unfamiliarity with managerial concepts
- Instability of managers careers
- Inappropriate appointment of managers
- Hasty use of quality management tools
Weakness in the performance of senior managers
- Lack of experts familiar with quality management tools
- Poor motivation of staff
- The shortage of manpower
- Skepticism about the quality tools
Problems related to manpower
- Lack of interaction between deputies of the ministry
- Weak intersectional communications
-Inappropriate definition of administrative structures
Structural/communicative problems
- Poor planning about training quality promotion concepts
- Inapplicability of quality promotion trainings
-Education costs
Educational problems
- A weak need for change
- Hasty conclusion
- Little attention to cultural conditions
-Poor teamwork
Cultural weakness
- Financial constraints
- Poor access to information
-Physical restrictions
Weakness in financial, information and equipment resources
-The shortage of some protective laws
- Poor assessment by the ministry and the university
Weaknesses in regulation and supervision
Challenges related to quality of services in HTP
Hoteling quality improvement package in public hospitals: Financial resources for this package are mainly allocated to improve physical space especially toilets, to equip hospital rooms with necessary facilities and to do necessary repairs

103
on heating and cooling systems. However, failure to provide necessary funds for basic repairs and improvements of central facilities of hospitals, attracting and spending allocated credits to receive further funding, old structure of some hospitals which cannot be repaired, limited opportunities of assessors to evaluate and assess the needs of hospitals and lack of allocation of patient carriers and workers to hospitals are some of the challenges that hospitals face in improving the quality of hoteling.
Improving the quality by natural childbirth promotion package: It seems that there is no serious and effective action that has been taken to promote social marketing, natural delivery, and attract public confidence in the quality of services of natural delivery in university hospitals. On the other hand, process of designing standards and physical space of delivery rooms and spaces to take care of mothers after delivery have been very slow, in some hospitals, there is no possibility of improvement due to the exhaustion of the physical structure.
Improving the quality by supporting the retention of physicians in deprived areas: Physicians concerns about the stability of this plan due to heavy financial burden of this project for the government, distrust of people residing in deprived areas of physicians who are sent to these areas and their willingness to go to the larger cities, distortion of the physician-patient relationship because of the negative publicity about the performance and earnings of physicians in the media and lack of equipping clinics of these regions with diagnostic and therapeutic para-clinical facilities all prevent providing high quality services in these areas.
Improving the quality by presence of specialists in public hospitals: Although, this guideline has caused some acceptable benefits and advantages in non-educational hospitals, especially in small towns where specialists and subspecialists have no incentive to serve, the effect of its implementation on the quality of services in educational hospitals in provinces or large cities which have experienced the constant presence of medical residents and supervision of medical school professors before proposing this plan is controversial. Although this plan has made specialists be present in some hospitals, real presence of specialists has not occurred in some other hospitals. Moreover, there is a problem that constant presence of professors reduces students’ autonomy in using what they have learnt.
Trends Affecting the Quality of Health Services in Iran
In this section, effective trends are presented in Table 4.26 in the form of STEEP-V classification. Some important effective trends in health system are also mentioned at the end of this table. In the “measures” section, some actions

104104
have been proposed in accordance with the effects of some of these important trends on quality of services.
Table 4.26 Some trends affecting the future of quality of health services
Some effects of trends on future of quality of health servicesImportant trendsTrend type
Changes in nature of services to observe the minimum quality requirements, more serious attention to all aspects of quality of service, offering high quality services through comparison with international standards, proposing concerns about the quality of aging services, increased concerns about the quality of services of diseases caused by changes in the lifestyle
Increased awareness, expectations and demands of society, aging population, changes in number of manpower, changes in lifestyles, increased health literacy in society
Social
Increased access to health information and evidence, increased use of specialists from distant locations, having access to some health services through mobile phones, having access to effective technologies, increased transparency and effectiveness of policies, increased awareness of professionals through access to information resources, increased concern about proportion of technology to local needs
Developing communicative networks and internet infrastructures, developing telemedicine, developing a new generation of phones, increasing capability of health technologies, developing educational technologies, increasing productivity by observing international standards, paying more attention to evidence in the health area and producing guidelines
Technological
The ups and downs of the structural budget of quality of service, gaps between quality of services in public and private sectors, challenges in financing due to sanctions and importing certain goods and technologies
Economic fluctuations and changes in the health budget, increased gap between different social classes, smuggling drugs and supplies, economic sanctions due to political reasons
Economical
Changes in the composition of service demands, changes in the distribution of human resources providing services, increased side effects of environmental pollution, increased diseases related to environmental pollution
Drought and water crisis, environmental pollution Environmental
Ability to change service quality management policies, quality of service, ups and downs of the budget, the possibility of changes in health sector financing policies
Political programs and partisanship, Iran’s nuclear file negotiations Political
Increased concerns about addressing patients’ non-clinical needs, fears of mistrust service provider
Changing the rules governing the service providers-receivers, increased tendency to western patterns, loss of social capital
Value
Increased concerns about monitoring quality of services, increased individual’s role in the quality of services, raising concerns about the quality of services of chronic and mental diseases, concerns about supplying human resources with regard to the burden of disease in the future, increased use of payment approaches based on quality of services, concerns about leveling and equity, increased competition in tangible aspects of quality such as hoteling
Increased privatization, increased self-care and self-treatment, increased chronic and mental diseases, changes in expectations of insurance organizations, increased sensitivity to quality of services, professionalism
Trends in healtharea

105
Lessons Learned From Other Countries
Thailand: its experience in status of quality of services teaches other countries many things and shows that improving and supervising quality must be considered an important reforming element related to universal health coverage (28). In its universal health coverage program, Thailand has considered three major approaches, namely codification and application of evidence-based guidelines, accreditation of service providers and creation of financial incentives through result-based financing to improve quality.
Evidence-based guidelines have been widely used by some countries such as Thailand which seek to improve the quality of their universal coverage programs. Guidelines can be used in many different forms such as clinical guidelines, health technology assessment, pathways, protocols and standards. Thailand’s main challenges in guidelines are evidence resources and how to interpret the mentioned evidence. In terms of evidence resources, there are some concerns about poor data and local studies. Interpretation of evidence is another challenge related to the shortage of experts familiar with the issue. Developing guidelines for chronic diseases with high load has recently been of great importance in this country. Moreover, results of health technology assessment projects have a great impact on health benefit package in this country.
Accreditation programs are powerful tools for defining and evaluating performance based on various dimensions of quality. These programs, to a great extent, have the potential to improve patients’ safety and satisfaction (29). Accreditation is a complex process whose implementation has been different in different countries. Although accreditation of service providers is optional, insurance encourages service providers to get certificates and meet requirements for accreditation by considering financial incentives for service providers that have been accredited. Financial rewards can motivate providers to achieve better results and to improve the process (such as better recording files). These incentives can be proposed as positive incentives and negative incentives (due to a defect in work) (30).
Turkey: as level of access to health care increases in Turkey, focusing on the quality of health services has become important in this country. Although this country has had some progress in improving the quality of health services in recent decades, it still lags behind other member countries of the Organization for Economic Co-operation and Development (OECD). Lack of focus on the quality outcome indices is one of the challenges in Turkish health system. Organizing and determining the role of various institutions appropriately is an important factor in improving the quality of health services. In its Ministry of Health, important steps have been taken to reorganize the health sector towards quality. To facilitate the use of quality indices, Turkish health system needs a coherent policy in the context of strengthening the health information infrastructures. In

106106
this regard, national institutions should collect adequate statistics comparable with region countries.
Systematic efforts to collect and report data related to quality of services, development of information infrastructures for quality (e.g. cancer registration system and secondary use of data from electronic medical records), collection of data on safety and effectiveness of care in hospitals (e. g. output indices, readmission level and complication rate), collection of specific managerial data, conducting field studies at family and patient levels, providing feedback to service providers on the quality of services at the regional level and encouraging self-assessment and continuous improvement are some of the requirements of this issue. Although, most hospitals in Turkey use health information system, the possibility of providing appropriate information related to the quality of services is controversial. Changing the nature of diseases towards chronic and mental diseases and diabetes, the nature of concerns about the quality of service is also changing in this country. Therefore, determining indices to specify the conditions of quality of these services is essential.
Some of the most important guidelines that turkey has emphasized concerning improvement of the condition of quality of services are as follows:
It is important to provide feedback on the quality of services to service providers, policy makers and decision makers;
To improve service quality promotion culture, activities must move from controls and punishments to encouragement. In this regard, defining ceremonies to celebrate the successes in improving this issue will be very effective;
• It is important to highlight quality in paying service providers and to encourage them through payment systems;
• Involving all beneficiaries in the process of defining quality standards will help implementing the plan;
• Coordination and agreement among organizations providing services with regard to monitoring the quality of services and implementing standards is important;
• Enabling service providers concerning the safety and quality of services and proper education, enabling patients, informing them and collecting patients’ viewpoints about the quality of service must be prioritized;
• Encouraging service providers to use self-assessment methods seems helpful;
• Developing clinical guidelines and protocols, trying to create primary

107
health care standards and focusing on clinical guidelines in important issues such as cardiovascular diseases or diabetes are of great importance (15).
South Korea: South Korea has taken to improve the quality of health services are as follows:
• National programs for patient’s safety:
In this regard, Korea is trying to create a system for reporting adverse events and medical errors; it can be an important tool to improve the quality of care and patient’s safety. The importance of establishing such a system has completely been understood by policymakers in Korea. In order to strengthen this subject, service providers are advised to legislate on “patient’s disability insurance”;
Policies related to clinical pathways within and between different service levels:
Ensuring that patients receive health care appropriately and uniquely is required in quality of services. Due to increased prevalence of chronic diseases, it seems that reorganizing services is necessary to meet this requirement. In this regard, countries like South Korea have proposed some guidelines like improving communication between different providers, defining multiple responsibilities of service providers and establishing information systems to monitor the quality of system services;
• National quality improvement programs
These programs include purposeful actions that are taken by cooperation of various groups such as service providers, patients, financial organizations and government. Examples of these actions in Korea include the publication of newsletters related to quality of services, activities of service quality improvement associations, holding regular meetings to discuss quality of services, holding educational courses on improving the quality purposefully and holding conferences related to the quality of services. In addition to these programs, Korea has focused on improving quality of services, increasing the quality of outputs by educating skilled physicians and ensuring safety of institutions and health technologies (31).
Denmark: This country is considered one of the pioneers in quality of health services among the members of the Organization for Economic Cooperation and Development. Like other countries, Denmark faces some challenges such as increased public and political expectations of quality of services, increased specialization and increased number of elderly patients; it has taken some actions to deal with them. Denmark has a coherent program to monitor the quality of services. In this program, appropriate databases can be found in the field of information related to the care processes and outcomes. Moreover, it uses a
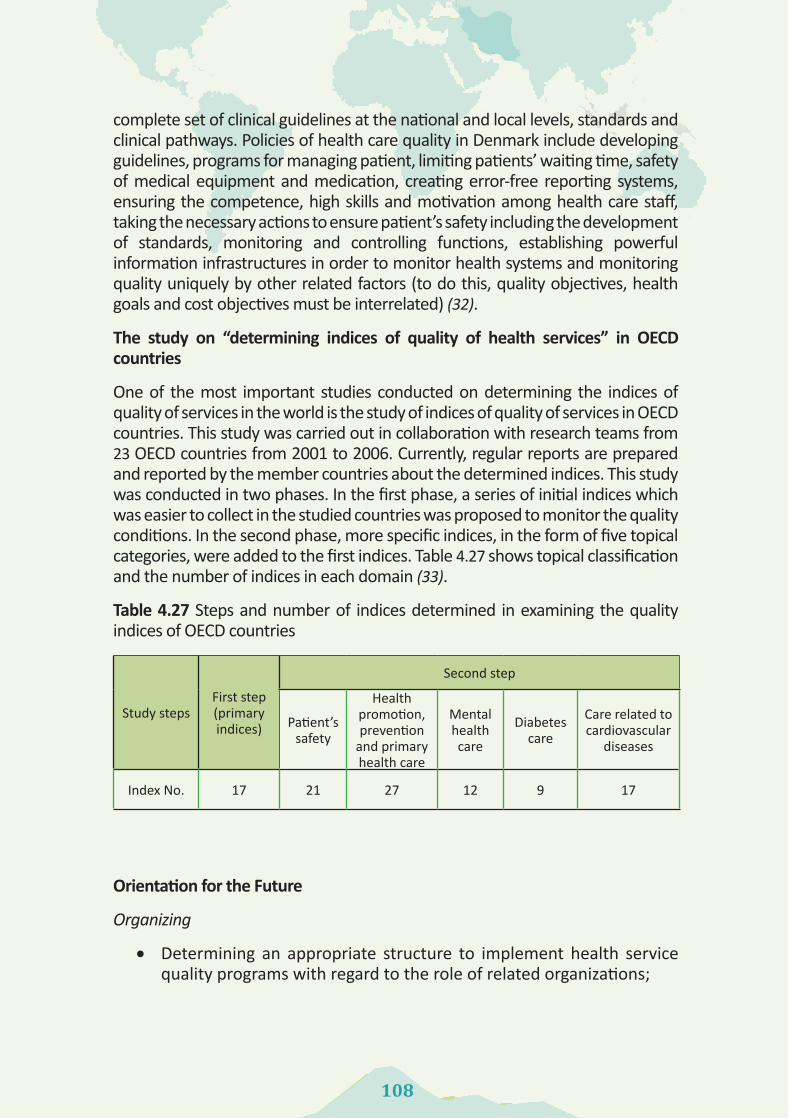
108108
complete set of clinical guidelines at the national and local levels, standards and clinical pathways. Policies of health care quality in Denmark include developing guidelines, programs for managing patient, limiting patients’ waiting time, safety of medical equipment and medication, creating error-free reporting systems, ensuring the competence, high skills and motivation among health care staff, taking the necessary actions to ensure patient’s safety including the development of standards, monitoring and controlling functions, establishing powerful information infrastructures in order to monitor health systems and monitoring quality uniquely by other related factors (to do this, quality objectives, health goals and cost objectives must be interrelated) (32).
The study on “determining indices of quality of health services” in OECD countries
One of the most important studies conducted on determining the indices of quality of services in the world is the study of indices of quality of services in OECD countries. This study was carried out in collaboration with research teams from 23 OECD countries from 2001 to 2006. Currently, regular reports are prepared and reported by the member countries about the determined indices. This study was conducted in two phases. In the first phase, a series of initial indices which was easier to collect in the studied countries was proposed to monitor the quality conditions. In the second phase, more specific indices, in the form of five topical categories, were added to the first indices. Table 4.27 shows topical classification and the number of indices in each domain (33).
Table 4.27 Steps and number of indices determined in examining the quality indices of OECD countries
Second step
First step (primaryindices)
Study steps Care related to cardiovascular
diseases
Diabetescare
Mental health
care
Health promotion, prevention
and primaryhealth care
Patient’ssafety
17912272117Index No.
Orientation for the Future
Organizing
• Determining an appropriate structure to implement health service quality programs with regard to the role of related organizations;

109
• Determining an appropriate structure to evaluate quality of services with regard to specific requirements and characteristics of these institutions;
• Defining the role of different levels involved in improving the quality of services and facilitating communication between them;
• Observing suitable structures for appropriate transfer of quality-based knowledge among beneficiaries;
• Defining educational and research roles related to improving the quality and its providers
• Defining a suitable structure for a proper definition of services of benefit packages.
Rules and Regulations
• Defining a legislative structure related to improving quality and strengthening the body of expertise regarding the role of interest groups in the legislative process;
• Reviewing rules and guidelines related to different service levels according to the new needs of society (such as chronic diseases);
• Codifying appropriate laws and regulations to produce different evidence-based guidelines;
• Creating a correct understanding of quality among legislators working in health area .
Supplying Resources (Financial, Human, Information)
• Defining a system of monitoring quality of health services in Iran and developing suitable indices;
• Monitoring infrastructural resources of quality of services allocated to the health sector;
• Creating information infrastructures related to quality of services through strengthening disease registration systems, improving the quality of clinical files and error registration systems;
• Providing evidence-based guidelines at different service levels in the health sector with the participation of all beneficiaries;
• More serious involvement of medical education with regard to

110110
teaching the concepts “quality of services” and training human resources qualitatively and quantitatively;
• Wise selection of quality promotion models to create an intellectual order in the field of concepts in beneficiaries and using them;
• Improving motivation of health personnel to provide high quality services and enabling them appropriately;
• Promoting production knowledge, interpreting and using information related to quality;
• Monitoring the quality of inputs such as medicines and medical equipment and promoting and facilitating the use of new technologies affecting the quality of services through some channels such as health technology assessment and monitoring new technologies (health technologies).
Payment
• Creating necessary mechanisms to use quality-based payments in units providing services ;
• Considering a more serious role of insurance through a payment tool to affect the quality of health services using strategic purchase approach;
• Facilitating the development of patient’s disability insurance to reduce concerns of service providers and receivers.
Behavior
• Providing feedback on the quality of services to society and service providers;
• Defining a meaningful ceremony to honor the efforts related to improving the quality nationally and locally;
• Using appropriate methods to promote education, awareness, attitude and performance of service providers concerning the quality of services and using evidence in making decisions;
• Promoting self-assessment processes in different organizations providing health services in Iran;
• Institutionalizing moral, cultural and social values in providing health and treatment services to meet non-clinical needs of the society;
• Using strategies such as relevant newsletters, service quality

111
communities, regular meetings related to the promotion of the concepts of quality of services;
• Promoting the adoption of a reasonable level of errors by the system and promoting reporting these errors honestly.
Operational Considerations in Iran in order to Improve Quality of Health Services in Iran
Ministry of Health and Medical Education
• Fulfilling duty as the steward to develop a system monitoring quality of health services;
• Developing a serious intent to have a comprehensive plan about this issue;
• Facilitating the legislation of the related laws and strengthening the issue in coordination with other beneficiaries in legislative institutions;
• Strengthening the bargaining power to attract necessary resources and effective cooperation of other institutions;
• More serious involvement in programs related to changes in behavior of society, service providers and policy makers concerning quality of health services;
• Planning to estimate and provide different resources to improve the quality of services, including information sources;
• Using indices of quality of services as one of resource allocation criteria among universities;
• More serious planning to get involved in producing evidence-based guidelines;
• Highlighting quality through holding national meetings to exchange experiences;
• Precise examination of selecting quality promotion models used in health sector.
Insuring organizations
• Reviewing the role of basic insurance organizations in purchasing services and service quality requirements;
• Facilitating patient compensation insurance;
• Coherent cooperation with determined institutions in communicated

112112
policies to determine various requirements of quality of services;
• Facilitating relevant legislation and reinforcing the coordination with the Ministry of Health and other institutions involved in the legislative bodies;
• Facilitating legislation of relevant rules and strengthening the issue in association with Ministry of Health and other legislative institutions;
• Defining the basic and complementary benefit package in association with Ministry of Health and Medical Education ;
• Formulating necessary guidelines to purchase quality of services and facilitating its implementation ;
• More serious involvement in programs related to society behavior change, service providers and policy makers concerning quality of health services.
Legislative bodies
• Highlighting quality of health services in legislations;
• Using the information related to the quality of health services in proposing issues for legislation.
Medical Science Universities
• Facilitating the collection of information related to the quality of services in the covered area;
• Allocating special sessions to discuss the quality of different covered services
• Using quality of services indices as one of resource allocation criteria in covered centers;
• Supervising the quality and quantity of training courses related to the quality at university level;
• Using the experiences of other universities and service providers concerning service quality improvement;
• Encouraging quality improvement efforts at university levels in the relevant events.
National Academic Boards
• Considering service quality requirements when reviewing curriculums;
• Defining new courses proportional to the increasing needs of society concerning quality of health services.

113
Media
• Increasing sensitivity of policy makers and decision makers with regard to the importance of quality of health services;
• Informing society of conditions of quality of services;
• Increasing reasonable expectations in the society to improve quality of services.

114114
References:
1. Pradhan M, Saadah F, Sparrow R. Did the health card program ensure access to medical care for the poor during Indonesia’s economic crisis? The World Bank Economic Review. 2007; 21 (1): 125-50.
2. Boerma T, Eozenou P, Evans D, Evans T, Kieny M-P, Wagstaff A. Monitoring progress towards universal health coverage at country and global levels. PLoS Medicine 2014; 11 (9): e1001731.
3. USAID. Measuring and monitoring country progress towards universal health coverage : concepts, indicators, and experiences. Meeting Summaary- July 20, 2012,Washington DC.
4. Chan M. Remarks at the Launch of the World Health Report 2013: Research for Universal Health Coverage. Beijing; 2013. Available from: http://www.who.int/dg/speeches/2013/whr_20130815/en/.
5. Mate KS, Rooney AL, Supachutikul A, Gyani G. Accreditation as a path to achieving universal quality health coverage. Globalization and Health 2014; 10 (1): 68.
6. World Health Organization. Measurement of trends and equity in coverage of health interventions in the context of universal health coverage. Meeting Report, Rockefeller Foundation Center, Bellagio; 2012.
7. Buttell P, Hendler R, Daley J. Quality in healthcare: concepts and practice. The Business of Healthcare 2008; 3: 61-94.
8. America IoMCoQoHCi. Crossing the quality chasm: A new health system for the 21st century: National Academy Press; 2001.
9. World Health Organization. Quality of care: a process for making strategic choices in health systems; 2006.
10. McQuestion MJ. Presentation: Quality of Care. Johns Hopkins Bloomberg School of Public Health; 2006.
11. Martin M, Zingg W, Hansen S, Gastmeier P, Wu A, Pittet D, et al. Public reporting of healthcare-associated infection data in Europe. What are the views of infection prevention opinion leaders? Journal of Hospital Infection 2013; 83 (2): 94-8.
12. Perla RJ, Peden CJ, Goldmann D, Lloyd R. Health care-associated infection reporting: the need for ongoing reliability and validity assessment. American Journal of Infection Control 2009; 37 (8): 615-8.
13. Masoumi Asl H. Country guide for hospital infection survilance. Tehran: Ministry of Health and Medical Education, Disease Management Center; 2006.
14. Rasslan O, Heeg P. Infection prevention and control program organizational structure. Basic concepts in infection control; 2007.
15. OECD. OECD Reviews of Health Care Quality: Turkey 2014: Raising Standards. Paris.

115
16. Barnett A, Segree W, Matthews A. The roles and responsibilities of physicians in Pre-hospital Emergency Medical Services: a Caribbean perspective. West Indian Medical Journal 2006; 55 (1): 52-5.
17. Motlagh ME, Chinian M, Dashti M, Moslemi Aghili MM, Aminaee T, Ardalan G, et al. Health Promoting School (HPS). Ghom: Khademolreza; 2010.
18. Dehnavieh R, Ebrahimipour H, Nouri Hekmat S, Taghavi A, Jafari Sirizi M, Mehrolhassani MH. EFQM-based Self-assessment of Quality Management in Hospitals Affiliated to Kerman University of Medical Sciences. International Journal of Hospital Research 2012; 1 (1): 57-64.
19. Naghavi M, Jamshidi HR. Utilization of health services in Iran:2002. Health Deputy of Ministry of Health and Medical Education. Tehran: Tandis; 2005.
20. Mohammad K, Khosravi A, Noori M, Gouya MM, Etemad K, Nadafi K. Public health profile indicators in the Islamic Republi of Iran 2006-2010. Ministry of Health and Medical Education Deputy for Public Health; 2013.
21. Rashidian R. Health observatory: First multiple-indicator demographic and health surveys 2010. Ministry of Health and Medical Education Deputy for Public Health; 2011.
22. Abolhassani F, Jamshid Beigi A, Mard Fard N, Moghimi D, Maleki F. Study of providing outpatient and rehabilitation health care and characterization of the structure and geographical distribution of providers. Tehran: Tandis; 2010.
23. Center fo family physician and referal system. Performance report of Iranian health insurance organization. Volume 1. Tehran: Iranian Health Insurance Organization; 2015.
24. Center for family physician and referal system. Performance report of Iranian health insurance organization: Volume 2. Tehran: Iranian Health Insurance Organization; 2015.
25. Center fo family physician and referal system. Performance report of Iranian health insurance organization: Volume 3. Tehran: Iranian Health Insurance Organization; 2015.
26. Taati Keley E, Meshkini A, Khorasani Zavareh D. Distribution of Specialists in Public Hospitals of Iran. Health Information Management 2012; 9 (4): 548-557.
27. Abolfathi L. Breif policy of Iranian provinces. Characteristics report. Tehran: Center for Strategic Research of the State Expediency Council; 2007.
28. Cutler D. Policy initiatives to improve the quality of healthcare under universal health coverage in low-and middle-income countries: the case of Thailand: Birkbeck, University of London; 2012.
29. Groene O, Skau JK, Frølich A. An international review of projects on hospital performance assessment. International Journal for Quality in Health Care 2008; 20 (3): 162-71.
30. Robinson JC. Theory and practice in the design of physician payment incentives. Milbank Quarterly 2001; 79 (2): 149-77.
31. OECD. OECD Reviews of Health Care Quality: Korea 2012: Raising Standards. Paris: 2012.

116116
32. OECD. OECD Reviews of Health Care Quality: Denmark 2013: Raising Standards. Paris: 2013.
33. Hurst J, Kelley E. Health Care Quality Indicators Project-Conceptual Framework Paper. Retrieved Marz 2006; 30: 2006.

117
118118
Chapter 5
Household Financial Protection in the Health SystemDr Zahra Kavousi
Dr Peivand Bastani
Azimeh Ghorbanian
Elham Elahi

119
AbstractOne of the main aspects of universal health coverage is financial protection which means how much people are protected against financial consequences of the disease. In this chapter, we will briefly examine theoretical frameworks of financial protection, health financing and related indices. Then, the status of Iran will be reviewed using reports and papers based on indices related to the financing and emphasizing health catastrophic expenditures, impoverishment due to health expenses and fair financial contribution index. Finally, this issue will be examined in the higher level documents, relying on experiences of some selected countries, some solutions will be proposed for Iran.
What is obvious is that financial protection against the costs of health care has been taken into account in Iran’s major programs such as the fourth and the fifth development plan, the important point here is how to implement these programs. Research evidence suggested that Iran was not successful in achieving the goal of the Fourth Development Plan in order to reduce the direct out-of-pocket payments (OOP) and catastrophic health expenditures. Thus, the Fifth Development Plan has also focused on this goal by providing administrative guidelines.
In addition, to attempts to increase resources in the health sector, some actions must be taken to improve pooling functions through reforming Iran’s insurance policy and shifting direct payments to prepayments.

120120
Introduction:
All people are willing to receive affordable and high quality health care. In recent years, this willingness has resulted in the Universal Health Coverage (UHC) movement. Although, roots of this movement date back to the primary healthcare (PHC) movement, World Health Forum (2005) has directly asked governments of all countries to expand their healthcare system in a way that people can have access to health services without experiencing financial problems and difficulties. As seen in this request, the UHC movement was established to focus on financial protection against the costs of illness, therefore, one of the key aspects of the proposed models of UHC which aims to guarantee all people’s access to effective and necessary health services is that having access to services for illnesses or injuries should not cause financial hardship for people (1). In its official report on the performance of health systems in 2000, The World Health Organization (WHO) stated that protecting families against the costs of illnesses and the concept “fair financing” were one of the main objectives of health systems (2).
The need for financial protection of households is due to three main factors: First, there is no certainty about the time and severity of an illness or injury, unpredictable health and treatment needs are a cost-opportunity because financial resources that were supposed to be spent on food or clothing are spent on health. Second, health and treatment (whether relatively or completely) can be very expensive, even inexpensive health services may also be catastrophic for the poor. In such cases, people may forgo the services or may pay the service fees and accept the risk of poverty. The third factor is that an illness or injury can be associated with a lower income which, in turn, increases the risk of poverty (3).
International studies have shown that financial protection in the health system is achieved by sharing the financial risk of illness among different groups of people (risk sharing) and distribution of risk over time (prepayment) (4). Pooling and prepayments lead to decreased financial results of uncertain health needs, elimination of financial barriers to health services and decreased financial hardships related to diseases (1).
Although, the pooling and prepayment in the health system have significant impact on the depth of UHC (a portion of the cost of benefits or services that are covered by pooled funds), it affects the breadth of UHC (comprehensiveness of health benefits) and the scope (the area of the covered benefits) (3).
Financial protection can play an important role in two political goals, i.e. Efficiency and Justice. Concerning efficiency, financial protection can result in people’s well-being, health system and macroeconomics. Moreover, adequate financial protection causes all people, even the poor, to use services easily without any financial problems; it leads to an increase in equity (3).
In different countries, policy makers use different tools through which they can

121
affect the depth of UHC or financial protection in the health system. In fact, financing performance of the health system will strongly affect the UHC. All health systems collect, manage and allocate resources. In order to achieve the health goals more effectively, sufficient resources must be generated, risks must be pooled effectively and resources must be allocated to services that use health costs more efficiently (5).
A proper system of health financing helps improve health status by providing adequate resources. Furthermore, financing affects the health status by correcting the incentives that the payers and recipients are faced with in relation to the provision and use of resources. Health financing system also affects a range of social goals rather than improving health status. This includes solidarity (fairness in payment for health services related to people’s income), financial protection (people’s right to the health system that should protect them against the costs of illnesses) and accountability (appropriate use of resources).
However, the financing of health systems has a strong influence on fairness in household financial contribution in the health system and on health outcomes and accountability through collecting, pooling and purchasing. During changes in the financing system, current funding mechanisms and social institutions that have historically been formed as well as people’s beliefs and expectations about paying for health services must be considered (6).
Who pays the costs of the health system? What is the role of families in providing health costs? The answer shows, on the one hand, the fairness of health system financing and the attainment of the fairness goal in financial contribution (2) and, on the other hand, specifies the level of households’ financial protection i.e. the depth of universal coverage cube. Results of household financial contribution in the health system can be analyzed by two approaches: the income approach and the financial burden approach. In the income approach, changes in income distribution are evaluated in terms of financial payments for the health system based on the changes in the number of households who are below the poverty line due to health payments and also on the changes in the distribution of income among households. In the second approach, health payments are examined concerning their effects or their distressing experiences on households. Calculating index of fairness in financial contribution and percentage of households exposed to catastrophic expenditures are examples of this approach (Table 5.1) (7).
Fair financial contribution index is in fact originated from the fairness goal in financial contribution in the health system. Household financial contribution in the health system includes each household’s payment for the health system to the payment capacity of that household, all households, with an equal proportion, pay for the health system. Financial contribution of all households will equal total health costs of a country to total payment capacity of that country. Fairness in financial contribution is used to measure the deviation from this equal situation.

122122
This index ranges from zero to one, one represents complete equality and the best condition and zero represents complete inequality (7).
Catastrophic health expenditures occur for the households when payments for receiving health services go beyond a certain limit of the family’s financial resources. The WHO has mentioned that this limit is 40% of the household’s payment ability. That is, if a household spends more than 40% of its payment ability on health, it faces catastrophic health expenditures (4).
Percentage of households who have become poor due to the health costs represents the number of households that have fallen below the poverty line due to paying for health costs (7).
Table 5.1 Main indices of measuring household financial contribution in the health system
Most studies examined the effect of interventions and UHC on the financial protection have investigated financial protection indices, the most important of which are the effects of direct OOP, catastrophic expenditures and poverty resulted from payment in the health system (8).
Health Financing Conditions in Iran
According to the statistical report of the WHO in 2014, the share of health sector of Gross Domestic Product (GDP) did not change in Iran from 2001 to 2011, although the government’s share increased to some extent, still more than 50% of the health costs were provided by private expenses. Of this amount, 96.2%
ThresholdComplete distributionApproach
Changes in the number of households falling below the poverty line due to health systempayments
Changes in income distribution due to health system payments(redistributive effect)
Income
Households above the threshold or burden due to health system payments (percentage of households facing catastrophicexpenditures)
Distribution or burden due to health system payments (fair financialcontribution index)
Financialburden

123
and 95.8% were respectively paid from people’s pocket (Table 2) (9).
Table 5.2 Statistics of health cost indices
Health cost indicesValue in year
2000
Value in year
2011Total health expenditures as percent of GDP 4.6 4.6
Total governmental expenses in health sector as percent of total health expenses 41.6 49.5
Private expenses in health sector as percent of total health expenses 58.4 50.5
General governmental expenses in health sector as percent of total government expenses 10.6 10.5
External resources for health as percent of total health costs
Social security expenses on health as % of general government expenses on health
57.850.2
Expenses of direct OOP expenses as % of private health costs 96.2 95.8
Private prepayment plans as % of private health costs 3.6 3.9
Costs of health per capita based on the exchange rate (US$) 231 326
Costs of health per capita (Purchasing Power Parity, international dollar) 379 874
Per capita of governmental expenses on health based on an average exchange rate (US$) 96 161
Per capita of governmental expenses on health (Purchasing Power Parity, international dollar) 158 432
Also, according to the latest report of national health accounts in 2008, only about 20% of health care resources were provided from the pre-paid resources and people still played a significant role in the health financing. According to the National Health Accounts (NHA), people’s direct payment was about one third in 1971 and increased by two third in 1998. Moreover, according to the NHA (2008), direct OOP for health services increased from 46.2% in 2004 to 53.7% in 2008 (10).
In recent years, some studies have examined the amount of direct OOP in Iran. In a survey conducted in Qazvin in 2009, the average direct OOP was 59.7% for receiving treatment services, the highest amount was related to the first decile (lowest incomes) (67.5%). Moreover, the average total direct OOP was 7.3% to the average total household income. The highest OOP was related to the first decile (19%), while the lowest amount was related to the tenth decile (6.3%). In other words, the average direct OOP decreased from the first decile to the tenth decile,

124124
the average share of OOP in the first decile was ten times more than that in the tenth decile (11). According to a survey conducted in Gorgan in 2002, the share of direct OOP was 13% to total household income. However, the first income decile that had the lowest income had the highest out-of-pocket payment, that is, they spent 28% of their income on direct health payments. However, it was 7% in the tenth decile that had the highest income (12).
High direct OOP in Iran is one side of the problem, the other side of it is that which income group pays most of these payments. A well-known indicator to assess equity in household payments for health services is Kakwani Index. It shows how is the share of payment for health services to income in different income groups. This index ranges from -2 to 1. Positive score reflects the progressive or increasing nature of the payments, that is, the rich spend a higher portion on health costs. Negative index indicates the regressive or decreasing nature of the payments. It means that the poor spend a higher portion on health costs.
A study conducted by Iran statistical center on household incomes and expenses showed that Kakwani index was positive for all years from 1984 to 2010 (average 0.34 in cities and 0.47 in villages) (13). Similarly, results of other studies conducted between 1995 and 2005 revealed progressive or increasing nature of direct OOP based on Kakwani index using household expenditure or, at the same time, regressive nature of this index according to incomes reported by people (14). As Zare pointed out (quoted from Deaton), household expenditure was a reliable indicator of household income (13). Thus, results of household expenditure can be more valid.
In addition to producing resources for health, pooling funds is very important too. The system of pooling funds in Iran health system is incoherent; the public sector has four main insurance funds, namely social security insurance, health insurance, armed forces insurance and Emam Khomeni charity. However, banks, Oil Company and some other organizations have their own individual funds. WHO has pointed out that establishing various insurance funds is one of the indicators of failure in organizing insurance (2). Diverse risk pooling increases administrative costs and causes duplication in service and insurance coverage. Moreover, a great number of funds decrease the ability of insurance to use power levers in strategic purchases because a large number of purchasers who are competing with each other decrease the providers’ incentives to improve quality and performance.
Status of Household Financial Contribution Indicators in Iran
If we want to answer the question “who pays health expenses in Iran?”, we must take a look at statistics related to direct OOP, health catastrophic expenditure and

125
poverty caused by health. Moreover, if we want to know how payment burden of these expenditures is distributed in Iran, we must consider fair financial contribution index. What these indicators show is a picture of level and intensity of troubles that people experience financially due to health expenditures, groups of people who have more financial problems and the type of services that cause most problems. These pictures help formulate appropriate policy responses (3). Although, each of these indicators has some limitations mentioned by critics, if the mentioned indicators are presented with studies on services utilization and financial barriers studies (3), they will provide a better description of Iran financing status for policy makers.
As discussed in the section related to Iran’s status, statistics on direct out of pocket payment in Iran represented large contribution of people in paying for health. But the most important thing is the impact of these payments on people’s lives and well-being. Several studies have been conducted in Iran on the catastrophic health expenditures (Table 5.3). Results of 12 household surveys whose data was collected by referring to all households indicated a high percentage of these payments in the range of 6% to 24% (15, 19, 21, 24, 25, 27-33), while the results of Iran Statistical Center showed that it was between 2% and 4% in different years and different areas (16-18, 20, 22, 23, 26). Owing to high direct OOP, high catastrophic expenditures is obvious unless households have such high levels of welfare or ability that direct OOP for them is less than 40% of their payment ability. There is another warning to the policymakers (that is, these statistics are related to people who have used health services and those people who have forgone using health services due to their poor financial conditions belong to those groups that have lower health expenditures).
Some national studies have focused on the factors affecting the occurrence of catastrophic health expenditures. Most of these studies have proposed the hypothesis of the effect of the variables “household characteristics”, including household aspect, presence of elderly people or children in the household, region of residence, sex of the household breadwinner on the incidence of catastrophic expenditures (17, 19, 24). However, what policymakers must pay attention to is that household characteristics should not be a factor affecting high health expenditures. The financial protection against disease expenses must act in a way that families can, regardless of their needs or payment abilities, use health services easily. Obviously, presence of elderly people in the household increases the family need for health services, but this increase should not lead to catastrophic expenditures. The political point of these analyses is that such families are vulnerable, so more attention should be paid to the provision of supportive packages for them.
Studies have shown that the type of services also affects the occurrence of catastrophic health expenditures. Hospitalization and utilizing dental services

126126
increase the risk of catastrophic expenditures (19, 24, 29). In Shiraz, for example, using dental services has increased the risk of catastrophic expenditures up to seven times (29). In Qazvin, 16% of dental service consumers have faced catastrophic expenditures (25). In addition, making use of private sector services increases direct OOP and catastrophic expenditures. However, people covered by the social security organization face less catastrophic expenditures (34). Since the MOH has paid attention to allocate some budgets to governmental hospitals in Health Transformation Plan(HTP) and to decrease copayments to 5% and 10%, the possibility of facing such expenditures due to hospitalization in the governmental hospitals decreases. The point here is that private hospitals play a significant role here, as NHA showed in 2008, the private sector with the capacity of about 27.2% of the capacity of public hospital beds, had about 42.3% of total inpatient care expenditure (10). It means that if the government wants to reduce health costs, it is essential to make its supervisory systems more accurate and more transparent. Another key question is “why is the role of the private providers very significant here?” The answer to this question may be found in the quality of services in public and private hospitals or the presence of many well-known professionals in the private sector.
The impact of insurance status on exposure to catastrophic expenditures has been different in various national studies. In some studies, having insurance has been an effective factor in reducing these costs (19, 22, 29, 34), while it has had no or little effect according to other studies (24, 30- 32). Insurance is one of the interventions and reforms proposed to reduce direct OOP and catastrophic expenditures. Results of national studies show partial efficiency of insurance in Iran, it may be due to the huge cost and service gap of health insurance. An increase in population coverage, regardless of cost sharing as well as services, cannot guarantee a decrease in expenses. Regardless of the relative inefficiency of insurance, national studies show that the prepayments were regressive in Iran between 1995 and 2005. In other words, people with lower incomes allocate a greater share of their resources to the prepayments. It is important to note that when an insurance plan is implemented, its impacts must be taken into account concerning justice and equity. Implementation of an urban inpatient insurance plan for uninsured families in the cities in 2000 had a regressive effect on the Kakwani index of direct OOP. In other words, it seems that wealthier households have used the governmental subsidies and this project has increased inequality (14).
In almost all studies, the economic situation of households had a significant effect on experiencing catastrophic expenditures (19, 22, 29). Several studies have shown that the concentration index of facing catastrophic expenditures is negative (19, 34), it represents its focus on lower-income households. It highlights the necessity of inter-sectoral activities to increase the well-being of households and to increase their ability to pay; it also highlights the necessity of

127
paying attention to the payment exemption approach for services in low-income groups.
Table 5.4 shows the statistics related to the poverty resulted from the use of health services. It ranges from 1.5% to 11% in different years (16-18, 26, 27, 31, 35). Concerning impoverishing health expenditure, the range of survey results is not significantly different from the results of data analysis by Iran Statistical Center. However, few specific surveys have been conducted in Iran on estimation of poverty-making of health expenditure. According to the existing research, it can be concluded that health costs cause a great number of people to become poor. It has been shown in a study that payments for health services increase the population below the poverty line by 13% (17). When households are forced to sell their assets and borrow money from friends and acquaintances to pay for their treatment expenses, it is hard for them to get out of this situation. However, households belonging to low economic quintiles are more sensitive to the health expenses due to their low payment ability; they may sometimes get poor without facing catastrophic expenditures. On the other hand, fair financial contribution index of health expenses among Iranian households has reached 0.83 in the best case and 0.57 in local studies (16-18, 20, 21, 26, 29). Both are not close to one and show inequality in health financing contribution (Table 5.5.). In other words, the difference between this index and one indicates that households did not have equal financial contribution in relation to their payment capacity to the health system. However, this index is close to one in the developed countries.

128128
Table 5.3 studies related to health catastrophic expenditure in Iran
Ref.No.
% of health catastrophicexpenditures
Data sources StudyyearPlace Sample
sizeAuthors
1515.31 World HealthSurvey2001Iran10300Soufi et al
160.83 Iran StatisticsCenter
2010-1984Iran30000Raghfar et al
173.9 Iran StatisticsCenter2002Iran32000 Alizade &
Fazaeli
182.3 Iran StatisticsCenter2002Iran-Razavi et al
1912.6 Householdsurvey2003 Tehran,
Dist. 17579Kavosi et al
201.52 Iran StatisticsCenter20043-07Iran31283Mehrara et al
1911.8 Householdsurvey2008 Tehran,
Dist. 17592Kavosi et al
2122.2 Householdsurvey2008Kermanshah189 Danesh
Kohan et al
222.8 Iran StatisticsCenter2008Iran39088Nekouie et al
234.1 Iran StatisticsCenter2007Kerman1480Nekouie et al
248.3 Householdsurvey2011Yazd400Ameri et al
2524 Householdsurvey2011 Mino Town,
Qazvin100Asefzade et al
263.38 Iran StatisticsCenter2011Iran36071Yousefi et al
2713.3 Householdsurvey2011Tehran1600 Vaez Mahdavi
et al
2811.3 Householdsurvey2011Tehran34700 Sabermahani
et al
2914.2 Householdsurvey2012Shiraz800Kavosi et al
306.77 Householdsurvey2012 Torbat
Heydariye384Ameri et al
316.54 Householdsurvey2013Tehran2200 Rezapour et
al
327.2 Householdsurvey2014Tehran792Ghafouri et al
3324 Householdsurvey2014Ferdos100 Ghodoosi
Nejad et al

129
Table 5.4 studies related to poverty caused by health in Iran
Am
ount (percent)D
ata sourcesStudy year
Place Sam
ple sizeA
uthors
5.4-1.4Iran Statistical Center
2010-1984
Iran30000
Raghfar et al
2Iran Statistical Center
1994-2002
Iran-
Razavi et al
11.5%2%
- of families below
the poverty line
Iran Statistical Center 2002
Iran32000
Alizade and Fazayeli
1.52Iran Statistical Center
2011Iran
36071Yousefi et al
4.83H
ousehold survey2013
Tehran2200
Rezapour et al
4.7H
ousehold survey2011
Tehran-
Vaez Mahdavi et al
10.2
5.5H
ousehold survey2003
2007
Region 17, Tehran
579
592Kavosi et al

130130
table 5. 5 Studies related to fairness in financial contribution
Fairness in financial contributionData resource
Study yearPlace
Sample
sizeAuthors
0.750.83 –Iran Statistical Center
2010-1984Iran
30000Raghfar et al
0.83Iran Statistical Center
1994-2002Iran
-Razavi et al
0.81Iran Statistical Center
2002Iran
32000Alizade and Fazayeli
0.63Iran Statistical Center
2011Iran
36071Yousefi et al
0.57Household survey
2008Kerm
anshah189
Daneshkohan et al
0.83Iran Statistical Center
2003-2007Iran
31283M
ehrara et al
0.6Household survey
2012Shiraz
800Kavosi et al

131
Financial Protection in Higher Level Documents
Since it can be said that the main element of health financing in Iran is high direct out of pocket payments, a reduction in direct out of pocket payments for health services has always been one of the most important priorities in health in Iran, it has been mentioned in Article 90 of the Fourth Development Plan (1997-2011), that “to provide equitable access to health-treatment services and to reduce the share of low-income and vulnerable households in paying the expenses, resources and facilities must be distributed in a way that people’ fair financial contribution index increases by 90% and people’s annual direct out of pocket payment decreases by 30%”. It has also been mentioned in this article that the proportion of households facing catastrophic expenditure must be reduced to less than 1% (36). This issue has also been repeated in paragraph B of Article 34 of the Fifth Development Plan (2011-2015). This paragraph has stated that to achieve health equity index, the share of people’s direct expenses for health services must be up to 30 percent (37). In addition, the Fifth Development Plan suggested some strategies to achieve this goal. For example, paragraph B of Article 34 stated that: “In order to achieve health equity index, people’s direct costs have to decrease to 30% of health expenditure, people’s fair access to public health services, financing treatment catastrophic expenditure, drug coverage, curing special and refractory patients, reducing dependence of the flow of affairs in health and treatment units on specific income and training, supplying and providing necessary skilled manpower, ten percent of total net funds resulted from implementing the targeted subsidy plan must be added to the health system.” Government is required to estimate the mentioned credits for every year and consider them in a special part of the budget bill of Ministry of Health, Treatment and Medical Education so as to be used for the above-mentioned cases. Paragraph (b) of Article 37 has stated that in order to protect families against disease and injury expenses, to provide a part of necessary resources to deliver therapeutic and diagnostic services for victims of traffic accidents, 10% of the third-party and passenger insurance fee must be taken from commercial insurance organizations and must be directly deposited to a dedicated revenue account through a separate voucher in the name of the Ministry of Health, Treatment and Medical Education. Moreover, article 38 focused on qualitative and quantitative development of health insurance in different ways such reforming structures of funds, managing resources, rationalizing tariffs, using internal resources of funds and, if necessary, using governmental funds. Paragraph A of this article focused on compulsory and public insurance and paragraph B focused on establishing “Iran Health Insurance” (37).
Moreover, the Health Evolution Plan has focused on people direct out of pocket payment, of six programs of this plan; two are directly related to this

132132
issue. These two programs are: “the program of reducing payment levels of patients hospitalized in hospitals affiliated to the Ministry of Health and Medical Education” and “the program of financial protection of special, needy and refractory patients” (38).
The overall goal of the program is to protect people, especially vulnerable citizens against health expenses, to reduce direct OOP to 10% in public hospitals and avoid referring patients to procure medicine, medical equipment and therapeutic and diagnostic services outside the hospital. The program of financial protection of special, needy and refractory patients has been proposed to protect needy patients against high treatment expenses through copayment coverage and necessary insurance expense gap such as diagnostic, therapeutic and pharmaceutical actions, provide supplies for patients with specific diseases such as thalassemia, hemophilia, multiple sclerosis, dialysis, cancer, kidney transplant, cochlear implant, psychiatric disorders, organ transplantation, refractory epilepsy and some other chronic and refractory diseases, as well as to support hospitalized patients with non-special diseases with regard to special groups such as orphans and female-headed households (38).
Lessons Learned from other Countries:
In moving towards UHC, different countries have implemented various interventions and reforms concerning financial protection. It is worth noting that the developed countries with high incomes have the lowest levels of direct OOP compared with low- income, middle- income and middle-to-high-income countries (9). Some of these countries are United Kingdom and Germany that have considered and implemented these reforms before the formation of financing systems. In this section, financing of United Kingdom and Germany health system is reviewed and then, experiences of Turkey, Thailand, Mexico, South Korea and China are presented (Table 6).
United Kingdom:
The National Health Service in United Kingdom was established in 1948 with the aim of providing free health services to all England citizens. Financing system of English National Health Service System is based on taxation. In 2011, 9% of national GDP per capita was allocated to the health system, 82% of it was governmental expenditure (9).
Germany:
Financing system in Germany is based on evolutions and changes occurred in the late 19th century, during which insurance funds were formed by order of Bismarck. These funds are the basis of German health social insurance system.

133
The insurance fee is paid by people progressively and direct OOP is restricted to purchasing non-prescribed drugs and some medical equipment (e.g., costs of medical glasses are paid by the insurance, but if someone wants to have glasses with higher quality, he must pay the difference) (39). In Germany, more than 80 percent of governmental expenditures in the health sector are provided through health social insurance fees (9).
Turkey:
Proportion of households facing catastrophic health expenditures and the poverty caused by health expenditures in Turkey is 0.6% and 0.4% respectively. To achieve the UHC, Turkish health system has focused on the elimination of non-integrity and the proliferation of access to health insurance and health services. Prior to 2003, most (60% to 70%) health financing was provided from the public sources and the rest came from private insurance and direct OOP. Turkey has started the Health Transformation Program since 2003 in order to fix problems such as direct OOP estimated up to 50% and inefficiency in using health care resources. Its goal was to organize and provide resources and to provide health services in an effective, productive and fair manner.
Before 2006, 70% of Turkish was covered by five different insurance plans in terms of packages of benefits and rules. The first plan was the social security organization which received insurance fee based on the salary and covered the highest number of people. The second one was the Government Employee Pension Fund which worked based on the active participation of public employees. The third program was the government employee insurance which was funded by the state budget. Bag-kur was another public program which covered self-employed or those who had not been covered by the above plans. Finally, there was the green-card program which covered people below a certain income level and was funded by state budgets.
In all of the above insurance plans, except for the green card, people had a kind of contribution in payment. MOH had determined some levels of payment for all health facilities. For example, people insured by the social security plan had to pay 20% of their outpatient services, but paid nothing for inpatient services. Private insurance was different, but it was mostly 20% for outpatient services. Almost one third of the population had no insurance coverage and had to pay for the services. In 2006, 19.3% of health costs were paid directly out of pocket. Therefore, several reforms were made to coordinate insurance benefits in this country. In 2005, in order to protect people in the green card plan, they were provided with access to outpatient and pharmaceutical services, thus, they enjoyed the benefits that other plans had.
In 2005, people insured by the social security plan had access to all governmental hospitals and pharmacies. In 2006, the list covered medicines became alike within
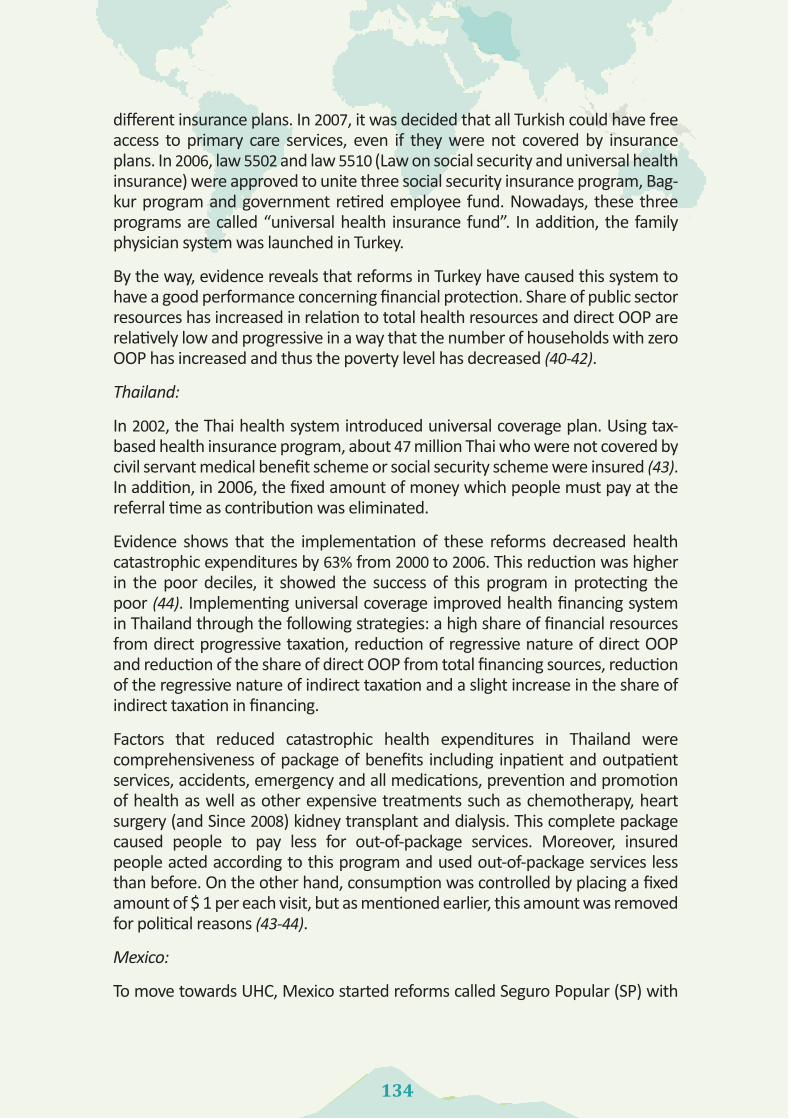
134134
different insurance plans. In 2007, it was decided that all Turkish could have free access to primary care services, even if they were not covered by insurance plans. In 2006, law 5502 and law 5510 (Law on social security and universal health insurance) were approved to unite three social security insurance program, Bag-kur program and government retired employee fund. Nowadays, these three programs are called “universal health insurance fund”. In addition, the family physician system was launched in Turkey.
By the way, evidence reveals that reforms in Turkey have caused this system to have a good performance concerning financial protection. Share of public sector resources has increased in relation to total health resources and direct OOP are relatively low and progressive in a way that the number of households with zero OOP has increased and thus the poverty level has decreased (40-42).
Thailand:
In 2002, the Thai health system introduced universal coverage plan. Using tax-based health insurance program, about 47 million Thai who were not covered by civil servant medical benefit scheme or social security scheme were insured (43). In addition, in 2006, the fixed amount of money which people must pay at the referral time as contribution was eliminated.
Evidence shows that the implementation of these reforms decreased health catastrophic expenditures by 63% from 2000 to 2006. This reduction was higher in the poor deciles, it showed the success of this program in protecting the poor (44). Implementing universal coverage improved health financing system in Thailand through the following strategies: a high share of financial resources from direct progressive taxation, reduction of regressive nature of direct OOP and reduction of the share of direct OOP from total financing sources, reduction of the regressive nature of indirect taxation and a slight increase in the share of indirect taxation in financing.
Factors that reduced catastrophic health expenditures in Thailand were comprehensiveness of package of benefits including inpatient and outpatient services, accidents, emergency and all medications, prevention and promotion of health as well as other expensive treatments such as chemotherapy, heart surgery (and Since 2008) kidney transplant and dialysis. This complete package caused people to pay less for out-of-package services. Moreover, insured people acted according to this program and used out-of-package services less than before. On the other hand, consumption was controlled by placing a fixed amount of $ 1 per each visit, but as mentioned earlier, this amount was removed for political reasons (43-44).
Mexico:
To move towards UHC, Mexico started reforms called Seguro Popular (SP) with

135
the aim of protecting people with no insurance coverage against high health expenditures in 2003. Prior to 2001, health insurance coverage in Mexico belonged only to formal sector employees. This insurance included the Mexican Social Security Institute, The Institute for Social Security and Services for State Workers and the special insurance plan for employees of the Ministry of Petroleum and the Ministry of Defense.
People working in the informal economy sector and self-employed people must either use facilities sponsored by the MOH or must pay directly out of pocket. The evidence indicated households’ high direct payment for health, especially among rural households, the poor, the elderly and even for prenatal care. The highest catastrophic expenditures were related to outpatient care and medication. Thus, evidence from huge direct OOP and catastrophic health expenditure caused the country to implement the social protection system in the health sector. The main purpose of this system was financial coverage and access to health services for poor families. However, families were free to choose it. By the end of 2005, thirty-two provinces of Mexico participated in this program and nearly four million households (12 million people) enrolled in this voluntary program.
In this program, 250 diseases and the related medicines were covered. This insurance program was funded by the federal and state government. However, households had a financial contribution according to their payment abilities. Households who belonged to the first two income deciles were exempted from payment but the remaining households, depending on their income deciles, must pay from 50 to 770 dollars each year. In order to determine the household’s income status, a questionnaire completed by the head of household at the time of enrollment was used. During 2006 and 2007, only 0.6% of the project resources were funded by the households and the rest were funded by the government. Almost 90% of the governmental resources were allocated to the provision of covered services. 8% of the resources were used to cover diseases with high expenditures and 3% were used to supply health infrastructures and unplanned health care services. Results of a survey conducted in 2006 to evaluate the effect of these reforms showed that 6.64% of households who registered in this plan faced catastrophic expenditures, while it was 95.39% among those who were not insured. Results of another survey showed that 4.7% percent of insured households and 6.67% of uninsured households spent more than 30% of their payment ability on health. Concerning direct OOP, a survey which had investigated the effect of SP showed that people covered by this program spent significantly lower amounts of money on health than the uninsured ones. Generally, the evidence suggested that insurance interventions and programs for the poor families had a significant role in promoting financial coverage in Mexico (45-46).
South Korea:
Evidence suggested that percent of catastrophic expenditures in South Korea in

136136
2005 was 2% in urban areas and 3% in rural areas (47). South Korea is known as a “leading example” of achieving the UHC in a short period of time. In 1976, Korea proposed a policy through which Korea must achieve the UHC by 1989.
Korea’s health insurance program started in 1963 with voluntary insurance and reimbursement for employees. After two years, better distribution of risk was impossible with six thousand insurers and high administrative costs, thus, health insurance law was amended. In 1977, the period of compulsory insurance started in South Korea for companies with more than 500 employees. It was expanded to companies with 300, 100 and even 16 employees in 1979, 1981, 1983 and 1988. The last insurance developments were related to 1988 (for self-employed villagers) and 1989 (for self-employed city dwellers). Evidence suggested that Korea achieved the universal service coverage 26 years after the Insurance Act and 12 years after the communication of national health insurance.
Korea developed its national health insurance program in a period of high and stable economic growth which injected higher incomes to the government, households and companies, thus, their ability to contribute to insurance programs increased. Industrialization increased the number of people working in formal sectors and encouraged urbanization. It made collection of contributions and development of compulsory membership possible.
In fact, insurance coverage was done in this country through gradual development of salaried employees, vulnerable populations (such as people with low incomes) and finally self-employed people. In addition, compulsory insurance program and economic growth of this country occurred simultaneously. The Korean government adopted a policy called “stop-loss” to prevent people from encountering severe financial losses caused by health expenditures (49-47).
China:
China as the world’s largest developing country has had significant challenges in providing fair, affordable and high quality health services over the past decade. Chinese health system has been criticized due to poor performance, low productivity, lack of adequate access to health services and increased costs. In 2008, the ratio of OOP to total health costs in this country was 40% (50). In a study by Lee (2008), the percentage of catastrophic healthcare expenditure in this country was 15% (varied from 9% to 24%) (51). In 2009, the Chinese government announced its goal to achieve UHC through medical-based social insurance by 2011.
China basic health insurance system includes several main insurance plans, namely Urban Employee Basic Medical Insurance System, New Rural Cooperative Medical System and Urban Resident Basic Medical Insurance System. Although, there are some private insurance organizations, they cover a small percentage of people with high incomes. Despite the insurance system in this country, direct

137
OOP is still high due to high copayments.
Decentralized risk pooling method with 7450 insurance funds is one of the reasons of insurance system failure to protect the insured people against financial risks. Optional selection of funds decreases the cross-subsidies from the rich to the poor. In addition, copayment level and different reimbursement methods are another reason of failure to protect people against the diseases (50, 51).
Table 5.6 Catastrophic health expenditures in selected countries
Country Study year Data sourcePercent of catastrophic expenditures
Reference
Turkey 2006 National household survey 0.6 40
Thailand
2000 National household survey 5.4
442002 National household survey 3.3
2004 National household survey 2.8
2006 National household survey 2
Mexico
2006 SP Impact Evaluation Survey 6.64
452006 SP Impact Evaluation Survey 9.39
2006 National Health and Nutrition Survey 4.71
2006 National Health and Nutrition Survey 6.67
Korea2009
Urban 2.1547
Rural 3.44
China 2008 Health and treatment benefit and cost survey 15.4 51
Germany 2003 Income and consumption survey 0.03 52
England 2003 Household expense survey 0.04 52
Recommended Strategies for Iran
Presenting different results of indices related to the financial protection in Iran, domestic studies highlight the necessity of presence of specific groups with suitable tools and methodological considerations to collect valid information

138138
in this regard. Surveys related to evaluating status of households’ financial contribution to the health system must be conducted annually so as to investigate the effect of implementing specific policies in Iran. Experiences of other countries show that insurance system is one of the success factors of successful countries such as Thailand or one of the failure factors of unsuccessful countries such as China in moving towards UHC. Therefore, moving towards reforming health insurance system is one of the first steps that should be taken in Iran. As evidence of national studies shows, the current insurance status is not successful in protecting households due to the service and expenditure gap. Existence of different insurance funds with different copayment and premium levels, and limited insurance package cause incompatibility in Iran’s insurance system. Although, cost sharing is necessary to control unnecessary use of services, a level of sharing must be considered for people that no financial burden is imposed on them. There are different ways for sharing the health service expenses in different insurance systems. In Iran, the method of “paying a proportion of service expenses at the time of using services” is used. However, other methods of sharing expenses can be considered here. Determining some amounts of annual payment by the insured person is one of the recommended methods, for example, if the annual amount of 15,000,000 Rials (fifteen million Rials) is considered for every person, services more than this amount will be paid by the insurance organizations.
Sometimes, in order to promote and facilitate enrollment in health insurance plans, the government must consider some subsidies for the specific groups such as low-income groups. The government can consider subsidies for prepayments, the percentage of direct OOP or combined payments, it can be called cost-sharing subsidy in the health systems. What is currently done by the government in the impatient sector is in fact a kind of cost-sharing subsidy for combined payment.
Moreover, social insurance especially employment-based social insurance cannot act properly in moving towards the UHC due to the vast informal economic system. Thus, tax-based financing seems essential in Iran. Reforming Iran’s tax system and considering earmarked taxes such as tobacco taxes are one of the essential steps in this regard.
Stability of financing sources of the health system is another challenge that government must take into account. Evidence reflects the growth of health costs in the future, so existence of stable resources is one of the main prerequisites of fair financing.
Presence of private providers in Iran’s health market and lack of proper supervision of tariffs in this sector are another reason for people’s high OOP. The MOH must act better in this regard. In addition, the structure of providing services must be reformed in Iran and private providers must join the health market according to certain preconditions and rules.

139
Some households may face catastrophic expenditure more due to some reasons such as payment inability. Therefore, it is essential that vulnerable groups and at risk groups be identified and supported in different ways such as payment exemption.
The reality that is obvious is that every change in policy and every new policy must be considered based on their short- or long-term effects and positive and negative consequences on financial protection of households in the health system. For example, although bed insurance policy, as mentioned earlier, was implemented to reduce direct OOP, it caused inequity in payments. Thus, financial protection against health service expenditures is achieved when the households do not encounter catastrophic expenditure, people contribute to the health system based on their payment capacity and the rich have more contribution.
Comprehensive review of studies on exposure to catastrophic health expenditures in Iran
In this systematic review, to find studies and papers related to the topic “household’s exposure to the health catastrophic expenditures”, studies were searched based on a protocol developed by the researchers. Accordingly, several major Persian and English databases were searched in November and December 2014. English studies were found in three Pubmed, Scopus and Science Direct databases and Persian studies were found in Scientific Information Database (SID), Iranian Research Center for Information Science and Technology (IRANDOC) and Magiran databases. After the related studies were found, references of these studies were also examined using appropriate keywords so as to identify more related studies.
Search strategy
The strategies used to search the relevant studies in non-Persian databases included various combinations of the keywords “Expenditure, Catastrophic, cost sharing, OOP, Household and Household Survey” along with the word “Iran”. These combinations were searched in the title, abstract, keywords or full text of the studies. In addition, the Boolean operators (OR and AND) were also used in the search process. In searching Persian databases, the keywords “justice”, “health”, “catastrophic”, “catastrophic expenditure”, “catastrophic costs”, “tragic costs” and “unbearable costs” were used.
Criteria for inclusion or exclusion of studies
In this systematic review, no time limit was considered and studies conducted in different years were selected. Moreover, different study types and formats
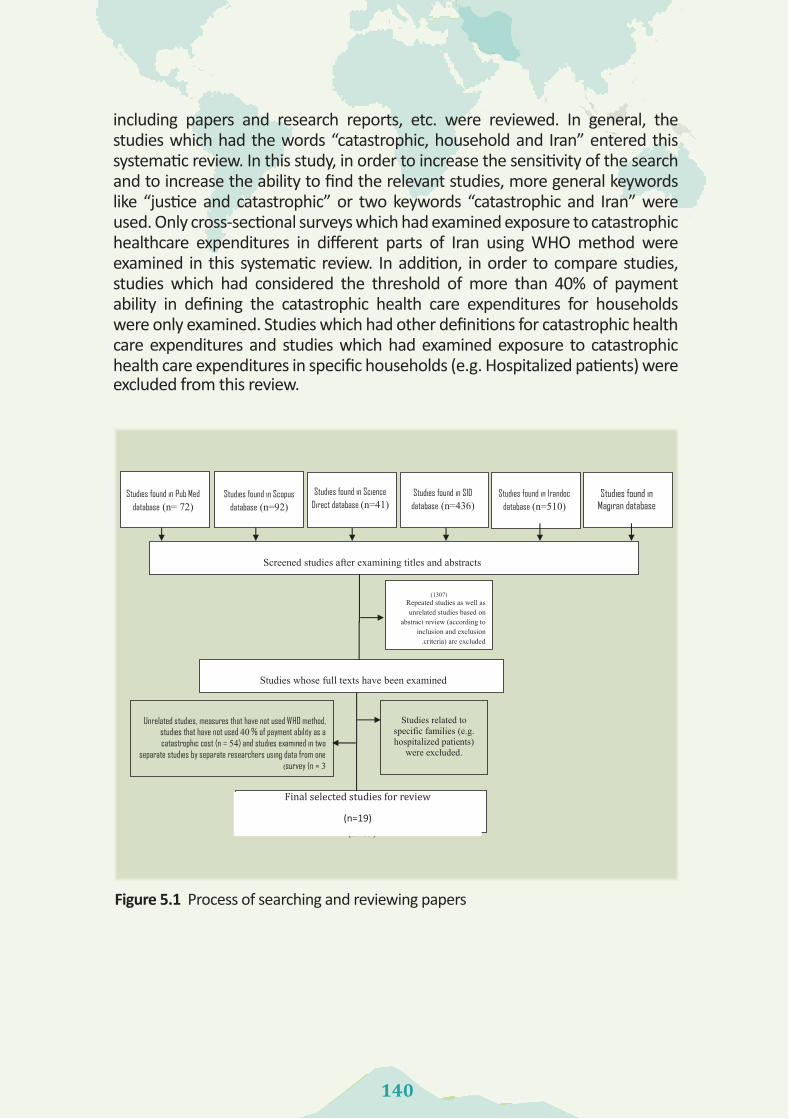
140140
including papers and research reports, etc. were reviewed. In general, the studies which had the words “catastrophic, household and Iran” entered this systematic review. In this study, in order to increase the sensitivity of the search and to increase the ability to find the relevant studies, more general keywords like “justice and catastrophic” or two keywords “catastrophic and Iran” were used. Only cross-sectional surveys which had examined exposure to catastrophic healthcare expenditures in different parts of Iran using WHO method were examined in this systematic review. In addition, in order to compare studies, studies which had considered the threshold of more than 40% of payment ability in defining the catastrophic health care expenditures for households were only examined. Studies which had other definitions for catastrophic health care expenditures and studies which had examined exposure to catastrophic health care expenditures in specific households (e.g. Hospitalized patients) were excluded from this review.
Figure 5.1 Process of searching and reviewing papers
Studies found in Magiran database
(n=240)
(1307) Repeated studies as well as unrelated studies based on
abstract review (according to inclusion and exclusion
criteria) are excluded.
Studies found in Pub Med database (n= 72)
Studies found in Scopus database (n=92)
Studies found in Science Direct database (n=41)
Studies found in SID database (n=436)
Screened studies after examining titles and abstracts
Studies whose full texts have been examined
Studies found in Irandoc database (n=510)
Unrelated studies, measures that have not used WHO method, studies that have not used 40 % of payment ability as a catastrophic cost (n = 54) and studies examined in two
separate studies by separate researchers using data from one survey (n = 3)
Studies related to specific families (e.g. hospitalized patients)
were excluded.
(n=8)
Final selected studies for review
(n=19)
Final selected studies for review
(n=19)

141
References:
1. World Health Organization. The World Health Report 2010: Health Systems Financing: The Path to Universal Coverage. Geneva: World Health Organization; 2010.
2. World Health Organization. The World Health Report 2000: Health Systems: Improving Performance. Geneva: World Health Organization; 2000.
3. Papanicolas I, Smith P. Health system performance comparison: An agenda for policy, information and research. Geneva: World Health Organization; 2013.
4. Xu K, Evans DB, Carrin G, Aguilar-Rivera AM, Mylena A, Musgrove P et al. Protecting households from catastrophic health spending. Health Affairs 2007; 26: 972–83.
5. Savedoff D W, Carrin G, Kawabata K, Mechbal A. Monitoring the Health Financing Function. In: Murray C.J.L., Evans D.B. Health System Performance Asseaament (Debates, Methods and Empiricism). World Health Organization; 2003:211-19.
6. William D. Savedoff, Carrin G. Developing Health Financing Policies. In: Murray CJL, Evans DB. Health System Performance Asseaament (Debates, Methods and Empiricism). World Health Organization; 2003:205-10.
7. Murray CJL, Xu K, Evans D, Klavus J, Kawabata K, Hanvoravongchai P, et al. Assessing the distribution of household financial contributions to the health system: concepts and empirical application. In: Murray CJL, Evans DB. Health System Performance Asseaament (Debates, Methods and Empiricism). World Health Organization; 2003:565-72.
8. GiedionU, Andrés Alfonso E, Díaz Y. The Impact of Universal Coverage Schemes in the Developing World: A Review of the Existing Evidence. UNICO Studies Series No. 25. The World Bank, Washington DC, January 2013.
9. WHO Library Cataloguing-in-Publication Data. World Health Statistics 2014. World Health Organization; 2014.
10. LiaeeManesh AR, Abolhallag M, Zangene M, Zakeri MR, Rashidian A, Kazemian M, et al. Report of National Health Accounts Islamic Republic of Iran- 2008. In: Office of Technology Assessment.
11. Keshavarz A, Kalhor R, Javadi A, Asefzadeh S. Estimating Out of Pocket payments (OOP) for medical cares in Qazvin province in 2009. Hospital 2012;10(4):71-7. (in Persian)
12. Semnani S, Keshtkar AA. Assessing of equality on health care cost in Gorgan population laboratory study Journal of Gorgan University of Medical Sciences 2004;5(12):53-69. (in persian)
13. Zare H, Trujillo AJ, Driessen J, Ghasemi M, Gallego G. Health inequalities and development plans in Iran; an analysis of the past three decades (1984–2010). INTERNATIONAL JOURNAL FOR EQUITY IN HEALTH 2014, 13:42.
14. Hajizadeh M. Luke B., Equity of Health Care Financing in Iran, The Effect of Extending Health Insurance to the Uninsured. Oxford Development Studies 2010; 38(4): 461-476.
15. Soofi, M, Rashidian A, Aabolhasani F, Akbari Sari A, Bazyar M. Measuring the Exposure of Households to Catastrophic Healthcare Expenditures in Iran in 2001: the World Health Organization and the World Bank’s Approach. Hospital 2012; 12(2): 39-50. (in Persian)
16. Raghfar H, Atkare Roshan S, Atefi M. Measurement of the Fair Financial Contribution Index and Catastrophic Expenditures in Different Regions of Iran, 1984-2010. Hakim Research Journal 2013; 16(3): 182- 191. (in Persian)

142142
17. Mohammad Alizadeh H, Fazaeli AA. Situation of Iran health system financing. Journal of Social Welfare 2003; 5 (19): 280-300.
18. Razavi SM, Hassanzadeh A, Basmenji K. Fairness in financial contribution in the health system. Tehran: Andishmand publication; 2005. (in Persian)
19. Kavosi Z, Rashidian A, Pourreza A, Majdzadeh R, Pourmalek F, Hosseinpour AR, et al. Inequality in household catastrophic health care expenditure in a low-income society of Iran. Health policy and planning 2012;27(7):613-23.
20. Mehrara M, Fazaeli AA, Fazaeli AA. Health Finance Equity in Iran: an Analysis of Household Survey Data (1382-1386). Journal of Health Administration 2010;13(40):51-62. (in Persian)
21. Karami M, Najafi F, Karami Matin B. Catastrophic Health Expenditures in Kermanshah, West of Iran: Magnitude and Distribution. J Res Health Sci 2009; 9 (2): 36-40.
22. Moghadam MN, Banshi M, Javar MA, Amiresmaili M, Ganjavi S. Iranian household financial protection against catastrophic health care expenditures. Iranian Journal of Public Health 2012;41(9):62.
23. Nekoeimoghadam M, Akbari-Javar M, Amiresmaili M, Baneshi M, Ganjavai S. Determining households exposure to catastrophic health expenditures and exploring its influential factors in Kerman province. Journal of Management and Medical Informatics School 2014; 7(2): 1. (in Persian)
24. Amery H, Jafari A, Panahi M. Determining the Rate of Catastrophic Health Expenditure and its Influential Factors on Families in Yazd Province. Journal of Health Administration 2013;16(52):51-60. (in Persian)
25. Asefzadeh S, Alijanzadeh M, Gholamalipour S, Farzaneh A. Households Encountering with Catastrophic Health Expenditures in Qazvin, Iran. Health Information Management 2013;10(1):1-8. (in Persian)
26. Yousefi M. Households and Health Expenditures: Components, Dimensions and Determinants. Tehran: Tarbiat Modarres University; 2013. (in Persian)
27. Vaez Mahdavi MR, Asadi-Lari M, Faghihzadeh S, Haeri H, Golmakani M. eds. Urban Health Equity Assessment and accountability: to explain the experience of Tehran. Second National Conference and the First International Conference on experiences and good practices of primary health care; 2013; Tehran, Iran: North Khorasan University of Medical Sciences Journals System.
28. Sabermahani A, Nooraee-motlagh S, Vaeze Mahdavi M, Hadian M, Asadi-Lari M. Catastrophic health expenditures and its determinants among households in Tehran in 2011, Urban HEART-2 study. Razi Journal of Medical Sciences 2014;21(126):15-26. (in Persian)
29. Kavosi Z, Keshtkaran A, Hayati R, Ravangard R, Khammarnia M. Household financial contribution to the health System in Shiraz, Iran in 2012. International Journal of Health Policy and Management 2014;3(5):243.
30. Ameri H, Vafaie H, Alizadeh H, Ghiasi A, Shmayan Razavi N, Khalfy A. Determining households exposure to Catastrophic Health Expendicher in Househols of Torbat Heydariyeh University of Medical Sciences: 2013. Journal of Torbat Heydariyeh University of Medical Sciences 2014;1(2):46-54. (in persian)
31. Rezapour A, Ghaderi H, Azar FE, Larijani B, Gohari MR. Effects of Health Out-of-Pocket Payment on HouseHolds in Iran; Catastrophic and Impoverishment: Population Based
143
Study in Tehran (2012). Issues 2013;12:13.
32. Ghafoori MH, Azar FE, Arab M, Mahmoodi M, Zadeh NY, Rezapour A. The Distribution of Health Expenditures in Tehran’s Districts. Journal of Community Health Research 2014;3(2):132-44.
33. Ghoddoosinejad J, Jannati A, Gholipour K, Baghban Baghestan E. Households encountering with catastrophic health expenditures in Ferdows, Iran. Egyptian Public Health Association Journal 2011; 89: 81–84.
34. Hajizadeh M. Nghiem HS. Out-of-pocket expenditures for hospital care in Iran: who is at risk of incurring catastrophic payments? Int J Health Care Finance Econ 2011; 11:267–285.
35. Kavosi Z. (dissertation). Study of change trend of responsiveness and equity in financial contribution in 17th district of Tehran, 2002-8. Tehran: Tehran University of Medical Sceinces; 2009.
36. The Islamic Republic of Iran’s Fourth Five-Year Development Plan (2007-2011).
37. The Islamic Republic of Iran’s Fifth Five-Year Development Plan (2011-2015).
38. Minestry of Health and Medical Education. Health Transformation Plan; 2013.
39. Thomson S, Osborn R, Squires D, Jun M. International Profiles of Health Care Systems (2012). The Common Wealth Fund; 2012.
40. Yardim M, Cilingiroglu N, Yardim N. Catastrophic health expenditure and impoverishment in Turkey. Health Policy 2010; 94: 26–33.
41. Akinci F, Mollahalilo S, Gürsöz H, Ögücü F. Assessment of the Turkish health care system reforms: A stakeholder analysis. Health Policy 2012; 107: 21– 30.
42. OECD. OECD reviews of health systems: Turkey. Paris: OECD and International Bank for Reconstruction and Development/the World Bank, OECD; 2008.
43. Limwattananon S, Vongmongkol V, Prakongsai P, Patcharanarumol W, Hanson K, Tangcharoensathien V, et al. The equity impact of Universal Coverage: health care finance, catastrophic health expenditure, utilization and government subsidies in Thailand. International Health Policy Program. Ministry of Public Health, Thailand; 2013.
44. Limwattananon S, Tangcharoensathien V, Prakongsai P. Catastrophic and poverty impacts of health payments: results from national household surveys in Thailand. Bulletin of the World Health Organization 2007; 85 (8): 600-606.
45. Galarraga O, Sosa-Rubi SG, Salinas-Rodriguez A, Sesma-Vazquez S. Health insurance for the poor: impact on catastrophic and out-of-pocket health expenditures in Mexico. Eur J Health Econ 2010; 11:437–447.
46. Knaul FM, González-Pier E, Gómez-Dantés O, Garca-Junco D, Arreola-Ornelas H, Barraza-Lloréns M, et al. The quest for universal health coverage: achieving social protection for all in Mexico. Lancet 2012; 380: 1259-79.
47. Kim Y, Yang B. The trend in catastrophic health payments by income strata in South Korea. The Korean Journal of Health Economics and Policy 2009; 15: 59–77.
48. Anderson GF. Universal Health Care Coverage in Korea. Health Affair 1989; 8(2):24-34.
49. Younhee Kim Y, Yang B. Relationship between catastrophic health expenditures and

144144
household incomes and expenditure patterns in South Korea. Health Policy 2011; 100: 239–246.
50. Li C, Yu X, Butler J, Yiengprugsawan V, Yu M. Moving towards universal health insurance in China: Performance, issues and lessons from Thailand. Social Science & Medicine 2011; 73: 359e.
51. Li X, Shen J, Lu J, Wang Y, Sun M, Li C, et al. Household catastrophic medical expenses in eastern China: determinants and policy implications. BMC Health Services Research 2013; 13:506.
52. Xu K, Evans DB, Kawabata K, Zeramdini R, Klavus J, Murray CJ. Household catastrophic health expenditure: a multicountry analysis. The Lancet 2003; 362(9378):111-7.

145

146146
Chapter6
Establishment of Universal Health Coverage in Iran

147
AbstractIn this chapter, we first take a look at the lessons learned from other countries, the status of Universal Health Coverage (UHC) in Iran and challenges and prerequisites toward achieving this coverage, then, the policy options to achieve the UHC will be proposed. The results of this research were obtained by summarizing the previous chapters, reviewing the related literature and analyzing the findings of a qualitative study. This qualitative study was conducted in the form of semi-structured interviews with a number of experts, including policy makers and decision makers at macro level and authorities of Iranian health system. Results showed that the situation of health service coverage and population was quantitatively relatively good but unclear qualitatively.
Indicators related to people’s financial protection showed an alarming situation, but after the implementation of the Health Transformation Plan (HTP), some signs of improvement could be seen. Some of the most important challenges identified in the path of the UHC include lack of precise orientation in this regard, stewardship problems of the health system, poor planning and inter-sectoral collaboration, insurance problems such as numerous insurance funds with different copayment and payment levels due to different levels of insurance services, lack of precise identification of the insured people, regressive insurance fee, relatively limited and inflexible insurance package, poor supervision of tariffs, irrational difference of tariffs in public and private sectors and non-inflationary and inefficient payment system. Some of these cases such as monitoring tariff have relatively improved after the implementation of the HTP. Prerequisites for the UHC also include unified stewardship by the Ministry of Health (MOH), developing a comprehensive and efficient information system, evidence-based planning and policy-making, development and use of clinical guidelines and reformation of payment system.

148148
Introduction:
The government is in charge of providing health of the people and ensuring that all citizens have access to basic health and treatment services without any financial concern. Concerning the importance of public health, providing, maintaining and promoting health has always been the dreams and, at the same time, one of the serious challenges of the governments. Governments are aware that health is the infrastructure and factor of growth and development and is necessary for economic prosperity. A healthy society is a prerequisite for comprehensive and sustainable development and guarantees it.
Owing to the importance of public health and its role in growth and development, as well as governments’ awareness of the fact that their success and failure in the field of health plays a crucial role in their acceptance or rejection by the people, people’s access to the health services has been taken into huge consideration in governments’ policies and programs.
Despite all the attentions, governments are not only able to provide the entire healthcare needs of all people, but normally encounter some challenges in providing their basic needs. Population growth (especially the elderly population), increased expectations of the people, arrival of new technologies and ongoing increase in healthcare costs are some factors that make UHC difficult, however, the task is not taken from the government.
Health is very important in the Islamic Republic of Iran and its constitutional law states that access to health services is the right of all people. In the last century, health system policymakers have taken important steps to overcome people’s health concerns, in recent decades, important steps have been taken to achieve it by implementing the health network plan, the family physician plan and the referral system.
In addition, to the constitutional law which has emphasized people’s easy access to health services, reducing public health costs and people’s equitable access to health services have also been taken into account in the Third (2000), Forth (2005) and Fifth (2011) Development Plan and especially in the general health policies announced by the Supreme Leader (2014). Identifying and providing universal health insurance coverage and implementing health system evolution plan are some of the actions that try to pave the way to achieve the UHC by completing the insurance coverage scope and reducing health costs, particularly in the inpatient sector.
Despite efforts made in the field of the UHC in Iran, it is not easy to achieve this goal. The precise knowledge of health and treatment status, capacities and resources of Iran, realistic identification of obstacles and challenges, as well as taking advantage of the experiences of countries that have achieved or are achieving the universal health coverage all will help Iran achieve the UHC.

149
UHC in Iran
As mentioned earlier, a great number of actions have been taken or are taking in Iran to achieve the UHC. These actions have resulted in success in completing some of three-dimensional aspects of the UHC cube although there are some serious deficiencies in some aspects.
Evidence shows that despite the great efforts made by the health system authorities, there is still no unique “basic services” package in Iran and moreover, a benefit package is not defined clearly and, most importantly, completely. “Complete” means that it covers people’s basic needs. On the one hand, the MOH, as the steward of the health system, has not considered the benefit package complete and on the other hand, insurance organizations that purchase services think that covering the complete package is impossible without an increase in resources. In addition, the existing benefit package is not integrated, that is, the basic health benefit package is covered by the MOH and services at the second and third levels are provided by the insurance organizations. Moreover, benefit packages underwritten by insurance organizations are also different.
Lack of transparent and complete definition of basic benefit packages, lack of a clear boundary between basic and supplementary benefit packages and existence of multiple policies in determining the extent of public participation in health care expenses are the main challenges in the field of health in Iran.
Concerning coverage of all citizens, it must fortunately be said that the recent actions taken by the government to identify and cover the uninsured people in the form of the HTP have caused all people to have the chance to utilize health insurance coverage, unless they do not act in this area. According to evidence and statistics, of 80 million people of Iran, about 34,299,692 people are insured by the social security organization (1) and 34,316,566 ones are covered by Iran health insurance organization (2) The Armed Forces Medical Services Organization covers about four millions people. Moreover, about 1,650,000 people (3) who are not able to pay their insurance fee are covered and supported by the Imam Khomeini Relief Foundation. In addition to these funds, there are 20 health insurance funds which cover staff of some ministries, organizations, institutions, municipalities, banks and cooperatives (see Figure 6.1.).
Status of the health system is far more worrying concerning the financial protection aspect than the other two aspects. According to WHO statistics (2014), the share of public resources in health financing in Iran is 49.5% (24.5% of government’s public budget and 25% of the social insurance budget), while the average index for the Eastern Mediterranean Region (EMR) countries is more than 50% (39% of government’s public budget and 12% of the social insurance budget) and its global average is about 59% (23% of government’s public budget and 35.5% of the social insurance budget). Comparing this index with the average

150150
regional and global index and understanding the fact that the share of private insurance of private financing in the health system of Iran is negligible, critical status of direct out-of-pocket payment (OOP) can be shown in financing the health system of Iran (4). Figure 6.2 compares the financing status in Iran with the EMR average and the global average. Owing to extensive interventions occurred in 2014 in the form of the HTP, significant changes happened in the insurance coverage, to make an accurate judgment about this issue, results of a study entitled “Utilization of Health Services” (conducted in December and February 2014 and published in 2015) will be helpful.
Figure 6.1 Distribution of population covered by the health insurance in Iran
Another challenge is the low share of government’s budget on health. It results in limited resources allocated to the health sector. In Iran, almost 10% of the governmental budget is spent on health, while the global average is 15% (4).
Figure 6.2 Share of various financing sources in Iran compared with average EMR and global average

151
According to the National Health Accounts (NHA) (2008), direct OOP for health services increased from 46.2% in 2003 to 53.8% in 2008 (3). Studies have shown different results in terms of the percentage of households facing catastrophic expenditures and impoverishment due to health care expenditures. Analyses conducted using the household survey study have shown that the percentage of households facing catastrophic expenditures is between 6% to 24% (5-14), analyses carried out using data of the Statistical Center of Iran have shown that the percentage of households exposed to catastrophic expenditures is between 2% and 4% (15-21) in different regions and times.
The indicator “impoverishment due to health expenditures” is between 1.5% and 11% in different years and areas. Moreover, various studies have shown that the “Fairness in Financial Contribution Index” (FFCI) is between 0.57 and 0.83 (6, 11, 15-18, 21), it represents the households’ inequality in contributing to health financing. These figures all reflect an alarming status of financial protection and health expenditure coverage. However, data obtained from monitoring the health system evolution plan by the National Institute of Health Research (NIHR) shows that a significant change has occurred in the share of people in paying hospital costs, it affects their total health costs as well as financial protection indicators such as catastrophic health expenditures.
Low share of the health system of GDP, low share of health of governmental budget, low share of the insurance organizations in financing the health system, high share of people’s direct OOP and lack of a clear policy to identify and support patients who are at risk of catastrophic expenditures are some problems that make achievement of the financial protection aspect more difficult.
In general, it can be said that despite the fact that the UHC cube is almost complete concerning population coverage, there is no comprehensive and unique benefit package and, more importantly, the trend situation of financial protection is extremely worrying. Therefore, Iran needs a set of actions to preserve and improve the existing situation in the population coverage aspect and to achieve success in the other two aspects, namely financial protection and comprehensive and basic benefit package coverage. To do this, paying attention to research in the field of UHC is necessary to make evidence-based decisions. Besides, reviewing experiences of other countries which are successful in achieving the universal health coverage seems helpful.
The Role of Research in UHC
An experimental and traditional look at problems rather than a scientific approach highlights the necessity of using scientific and research documentation

152152
and international experience in order to facilitate the achievement of the UHC.
One of the problems of the health system is lack of application of research to identify and solve the problems. Non-technical looks at the UHC and managers and inadequate familiarity with the importance of research in this field have resulted in serious problems in achieving the UHC. Generally, enough supporting documentation and evidence is not produced in the health systems, or it is not dependent on knowledge-based documentation. This, in turn, makes policies and programs more vulnerable, thus, a change in governments leads to serious changes in managerial approaches in the field of health research. As a result, the health system and the policies implemented to achieve the UHC will be seriously damaged and resources will be wasted.
Evidence indicates that research could not play a role in the UHC due to four main reasons, these include: 1) barriers related to funding for conducting research; 2) Barriers related to the production and application of knowledge; 3) barriers related to the level of resources; and 1) Barriers in the health system stewardship.
Although, effective actions have been taken to support research activities in this field in Iran and although many centers are active in this field, the shortage of research is obvious in making policies, determining goals and plans of the health system and achieving the UHC.
International Experience in UHC
All countries, including low-income and high-income countries, seek to achieve the UHC. But most countries that have achieved the UHC are among high-income countries and the member countries of the Organization for Economic Cooperation and Development (OECD) (23). Over the past decade, some low- and middle-income countries such as Chile, China, Brazil, Mexico, Rwanda, Turkey and Thailand have moved towards the UHC (23, 24). Although the path and duration of achieving the universal health coverage is different in every country due to their health structure and resources, economic situation of countries do not seem to be the only factor determining UHC achievement (23).
Germany (in the form of a social insurance system), Canada (in the form of a national insurance system) and United Kingdom (in the form of a national health system) to a great extent have removed concerns of their citizens about having access to and utilizing necessary health services. Studies have shown that countries have achieved the UHC in different contexts and structures and there have been no single prescription to achieve it although, in some elements, there are some similarities between them, including a significant increase in the share of pooled financing (total internal financial resources except for direct OOP) (23) (Table 6.1.).
In high-income countries such as Germany, Britain and Sweden that have achieved

153
the UHC, nearly 90% of the financing is of the pooled type. Among middle-income countries such as Chile, South Korea and Malaysia which have achieved the UHC or are moving rapidly towards it (such as Brazil, Mexico and Thailand), more than 65% of financing is in the form of pooled financing (23). The share of health taxes is different in these countries; it is significant in some countries such as Britain, Sweden, Brazil, Malaysia and Thailand. To achieve this position, countries have faced numerous problems and have taken numerous and diverse actions.
Given the importance of health system funding in reducing patient’s financial risk, most developed countries provide their health system resources through taxation or compulsory insurance fee and thus the share of direct OOP is minimized (23).
Table 6.1 Health financing in selected countries with different income levels and progress towards universal health coverage (2009)
Moreover, in most countries a single purchaser or several independent purchasers purchase health services from one of the public or private providers or both of them. Most countries have allocated significant subsidies to specific target populations and have developed financial protection through increased tax revenues. Instead of several programs for different population groups, some countries have implemented single coverage programs for all the population (23). In addition, comprehensiveness of the benefit package has been of great importance in most successful countries. Other common points here are the application of evidence-based guidelines, accreditation and quality improvement programs and considering providers’ financial incentives in order to guarantee the quality of the provided services (23). Table 6.2 summarizes the experiences of four countries of Turkey, Brazil, China and Russia in achieving the UHC in three “covered population, benefit package and financial protection” aspects.
Share of pooled funds of total health expenditures(%)
Health expenditures share of GDP(%)Countries
Classification of countries
8911Germany
High-income countries with universal health coverage 909Britain
8510Sweden
668ChileMiddle-income countries with universal health coverage 657South
Korea605Malaysia
699BrazilMiddle-income countries that are moving rapidly towards universal health coverage
527Mexico
844Thailand

154154
Country
Status of important actions taken in the field of population coverage
Status of important actions taken in the field of benefit
packageStatus of im
portant actions taken in the field of financial protection
Turkey
• Increased percentage of insured people over eight years (60%
among low
-income decile and other deciles)
• Increased coverage of Green Card Scheme am
ong the poor (in 2001, about 2.4 m
illion people were covered, w
hile about 19 m
illion people were poor. This card covered 10.2 m
illion in 2011, w
hile about 11.8 million people w
ere poor) (25)
• comprehensive basic benefit package: all treatm
ent and diagnostic services including inpatient and outpatient services, except for som
e special cases
• Free personal health care related to prevention and financing it through health budget by the governm
ent
• Free oral health services for all people under 18, regardless of insurance
• Proposing first level services with a focus on the fam
ily physician plan in 2005 and covering m
ost of the population (25)
• Creating a mechanism
for identifying the poor in 2004 to support the low-incom
e deciles
• Integrating five insurance units in 2008 and creating a single unit under the supervision of the Social Security Organization, all these units and the Green Card Schem
e were created in 2012
• Decreasing out-of-pocket payments in all incom
e quarters due to increased coverage of green card plan and sim
ilar health expenditures in all quarters (25)
China
Implem
enting basic health insurance in 2007 for people residing in urban areas in order to cover people w
ho are not covered by urban em
ployee basic health insurance (before 2007, 30% of the
urban population were covered by urban em
ployee basic health insurance) (26)
A benefit package including all health services except for heart surgery and lung and liver transplantation (26)
• Implem
enting New Rural Cooperative M
edical Scheme in 2003, it is
mainly funded by the governm
ent (more than 95%
of farmers w
ere covered in June 2012).
• Share of insurance in paying equal health expenses (equal to 75% of
expenses for all city dwellers covered by tw
o urban employee insurance
and basic health insurance in 2012)
• Implem
enting Medical Financial Assistance system
for the poorest citizens and covering m
ore than 68 million people (this system
covers disabled people, old people and seriously sick people in low-incom
e fam
ilies) (26)
Brazil
• Establishing the Unified Health System (this system
financed by the federal and state governm
ent through taxes and social contributions covers the entire population of Brazil)
• Covering about 25% of the population by private insurance
(usually healthier, younger and richer people) (26)
• No limitations for existing benefit packages and covering all
levels of health care in accordance with service levels and by
focusing on primary health care
• Covering 55% of people (m
ainly low-incom
e deciles) by fam
ily health plan that provides primary health care (26)
• Providing treatment services by private and governm
ental sectors and free services
• Involvement of private sector in health insurance m
arket (26)
Russia
• Covering all civilians except for the military and prisoners by
compulsory health insurance (financing for people excluded from
the public budget), presence of optional private insurance
• Covering 99% of the target population by m
andatory health insurance and covering 100%
of the target population by the state budget and covering 8%
of the population by private insurance (26)
• covering all inpatient and outpatient services, except for special services and second-level services by m
andatory health insurance
• Not covering drugs for outpatient people by compulsory
health insurance (only certain drugs are free) (26).
• Free medicine for poor people
•financing through compulsory health insurance in the
form of deposits and prepaym
ents (26)
Table6. 2 Actions of selected countries in order to achieve universal health coverage

155
Generally, evidence shows that the UHC cannot be achieve easily, to achieve it, some coherent and comprehensive actions must be taken. Authorities’ will and commitment to achieve the UHC and increasing the share of health of the public budget and pooled funding are very important. The prevailing policy of the surveyed countries was to reduce reliance on the OOP and to adopt a fair and suitable approach to finance the health system.
Challenges of Achieving UHC in Iran
Reviewing the status of the health system in Iran and the actions taken by other countries shows that if the challenges and obstacles are identified more successfully, achieving UHC would be easier. Therefore, the challenges of achieving the UHC in Iran will be discussed in this section.
It should be noted that some of these challenges of achieving the UHC are beyond the health sector and are related to the higher levels, while some others are related to the health system and are divided into two main parts of the MOH as the stewardship and the insurance system as the purchaser of services. Accordingly, the challenges of achieving the UHC can be categorized in two general “outside the health system and inside the health system” categories. Challenges inside the health system can be classified based on four functions of the health system including stewardship, financing, production and provision of health services (27).
Figure 6.3 The relationship between the health system and socioeconomic systems
Challenges outside the Health System
Some of the challenges of the UHC are out of the health system and are mainly affected by the situation governing the economic system (Figure 6.3.). Low per capita income, low economic growth, high unemployment rates, inefficient and non-transparent tax system and low level of wages and salaries of people who pay insurance fess including staff and workers are some of the factors that affect the health system directly or indirectly. In addition, there are other factors that affect people’s health and the health system.
Political, social and cultural system
Economic system
Health system

156156
Low and unstable share of health system resources caused by economic crises is a significant issue that affects the health system reforms and postpones achieving the UHC. Lack of a transparent and efficient tax system in Iran and the impact of oil price fluctuations are undeniable and bad realities which affect health system resources. On the other hand, Iran’s economic growth and development (along with its impact on employment) increases population coverage, increased financial protection facilitates the achievement of the UHC.
Challenges inside the Health System
In addition, to the factors which affect the health system performance and the achievement of the UHC outside the health system, there are other challenges that are related to the functions of the health system. In a general classification, these challenges can be divided into four main categories: challenges related to the health system stewardship, challenges related to financing, challenges related to the production of resources and challenges related to the provision of services.
• Challenges Related to Stewardship
Problems and challenges related to stewardship can be regarded as the infrastructure of challenges existed inside the health system because insufficient attention to this issue can cause many problems in other functions of the health system. Vague orientation in the health system in the context of the overall pattern of achieving the UHC, poor inter-sectoral collaboration due to lack of proper planning, lack of using strong scientific evidence in policy making and planning, lack of attention to the balance between the interests of different beneficiaries in making policies, lack of attention to various economic, social and cultural aspects of health programs and interventions, lack of attention to the existing structures and substrates in formulating and implementing policies, dismissal and employment of managers at different levels and dependency of policies and programs on individuals are some of the challenges that can be examined in the context of the health system stewardship. Although, most of the experts (interviewed in a qualitative study for the development of this text) agree on the existence of main challenges in the health system stewardship in Iran, beneficiaries disagrees on how to separate the duties of stewardship in the health system.
Setting tariffs on the healthcare services is a duty that is mainly affected by the stewardship performance of the health system in Iran. Concerning the fact that tariffs determine the relative value of the health services and thus their prices, they will have a significant role in purchasing services, performance of insurance organizations and finally in people’s OOP. Some experts have emphasized that tariffs of the public and private sectors have been apart for the past ten years and that K-value of services has been different in these two different sectors.
157
Some experts have mentioned that private providers play a significant role in Iran’s health market, concerning the problems related to covering some services provided by the private sector as well as service costs, problems related to the access, especially access to the financial protection increase OOP. In addition, no correct supervision is applied on the existing tariffs while providing services.
Owing to the active presence of the private providers in the health market, especially in outpatient and diagnostic services, the private sector plays a significant role in OOP. According to experts, however, despite the important role of this sector in the provision of health services, they are not taken into serious account in making policies and programs.
• Challenges Related to Financing
Challenges of financing can be divided into two categories, namely challenges related to the collection and pooling revenues and challenges related to strategic purchasing:
− Challenges Related to the Collection and Pooling Revenues
Non-mandatory insurance coverage, presence of numerous insurance funds with different copayment and prepayment levels, regressive and unfair nature of insurance fees paid by individuals, inequality and disparity in the level of insurance liabilities in paying for the health expenditure, uncertainty of people’s situation in income deciles with regard to their financial power, overlap of statistics, inefficiency of insurance organization in providing suitable financial protection, absence of necessary information structures, non-implementation of electronic health record, presence of vast non-official economic sectors and presence of obstacles in social insurance coverage are some of the challenges in collecting and pooling revenues which are mentioned by the experts.
Reviewing coverage level of two main Social Security Organization (SSO) and Iran Health Insurance funds and concerning Iran population and statistics of other funds, it can be concluded that some people are covered by both funds (more than 5% in a study conducted on multiple demographic and health indicators in 2010) (28). This overlap can be due to inaccurate identification of insured people due to lack of appropriate and integrated information systems in Iran health system. In addition, it should be noted that the absence of a comprehensive and integrated information system and non-implementation of electronic health record make status of healthcare provided to patients impossible to follow, it results in the radar syndrome in the health system and thus effectiveness and cost effectiveness of interventions in the health system become problematic.
On the other hand, there are some significant disparities between health insurance funds in Iran and people are categorized in different groups in terms of their access to insurance coverage (3). Some people who work in governmental and relatively high-income organizations are members of rich insurance funds,

158158
while other people are members of insurance funds which do not have good financial situation and good financial stability (29, 30).
− Challenges Related to Strategic Purchase of Health Services
Purchasing services, as a process that connects the collected resources to services provided for the covered population, has a significant effect on managing resources and achieving UHC. Basic health insurance package provides a relatively good coverage. According to most experts, however, basic health insurance package has been developed unscientifically and prioritizing services and cost-effectiveness of interventions have not been considered in its design. These criteria are not taken into account during arrival of new services. One of the main causes of the problems mentioned in designing the benefit packages is lack of coordination and agreement among various beneficiaries, especially insurance organizations and the MOH, about developing these packages and in other words, about insignificant role of service purchasers i.e. insurance organizations in this process.
According to experts, another challenge in the process of purchasing health services in Iran is the problems related to payment mechanism. The existing payment method which is mostly conservative creates incentives to induce demands by providers and has little to do with the outcomes and quality of services delivered by the providers. Moreover, since payers mainly experience financial risks, insurance organizations will not be able to cover some expensive services due to the shortage of resources. This, in turn, affects different aspects of universal coverage, especially financial protection.
One of the main aspects considered in the process of purchasing services is the price of these services. Price of services determined in the form of tariffs faces some challenges, the most important of which is lack of coordination of beneficiaries, especially the MOH (as the health stewardship) and insurance organizations (as service purchasers) in this process.
• Challenges Related to Production of Resources
According to experts, providing the necessary resources of the health sector to cover the public health is faced with several challenges which are mainly related to human resources. Inefficient use of human resources of the health sector and the shortage of manpower in some rural and less-developed areas is the main challenge which reduces people’s access to health system services and increases direct OOP due to high expenses of traveling to receive services. This is due to the absence of necessary infrastructures, the shortage of equipment and unwillingness of staff to work in rural and deprived areas (31).
According to health experts, uncontrolled arrival of medicines and medical equipment is another challenge that has created many problems for the health sector due to the shortage of health financial resources .Non-optimal use of resources, ignoring economic principles and concepts in the health sector and

159
failure to take advantage of the economic evaluation of health technologies lead to, in some cases, the loss of a huge part of the resources allocated to the health sector.
• Challenges Related to the Provision of Services
Providing Health services is the most obvious function of the health system and is considered a showcase of the health system. Most challenges and problems related to the provision of health systems stem from challenges outside the health system and challenges related to stewardship, financing and production of resources.
In particular, some success has been achieved in the field of providing health services for all citizens in all areas, but there are still problems and obstacles. One of these problems is the unfair distribution of health resources and inequitable utilization of health services in different geographical areas. In rural areas, the first level services are provided appropriately and actively, while they are passive in urban areas, especially in the outskirts. Moreover, in rural and deprived areas, the second and third level health services are provided less than those in the big and developed cities due to lack of necessary infrastructures, the shortage of equipment and unwillingness of human resources to work in rural and deprived areas (31).
Another challenge in providing services is related to the quality of services. Despite different quality policies and programs in Iran, especially in hospital services, quality of service has not reached an appropriate level. This problem affects the accountability, it can be said that problems related to the quality of services is the main cause of inappropriate accountability which occurs as a result of weak supervision and stewardship in the health system. In this case, experts have mentioned poor formulation, implementation and supervision of clinical guidelines. Although this challenge is related to the stewardship of the health system, many problems related to service provision such as poor quality of services, provider’s induced demand and low provider’s accountability are also originated from this issue.
Policy Requirements and Prerequisites of Deploying UHC in Iran
The health system has many components and elements that act as an intelligent system whose components are interrelated, any change in one of these elements changes other components. The UHC is also achieved through perfect performance of all elements of the health system. Thus, perhaps the most fundamental principle for achieving the UHC is considering a systemic thinking in the health system.

160160
According to the most health experts, the first thing to consider here is that the socio-economic structure of a country dramatically affects the performance and even objectives of the health system. If economic structure and performance of a country is modified and improved, much of the pressure imposed on the health system will be reduced. Increased revenue from economic growth increases people’s purchasing power and increases demand for health services. On the other hand, financial barriers to utilizing the health services are largely reduced by covering people through employment. Likewise, increased public revenue through reforming tax structures increases the government’s financial ability to achieve the UHC and strengthens sustainability of resources. Thus, modifying the economic components of Iran, even indirectly, dramatically affects the financial ability and capacity of the government to create lasting reforms in the health system and to nationalize the public health coverage. When the share of the health system of total GDP and the public budget is determined, the health system players will help the country achieve the UHC.
Coordinating all actors in the field of health, including the MOH, the insurance organizations, service purchasers and providers, medical professional unions and most importantly, people is very difficult but essential. The absence of a strong stewardship to create coordination, explaining frameworks and defining the dos and do nots at macro levels can, more than anything else, affect the implementation of programs and creation of stable and lasting reforms. To achieve the UHC, orientation of the health system should be determined and key strategic decisions must be made in the field of health by the unit stewardship, this subject has also been emphasized in various reports the WHO. Most experts believe that the stewardship role of the MOH has greatly been strengthened since the beginning of the eleventh government, but no sign of structural and legal changes has been observed in the unit stewardship. Thus, providing a clear and uniform definition of stewardship and determining the scope of its duties and powers help pave the way for achieving the UHC by creating coordination and integration in making policies and by creating cohesion in programs and actions. Therefore, stewardship limits and scope of duties and powers must be determined and announced so as not to interpret failures in the implementation of programs and in achievement of the defined objectives due to uncertainty in “stewardship”.
The role of insurance organizations and their relationship with stewardship must be explained clearly and authorities of insurance organizations must be determined in accordance with the duties and the roles that health system has allocated to them. The uncertainties of the duties of stewardship and insurance organizations or lack of clear borders have prevented the purchase of strategic services and have caused inefficiency in the allocation of healthcare resources. In order to reduce the conflict between the people forming the health system and to improve their interaction, there is no option but to determine the role,

161
functions and powers of each component properly and accurately, it is also important to achieve the UHC.
Given the important role that the private sector has in providing services in the health system, it must be taken into account in making policies and plans more than ever. It was also mentioned in the report of the WHO (2000) that ignoring the private sector in making policies was a major challenge in many countries. It also mentioned that strengthening the plans and government’s supervisions on the private sector was a path toward improving performance of health systems (27). Undoubtedly, achieving the UHC is impossible, regardless of the position and power of the private sector in providing health services. Since a huge part of outpatient services in Iran is provided by the private sector, lack of commitment of the private sector to comply with the approved tariffs and inappropriate and unreasonable distribution of the private sector in Iran cause some problems in providing financial protection and equitable access of citizens to health services which is one of the goals of the UHC.
Strengthening the information infrastructures is a prerequisite in the context of the health system financing. This can have a significant impact on meeting the challenges of this sector. As discussed earlier, the major challenge in financing is insufficient information about the insured people, this causes the management of financial resources not to be systematic and process-based in the health system.
Changes in medical education and training the manpower proportional to health and treatment needs of a society is one of the most important implications not only for achieving the UHC but also for continuing it. Training the manpower has an undeniable impact on the demand and supply of health services and therefore on the cost of the health system. Without adequate human resources, timely supply of health services needed by citizens is not possible and controlling supply and demand market will be difficult. The shortage of supply or increased number of medical staff can prevent the achievement of the UHC. Increased manpower in each of the specialized fields facilitates people’s access to services, creates induced demand and, consequently, increases treatment costs. On the other hand, the shortage of treatment personnel or inappropriate training of treatment staff causes some problems in completing three aspects of the UHC cube.
From the perspective of most health experts, the lack of policymaking and management based on effective and continuous evidence is one of the factors that hurts the health system and its authorities and wastes resources. The absence of evidence-based policy-making, decision-making and management, non-application of the health technology assessment system, non-adherence to the service grading system in the development of health infrastructures, networks and centers, and non-application of clinical guidelines in diagnosing

162162
and treating people and many other similar cases all causes some problems for the UHC.
In addition to the above-mentioned requirements, there are other considerations and commitments that must be considered by policymakers to achieve the UHC. Health experts have mentioned the following items:
• Necessity of stable management and presence of managers committed to the UHC;
• Strengthening the rules, designing and legislating effective and efficient laws;
• National will and political supports;
• Creating cultures and educating the public and health care providers;
• Allocating stable governmental budget and increasing it proportional to the actual needs of the health system.
Recommendations to Achieve UHC in Iran
According to what was mentioned about the status of Iran in the field of the UHC, existing challenges and prerequisites presented to achieve the UHC, this section provides some administrative guidelines and suggestions to achieve the UHC.
In reviewing recommendations, it should be noted that paying attention to only one set of actions cannot help achieve the UHC. Although, the shortage of some aspects of the UHC is more obvious, actions should be comprehensive and simultaneous so as to help the health system develop in all aspects of the UHC. Therefore, in line with other chapters of this report, the administrative actions proposed in the context of achieving the UHC have been categorized based on four aspects of “increased covered population, designing benefit packages, improved quality of service and increased financial protection”. Given the importance of the evidence-based policymaking, some suggestions will be brought to strengthen a research-based method to solve health problems, especially the UHC.
Financial Protection
One of the most important aspects which have been taken into account in the field of the UHC is financial protection of the covered population at the time of paying health expenses. It is also of great importance in Iran and has been considered in the Fourth and Fifth Development Plans. However, the objectives considered in the development plans have not been obtained yet and OOP is still more than 50% of the health expenditures (4). Also, based on the existing evidence, the most challenging aspect of the UHC in the health system of Iran is

163
financial protection of people at the time of receiving health services.
In this case, to overcome most of the mentioned challenges, many solutions and guidelines have been provided; they can be categorized as followings:
Increasing the Share of Health From Government Sources
The first option proposed by WHO, particularly for low- and middle-income countries, is increasing the share of public health from government’s public budget. In this case, the operational suggestion is to reprioritize governmental budget and bargain in order to allocate more public funds to the health sector (32). It has been considered in the HTP, moreover, a part of revenues resulted from the second phase of the targeted subsidy plan (about 10%) and a one percent increase in value-added tax have been allocated to the health sector. However, the MOH, as the health steward in Iran, must take some actions to stabilize resources, try to legislate on allocation of resources to this section and implement these laws effectively. Unfortunately, it has not been achieved completely in recent years. Thus, the most important measure in this regard is the attempts made to stabilize governmental resources of health financing clarified in above paragraph of general health policies announced by the Supreme Leader of Iran.
In addition to increasing the share of health from government’s public budget, an emphasis on earmarked tax is another way of increasing the share of health care resources (mentioned by some experts). In addition to provide the health sector with sustainable sources without the need to negotiate, these types of taxes play a direct role in promoting health and have a mutual benefit for the health sector by affecting the reduction of the demand for goods that are harmful to health (32, 33). In this regard, the Supreme Leader has considered and emphasized this issue in article 3-10 of the general health policies. Thus, given the significant use of tobacco, sugar and salt in Iran, it is recommended that consumption of these harmful substances must be reduced and released resources must be directly and specifically be allocated to the health sector by imposing tax on the consumption of these goods.
Also, concerning high limitation of low-income areas in the field of achieving the UHC, one of the innovative ways is to increase taxes on goods and services that are mostly used by the richer people of the society. For example, raising taxes on plane tickets, currency exchanges, departure duties, exchange of luxury and expensive goods and the allocation of revenue to the health sector in low-income and deprived areas can be effective guidelines. Imposing taxon activities that have an adverse effect on the economy and sends currency out of the country and allocation of the revenue to the health sector are some strategic recommendations that will be easily approved by Iran economic and financial authorities (32-34).

164164
• Increasing the Share of Insurance in Financing
Another aspect of financial protection is paying attention to social insurance contributions. Given the low share of social insurance in health financing, another strategy is to increase social insurance participation in the financing of health care services and covered people. One of the complaints that is usually attributed to the insurance organizations is insufficient coverage of diagnostic and therapeutic costs of insured people and lack of coverage for costs of health and preventive actions. Inability of insurance to cover the health expenses of the insured people due to insufficient received insurance fee, ongoing and inappropriate growth of medical expenses of the insured people, lack of a prioritization system and non-optimal allocation and absence of strategic purchasing and unnecessary use of services by the insured people are some serious obstacles in achieving the UHC. In addition to increasing insurance fee and other corrective actions to rationalize the consumption pattern and to control expenses, the government can pave the way to achieve the UHC by increasing the allocation of financial resources from the public budget or subsidies to the insurance funds and organizations. Increasing the efficiency of the health insurance funds will certainly be necessary in this area (32, 35).
Some experts in the health system believe that compulsory health insurance is a way to achieve the UHC. Although the activities done by the eleventh government to provide free insurance coverage to all uninsured citizens was to some extent useful, financial ability of the government to continue this policy is questionable and it seems that free insurance coverage should be limited to poor and vulnerable citizens. Thus, to have permanent insurance coverage, a mechanism should be created for compulsory insurance coverage. On the other hand, the criticism of free insurance coverage is that maybe some people do not financially need free insurance coverage and that the wealthy people who should have higher share of payments, their share in pre-payments minimize to zero. Therefore, such injustices must be prevented by designing an updated information system.
Also, according to the experts, eliminating overlapping in insurance funds is achievable by the establishment of the electronic health record. In order to increase the efficiency of social insurance organizations, performance and application of resources of insurance funds should be considered and monitored. In this case, the following items can be considered:
− Determining the optimum level of population coverage;
− Determining the cost of the most effective benefit package;
− Controlling consumer moral hazard in a way that necessary demands or

165
needs are not affected;
− Controlling provider moral hazard;
− Managing the induced demand;
− Determining the optimal level of patients’ franchise and copayment when receiving health services.
Updating benefit packages and prioritizing insurance benefit packages should also be considered. For example, in covering services, service priority is identified by the insurance organization. Currently, insurance organizations cover only a fixed percentage of the costs and do not differentiate between expensive and cheap services.
• Optimal Use of Existing Resources
There are many other ways that emphasize the efficient use of the existing resources in the health sector. In other words, even if the resources of the health sector do not increase, better outcomes will be obtained by making optimal use of available resources (32). It must be noted that the efficient use of the resources available in the health sector requires all resources in the health sector. These resources include financial, human and physical resources. If the available resources are used appropriately and expenses are controlled based on systematic and evidence-based programs and according to the cost-effectiveness criteria, many resources will be allocated to the health sector from these savings and the UHC will also be achieved through these financial resources. Otherwise, resources will be distributed equally among all people and the rich and the poor use these resources equally; as a result, needy people cannot be covered completely.
It is necessary that economic aspects of the program be regarded as one of the most important decision aspects in all policies and programs made in the health sector at all levels. In other words, economic evaluation must be used in all aspects from the macro policies made in the health system to selection of therapeutic interventions for the patients. At the micro level, selection of an optimum combination and cost-effective interventions should be considered for patients. Evidence shows that one of the main causes of loss of resources in the health sector is the use of non-cost effective interventions (32, 36).
Another solution in the area of cost control is the development of clinical guidelines that will be very effective, especially for expensive services. Besides the development of clinical guidelines, the scientific committees of the hospitals can be used so that prescription of expensive services is subject to the approval of those committees. Experts have suggested this issue to improve the conditions in the short term.

166166
On the other hand, absence of an optimal combination of human resources in the structures affiliated to the MOH is one of the causes of inefficiency in the human resources and thus inefficiency in the entire health system. Making use of specialized manpower at all levels of the health system and recruiting less paid human resources with the same function for service provision would be helpful(27, 32).
It is also essential to improve the quality and quantity of skill level of the manpower. For example, in order to prescribe cost effective interventions, some training courses can be designed for healthcare practitioners. In addition, paying attention to “pay for performance” as an approach through which the employees’ motivation, quality of services, health outcomes and finally efficiency will improve seems necessary (27, 32).
Service Coverage
Concerning the covered population, two aspects should be considered: a) increasing insurance coverage so that all people will be included and b) improving insured people’s access to the health services so that all citizens have access to essential services.
• Increasing Insurance Coverage
In terms of insurance coverage, it should be noted that in addition to covering everyone in a society, injustice and inequality must be eliminated among the insured people. As mentioned earlier, there are about 20 insurance funds in Iran (3). The funds have different payments and commitments. Moreover, there are a large number of small funds (due to the low risk pooling and high costs) which decrease the effectiveness of these funds in health service financing.
Concerning the UHC, the WHO has emphasized pooling insurance funds. In addition to transparency and identification of the covered people, pooling insurance funds can improve equity and equality in using insurance payments at the time of receiving services. Pooling funds helps insurance systems reduce administrative and managerial costs of incoherent funds and result in better risk pooling; thus, fund members are protected more against financial risks (36). However, the suspicion raised by some beneficiaries is article 5-9 of the general health policies announced by the Supreme Leader, it has emphasized the strengthening of the competitive market to provide treatment insurance services. Another suspicion is the lack of necessary infrastructures for pooling funds. These people believe that a single policy must first be made for the health insurance and social security organizations and then insurance integration must be discussed if the required infrastructures are created. International experience has shown that countries have achieved the UHC in the context of a

167
single insurance system like Canada or of several active insurance funds such as Germany and Japan. Any decision made in this regard must be according to the structures governing the health system, be in association with beneficiaries, be within the framework of higher level documents and must respect the national interests. Obviously, using scientific evidences will be more helpful than before.
According to experts, low-income people in different countries have a greater share in financing the insurance funds (38). Although the method “percentage of salary or wage” implemented in the social security organization is more progressive than the per capita method, a certain percentage of poor families’ salary receives a bigger share of their financial power than the same amount for the rich families. Therefore, a mechanism of receiving the insurance fee should be more progressive.
• Increasing Access to Health Services
Another issue related to increasing the covered people is to increase people’s access to health services. Concerning continuous implementation of the health network plan, it can be said that conditions of access to health services is quite acceptable. Unfortunately, there are some failures in some cases due to the lack of appropriate infrastructures. One of the basic infrastructures for the public access is to provide high quality manpower in rural and deprived areas. People who have university education are mainly unwilling to work in deprived areas, it results in unequal access to the health services (39). Thus, policies must be applied to increase employees’ willingness to work in rural and underdeveloped areas. There are several guidelines and policies to encourage people to provide services in rural and deprived areas, they can be categorized into four “educational, legislative, financial support and personal support” groups (39, 40).
Another guideline for more access to health services is the full implementation of the referral system in the form of rationing system considered in the health network plan. Full and complete implementation of health rationing system along with the Family Physician Plan can guarantee a high level of access to the health services.
Scope of Services
One of the fundamental components of the UHC is exact definition of benefit packages considered in many countries in the field of the UHC. Different countries have tried to cover a relatively comprehensive package and provide it to the people.
Concerning experiences of various countries (table 6.2.), essential health services

168168
must be provided completely for all people. Since the health network plan emphasizes rationing system in Iran, suitable attempts have been made in the field of primary healthcare (PHC) and basic benefit packages have been provided to people in health houses and health centers in the first level. Unfortunately, benefit packages have not been defined and identified properly in higher levels. In designing the health benefit package, experiences of other countries can be considered, in this case, a suitable package can be provided so that all citizens can have good access to these services.
In the third chapter, the report of a benefit package in Iran was investigated in detail. Owing to the actions taken in this regard, according to experts, a lack of clear planning has created some problems in the field of benefit packages. In the past, some attempts were made to prepare and provide benefit package which is now available in the MOH. But these efforts must continue and the benefit package should be updated annually. Moreover, the mechanism of updating the benefit package should be specified.
As mentioned in the third chapter, a rational scientific pattern is required to design a health benefit package at different levels of the health system so as to allocate the existing resources to the health system more effectively. Prerequisites and requirements in this respect include promoting and strengthening the scientific capacities related to the capacities of evidence-based decision-making and policy-making, it, in turn, depends on a valid information system and on determination of local priorities.
In order to define the benefit package, clear criteria must first be identified and benefit packages must be specified. Concerning every service, there must be some scientific and technical abilities to evaluate these criteria. Moreover, benefit package must be defined far away from political and economic influence and those who are involved in developing this package must not be involved in the issue of interest conflict. Hence, this package should be developed based on scientific evidence. In addition, economic aspects of interventions must be considered in developing this package, covered health services must be prioritized based on cost-effectiveness studies.
Organizing Research
In some organizations outside the MOH, there is a certain structure for research in the fields related to the UHC, but no centralized structure is predicted in the MOH in this regard. In the organizations outside the MOH (e.g. insurance organizations and supporting vulnerable people), there is a certain structure for leading and managing research, it is in fact the centralized structure of research and development in those organizations. Barriers recognized in the knowledge production and knowledge utilization sections are all in the same organization

169
(although university researchers conduct research, the same organization is in charge of research process stewardship). Concerning the MOH, barriers available in the knowledge production sector related to the UHC are out of control of the MOH.
Evidence shows that one of the major causes of dissolving research structures both inside and outside the MOH is that these structures have not achieved the determined goals. Therefore, leadership and management of newly formed research structures in the field of the UHC must try to succeed and must measure and document its success level and method. Considering the existing obstacles, an important question which must be though about is that “what should we do in order not to change the research structures and capacities of the organizations when the management changes?”
Another important point is to consider the fact that although it is seriously recommended that identified intervention coverage must increase instead of identifying new interventions (in this case, the gap between scientific evidence and what is done can be filled), some local research must be conducted on some issues such as studies related to identification of problems and their severity, the economic studies and studies related to the implementation of interventions in Iran because whatever has been done in other countries does not meet our needs.
Some general guidelines have been presented in order to improve the production process and application of research to improve the UHC. In 2013, the WHO proposed the following suggestions to use research to move towards the UHC (22):
• Determining research priorities in the field of the UHC;
• Strengthening research capacities;
• Determining standards for conducting research;
• Translating knowledge into policy and performance;
• Ensuring the public participation in and understanding of research.
Actions proposed to support research in the field of the UHC in national and international levels:
• Monitoring Research;
• Coordinating research and information exchange;
• Financing for research;
• Managing health research custodian.
Although, these strategies are correct and proper, they must be used along with strategies that target the barriers identified in Iran. Some of these strategies include promoting the use of research after making decisions and selecting

170170
policies in the organization and guiding organizations to document and prepare a standard protocol for a research process. It must be noted that the procedure “promotion of producing evidence for the decision” will be effective when there is a mechanism in organizations to correct decisions and policies based on the results obtained from the research.
Quality of Services
Quality of services is one of the issues related to the service overage which must be taken into account. What is important about the quality is that it is difficult to define this term, there is no agreement on its definition and it is hard to measure and evaluate it. On the other hand, a positive aspect of the quality is that it has no end and it can always improve.
In Iran health system, health policymakers have emphasized the improvement of the quality of services; various programs have been proposed to improve the quality of services, particularly hospital services. According to previous actions and experiences of other countries, this section provides suggestions and strategies to improve the quality of services of Iran health system. It should be noted that improving the quality must be considered at all levels, from prevention to treatment and rehabilitation.
The first step which can be recommended in improving the quality of services is the efforts to develop indicators and benchmarks to measure the quality at different levels of health services. According to these indices, a standard level can be determined, accordingly, health service providing organizations can be evaluated. In developing these indicators, conditions of different health service providing organizations should be considered as much as possible. It also seems that informing the society and policymakers of the results of the evaluation of the quality of services can play a good role in promoting the culture of quality.
To establish a reward and punishment mechanism, service providers can be paid based on the assessed quality. This has also been considered in article 7-9 of the general health policy, the Supreme leader has emphasized the correction of a quality-based payment system.
Developing clinical guidelines is a measure which protects people financially and helps improve the UHC in the field of quality. Hence, predicting a mechanism to develop and update these guidelines should be considered. Position and role of quality of services have been completely explained in the chapter four of this report.
Finally, concerning the weaknesses, strengths and challenges in the area of health, the most important actions needed to achieve the UHC in the Islamic Republic of Iran (according to experts, as well as the experiences of other countries) are shown in Figure 6.2. as a pattern for achieving the UHC in Iran.

171
Fig. 2: pattern of achieving the universal health coverage in
Health system
- Figure 2. pattern of achieving the universal health coverage in Iran
-Exact implem
entation of the leveling system
in presenting health services -Fair and equitable distribution of health facilities and m
anpower in
various parts of the country -M
aking use of cheaper m
anpower w
ith the same
functions in presenting services -U
sing clinical guidelines to im
prove the quality of services and m
aking optimal use of
resources
Delivering services
- Increasing production, em
ployment, econom
ic growth and econom
ic stability -
Reducing dependence on oil revenues -
Improving the transparency and efficiency of Iran tax system
s -
Promoting and strengthening the existing social security structures
- Im
proving Iran information infrastructures
- Increasing and stabilizing governm
ental resources allocated to the health sector - Explaining and paying attention to the health in all policies
Population coverage
Services coverage
Financial protection
خدمات UH
C O
bjectives
Financing
-Production of hum
an resources based on health needs -H
ealth-oriented staff training -Paying operational attention to the concept “H
ealth Technology A
ssessment” in
producing and im
porting medicines
and medical
equipment
-producing strong evidence through scientific research in the field of U
HC
Creating resources
-Clear orientation in the field of the pattern of achieving U
HC
-Stability in policies and preventing individual orientation in m
aking policies -Evidence-based policym
aking -Form
ulation and implem
entation of policies with
regard to the role of different beneficiaries, structures and existing context and econom
ic, social and cultural aspects of program
s -Im
provement of planning and inter-sectoral
collaboration -U
nified tariff setting for public and private sectors and supervising it
Stewardship
-Determ
ining and updating benefit packages using a scientific m
ethod and paying attention to criteria such as cost-effectiveness -Prioritizing services w
ith regard to the role of various beneficiaries, especially service purchasers -D
etermining contractual arrangem
ents and optim
al payment m
echanisms to
promote efficiency and access
Purchasing
-Unified policym
aking and Integration of several insurance organizations -Exact identification of covered population -M
andatory health insurance -D
etermination of prepaym
ents progressively -Im
plementation of electronic health
record -Identification of new
resources, such as new
tax bases
Collecting and Pooling
Health System
Figure 6.2

172172
Conclusions and Recommendations for the Future
Experience of many developing countries such as Brazil, Turkey, Mexico and Rwanda has shown that achieving the UHC is not limited to the developed countries and developing countries can plan to achieve it too.
Fortunately, there are some programs in Iran and developing programs have, to some extent, met the needs for macro programs, moreover, the UHC is one of the issues which has recently been taken into account by the policymakers. However, a challenge existing in these programs is that sometimes the executive mechanism of detailed plans and programs is not predicted well. Hence, it is suggested that the mechanism of operationalizing macro plans must be predicted in relation to the universal health coverage.
It seems that the most important issues that must be considered to establish the UHC Iran in the Sixth Development Plan include:
Emphasizing unified stewardship in the MOH; Emphasizing general health policies announced by the Supreme Leader; Reforming the payment system and planning to eliminate the fee payment system; Paying attention to the integrated health information system; Determining policy and orientation towards insurance; Inter-sectoral cooperation between all relevant organizations; Emphasizing social factors affecting health; Separating policy-makers, providers and service purchasers; Attempting to unify public and private tariffs;
Planning to determine research priorities and strengthening research capacity.
What must be considered about these guidelines is that there is not a single path to achieve the UHC and that it has a gradual trend. As discussed earlier, the UHC can be obtained in different ways and forms. However, the similar thing in all of these cases is the necessary evidence-based actions and steps taken to improve all aspects of the UHC.
Based on the experiences of different countries, it must be stated that the UHC can be achieved through different financing models; the point here is that pooled fund is a prerequisite for all successful cases in this regard. The political will to achieve the UHC and the main power beyond all actions are some actions taken to increase pooled funds share. Experience of countries which have achieved the UHC shows that public financing and insurance play a key role in these countries, while private financing and OOP play a small role in these countries.
What is certain is that the appropriate actions to achieve the UHC by reducing OOP will result in justice and reduction of the gap between the rich and the poor in having access to services and in improving health indicators, as a result, Iran will step in a sustainable development path.
173
References
1. Center of Statistics and Strategic Information of Ministry of Cooperatives, Labour and Social Welfare, Statictical. Special Issue of Social Security Weak, Tehran: Center of Statistics and Strategic Information Publication, 2014. [in Persian]
2. Ghesemi F. Ministry of Cooperatives, Labour and Social Welfare Statictics 2012. Tehran: of Cooperatives, Labour and Social Welfare. 2012. [in Persian]
3. Oliyaimanesh A. National Health Account Islamic Republic of Iran 2008. Tehran: Sarneveshsazan Publication. 2012. [in Persian]
4. World Health Organization. World health statistics 2014: World Health Organization, 2014.
5. Kavosi Z, Rashidian A, Pourreza A, Majdzadeh R, Pourmalek F, Hosseinpour AR, et al. Inequality in household catastrophic health care expenditure in a low-income society of Iran. Health Policy and Planning 2012,27(7):613-23.
6. Karami M, Najafi F, Karami Matin B. Catastrophic health expenditures in Kermanshah, west of Iran: magnitude and distribution. Journal of Research in Health Sciences 2009,9(2):36-40.
7. Amery H, Jafari A, Panahi M. Determining the Rate of Catastrophic Health Expenditure and Its Influential Factors on Families in Yazd Province. Journal of Health Administration. 2013,16(52):51-60 [in Persian]
8. Asefzadeh S, Alijanzadeh M, Gholamalipour S, Farzaneh A. Households Encountering with Catastrophic Health Expenditures in Qazvin, Iran. Health Information Management. 2013,10(1):1-8 [in Persian]
9. Ameri H, Vafaie H, Alizadeh H, Ghiasi A, Shmayan Razavi N, khalfy A. Determining households exposure to Catastrophic Health Expendicher in Househols of Torbat Heydariyeh University of Medical Sciences: 2013. Journal of Torbat Heydariyeh University of Medical Sciences. 2014,1(2):46-54 [in persian]
10. Sabermahani A, Nooraee-motlagh S, Vaeze Mahdavi M, Hadian M, Asadi-Lari M. Catastrophic health expenditures and its determinants among households in Tehran in 2011 , Urban HEART-2 study. Razi Journal of Medical Sciences. 2014,21(126):15-26 [in Persian]
11. Kavosi Z, Keshtkaran A, Hayati R, Ravangard R, Khammarnia M. Household financial contribution to the health System in Shiraz, Iran in 2012. International Journal of Health Policy and Management 2014,3(5):243.
12. Rezapour A, Ghaderi H, Azar FE, Larijani B, Gohari MR. Effects of Health Out-of-Pocket Payment on households in Iran, Catastrophic and Impoverishment: Population Based Study in Tehran (2012). Life Science 2013,10(3):1457-69.
13. Ghafoori MH, Azar FE, Arab M, Mahmoodi M, Zadeh NY, Rezapour A. The Distribution of Health Expenditures in Tehran’s Districts. Journal of Community Health Research 2014,3(2):132-44.
14. Ghoddoosinejad J, Jannati A, Gholipour K, Baghestan EB. Households encountering with catastrophic health expenditures in Ferdows, Iran. The Journal Of the Egyptian Public Health Association 2014,89(2):81-4.
15. Raghfar H, Atrkar-Roshan S, Atefi, M. Measurement of the Fair Financial Contribution Index and Catastrophic Expenditures in Different Regions of Iran, 1984-2010. Hakim Research

174174
Journal. 2013,16(3): 182-91 [in Persian]
16. Razavi SM, Hassanzadeh A, Basmenji K. Fairness in financial contribution in the health system. Tehran: Andishmand publication. 2005. [In Persian]
17. Mohammad Alizadeh H, Fazaeli AA. Situation of Iran health system financing. Journal of Social Welfare. 2003,5(19):280-300. [In Persian]
18. Mehrara M, Fazaeli AA, Fazaeli AA. Health Finance Equity in Iran: an Analysis of Household Survey Data (1382-1386). Journal of Health Administration. 2010,13(40):51-62 [in Persian]
19. Nekoeimoghadam M, Akbari-Javar M, Amiresmaili M, Baneshi M, Ganjavai S. Determining households exposure to catastrophic health expenditures and exploring its influential factors in Kerman province. Journal of Management and Medical Informatics School. 2014, 1(2):78-85 [In Persian]
20. Moghadam MN, Banshi M, Javar MA, Amiresmaili M, Ganjavi S. Iranian household financial protection against catastrophic health care expenditures. Iranian Journal of Public Health. 2012,41(9):62.
21. Yousefi M. Households and Health Expenditures: Components, Dimensions and Determinants. Tehran: Tarbiat Modarres University, 2013 [in Persian]
22. Dye C, Reeder JC ,Terry RF. Research for Universal Health Coverage. Science translational medicine. 2013,5(199):199ed13-ed13.
23. Savedoff WD, de Ferranti D, Smith AL, Fan V. Political and economic aspects of the transition to universal health coverage. The Lancet 2012,380(9845):924-32.
24. Knaul FM, Arreola-Ornelas H, Méndez-Carniado O, Bryson-Cahn C, Barofsky J, Maguire R, et al. Evidence is good for your health system: policy reform to remedy catastrophic and impoverishing health spending in Mexico. The Lancet 2006,368(9549):1828-41.
25. Atun R, Aydın S, Chakraborty S, Sümer S, Aran M, Gürol I, et al. Universal health coverage in Turkey: enhancement of equity. The Lancet 2013,382(9886):65-99.
26. Marten R, mcintyre D, Travassos C, Shishkin S, Longde W, Reddy S, et al. An assessment of progress towards universal health coverage in Brazil, Russia, India, China and South Africa (BRICS). The Lancet 2014,9960)384 ):2164-71.
27. World Health Organization. World health report 2000: World Health Organization, 2000.
28. Rashidian A. I.R. Iran Multiple Indicator Demographic and Health Survey 2010. Tehran: Ministry of Health and Medical Education, 2012[in Persian]
29. Ibrahimipour H, Maleki M-R, Brown R, Gohari M, Karimi I, Dehnavieh R. A qualitative study of the difficulties in reaching sustainable universal health insurance coverage in Iran. Health Policy and Planning 2011,26(6):485-95.
30. Ibrahimipour H, Maleki M-R, Gohari M. Challenges of Sustainable Health Insurance in Iran. Payesh 2009,9(2):173-87[in Persian]
31. Doshmangir L, Fakhri A. Universal Health Coverage and Policy Decision to Achieve it. Tehran: Ayande Pazhuh Publications, 2014[in Persian]
32. World Health Organization. World health report 2010: World Health Organization, 2010.
33. Wonderling D, Gruen R, Black N. Introduction to health economics: mcgraw-Hill International, 2005.
175
34. Kutzin J. Health financing policy: a guide for decision-makers. Health financing policy paper Copenhagen, WHO Regional Office for Europe. 2008,24.
35. Giedion U andrés Alfonso E, Díaz Y. The impact of universal coverage schemes in the developing world: a review of the existing evidence. 2013.
36. Garrido MV, Amaro JAB, Cichietti A, Integlia D, Norderhaug IN, Valentin B, et al. Health technology assessment in Europe–overview of the producers. Health Technology Assessment and Health Policy-Making in Europe 2008:79.
37. World Health Organization. World health report 2006: World Health Organization, 2006.
38. Preker A, Carrin G, Dror D, Jakab M, Hsiao W, Arhin-Tenkorang D, et al. Rich-poor differences in health care financing. Health financing for poor people: Resource mobilization and risk-sharing. 2004.
39. World Health Organization. Increasing access to health workers in remote and rural areas through improved retention: global policy recommendations: World Health Organization, 2010.
40. Grobler L, Marais BJ, Mabunda S, Marindi P, Reuter H, Volmink J. Interventions for increasing the proportion of health professionals practising in rural and other underserved areas. Cochrane Database Syst Rev 2009,1(1).

176176