The Product Carbon Footprint of EU Beet Sugar - CEFS EXTRANET
23
A landmark research article recently published provides for the first time a detailed estimate of the carbon footprint of EU beet sugar. On that basis, it also compares the carbon footprint of beet sugar with that of cane sugar as consumed in the EU as well as starch syrups (isoglucose/ High Fructose Corn Syrup). This research also ventures beyond product carbon footprints and into other relevant agro-ecological aspects that should be taken into account when assessing the overall sustainability of sugar (from cane or beet) consumed in the EU such as an adequate management of water resources, an efficient use of available land and the role of rotational crops in developing a sustainable agriculture. www.cefs.org The Product Carbon Footprint of EU Beet Sugar Sugar Industry Journal, Issue 137 (62) March-April 2012 (by Ingo Klenk, Birgit Landquist and Oscar Ruiz de Imaña) Summary of Key Findings « «
Transcript of The Product Carbon Footprint of EU Beet Sugar - CEFS EXTRANET

Alandmark research article recently published provides for the
first time a detailed estimate of the carbon footprint of EU beet
sugar. On that basis, it also compares the carbon footprint of
beet sugar with that of cane sugar as consumed in the EU as well as
starch syrups (isoglucose/ High Fructose Corn Syrup).
This research also ventures beyond product carbon footprints and into
other relevant agro-ecological aspects that should be taken into
account when assessing the overall sustainability of sugar (from cane
or beet) consumed in the EU such as an adequate management of
water resources, an efficient use of available land and the role of
rotational crops in developing a sustainable agriculture.
www.cefs.org
The Product Carbon Footprint of EU Beet Sugar
Sugar Industry Journal, Issue 137 (62) March-April 2012
(by Ingo Klenk, Birgit Landquist and Oscar Ruiz de Imaña)
Summary of Key Findings
«
«

KEY FINDINGS
� In the EU the average distance from beet field
to factory is just 45 km as beet sugar factories
are located in the heart of rural areas.
The transport cycle of raw cane sugar to EU
refineries involves greater distances. Overall,
transport and refining represents approximately
45-61% of the total emissions of cane sugar
consumed in the EU.
� The carbon footprint range for EU beet sugar was found
to be at least similar, if not lower, than cane sugar imported
and refined in the EU. In the case of starch-based glucose
and fructose syrups (‘isoglucose’ or ‘HFCS’), the available
literature indicated a higher carbon footprint range than
EU beet sugar.
� The carbon footprint of EU beet sugar was found to
vary widely according to different carbon accounting
methodologies. Even though the same data set was used,
the use of different methodologies lead to a wide range of
results for beet sugar (i.e. 242-771 kgCO2eq/t sugar).
Cane sugar refining
32-38%
Cane sugar
transport
14-23%
1200
1000
800
600
400
200
100
0
kg
CO
2/t
su
gar
kg
CO
2/t
su
gar
242-771 642-760
640-1100
242-771
� EU Beet sugar carbon footprint
800
600
400
200
� Emissions due to direct land use change (dLUC) result from using previously
uncultivated land, rich in CO2 (e.g. forests). EU sugar beet is grown in existing
agricultural land and therefore dLUC emissions are deemed to be negligible.
Studies on cane sugar generally do not account for those emissions although
they can result in a carbon footprint that is five times higher!
EU beetsugar dLUCemissions are virtually
zero!
CANE MILL RAW SUGAR REFINERY
(Section 4 of the article on 'The Carbon Footprint of EU Beet Sugar')
(Section 5.1 of the article on 'The Carbon Footprint of EU Beet Sugar')
(Section 5.1.1 of the article on 'The Carbon Footprint of EU Beet Sugar')
(Section 2.1 of the article on 'The Carbon Footprint of EU Beet Sugar')
45 km is the averagedistance frombeet field to
factory in the EU

A short note on Methodologies:
The product carbon footprint of EU beet sugar was calculated
using a “cradle to gate” assessment. System limits were
from the cultivation of the sugar beet up to and including the
sugar factory.
The greenhouse gas emissions of the entire system were
identified and calculated using the stepwise procedure as
defined in the ISO standard 14044 for emissions accounting.
CROP ROTATION BENEFITS
Sugar beet is a rotational crop. It is only
grown in the same field once in every three to five
years and is never grown for continuous monoculture
unlike sugar cane which is generally grown on the same field
for a period of three to five years. As root crop, sugar beet plays a
key role in breaking up the common cereal-based crop rotations.
The cereal yield after beet is 10-20% higher than after two
successive years of cereals. Because sugar beet is not a host to pests
or diseases which generally affect combinable crops, the cultivation
of sugar beet reduces the level of weeds, diseases and pests and
therefore reduces the amount of pesticides applied at farm
level. Once emerged, sugar beet is less vulnerable to
climatic variations than other crops. This relatively
low year-to-year variability facilitates
farm input management.
Meet Miss Better in (www.facebook.com/MissBetter)
Miss Better is presented to you courtesy of CGB (www.cgb-france.fr)
LAND
USE EFFICIENCY
is required by beet systems compared to cane in order to produce
an equivalent amount of products with equivalent
greenhouse gas emissions
50% less land50% less land
WATER
REQUIREMENTS
Sugar beet cultivation
requires
than sugar
cane.
50% less
waterwater
(Sections 3.3 and 5.2 of the article)
(Section 7 of the article & CIBE-CEFS EnvironmentalSustainability report (2010)
(Section 7 of the article)
50% less

CEFS, founded in 1953,
represents all European beet
sugar manufacturers and
cane sugar refiners,
covering sugar production
in 20 EU countries (Austria,
Bulgaria, Belgium,
the Czech Republic,
Denmark, Finland, France,
Germany, Greece, Hungary,
Italy, Lithuania, Portugal,
Romania, the Netherlands,
Poland, Slovakia, Spain,
Sweden and the United
Kingdom) plus Switzerland.
CEFS
Comité Européen
des Fabricants de Sucre
Avenue de Tervuren 182
B-1150 Brussels
Tel: + 32 (0) 2 762 07 60
Fax: + 32 (0) 2 771 00 26
www.cefs.org
Sugar beet area
Beet sugar factory
Beet ethanol factory
Cane sugar refinery
Combined beet & cane sugar refinery
Organic & Mineral Fertiliser
Machinery operations
Limestone
Lime
Beet tops and tails
Lime kiln
Purification Diffusion Cleaning Slicing
Milk of
lime tank
Silos
Screen & pack
Clarify & filter
Filter
Crystallisation
Evaporation
Fermentation& distillation
Weighing Sampling
Unloading / storage
Fuel
Water (treated)
Low temperature heat
Separation
Molasses
Electricity
2 River
Power station
Steam
Evaporation
Thick juice storage Pulp press &
drying
Pelleting
Wash & screen
Stones Dry screen & mix
Fermenters
Seed Plant protection
Rainfall
Eva
pot
ransp
irat
ion
Irri
gat
ion
Phot
osyn
thes
is
Sunlight
SUGAR BEET
H2O CO2 O2
Soil & compost Construction Biogas Animal feed Lime fertiliser Sugar productsBioethanol Vinasse Fermentation products District heating Electricity
Source: CIBE and CEFS (after British Sugar)
From Field to Sugar Factory: the Life Cycle of EU Beet Sugar
La Réunion Guadeloupe Martinique

3
137 (62) March 2012 A 7471 E
The Product Carbon Footprint of EU beet sugar
by Ingo Klenk, Birgit Landquist and Oscar Ruiz de Imaña
Reprint from SUGAR INDUSTRY / ZUCKERINDUSTRIE 137 (2012) No. 3, 169–177, and No. 4
Verlag Dr. Albert Bartens, Berlin, Germany Bartens


1
Reprint (2012) Sugar Industry 137 | 1–17
Technology/Technologie
The Product Carbon Footprint of EU beet sugar
Die Treibhausgasbilanz von EU-Rübenzucker
Ingo Klenk, Birgit Landquist, Oscar Ruiz de Imaña
The calculations made to obtain the PCF of EU white sugar from sugar beet have revealed that the results are extremely sensitive to methodological choices and this article provides some recommendations in that regard. A comparison of EU beet sugar with two examples of raw cane sugar imported and refined in the EU, showed that the PCF range for EU refined cane sugar is on average simi-lar, if not higher (642–760 kg CO
2eq/t sugar) than the total
methodological PCF range for the EU beet sugar average case (242–771 kg CO
2eq/t sugar). A review of the published
literature revealed, on the one hand, that land use change emissions for cane sugar can be very significant but are rarely taken into account, and on the other hand, that overseas transport and refining adds a significant amount of emissions to the PCF of raw cane sugar imported into the EU. An overall land use efficiency comparison between cane and beet production systems also concluded that significantly more land (51%) is required by cane systems to produce an equivalent set of products (sugar and co-products) with an equivalent amount of GHG emissions. Finally, the limitations of PCFs as a tool to evaluate the overall environmental sustainability of EU beet sugar were also analysed.
Key words: sugar beet, white sugar, Product Carbon Footprint
(PCF), greenhouse gas (GHG) emissions, cane sugar
Berechnungen der Treibhausgasbilanz (bzw. Product Carbon Footprint PCF) von EU-Weißzucker aus Zuckerrüben ergaben, dass das Ergebnis sehr stark durch die Wahl der Methodik beein-lusst wird. Dieser Artikel enthält daher diesbezügliche Metho-dikempfehlungen. Der PCF von EU-Rübenzucker (Mittelwert) wurde mit zwei Beispielen für importiertem und in der EU rai-nierten Rohrohzucker verglichen. Es zeigte sich, dass der PCF von importiertem rainierten Rohrzucker im Durchschnitt vergleich-bar, wenn nicht sogar höher ist (642–760 kg CO
2eq/t Zucker) als
die methodisch bedingte, vollständige Ergebnisbandbreite im Falle von EU-Rübenzucker (242–771 kg CO
2eq/t Zucker). Eine
Auswertung von Veröfentlichungen zum Betref zeigte einer-seits, dass für Zuckerrohr Emissionen aus Landnutzungsän-derungen erheblich sein können, jedoch selten berücksichtigt werden; andererseits, dass Überseetransporte und Raination signiikante Anteile am PCF von in die EU importierten Rohr-rohzucker haben. Aus einem Vergleich der Flächennutzungsei-zienz von Produktionssystemen auf Basis von Zuckerrohr bzw. Zuckerüben konnte gefolgert werden, dass der Flächenbedarf von Produktionssystemen auf Basis von Zuckerrohr signiikant höher ist (51 %), um einen vergleichbaren Warenkorb an Produkten zu erzeugen (Zucker und Nebenprodukte) – dies bei Treibhaus-gasemission in vergleichbarer Höhe. Abschließend wurden die Limitierungen des PCFs bei der umfassenden Ermittlung der ökologischen Nachhaltigkeit von EU-Rübenzucker untersucht.
Schlagwörter: Zuckerrübe, Weißzucker, Treibhausgasbilanz,
Treibhausgasemissionen, Rohrzucker
1 Introduction to carbon footprints and sugar
Carbon footprints provide an estimate of the total amount of
greenhouse gases (GHG) which are emitted during the life-
cycle of goods or services. Businesses, governments and other
stakeholders use carbon footprints in order to gain an under-
standing of the emissions of GHGs from consumer products
and also companies. Product Carbon Footprints (PCFs) can be
used for diferent purposes and that in turn inluence the level
of detail, accuracy and therefore complexity required when
conducting an assessment of the GHG impact of the product1.
According to a World Bank study (Brenton et al., 2010), carbon
footprint accounting methods have undergone rapid develop-
ment over recent years, with no less than 16 diferent meth-
odologies developed or undergoing development since 2007.
hese range from nationally and internationally recognized
standards such as those based on ISO, to proprietary super-
market systems which aim to satisfy an increasing market
demand for ‘climate relevant’ information along supply chains
and towards consumers (Finkbeiner, 2009).
Carbon accounting methods difer both in approach and cal-
culation methodology. hese methodological diferences are
relected in the great variability of results from study to study
but also from data set to data set (within the same methodol-
ogy). Moreover, the diferent types of GHG emissions that can
be taken into account across a product life-cycle and the choice
of what emissions are included or not (‘system boundaries’)
can also play an important role in the inal result.
For primary food products, such as sugar, the main sources
1 The ILCD (International Reference Life Cycle Data System ) Handbook (2010) in particular distinguishes 3 main goal situations (A, B, C) related to, respectively, deci-sions based on Life-Cycle Assessments (LCAs) at a ‘micro’ level, ‘meso-macro’ level and for ‘accounting’ purposes.

2
Sugar Industry 137 (2012) Reprint | 1–17
Technology/Technologie
Table 1: Literature review for PCF of beet sugar, cane sugar and isoglucose
Source Product Region of
production
Region of use
GEMIS, version 4.2 (2004) Sugar
Unknown UnknownGEMIS, version 4.7 (2011) Sugar
Sugar, organic
British Sugar ( 2008) Beet sugar UK UK
Chappert and Toury (2011) –
Cristal Union
Beet sugar France Not relevant
(partial PCF)
Climatop (2010a), validity
1.9.2009-30.8.2010
Beet sugar Switzerland
and Germany
Switzerland
Climatop (2010b), validity
1.10.2010-30.9.2012
Beet sugar Switzerland
and Germany
Switzerland
Fereday et al. (2010) Beet sugar US Not relevant
(partial PCF)
Kägi and Wettstein (2008) Beet sugar Switzerland Switzerland
Nordic Sugar (2009) Beet sugar Northern
Europe
Not relevant
(partial PCF)
Setzer / BASF (2005) Beet sugar Germany Not relevant
(partial PCF)
Suiker Unie (2011) Beet sugar Netherlands Not relevant
(partial PCF)
Climatop (2010a), validity
1.9.2009-30.8.2010
Cane sugar Colombia Switzerland
Climatop (2010a), validity
1.9.2009-30.8.2010
Cane sugar Paraguay Switzerland
Climatop (2010b), validity
1.10.2010-30.9.2012
Cane sugar Colombia Switzerland
Climatop (2010b), validity
1.10.2010-30.9.2012
Cane sugar Paraguay Switzerland
Fereday et al. (2010) Cane sugar US? Not relevant
(partial PCF)
Hattori et al. (2008) Cane sugar SW Japan /
hailand
Japan
Kägi and Wettstein (2008) Cane sugar Colombia Switzerland
Kägi and Wettstein (2008) Cane sugar Paraguay Switzerland
Plassmann et al. (2010) Cane sugar Mauritius Not relevant
(partial PCF)
Plassmann et al. (2010) Cane sugar Zambia
Rein (2010) Cane sugar Unknown Not relevant
(partial PCF)
Seabra et al. (2011) Cane sugar Brazil Center-
South
Not relevant
(partial PCF)
Setzer / BASF (2005) Cane sugar Brazil Not relevant
(partial PCF)
Yuttiham et al. (2011) Cane sugar Eastern
hailand
Not relevant
(partial PCF)
Wiltshire et al. (2009) from
Plassmann et al. (2010)
Cane sugar Zambia Not relevant
(partial PCF)
Setzer / BASF (2005) Isoglucose
from winter
wheat
Germany Not relevant
(partial PCF)
Setzer / BASF (2005) Isoglucose
from US corn
US, dry mil-
ling process
Not relevant
(partial PCF)
Setzer / BASF (2005) Isoglucose
from US corn
US, wet mil-
ling process
Not relevant
(partial PCF)
of GHG emissions are farming, raw material processing and
transport. Land use change emissions (LUC), can also be a
significant source of emissions. GHG emissions linked to
LUC occur when a previously uncultivated area (e.g. degraded
land or forests) is converted into cultivated land (direct LUC).
A change in cultivation on existing agricultural land from
a speciic crop to another can indirectly cause a direct LUC
somewhere else (indirect LUC), if the crop being replaced is
subsequently cultivated in new and former uncultivated land.
The negative impact of this type of LUC in the increase of
emissions is largely undisputed. To agree, though, on a fair
and accurate way to calculate these emissions has proven a far
more challenging – and contentious – issue, in particular when
LUC efects are deemed to be indirect.
So far, no comprehensive attempt has been made to evaluate
the typical carbon footprint of EU beet sugar and compare the
latter with the PCF of alternative products such as imported
cane sugar or isoglucose consumed in the EU.
his paper has two main objectives: irst, to estimate the typi-
cal carbon footprint of sugar produced from sugar beet grown
in the EU based on various carbon footprinting methodologies
and secondly, to compare the derived beet sugar carbon foot-
print igures to the carbon footprints of its main alternative
products as consumed in the EU such as reined cane sugar
and glucose and fructose syrups derived from starch based on
publicly available data.
2 Literature review of published PCFs for sugar
In recent years, very diverse PCF numbers for sugar (cane- or
beet-based) have been published although the details of the
methodologies and the calculations behind those igures have
not always been made available. Therefore, this article will
focus mainly on published studies which provide a minimum
of details thus, allowing to attempt a meaningful classiica-
tion.
Existing publications on the Product Carbon Footprint (PCF)
of sugar can be divided into two categories: those assessing
the full life-cycle, i.e. from cultivation of sugar crops up to and
including the consumer use phase (further on called “cradle
to grave” assessments) and those assessing only a part of the
life-cycle, e.g. from cultivation up to and including the produc-
tion facility of the inal product such as the sugar factory or
mill (further on called “cradle to gate” assessments). White
sugar is a ready-made ingredient used for a multiplicity of
purposes and does not lead per se to speciic GHG emissions
in the use phase. In addition to the varying emissions related
to transport to diferent sugar users (through retail shops,
restaurants or the food processing industry), the multiplicity
of possible uses for sugar also makes it very diicult to iden-
tify a single appropriate and representative model for the use
phase. Maybe for that reason, “cradle to grave” data appear to
be clearly in the minority with regards to sugar (essentially
reduced to the studies of Kägi and Wettstein, 2008; Climatop,
2010 and the GEMIS database2). A compilation of method-
ological details and results can be found in Table 1.2 GEMIS is a public domain software/database for eco-balancing. GEMIS was origi-
nally developed in Germany by Öko-Institut and Gesamthochschule Kassel (GhK).
3
Reprint (2012) Sugar Industry 137 | 1–17
Technology/Technologie
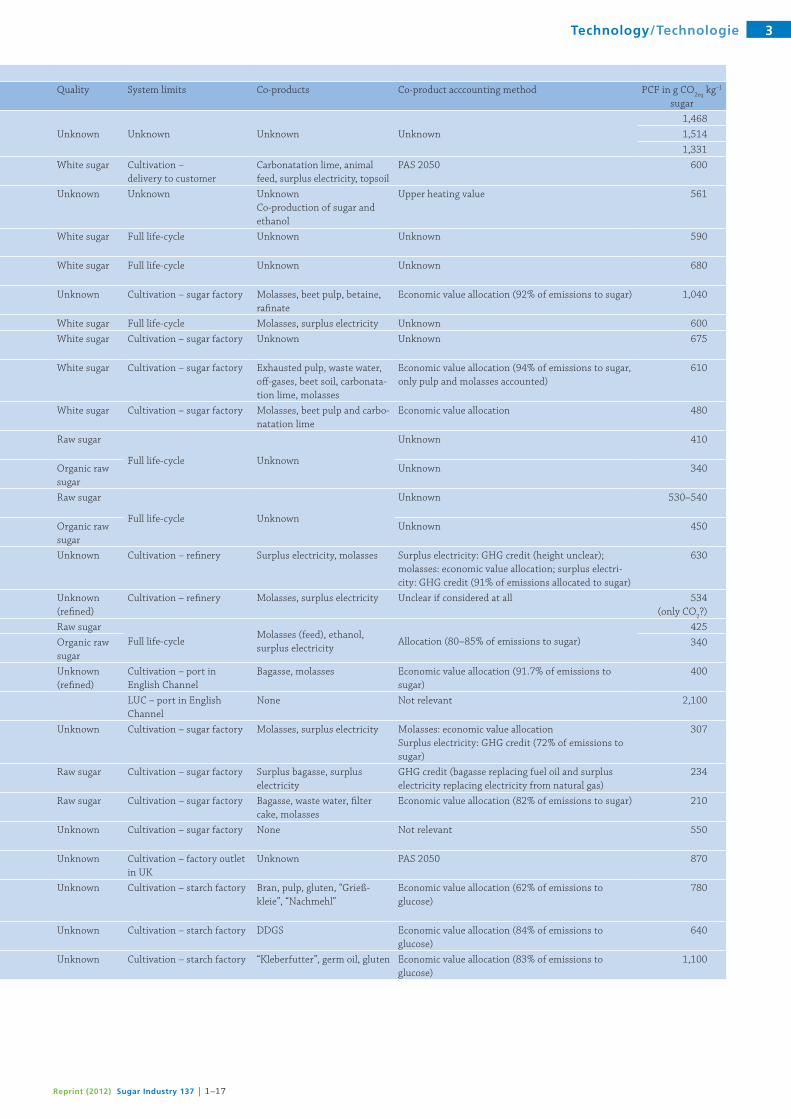
Quality System limits Co-products Co-product acccounting method PCF in g CO2eq
kg–1
sugar
Unknown Unknown Unknown Unknown
1,468
1,514
1,331
White sugar Cultivation –
delivery to customer
Carbonatation lime, animal
feed, surplus electricity, topsoil
PAS 2050 600
Unknown Unknown Unknown
Co-production of sugar and
ethanol
Upper heating value 561
White sugar Full life-cycle Unknown Unknown 590
White sugar Full life-cycle Unknown Unknown 680
Unknown Cultivation – sugar factory Molasses, beet pulp, betaine,
rainate
Economic value allocation (92% of emissions to sugar) 1,040
White sugar Full life-cycle Molasses, surplus electricity Unknown 600
White sugar Cultivation – sugar factory Unknown Unknown 675
White sugar Cultivation – sugar factory Exhausted pulp, waste water,
of-gases, beet soil, carbonata-
tion lime, molasses
Economic value allocation (94% of emissions to sugar,
only pulp and molasses accounted)
610
White sugar Cultivation – sugar factory Molasses, beet pulp and carbo-
natation lime
Economic value allocation 480
Raw sugar
Full life-cycle Unknown
Unknown 410
Organic raw
sugar
Unknown 340
Raw sugar
Full life-cycle Unknown
Unknown 530–540
Organic raw
sugar
Unknown 450
Unknown Cultivation – reinery Surplus electricity, molasses Surplus electricity: GHG credit (height unclear);
molasses: economic value allocation; surplus electri-
city: GHG credit (91% of emissions allocated to sugar)
630
Unknown
(reined)
Cultivation – reinery Molasses, surplus electricity Unclear if considered at all 534
(only CO2?)
Raw sugar
Full life-cycleMolasses (feed), ethanol,
surplus electricityAllocation (80–85% of emissions to sugar)
425
Organic raw
sugar
340
Unknown
(reined)
Cultivation – port in
English Channel
Bagasse, molasses Economic value allocation (91.7% of emissions to
sugar)
400
LUC – port in English
Channel
None Not relevant 2,100
Unknown Cultivation – sugar factory Molasses, surplus electricity Molasses: economic value allocation
Surplus electricity: GHG credit (72% of emissions to
sugar)
307
Raw sugar Cultivation – sugar factory Surplus bagasse, surplus
electricity
GHG credit (bagasse replacing fuel oil and surplus
electricity replacing electricity from natural gas)
234
Raw sugar Cultivation – sugar factory Bagasse, waste water, ilter
cake, molasses
Economic value allocation (82% of emissions to sugar) 210
Unknown Cultivation – sugar factory None Not relevant 550
Unknown Cultivation – factory outlet
in UK
Unknown PAS 2050 870
Unknown Cultivation – starch factory Bran, pulp, gluten, “Grieß-
kleie”, “Nachmehl”
Economic value allocation (62% of emissions to
glucose)
780
Unknown Cultivation – starch factory DDGS Economic value allocation (84% of emissions to
glucose)
640
Unknown Cultivation – starch factory “Kleberfutter”, germ oil, gluten Economic value allocation (83% of emissions to
glucose)
1,100
4
Sugar Industry 137 (2012) Reprint | 1–17
Technology/Technologie
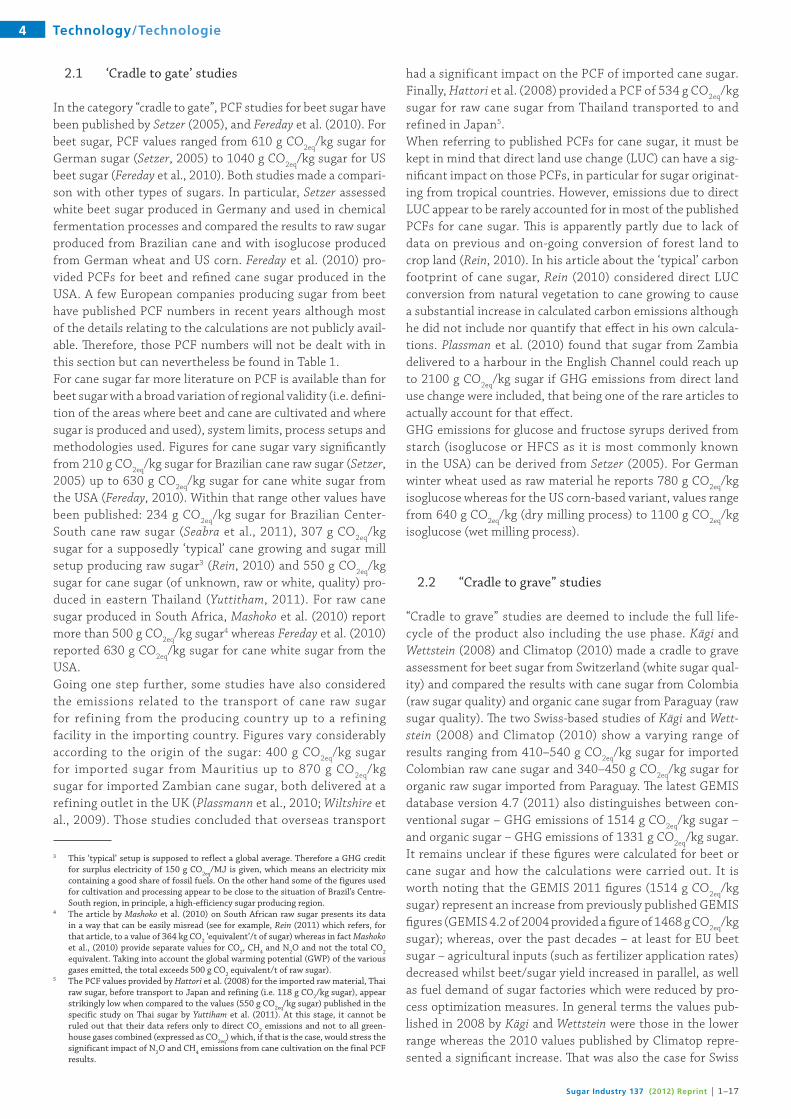
2.1 ‘Cradle to gate’ studies
In the category “cradle to gate”, PCF studies for beet sugar have
been published by Setzer (2005), and Fereday et al. (2010). For
beet sugar, PCF values ranged from 610 g CO2eq
/kg sugar for
German sugar (Setzer, 2005) to 1040 g CO2eq
/kg sugar for US
beet sugar (Fereday et al., 2010). Both studies made a compari-
son with other types of sugars. In particular, Setzer assessed
white beet sugar produced in Germany and used in chemical
fermentation processes and compared the results to raw sugar
produced from Brazilian cane and with isoglucose produced
from German wheat and US corn. Fereday et al. (2010) pro-
vided PCFs for beet and reined cane sugar produced in the
USA. A few European companies producing sugar from beet
have published PCF numbers in recent years although most
of the details relating to the calculations are not publicly avail-
able. herefore, those PCF numbers will not be dealt with in
this section but can nevertheless be found in Table 1.
For cane sugar far more literature on PCF is available than for
beet sugar with a broad variation of regional validity (i.e. deini-
tion of the areas where beet and cane are cultivated and where
sugar is produced and used), system limits, process setups and
methodologies used. Figures for cane sugar vary signiicantly
from 210 g CO2eq
/kg sugar for Brazilian cane raw sugar (Setzer,
2005) up to 630 g CO2eq
/kg sugar for cane white sugar from
the USA (Fereday, 2010). Within that range other values have
been published: 234 g CO2eq
/kg sugar for Brazilian Center-
South cane raw sugar (Seabra et al., 2011), 307 g CO2eq
/kg
sugar for a supposedly ‘typical’ cane growing and sugar mill
setup producing raw sugar3 (Rein, 2010) and 550 g CO2eq
/kg
sugar for cane sugar (of unknown, raw or white, quality) pro-
duced in eastern Thailand (Yuttitham, 2011). For raw cane
sugar produced in South Africa, Mashoko et al. (2010) report
more than 500 g CO2eq
/kg sugar4 whereas Fereday et al. (2010)
reported 630 g CO2eq
/kg sugar for cane white sugar from the
USA.
Going one step further, some studies have also considered
the emissions related to the transport of cane raw sugar
for refining from the producing country up to a refining
facility in the importing country. Figures vary considerably
according to the origin of the sugar: 400 g CO2eq
/kg sugar
for imported sugar from Mauritius up to 870 g CO2eq
/kg
sugar for imported Zambian cane sugar, both delivered at a
refining outlet in the UK (Plassmann et al., 2010; Wiltshire et
al., 2009). Those studies concluded that overseas transport
had a significant impact on the PCF of imported cane sugar.
Finally, Hattori et al. (2008) provided a PCF of 534 g CO2eq
/kg
sugar for raw cane sugar from Thailand transported to and
refined in Japan5.
When referring to published PCFs for cane sugar, it must be
kept in mind that direct land use change (LUC) can have a sig-
niicant impact on those PCFs, in particular for sugar originat-
ing from tropical countries. However, emissions due to direct
LUC appear to be rarely accounted for in most of the published
PCFs for cane sugar. his is apparently partly due to lack of
data on previous and on-going conversion of forest land to
crop land (Rein, 2010). In his article about the ‘typical’ carbon
footprint of cane sugar, Rein (2010) considered direct LUC
conversion from natural vegetation to cane growing to cause
a substantial increase in calculated carbon emissions although
he did not include nor quantify that efect in his own calcula-
tions. Plassman et al. (2010) found that sugar from Zambia
delivered to a harbour in the English Channel could reach up
to 2100 g CO2eq
/kg sugar if GHG emissions from direct land
use change were included, that being one of the rare articles to
actually account for that efect.
GHG emissions for glucose and fructose syrups derived from
starch (isoglucose or HFCS as it is most commonly known
in the USA) can be derived from Setzer (2005). For German
winter wheat used as raw material he reports 780 g CO2eq
/kg
isoglucose whereas for the US corn-based variant, values range
from 640 g CO2eq
/kg (dry milling process) to 1100 g CO2eq
/kg
isoglucose (wet milling process).
2.2 “Cradle to grave” studies
“Cradle to grave” studies are deemed to include the full life-
cycle of the product also including the use phase. Kägi and
Wettstein (2008) and Climatop (2010) made a cradle to grave
assessment for beet sugar from Switzerland (white sugar qual-
ity) and compared the results with cane sugar from Colombia
(raw sugar quality) and organic cane sugar from Paraguay (raw
sugar quality). he two Swiss-based studies of Kägi and Wett-
stein (2008) and Climatop (2010) show a varying range of
results ranging from 410–540 g CO2eq
/kg sugar for imported
Colombian raw cane sugar and 340–450 g CO2eq
/kg sugar for
organic raw sugar imported from Paraguay. he latest GEMIS
database version 4.7 (2011) also distinguishes between con-
ventional sugar – GHG emissions of 1514 g CO2eq
/kg sugar –
and organic sugar – GHG emissions of 1331 g CO2eq
/kg sugar.
It remains unclear if these igures were calculated for beet or
cane sugar and how the calculations were carried out. It is
worth noting that the GEMIS 2011 igures (1514 g CO2eq
/kg
sugar) represent an increase from previously published GEMIS
igures (GEMIS 4.2 of 2004 provided a igure of 1468 g CO2eq
/kg
sugar); whereas, over the past decades – at least for EU beet
sugar – agricultural inputs (such as fertilizer application rates)
decreased whilst beet/sugar yield increased in parallel, as well
as fuel demand of sugar factories which were reduced by pro-
cess optimization measures. In general terms the values pub-
lished in 2008 by Kägi and Wettstein were those in the lower
range whereas the 2010 values published by Climatop repre-
sented a signiicant increase. hat was also the case for Swiss
3 This ‘typical’ setup is supposed to reflect a global average. Therefore a GHG credit for surplus electricity of 150 g CO
2eq/MJ is given, which means an electricity mix
containing a good share of fossil fuels. On the other hand some of the figures used for cultivation and processing appear to be close to the situation of Brazil’s Centre-South region, in principle, a high-efficiency sugar producing region.
4 The article by Mashoko et al. (2010) on South African raw sugar presents its data in a way that can be easily misread (see for example, Rein (2011) which refers, for that article, to a value of 364 kg CO
2 ‘equivalent’/t of sugar) whereas in fact Mashoko
et al., (2010) provide separate values for CO2, CH
4 and N
2O and not the total CO
2
equivalent. Taking into account the global warming potential (GWP) of the various gases emitted, the total exceeds 500 g CO
2 equivalent/t of raw sugar).
5 The PCF values provided by Hattori et al. (2008) for the imported raw material, Thai raw sugar, before transport to Japan and refining (i.e. 118 g CO
2/kg sugar), appear
strikingly low when compared to the values (550 g CO2eq
/kg sugar) published in the specific study on Thai sugar by Yuttiham et al. (2011). At this stage, it cannot be ruled out that their data refers only to direct CO
2 emissions and not to all green-
house gases combined (expressed as CO2eq
) which, if that is the case, would stress the significant impact of N
2O and CH
4 emissions from cane cultivation on the final PCF
results.

5
Reprint (2012) Sugar Industry 137 | 1–17
Technology/Technologie
beet sugar whose footprint increased between 2008 and 2010,
from 590 to 680 g CO2eq
/kg sugar. Both for the Swiss-based
studies and the GEMIS database it remains unclear what were
the reasons for the increase in the absolute PCF igures for
those types of sugar within a relatively short time period.
It appears from the above screening of published literature that
there is signiicant variability of PCFs for sugar. hat variability
is due to multiple factors including, but not limited to, difer-
ences in product types and qualities, diferent geographical
scopes, diferent impacts being considered (e.g. for cane sugar
the inclusion or not of overseas transport or LUC), diferent
system boundaries (“cradle to gate” vs. “cradle to grave”), difer-
ent factory process setups and diferent co-product accounting
methods (e.g. GHG credits from surplus electricity). In such a
complex context, it would be clearly inappropriate to simply
take those PCFs at face value and compare them with one
another without taking into account the diferent sets of meth-
ods and assumptions underlying those calculations.
3 Methodology used in this study
Within this study, “cradle to gate” PCFs of EU beet sugar were
calculated. The system limits are from cultivation of sugar
beet up to and including the sugar factory, but excluding the
packaging, distribution and use of the sugar (see Fig. 1). Pro-
cesses in the background system such as the emissions related
to the production of fertilizers and fuel were included whereas
manufacturing and maintenance of machinery and infrastruc-
ture were not taken into account. he outputs from the ana-
lysed system are the following co-products: sugar, molasses,
wet pulp, pressed pulp, dried pulp with molasses, sugar fac-
tory lime (a liming fertilizer), beet soil, surplus electricity and
surplus heat. he functional unit on which PCF results are
expressed is one tonne of white sugar.
Data for sugar beet cultivation and transport emissions were
taken from the Biograce (2011) database. hese data are oi-
cially used within the EU renewable energy directive (RED)
to assess GHG emissions associated with bioethanol from
sugar beet and serve in the present case as a generic average of
the speciic GHG emission of sugar beet cultivation. For data
related to the sugar beet transport distances and emissions
from beet sugar production, EU average igures for the sec-
tor were used. Average EU beet sugar factory emissions were
Fig. 1: System boundaries of the analysed system
calculated based on an EU-wide study conducted by ENTEC
for the European Association of Sugar Producers (CEFS) in
2010. he data covered the period 2005–2008, which does
not fully relect the massive closure of, often less-eicient,
factories which took place throughout that period and until
the end of the last decade, as a result of the EU sugar market
reform. A base-case relecting the average emissions of EU
beet sugar production was calculated including an average
of EU beet pulp drying practices.6 Since there are sugar beet
factories either producing wet/pressed beet pulp or drying
the beet pulp, two variations of the factory setup, ‘no drying’
(scenario 1) and ‘all beet pulp is dried’ (scenario 2) were also
assessed. For details of the data used see Tables 2 to 5.
Table 3: Data used for sugar beet cultivation, sugar beet transport and as
inputs of sugar factory
Unit Amount Source
Sugar beet cultivation (Input)
Diesel L ha–1 year–1 177
Biograce
(2011)
Nitrogen fertilizer kg N ha–1 year–1 120
CaO fertilizer kg ha–1 year–1 400
Potassium (K2O) kg K
2O ha–1 year–1 135
Phosphorous (P2O
5) kg P
2O
5 ha–1 year–1 60
Pesticides kg ha–1 year–1 1.3
Seed kg ha–1 year–1 6
Field N2O emissions kg N
2O ha–1 year–1 3.27
Sugar beet cultivation (Output)
Sugar beet (clean) t ha–1 year–1 68.9 Biograce
(2011)
Dirt tare % on sugar beet 8.9 CEFS
Sugar beet (with tare) t ha–1 year–1 75.0
Beet transport
Average distance km 45 CEFS
Transport mode % road by truck 100 Assump-
tion
Spec. diesel consumption MJ t–1 km–1 0.94 Biograce
(2011)
Beet sugar factory (Input)
Process steam production
Spec. fuel consumption kWh t–1 sugar 1522 ENTEC
(2010)
Lime kiln operation
Spec. fuel consumption kWh t–1 sugar 74.2 ENTEC
(2010)
t t–1 sugar 0.0096 *
Spec. limestone consumption t t–1 sugar 0.12 ENTEC
(2010)
Fuel transport km 400 **
Limestone transport km 400 **
Pulp drier
Spec. fuel consumption kWh t–1 pulp dry
substance
1370 ENTEC
(2010)
* For lower heating value of 7.7 MJ kg–1 (GEMIS 4.5). ** Assumption (100%
by truck).
Table 2: Greenhouse warming
potential (GWP) factors used
(Source: IPCC, 2007)
GWPs (IPCC, 2007) CO2eq
CO2
1
CH4
25
N2O 298
6 Based on the EU average for the pe-riod 2005–2008 that was an aver-age production of 7% wet pulp, 31% pressed pulp and 62% dried pulp (source: estimate based on CEFS (2010) for the period 2005–2008 on the basis of a standardised dry matter content for beet pulp of, re-spectively, 13% (‘wet pulp’), 22% (‘pressed pulp’) and up to 92% (‘dried pulp’).

6
Sugar Industry 137 (2012) Reprint | 1–17
Technology/Technologie
Sugar factories produce a set of different products includ-
ing, but not limited to, sugar, beet pulp, molasses and sugar
factory lime (i.e. it is a multifunctional process). In order to
establish the PCF of the product beet sugar, at irst the total
GHG emissions of the whole system were identiied and then
followed the stepwise procedure of ISO 14044 norm for emis-
sions accounting, which can be summed up as follows:
– Step 1: Allocation should be avoided by dividing the unit
process into independent sub-processes or by expanding the
product system to include the additional functions related
to the co-products and calculating GHG credits for the co-
products (substitution method).
– Step 2: Where allocation cannot be avoided (i.e. step 1 can-
not be applied or is inadequate), the inputs and outputs
Table 5: Speciication of sugar factory outputs
Beet sugar factory (output) Dry substance
in %
Digestible
energy in
MJ kg–1 dry
substance
Lower heating
value (LHV)
in MJ kg–1
White sugar 100 16.8 16.92
Beet soil 65 0 0
Carbonatation lime 70 0 0
Molasses 80 12.29 10.4
Wet pulp 13 12.1 0.0
Pressed pulp 22 12.1 1.6
Dried pulp with molasses 92 12.1 14.5
Table 6: Sugar factory outputs and their competing products (substitutes)
Beet sugar factory (output) Competing products (substitutes) Chosen substitutes for example I Chosen substitutes for example II
White sugar Reined cane sugar Not relevant Not relevant
Beet soil Agricultural soil Not accounted for Not accounted for
Carbonatation lime Mineral lime fertilizer Mineral lime fertilizer Mineral lime fertilizer
Molasses As feed: fodder cereal (e.g. barley),
As raw material for fermentation industry: raw, thin or thick juice; cane
molasses
hick juice from sugar beet Fodder barley
Wet pulp Fodder cereal (barley, wheat); corn
whole plant for silageCorn whole plant for silage Fodder barley
Pressed pulp
Dried pulp with molasses Fodder cereal (barley, wheat); wheat
bran; citrus; corn gluten feed; lucerne
(alfalfa); spent grains (from breweries)
Fodder barley Dried lucerne (alfalfa)
Electricity Electricity from grid EU average grid intensity Marginal electricity: coal
Steam / heat Steam/heat produced by 3rd parties Not accounted for Not accounted for
of the system should be partitioned between its diferent
products or functions in a way that relects the underlying
physical relationships between them.
– Step 3: Where physical relationship alone cannot be estab-
lished or used as the basis for allocation, the inputs should
be allocated between the products and functions in a way
that relects other relationships between them. For example,
input and output data might be allocated between co-prod-
ucts in proportion to the economic value of the products.
In the present study, the authors decided to apply the most
common accounting methods across all steps (1 to 3 above) as
a way of identifying possible biases in the choice of accounting
methodologies and in order to explore the practical diiculties
and challenges associated with the implementation of some of
those accounting methods.
he irst step in the ISO hierarchy, consisting in the division
of the system into separate sub-processes, could not be imple-
mented in order to solve the multi-functionality of the pro-
duction process. System expansion (also called ‘substitution’)
was then analysed. In that context several equally adequate
substitution products could be identified for the main co-
products, which, in turn, resulted in significantly different
PCFs for sugar. his is because some of those co-products can
either be used in diferent sectors (like molasses) or – as in the
case of feed products – a group of equivalent products exists.
To show the extreme variation of results depending on the
type of substitute products selected, the authors have chosen
Table 4: Data used for sugar factory output
Beet sugar factory (output) Unit Amount Source
EU average Scenario 1
(drying of full amount of
beet pulp)
Scenario 2
(no drying of beet pulp)
White sugar t t–1 sugar beet 0.128 0.128 0.128 CEFS (2010)
Beet soil t t–1 sugar beet 0.137 0.137 0.137 CEFS (2010)
Carbonatation lime t t–1 sugar beet 0.027 0.027 0.027 Estimate
Molasses t t–1 sugar beet 0.02 0.02 0.04 Estimate
Wet pulp t t–1 sugar beet 0.03 0 0 CEFS (2010)
Pressed pulp t t–1 sugar beet 0.07 0 0.227 CEFS (2010)
Dried pulp with molasses t t–1 sugar beet 0.051 0.072 0 CEFS (2010)
thereof beet pulp t t–1 sugar beet 0.031 0.05 0 CEFS (2010)
Net electricity export kWh t–1 sugar 29.4 29.4 29.4 ENTEC (2010)
Net steam/heat export kWh t–1 sugar 2.94 2.94 2.94 ENTEC (2010)

7
Reprint (2012) Sugar Industry 137 | 1–17
Technology/Technologie
two examples of ‘substitution scenarios’ based on diferent
substitutes (for details see Table 6 and Table 7). In that con-
text, no substitute was accounted for beet soil or surplus heat
(Table 8) which, in practice, means that no emission credit was
given for those two outputs.
Table 7: Data used to calculate GHG credits
Unit Amount Source
Mineral lime fertilizer
CaO content carbonatation lime kg CaO kg–1 0.27 Bürcky and Märländer (2000)
hick juice from sugar beet
Energy demand / surplus electricity compared to
sugar beet production % 90 Assumption
Spec. thick juice production kg thick juice kg–1 sugar 1.7 Assumption
Substitutes for co-product credits: Assumption
– Beet soil: not accounted for
– Carbonatation lime: mineral lime fertilizer
– Wet pulp & pressed pulp: corn whole plant for silage
– Dried pulp: fodder barley
– Surplus electricity: EU average grid intensity
– Surplus heat/steam: not accounted for
Corn whole plant for silage
Diesel L ha–1 year–1 105
Biograce (2011)
Nitrogen fertilizer kg N ha–1 year–1 51.7
CaO fertilizer kg ha–1 year–1 1,600
Potassium (K2O) kg K
2O ha–1 year–1 25.8
Phosphorous (P2O
5) kg P
2O
5 ha–1 year–1 34.5
Pesticides kg ha-–1 year–1 2.4
Seed kg ha–1 year–1 0
Field N2O emissions kg N
2O ha–1 year–1 0.82
Corn yield t corn dry substance ha–1 year–1 7.5 Assumption
Dry substance content of corn % 35 DLG Futterwerttabellen (1997)
Digestible energy GJ t–1 corn 3.7
Fodder barley
Diesel L ha–1 year–1 100 Assumption
CaO fertilizer kg ha–1 year–1 150 Assumption
Nitrogen fertilizer kg N ha–1 year–1 98
EFMA (data for EU 15, 2004/05)Potassium (K2O) kg K
2O ha–1 year–1 28
Phosphrous (P2O
5) kg P
2O
5 ha–1 year–1 35
Pesticides kg ha–1 year–1 2.0 Assumption
Seed kg ha–1 year–1 120 Kaltschmitt and Reinhardt (1997)
Field N2O emissions kg N
2O kg–1 N applied 0.021 IPCC (2006)
Barley yield t barley ha–1 year–1 4.2 EFMA (data for EU 15, 2004/05)
Digestible energy GJ t–1 barley 11.3 DLG-Futterwerttabellen (1997)
Dried lucerne (alfalfa)
Diesel L ha–1 year–1 50 Assumption
Nitrogen fertilizer kg N ha–1 year–1 15
Hanff et al. ( 2008)CaO fertilizer kg ha–1 year–1 320
Potassium (K2O) kg K
2O ha–1 year–1 256
Phosphrous (P2O
5) kg P
2O
5 ha–1 year–1 33
Pesticides kg ha–1 year–1 0 Assumption
Seed kg ha–1 year–1 12 Peyker and Degner (1996)
Field N2O emissions kg N
2O kg–1 N applied 0.021 IPCC (2006)
Fuel for drying (diesel) GJ t–1 dried protein 41.868 COPA COGECA et.al. (2007)
Lucerne yield t lucerne dry substance ha–1 year–1 8.7
Hanff et al. ( 2008)Dry substance lucerne % 40
Protein content lucerne kg raw protein t–1 dry substance 200
Dry substance after drying % 88
Digestible energy GJ t–1 dried lucerne 7.2 DLG Futterwerttabellen (1997)
EU average grid intensity
Emission factor of grid electricity g CO2eq
kWh–1 electricity 465.1 Biograce (2011)
Marginal electricity: coal
Emission factor of coal g CO2eq
kWh–1 coal 400.61 Biograce (2011)
Power plant % 40 Assumption
Additionally, PCFs of beet sugar were also calculated by allo-
cation based on a physical criteria (step 2 of the ISO 14044
hierarchy). Four possible physical relationships could be iden-
tified and were subsequently used: mass (wet), mass (dry
substance) and energy (as digestible energy and lower heat-

8
Sugar Industry 137 (2012) Reprint | 1–17
Technology/Technologie
ing value, LHV). Surplus electricity production was assessed
homogeneously across the four allocation scenarios through
the substitution method (using EU grid average).
For the economic allocation methodology (the lowest ranked
in the ISO hierarchy) no less than 5 diferent price references
applicable to EU beet sugar were identiied (see also Fig. 2):
(1) the EU regulatory reference price for white sugar – an
oicial EU price related to a standardised estimate of EU beet
sugar production costs, (2) the EU average market price for
bulk sugar for food uses, (3) the EU average market price for
bulk sugar for non-food uses, (4) the World market price for
white sugar – as an indication of EU sugar export prices – and
inally (5) an EU-mix price that would relect a combination
of the previous three types [(2) to (4)] of sugar prices accord-
ing to the share of the diferent EU beet sugar sales (based
on public statistics for food, non-food markets and exports).
When combined with the three diferent factory settings ana-
lysed (base case, no drying of beet pulp and drying 100% of
the pulp) no less than 15 diferent PCFs for the same beet
sugar were identiied under economic allocation. All of them
are shown in the results section of this article. For co-products
other than sugar the same price was used in all variations.
3.1 Cut-of criteria, assumptions and limitations
With regard to farming operations, all N-fertilizer was
assumed to be in the form of mineral fertilizer, as there is no
publicly available igure known for the average use of organic
Table 8: Chosen substitutes
Substitute chosen
Co-product Example I Example II
Beet soil Not accounted for
Carbonatation lime Mineral lime fertilizer
Molasses hick juice Fodder barley
Wet pulp Corn whole plant
(for silage)Fodder barley
Pressed pulp
Dried pulp with molasses
(incl. pulp drying) Fodder barley Lucerne (alfalfa), dried
Surplus electricity EU grid mix Marginal electricity
(from hard coal)
Surplus heat Not accounted for
Fig. 2: A selection of different prices applicable to EU beet sugar and their
evolution throughout several years. All prices are shown in EUR/t (Source:
Data from European Commission and other public sources).
fertilizer (e.g. manure) in sugar beet cultivation in Europe. All
the basic inputs to sugar beet cultivation were included, that
is, seed, fertilisers, pesticides and diesel consumption for ield
work. Nitrous oxide, soil emissions (N2O, commonly known
as laughing gas) from farming were included according to
Biograce (i.e. 2.7% of applied N is emitted as N2O). Transport
of sugar beet and adherent soil was also accounted for, and it
was assumed that all transports are by 40-t truck. he emis-
sions related to the return of empty trucks delivering beet to
the factories were also accounted for in the Biograce data.
GHG emissions linked to LUC (land use change, direct or indi-
rect) were estimated to be negligible because all land used to
grow beet, at least in the EU, is already arable land.
With regard to factories, very small inputs were excluded. Spe-
ciically, most process chemicals used in sugar production such
as NaOH or HCl for pH correction or antifoaming agents were
assumed not to be signiicant for the overall result because
they were used only in small quantities. However, as limestone
is a processing aid used in larger amounts (approx. 2% per
tonne of beet processed), it therefore was included.7
For surplus steam, which some factories co-produce, substi-
tutes were diicult to establish, because they depend on the
local situation. Since the resulting GHG credit for surplus
steam was expected to be small as an EU average, no GHG
credit for surplus steam was calculated. Potential emissions
from water treatment systems were, on the other hand, not
taken into account because there is insuicient data available
about the diferent types of water treatment systems in opera-
tion in EU beet sugar factories.
he emission factors of the process inputs used in the calcula-
tions are listed in Table 9.
3.2 Calculation of a comparable PCF for cane sugar used for reining
For the supply of cane sugar to the EU the most common sce-
nario is the production of raw cane sugar in a tropical country,
which is then transported as bulk sugar to a reinery located
within a European harbour to produce white cane sugar. How-
ever, raw cane sugar imports that are consumed as such (i.e.
raw) constitute a diferent product and moreover represent very
limited amounts out of the total amount of sugar consumed in
Europe.8 For that reason raw cane sugar as a inal product was
not considered for the purpose of this comparison. Semi-white
sugar originating directly from cane sugar mills (‘plantation
white sugar’) is not typically consumed as such in the EU and
was also not considered to be a full substitute of crystal white
sugar (from beet or cane), notably for applications such as soft
drinks and pharmaceutical products which often require very
high purity (e.g. very low levels of ash and other plant material,
even at trace levels9), very low sugar colour levels and speciic
crystal sizes among other quality requirements.10
7 From a procedural point of view, when calculating the PCF of actual factories, the size of the emissions from inputs suspected to be ‘small’ may still need to be evalu-ated before these can be ruled out.
8 According to Eurostat data, imports of ‘raw cane sugar not for refining’ (code 1701 11 90) represented less than 4% of the total sugar consumed in the food market in the EU in 2010 (Eurostat trade database accessed in September 2011).

9
Reprint (2012) Sugar Industry 137 | 1–17
Technology/Technologie
Because raw cane sugar can be supplied from various regional
origins, two different examples were assessed: example I
(which more or less would relect import of cane sugar from
Brazil Centre-South) assumed 400 km truck transport within
the production country and 10,000 km transport by ocean
carrier to a harbour within the EU. Example II (which could
be applicable to imports of sugar from South-East Africa)
assumed only 50 km truck transport within the production
country and 5000 km transport by ocean carrier to a harbour
within the EU.
Due to the absence of an existing data set available for cane
sugar for reining in the EU (such as the ENTEC data set for
EU beet sugar), it was decided to estimate a PCF for cane sugar
used for reining in the EU based on published literature data.
For that purpose, data from Rein (2010) were used as a basis
since the latter was supposed to relect a ‘typical’ PCF for cane
sugar. It should be noted, however, that under closer examina-
tion, it appears, in particular, that some of its data relects best
performance levels in sugarcane growing and above-average
electricity exports to the grid. his assessment is particularly
relevant with regard to one major GHG emitting factor (N-fer-
tilizer and the derived N-ield emissions) and a major source of
GHG ‘credit’ (electricity put into the public grid):
– Application rate of mineral N fertilizer is assumed to be
75 kg N/ha/a by Rein (2010) whereas Yuttiham et al. (2011)
Table 9: Emission factors used
Unit Emission factor Source
Cultivation (Input)
Diesel kg CO2eq
L–1 3.14
Biograce ( 2011)
g CO2eq
MJ–1 87.64
Nitrogen fertilizer kg CO2eq
kg–1 5.88
CaO fertilizer kg CO2eq
kg–1 0.13
Potassium (K2O) kg CO
2eq kg–1 0.58
Phosphorous (P2O
5) kg CO
2eq kg–1 1.01
Pesticides kg CO2eq
kg-1 10.97
Sugar beet seeds kg CO2eq
kg–1 3.54
Corn seeds kg CO2eq
kg–1 –
Barley seeds kg CO2eq
kg–1 0.15 Kaltschmitt and Reinhardt (1997)
Lucerne (alfalfa) seeds kg CO2eq
kg–1 –
Transports
Truck for dry products g CO2eq
t–1 km–1 82.5 Biograce ( 2011)
Ship, ocean bulk carrier g CO2eq
t–1 km–1 17.6 Biograce ( 2011)
Beet sugar factory (Input)
Fuel provision and use for process
steam production g CO2eq
kWh–1 286.1 Fuel mix: ENTEC (2010), emissions factors Biograce ( 2011)
Fuel provision and use in lime kiln g CO2eq
kWh–1 414.6 Fuel mix: ENTEC 82010), emissions factors GEMIS 4.5
Limestone provision kg CO2eq
t–1 11.58 GEMIS 4.5 (only provision to market, no CO2 from burning,
since CO2 is precipitated in the process as CaCO
3 again)
Fuel provision and use in pulp drier g CO2eq
kWh–1 303.7 Fuel mix: ENTEC, 2010 Emissions factors Biograce ( 2011)
Cane sugar reinery (Input)
Fuel oil g CO2eq
kWh–1 305.9 Biograce ( 2011)
9 That is the case, for example, with the undesirable ‘Acid Beverage Floc’ formation in soft drinks due to the presence of trace elements in some sugars at a level of some parts per million (ppm). Cf. Clarke et al. (1999).
10 See for example van der Poel et al. (1998; p. 84, 98 and following): “Advanced processes
in the food industry and the development of new products have historically led to specific
and sensitive analytical methods to assess sugar quality. These have revealed that even a
small portion of less than 0.1% of additional non-sucrose substances in sugar affects the
quality of the sugar and its behaviour during storage and either industrial processing or
household use”.
have recently reported – for the situation in Eastern hai-
land (a top-three world exporter of cane sugar) N fertilizer
application rates between 19 and 939 kg N/(ha · a) (199 kg
N/(ha · a) on average). In Australia, another top-three world
cane sugar exporter, Renouf and Wegener (2007) reported
N-application rates (urea) at similar levels [167 kg N/(ha ·a)
average in Queensland with a range between 140–223 kg
N/(ha · a)]. hose N-use levels refer only to N in urea and do
not include partial N applications though ammonium sul-
phate (12 kg/ha as S) or diammonium phosphate (19 kg/ha
as P). Finally, in South Africa, Mashoko et al. (2010) reported
120 kg N/(ha · a).
– When it comes to ield emissions of N2O due to N-fertilizer
application, Rein (2010) used a speciic conversion factor
(1.325% of N in nitrogen fertilizer converted to N in N2O
emissions) derived from general IPCC guidelines. Several
studies, in particular with regard to sugarcane cultivation
in Australia (Denmead et al., 2009 and Renouf and Wegener,
2007) have shown that actual N-fertilizer conversion rates
for cane growing soils can be much higher due to the climatic
conditions and some cultural practices in sub-tropical and
tropical high-rainfall regions in which sugarcane is grown.11
In the present article, for beet sugar cultivation, the authors
made use of the EU Biograce igures which are crop-speciic
and which assume that 1.718% (a higher fraction than the
default IPCC value used by Rein) of N in nitrogen fertilizer is
converted to N in N2O emissions.
11 In particular, Denmead et al. (2010) refer to values oscillating between 2.8% and 21% of N in nitrogen fertiliser converted to N in N
2O emissions for different Australian
sites compared with a default national inventory value of 1.25%. They enunciate as possible causes the ‘climatic conditions and cultural practices in the sub-tropical and tropical high-rainfall regions in which sugarcane is grown in Australia’ as being conducive to rapid carbon and nitrogen cycling.

10
Sugar Industry 137 (2012) Reprint | 1–17
Technology/Technologie
– Although exports of surplus electricity take place – to some
extent – in some countries (see Seabra et al., 2011, for Brazil
and Hattori et al., 2008, for hailand) exports of surplus
electricity are only carried out by a certain fraction of cane
mills and only to the extent permitted by the local situation
of the mill. Rein (2010) used an average value of 20 kWh
surplus electricity/t sugarcane. Other studies (e.g. Seabra,
2011) report that in Brazil Centre-South only 100 mills –
out of a total exceeding 40012 – export electricity thus result-
ing in a regional average of 10.7 kWh/t sugarcane, therefore
Rein’s value seems to be high and not average.
hat PCF value for cane sugar was then adjusted by adding
the emissions related to the estimated transport distance to
a reining facility in Europe (local transport within Europe
was however set at zero km between the arrival port and the
reining installation) plus emissions of raw sugar reining into
white sugar derived from energy use data from Fereday et al.
(2010). For a detailed summary of the assumptions and data
used to estimate those emissions please see Table 10.
Despite their potential relevance, direct LUC efects were not
calculated or added to the base igures of Rein (2010) as the latter
relected a hypothetical situation not related to a speciic country
of origin. Indirect LUC efects lack, in any case, a suiciently
clear methodology to account for those and were therefore not
considered at this stage of their methodological development.
3.3 Beyond the carbon footprint of sugar: GHG and land use eiciencies of production systems
In multi-functional processes, where the total emissions of the
analysed system are to be shared among diferent co-products,
diferent methodological choices may signiicantly inluence the
calculated PCFs and thus result in biased comparisons between
the GHG eiciency of products. An alternative approach is to
compare the land use eiciency of producing a given amount
of a product, e.g. white sugar, under alternative production
systems (e.g. beet and cane sugar) taking into account the full
set of products generated, the total GHG emitted and the total
amount of land required by each production system.
In the case of beet and cane sugar, though, the two systems do
not produce the same kind of products and/or not in the same
amounts. Hence, the cane production system will typically gen-
12 FranceAgriMer (2011) p. 89.13 Example I (Centre-South Brazil): raw cane sugar
transport to harbour (400 km) and overseas trans-port by ship (10,000 km). Equivalent products (op-tion [a]): barley (for wet and pressed sugar beet pulp) and dried lucerne/alfalfa (for dried sugar beet pulp with molasses).
Example II (South-East Africa): raw cane sugar trans-port to harbour (50 km) and overseas transport by ship (5000 km). Equivalent products (option [b]): corn, whole plant (for wet and pressed sugar beet pulp) and barley (for dried sugar beet pulp with mo-lasses).
Table 10: Data used to calculate PCF of cane sugar delivered to EUUnit Amount Source
Example I Example II
Cane sugar production kg CO2eq
t–1
sugar
307 Rein (2010)
Fraction of cultivation / cane
transport / mill % 72 / 5 / 23 Rein (2010)
Sugar transport to harbour km 100 400 Assumption
Transport mode Truck Assumption
Sugar transport to EU harbour km 5,000 10,000 Assumption
Transport mode Ship Assumption
Sugar transport from the harbour
to EU reinery km 0 Assumption
Transport mode Truck Assumption
Spec. fuel consumption of reinery kWh t–1
sugar
794 Fereday et al. (2010)
Fuel used – Fuel oil Assumption
erate signiicant amounts of sugar, molasses and surplus elec-
tricity (the latter obtained by burning the cane ibre, bagasse)
whereas a typical beet production system will also produce,
in addition to sugar, signiicant amounts of animal feed (beet
pulp) and lime fertiliser (carbonatation lime) correlated with
a lower production of surplus electricity. In order to make a
valid comparison, the authors created two sets of ‘equivalent’
production systems (based on two diferent possible substi-
tutes for beet pulp) to compensate for those outputs produced
in greater amounts by one system or the other (see Fig. 3).13
his system comparison makes it possible to determine overall
GHG and land use eiciencies of both production systems.
Fig. 3: Diagram representing the concept of a comparison between beet
and cane production systems on the basis of the amount of land required
to produce an equivalent set of products.
4 Results
4.1 Total emissions of the deined (beet) system
he overall system emissions for sugar beet cultivation, sugar
beet transport and sugar production are shown in Table 11.
About 32% of these emissions are associated with sugar beet
cultivation, 4% with sugar beet transport and the remaining
part, about 64%, with sugar beet processing in the sugar fac-
tory (see Fig. 4). Nearly 50% of the overall GHG emissions are
due to the production of steam for the sugar factory process.
Compared with the EU average case described above, total
emissions decreased by 11% under scenario 1 (i.e. no drying
of sugar beet pulp) whereas they increased by about 7% when
assuming drying of the full amount of beet pulp produced
(scenario 2) (see Table 11).
Within sugar beet cultivation the main
contributors to GHG emissions were
N2O ield emissions (40%), nitrogen fer-
tilizer production (29%) and diesel use
(23%) (see Fig. 5).

11
Reprint (2012) Sugar Industry 137 | 1–17
Technology/Technologie
Table 11: System GHG emissions of sugar beet cultivation and beet sugar
production in kg CO2eq
t–1 sugar (before GHG credits/allocation of emissions)
EU average Scenario no
drying of beet
pulp
Scenario full
drying of beet
pulp
Beet cultivation 279.8 279.8 279.8
Beet transport 31.7 31.7 31.7
Sugar factory
– process steam production 435.5 435.5 435.5
– lime kiln operation 36.6 36.6 36.6
– drying of sugar beet pulp 101.1 163.0
Total 884.5 783.5 946.5
Fig. 4: Sugar beet growing, transport and processing: origin of GHG
emissions in CO2eq examples was mainly linked to the choice of diferent sub-
stitute products for dried beet pulp and the amount of GHG
credits associated with that choice. Hence, assuming fodder
barley as a substitute (example I) this resulted in a GHG credit
of 151 kg CO2eq
/t sugar, whilst assuming that the substitute
was dried lucerne (alfalfa) (example II) this resulted in a GHG
credit of 434,3 kg CO2eq
/t sugar. Among the various physi-
cal allocation methods, the allocation based on (wet) mass
systematically resulted in the lowest PCF for white sugar
(followed closely by allocation based on dry matter) whereas
energy allocation methods provided the highest PCF range
based on physical allocation methods.
Economic allocation, on the other hand, resulted in no less than 5
diferent PCFs for each scenario according to the diferent prices
for sugar chosen. Economic allocation methods resulted, in gen-
eral, in the highest average ranges of PCFs for white sugar. hat is
Fig. 6: PCF of white sugar from beet (EU average and 2 different beet pulp drying scenarios)
according to the substitution and physical allocation methods (the details of the background data
used are provided in Tables 12 and 13).
Fig. 5: Sugar beet cultivation: origin of GHG emissions in CO2eq
4.2 PCF of EU beet sugar
Based on the various GHG accounting methods, about a dozen
diferent PCFs for white sugar under each of the beet pulp
drying scenarios considered were obtained. Roughly half of
the PCFs obtained corresponded to substitution and physical
allocation methods as shown in Figure 6.
he large diference observed between the two substitution
explained by the generally larger share of
value captured by sugar compared to the
other co-products of the analysed system.
he details of each of the ifteen combina-
tions found are shown in Figure 7.
Table 14 summarises the range of PCF
results for EU beet sugar obtained
across all the methods analysed includ-
ing both the EU average case and the
two alternative scenarios considered for
the handling of beet pulp.
5 Discussion of beet sugar
results and comparison
with other products and
production systems
Using the preferred methodology of ISO
EN 14044:2006 for co-product account-
ing (substitution) requires making
some assumptions about the products
replaced on the market by the co-products. It is not unusual
Table 14: Ranges of PCF results for EU beet sugar obtained across all methods
PCF range white sugar in kg CO2eq
t–1 sugar
EU average case 242–748
Scenario 1 (‘no pulp drying’) 176–681
Scenario 2 (‘all pulp dried’) 311–789

12
Sugar Industry 137 (2012) Reprint | 1–17
Technology/Technologie
that more than one equivalent product exists, thus allowing
for diferent choices to be made. Within this paper only two
examples with sets of possible substitutes were assessed, but
this revealed that the result was extremely sensitive to those
choices. For the substitution examples calculated, the PCF of
white sugar from sugar beet (EU average case) ranged from
Table 12: GHG credits and allocation factors (for physical allocation) resulting from calculation
Substitution credit in kg CO2eq
t–1 sugar Allocation factor [–]
Product Example I Example II Mass Dry substance mass Digestible energy Lower heating value
EU average
White sugar n.a. 0.28 0.40 0.68 0.67
Beet soil Not accounted for 0.30 0.28 0 0
Carbonatation lime 7.4 0.06 0.06 0 0
Molasses 43.6 52.2 0.04 0.05 0.06 0.06
Wet pulp 4.8 11.2 0.06 0.01 0.01 0
Pressed pulp 21.3 49.8 0.15 0.05 0.06 0.03
Dried pulp with molasses 151.0 434.3 0.11 0.15 0.18 0.23
Electricity 13.7 29.5 Substitution method applied
Steam / heat Not accounted for Not accounted for
Total 241.8 584.5
Scenario drying of full amount of beet pulp
White sugar n.a. 0.33 0.40 0.68 0.63
Beet soil Not accounted for 0.36 0.28 0 0
Carbonatation lime 7.4 0.07 0.06 0 0
Molasses 45.5 52.2 0.05 0.05 0.06 0.06
Wet pulp n.a. n.a. n.a. n.a. n.a. n.a.
Pressed pulp n.a. n.a. n.a. n.a. n.a. n.a.
Dried pulp with molasses 212 609.9 0.19 0.21 0.25 0.30
Electricity 13.7 29.5 Substitution method applied
Steam / heat Not accounted for Not accounted for
Total 278.6 699
Scenario no drying of beet pulp
White sugar n.a. 0.23 0.40 0.68 0.74
Beet soil Not accounted for 0.25 0.28 0 0
Carbonatation lime 7.4 0.05 0.06 0 0
Molasses 88.2 104.5 0.07 0.10 0.13 0.14
Wet pulp n.a. n.a. n.a. n.a. n.a. n.a.
Pressed pulp 68.7 160.6 0.16 0.19 0.12 0.16
Dried pulp with molasses n.a. n.a. n.a. n.a. n.a. n.a.
Electricity 13.7 29.5 Substitution method applied
Steam / heat Not accounted for Not accounted for
Total 178 302
Table 13: Allocation factors (for economic allocation) resulting from calculation
Allocation factor for sugar [–] EU white reference
price
EU quota white sugar EU industrial sugar “EU-mix” price World white price
(London #5 ICE)
EU average (total system GHG emission: 885 kg CO2eq
t–1 sugar)
Average 2008 0.87 0.87 0.75 0.86 0.73
Average 2009 0.85 0.86 0.78 0.85 0.80
Average 2010 0.78 0.80 0.74 0.80 0.80
Average 2008–10 0.83 0.85 0.76 0.83 0.78
Scenario no drying of beet pulp (total system GHG emission: 783 kg CO2eq
t–1 sugar)
Average 2008 0.88 0.87 0.76 0.86 0.74
Average 2009 0.86 0.87 0.79 0.86 0.81
Average 2010 0.84 0.86 0.81 0.86 0.86
Average 2008–10 0.86 0.87 0.79 0.86 0.80
Scenario drying of full amount of beet pulp (total system GHG emission: 946 kg CO2eq
t–1 sugar)
Average 2008 0.87 0.86 0.74 0.85 0.72
Average 2009 0.85 0.86 0.77 0.84 0.79
Average 2010 0.75 0.78 0.71 0.78 0.78
Average 2008–10 0.82 0.83 0.74 0.82 0.76
300 to 643 kg CO2eq
/t sugar. It has to be assumed that with dif-
ferent assumptions diferent results would also be obtained.
Switching to physical allocation methods also provided a large
and similar range of results (242–595 kg CO2eq
/t sugar for the
EU average case). However, it was observed that for each phys-
ical allocation method (based on mass or energy) there were

13
Reprint (2012) Sugar Industry 137 | 1–17
Technology/Technologie
co-products which were not, in principle, allocated any share
of GHG emissions (e.g. electricity has no mass or contains no
energy expressed as digestible energy or lower heating value;
the amount of digestible energy or lower heating value for
beet soil or carbonatation lime is zero). his phenomenon was
partially solved in the calculations by accounting for surplus
electricity via the substitution method. Finally, beet soil was
found to have a signiicant impact on mass-based allocation
methods, accounting for about 30% of the total emissions
that were allocated to this co-product. Beet soil is, however,
a relatively unproductive input that any eicient beet sugar
production system should try to minimise to as large an extent
as possible. he use of mass-based methods for beet sugar pro-
duction – where beet soil is accounted for – can thus lead to
the paradox that an ineicient soil prevention system will lead
to a better performing PCF for sugar.
Economic value allocation, the least preferable option accord-
ing to EN ISO 14044:2006 – delivered, on the other hand,
significantly higher PCF results for white beet sugar than
those obtained with the substitution method or by allocation
Fig. 7: PCF of white sugar from beet (EU average and 2 different beet pulp drying scenarios)
according to the economic value allocation method (based on three-year average prices between
2008 and 2010). For a breakdown of results per year, please refer to Figure 8.
Fig. 8: EU average for PCF for white sugar from beet sugar when using allocation based on
economic value of the co-products. Price averages for years 2008, 2009 and 2010
based on physical relationships (range
from 645–771 kg CO2eq
/t sugar for the
EU average case). Economic allocation
thus added further complexity as the
result was found to vary significantly
with time and due to the wide range of
sugar prices that can be used (that is
especially the case for products which
can be equally sold to diferent markets
with diferent prices as it is the case for
the EU sugar market regime). Finally,
this method requires some caution, in
particular when information is com-
municated to third parties in a detailed
and transparent manner, because it may
allow the calculation of average com-
pany prices for sugar backwards from
the communicated igures.
5.1 Comparison of EU beet sugar PCFs with competing products
5.1.1 Cane sugar
he GHG emissions from cane cultiva-
tion and raw cane sugar production of
307 kg CO2eq
/t raw sugar published by
Rein (2010) were used as a basis for the
estimated PCF of raw cane sugar for
reining in the EU before transport to
the EU. After adjusting that figure to
account for transport and refining in
Europe, the resulting PCFs were 760 kg
CO2eq
/t white sugar (example I: sugar
from Centre-South Brazil) and 642 kg
CO2eq
/t white sugar (example II: sugar
from South-East Africa). his means, in
practice, that raw sugar transport to the
EU and the reining of cane raw sugar have a signiicant impact
on the PCF of imported cane sugar reined in the EU. he rein-
ing emissions represent the main addition (+243 kg CO2eq
/t
white sugar), although the overseas transport also adds a sig-
nificant amount of emissions, between 14 and 23% of the
total PCF (+88 to +176 kg CO2eq
/t white sugar) depending on
the distance.14 Although these PCF-figures reflect just two
representative examples, it can be concluded that cane sugar
reined within the EU has a PCF range (642–760 kg CO2eq
/t
sugar) which is on average higher than the total PCF range for
EU beet sugar (242–771 kg CO2eq
/t sugar) but otherwise, it is
equivalent to the highest estimated range for beet sugar (645–
771 kg CO2eq
/t sugar) based on economic value allocation.
On the other hand, it should be recalled that there are indica-
tions that the PCF for cane sugar calculated by Rein (2010)
is, at least with regard to some aspects, not a conservative
estimate but representative of some of the best practices in
14 For further background data see Table 16.

14
Sugar Industry 137 (2012) Reprint | 1–17
Technology/Technologie
the production of cane sugar. It was also observed that the
estimated emissions value for reining emissions used in this
article corresponds to the lower end of the reining emissions
range found in the literature (–7% versus Fereday et al, 2010;
–23% versus Hattori et al., 2008).
It should also be noted that direct land use changes were not
accounted for in the PCF of cane sugar estimated in this study
whereas for EU beet sugar the impact is estimated to be neu-
tral. In fact due to the reform of the EU sugar market regime,
the EU turned, during the last decade, from being a net
exporter to being a net importer of sugar. Accordingly, during
the same period, the cultivation area for sugar beet has been
reduced by around 0.5 mn ha, about 25% of the total, letting
that area free for other uses, be it cultivation of other crops or
nature conservation purposes (CIBE/CEFS, 2010). In the case
of imported cane sugar, Plassmann et al. (2010) showed that
LUC can be an issue for cane sugar cultivation where it can
have an enormous impact on the resulting PCF of cane sugar
(e.g. for Zambian sugar, 400 kg CO2eq
/t sugar without LUC,
and 2100 kg CO2eq
/t sugar including land use change). Based
on that example it is obvious that the actual PCF of imported
cane sugar can be signiicantly higher than the PCF of domes-
tic sugar produced from EU sugar beet.
5.1.2 Glucose and fructose syrups derived from starch (isoglucose / HFCS)
The only PCFs for glucose and fructose syrups that could be
obtained from publicly available sources are “cradle to gate” ig-
ures using German wheat and US corn as feedstocks to produce
isoglucose (Setzer, 2005). he resulting PCFs have a range of 640
to 1100 kg CO2eq
/t sugar equivalent. Due to the restricted infor-
mation available about the methodology used to obtain those
PCFs it is even more diicult to infer a valid conclusion when
comparing these igures with the PCF for beet sugar than when
doing so with imported cane sugar. At this stage, it can only be
observed that the average PCF range for those syrups indicates
signiicantly higher carbon footprint igures than the calculated
range of PCFs for EU beet sugar, with only a partial common zone
around the extremes of each PCF range (the highest part of the
PCF range for beet sugar and the lowest one for starch syrups).
5.2 Comparison of GHG and land use eiciencies of beet and cane sugar production systems
Based on an initial plot of land of 1 ha it was estimated an
identical production of 8.8 t of sugar from either beet or cane.
his was done only for the purpose of having a balanced com-
parison between two theoretical beet and cane systems. Actual
average EU beet sugar extraction yields are in reality far bet-
ter than the hypothesis used here.15 Different co-products
are created in diferent amounts in both cane and beet sugar
production systems (e.g. more molasses and electricity in the
cane system and more animal feed and lime fertilizer in the
beet system). In order to make a valid comparison, two equiva-
lent production systems were re-created by compensating (in
terms of land and GHG emissions) for those outputs produced
in greater amounts by one system or the other. he products
taken into consideration as well as the results of that compari-
son of equivalent systems are provided in Table 15.
From the above analysis it appears that the total direct emis-
sions of both cane and beet sugar systems are similar and
comparable but a very signiicant amount of additional land
(51% more) is required for cane production systems to fully
replace beet sugar ones, in particular due to the need for cane
production systems to compensate for the animal feed (beet
pulp) produced in the beet sugar system (see Fig. 9).
Currently about 85% of EU sugar needs (~16 mn t) are covered
by locally produced beet sugar and the balance is supplied
Table 15: Products taken into consideration as well as the results of that comparison of equivalent systems
Beet (EU average case) Cane (Rein, 2010) Additional land required /
CO2eq
emitted (beet)
Additional land required /
CO2eq
emitted (cane)
Sugar yield 8.8 t/ha 8.8 t/ha – –
Animal feed 1.9 t (wet pulp)
4.9 t (pressed)
3.5 t (dried and molassed)
– – 0.9 – 1 ha
1556 – 4355 kg CO2eq
Electricity 259 kWh 3465 kWh 1491 kg CO2eq
(EU-electricity mix)
–
Liming fertilizer 1.9 t Not leaving system – 65 kg CO2eq
Molasses 1.4 t 2.8 t 0.3 ha of barley
464 kg CO2eq
–
Total system (equivalent) emissions 9731 kg CO2eq
10,236 kgCO2eq
(average)
[range: 8323 – 12150 kg
CO2eq
]
Total system (equivalent) land use 1.29 ha 1.95 ha (average)
[range: 1.9 – 2.0 ha]
Fig. 9: A comparison of the land use efficiency of two equivalent beet
and cane systems
15 The actual yield for the EU is about 10.6 t sugar/ha (5-year average for the period 2006–2011. Source: CEFS, 2011)

15
Reprint (2012) Sugar Industry 137 | 1–17
Technology/Technologie
from imports of cane sugar. he above indings therefore sug-
gest that, in the future, an eventual shift towards a larger sub-
stitution of EU beet sugar production with cane sugar imports
into the EU will put further pressure on the global demand for
arable land. hat increased demand could, in addition, increase
the risk of land use change emissions since most uncultivated
land types, be it grassland, savannah or forest land have a
much higher carbon stock than agricultural land. On the other
hand, an increased supply of EU beet sugar in the EU market
would decrease the pressure on the global demand for land
and liberate land to supply the increasing demand for food and
feed linked to the rising global population.
6 Conclusions
he calculations made to obtain the PCF of white sugar from
sugar beet have revealed that the results are extremely sensi-
tive to methodological choices and therefore it may be diicult
to compare the actual performance of sugar products with
regard to GHG emissions via a direct comparison of published
PCFs.
he PCF range for beet white sugar (based on the EU average
case) was 300–643 kg CO2eq
/t sugar when using the substitu-
tion method, which is the preferred method for co-product
accounting according to ISO EN 14044:2006. he second pref-
erence according to this standard (allocation based on physical
relationship) delivered a similar range of 242–595 kg CO2eq
/t
sugar whilst the least preferred option according to the ISO
hierarchy (economic value allocation) delivered a range of
645–771 kg CO2eq
/t sugar. he total PCF range across all meth-
ods was therefore 242 to 771 kg CO2eq
/t sugar from sugar beet.
The results for substitution and economic value allocation
shown in this study relect only some of the possible examples
of PCFs that can be calculated for EU beet sugar. Using the
substitution approach required making assumptions about
the most suitable substitute products. he wide diference in
results observed from the two analysed examples of substitu-
tion indicates that diferent operator’s choices and assump-
tions will have a signiicant impact on the results. his in turn,
can lead to diferences in PCFs for beet sugar producers not
relecting the actual improvements in product performance
but simply diferent substitution choices. When calculating
PCFs for the EU average case, economic allocation was found
to be the allocation methodology more open to a multiplicity
of results (from the same dataset) due only to diferent choices
being made by diferent operators. he latter also raised other
issues such as the complexity of its implementation (multi-
plicity of markets/prices for EU sugar, asymmetrical changes
in the prices of sugar and co-products) and the conidentiality
of companies’ price data when PCFs are conducted at company
level.
Physical allocation methods were found to be more constant
and limited in number although some other challenges had
to be overcome. Indeed, since physical allocation methods
cannot be applied to some beet sugar co-products (notably
surplus electricity/heat and ‘sugar factory lime’) they need to
be combined with the substitution method (in a similar way as
done in the EU Renewable Energy Directive). A method lead-
ing to conservative estimates of the PCF of beet sugar would
be to use substitution with exactly defined substitutes for
surplus electricity (e.g. national/regional grid GHG intensity),
surplus heat/steam (e.g. heat/steam related emissions from a
natural gas boiler) and ‘sugar factory lime’/carbonatation lime
(e.g. mineral lime fertilizer of equivalent grade and quality).
Due to the presence of wet products among the range of pos-
sible co-products, mass allocation (on wet basis) was found
to distort the obtained results signiicantly and would not be
recommended to calculate the PCF of beet sugar. Beet soil was
found to have a signiicant impact on mass-based allocation
methods, accounting for about 30% of the total emissions that
were allocated to this co-product. Beet soil is, however, a rela-
tively unproductive input that any eicient beet sugar produc-
tion system should try to minimise to the largest extent pos-
sible. he use of mass-based allocation methods to calculate
PCFs for beet sugar production – when beet soil is accounted
for as a co-product – can thus lead to the paradox that an inef-
icient soil prevention system will lead to a better performing
PCF for sugar. For that reason mass allocation methods would
not be recommended in those circumstances where beet soil
is also accounted for. Allocation methods based on energy
(digestible energy or lower heating value) seemed to be, under
the scope of present analysis, adequate candidate methodolo-
gies to account for the emissions of EU beet sugar production
systems, such as the one considered in the present study.
Finally it should be recalled that data used for beet sugar fac-
tories represent the EU situation in 2005–2008. Meanwhile –
due to the reform of the EU sugar market regime – many of the
least eicient factories have been closed down, whereas beet
cultivation and beet sugar production have been concentrated
in the most productive sites and regions. herefore it has to be
assumed that the current EU average PCF range for EU beet
sugar would be lower than the one calculated in this study.
For cane raw sugar imported and refined in the EU it was
found that the PCF range (642–760 kg CO2eq
/t sugar) is gener-
ally higher than the PCF range for EU beet sugar (242–771 kg
CO2eq
/t sugar) if not equivalent to the highest estimated
range for beet sugar (645–771 kg CO2eq
/t sugar, based on
economic allocation). he estimated range for cane sugar does
not account however, for direct LUC efects, which can have a
signiicant impact by increasing the PCF igures for sugarcane.
According to the available data, the PCF range of glucose and
fructose starch syrups, based on a study of isoglucose pro-
duced either from European wheat or US corn (640 to 1100 kg
CO2eq
/t sugar equivalent), appeared to be higher than the PCF
range of EU beet sugar.
Table 16: GHG emission for provision of cane sugar to EU in kg CO2eq
t–1
reined cane sugar
Example I Example II
Cane cultivation 222 222
Cane transport 16 16
Cane sugar factory 70 70
Road transport to harbour 33 4
Ship transport to EU 176 88
Road transport to reinery 0 0
Reining 243 243
Total 760 642

16
Sugar Industry 137 (2012) Reprint | 1–17
Technology/Technologie
7 Beyond PCFs
PCFs are not necessarily indicators of overall environmental
sustainability of a product. This is based on the fact that
carbon footprints focus on one sole ecological impact: cli-
mate impact. Water requirements for example, although
not dealt with in this article, also vary strikingly between
crops, with sugar beet requiring, for example, half the water
needed to grow sugarcane (Gerbens-Leenes et al., 2006).
Other relevant (agro-)ecological aspects are not reflected at
all in carbon footprint figures. Sugar beet, for example, is a
key rotational crop for farmers in the EU. Grown in the same
field only every three to five years, it breaks up the common
cereal-based crop-rotations. The resulting cereal yield after
beet is 10–20% higher than after two successive years of
cereals (CIBE/CEFS, 2010). Because sugar beet is not a host
to pests or diseases which generally affect combinable crops,
the cultivation of sugar beet as a break crop also reduces
the level of weeds, diseases and pests on a given land and
therefore reduces the overall amount of pesticides applied
on the farm.
Besides methodological challenges for the calculation of PCFs
for beet sugar, further year-on-year variability of results is
to be expected due to single external factors (e.g. weather
conditions) afecting the PCFs’ values independently of actual
changes in the relative environmental performance of speciic
farmers or raw material processors. he use of PCFs at con-
sumer level – as a tool to guide consumers’ purchase decisions
towards more environmentally sustainable choices within the
sugars category of products – appears, in the light of the above
indings with regard to the uncertainty and variability of calcu-
lations, to be a signiicant challenge.
Furthermore, although greenhouse gas (GHG) accounting
using a life-cycle approach is useful for understanding the
impact of a product or a service with respect to climate change,
the suitability of PCFs for comparing the climate performance
of diferent products is questionable in particular, in light of
the results obtained with the comparison of entire produc-
tions systems for beet and cane sugar consumed in the EU.
Indeed, the comparison of production systems for beet and
cane sugar revealed, that PCFs alone do not provide the full
GHG and land use eiciency picture. he ecological impact
indicator “land use (efficiency)” is typically assessed sepa-
rately from the indicator “GHG emission / PCF”. However,
not accounting for land use eiciency (i.e. the amount of land
needed to provide a certain amount of goods) when deciding if
a product is more climate-friendly than another (i.e. just doing
so based on PCFs) could push for greater consumption of cer-
tain products while leading to an increased global demand for
land. his in turn would increase the pressure to change the
land use of previously non-cultivated land with the result of
increased global GHG emissions.
In particular, the comparison of beet and cane sugar produc-
tion systems showed that, in order to supply the EU market
with sugar and its related co-products (notably animal feed),
the demand for land would be signiicantly greater in the case
of increased supplies from cane sugar whereas direct GHG
emissions would remain similar for both cane and beet sugar
production systems.
Acknowledgements
he authors would like to thank A. Papagrigoraki for her sup-
port in the preparation and editing of this article.
References
BIOGRACE (2011): List of standard values. Version 4 and Excel Greenhouse gas emission calculation tool. Available online at http://www.biograce.net/ (accessed 22 September 2011)
Brenton, P.; Edwards-Jones, G.; Jensen, M.F. (2010): Carbon Footprints and Food Systems: Do Current Accounting Methodologies Disadvantage De-veloping Countries? The World Bank, ISBN 978-0-8213-8539-5; available online at: http://www.worldbank.org (Last accessed 1 June 2011)
Bürcky, K.; Märländer, B. (2000): Untersuchungen zum Nährstoffgehalt von Carbokalk während dessen Lagerung im Feld. Zuckerind. 125, 169–174
CEFS (2010): CEFS Sugar statistics 2010. Covering data for the previous 10 campaigns. Available online at www.cefs.org (Last accessed 6.12.2011)
CEFS (2011): CEFS Sugar statistics 2011. Available online at www.cefs.org (Last accessed 6.12.2011)
Chappert, A.; Toury, J.-C. (2011), Evaluation des impacts environnementaux de la production de sucre de betterave sur les sites de Cristal Union par une analyse du cycle de vie. Industries Alimentaires et Agricoles July / August, 46–48
CIBE/CEFS (2010): Sustainable Environmental Report: The EU Beet and Sugar Sector: A model of Environmental Sustainability. Available online at www.cefs.org and www.cibe-europe.eu.
Clarke, M.A.; Roberts, E. J.; Godshall, M.A. (1999): Acid Beverage Floc from Sugar Beets. Journal of Sugar Beet Research 36 (No. 3, July–September), 15–27
Climatop (2010a): CO2 Balance: Sugar, fact sheet, validity: 1.9.2009 –
30.8.2010, 18.3.2010. Available online from http://www.climatop.ch/downloads/E-Fact_Sheet_Pronatec_Sugar_v3.pdf (Last accessed 23.9.2011)
Climatop (2010b): CO2 Balance: Sugar, fact sheet, validity: 1.10.2010 –
30.9.2010 (renewed calculation), 20.10.2010. Available online from http://www.climatop.ch/downloads/E-Fact_Sheet_Migros_Sugar_b1.pdf (Last accessed 23.9.2011)
COPA / COGECA, C.I.D.E., Confederation Internationale de l’industrie et du commerce des Paille, Fourrage, tourbe et dérivés (2007): Die Luzerne, ein Trumpf für die Umwelt. / La Luzerne un atout pour l’Environnement. Available online from http://www.luzernes.org/docs/2007_CIDE_La%20luzerne-atout-environnement.pdf (last accessed 11.12.2011)
Denmead, O.T.; Macdonald, B.C.T.; Bryant, G.; Naylor, T.; Wilson, S.; Griffith,
D.W.T.; Wang, W.J.; Salter, B.; White, I.; Moody, P.W. (2010); Emissions of methane and nitrous oxide from Australian sugarcane soils. Agricultural and Forest Meteorology (No. 150), 748–756
DLG (1997): Futterwerttabellen Wiederkäuer. Universität Hohenheim (Ed.), Dokumentationsstelle. Unter Mitw. des Ausschusses für Bedarfsnormen der Gesellschaft für Ernährungsphysiologie und der Bundesanstalt für Alpenländische Landwirtschaft Gumpenstein; 7. erw. und überarb. Aufl.; DLG-Verlag, Frankfurt am Main 1997, ISBN 3-7690-0547-3
EN ISO 14044:2006 (2006): Environmental management – Life cycle assess-ment – requirements and guidelines. Available from http://www.iso.org/iso/iso_catalogue.htm
ENTEC (2010): EU ETS Phase III Benchmarking Project for CEFS. Unpub-lished.
Eurostat trade database accessed in September 2011. http://epp.eurostat.ec.europa.eu/portal/page/portal/external_trade/data/database).
Fereday, N.; Forber, G.; Powell, N.; Todd, M.; Midgely, C.; Nutt, T.; Girardello, S.;
Wagner, O. (2010): Assessing the carbon footprint of cane and beet sugar production. Sugar and Sweeteners, Sweetener Analyses, LMC Interna-tional Ltd, June issue. Available online at http://www.lmc.co.uk/Articles.aspx?id=1&repID=75 (Last accessed 6.12.2011)
Finkbeiner, M. (2009): Carbon footprinting opportunities and threats. The In-ternational Journal of Life Cycle Assessment 14 (No. 2), 91–94; available online at http://www.springerlink.com/content/5106170g43854187/full-text.pdf (Last accessed 6.12.2011)
FranceAgriMer (2011): L’Economie Sucrière – Campagne 2009/10. Edi-tion June 2011; available on-line at http://www.franceagrimer.fr/Projet-02/08publications/index83.htm (Last accessed 15.12.2011)

17
Reprint (2012) Sugar Industry 137 | 1–17
Technology/Technologie
Gerbens-Leenes, W.; Hoekstra, A.Y.; Meer, T.H. van der (2009): The water foot-print of bioenergy. Proc. National Academy of Sciences 106 (No. 25), 10219–10223; available online at: www.waterfootprint.org (Last accessed 6.12.2011)
Global Emission Modell for Integrated Systems (GEMIS): 2011 Global Emis-sion Model for Intergrated Systems (GEMIS), Version 4.7; available on-line at http://www.oeko.de/service/gemis/en/index.htm (Last accessed 6.12.2011)
Hanff, H.; Neubert, G.; Brudel, H. (2008): Datensammlung für die Betrieb-splanung und die betriebswirtschaftliche Bewertung landwirtschaftlicher Produktionsverfahren im Land Brandenburg – Ackerbau / Grünland-wirtschaft / Tierproduktion. Schriftenreihe des Landesamtes für Ver-braucherschutz, Landwirtschaft und Flurneuordnung Abteilung Land-wirtschaft und Gartenbau, Teltow, Großbeeren, Groß Kreutz, Güterfelde, Paulinenaue, Wünsdorf; Reihe Landwirtschaft, Band 9, Heft IV. Ed.: Min-isterium für Ländliche Entwicklung, Umwelt und Verbraucherschutz des Landes Brandenburg (MLUV) und Landesamt für Verbraucherschutz, Landwirtschaft und Flurneuordnung.
Hattori, K.; Suzuki, A.; Ebashi, T.; Ota, M.; Sato, K. (2008): The calculation of carbon dioxide emission intensity from sugarcane to refined sugar. Proc. Res. Soc. Japan Sugar Refineries Technol. 56, 29–35
IPCC (2006): Guidelines for National Greenhouse Gas Inventories. Chapter 11: N
2O emissions from managed soils, and CO
2 emissions from lime and
urea application (pdf); available online at http://www.ipcc-nggip.iges.or.jp/public/2006gl/pdf/4_Volume4/V4_11_Ch11_N2O&CO2.pdf,
IPCC (2007): Contribution of Working Group I to the Fourth Assessment Report of the Intergovernmental Panel on Climate Change. Cambridge: Cambridge University Press
Kägi, T.; Wettstein, D. (2008): Ökobilanz von Zucker. Stiftung myclimate – The Climate Protection Partnership, 28.8.2008; available online from http://ch.myclimate.org/fileadmin/documents/cms/Publications/100120_ Bilanz_Zucker_public.pdf (Last accessed 23.09.2011)
Kaltschmitt, M.; Reinhardt, G. (Ed.) (1997): Nachwachsende Energieträger – Grundlagen, Verfahren, ökologische Bilanzierung. Vieweg Verlag, ISBN 3-528-06778-0
Mashoko, L.; Mbohwa,C.; Thomas, V.M. (2010): LCA of the South African sugar industry. Journal of Environmental Planning and Management 53 (No. 6), 793–807
Peyker, W.; Degner, J. (1996): Leitlinie zur effizienten und umweltverträgli-chen Erzeugung von Luzerne und Luzernegras. Thüringer Landesanstalt für Landwirtschaft, 1. Auflage
Plassmann K.; Norton, A.; Attarzadeh, N.; Jensen, M.P.; Brenton, P.; Edwards-
Jones, G. (2010): Methodological complexities of product carbon foot-printing: a sensitivity analysis of key variables in a developing country context. Environmental Science & Policy 13 (No. 5) 393–404; avail-able online through http://www.sciencedirect.com/science/article/pii/S1462901110000316 (Last accessed 6 December 2011)
Rein, P.W. (2010): The carbon footprint of sugar. Sugar Industry / Zuckerind. 135, 427–434
Rein, P.W. (2011): Sustainable production of raw and refined cane sugar. Sug-ar Industry / Zuckerind. 136, 734–741
Renouf, M.A.; Wegener, M.K. (2007): Environmental Life Cycle Assessment (LCA) of sugarcane production and processing in Australia. Proc. Aust. Soc. Sugar Cane Technol. 29, 385–400
Seabra, J.E.A.; Macedo, I.C.; Chum, H.L.; Faroni, C.E.; Sarto, C.A. (2011): Life cycle assessment of Brazilian sugarcane products: GHG emissions and en-ergy use. Biofuels, Bioprod. Bioref. 5, 519–532; DOI: 10.1002/bbb.289
Setzer, T. (2005): Ökoeffizienz-Analyse Nachwachsende Rohstoffe zur Chemikalienherstellung am Beispiel Zucker. Masterarbeit im Studiengang Wirtschaftsingenieurwesen der Fachhochschule Mannheim
Poel, P.W. van der; Schiweck, H.; Schwartz, T. (1998): Sugar Technology. Beet and Cane Sugar Manufacture. Verlag Dr. Albert Bartens, Berlin
Wiltshire, J.; Wynn, S.; Clarke, J.; Chambers, B.; Cotrill, B.; Drakes, D.; Gittins,
J.; Nicholson, C.; Phillips, K.; Thorman, R.; Tiffin, D.; Walker, O.; Tucker, G.;
Thorn, R.; Green, A.; Fendler, A.; Williams, A.; Bellamy, P.; Ausdsley, E.; Chat-
terton, J.; Chadwick, D., Foster, C. (2009): Scenario building to test and inform the development of a BSI method for assessing greenhouse gas emissions from food. Technical annex to the final report. Report to Defra, Project Reference Number: FO0404, ADAS, UK
Yuttiham, M.; Gheewala, S.H.; Chidthaisong, A. (2011): Carbon footprint of sugar produced from sugarcane in eastern Thailand. Journal of Cleaner Production 19, 2119–2127; available online from http://www.deepdyve.com/lp/elsevier/carbon-footprint-of-sugar-produced-from-sugarcane-in-eastern-thailand-1X16yym4NX (Last accessed 6.12.2011)
L’empreinte carbone du sucre de betterave de l’U.E.
(Résumé)
Les calculs effectués pour obtenir le bilan CO2 (ou le PCF:
produits à empreinte Carbone) du sucre blanc de l’U.E. prove-
nant de betteraves ont montré que les résultats sont extrême-
ment sensibles aux choix méthodologiques. Cet article fournit
quelques recommandations à cet égard. Une comparaison
entre du sucre de l’U.E. et deux sucres bruts de canne importés
et rainés en U.E. a montré que la gamme de l’empreinte du
sucre de canne importé et rainé est, en moyenne, compara-
ble, si pas plus élevée (642–760 kg CO2eq
/t de sucre) que dans
la gamme, déterminée par la même méthode dans le sucre de
betterave de l’U.E. (242–771 kg CO2eq
/t de sucre). Une revue
de la littérature publiée a montré, d’une part, que les émis-
sions pour le sucre de canne peuvent être considérables à la
suite de changements dans l’utilisation du sol, mais sont rare-
ment prises en considération et, d’autre part, que le transport
outre-mer et le rainage ajoutent une quantité importante
d’émissions au PCF du sucre de canne importé dans l’U.E. De
la comparaison de l’eicacité de l’utilisation des sols entre les
diférents systèmes de production, on peut conclure qu’il faut
signiicativement plus de sol (51 %) pour la canne pour obte-
nir une quantité équivalente de produits (sucre et coproduits)
avec une quantité équivalente d’émissions de GES (gaz à efet
de serre). Enfin, les limitations de PCFs comme outil pour
évaluer pour évaluer la durabilité environnementale globale du
sucre de betteraves de l’U.E. ont été aussi analysés.
El balance de los gases de invernadero de azúcar de remola-
cha de la UE (Resumen)
Cálculos del balance de CO2 (Product Carbon Footprint, PCF)
de azúcar blanco de remolachas de la UE mostraron que el resul-
tado depende extremamente de la metodología seleccionada. Es
por esto que en este artículo se presentan varias recomendacio-
nes de metodología. El balance de CO2 de azúcar de remolacha
de la UE (valor medio) se comparó con dos ejemplos de azúcar
crudo importado y reinado en la UE. El balance de CO2 del azú-
car importado y reinado, en promedio, fue similar hasta mayor
(642–760 kg CO2eq
/t azúcar) que el balance de CO2 del azúcar
producido y reinado directamente en la UE (242–771 kg CO2eq
/t
azúcar). Un análisis de las publicaciones al respecto mostró, por
uno, que las emisiones, originadas de cambios del uso de campos,
pueden ser considerables pero normalmente no se las toma en
cuenta, y, por otro, que el transporte de ultramar y la reinación
producen mayores valores de CO2 del azúcar importado. Una
comparación de la eicacia del aprovechamiento de áreas cultiva-
dos con caña de azúcar y con remolachas azucareras mostró que
para el cultivo de caña de azúcar, la producción de azúcar y de sub-
productos se requiere un poco más área (51 %), pero se obtiene
la misma emisión de gas invernadero como con la producción de
remolachas azucareras. Finalmente se estudiaron la limitaciones
del balance de CO2 como instrumento para la determinación de la
persistencia ecológica de azúcar de remolacha de la UE.
Author’s addresses: Ingo Klenk, Südzucker AG, Germany;
Birgit Landquist, Nordic Sugar, Denmark; Oscar Ruiz De Imaña,
Deputy Director-General, CEFS (Comité Européen des Fabri-
cants de Sucre), Av. de Tervuren 182, 1150 Brussels, Belgium;
e-mail: [email protected]