The premium mining player - Vale.com · “eventsThis press or results release. All may statements,...
71
The premium mining player
-
Upload
truongphuc -
Category
Documents
-
view
215 -
download
0
Transcript of The premium mining player - Vale.com · “eventsThis press or results release. All may statements,...

The premium mining player
Dis
clai
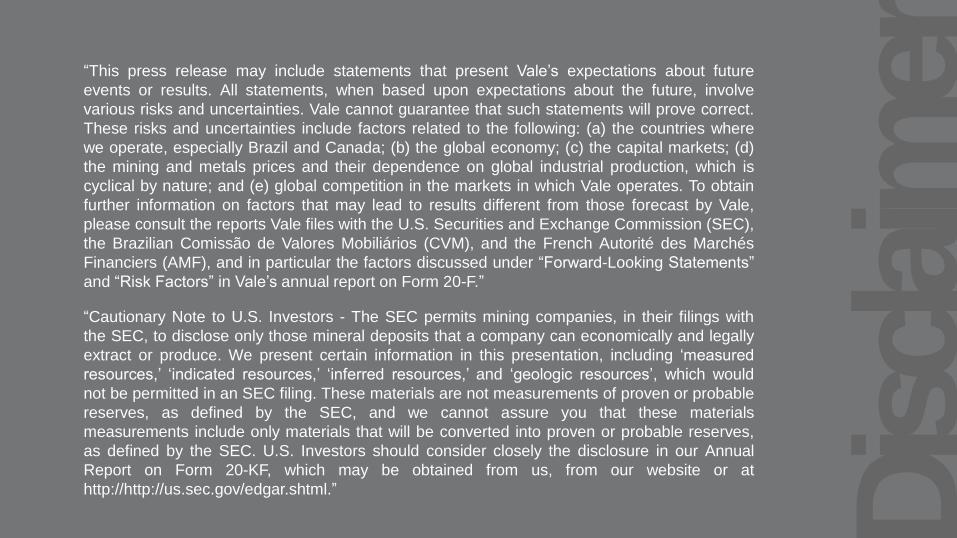
mer“This press release may include statements that present Vale’s expectations about future
events or results. All statements, when based upon expectations about the future, involve
various risks and uncertainties. Vale cannot guarantee that such statements will prove correct.
These risks and uncertainties include factors related to the following: (a) the countries where
we operate, especially Brazil and Canada; (b) the global economy; (c) the capital markets; (d)
the mining and metals prices and their dependence on global industrial production, which is
cyclical by nature; and (e) global competition in the markets in which Vale operates. To obtain
further information on factors that may lead to results different from those forecast by Vale,
please consult the reports Vale files with the U.S. Securities and Exchange Commission (SEC),
the Brazilian Comissão de Valores Mobiliários (CVM), and the French Autorité des Marchés
Financiers (AMF), and in particular the factors discussed under “Forward-Looking Statements”
and “Risk Factors” in Vale’s annual report on Form 20-F.”
“Cautionary Note to U.S. Investors - The SEC permits mining companies, in their filings with
the SEC, to disclose only those mineral deposits that a company can economically and legally
extract or produce. We present certain information in this presentation, including ‘measured
resources,’ ‘indicated resources,’ ‘inferred resources,’ and ‘geologic resources’, which would
not be permitted in an SEC filing. These materials are not measurements of proven or probable
reserves, as defined by the SEC, and we cannot assure you that these materials
measurements include only materials that will be converted into proven or probable reserves,
as defined by the SEC. U.S. Investors should consider closely the disclosure in our Annual
Report on Form 20-KF, which may be obtained from us, from our website or at
http://http://us.sec.gov/edgar.shtml.”
Fabio SchvartsmanCEO
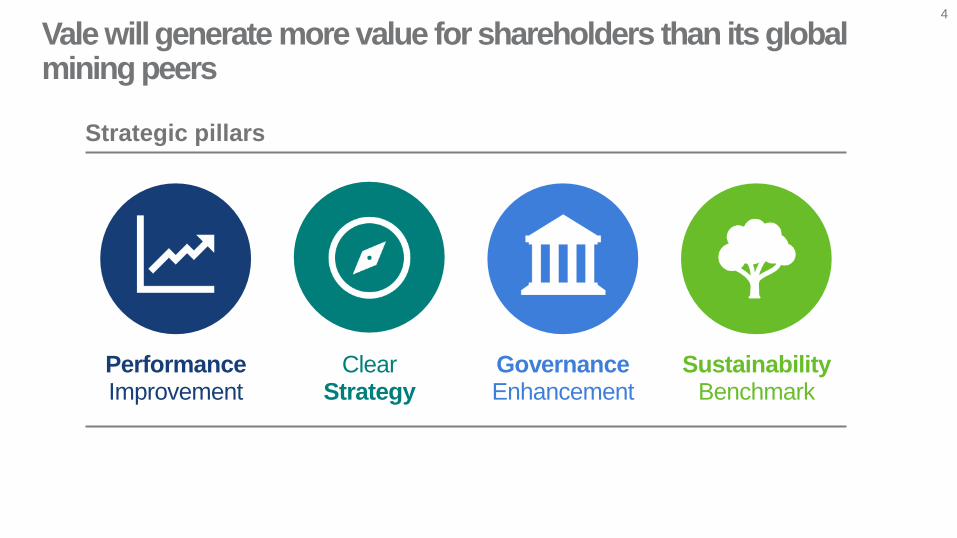
Vale will generate more value for shareholders than its global mining peers
4
Strategic pillars
Performance Improvement
GovernanceEnhancement
ClearStrategy
SustainabilityBenchmark
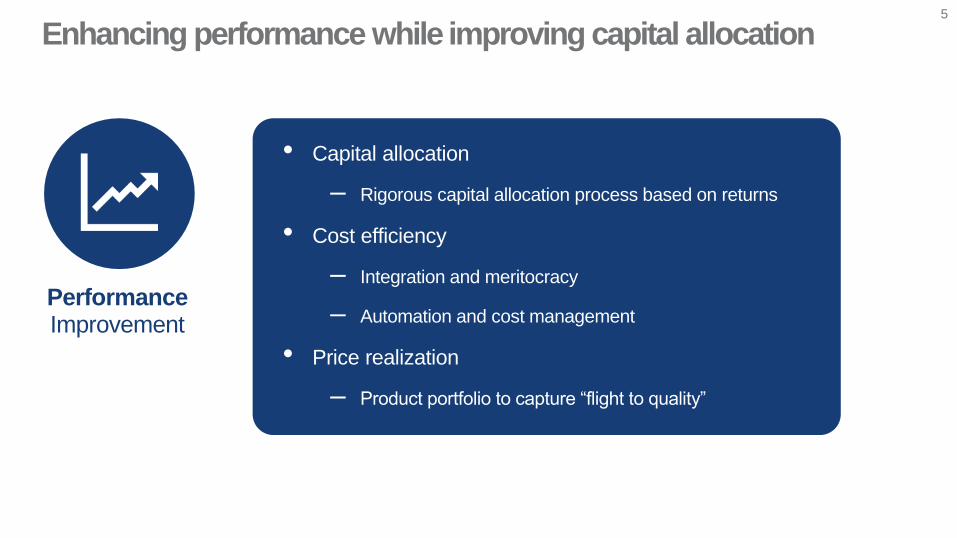
• Capital allocation
– Rigorous capital allocation process based on returns
• Cost efficiency
– Integration and meritocracy
– Automation and cost management
• Price realization
– Product portfolio to capture “flight to quality”
5
Performance Improvement
Enhancing performance while improving capital allocation
6
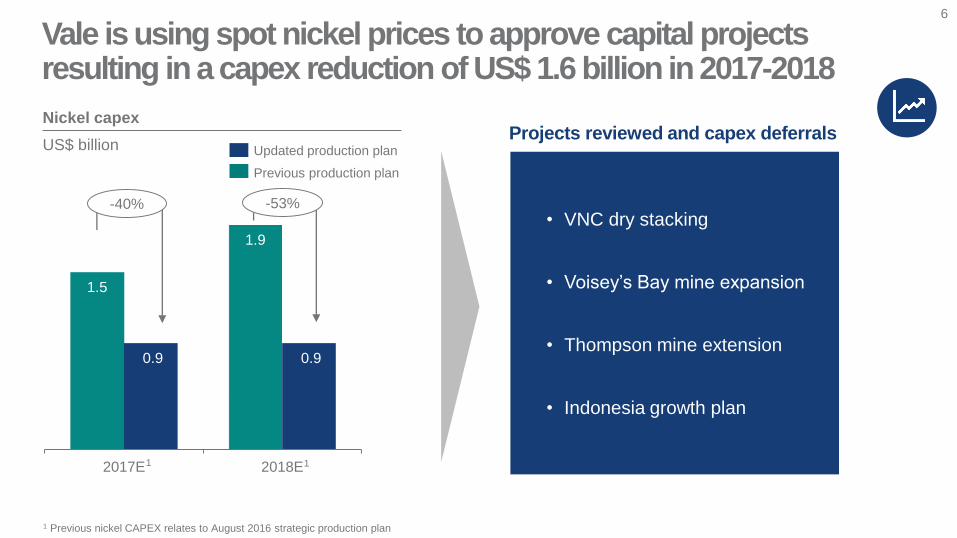
1.5
1.9
0.9 0.9
2017E 2018E
Nickel capex
US$ billion
-53%
Vale is using spot nickel prices to approve capital projects resulting in a capex reduction of US$ 1.6 billion in 2017-2018
-40%
Updated production plan
Previous production plan
• VNC dry stacking
• Voisey’s Bay mine expansion
• Thompson mine extension
• Indonesia growth plan
Projects reviewed and capex deferrals
1
1 Previous nickel CAPEX relates to August 2016 strategic production plan
1
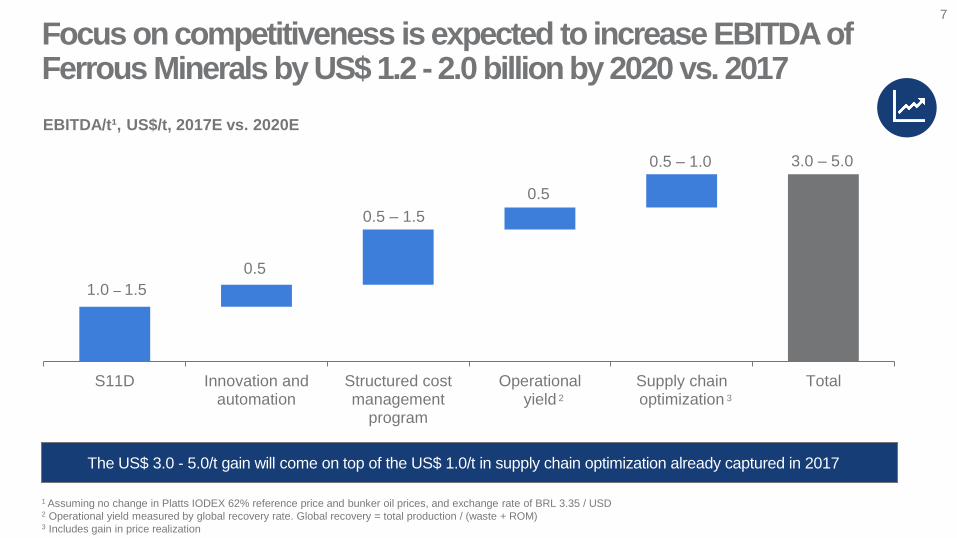
0.5
0.5 – 1.5
1.0 – 1.5
0.5
0.5 – 1.0 3.0 – 5.0
S11D Innovation andautomation
Structured costmanagement
program
Operationalyield
Supply chainoptimization
Total
7
EBITDA/t¹, US$/t, 2017E vs. 2020E
The US$ 3.0 - 5.0/t gain will come on top of the US$ 1.0/t in supply chain optimization already captured in 2017
Focus on competitiveness is expected to increase EBITDA of Ferrous Minerals by US$ 1.2 - 2.0 billion by 2020 vs. 2017
1 Assuming no change in Platts IODEX 62% reference price and bunker oil prices, and exchange rate of BRL 3.35 / USD2 Operational yield measured by global recovery rate. Global recovery = total production / (waste + ROM)3 Includes gain in price realization
32
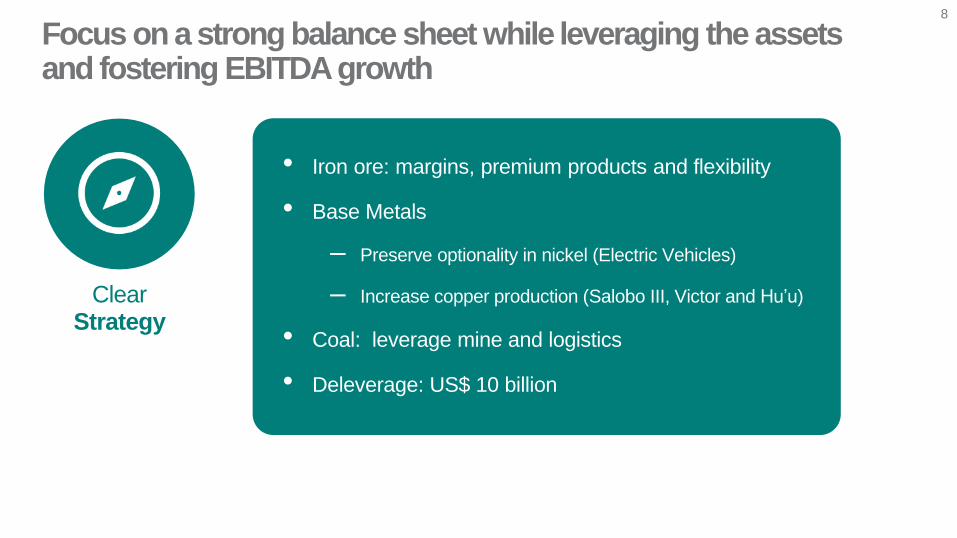
• Iron ore: margins, premium products and flexibility
• Base Metals
– Preserve optionality in nickel (Electric Vehicles)
– Increase copper production (Salobo III, Victor and Hu’u)
• Coal: leverage mine and logistics
• Deleverage: US$ 10 billion
8
ClearStrategy
Focus on a strong balance sheet while leveraging the assets and fostering EBITDA growth
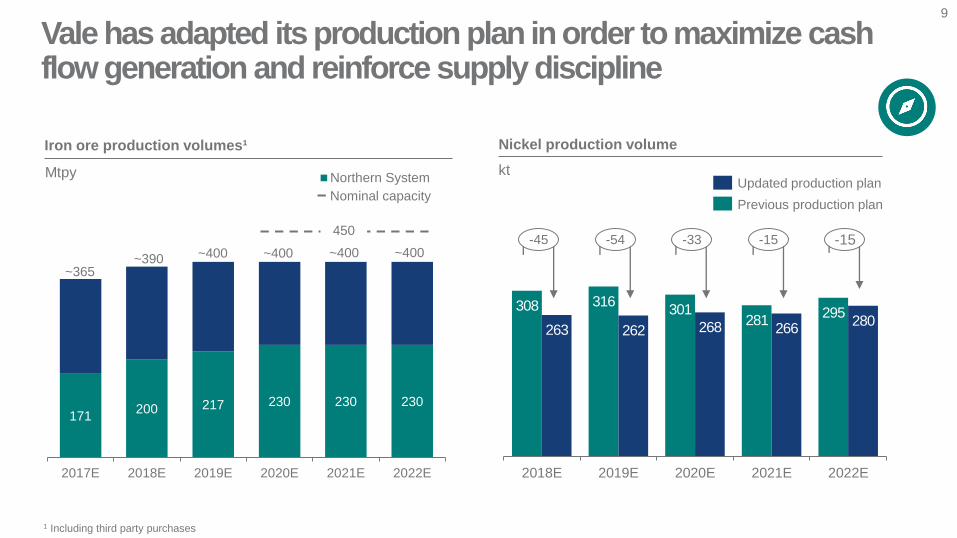
171200 217 230 230 230
2017E 2018E 2019E 2020E 2021E 2022E
Northern System
~365~390 ~400 ~400~400 ~400
450
Iron ore production volumes¹
Mtpy
9
Nominal capacity
1 Including third party purchases
Vale has adapted its production plan in order to maximize cash flow generation and reinforce supply discipline
Updated production plan
Previous production plan
Nickel production volume
kt
308 316301
281295
263 262 268 266280
2018E 2019E 2020E 2021E 2022E
-45 -54 -33 -15 -15
10
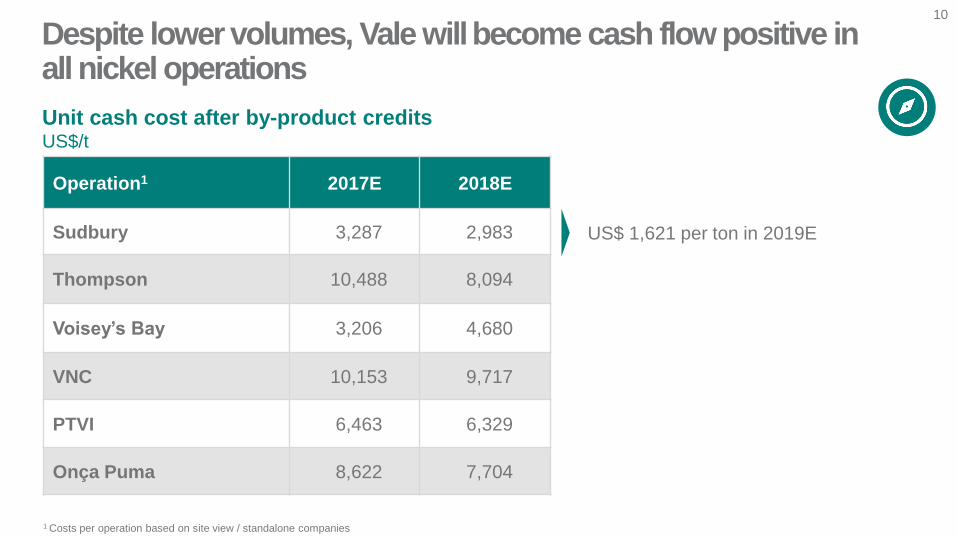
Operation1 2017E 2018E
Sudbury 3,287 2,983
Thompson 10,488 8,094
Voisey’s Bay 3,206 4,680
VNC 10,153 9,717
PTVI 6,463 6,329
Onça Puma 8,622 7,704
1 Costs per operation based on site view / standalone companies
Unit cash cost after by-product creditsUS$/t
Despite lower volumes, Vale willbecome cash flow positive in all nickel operations
US$ 1,621 per ton in 2019E
• December 22nd, 2017: important date for Vale
• Transformation of Vale into a corporation
• Two independent board members
• Re-rating
11
GovernanceEnhancement
Better governance and Novo Mercado
• Focus on systematic planning and execution
• Beyond Vale’s operations
12
SustainabilityBenchmark
Sustainability
13
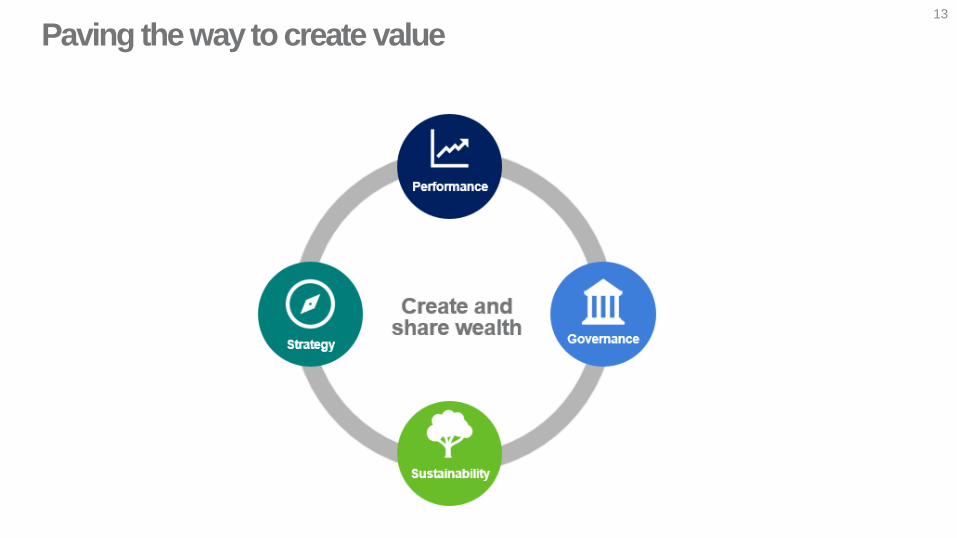
Paving the way to create value
Luiz Eduardo OsorioExecutive Officer, Sustainability and Institutional Relations
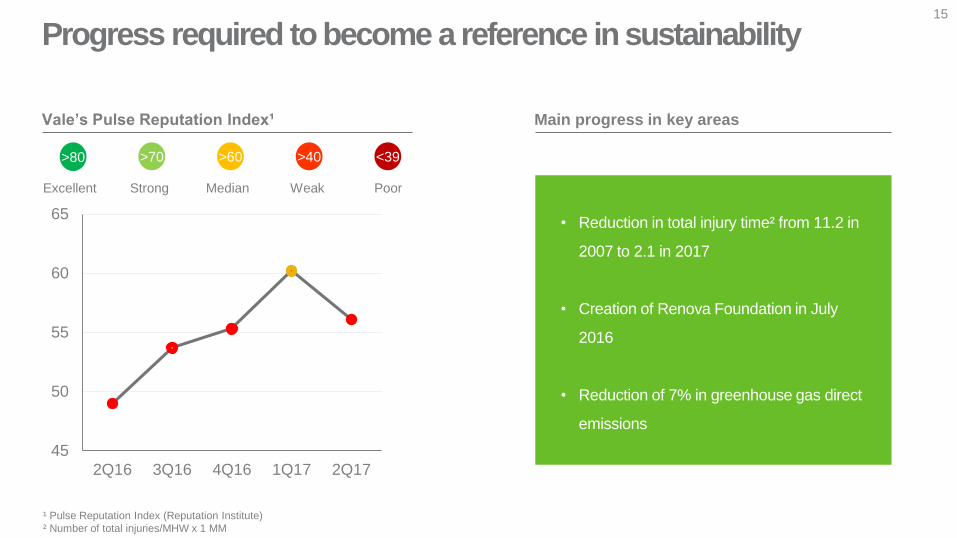
Progress required to become a reference in sustainability15
• Reduction in total injury time² from 11.2 in
2007 to 2.1 in 2017
• Creation of Renova Foundation in July
2016
• Reduction of 7% in greenhouse gas direct
emissions
Main progress in key areas
45
50
55
60
65
2Q16 3Q16 4Q16 1Q17 2Q17
Vale’s Pulse Reputation Index¹
¹ Pulse Reputation Index (Reputation Institute)
² Number of total injuries/MHW x 1 MM
Excellent
>80
Strong
>70
Median
>60
Weak
>40
Poor
<39
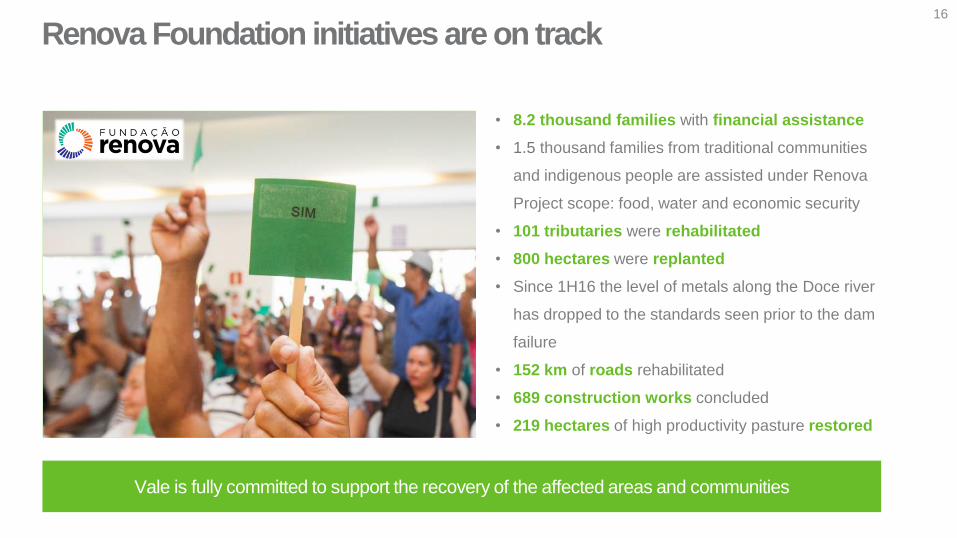
• 8.2 thousand families with financial assistance
• 1.5 thousand families from traditional communities
and indigenous people are assisted under Renova
Project scope: food, water and economic security
• 101 tributaries were rehabilitated
• 800 hectares were replanted
• Since 1H16 the level of metals along the Doce river
has dropped to the standards seen prior to the dam
failure
• 152 km of roads rehabilitated
• 689 construction works concluded
• 219 hectares of high productivity pasture restored
16
Renova Foundation initiatives are on track
Vale is fully committed to support the recovery of the affected areas and communities
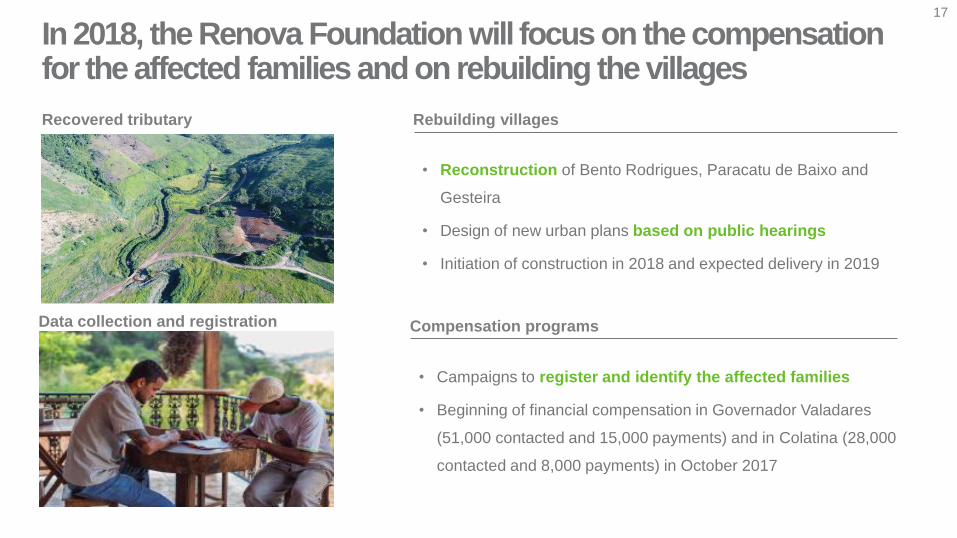
• Reconstruction of Bento Rodrigues, Paracatu de Baixo and
Gesteira
• Design of new urban plans based on public hearings
• Initiation of construction in 2018 and expected delivery in 2019
In 2018, the Renova Foundation will focus on the compensation for the affected families and on rebuilding the villages
Recovered tributary Rebuilding villages
• Campaigns to register and identify the affected families
• Beginning of financial compensation in Governador Valadares
(51,000 contacted and 15,000 payments) and in Colatina (28,000
contacted and 8,000 payments) in October 2017
Compensation programsData collection and registration
17
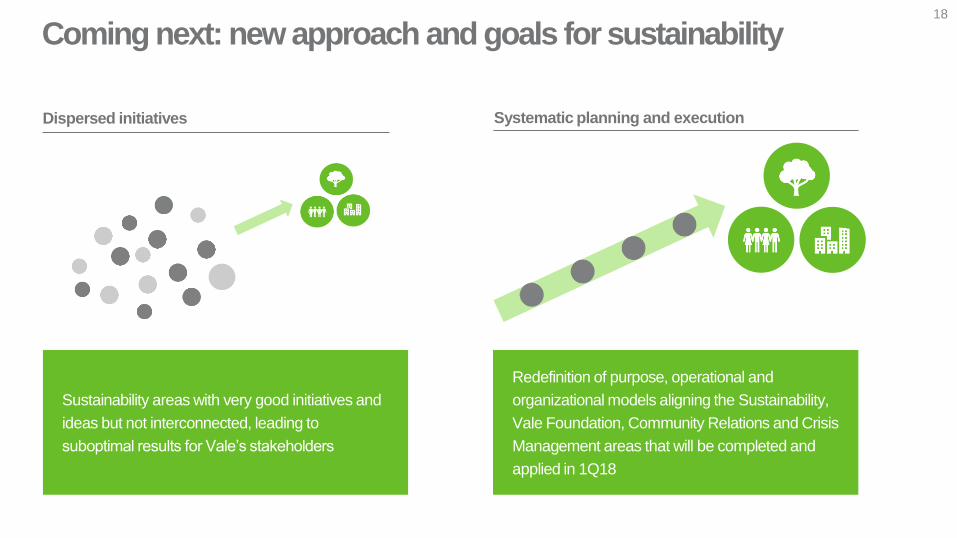
Sustainability areas with very good initiatives and
ideas but not interconnected, leading to
suboptimal results for Vale’s stakeholders
18
Coming next: new approach and goals for sustainability
Systematic planning and executionDispersed initiatives
Redefinition of purpose, operational and
organizational models aligning the Sustainability,
Vale Foundation, Community Relations and Crisis
Management areas that will be completed and
applied in 1Q18
Alexandre PereiraExecutive Officer, Global Business Support
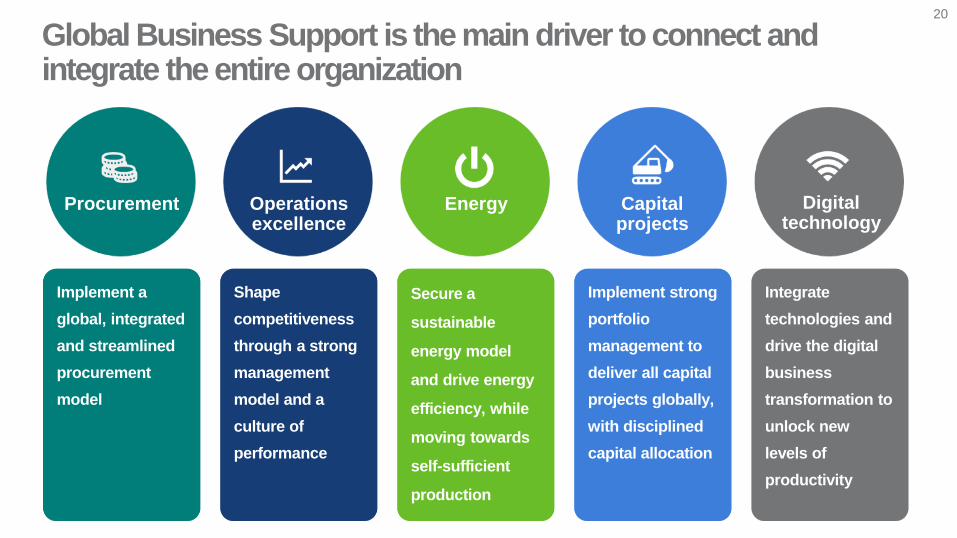
Implement a
global, integrated
and streamlined
procurement
model
Implement strong
portfolio
management to
deliver all capital
projects globally,
with disciplined
capital allocation
Shape
competitiveness
through a strong
management
model and a
culture of
performance
Secure a
sustainable
energy model
and drive energy
efficiency, while
moving towards
self-sufficient
production
Integrate
technologies and
drive the digital
business
transformation to
unlock new
levels of
productivity
20
Global Business Support is the main driver to connect and integrate the entire organization
Procurement Operations excellence
Energy Capitalprojects
Digitaltechnology
21
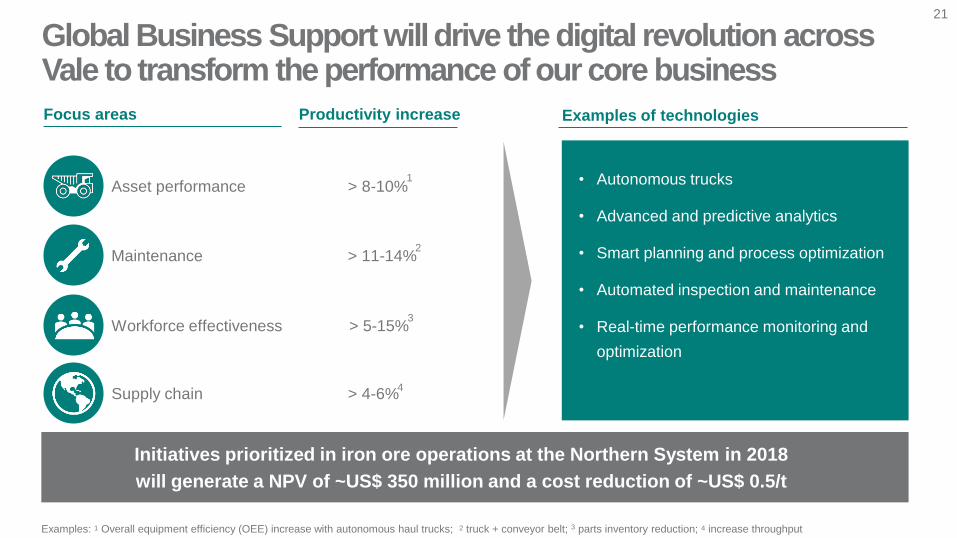
Asset performance > 8-10%
Maintenance > 11-14%
Workforce effectiveness > 5-15%
Supply chain > 4-6%
• Autonomous trucks
• Advanced and predictive analytics
• Smart planning and process optimization
• Automated inspection and maintenance
• Real-time performance monitoring and
optimization
Focus areas Examples of technologies
Global Business Support will drive the digital revolution across Vale to transform the performance of our core business
Initiatives prioritized in iron ore operations at the Northern System in 2018
will generate a NPV of ~US$ 350 million and a cost reduction of ~US$ 0.5/t
Examples: 1 Overall equipment efficiency (OEE) increase with autonomous haul trucks; 2 truck + conveyor belt; 3 parts inventory reduction; 4 increase throughput
1
2
3
4
Productivity increase
22
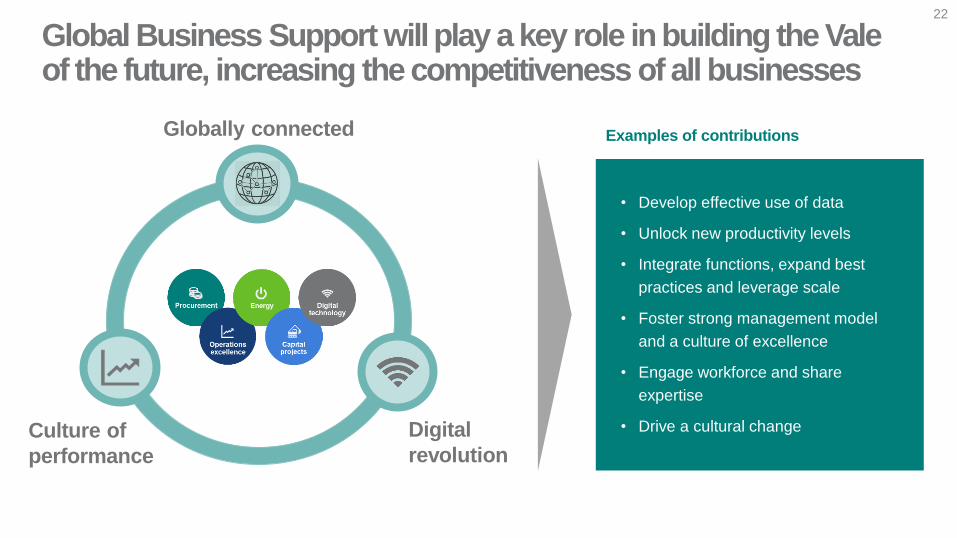
• Develop effective use of data
• Unlock new productivity levels
• Integrate functions, expand best
practices and leverage scale
• Foster strong management model
and a culture of excellence
• Engage workforce and share
expertise
• Drive a cultural change
Examples of contributions Globally connected
Digital
revolutionCulture of
performance
Global Business Support will play a key role in building the Vale of the future, increasing the competitiveness of all businesses

Peter PoppingaExecutive Officer, Ferrous Minerals and Coal
24
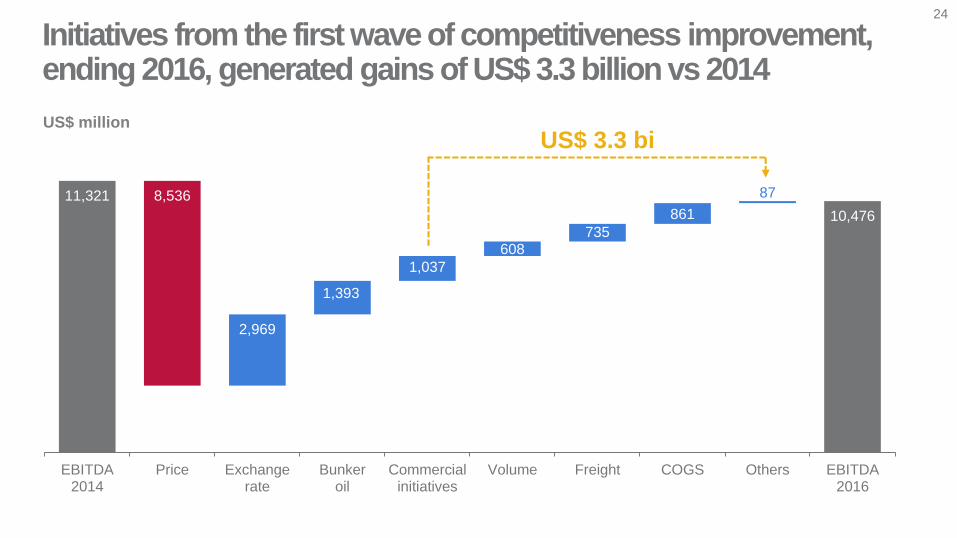
US$ million
11,321 8,536
2,969
1,393
1,037
608735
861
87
10,476
EBITDA2014
Price Exchangerate
Bunkeroil
Commercialinitiatives
Volume Freight COGS Others EBITDA2016
Initiatives from the first wave of competitiveness improvement, ending 2016, generated gains of US$ 3.3 billion vs 2014
US$ 3.3 bi
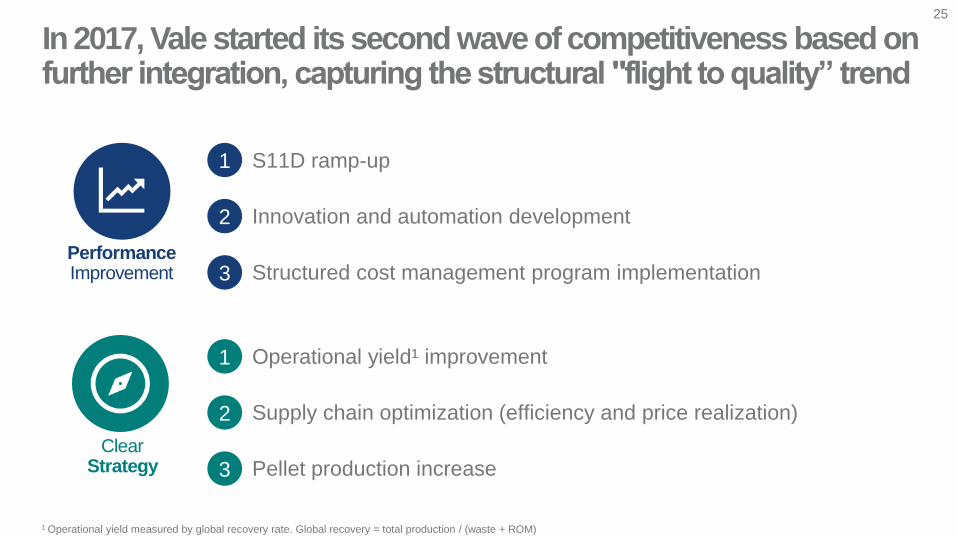
S11D ramp-up
Innovation and automation development
Structured cost management program implementation
1
2
3
1
25
PerformanceImprovement
ClearStrategy
Operational yield¹ improvement
Supply chain optimization (efficiency and price realization)
Pellet production increase
2
3
In 2017, Vale started its second wave of competitiveness based on further integration, capturing the structural "flight to quality” trend
1 Operational yield measured by global recovery rate. Global recovery = total production / (waste + ROM)
26
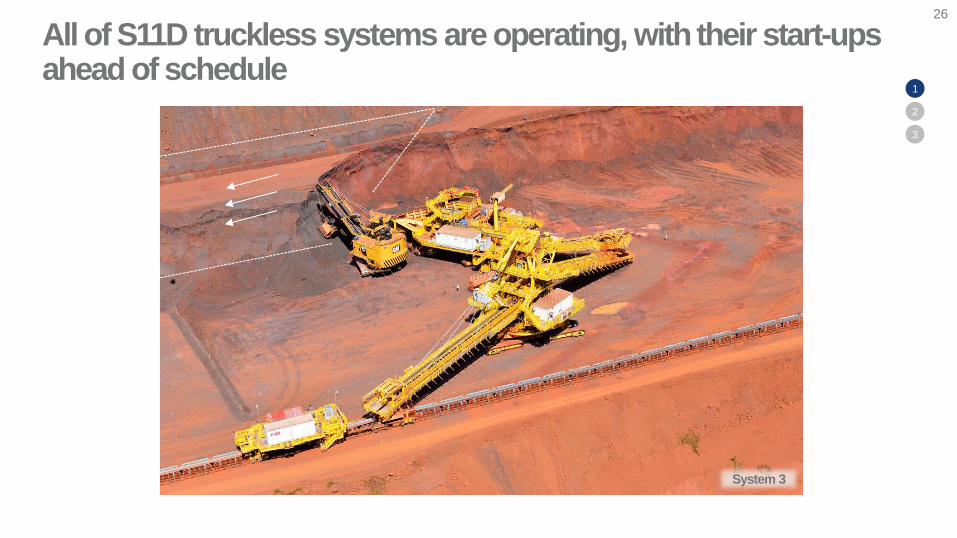
System 3
All of S11D truckless systems are operating, with their start-ups ahead of schedule
1
2
3
27
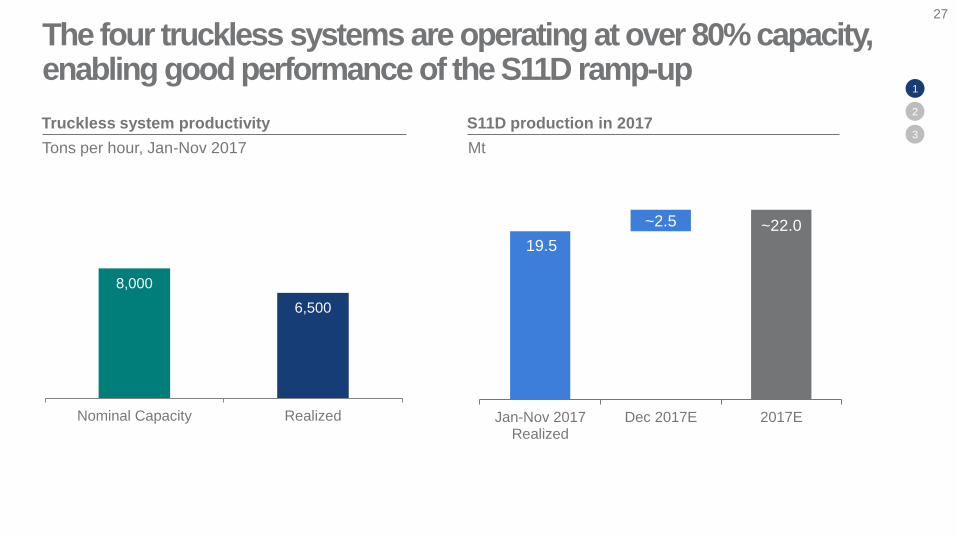
Truckless system productivity
Tons per hour, Jan-Nov 2017
S11D production in 2017
Mt
8,000
6,500
Nominal Capacity Realized
19.5
~2.5 ~22.0
Jan-Nov 2017Realized
Dec 2017E 2017E
1
2
3
The four truckless systems are operating at over 80% capacity, enabling good performance of the S11D ramp-up
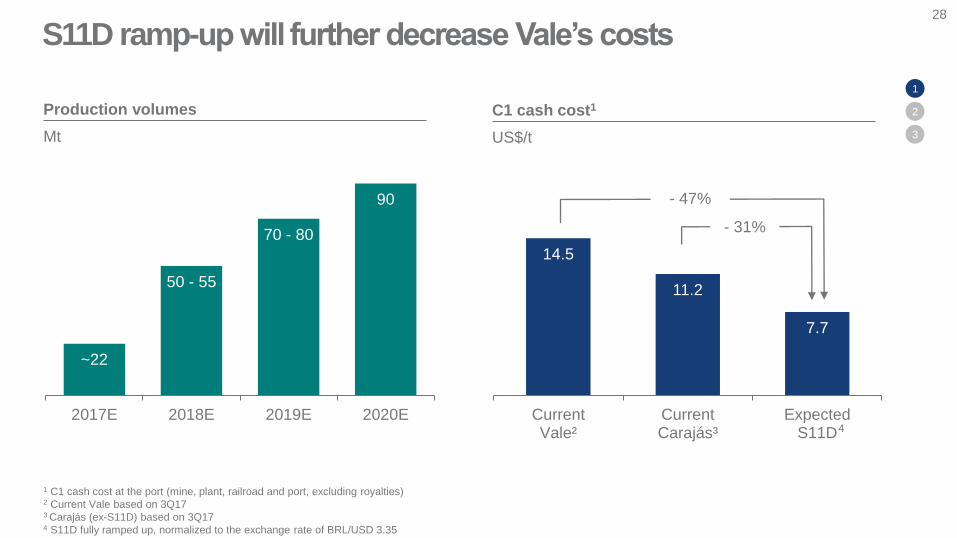
~22
50 - 55
70 - 80
90
2017E 2018E 2019E 2020E
Production volumes
Mt
1 C1 cash cost at the port (mine, plant, railroad and port, excluding royalties)2 Current Vale based on 3Q173 Carajás (ex-S11D) based on 3Q174 S11D fully ramped up, normalized to the exchange rate of BRL/USD 3.35
14.5
11.2
7.7
CurrentVale²
CurrentCarajás³
ExpectedS11D
C1 cash cost1
US$/t
- 31%
- 47%
28
4
1
2
3
S11D ramp-up will further decrease Vale’s costs
29
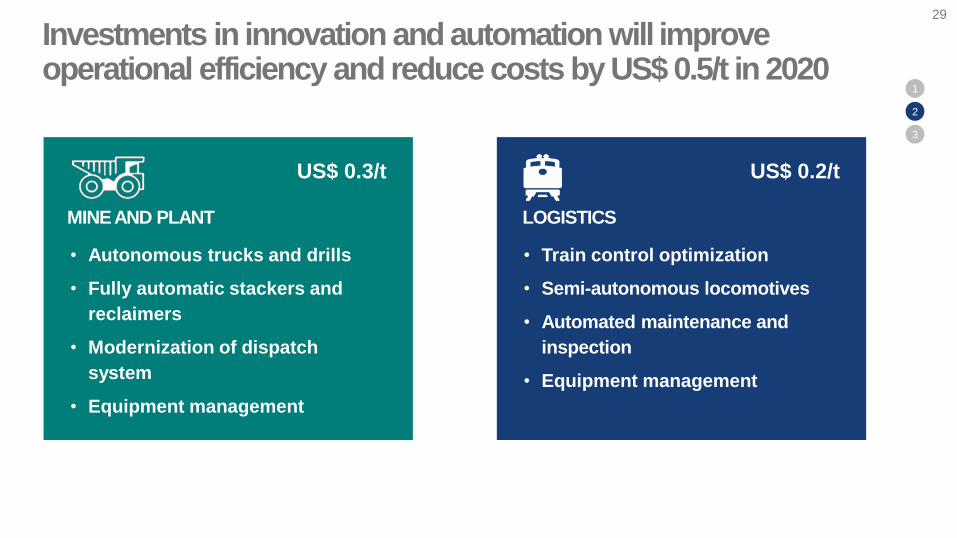
• Autonomous trucks and drills
• Fully automatic stackers and
reclaimers
• Modernization of dispatch
system
• Equipment management
1
2
3
• Train control optimization
• Semi-autonomous locomotives
• Automated maintenance and
inspection
• Equipment management
MINE AND PLANT
US$ 0.3/t US$ 0.2/t
Investments in innovation and automation will improve operational efficiency and reduce costs by US$ 0.5/t in 2020
LOGISTICS
30
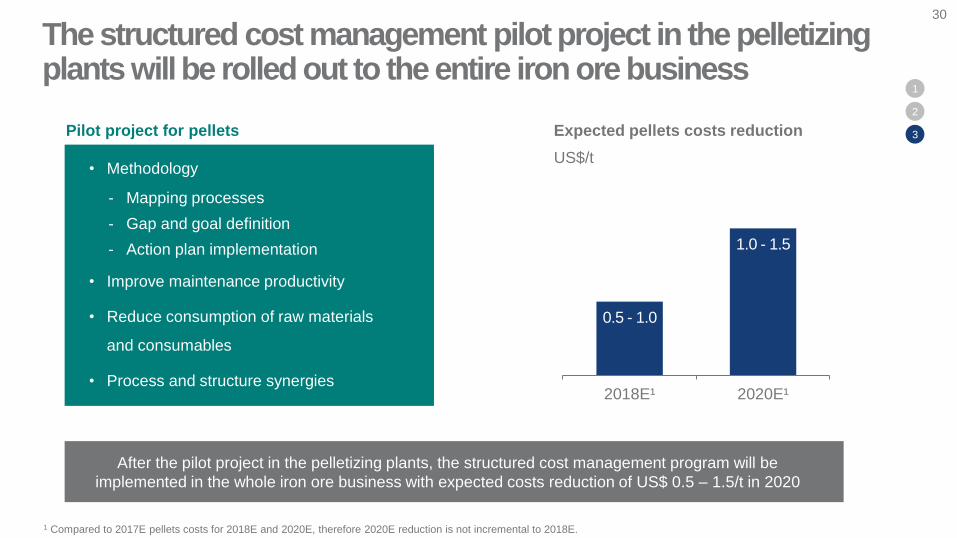
• Methodology
- Mapping processes
- Gap and goal definition
- Action plan implementation
• Improve maintenance productivity
• Reduce consumption of raw materials
and consumables
• Process and structure synergies
Pilot project for pellets Expected pellets costs reduction
US$/t
1
2
3
0.5 - 1.0
1.0 - 1.5
2018E¹ 2020E¹
After the pilot project in the pelletizing plants, the structured cost management program will be
implemented in the whole iron ore business with expected costs reduction of US$ 0.5 – 1.5/t in 2020
The structured cost management pilot project in the pelletizing plants will be rolled out to the entire iron ore business
1 Compared to 2017E pellets costs for 2018E and 2020E, therefore 2020E reduction is not incremental to 2018E.
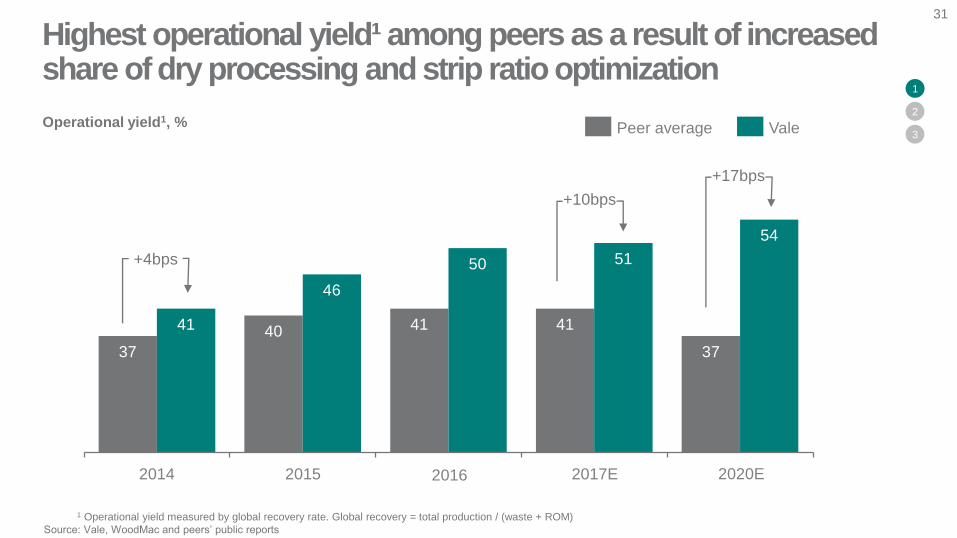
37
40 41 41
37
41
46
50 51
54
31
1 Operational yield measured by global recovery rate. Global recovery = total production / (waste + ROM)
Source: Vale, WoodMac and peers’ public reports
Operational yield1, %
20152014 2016 2017E
Peer average Vale
+4bps
2020E
+17bps
Highest operational yield¹ among peers as a result of increased share of dry processing and strip ratio optimization
+10bps
1
2
3
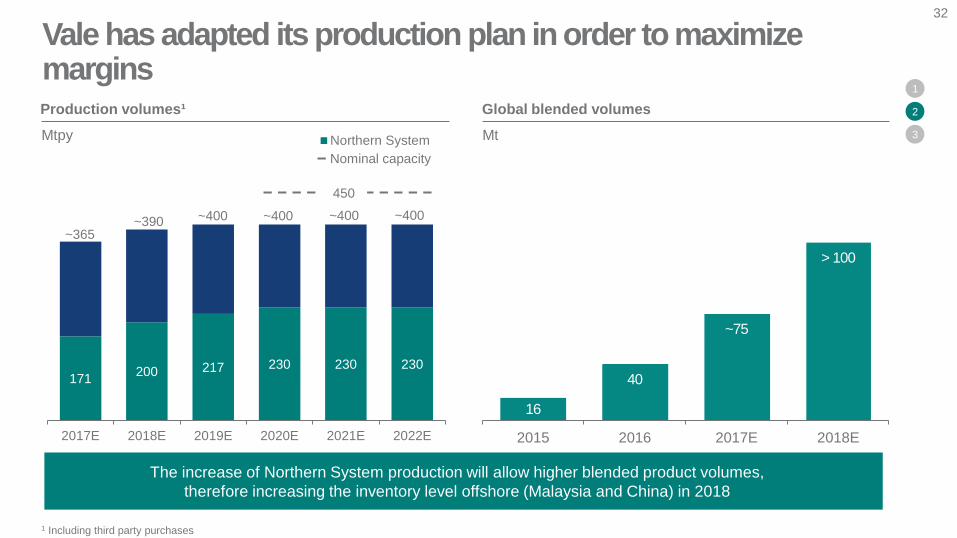
171200 217 230 230 230
2017E 2018E 2019E 2020E 2021E 2022E
Northern System
~365~390 ~400 ~400~400 ~400
450
Production volumes¹
Mtpy
32
Nominal capacity
1 Including third party purchases
The increase of Northern System production will allow higher blended product volumes,
therefore increasing the inventory level offshore (Malaysia and China) in 2018
Vale has adapted its production plan in order to maximize margins
1
2
3
16
40
~75
> 100
2015 2016 2017E 2018E
Global blended volumes
Mt
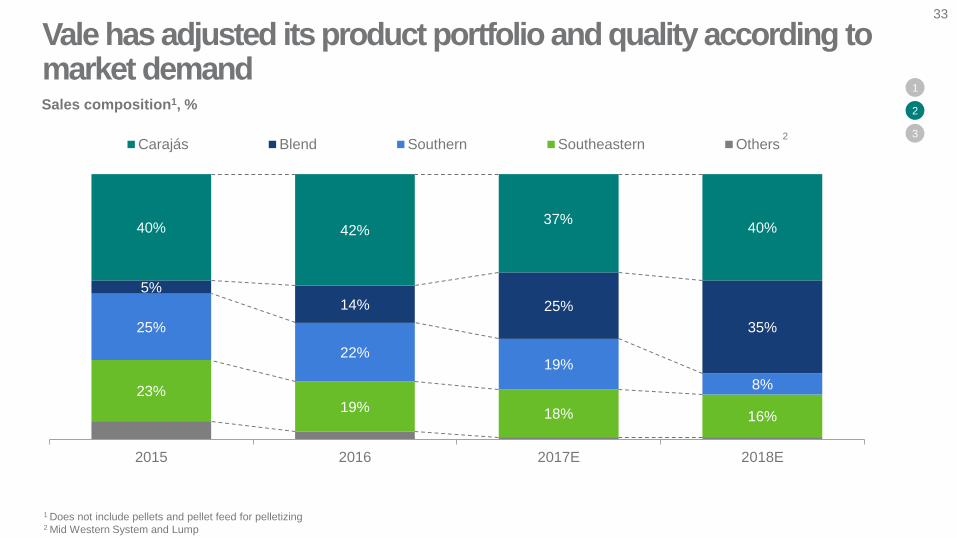
23%19% 18% 16%
25%
22%19%
8%
5%
14% 25%
35%
40% 42%37%
40%
2015 2016 2017E 2018E
Carajás Blend Southern Southeastern Others
33
Sales composition1, %
2
Vale has adjusted its product portfolio and quality according to market demand
1 Does not include pellets and pellet feed for pelletizing2 Mid Western System and Lump
1
2
3
34
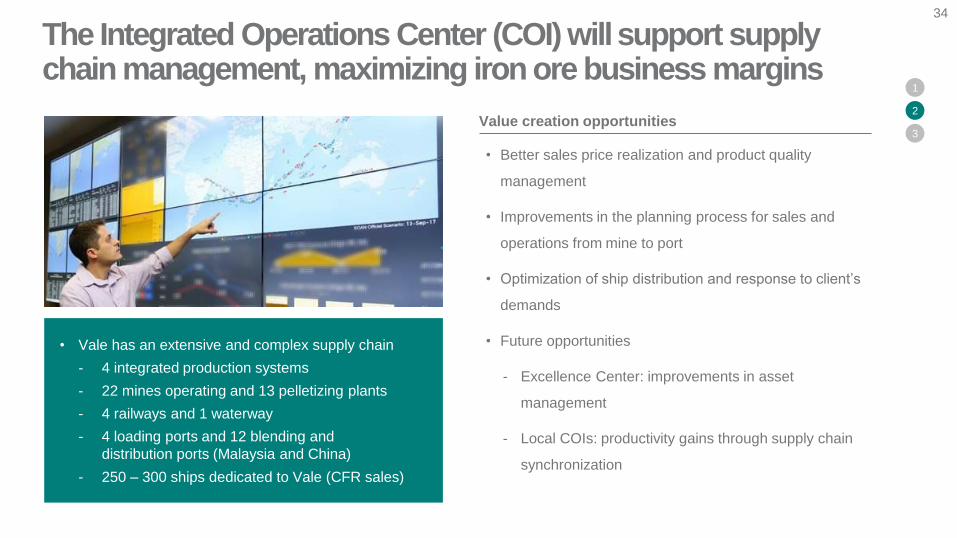
Value creation opportunities
• Better sales price realization and product quality
management
• Improvements in the planning process for sales and
operations from mine to port
• Optimization of ship distribution and response to client’s
demands
• Future opportunities
- Excellence Center: improvements in asset
management
- Local COIs: productivity gains through supply chain
synchronization
• Vale has an extensive and complex supply chain
- 4 integrated production systems
- 22 mines operating and 13 pelletizing plants
- 4 railways and 1 waterway
- 4 loading ports and 12 blending and
distribution ports (Malaysia and China)
- 250 – 300 ships dedicated to Vale (CFR sales)
The Integrated Operations Center (COI) will support supply chain management, maximizing iron ore business margins
1
2
3
35
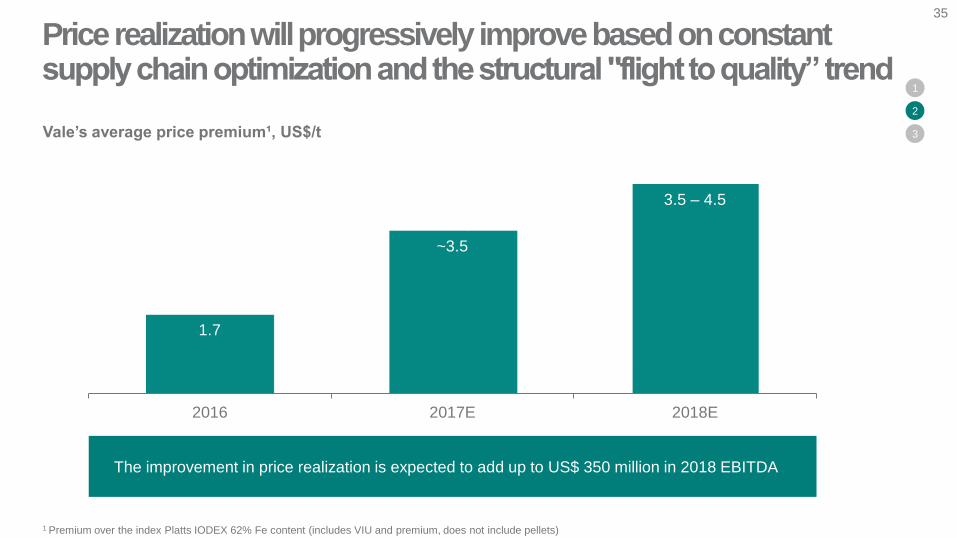
1 Premium over the index Platts IODEX 62% Fe content (includes VIU and premium, does not include pellets)
Vale’s average price premium¹, US$/t
1.7
~3.5
3.5 – 4.5
2016 2017E 2018E
The improvement in price realization is expected to add up to US$ 350 million in 2018 EBITDA
Price realization will progressively improve based on constant supply chain optimization and the structural "flight to quality” trend
1
2
3
61.7
61.4
61.0
60.7
60.460.4 60.4
60.3
61.5
61.2
60.8
60.5
60.260.0
60.059.8
60
60
61
61
62
62
2010 2011 2012 2013 2014 2015 2016 2017e
36
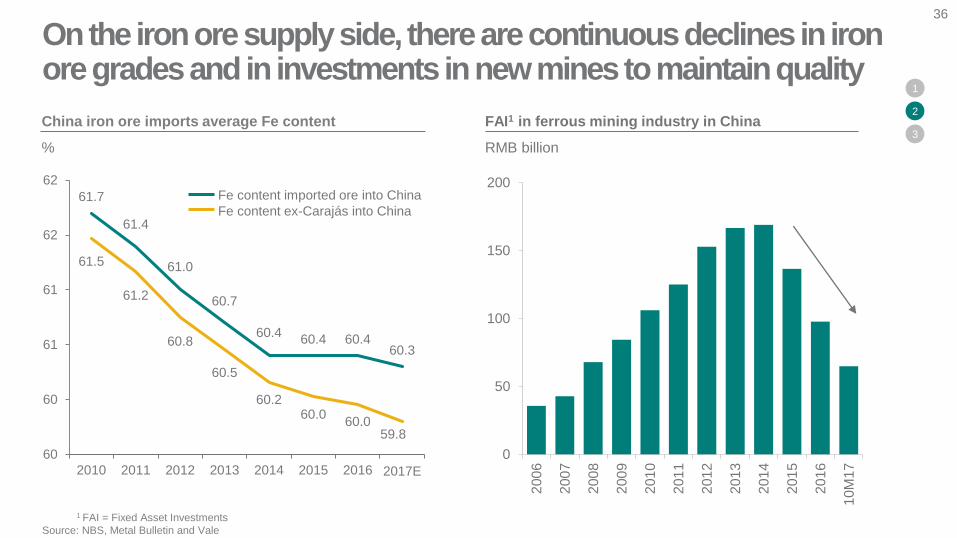
China iron ore imports average Fe content
%
On the iron ore supply side, there are continuous declines in iron ore grades and in investments in new mines to maintain quality
FAI1 in ferrous mining industry in China
RMB billion
1 FAI = Fixed Asset Investments
Source: NBS, Metal Bulletin and Vale
0
50
100
150
200
200
6
200
7
200
8
200
9
201
0
201
1
201
2
201
3
201
4
201
5
201
6
10M
17
Fe content imported ore into China
Fe content ex-Carajás into China
1
2
3
2017E
0
2
4
6
8
Oct-16 Dec-16 Feb-17 Apr-17 Jun-17 Aug-17 Oct-17
1% SiO2 Discount (4.5-6.5%)
1% SiO2 Discount (6.5-9.0%)
1% Al2O3 Discount (1.0-2.5%)
0.01% Phos Discount (0.09-0.12%)
37
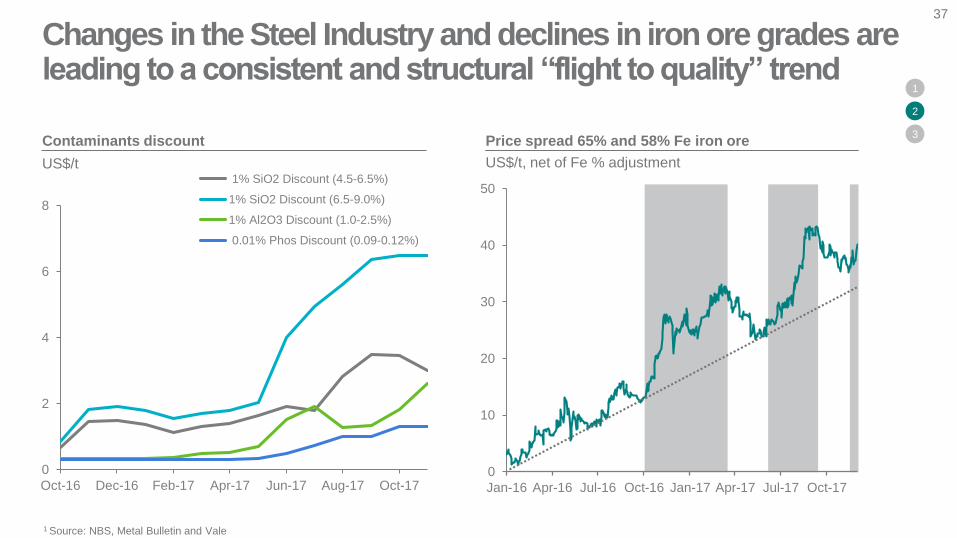
Changes in the Steel Industry and declines in iron ore grades are leading to a consistent and structural “flight to quality” trend
1 Source: NBS, Metal Bulletin and Vale
Contaminants discount
US$/t
Price spread 65% and 58% Fe iron ore
US$/t, net of Fe % adjustment
0
10
20
30
40
50
Jan-16 Apr-16 Jul-16 Oct-16 Jan-17 Apr-17 Jul-17 Oct-17
1
2
3
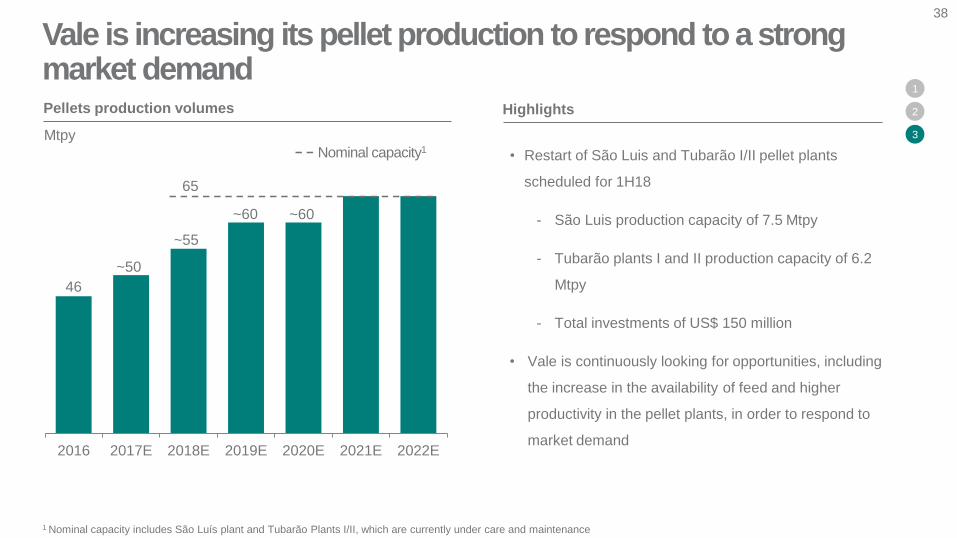
Pellets production volumes
Mtpy
38
Highlights
• Restart of São Luis and Tubarão I/II pellet plants
scheduled for 1H18
- São Luis production capacity of 7.5 Mtpy
- Tubarão plants I and II production capacity of 6.2
Mtpy
- Total investments of US$ 150 million
• Vale is continuously looking for opportunities, including
the increase in the availability of feed and higher
productivity in the pellet plants, in order to respond to
market demand
Vale is increasing its pellet production to respond to a strong market demand
1 Nominal capacity includes São Luís plant and Tubarão Plants I/II, which are currently under care and maintenance
1
2
3
46
2016 2017E 2018E 2019E 2020E 2021E 2022E
Nominal capacity1
~50
~55
~60 ~60
65
39
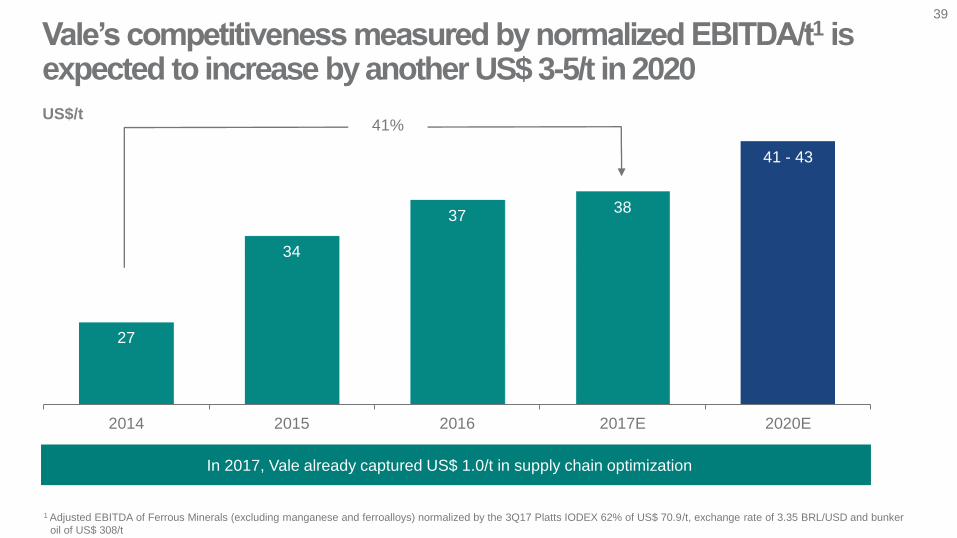
US$/t
1 Adjusted EBITDA of Ferrous Minerals (excluding manganese and ferroalloys) normalized by the 3Q17 Platts IODEX 62% of US$ 70.9/t, exchange rate of 3.35 BRL/USD and bunker
oil of US$ 308/t
27
34
3738
41 - 43
2014 2015 2016 2017E 2020E
Vale’s competitiveness measured by normalized EBITDA/t1 is expected to increase by another US$ 3-5/t in 2020
In 2017, Vale already captured US$ 1.0/t in supply chain optimization
41%
Peter PoppingaExecutive Officer, Ferrous Minerals and Coal
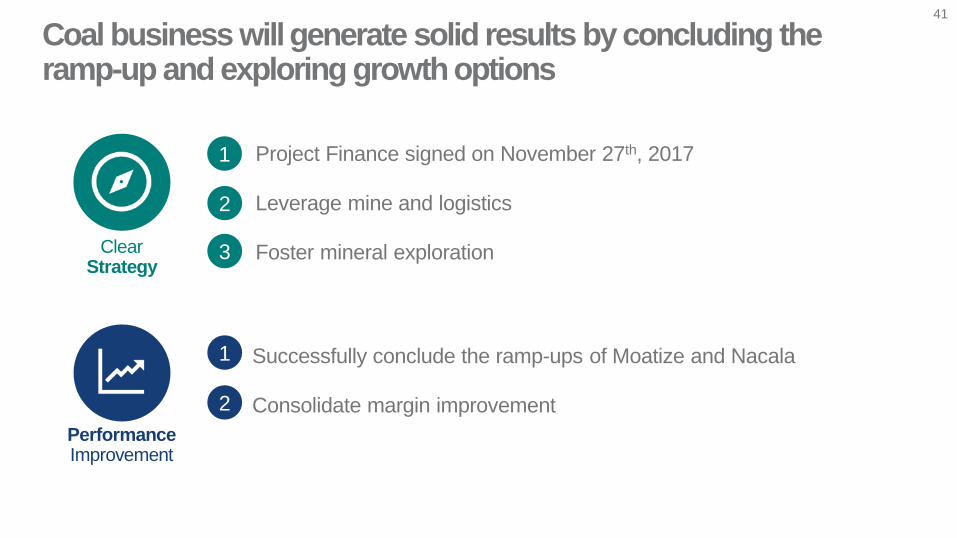
Successfully conclude the ramp-ups of Moatize and Nacala
Consolidate margin improvement
1
2
41
PerformanceImprovement
ClearStrategy
Project Finance signed on November 27th, 2017
Leverage mine and logistics
Foster mineral exploration
1
2
3
Coal business will generate solid results by concluding the ramp-up and exploring growth options
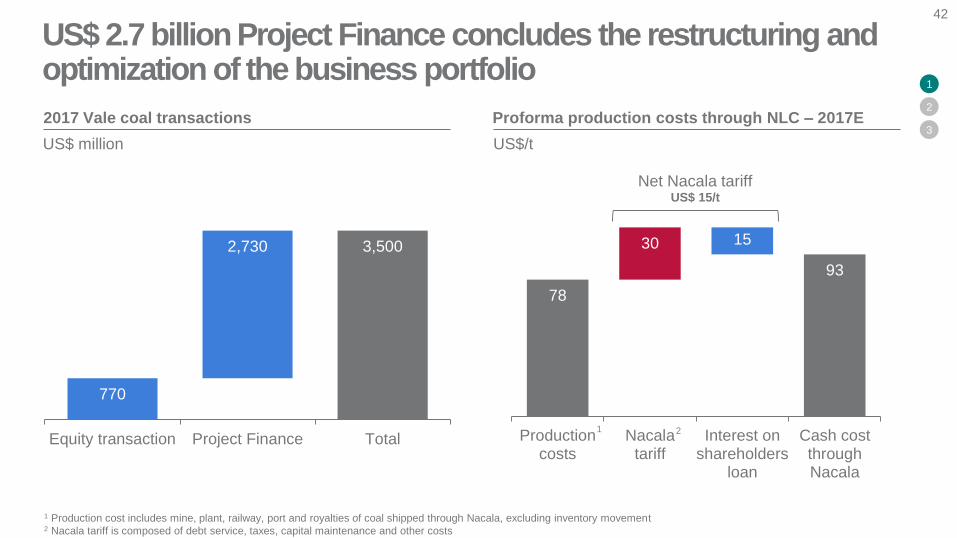
78
30
93
15
Productioncosts
Nacalatariff
Interest onshareholders
loan
Cash costthroughNacala
42
770
2,730 3,500
Equity transaction Project Finance Total
2017 Vale coal transactions Proforma production costs through NLC – 2017E
US$/tUS$ million
Net Nacala tariffUS$ 15/t
1 Production cost includes mine, plant, railway, port and royalties of coal shipped through Nacala, excluding inventory movement2 Nacala tariff is composed of debt service, taxes, capital maintenance and other costs
1 2
1
2
3
US$ 2.7 billion Project Finance concludes the restructuring and optimization of the business portfolio
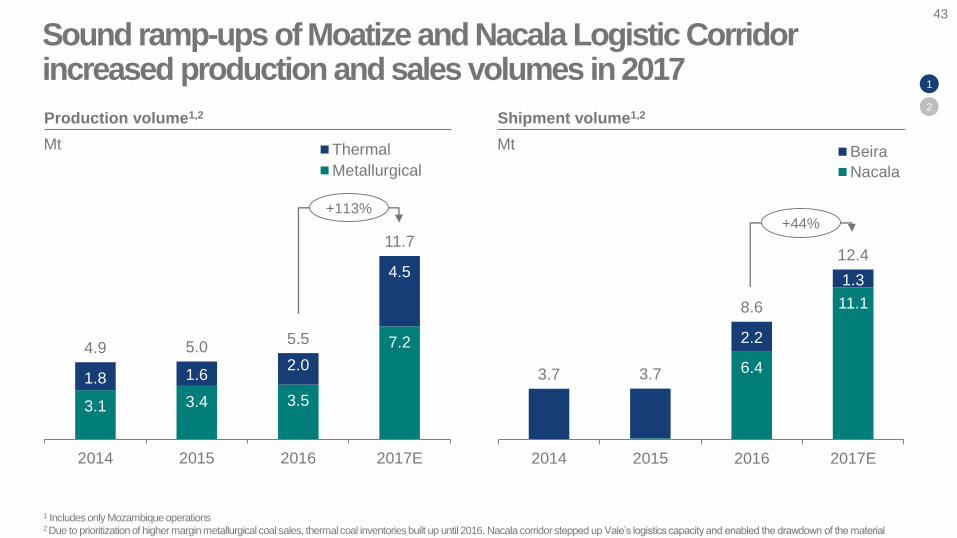
3.1 3.4 3.5
7.2
1.8 1.62.0
4.5
4.9 5.05.5
11.7
2014 2015 2016 2017E
Thermal
Metallurgical
43
Production volume1,2
Mt
6.4
11.1
2.2
1.3
3.7 3.7
8.6
12.4
2014 2015 2016 2017E
Beira
Nacala
Shipment volume1,2
Mt
1 Includes only Mozambique operations2 Due to prioritization of higher margin metallurgical coal sales, thermal coal inventories built up until 2016. Nacala corridor stepped up Vale’s logistics capacity and enabled the drawdown of the material
+113%+44%
1
2
Sound ramp-ups of Moatize and Nacala Logistic Corridor increased production and sales volumes in 2017
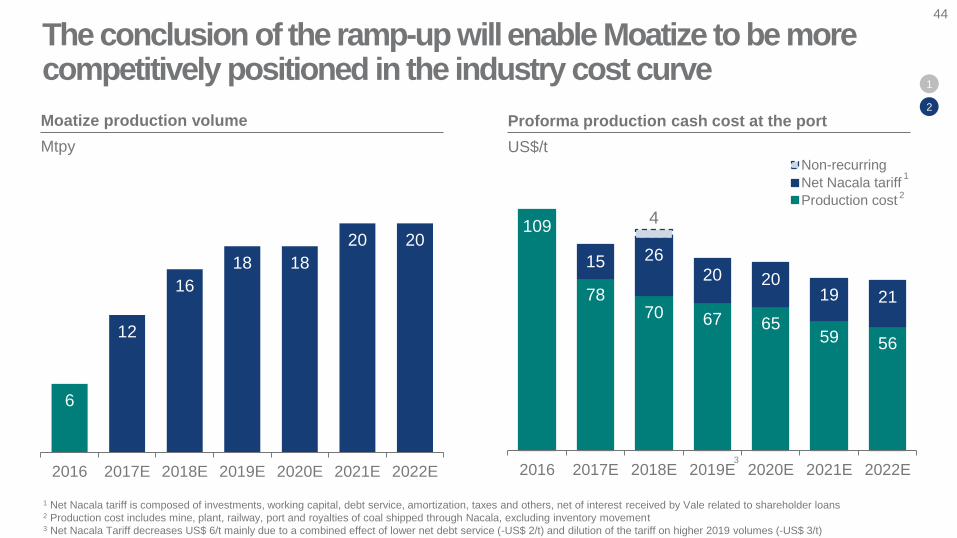
44
109
7870 67 65
59 56
15 2620 20
19 21
4
2016 2017E 2018E 2019E 2020E 2021E 2022E
Non-recurring
Net Nacala tariff
Production cost
Proforma production cash cost at the port
US$/t
2
1
1 Net Nacala tariff is composed of investments, working capital, debt service, amortization, taxes and others, net of interest received by Vale related to shareholder loans2 Production cost includes mine, plant, railway, port and royalties of coal shipped through Nacala, excluding inventory movement3 Net Nacala Tariff decreases US$ 6/t mainly due to a combined effect of lower net debt service (-US$ 2/t) and dilution of the tariff on higher 2019 volumes (-US$ 3/t)
1
2
The conclusion of the ramp-up will enable Moatize to be more competitively positioned in the industry cost curve
3
Moatize production volume
Mtpy
6
12
16
18 18
20 20
2016 2017E 2018E 2019E 2020E 2021E 2022E
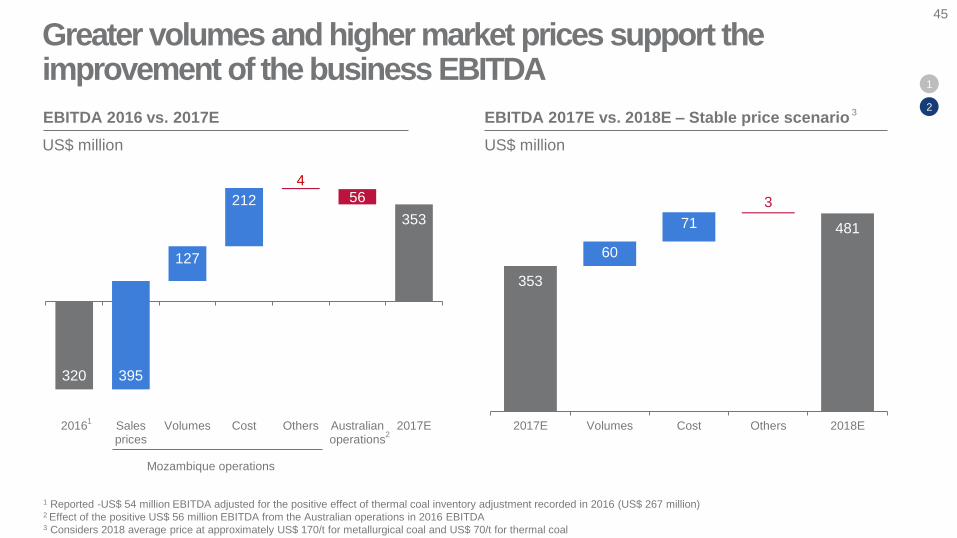
127
212
395
456
320
353
2016 Salesprices
Volumes Cost Others Australianoperations
2017E
45
Mozambique operations
EBITDA 2016 vs. 2017E
1
1 Reported -US$ 54 million EBITDA adjusted for the positive effect of thermal coal inventory adjustment recorded in 2016 (US$ 267 million)2 Effect of the positive US$ 56 million EBITDA from the Australian operations in 2016 EBITDA3 Considers 2018 average price at approximately US$ 170/t for metallurgical coal and US$ 70/t for thermal coal
3
US$ million
EBITDA 2017E vs. 2018E – Stable price scenario
US$ million
60
71
3
353
481
2017E Volumes Cost Others 2018E
1
2
Greater volumes and higher market prices support the improvement of the business EBITDA
2
Jennifer MakiExecutive officer, Base Metals
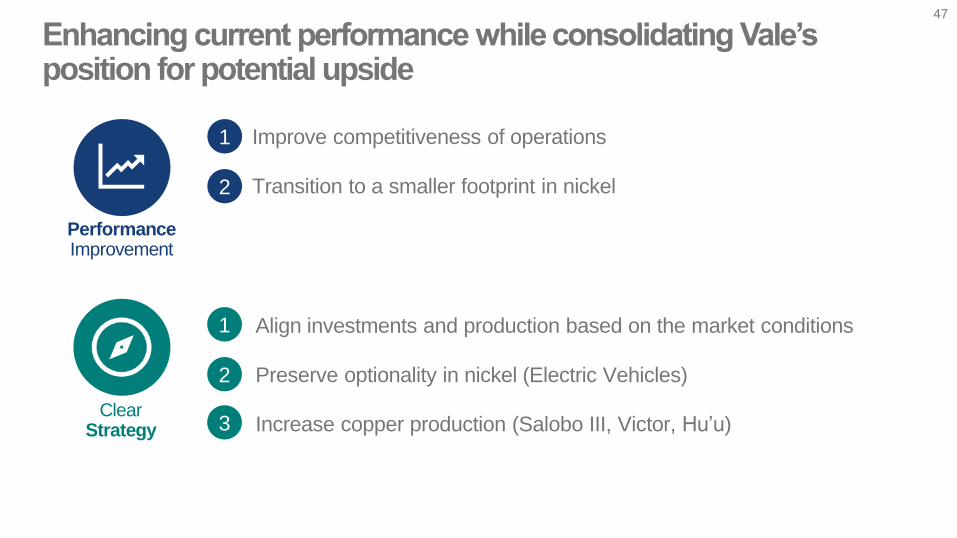
Enhancing current performance while consolidating Vale’s position for potential upside
Improve competitiveness of operations
Transition to a smaller footprint in nickel
1
2
47
PerformanceImprovement
Clear Strategy
Align investments and production based on the market conditions
Preserve optionality in nickel (Electric Vehicles)
Increase copper production (Salobo III, Victor, Hu’u)
1
2
3
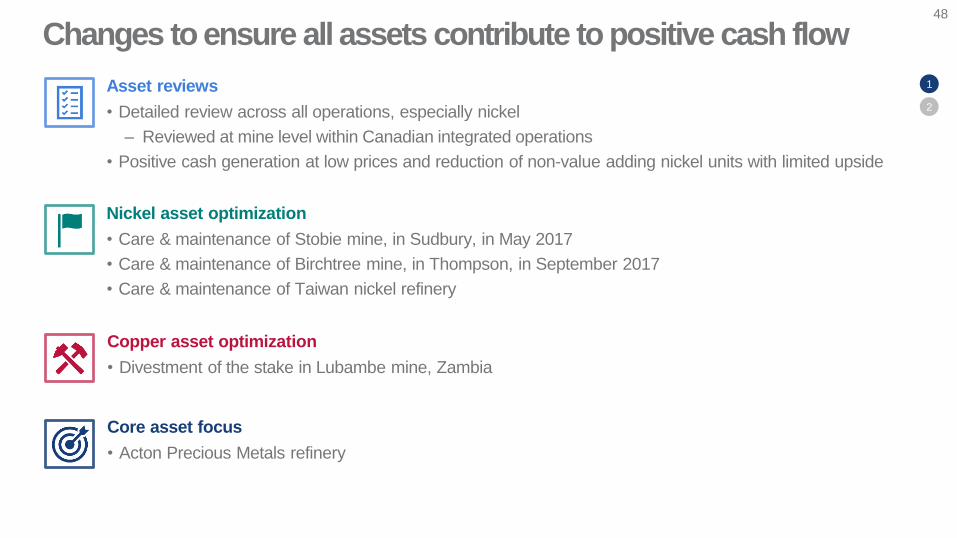
Changes to ensure all assets contribute to positive cash flow48
Copper asset optimization
• Divestment of the stake in Lubambe mine, Zambia
Asset reviews
• Detailed review across all operations, especially nickel
– Reviewed at mine level within Canadian integrated operations
• Positive cash generation at low prices and reduction of non-value adding nickel units with limited upside
Nickel asset optimization
• Care & maintenance of Stobie mine, in Sudbury, in May 2017
• Care & maintenance of Birchtree mine, in Thompson, in September 2017
• Care & maintenance of Taiwan nickel refinery
1
2
Core asset focus
• Acton Precious Metals refinery
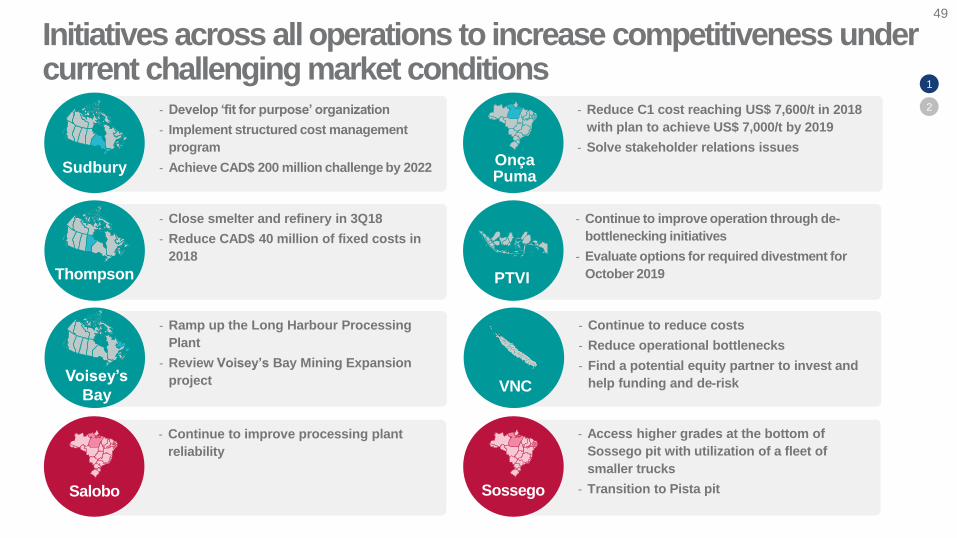
Initiatives across all operations to increase competitiveness under current challenging market conditions
Thompson
Sudbury
Voisey’s
Bay
‐ Develop ‘fit for purpose’ organization
‐ Implement structured cost management
program
‐ Achieve CAD$ 200 million challenge by 2022
‐ Ramp up the Long Harbour Processing
Plant
‐ Review Voisey’s Bay Mining Expansion
project
‐ Close smelter and refinery in 3Q18
‐ Reduce CAD$ 40 million of fixed costs in
2018
‐ Reduce C1 cost reaching US$ 7,600/t in 2018
with plan to achieve US$ 7,000/t by 2019
‐ Solve stakeholder relations issues
‐ Continue to improve operation through de-
bottlenecking initiatives
‐ Evaluate options for required divestment for
October 2019PTVI
Onça Puma
49
VNC
‐ Continue to reduce costs
‐ Reduce operational bottlenecks
‐ Find a potential equity partner to invest and
help funding and de-risk
1
2
‐ Continue to improve processing plant
reliability
‐ Access higher grades at the bottom of
Sossego pit with utilization of a fleet of
smaller trucks
‐ Transition to Pista pitSalobo Sossego
50
308 14
611
9 32
263
220
230
240
250
260
270
280
290
300
310
2018EVale Day
2016
Sudbury Thompson Voisey's Bay
PTVI VNC Onça Puma 2018EVale Day
2017
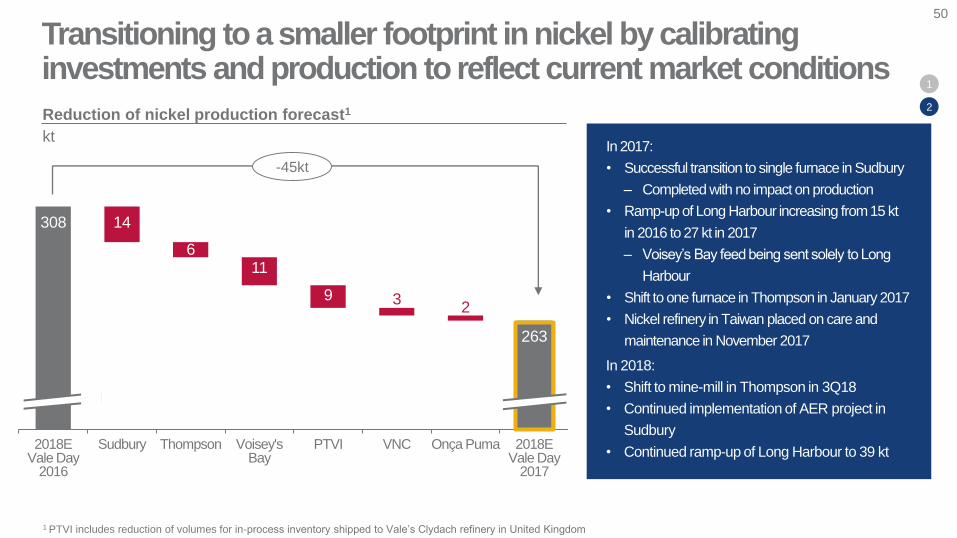
Reduction of nickel production forecast1
kt
-45kt
1 PTVI includes reduction of volumes for in-process inventory shipped to Vale’s Clydach refinery in United Kingdom
Transitioning to a smaller footprint in nickel by calibrating investments and production to reflect current market conditions
1
2
In 2018:
• Shift to mine-mill in Thompson in 3Q18
• Continued implementation of AER project in
Sudbury
• Continued ramp-up of Long Harbour to 39 kt
In 2017:
• Successful transition to single furnace in Sudbury
– Completed with no impact on production
• Ramp-up of Long Harbour increasing from 15 kt
in 2016 to 27 kt in 2017
– Voisey’s Bay feed being sent solely to Long
Harbour
• Shift to one furnace in Thompson in January 2017
• Nickel refinery in Taiwan placed on care and
maintenance in November 2017
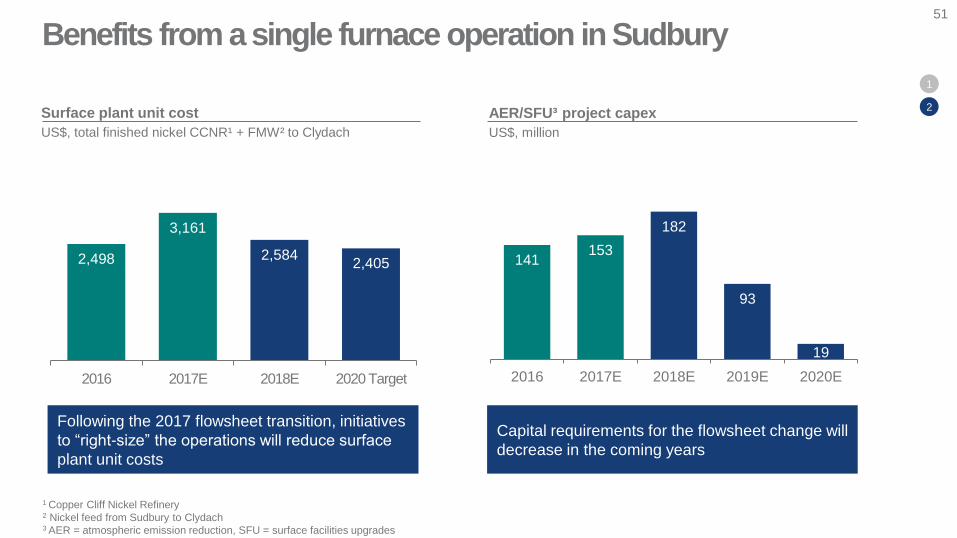
Benefits from a single furnace operation in Sudbury51
Surface plant unit cost
US$, total finished nickel CCNR¹ + FMW² to Clydach
AER/SFU³ project capex
US$, million
Capital requirements for the flowsheet change will
decrease in the coming years
2,498
3,161
2,5842,405
2016 2017E 2018E 2020 Target
141153
182
93
19
2016 2017E 2018E 2019E 2020E
1
2
1 Copper Cliff Nickel Refinery2 Nickel feed from Sudbury to Clydach3 AER = atmospheric emission reduction, SFU = surface facilities upgrades
Following the 2017 flowsheet transition, initiatives
to “right-size” the operations will reduce surface
plant unit costs
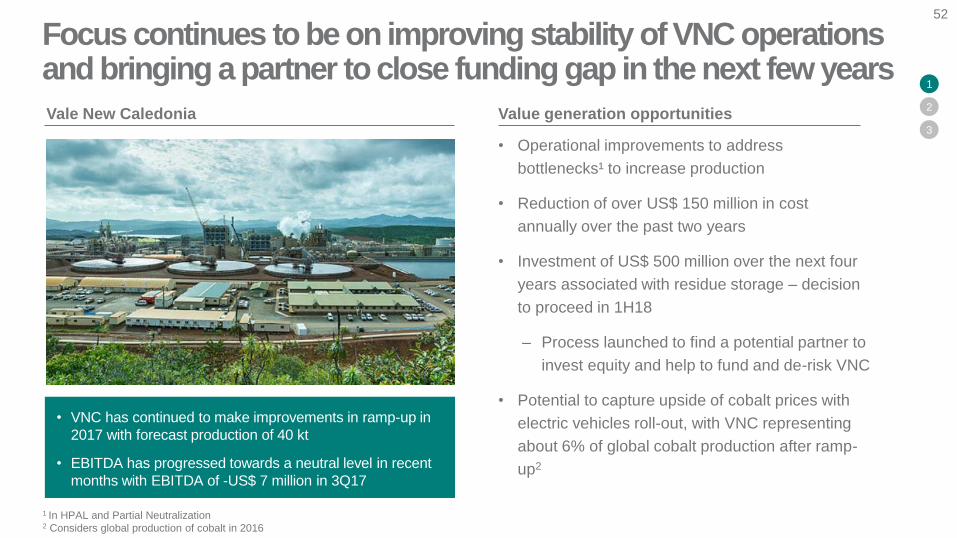
Focus continues to be on improving stability of VNC operations and bringing a partner to close funding gap in the next few years
52
Vale New Caledonia Value generation opportunities
• Operational improvements to address
bottlenecks¹ to increase production
• Reduction of over US$ 150 million in cost
annually over the past two years
• Investment of US$ 500 million over the next four
years associated with residue storage – decision
to proceed in 1H18
‒ Process launched to find a potential partner to
invest equity and help to fund and de-risk VNC
• Potential to capture upside of cobalt prices with
electric vehicles roll-out, with VNC representing
about 6% of global cobalt production after ramp-
up2
• VNC has continued to make improvements in ramp-up in
2017 with forecast production of 40 kt
• EBITDA has progressed towards a neutral level in recent
months with EBITDA of -US$ 7 million in 3Q17
1 In HPAL and Partial Neutralization2 Considers global production of cobalt in 2016
1
2
3
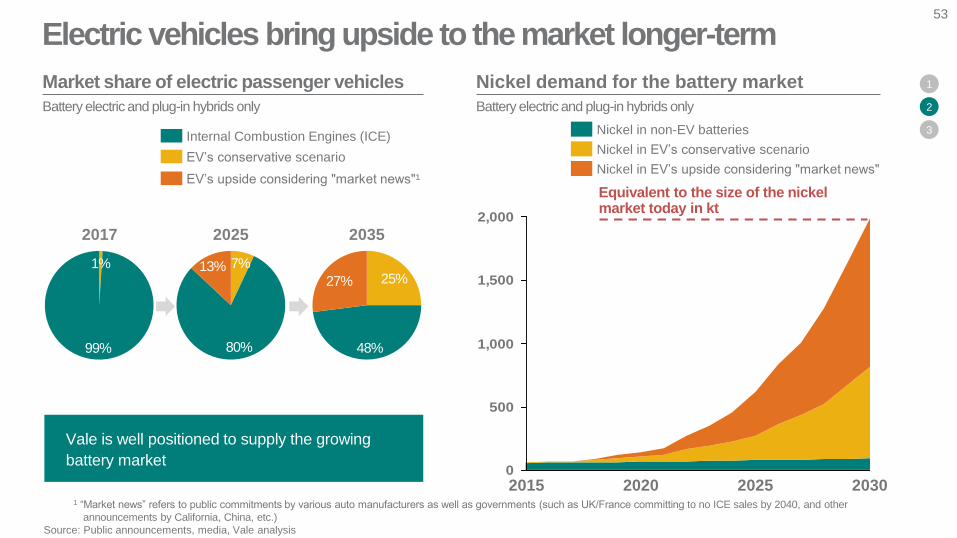
7%
80%
13%1%
99%
Electric vehicles bring upside to the market longer-term53
1 “Market news” refers to public commitments by various auto manufacturers as well as governments (such as UK/France committing to no ICE sales by 2040, and other
announcements by California, China, etc.)
Source: Public announcements, media, Vale analysis
Market share of electric passenger vehicles
Battery electric and plug-in hybrids only
Nickel demand for the battery market
Battery electric and plug-in hybrids only
0
500
1,000
1,500
2,000
2025 203020202015
2017 20352025
Internal Combustion Engines (ICE)
EV’s conservative scenario
EV’s upside considering "market news"¹
25%
48%
27%
Nickel in non-EV batteries
Nickel in EV’s conservative scenario
Nickel in EV’s upside considering "market news"
Vale is well positioned to supply the growing
battery market
1
2
3
Equivalent to the size of the nickel market today in kt
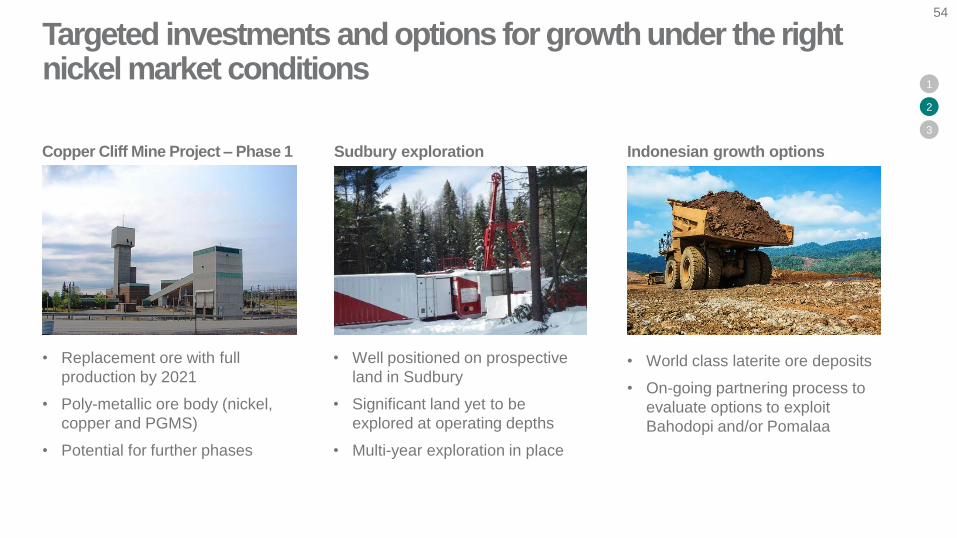
Targeted investments and options for growth under the right nickel market conditions
• Replacement ore with full
production by 2021
• Poly-metallic ore body (nickel,
copper and PGMS)
• Potential for further phases
• Well positioned on prospective
land in Sudbury
• Significant land yet to be
explored at operating depths
• Multi-year exploration in place
• World class laterite ore deposits
• On-going partnering process to
evaluate options to exploit
Bahodopi and/or Pomalaa
Sudbury exploration Indonesian growth optionsCopper Cliff Mine Project – Phase 1
1
2
3
54
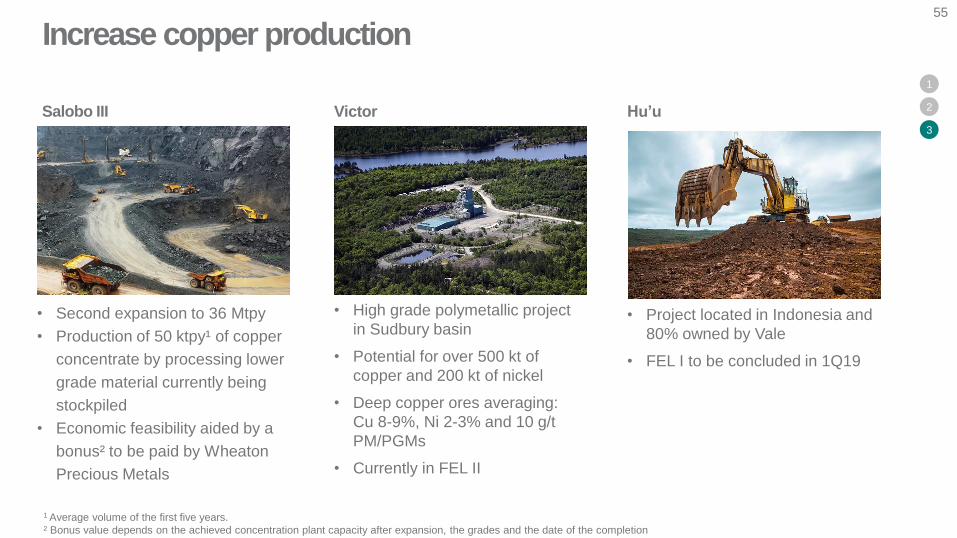
Increase copper production
• Second expansion to 36 Mtpy
• Production of 50 ktpy¹ of copper
concentrate by processing lower
grade material currently being
stockpiled
• Economic feasibility aided by a
bonus² to be paid by Wheaton
Precious Metals
• High grade polymetallic project
in Sudbury basin
• Potential for over 500 kt of
copper and 200 kt of nickel
• Deep copper ores averaging:
Cu 8-9%, Ni 2-3% and 10 g/t
PM/PGMs
• Currently in FEL II
• Project located in Indonesia and
80% owned by Vale
• FEL I to be concluded in 1Q19
Victor Hu’uSalobo III
1
2
3
1 Average volume of the first five years.
² Bonus value depends on the achieved concentration plant capacity after expansion, the grades and the date of the completion
55
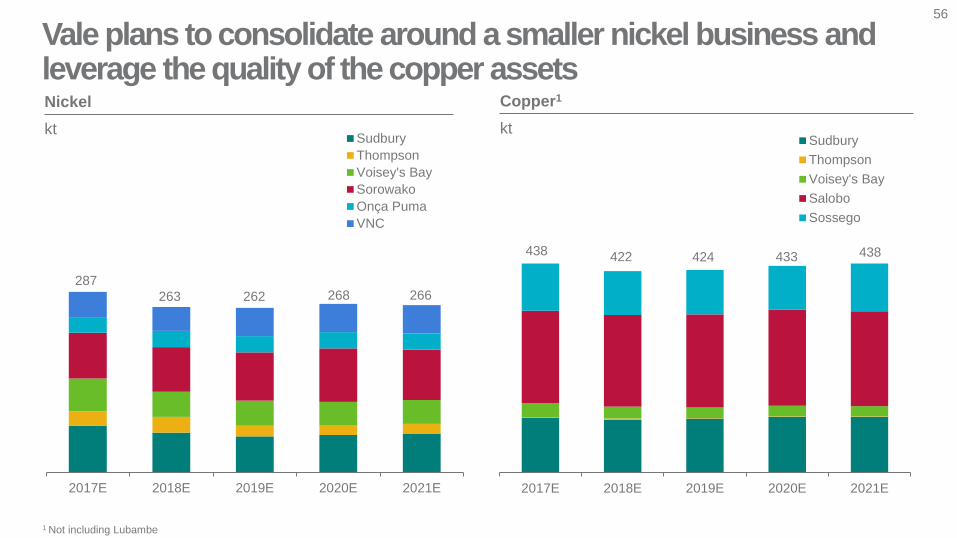
Vale plans to consolidate around a smaller nickel business and leverage the quality of the copper assetsNickel
kt
Copper1
kt
2017E 2018E 2019E 2020E 2021E
Sudbury
Thompson
Voisey's Bay
Sorowako
Onça Puma
VNC
287
263 262 268
2017E 2018E 2019E 2020E 2021E
Sudbury
Thompson
Voisey's Bay
Salobo
Sossego
438 422 424 433
266
438
56
1 Not including Lubambe
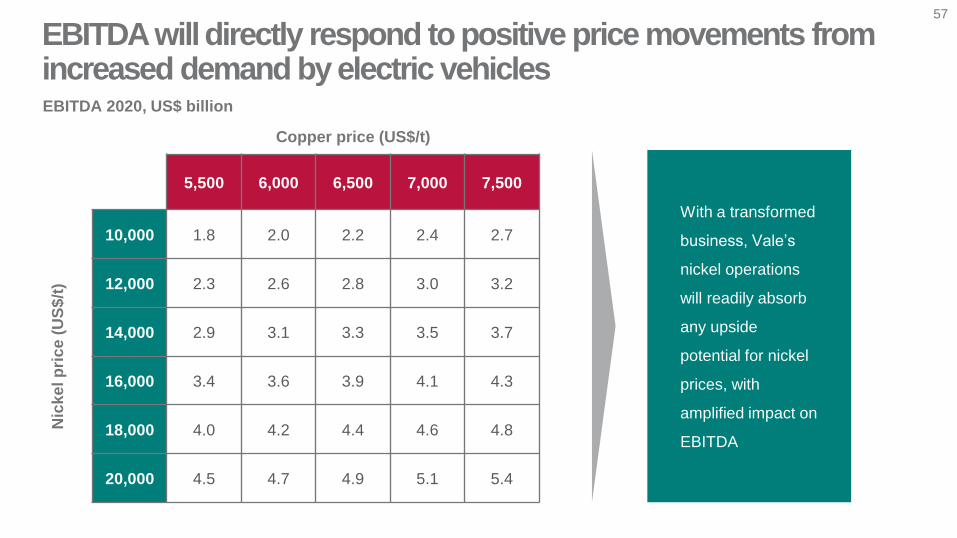
EBITDA will directly respond to positive price movements from increased demand by electric vehicles
With a transformed
business, Vale’s
nickel operations
will readily absorb
any upside
potential for nickel
prices, with
amplified impact on
EBITDA
Copper price (US$/t)
5,500 6,000 6,500 7,000 7,500
Nic
ke
l p
ric
e (
US
$/t
)
10,000 1.8 2.0 2.2 2.4 2.7
12,000 2.3 2.6 2.8 3.0 3.2
14,000 2.9 3.1 3.3 3.5 3.7
16,000 3.4 3.6 3.9 4.1 4.3
18,000 4.0 4.2 4.4 4.6 4.8
20,000 4.5 4.7 4.9 5.1 5.4
57
EBITDA 2020, US$ billion
Luciano Siani PiresCFO
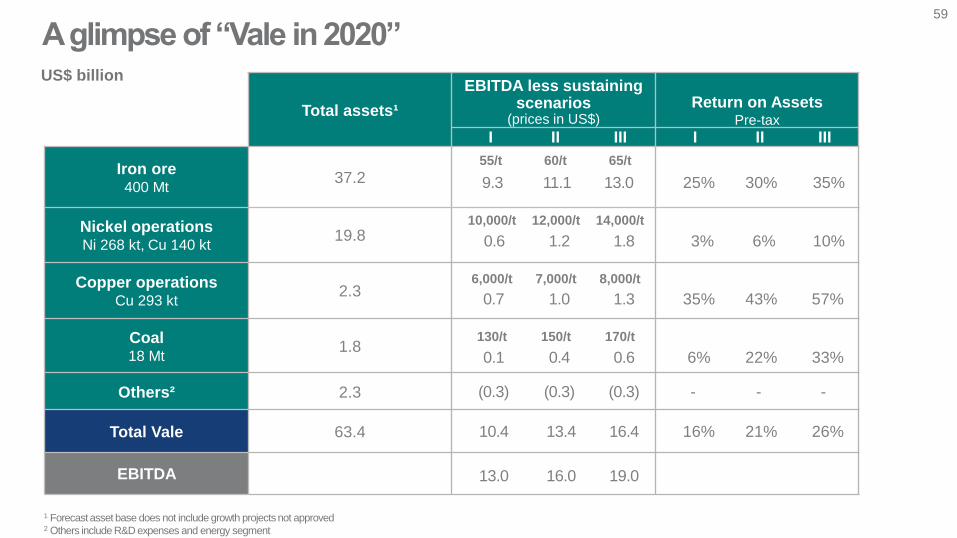
1 Forecast asset base does not include growth projects not approved2 Others include R&D expenses and energy segment
Total assets¹
EBITDA less sustaining scenarios
(prices in US$)Return on Assets
Pre-tax
Iron ore400 Mt
37.2
Nickel operationsNi 268 kt, Cu 140 kt
19.8
Copper operationsCu 293 kt
2.3
Coal18 Mt
1.8
Others² 2.3
Total Vale 63.4
EBITDA
I
9.3 11.1 13.0
II III I II III
0.6 1.2 1.8
25% 30% 35%
3% 6% 10%
55/t 60/t 65/t
10,000/t 12,000/t 14,000/t
0.7 1.0 1.3
6,000/t 7,000/t 8,000/t
0.1 0.4 0.6
130/t 150/t 170/t
(0.3) (0.3) (0.3) - - -
35% 43% 57%
6% 22% 33%
10.4 13.4 16.4 16% 21% 26%
A glimpse of “Vale in 2020” 59
US$ billion
13.0 16.0 19.0
1
60
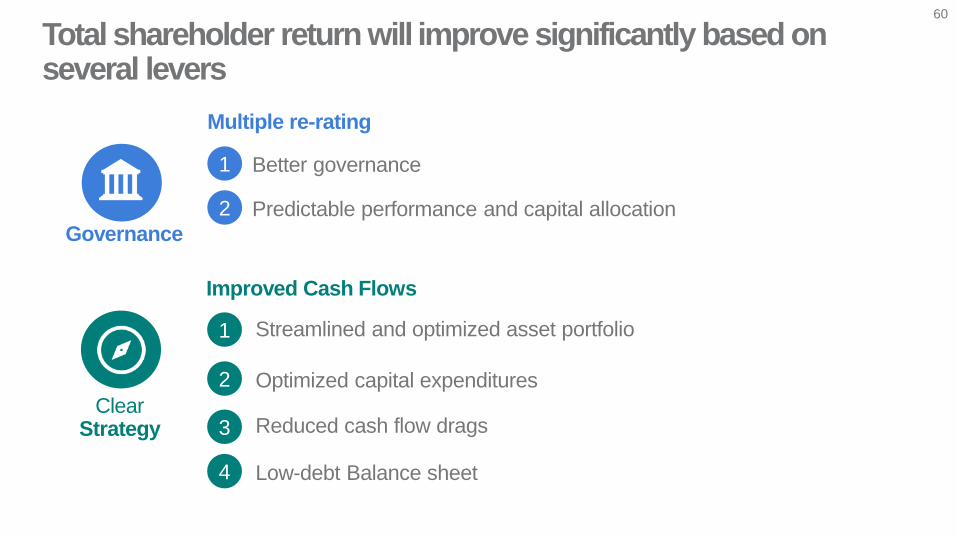
Improved Cash Flows
Low-debt Balance sheet
1
2
3
Multiple re-rating
Optimized capital expenditures
Streamlined and optimized asset portfolio
Reduced cash flow drags
4
Total shareholder return will improve significantly based on several levers
Better governance
Predictable performance and capital allocation2
Governance
ClearStrategy
61
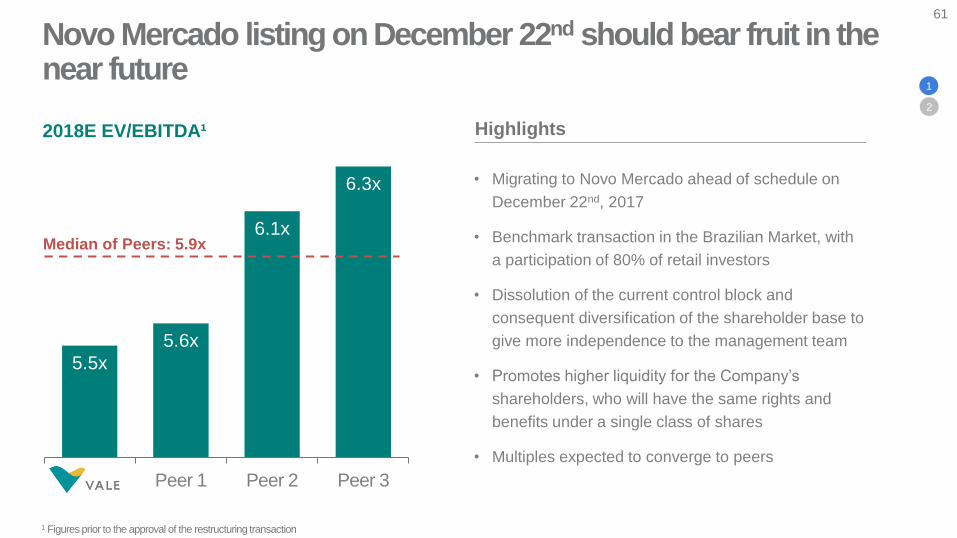
Highlights
• Migrating to Novo Mercado ahead of schedule on
December 22nd, 2017
• Benchmark transaction in the Brazilian Market, with
a participation of 80% of retail investors
• Dissolution of the current control block and
consequent diversification of the shareholder base to
give more independence to the management team
• Promotes higher liquidity for the Company’s
shareholders, who will have the same rights and
benefits under a single class of shares
• Multiples expected to converge to peers
1
5.5x
5.6x
6.1x
6.3x
Peer 1 Peer 2 Peer 3
2018E EV/EBITDA¹
Novo Mercado listing on December 22nd should bear fruit in the near future
2
Median of Peers: 5.9x
1 Figures prior to the approval of the restructuring transaction
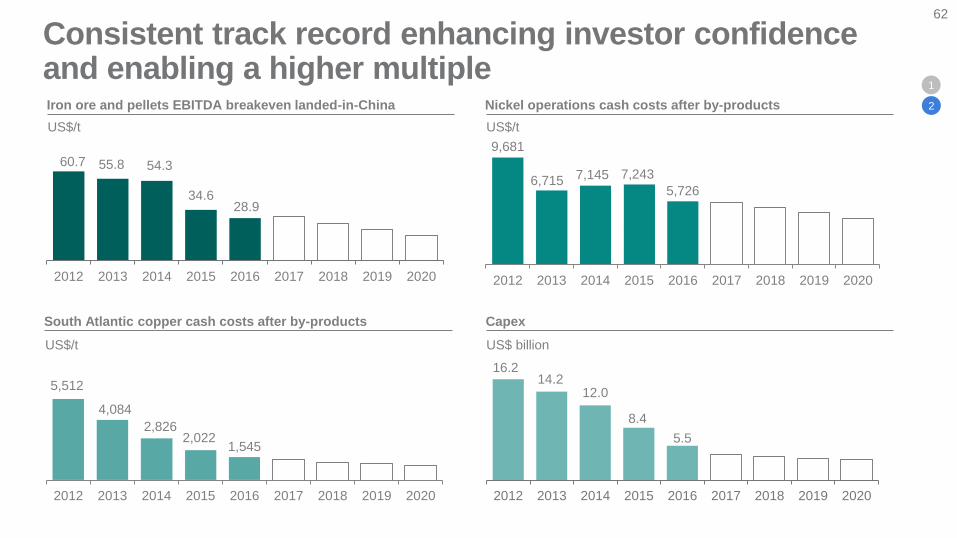
Capex
16.214.2
12.0
8.4
5.5
2012 2013 2014 2015 2016 2017 2018 2019 2020
Nickel operations cash costs after by-products
9,681
6,715 7,145 7,243
5,726
2012 2013 2014 2015 2016 2017 2018 2019 2020
Consistent track record enhancing investor confidence and enabling a higher multiple Iron ore and pellets EBITDA breakeven landed-in-China
South Atlantic copper cash costs after by-products
60.7 55.8 54.3
34.628.9
2012 2013 2014 2015 2016 2017 2018 2019 2020
5,512
4,084
2,8262,022
1,545
2012 2013 2014 2015 2016 2017 2018 2019 2020
US$/t
US$/tUS$/t
US$ billion
2
1
62
1
2
3
4
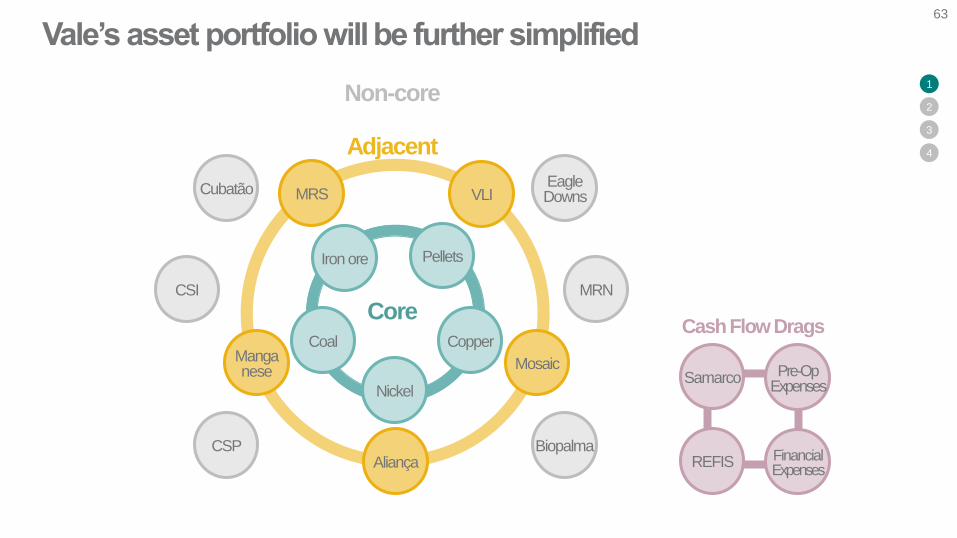
Vale’s asset portfolio will be further simplified
CubatãoEagleDowns
BiopalmaCSPAliança
Mosaic
VLIMRS
Manganese
Iron ore
Coal
Nickel
Copper
Pellets
Core
Adjacent
Non-core
Samarco
REFIS
Pre-OpExpenses
FinancialExpenses
Cash Flow Drags
MRNCSI
63
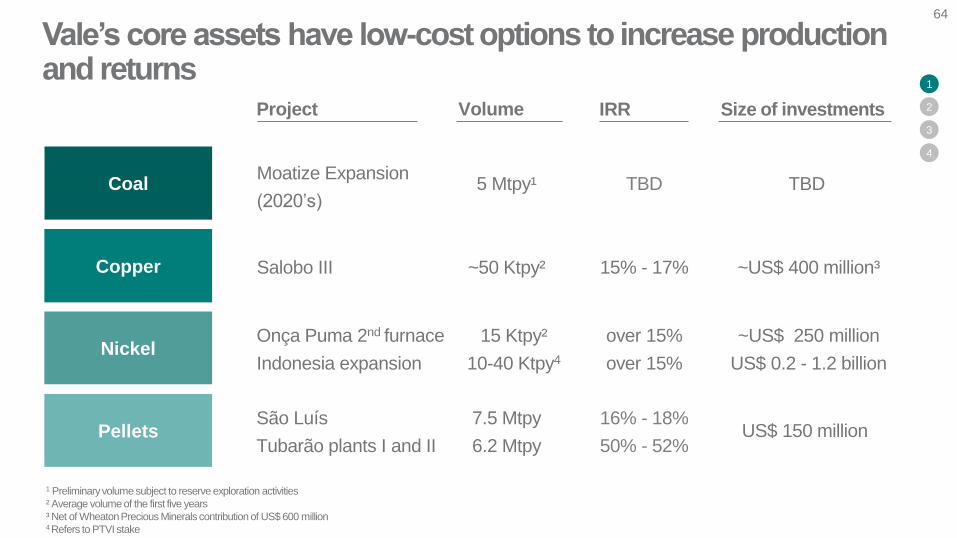
Vale’s core assets have low-cost options to increase production and returns
Coal
Copper
Nickel
Pellets
Volume IRR Size of investments Project
Moatize Expansion
(2020’s)
Salobo III
Onça Puma 2nd furnace
Indonesia expansion
São Luís
Tubarão plants I and II
5 Mtpy¹
~50 Ktpy²
15 Ktpy²
10-40 Ktpy4
7.5 Mtpy
6.2 Mtpy
TBD
15% - 17%
over 15%
over 15%
16% - 18%
50% - 52%
TBD
~US$ 400 million³
~US$ 250 million
US$ 0.2 - 1.2 billion
US$ 150 million
64
1 Preliminary volume subject to reserve exploration activities
² Average volume of the first five years
³ Net of Wheaton Precious Minerals contribution of US$ 600 million4 Refers to PTVI stake
1
2
3
4
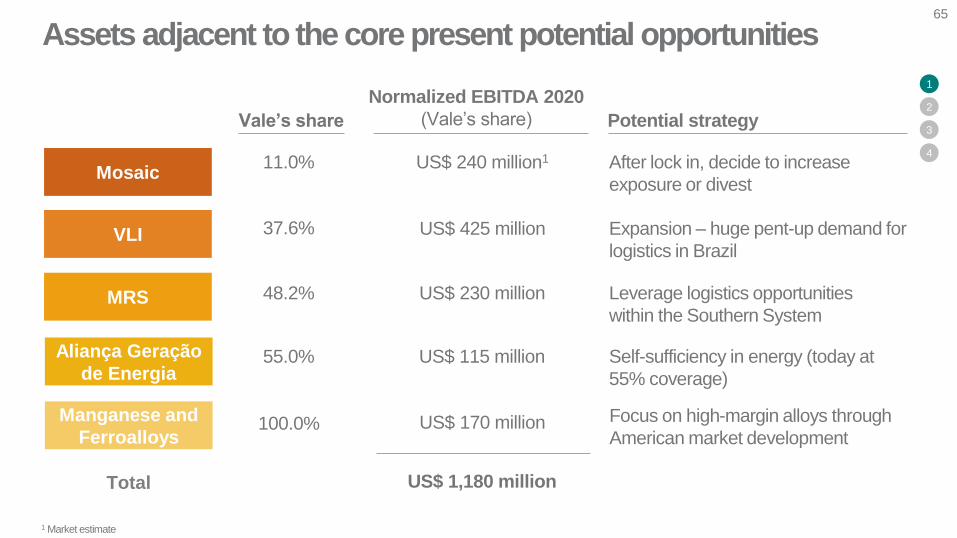
Mosaic
VLI
MRS
Manganese and
Ferroalloys
Aliança Geração
de Energia
Assets adjacent to the core present potential opportunities
Total
65
1 Market estimate
1
2
3
4
Potential strategy
After lock in, decide to increase
exposure or divest
Expansion – huge pent-up demand for
logistics in Brazil
Leverage logistics opportunities
within the Southern System
Self-sufficiency in energy (today at
55% coverage)
Vale’s share
11.0%
37.6%
48.2%
55.0%
100.0% Focus on high-margin alloys through
American market development
Normalized EBITDA 2020
(Vale’s share)
US$ 240 million1
US$ 425 million
US$ 230 million
US$ 115 million
US$ 170 million
US$ 1,180 million
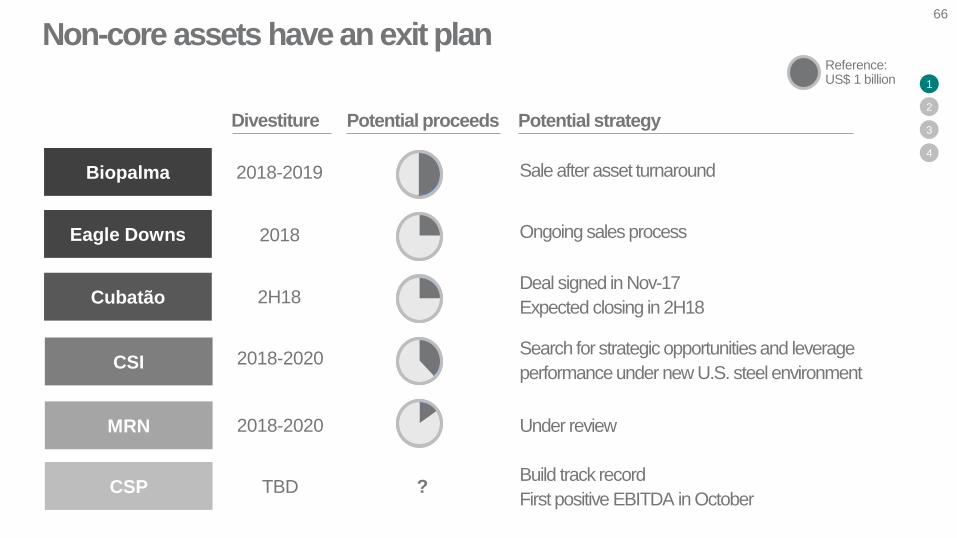
Potential proceeds Potential strategyDivestiture
2018-2019
2018
2H18
Sale after asset turnaround
Ongoing sales process
Deal signed in Nov-17
Expected closing in 2H18
1
2
3
4
Biopalma
Eagle Downs
Cubatão
2018-2020 Under reviewMRN
CSI 2018-2020Search for strategic opportunities and leverage
performance under new U.S. steel environment
Non-core assets have an exit plan
CSP TBDBuild track record
First positive EBITDA in October?
Reference:US$ 1 billion
66
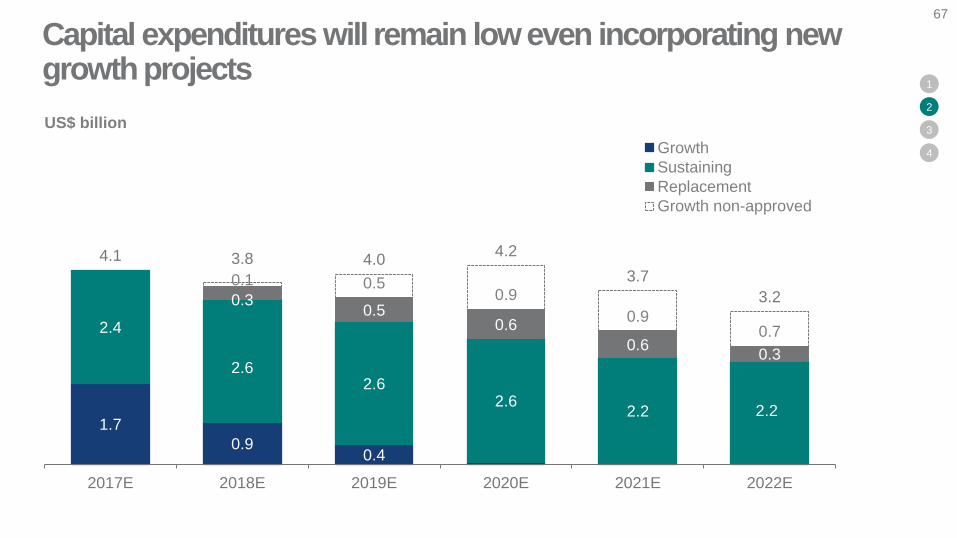
1.7
0.90.4
2.4
2.62.6
2.62.2 2.2
0.30.5
0.6
0.60.3
0.1 0.50.9
0.90.7
4.1 3.8 4.04.2
3.7
3.2
2017E 2018E 2019E 2020E 2021E 2022E
Growth
Sustaining
Replacement
Growth non-approved
US$ billion
1
2
3
4
Capital expenditures will remain low even incorporating new growth projects
67
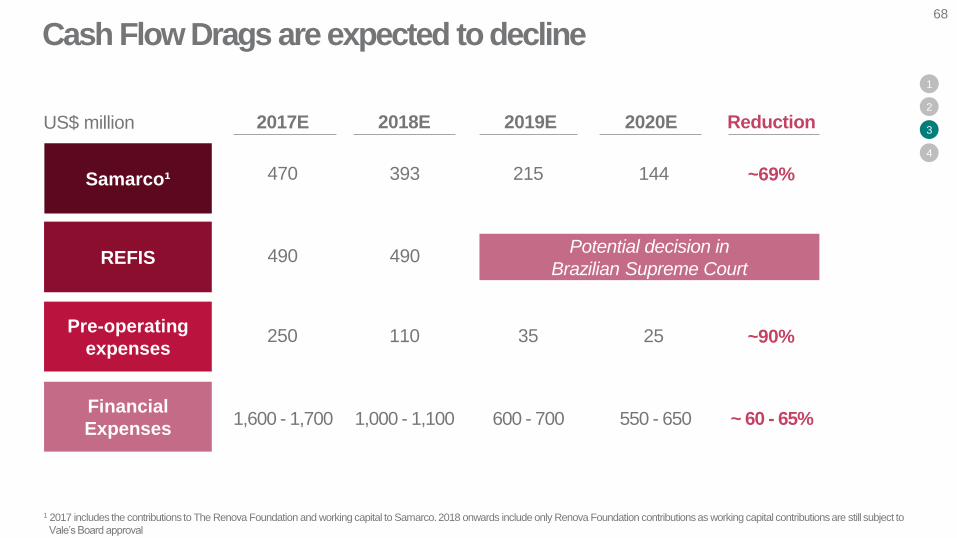
2018E 2019E2017E 2020E Reduction
470
490
250
1,600 - 1,700
393
490
110
1,000 - 1,100
215
35
600 - 700
144
25
550 - 650
~69%
~90%
~ 60 - 65%
1 2017 includes the contributions to The Renova Foundation and working capital to Samarco. 2018 onwards include only Renova Foundation contributions as working capital contributions are still subject to
Vale’s Board approval
US$ million
Cash Flow Drags are expected to decline
1
2
3
4
68
Samarco¹
REFIS
Pre-operating
expenses
Financial
Expenses
Potential decision in
Brazilian Supreme Court
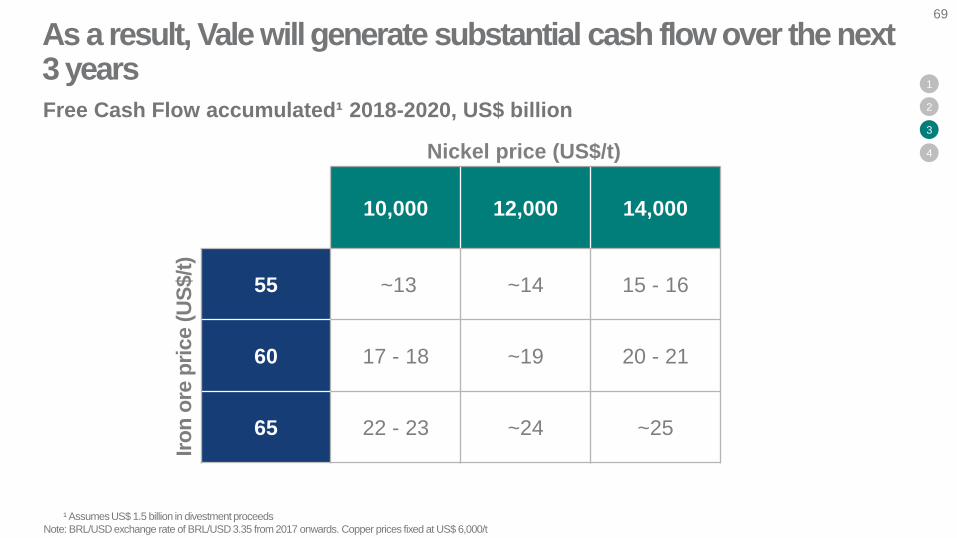
Free Cash Flow accumulated¹ 2018-2020, US$ billion
10,000 12,000 14,000
55 ~13 ~14 15 - 16
60 17 - 18 ~19 20 - 21
65 22 - 23 ~24 ~25
¹ Assumes US$ 1.5 billion in divestment proceeds
Note: BRL/USD exchange rate of BRL/USD 3.35 from 2017 onwards. Copper prices fixed at US$ 6,000/t
1
2
3
4
As a result, Vale will generate substantial cash flow over the next 3 years
69
Nickel price (US$/t)
Iro
n o
re p
rice (
US
$/t
)
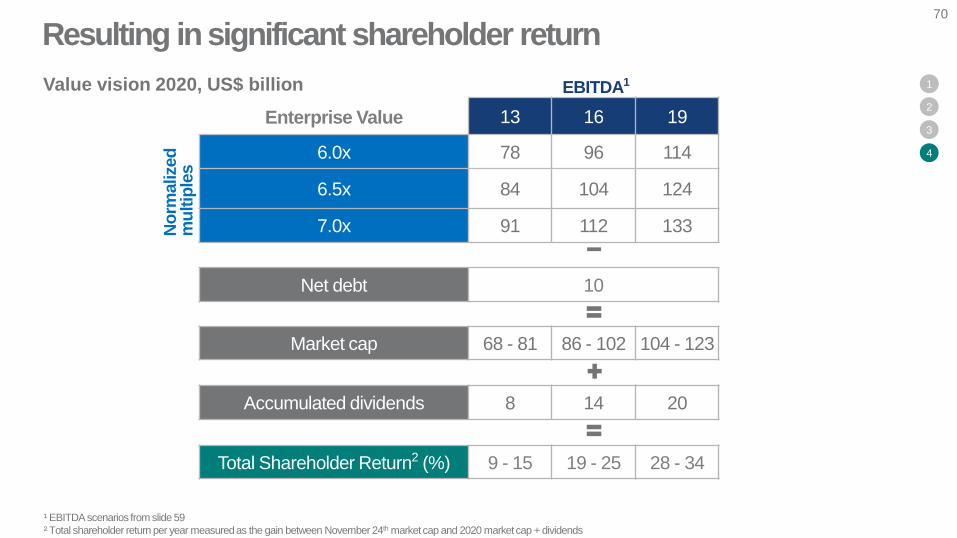
Enterprise Value 13 16 19
6.0x 78 96 114
6.5x 84 104 124
7.0x 91 112 133
Net debt 10
Market cap 68 - 81 86 - 102 104 - 123
Accumulated dividends 8 14 20
Total Shareholder Return2 (%) 9 - 15 19 - 25 28 - 34
¹ EBITDA scenarios from slide 59
² Total shareholder return per year measured as the gain between November 24th market cap and 2020 market cap + dividends
Value vision 2020, US$ billion
Resulting in significant shareholder return70
No
rmalized
m
ultip
les
EBITDA1 1
2
3
4