The Power of 10 Draft 3 - TravelBiz Monitor · Total Total 157,919 172,484 9.2 14,565 Overall,...
29
THE POWER OF 10 ASEAN Tourism in 2013 A discussion paper from: The College of Innovation Service Innovation Program Thammasat University Bangkok, Thailand Prepared by: Service Innovation and Development Unit January 17, 2013
Transcript of The Power of 10 Draft 3 - TravelBiz Monitor · Total Total 157,919 172,484 9.2 14,565 Overall,...

THE POWER OF 10 ASEAN Tourism in 2013
A discussion paper from: The College of Innovation
Service Innovation Program Thammasat University
Bangkok, Thailand Prepared by: Service Innovation and Development Unit
January 17, 2013

Page 3 /29
The Power of 10
INTRODUCTION The bloc of economies that collectively form the ASEAN community are likely to see their aggregate international inbound arrivals reach an historic peak of around 100 million in 2013 reaching a new record for foreign inbound arrivals and quite possibly passing that level for the first time ever. This suggests growth of between 10%-11% over 2012 and would add more than nine million additional arrivals to the collective inbound count from 2012. Preliminary CY2013 data from the Ministry of Hotels and Tourism suggest that Myanmar will dominate the region’s annual percentage gain in foreign inbound arrivals with an increase of almost 52%, in arrivals by air, year-on-year. In addition, land border crossings look to have increased by a factor of almost 1.5 times that of 2012 to reach 1.144 million arrivals1. Thailand2 ended the year with a gain of close to 20%, and is likely to be followed by Cambodia and Lao PDR with gains of 17% and 13% respectively. Preliminary full year data from Vietnam also suggest a double-digit increase of close to 11%.
Table 1: Estimates of foreign arrivals into ASEAN destinations, 2013 (Ranked by % growth 2013e/2012)
Volume Gain
Destination % Gain ('000) Myanmar* 51.7 306.780 Thailand* 19.6 4,381.680 Cambodia 17.0 610.776 Lao PDR 13.0 433.718 Vietnam* 10.4 669.585 Philippines 9.9 423.066 Brunei 8.1 16.851 Indonesia 7.2 575.514 Singapore 6.9 994.272 Malaysia 2.9 714.456 ASEAN 10.3 9,126.699
Note: Destinations marked * have submitted preliminary 2013 full year arrivals data.
Data for Myanmar is for air arrivals only. Other estimates produced by author based on arrivals to date. A high degree of uncertainly exists with the Philippines estimate due to the impacts of super typhoon Yolanda. All data are subject to revision.
No destinations within the ASEAN bloc showed contraction through 2013. The volume increase is likely to be over nine million additional foreign arrivals, at least on the metrics as presented here, with Thailand accounting for just under half of those additional visits (48%). Singapore stands to gain close to a million additional foreign arrivals followed by Cambodia, Indonesia, Malaysia and Vietnam, each of whom are likely to see their respective inbound counts increase by a half-million or more.
1 Preliminary data 2013, includes day-trippers 2 Preliminary data for CY 2013 3 Origin data for Indonesia is not yet available for 2013; as at January 14, 2014; some variation between aggregate 2 Preliminary data for CY 2013

Page 4 /29
The Power of 10
SOURCE MARKETS3 While a full listing of origin markets is not yet available, a comparative analysis of available data for the same periods of 2012 and 2013, year to date (for those destinations that have released such data) shows some interesting movements. Asia At the aggregate level for example, it appears that Asia not only dominates the volume of foreign arrivals into Southeast Asia with a year-to-date increase of around 14%, but is also supplying the lion’s share of those arrivals – well over 54 million so far this year, an annual increase thus far of more than 6.7 million.
Table 2: Foreign arrivals into ASEAN, year to date 2013, by origin regions
Change YTD
Origin Region 2012 2013 % Volume Asia 47,670,849 54,395,954 14.1 6,725,105 Europe 9,246,090 10,202,944 10.3 956,854 Americas 3,096,567 3,252,455 5.0 155,888 Pacific 2,682,264 2,775,974 3.5 93,710 Africa 262,672 279,261 6.3 16,589 Other 840,840 822,336 -2.2 -18,504 Total 63,799,282 71,728,924 12.4 7,929,642
As a source region, Asia is well ahead of Europe, however the latter has still added close on a million additional foreign arrivals to this cluster of destinations so far this year and in terms of generating visitor arrivals, is still well ahead of the other origin regions. Within the Asia origin cluster, it is perhaps no surprise to see that Northeast and Southeast Asia supply the bulk of arrivals to the ASEAN bloc, generating over 50 million arrivals between them and being responsible for almost 97% of the additional arrivals from Asia into Southeast Asia for the period under review. Between them these two origin sub-regions also supplied 82% of the additional arrivals from all sources.
Table 3: Foreign arrivals from Asia sub-regions into ASEAN year to date 2013
Change YTD
Origin Sub-region 2012 2013 % Volume Northeast Asia 16,054,503 20,280,865 26.3 4,226,362 Southeast Asia 27,786,570 30,074,444 8.2 2,287,874 Other Asia 82,451 204,842 148.4 122,391 South Asia 2,866,528 2,929,148 2.2 62,620 West Asia 878,680 903,902 2.9 25,222 Central 2,117 2,753 30.0 636 Total Origin Asia 47,670,849 54,395,954 14.1 6,725,105
3 Origin data for Indonesia is not yet available for 2013; as at January 14, 2014; some variation between aggregate counts and arrivals by origin may (and do) occur.

Page 5 /29
The Power of 10
Northeast Asia has been the star supplier of arrivals so far however, with an increase of over 26% year-to-date, while Southeast Asia, slipped to around eight percent - still a strong performance but at less than a third of the growth shown by Northeast Asia. At the single origin level, 12 source markets have generated in excess of 100,000 additional arrivals so far this year; China leads the way with an increase of more than 3.2 million to create a year to date numeric base now coming very close to that of Singapore.
Table 4: Top Asian source markets into ASEAN, year to date 2013 (Ranked by annual volume increase)
ASEAN Change YTD
Origin 2013 (mns) % Volume (mns) China 10.343 45.4 3.230 Malaysia 4.237 14.1 0.523 Indonesia 4.075 11.6 0.424 Vietnam 2.601 18.7 0.409 Korea (ROK) 3.895 11.1 0.390 Singapore 10.828 3.3 0.347 Japan 3.532 10.7 0.342 Lao PDR 1.633 18.3 0.252 Hong Kong SAR 0.960 18.5 0.150 Thailand 3.275 4.1 0.129 Chinese Taipei 1.532 8.2 0.117 Philippines 1.324 9.2 0.112
ASEAN Within the context of Asian source markets, the ASEAN-to-ASEAN flows are significant, with markets originating within Southeast Asia having generated more than 30 million intra-ASEAN arrivals during this 2013 year to date period.
Table 5: ASEAN source markets into ASEAN, year to date 2013
Change YTD
Origin 2012 2013 % Volume Malaysia 3,713,986 4,236,726 14.1 522,740 Indonesia 3,650,325 4,074,544 11.6 424,219 Vietnam 2,191,882 2,601,252 18.7 409,370 Singapore 10,481,339 10,828,048 3.3 346,709 Lao PDR 1,381,109 1,633,248 18.3 252,139 Thailand 3,145,760 3,275,219 4.1 129,459 Philippines 1,211,580 1,323,607 9.2 112,027 Myanmar 249,979 299,465 19.8 49,486 Cambodia 806,182 843,645 4.6 37,463 Brunei 933,064 933,456 0.0 392 Other Southeast Asia 21,364 25,234 18.1 3,870 Total Origin ASEAN 27,786,570 30,074,444 8.2 2,287,874

Page 6 /29
The Power of 10
Furthermore, seven of the ten ASEAN origin markets have generated in excess of 100,000 additional arrivals into ASEAN destinations during the period under review, led by Malaysia, Indonesia, Vietnam and Singapore amongst others. A number of ASEAN origin-destination pairs have seen gains in excess of 100,000 additional arrivals in the year to date period, particularly the flows between Malaysia and Thailand, but also from Indonesia, which has shown significant increases into each of Malaysia, Thailand and Singapore.
Table 6: Main origin-destination pairs across ASEAN, year to date 2013 (Ranked by volume gain >100,000 ytd)
2013 YTD Change YTD
Origin Destination IVAs (mns) % Volume Malaysia Thailand 2.996 17.3 441,674 Singapore Malaysia 9.474 2.3 216,494 Vietnam Thailand 0.787 27.3 168,631 Lao PDR Cambodia 0.376 67.2 151,209 Indonesia Malaysia 1.862 8.8 150,805 Vietnam Lao PDR 0.652 27.7 141,423 Indonesia Thailand 0.589 31.5 141,259 Lao PDR Thailand 1.106 13.3 130,081 Thailand Lao PDR 1.531 8.0 113,752 Indonesia Singapore 1.475 8.0 109,263 Singapore Thailand 0.936 12.7 105,262
Interestingly, while travel between Malaysia and Thailand has been on the increase, the reverse is not the case; arrivals from Thailand to Malaysia have in fact decreased by almost 12% during the January to September period, creating a shortfall of more than 112,000 visits.

Page 7 /29
The Power of 10
ASEAN by Destination Brunei Darussalam Data for Brunei Darussalam are supplied by the Ministry of Industry and Primary Resources and cover foreign arrivals by air at Brunei International Airport (BWN), for the period January to September 2012 & 2013. Data are reported by nationality.
Table 7: Foreign arrivals into Brunei Darussalam by air & origin sub-region (Jan-Sep 2012 & 2013)
Origin Jan-Sept YTD Change
Region Sub-region 2012 2013 % Volume Americas North 4,631 5,671 22.5 1,040
Sub-total 4,631 5,671 22.5 1,040
Asia Northeast 30,042 32,406 7.9 2,364
South 5,872 7,375 25.6 1,503
Southeast 88,204 93,665 6.2 5,461
West 722 542 -24.9 -180
Sub-total 124,840 133,988 7.3 9,148
Europe Eastern 648 969 49.5 321
Northern 9,462 11,010 16.4 1,548
Southern 827 834 0.8 7
Western 4,223 4,715 11.7 492
Sub-total 15,160 17,528 15.6 2,368
Pacific Oceania 10,284 12,394 20.5 2,110
Sub-total 10,284 12,394 20.5 2,110
Others Others 3,004 2,903 -3.4 -101
Sub-total 3,004 2,903 -3.4 -101
Total Total 157,919 172,484 9.2 14,565 Overall, Brunei has seen a solid increase in foreign arrivals by air with a year-to-date increase of 14,565 visits during the first nine months of 2013, relative to the same period last year. The bulk of this increase has come from Asia (63%), specifically from Southeast Asia source markets (38%), but with additional support from Europe (16%) and the Pacific (15%) and to a lesser degree the Americas (7%). The top ten source markets for Brunei YTD are as shown below; collectively they delivered more than 83% of Brunei’s foreign inbound mix (by air) in the nine months to September 2013.

Page 8 /29
The Power of 10
Table 8: Top ten foreign source markets into Brunei Darussalam by air (Jan-Sep 2012 & 2013, ranked by volume)
IVAs Relative share (%)
Nationality Jan-Sep
2013 Origin Cumulative Malaysia 42,989 24.9 24.9 China 23,851 13.8 38.8 Indonesia 14,803 8.6 47.3 Philippines 13,998 8.1 55.4 Singapore 13,529 7.8 63.3 Australia 11,125 6.4 69.7 UK 9,518 5.5 75.3 Thailand 4,933 2.9 78.1 India 4,664 2.7 80.8 Japan 4,235 2.5 83.3 Sub-total 143,645 83.3 Total 172,484
During the first nine months of 2013, Malaysia remains the single most important source market for Brunei and accounted for almost one-quarter of all foreign arrivals by air. Collectively, the top ten origin markets accounted for over 80% of all foreign air arrivals, while five ASEAN source markets appeared in this rankings table with a combined share of more than 50% of the total foreign inbound count.
Page 9 /29
The Power of 10
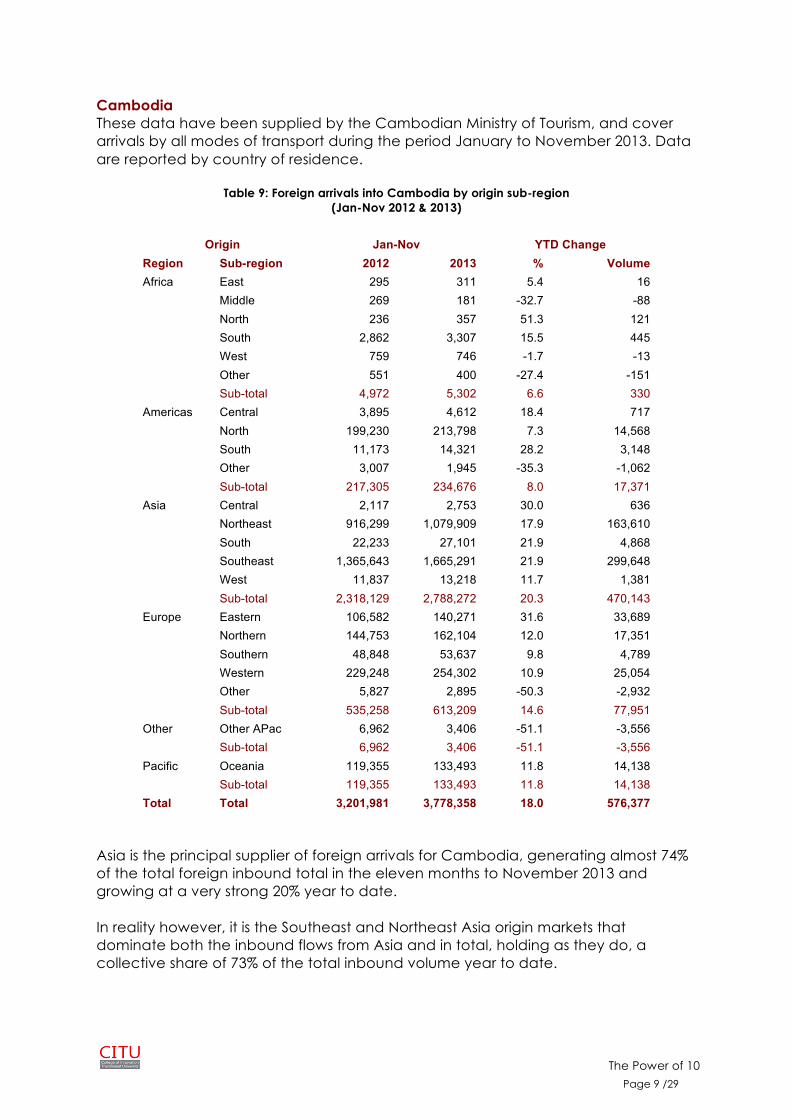
Cambodia These data have been supplied by the Cambodian Ministry of Tourism, and cover arrivals by all modes of transport during the period January to November 2013. Data are reported by country of residence.
Table 9: Foreign arrivals into Cambodia by origin sub-region (Jan-Nov 2012 & 2013)
Origin Jan-Nov YTD Change
Region Sub-region 2012 2013 % Volume Africa East 295 311 5.4 16
Middle 269 181 -32.7 -88
North 236 357 51.3 121
South 2,862 3,307 15.5 445
West 759 746 -1.7 -13
Other 551 400 -27.4 -151
Sub-total 4,972 5,302 6.6 330
Americas Central 3,895 4,612 18.4 717
North 199,230 213,798 7.3 14,568
South 11,173 14,321 28.2 3,148
Other 3,007 1,945 -35.3 -1,062
Sub-total 217,305 234,676 8.0 17,371
Asia Central 2,117 2,753 30.0 636
Northeast 916,299 1,079,909 17.9 163,610
South 22,233 27,101 21.9 4,868
Southeast 1,365,643 1,665,291 21.9 299,648
West 11,837 13,218 11.7 1,381
Sub-total 2,318,129 2,788,272 20.3 470,143
Europe Eastern 106,582 140,271 31.6 33,689
Northern 144,753 162,104 12.0 17,351
Southern 48,848 53,637 9.8 4,789
Western 229,248 254,302 10.9 25,054
Other 5,827 2,895 -50.3 -2,932
Sub-total 535,258 613,209 14.6 77,951
Other Other APac 6,962 3,406 -51.1 -3,556
Sub-total 6,962 3,406 -51.1 -3,556
Pacific Oceania 119,355 133,493 11.8 14,138
Sub-total 119,355 133,493 11.8 14,138
Total Total 3,201,981 3,778,358 18.0 576,377 Asia is the principal supplier of foreign arrivals for Cambodia, generating almost 74% of the total foreign inbound total in the eleven months to November 2013 and growing at a very strong 20% year to date. In reality however, it is the Southeast and Northeast Asia origin markets that dominate both the inbound flows from Asia and in total, holding as they do, a collective share of 73% of the total inbound volume year to date.
Page 10 /29
The Power of 10
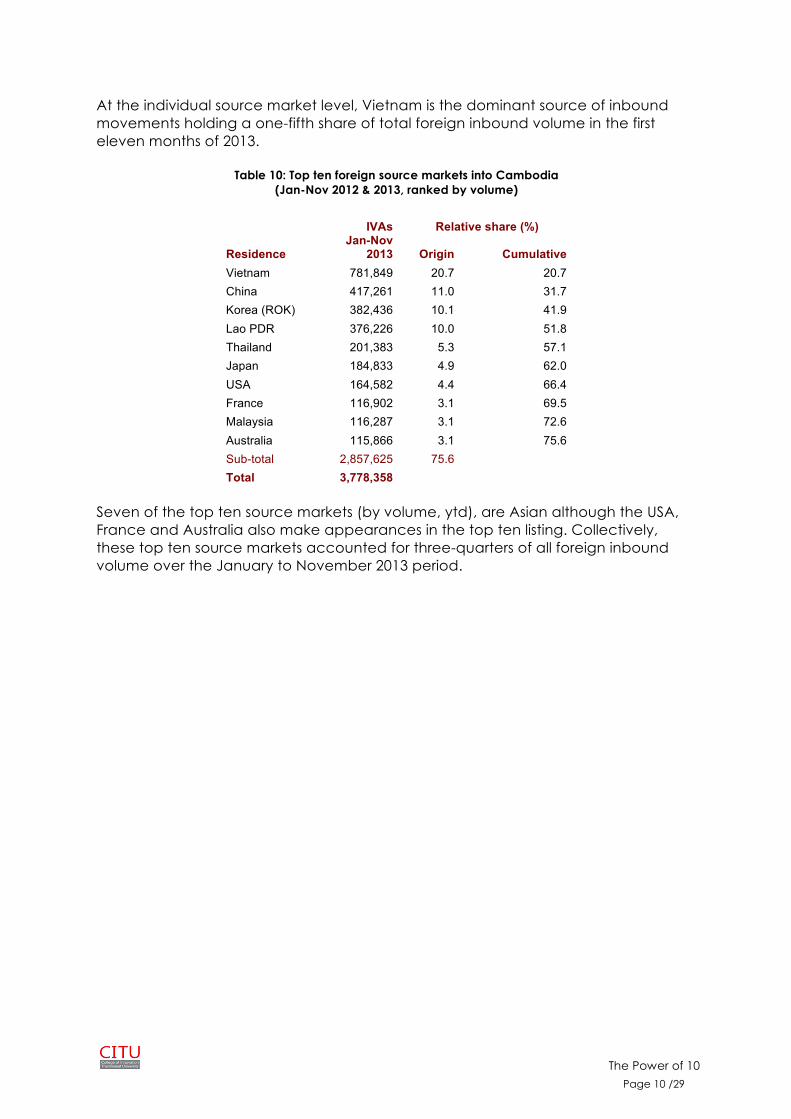
At the individual source market level, Vietnam is the dominant source of inbound movements holding a one-fifth share of total foreign inbound volume in the first eleven months of 2013.
Table 10: Top ten foreign source markets into Cambodia (Jan-Nov 2012 & 2013, ranked by volume)
IVAs Relative share (%)
Residence Jan-Nov
2013 Origin Cumulative Vietnam 781,849 20.7 20.7 China 417,261 11.0 31.7 Korea (ROK) 382,436 10.1 41.9 Lao PDR 376,226 10.0 51.8 Thailand 201,383 5.3 57.1 Japan 184,833 4.9 62.0 USA 164,582 4.4 66.4 France 116,902 3.1 69.5 Malaysia 116,287 3.1 72.6 Australia 115,866 3.1 75.6 Sub-total 2,857,625 75.6
Total 3,778,358
Seven of the top ten source markets (by volume, ytd), are Asian although the USA, France and Australia also make appearances in the top ten listing. Collectively, these top ten source markets accounted for three-quarters of all foreign inbound volume over the January to November 2013 period.

Page 11 /29
The Power of 10
Indonesia Data are supplied by Statistics Indonesia and cover the period January to November 2013. Disaggregated data have not been published as yet, so the following information relates to aggregate foreign arrivals through all entry points.
Table 11: Foreign arrivals into Indonesia by entry point (Jan-Nov 2012 & 2013)
INDONESIA Jan-Nov YTD Change Relative share (%) Entry point 2012 2013 % Volume 2013 YTD Ngurah Rai 2,637,759 2,948,928 11.8 311,169 35.3 Soekarno-Hatta 1,876,515 2,051,497 9.3 174,982 24.5 Batam 1,082,240 1,182,633 9.3 100,393 14.1 Tanjung Uban 305,523 286,225 -6.3 -19,298 3.4 Juanda 180,821 203,994 12.8 23,173 2.4 Polonia 184,146 197,602 7.3 13,456 2.4 Husein Sastranegara 128,591 152,113 18.3 23,522 1.8 Tanjung Balai Karimun 96,394 94,196 -2.3 -2,198 1.1 Tanjung Pinang 93,013 89,265 -4.0 -3,748 1.1 Adi Sucipto 51,988 75,165 44.6 23,177 0.9 Tanjung Priok 59,758 60,114 0.6 356 0.7 Minangkabau 28,605 38,589 34.9 9,984 0.5 Bandara 14,505 32,697 125.4 18,192 0.4 All other entry points 537,638 528,456 -1.7 -9,182 6.3 Total all entry points 7,277,496 7,941,474 9.1 663,978 100.0
Note: While the ‘All other entry points’ aggregate is substantial, either none of these entry points have received more than 30,000 arrivals in the January to November 2013 period, or they were not individually identified. Clearly, the airports of Ngurah Rai (DPS - Denpasar International Airport), and Soekarno-Hatta (Jakarta – CGK), dominate the gateways into Indonesia, capturing close to 60% of all foreign inbound traffic in the first eleven months of 2013. Some of the smaller gateways are showing significant percentage increases however, albeit off a very much smaller numeric base, and could be worth tracking over the next few years. Minangkabau (Sumatra – PDG), Adi Sucipto (Yogyakarta, Java - JOG) and Bandara international airports (Lombok - LOP) for example are showing year to date growth rates of 35%, 45% and 125% respectively and could produce significant arrival numbers in the future, if those levels of annual increase remain for the next few years at least.
Page 12 /29
The Power of 10
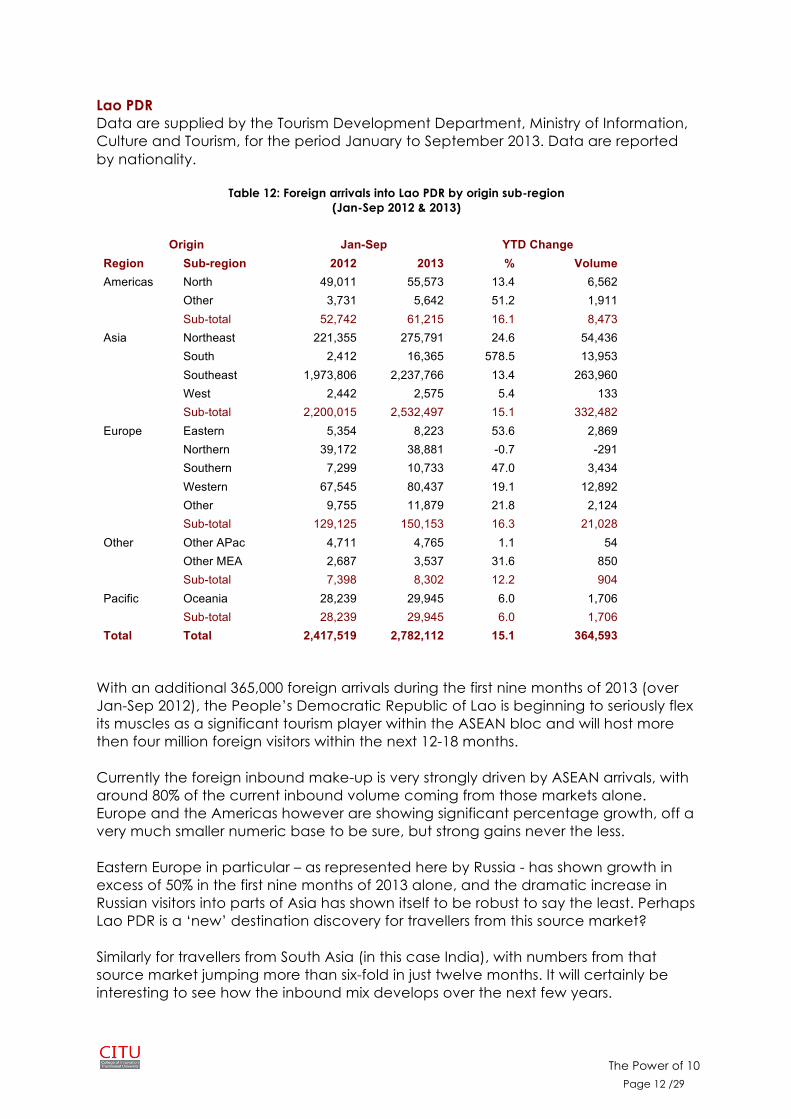
Lao PDR Data are supplied by the Tourism Development Department, Ministry of Information, Culture and Tourism, for the period January to September 2013. Data are reported by nationality.
Table 12: Foreign arrivals into Lao PDR by origin sub-region (Jan-Sep 2012 & 2013)
Origin Jan-Sep YTD Change
Region Sub-region 2012 2013 % Volume Americas North 49,011 55,573 13.4 6,562
Other 3,731 5,642 51.2 1,911
Sub-total 52,742 61,215 16.1 8,473
Asia Northeast 221,355 275,791 24.6 54,436
South 2,412 16,365 578.5 13,953
Southeast 1,973,806 2,237,766 13.4 263,960
West 2,442 2,575 5.4 133
Sub-total 2,200,015 2,532,497 15.1 332,482
Europe Eastern 5,354 8,223 53.6 2,869
Northern 39,172 38,881 -0.7 -291
Southern 7,299 10,733 47.0 3,434
Western 67,545 80,437 19.1 12,892
Other 9,755 11,879 21.8 2,124
Sub-total 129,125 150,153 16.3 21,028
Other Other APac 4,711 4,765 1.1 54
Other MEA 2,687 3,537 31.6 850
Sub-total 7,398 8,302 12.2 904
Pacific Oceania 28,239 29,945 6.0 1,706
Sub-total 28,239 29,945 6.0 1,706
Total Total 2,417,519 2,782,112 15.1 364,593 With an additional 365,000 foreign arrivals during the first nine months of 2013 (over Jan-Sep 2012), the People’s Democratic Republic of Lao is beginning to seriously flex its muscles as a significant tourism player within the ASEAN bloc and will host more then four million foreign visitors within the next 12-18 months. Currently the foreign inbound make-up is very strongly driven by ASEAN arrivals, with around 80% of the current inbound volume coming from those markets alone. Europe and the Americas however are showing significant percentage growth, off a very much smaller numeric base to be sure, but strong gains never the less. Eastern Europe in particular – as represented here by Russia - has shown growth in excess of 50% in the first nine months of 2013 alone, and the dramatic increase in Russian visitors into parts of Asia has shown itself to be robust to say the least. Perhaps Lao PDR is a ‘new’ destination discovery for travellers from this source market? Similarly for travellers from South Asia (in this case India), with numbers from that source market jumping more than six-fold in just twelve months. It will certainly be interesting to see how the inbound mix develops over the next few years.

Page 13 /29
The Power of 10
For the moment however, the ASEAN neighbours of Thailand and Vietnam generate the bulk of foreign visitors into Lao PDR. Between them they currently hold a better than 78% share of all foreign inbound traffic into Lao PDR, for the period January to September 2013 at least.
Table 13: Top ten foreign source markets into Lao PDR (Jan-Sep 2012 & 2013, ranked by volume)
IVAs Relative share (%)
Residence Jan-Sep
2013 Origin Cumulative Thailand 1,531,343 55.0 55.0 Vietnam 652,193 23.4 78.5 China 171,581 6.2 84.7 Korea (ROK) 62,510 2.2 86.9 USA 43,211 1.6 88.5 Japan 38,039 1.4 89.8 France 37,596 1.4 91.2 UK 26,573 1.0 92.1 Australia 25,837 0.9 93.1 Germany 20,229 0.7 93.8 Sub-total 2,609,112 93.8
Total 2,782,112
Currently, over 90% of all foreign inbound arrivals are accounted for by just ten source markets with an interesting mix of origins that include not only Asia but also the USA, France & the UK and from the Pacific, Australia.

Page 14 /29
The Power of 10
Malaysia Data are supplied by Tourism Malaysia and cover the period January to September 2013. Data are reported by nationality.
Table 14: Foreign arrivals into Malaysia by origin sub-region (Jan-Sep 2012 & 2013)
Origin Jan-Sep YTD Change
Region Sub-region 2012 2013 % Volume Africa North 12,237 14,041 14.7 1,804
South 16,849 15,282 -9.3 -1,567
West 14,671 14,039 -4.3 -632
Sub-total 43,757 43,362 -0.9 -395
Americas North 243,221 246,952 1.5 3,731
Sub-total 243,221 246,952 1.5 3,731
Asia Northeast 1,935,564 2,251,847 16.3 316,283
South 881,589 828,354 -6.0 -53,235
Southeast 13,463,773 13,778,197 2.3 314,424
West 159,182 152,164 -4.4 -7,018
Sub-total 16,440,108 17,010,562 3.5 570,454
Europe Eastern 32,475 37,672 16.0 5,197
Northern 375,945 389,181 3.5 13,236
Southern 52,635 52,626 0.0 -9
Western 308,738 308,610 0.0 -128
Sub-total 769,793 788,089 2.4 18,296
Pacific Oceania 421,303 418,511 -0.7 -2,792
Sub-total 421,303 418,511 -0.7 -2,792
Other Other 235,461 249,000 5.7 13,539
Sub-total 235,461 249,000 5.7 13,539
Total Total 18,153,643 18,756,476 3.3 602,833 With such a large numeric base of to begin with, what appears to be a rather sluggish growth rate over the nine months to September 2013 actually converts to an additional 600,000 additional foreign arrivals over the period. Once again the bulk of those additional visitors stems from the origin markets of Northeast and Southeast Asia, which collectively have added sufficient additional arrivals to offset the smaller losses from other source areas. Europe has added a significant number of additional visitors as well, particularly from Northern and Eastern Europe – the latter again equating to Russian travellers while the former includes a spread of markets from Denmark, Norway, Ireland and the UK to name just a few.

Page 15 /29
The Power of 10
Table 15: Top ten foreign source markets into Malaysia (Jan-Sep 2012 & 2013, ranked by volume)
IVAs Relative share (%)
Residence Jan-Sep
2013 Origin Cumulative Singapore 9,474,081 50.5 50.5 Indonesia 1,861,891 9.9 60.4 China 1,449,477 7.7 68.2 Brunei 876,028 4.7 72.8 Thailand 847,167 4.5 77.4 India 482,134 2.6 79.9 Philippines 403,728 2.2 82.1 Australia 373,523 2.0 84.1 Japan 371,009 2.0 86.0 UK 305,144 1.6 87.7 Sub-total 16,444,182 87.7
Total 18,756,476
Eight of the top ten origin markets (by volume) over this period, originate in Asia, however Australia and the UK are individually large enough to rank in the top ten listing and together they account for well over 650,000 arrivals.

Page 16 /29
The Power of 10
Myanmar Data are supplied by the Myanmar Ministry of Hotels & Tourism and cover the period January to December 2013. The data used here refer to arrivals through the Yangon entry points (air/land/sea), and the Mandalay & Bagan International Airports. Data are reported by nationality.
Table 16: Foreign arrivals into the Union of Myanmar by origin sub-region (Jan-Dec 2012 & 2013)
Origin January to December YTD Change Region Sub-region 2012 2013 % Volume Africa Other 1,598 2,688 68.2 1,090
Sub-total 1,598 2,688 68.2 1,090
Americas North 44,074 62,628 42.1 18,554
Other 3,535 4,625 30.8 1,090
Sub-total 47,609 67,253 41.3 19,644
Asia Northeast 180,186 252,818 40.3 72,632
South 18,605 23,023 23.7 4,418
Southeast 151,137 218,668 44.7 67,531
West 3,747 3,396 -9.4 -351
Other 30,476 135,890 345.9 105,414
Sub-total 384,151 633,795 65.0 249,644
Europe Eastern 9,077 10,183 12.2 1,106
Northern 24,296 33,203 36.7 8,907
Southern 17,518 17,316 -1.2 -202
Western 88,482 107,644 21.7 19,162
Sub-total 139,373 168,346 20.8 28,973
Pacific Oceania 20,603 28,036 36.1 7,433
Sub-total 20,603 28,036 36.1 7,433
Other Other 47 43 -8.5 -4 Sub-total 47 43 -8.5 -4 Total Total 593,381 900,161 51.7 306,780
Foreign arrivals into Myanmar continue to grow at an astounding rate. Calendar year 2013 saw an increase of close to 52% in arrivals through the major air gateways as well as by land & sea through Yangon, while overland border crossings (which include day trippers) grew by almost 146%. These latter movements more than doubled at the Eastern region, which saw a doubling of inbound movements from 230,298 in 2012 to almost 753,000 in 2013. Disaggregated data - by nationality – are currently only available for foreign arrivals through the Yangon entry points (air/land/sea), and the Mandalay & Bagan International Airports (as above) but clearly show the strength of growth in demand. Asia dominates the source markets, accounting for more than two-thirds of the arrivals through these gateways in 2013. At the moment it appears as if the Asia source markets are dominated by Northeast and Southeast Asia, however the enormous four-fold increase in those classified as ‘Other Asia’ may change those profiles once their specific origins are known.

Page 17 /29
The Power of 10
There are a few areas of contraction however these are minimal and the majority of gains are I the strong double-digit range.
Table 17: Top ten foreign source markets into Myanmar (Jan-Dec 2012 & 2013, ranked by volume)
IVAs Relative share (%)
Nationality Jan-Dec
2013 Origin Cumulative Thailand 139,770 15.5 15.5 China 90,550 10.1 25.6 Japan 68,761 7.6 33.2 Korea (ROK) 54,934 6.1 39.3 USA 53,653 6.0 45.3 Malaysia 39,758 4.4 49.7 Singapore 39,140 4.3 54.1 France 35,462 3.9 58.0 UK 33,203 3.7 61.7 Chinese Taipei 30,699 3.4 65.1 Sub-total 585,930 65.1
Total 900,161
There is a relatively wide range of source markets with the top ten by volume accounting for less than two-thirds of the inbound volume through the gateways as previously specified. Neighbouring Thailand is easily the most dominant single source market and holds better than a 15% share of foreign arrivals in this group.

Page 18 /29
The Power of 10
Philippines Data for the Philippines are supplied by the Department of Tourism and cover the period January to September 2013. Data are reported by country of residence.
Table 18: Foreign arrivals into the Philippines by origin sub-region (Jan-Sep 2012 & 2013)
Origin Jan-Sep YTD Change
Region Sub-region 2012 2013 % Volume Africa North 1,236 1,312 6.1 76
South 2,572 2,832 10.1 260
West 773 846 9.4 73
Sub-total 4,581 4,990 8.9 409
Americas Central 1,327 1,985 49.6 658
North 572,870 588,786 2.8 15,916
South 3,673 4,448 21.1 775
Sub-total 577,870 595,219 3.0 17,349
Asia Northeast 1,528,441 1,778,269 16.3 249,828
South 47,492 51,059 7.5 3,567
Southeast 269,981 309,652 14.7 39,671
West 48,147 59,111 22.8 10,964
Sub-total 1,894,061 2,198,091 16.1 304,030
Europe Eastern 24,748 30,912 24.9 6,164
Northern 128,876 138,405 7.4 9,529
Southern 32,550 31,405 -3.5 -1,145
Western 122,935 131,317 6.8 8,382
Sub-total 309,109 332,039 7.4 22,930
Pacific Melanesia 3,344 3,751 12.2 407
Micronesia 32,450 31,007 -4.4 -1,443
Oceania 141,763 158,946 12.1 17,183
Sub-total 177,557 193,704 9.1 16,147
Other Other 27,746 30,944 11.5 3,198
Sub-total 27,746 30,944 11.5 3,198
Total Total 2,990,924 3,354,987 12.2 364,063 Foreign arrivals growth into the Philippines was strong through the first nine months of 2013 however the impact of super typhoon Yolanda (Haiyan) is likely to have a dampening effect on that for a few months at least. Hopefully, that will last only a short time and travel demand for the Philippines will rebound back to the double-digit levels seen during the first three-quarters of 2013. Asia is the dominant supplier of arrivals, particularly out of Northeast Asia, which in the period considered generated 81% of arrivals from Asia into the Philippines and more than half (53%) of total foreign inbound traffic.

Page 19 /29
The Power of 10
Table 19: Top ten foreign source markets into the Philippines
(Jan-Sep 2012 & 2013, ranked by volume)
IVAs Relative share (%)
Nationality Jan-Sep
2013 Origin Cumulative Korea (ROK) 908,881 27.1 27.1 USA 497,748 14.8 41.9 Japan 329,008 9.8 51.7 China 327,054 9.7 61.5 Australia 148,218 4.4 65.9 Singapore 127,971 3.8 69.7 Chinese Taipei 111,059 3.3 73.0 Hong Kong SAR 96,444 2.9 75.9 Canada 91,038 2.7 78.6 UK 87,238 2.6 81.2 Sub-total 2,724,659 81.2
Total 3,354,987 100.0
While travel demand from the Northeast Asia source market cluster is dominant, at the individual source market level other suppliers also become more significant. In the top ten (by volume) rankings for example, the USA, Australia, Canada and the UK all make an appearance and during the first nine months of 2013 generated a collective volume in excess of 800,000 arrivals to the Philippines.

Page 20 /29
The Power of 10
Singapore Data are supplied by the Singapore Tourism Board and cover the period January to June 2013. Data are reported by country of residence. It should be noted that Singapore is currently migrating to a new system for tracking visitor arrival statistics and some delays in delivering disaggregated data are being experienced during this period. Additionally, it should be noted that these data refer to all foreign visitors who clear CIQ regardless of their length of stay, however they specifically exclude:
§ Malaysian citizens arriving by land; § Returning Singapore citizens resident abroad; § Non-resident air/sea crew (except for sea crew flying in to join a ship); and § Air transit and transfer passengers.
Table 20: Foreign arrivals into Singapore by origin sub-region
(Jan-Jun 2012 & 2013)
Origin Jan-Jun YTD Change Region Sub-region 2012 2013 % Volume Africa East 4,798 3,751 -21.8 -1,047
North 1,775 1,836 3.4 61
Other 9,520 9,671 1.6 151
South 16,209 15,415 -4.9 -794
Sub-total 32,302 30,673 -5.0 -1,629
Americas North 287,532 303,535 5.6 16,003
Other 24,835 30,091 21.2 5,256
Sub-total 312,367 333,626 6.8 21,259
Asia Northeast 1,921,766 2,296,652 19.5 374,886
South 601,464 629,409 4.6 27,945
Southeast 2,829,075 2,977,668 5.3 148,593
West 67,044 73,549 9.7 6,505
Sub-total 5,419,349 5,977,278 10.3 557,929
Europe Eastern 83,539 94,526 13.2 10,987
Northern 320,828 321,533 0.2 705
Southern 48,627 47,814 -1.7 -813
Western 317,702 316,103 -0.5 -1,599
Sub-total 770,696 779,976 1.2 9,280
Pacific Oceania 534,631 601,166 12.4 66,535
Other 7,025 7,463 6.2 438
Sub-total 541,656 608,629 12.4 66,973
Other Other 5,962 1,296 -78.3 -4,666
Sub-total 5,962 1,296 -78.3 -4,666
Total Total 7,082,332 7,731,478 9.2 649,146 Singapore looks to be experiencing another strong foreign inbound year, with an increase of better than nine percent during the first half of 2013. Asian source markets have generated over 77% of these inbound flows to date, with Southeast Asia the single most dominant source cluster (39% share of total foreign inbound).

Page 21 /29
The Power of 10
Northeast Asia is becoming even more significant however, having generated an increase of close to 20% during the first half of 2013 and producing close to 375,000 additional arrivals year on year. The relative share out of Northeast Asia has consequently jumped from 27% in 1H12 to 30% in 1H13. All other source markets have generated less than one million arrivals during the first half of 2013. The importance of Indonesia and China can be seen clearly in the following table – together these two source markets have generated more than one-third of the foreign inbound volume into Singapore during the first half of 2013.
Table 21: Top ten foreign source markets into Singapore (Jan-Jun 2012 & 2013, ranked by volume)
IVAs Relative share (%)
Residence Jan-Jun
2013 Origin Cumulative Indonesia 1,475,354 19.1 19.1 China 1,240,645 16.0 35.1 Malaysia 601,912 7.8 42.9 Australia 546,561 7.1 50.0 India 499,064 6.5 56.4 Japan 385,146 5.0 61.4 Philippines 358,055 4.6 66.1 Hong Kong SAR 256,107 3.3 69.4 USA 254,907 3.3 72.7 Thailand 246,291 3.2 75.8 Sub-total 5,864,042 75.8
Total 7,731,478 100.0
In total, the top ten source markets accounted for three-quarters of the foreign inbound traffic into Singapore during the first half of 2013.

Page 22 /29
The Power of 10
Thailand Data are supplied by the Bureau of Immigration and the Royal Thai Police Department and cover calendar years 2013 and 2012. Data are reported by nationality.
Table 22: Foreign arrivals into the Kingdom of Thailand by origin sub-region (Jan-Dec 2012 & 2013)
Origin Jan-Dec YTD Change Region Sub-region 2012 2013 % Volume Africa North 19,918 28,088 41.0 8,170
South 76,326 74,356 -2.6 -1,970
Other 79,218 89,802 13.4 10,584
Sub-total 175,462 192,246 9.6 16,784
Americas North 987,992 1,056,432 6.9 68,440
South 48,240 57,929 20.1 9,689
Other 47,201 56,281 19.2 9,080
Sub-total 1,083,433 1,170,642 8.0 87,209
Asia Northeast 6,192,086 8,625,380 39.3 2,433,294
South 1,286,861 1,346,462 4.6 59,601
Southeast 6,281,153 7,396,297 17.8 1,115,144
West 585,559 599,347 2.4 13,788
Other East 51,975 68,952 32.7 16,977
Sub-total 14,397,634 18,036,438 25.3 3,638,804
Europe Eastern 1,597,540 2,083,236 30.4 485,696
Northern 1,769,253 1,762,636 -0.4 -6,617
Southern 313,844 329,540 5.0 15,696
Western 1,847,357 1,980,991 7.2 133,634
Other 122,625 151,100 23.2 28,475
Sub-total 5,650,619 6,307,503 11.6 656,884
Pacific Oceania 1,044,112 1,025,598 -1.8 -18,514
Other 2,643 3,156 19.4 513
Sub-total 1,046,755 1,028,754 -1.7 -18,001
Total Total 22,353,903 26,735,583 19.6 4,381,680 Note: In this table, Egypt is included in Africa Thailand continued its solid growth of recent years into 2013, posting an amazing 20% increase year on year and welcoming more than 26.7 million foreign arrivals, an increase of more than 4.38 million additional arrivals over the previous year (which in itself was a record year). Despite some minor contractions, Thailand still receives in excess of one million arrivals annually from the major source regions, with Asia and Europe dominating the mix. The former (Asia) generated three-quarters of the total foreign inbound volume in 2013, while the latter (Europe) produced close on one-quarter of all foreign arrivals. Southeast Asia is a significant contributor to Thailand’s foreign inbound count in its own right and the ASEAN-to-Thailand flows in 2013 were close to 7.4 million.

Page 23 /29
The Power of 10
Northeast Asia however, with an increase of better than 1.9 million additional arrivals from China alone (year on year) has moved ahead of Southeast Asia during the last twelve months and is now the single largest suppler of foreign arrivals at the sub-regional level. Similarly in Europe where the Eastern markets have now (collectively) moved ahead of both the West and the North to become the largest supplier out of Europe generally. At the individual source market level, Thailand now receives in excess of one million arrivals annually from seven distinct markets with several others coming tantalisingly close to that milestone.
Table 23: Top ten foreign source markets into Thailand (Jan-Dec 2012 & 2013, ranked by volume)
IVAs Relative share (%)
Nationality Jan-Dec
2013 Origin Cumulative China 4,705,173 17.6 17.6 Malaysia 2,996,071 11.2 28.8 Russia 1,736,990 6.5 35.3 Japan 1,537,979 5.8 41.1 Korea (ROK) 1,297,200 4.9 45.9 Lao PDR 1,106,080 4.1 50.0 India 1,049,856 3.9 54.0 Singapore 936,477 3.5 57.5 Australia 907,868 3.4 60.9 UK 906,312 3.4 64.3 Sub-total 17,180,006 64.3
Total 26,735,583 100.0

Page 24 /29
The Power of 10
Vietnam Data are supplied by Vietnam’s General Statistics Office and the VNAT and cover calendar years 2013 and 2012. Data are reported by nationality.
Table 24: Foreign arrivals into Vietnam by origin sub-region (Jan-Dec 2012 & 2013)
Origin Jan-Dec YTD Change Region Sub-region 2012 2013 % Volume Americas North 557,389 537,201 -3.6 -20,188
Sub-total 557,389 537,201 -3.6 -20,188
Asia Northeast 3,128,764 3,687,793 17.9 559,029
Southeast 1,363,798 1,397,240 2.5 33,442
Sub-total 4,492,562 5,085,033 13.2 592,471
Europe Eastern 174,287 298,126 71.1 123,839
Northern 270,183 275,789 2.1 5,606
Southern 62,642 65,326 4.3 2,684
Western 419,845 406,860 -3.1 -12,985
Sub-total 926,957 1,046,101 12.9 119,144
Pacific Oceania 316,465 322,465 1.9 6,000
Sub-total 316,465 322,465 1.9 6,000
Other Other 554,307 526,485 -5.0 -27,822
Sub-total 554,307 526,485 -5.0 -27,822
Total Total 6,847,680 7,517,285 9.8 669,605 Note: there is a slight divergence between the published total and the disaggregated totals at this time. Vietnam has seen a dramatic increase in its foreign inbound count trebling the volume of arrivals within the last decade alone. Calendar year 2013 was another record year driven by substantial gains in arrivals from Northeast Asia and to a lesser extent Eastern Europe. Northeast Asia contributed just under half (49%) of all foreign arrivals during 2013, driven primarily by China, Korea (ROK) and Japan which, as can be seen in the following table, collectively generated 44% of foreign inbound traffic into Vietnam during the year.
Table 25: Top ten foreign source markets into Vietnam (Jan-Dec 2012 & 2013, ranked by volume)
IVAs Relative share (%)
Nationality Jan-Dec
2013 Origin Cumulative China 1,917,794 25.5 25.5 Korea (ROK) 748,727 10.0 35.5 Japan 613,050 8.2 43.6 USA 432,228 5.7 49.4 Chinese Taipei 398,990 5.3 54.7 Malaysia 339,510 4.5 59.2 Cambodia 315,289 4.2 63.4 Russia 298,126 4.0 67.4 Australia 291,508 3.9 71.2 Thailand 268,968 3.6 74.8 Sub-total 5,624,190 74.8
Total 7,517,285 100.0

Page 25 /29
The Power of 10
EUROPE Europe remains an important source region for the ASEAN bloc generating well over ten million arrivals year to date, however most of that growth is coming from Eastern Europe which is growing at almost 33% over the period of this report. In fact while this origin sub-region lags behind Western and Northern Europe in its generation of arrival numbers, the growth of almost 33% in 2013 to date, has narrowed the difference in volume from one million in 2012 (Eastern Europe as against Northern Europe) to well under half a million in just one year.
Table 26: Foreign arrivals from European sub-regions into ASEAN, year to date 2013
Change YTD
Origin Sub-region 2012 2013 % Volume Eastern Europe 2,034,250 2,704,118 32.9 669,868 Western Europe 3,406,075 3,590,979 5.4 184,904 Northern Europe 3,082,768 3,132,742 1.6 49,974 Southern Europe 584,790 609,231 4.2 24,441 Other Europe 138,207 165,874 20.0 27,667 Total Origin Europe 9,246,090 10,202,944 10.3 956,854
Another year with growth similar to that seen in 2013 (to date) would see the volume of arrivals from Eastern Europe surpass those from Northern Europe and begin to rival those from Western Europe. Significantly, Russia is the driving origin market behind the Eastern European growth momentum and so far, has generated more than 88% of the additional volume increase from Eastern Europe and close to 62% of all volume growth from Europe generally.
Table 27: Foreign arrivals from major European markets into ASEAN, year to date 2013 (Ranked by volume increase ytd)
ASEAN Change YTD
Origin 2013 (mns) % Volume Russia 2.265 35.3 591,089 UK 1.900 4.8 87,074 Germany 1.240 5.9 69,587 France 1.232 4.8 56,318 Switzerland 0.346 5.1 16,929

Page 26 /29
The Power of 10
AMERICAS The Americas is the third largest supplier of foreign arrivals to ASEAN (by volume), and year to date these markets collectively, have generated in excess of three million arrivals to the destinations of Southeast Asia.
Table 28: Foreign arrivals from the Americas sub-region into ASEAN year to date 2013
Change YTD
Origin Sub-region 2012 2013 % Volume North America 2,945,950 3,070,576 4.2 124,626 South America 63,086 76,698 21.6 13,612 Central America 5,222 6,597 26.3 1,375 Other America 82,309 98,584 19.8 16,275 Total Origin Americas 3,096,567 3,252,455 5.0 155,888
North America is the dominant source sub-region and year to date holds a dominant 94% share of the Americas-to-ASEAN flows, with the USA dominating that sub-group. Other source markets within the Americas generate very small volumes into ASEAN at the moment, however if the growth rates of recent years continue into the future it will only be a matter of five years or so before they command greater attention. This will be hastened of course by greater air connectivity between Asia and Latin America.
Table 29: Foreign arrivals from major Americas markets into ASEAN, year to date 2013
ASEAN Change YTD
Origin 2013 (mns) % Volume USA 2.459 4.6 107,992 Canada 0.608 2.6 15,663 Brazil 0.045 22.3 8,170 Argentina 0.028 20.3 4,650 Mexico 0.006 26.4 1,320

Page 27 /29
The Power of 10
AFRICA Arrival volumes from Africa to ASEAN are currently very small with a strong dominance by South Africa (essentially the Republic of South Africa as opposed to Southern Africa). Unfortunately 2013 saw a slight reduction from that source market into the collective of Southeast Asia destinations.
Table 30: Foreign arrivals from Africa into ASEAN, year to date 2013
Change YTD
Origin Sub-region 2012 2013 % Volume East 5,093 4,062 -20.2 -1,031 Middle 269 181 -32.7 -88 North 35,402 45,634 28.9 10,232 South 114,818 111,192 -3.2 -3,626 West 16,203 15,631 -3.5 -572 Other 90,887 102,561 12.8 11,674 Total origin Africa 262,672 279,261 6.3 16,589
Most ASEAN destinations have very small counts from Africa, which is also why the ‘Other Africa’ grouping is larger than some of the identified origin markets from this continent. In addition, a number of destinations group Egypt under Middle East as opposed to Africa or North Africa; in this paper, Egypt has been moved to Africa.
Table 31: Foreign arrivals from major Americas markets into ASEAN, year to date 2013
ASEAN Change YTD
Origin 2013 % Volume Egypt 45,578 28.9 10,220 Kenya 250 12.6 28 Sudan 56 27.3 12 Congo 52 -11.9 -7 Ghana 128 -7.9 -11 Uganda 61 -16.4 -12 Liberia 44 -51.1 -46 Cameroon 129 -38.6 -81 Nigeria 15,459 -3.2 -515 Mauritius 3,751 -21.8 -1,047 South Africa 111,192 -3.2 -3,626 Other Africa 102,561 12.8 11,674
If the ‘Other Africa’ into ASEAN destinations continues to grow at rates above ten percent, it will soon become important for those destinations to begin assigning country tags to these arrivals and begin tracking their outbound travel development fore effectively.

Page 28 /29
The Power of 10
Conclusion & Endnotes The ASEAN bloc of 10 economies is poised to set a new record for international inbound arrivals and ahead of the move into the ASEAN Economic Community (AEC), will most certainly be hosting (collectively) more than 100 million foreign arrivals annually – black swans not withstanding. This obviously begs the question about management of those flows so that degradation of the environmental, social and economic fabric of the ASEAN society and its myriad of cultures and communities is effectively managed to the benefit of not only the travellers to this part of the world but also to those of us who live here. It also warrants some thought about the varying rates of inbound growth and the need to move away from a mindset of constantly growing at a rate better than those of perceived competitors, towards one of growth that is realistic, serviceable and sustainable for each destination at each of the national and sub-national levels. These questions and others will be raised and highlighted in future papers of this type when the College of Innovation’s Service Innovation and Development Unit introduces concepts relating to dispersion, measurement, satisfaction, systems thinking, responsible development and other metrics and mechanisms that need to be considered in evaluating the success or otherwise of the travel & tourism system.

Page 29 /29
The Power of 10
About the Service Innovation and Development Unit This is a new functional unit recently formed within Thammasat University’s College of Innovation and within the Service Innovation Program. As such it is mandated with – as the name implies – analysing, understanding and educating the services sector across Thailand and the ASEAN community about better service delivery. The travel & tourism sector is one key area of focus, given its importance to areas that include job creation, business & investment opportunities, community integrity, cultural continuation and a host of other factors that make ASEAN such a diverse tourism delivery system. Note also the use of the term ‘system’. This becomes significant as we expand our understanding of the upstream and downstream impacts of travel – both international and domestic – on properties, locations, regions, destinations and economic blocs. This is what we are about and why we are different. We are still in a state of development but expect to be fully functional within the next few months. In the meantime, if anyone would like to know more about the unit, and the work we do, please contact: John Koldowski Head, Service Innovation & Development Unit Service Innovation Program College of Innovation, Thammasat University 4th Floor, LB Building, 2 Prachan Road, Pranakorn District, Bangkok, Thailand, 10200 Email: [email protected] Web: www.cie.tu.ac.th
Page 2 /29
The Power of 10
NOTES This paper is intended as a discussion piece for use by travel and tourism professionals at the ASEAN Tourism Forum (ATF), being held in Kuching, Malaysia from 16-23 January 2014. All the data used herein are preliminary and will change as final counts are received and published, so the observations and comments made here are to be considered within the context of possible future changes in the data. That not withstanding, some of the early indicators of growth (or contraction) may be useful as resource allocation decisions are made and possible policy adjustments debated. It is in such a spirit of metrics-driven discussion that this paper was written and is now made available. Disclaimer: Any views or opinions presented in this discussion paper are solely those of the author and do not necessarily represent those of Thammasat University or the College of Innovation. It has been prepared for discussion from the best available data at the time of preparation and in the full knowledge that some of these data series may change as preliminary counts become final. As such, this paper is intended to serve only as a general resource, not as a form or recommendation.