
The Paris meeting: the vision of an international power utility (BC3 Summer School _July 2015)
32
1 The Paris Summit on Climate Change: the vision of an international power utility Gonzalo Sáenz de Miera San Sebastián, 15 th of July 2015
-
Upload
bc3-basque-center-for-climate-change -
Category
Environment
-
view
35 -
download
1
Transcript of The Paris meeting: the vision of an international power utility (BC3 Summer School _July 2015)

1
The Paris Summit on Climate Change: the vision of an
international power utility
Gonzalo Sáenz de MieraSan Sebastián, 15th of July 2015

22
Index
1. The urgency of an international agreement on global warming
2. The Paris summit: challenges and perspectives
3. Our vision on the Paris summit
4. The role of the electricity sector
5. Iberdrola’s contribution
6. Summary and conclusions

33
The evidence of climate change induced by human activity is overwhelming
* http://www.rtcc.org/2013/10/08/world-bank-and-imf-we-must-think-about-climate-change-every-day/http://www.euractiv.com/sections/climate-environment/eu-demands-more-urgency-climate-negotiations-315365
• What we know about the consequences of climate change is bad, but what we don’t know appears to be worse
• Science, Governments and multilateral institutions acknowledge the urgency to act
• The later we act, the costlier it will be
• We have also to consider very unlikely extremely negative scenarios
Scenario Probability Consequences
2 – 4,5 oC Likely 66‐90% Extremely costlyEconomically, socially and ecologically
> 6oC Very unlikely 10% CatastrophicFor society as we know ( ≈30% GDP losses)
Climate Scenarios: probability and consequences in BAU scenarios (IPCC)
Source: IPCC

44
Climate change is the result of GHG emissions
Global GHG emissions
Source : International Energy Agency (2014), CO2 Emissions from Fuel Combustion 2014. Highlights, OECD/IEA, Paris
Other*33%
CO2energy sector67%
Electricity42%
Transport23%
Industry20%
Residencial6%
Other9%
* Includes GHG emissions from other sectors y and GHG emissions from energy sector with the exception of CO2.
Split of energy-related CO2 emissions
CO2 emissions from fossil fuel combustion represents 2/3 of GHG emissions
Energy sector is the main cause of the problem… And key to solve it

55
Index
1. The urgency of an international agreement on global warming
2. The Paris summit: challenges and perspectives
3. Our vision on the Paris summit
4. The role of the electricity sector
5. Iberdrola’s contribution
6. Summary and conclusions

66
Climate change is a complex phenomenon…
GHG is “public bad” and mitigation is a “public good”Free riding
Dynamic problemProblems of
intergenerational equity
High level of uncertainty on
impacts
Impacts are different across
regions and sectors
Burden sharing of mitigation costs
…That makes an international agreement extremely difficult(with a long term global government, the solution would be easier)
• Non excludability• No rivalry
• Trade off: cost today vs future benefitsPresent
features

77
Results on the INDCs so far
INDCs * representing ¾ of global GHG have been presented to UN
Country/Region Commitment Gases
Emissions inter-annual
variation 2020-2030*
Key sectors
EU-28 Base year:1990. 40% of reduction in 2030 100% -2,8% -
USA Base year: 2005. 26%-28% of reduction in 2025
100% -2,8% Transport, building, oil andnatural gas.
Canada Base year: 2005. 30% of reduction in 2030 100% -1,7% Electricity, transport, oil andnatural gas, CCS.
Russia Base year: 1990. 25%-30% of reduction in 2030 100% -0,7% -
China Base year: 2005. 60-65% of carbon intensity reduction in 2030 CO2 1,6% Energy, building, transport and
chemical industry.
Updated to 02/07/2015* Note: The emissions annual rate of change corresponds to the period 2020‐2030, except the US, which corresponds to the period 2020‐2025.Source: United Nations Framework Convention on Climate Change (UNFCC) http://unfccc.int/ghg_data/ghg_data_unfccc/time_series_annex_i/items/3814.php; https://unfccc.int/files/ghg_data/ghg_data_unfccc/ghg_profiles/application/pdf/chn_ghg_profile.pdf
Summary of the main INDCs
INDCs reflect wide differences on ambition across the main economic blocs
Base year makes a big difference when setting goals* Intended Nationally Determined Contributions
88
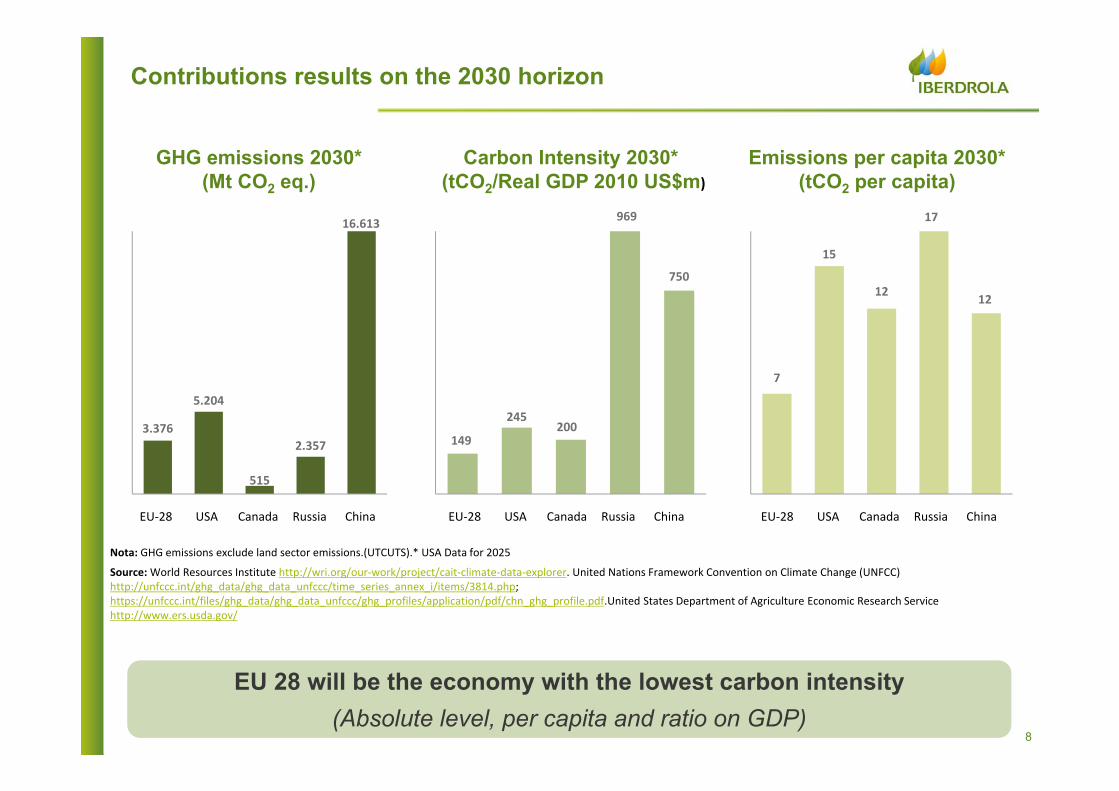
Contributions results on the 2030 horizon
3.376
5.204
515
2.357
16.613
USAEU‐28 Canada Russia China
GHG emissions 2030* (Mt CO2 eq.)
149
245200
969
750
Carbon Intensity 2030*(tCO2/Real GDP 2010 US$m)
7
15
12
17
12
Emissions per capita 2030* (tCO2 per capita)
Nota: GHG emissions exclude land sector emissions.(UTCUTS).* USA Data for 2025
Source: World Resources Institute http://wri.org/our‐work/project/cait‐climate‐data‐explorer. United Nations Framework Convention on Climate Change (UNFCC) http://unfccc.int/ghg_data/ghg_data_unfccc/time_series_annex_i/items/3814.php; https://unfccc.int/files/ghg_data/ghg_data_unfccc/ghg_profiles/application/pdf/chn_ghg_profile.pdf.United States Department of Agriculture Economic Research Service http://www.ers.usda.gov/
USAEU‐28 Canada Russia ChinaUSAEU‐28 Canada Russia China
EU 28 will be the economy with the lowest carbon intensity (Absolute level, per capita and ratio on GDP)

99
Perspectives of reaching the 2oC goal
(Peak emissions 2020)
3 oC
2 oC
INDCs scenario is not able to achieve the 2oC goal
Global energy-related CO2 emissions by scenario
uncertainty
uncertainty
High level of uncertainty to achieve INCDs scenarioMuch of the assumptions are based on CCS, EE achievements…
Source: IEA. WEO Energy and Climate Change
1010
Index...
1. The urgency of an international agreement on global warming
2. The Paris summit: challenges and perspectives
3. Our vision on the Paris summit
4. The role of the electricity sector
5. Iberdrola’s contribution
6. Summary and conclusions

1111
6 Key Elements Of A Potential Agreement in Paris
Stable framework
for investments
Ambitious goals
CO2 pricingBurden sharing
R&DPPPs
Awareness
Efficiency and
emissions standards
Paris COP

1212
Ambitious Goals and Stable Framework to drive the requiredinvestment
• A global emissions reduction target that is compatible with 2ºC goal.• A working schedule with a firm commitment to submitting ambitious
contributions within a reasonable timeframe.
Ambitious Goals
• The terms and legal format of the agreement should provide the long-term view and stability that are needed for the investment volumeit requires.
• Thoroughness in measuring and verifying targets, in establishingtransparent and equivalent efforts, and transparent framework toenable countries and companies to negotiate and exchangeverifiable emissions.
• From the governance perspective, it is important to establish five-year action periods in order to verify the degree of progress beingmade in the contributions and adapt them according to the results thatare achieved.
Stable Framework

1313
Energy Sector Decarbonisation Cost Burden Sharing
• The cost of the decarbonisation of the energy sector has beenborne by electricity consumers, to date.– Particularly true in Europe, where electricity tariffs have been
financing the attainment of energy policy targets that affected theeconomy as a whole.
• The electricity sector is going to continue to make the biggesteffort in reducing emissions, given its technological and economiccharacteristics– The energy policy framework should ensure that this cost is
distributed on a balanced basis by all energy consumers(natural gas, fuels,…)
– Right price signals should be sent to energy consumers and avoidnegative distortions (environmental and industrial competitiveness)
• Ensure “Polluter pays” principle, to distribute the cost of thepolicies needed for the decarbonisation of the economy amongenergy consumers– Thus removing subsidies to emitters and reducing the taxes that
apply to non-emitting technologies.
Burden Sharing

1414
Global CO2 Pricing Signal (I)
• Progress should be made towards a global CO2 price signalcovering all sectors of the economy
• Signals to industry operation and investments
• Fund collection to achieve goals
• Stringent and transparent carbon pricing systems
• Incentives should be provided for decarbonisation from atechnologically neutral perspective that fosters the development ofthe most efficient energy sources.
• This CO2 signal should be sufficient to provide incentives fortechnological change, and should constitute the basic tool topromote the most efficient renewable energy technologies.
• ≈ 40 € / ton (social cost)
• Taxation and ETS may play a significant role in transferring the CO2cost signal.
Global CO2
pricing

1515
Global CO2 Pricing Signal (II)
Energy-related CO2 emissions, carbon pricing mechanism and fossil fuel subsidies in selected regions, 2014
Source: IEA. WEO Energy and Climate Change

1616
Global CO2 Pricing Signal (III)
The question is not whether there should be a price for CO2 butWhen? At what level? How?
This situation should be tackled nowThe later… The worse
Only 12% of emissions covered by CO2 pricingMassive subsidies to
fossil fuelsTransport not covered (as
in the EU ETS) or with a lower level of stringency
“Great disparity between regions but on average global price is closer to negative 15 $ per ton.”
Source: Wagner & Weitzman. Climate Choice. P. 49.
Main conclusions from the global map of CO2 emissions under carbon pricing schemes and those subject to subsidies…

1717
Global Standards That Spur Emissions Reductions, Specially In Sectors Not Subject To CO2 Pricing Schemes
• Current carbon pricing systems do not provide asufficiently strong signal to decarbonize economy…Additional instruments are required.
• Energy efficiency standards, emissions standards ormandatory regulations for consumer equipment (vehicles,heating systems, etc.) should contribute to promote the useof low-carbon technologies and ultimately reduce emissions.
• For instance, emissions standards set in the car manufacturingsector (CO2 emissions per km) at regional level.
Efficiency and
emissions standards

1818
Other Topics
• R&D progress is key for technological deployment(supply and demands side) under an efficient path foremissions reduction
– One of the basic challenges in this area should be toimprove the relative competitiveness of carbon-freetechnologies compared to those that are based on fossilfuels
• Public-Private collaboration (PPPs) is a basic factor inachieving the high volume of investment and the majortechnological roll-out that to attain the 2ºC scenario
• Information and awareness measures are very important inmaking progress in the field of sustainable consumption ofall resources, particularly energy resources.
R&D
PPPs
Awareness

1919
Index
1. The urgency of an international agreement on global warming
2. The Paris summit: challenges and perspectives
3. Our vision on the Paris summit
4. The role of the electricity sector
5. Iberdrola’s contribution
6. Summary and conclusions
2020
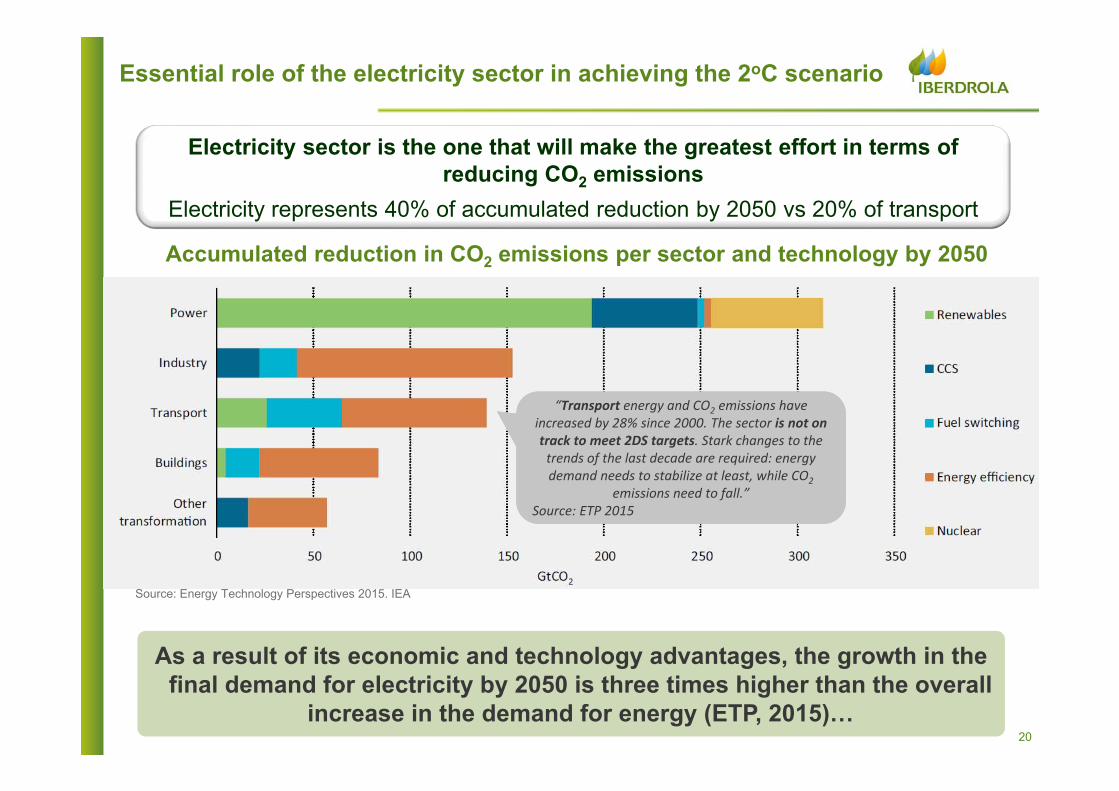
Essential role of the electricity sector in achieving the 2oC scenario
Source: Energy Technology Perspectives 2015. IEA
Accumulated reduction in CO2 emissions per sector and technology by 2050
“Transport energy and CO2 emissions have increased by 28% since 2000. The sector is not on track to meet 2DS targets. Stark changes to the trends of the last decade are required: energy demand needs to stabilize at least, while CO2
emissions need to fall.”Source: ETP 2015
“Transport energy and CO2 emissions have increased by 28% since 2000. The sector is not on track to meet 2DS targets. Stark changes to the trends of the last decade are required: energy demand needs to stabilize at least, while CO2
emissions need to fall.”Source: ETP 2015
As a result of its economic and technology advantages, the growth in the final demand for electricity by 2050 is three times higher than the overall
increase in the demand for energy (ETP, 2015)…
Electricity sector is the one that will make the greatest effort in terms of reducing CO2 emissions
Electricity represents 40% of accumulated reduction by 2050 vs 20% of transport

2121
Essential role of the electricity sector in achieving the 2oC scenario: the role of utilities
The 2oC scenario requires a major technological and infrastructure roll‐out at every stage of the electricity sector value generation chain…
…and a significant technological and managerial capacity in order to tackle all of these challenges that are as yet unmet.
9 Trillion * dollars of additional investments to achieve 2oC Scenario associated to electricity sector
High penetration rate of renewable energies will require stronger and smarter grids, back-up energy and new services offered by the system in order to
guarantee the quality and continuity of supply
Utilities have the business know-how and the technological and investment capacity to face these challenges on a competitive basis
* 1 Trillion = 1.000.000.000.000

2222
Index
1. The urgency of an international agreement on global warming
2. The Paris summit: challenges and perspectives
3. Our vision on the Paris summit
4. The role of the electricity sector
5. Iberdrola’s contribution
6. Summary and conclusions

2323
Increased relevance Of non-state players
+2.700 Specific Actions already submitted to UN *660 from Businesses
* Source: Platform NAZCA-Non-State Actor Zone for Climate Action
Businesses, Cities, Local Administrations, Investors, Communities
Non-state players engagement and commitment required to keep pressure towards a new and ambitious agreement beyond 2020 in Paris
2424
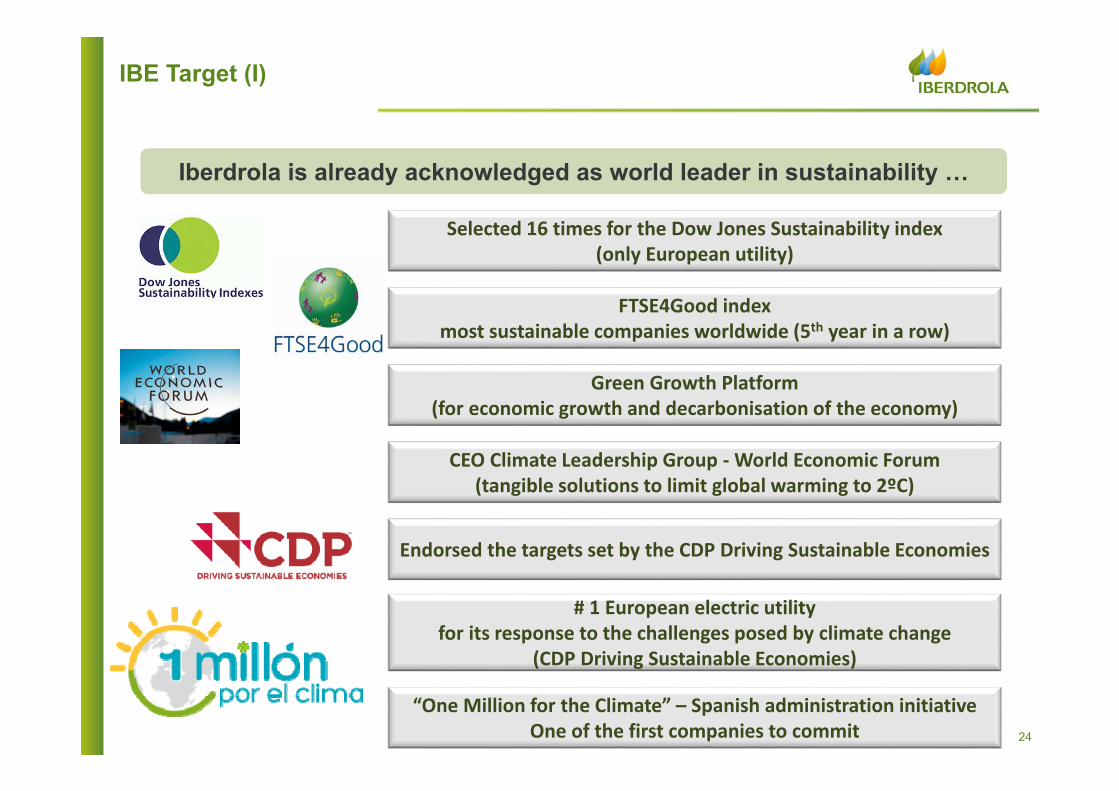
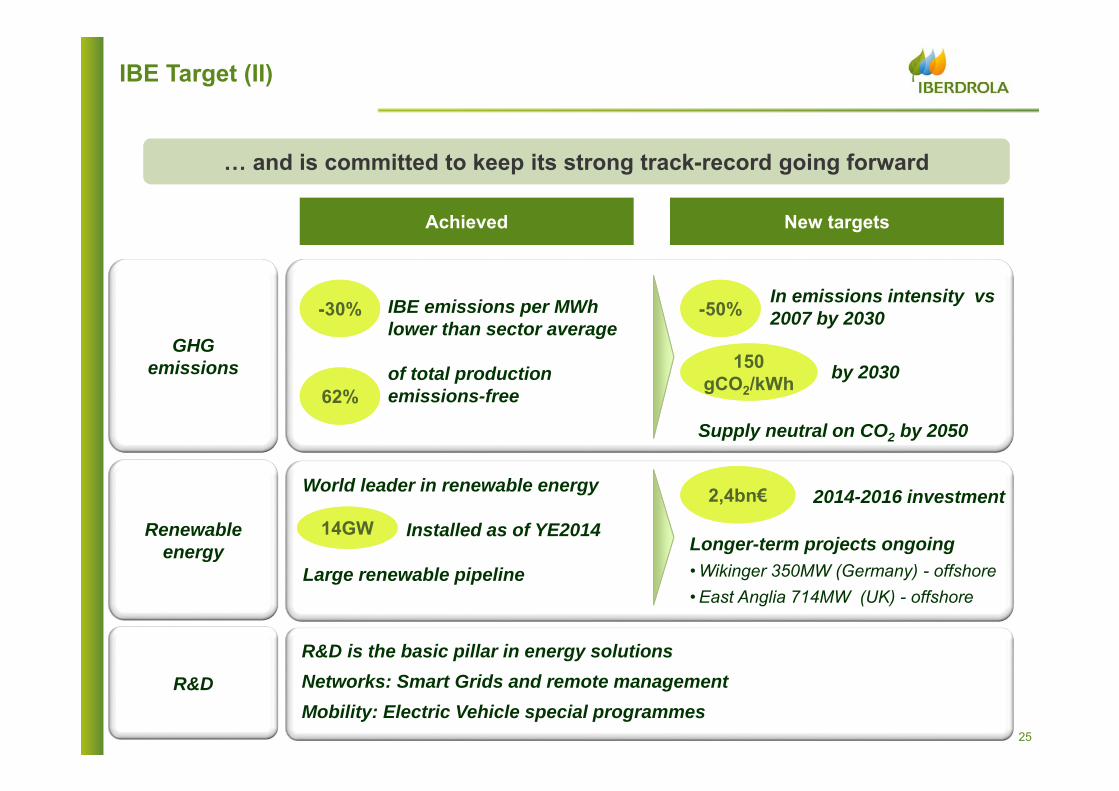
IBE Target (I)
Iberdrola is already acknowledged as world leader in sustainability …
Selected 16 times for the Dow Jones Sustainability index(only European utility)
FTSE4Good index most sustainable companies worldwide (5th year in a row)
Green Growth Platform(for economic growth and decarbonisation of the economy)
CEO Climate Leadership Group ‐World Economic Forum(tangible solutions to limit global warming to 2ºC)
# 1 European electric utility for its response to the challenges posed by climate change
(CDP Driving Sustainable Economies)
Endorsed the targets set by the CDP Driving Sustainable Economies
“One Million for the Climate” – Spanish administration initiative One of the first companies to commit
2525
IBE Target (II)
… and is committed to keep its strong track-record going forward
Achieved New targets
GHG emissions
IBE emissions per MWhlower than sector average
of total productionemissions-free
-30%-30%
62%62%
In emissions intensity vs 2007 by 2030 -50%-50%
by 2030
Renewable energy
World leader in renewable energy
Installed as of YE2014
Large renewable pipeline
14GW14GW2014-2016 investment
Longer-term projects ongoing• Wikinger 350MW (Germany) - offshore• East Anglia 714MW (UK) - offshore
2,4bn€2,4bn€
R&D
R&D is the basic pillar in energy solutionsNetworks: Smart Grids and remote managementMobility: Electric Vehicle special programmes
150gCO2/kWh
150gCO2/kWh
Supply neutral on CO2 by 2050

2626
Index
1. The urgency of an international agreement on global warming
2. The Paris summit: challenges and perspectives
3. Our vision on the Paris summit
4. The role of the electricity sector
5. Iberdrola’s contribution
6. Summary and conclusions
2727
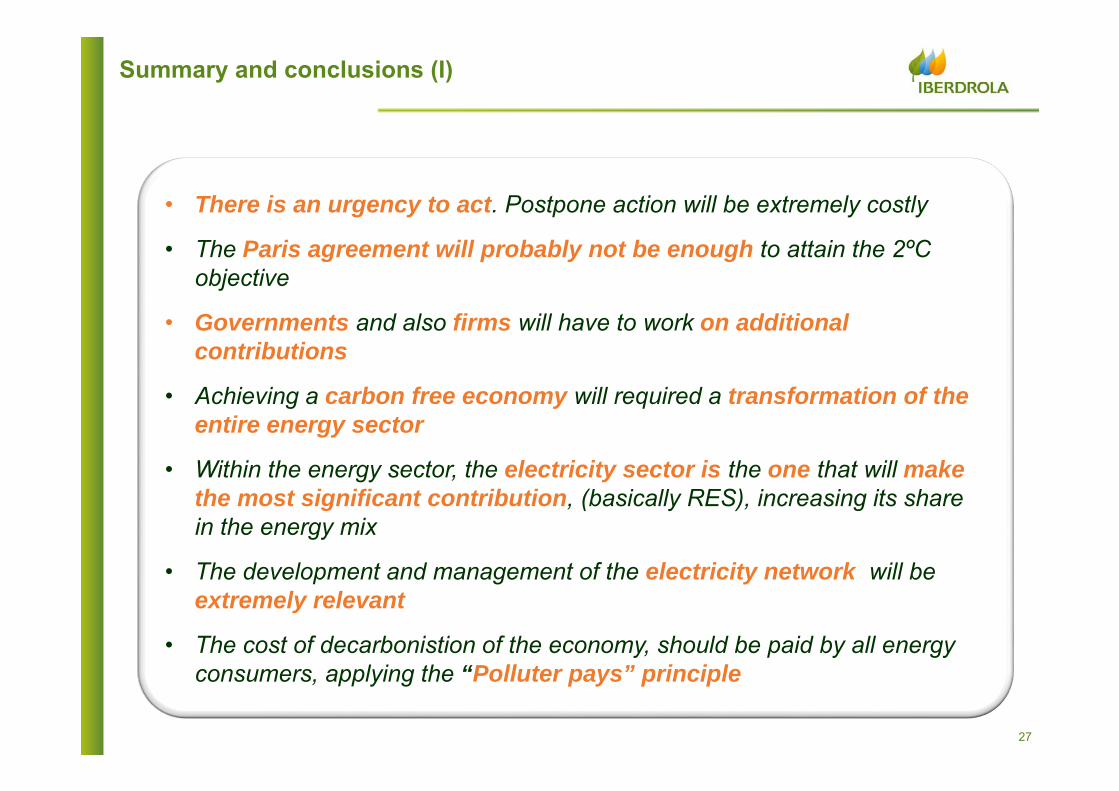
Summary and conclusions (I)
• There is an urgency to act. Postpone action will be extremely costly
• The Paris agreement will probably not be enough to attain the 2ºC objective
• Governments and also firms will have to work on additional contributions
• Achieving a carbon free economy will required a transformation of the entire energy sector
• Within the energy sector, the electricity sector is the one that will make the most significant contribution, (basically RES), increasing its share in the energy mix
• The development and management of the electricity network will be extremely relevant
• The cost of decarbonistion of the economy, should be paid by all energy consumers, applying the “Polluter pays” principle

2828
• CO2 pricing is a key element for an efficient transition:
• Signals to industry operation and investments
• Raise funds to achieve goals
• Stringent and transparent carbon pricing systems that providessignals throughout all economy
• Energy standards could complement the CO2 signal, specially if CO2prices are below the necessary levels
• Iberdrola has a strong commitment to achieve a sustainable energy model:
• Leadership in RES and sustainability indexes
• Goals : 50% reduction CO2 intensity by 2030; CO2 neutral by 2050
• d
Summary and conclusions (II)

29
ANNEX

3030
INDCS. Assessment of the efforts. GHG emissions reduction
Country/Region
GHG emissions (Mt CO2 eq.)
1990 1994 2005 2020 2025 2030
EU-28 5.626 5.178 4.501 3376
USA* 6.220 7.228 6.000 5.2045.349 -
Canada 591 736 611 515
Russia 3.368 2.138 2.526 2357
China 4.058 7.466 14.106 15.388
16.613 18.987
Note: GHG emissions GHG emissions exclude land sector emissions.(UTCUTS).* USA has two possible scenarios according to the different GHG emissions commitment in 2025 (26% or 28%).. ** The GHG emissions annual rate of change corresponds to the period 2020‐2030, except the US, which corresponds to the period 2020‐2025.
Source: World Resources Institute http://wri.org/our‐work/project/cait‐climate‐data‐explorer. United Nations Framework Convention on Climate Change (UNFCC) http://unfccc.int/ghg_data/ghg_data_unfccc/time_series_annex_i/items/3814.php;https://unfccc.int/files/ghg_data/ghg_data_unfccc/ghg_profiles/application/pdf/chn_ghg_profile.pdf . United States Department of Agriculture Economic Research Service http://www.ers.usda.gov/
‐2,8 ‐2,8
‐1,7
‐0,7
1,6
GHG emissions annual rate of change
(%). 2020- 2030**
USAEU‐28 Canada Russia China

3131
INDCS. Assessment of the efforts. Carbon Intensity reduction
Country/Region
Carbon Intensity 2030(tCO2/Real GDP 2010 US$m)
1990 1994 2005 2020 2025 2030
EU-28 492 331 239 149
USA* 686 502 312 238245 -
Canada 586 486 298 200
Russia 2.382 1.668 1.422 969
China 3.244 2.141 1.178 1.285
750 857
Carbon Intensity annual rate of change
(%). 2020- 2030**
Note: GHG emissions GHG emissions exclude land sector emissions.(UTCUTS).* USA has two possible scenarios according to the different GHG emissions commitment in 2025 (26% or 28%).. ** The GHG emissions annual rate of change corresponds to the period 2020‐2030, except the US, which corresponds to the period 2020‐2025.
Source: World Resources Institute http://wri.org/our‐work/project/cait‐climate‐data‐explorer. United Nations Framework Convention on Climate Change (UNFCC) http://unfccc.int/ghg_data/ghg_data_unfccc/time_series_annex_i/items/3814.php;https://unfccc.int/files/ghg_data/ghg_data_unfccc/ghg_profiles/application/pdf/chn_ghg_profile.pdf . United States Department of Agriculture Economic Research Service http://www.ers.usda.gov/
USAEU‐28 Canada Russia China
‐4,6
‐5,3
‐3,9 ‐3,8
‐4,42

3232
INDCS. Assessment of the efforts. Emissions per capita reduction
Country/Region
Emissions per capita 2030(tCO2 per capita)
1990 1994 2005 2020 2025 2030
EU-28 11,9 10,5 8,8 6,6
USA* 24,9 24,5 17,6 14,615,0 -
Canada 21,3 22,8 16,1 12,2
Russia 22,7 14,9 17,9 17,3
China 3,40 5,7 10,2 11,1
11,9 13,6
Emissions per capita annual rate of change
(%). 2020- 2030**
Note: GHG emissions GHG emissions exclude land sector emissions.(UTCUTS).* USA has two possible scenarios according to the different GHG emissions commitment in 2025 (26% or 28%).. ** The GHG emissions annual rate of change corresponds to the period 2020‐2030, except the US, which corresponds to the period 2020‐2025.
Source: World Resources Institute http://wri.org/our‐work/project/cait‐climate‐data‐explorer. United Nations Framework Convention on Climate Change (UNFCC) http://unfccc.int/ghg_data/ghg_data_unfccc/time_series_annex_i/items/3814.php;https://unfccc.int/files/ghg_data/ghg_data_unfccc/ghg_profiles/application/pdf/chn_ghg_profile.pdf . United States Department of Agriculture Economic Research Service http://www.ers.usda.gov/
USAEU‐28 Canada Russia China
‐2,8
‐3,7
‐2,7
‐0,4
1,6


![Septage_Management Advisory _July 3,2012[1]](https://static.fdocuments.in/doc/165x107/577cdaa41a28ab9e78a62384/septagemanagement-advisory-july-320121.jpg)