Adapting to Sea Level Rise (BC3 Summer School _July 2015)
103
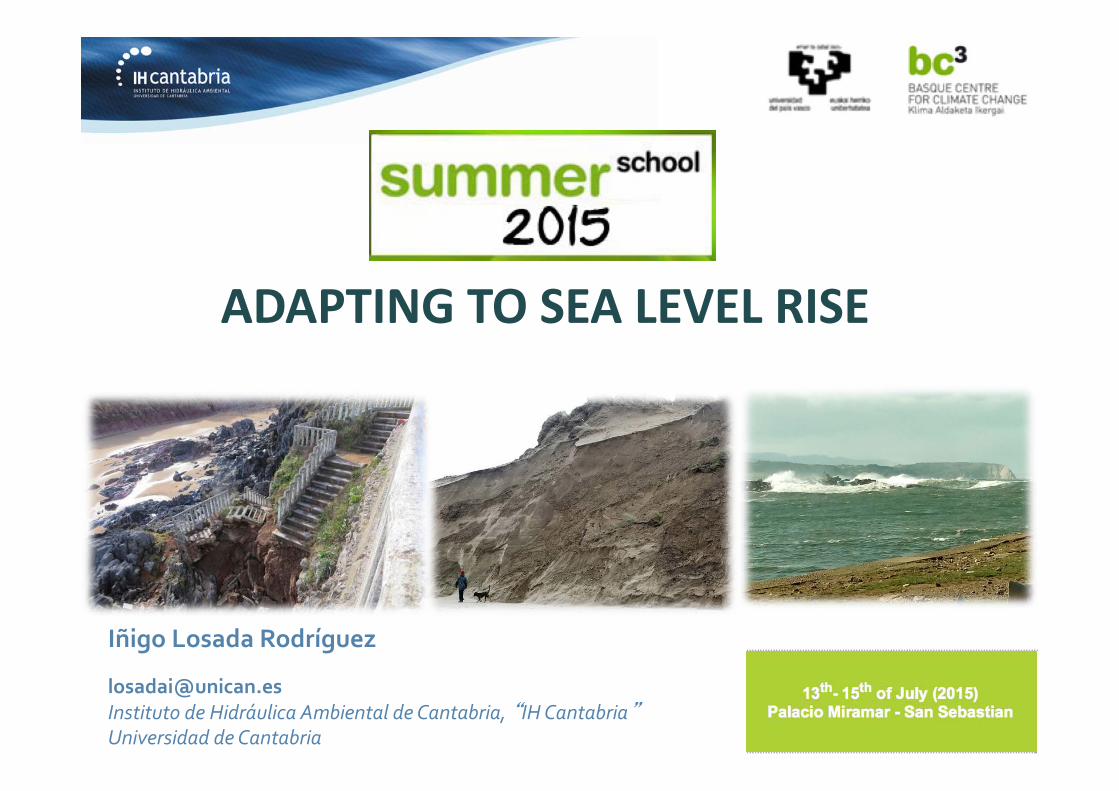
ADAPTING TO SEA LEVEL RISE Iñigo Losada Rodríguez [email protected] Instituto de Hidráulica Ambiental de Cantabria, “IH Cantabria” Universidad de Cantabria
-
Upload
bc3-basque-center-for-climate-change -
Category
Environment
-
view
143 -
download
0
Transcript of Adapting to Sea Level Rise (BC3 Summer School _July 2015)

ADAPTING TO SEA LEVEL RISE
Iñigo Losada Rodríguez
[email protected] de Hidráulica Ambiental de Cantabria, “IH Cantabria”Universidad de Cantabria
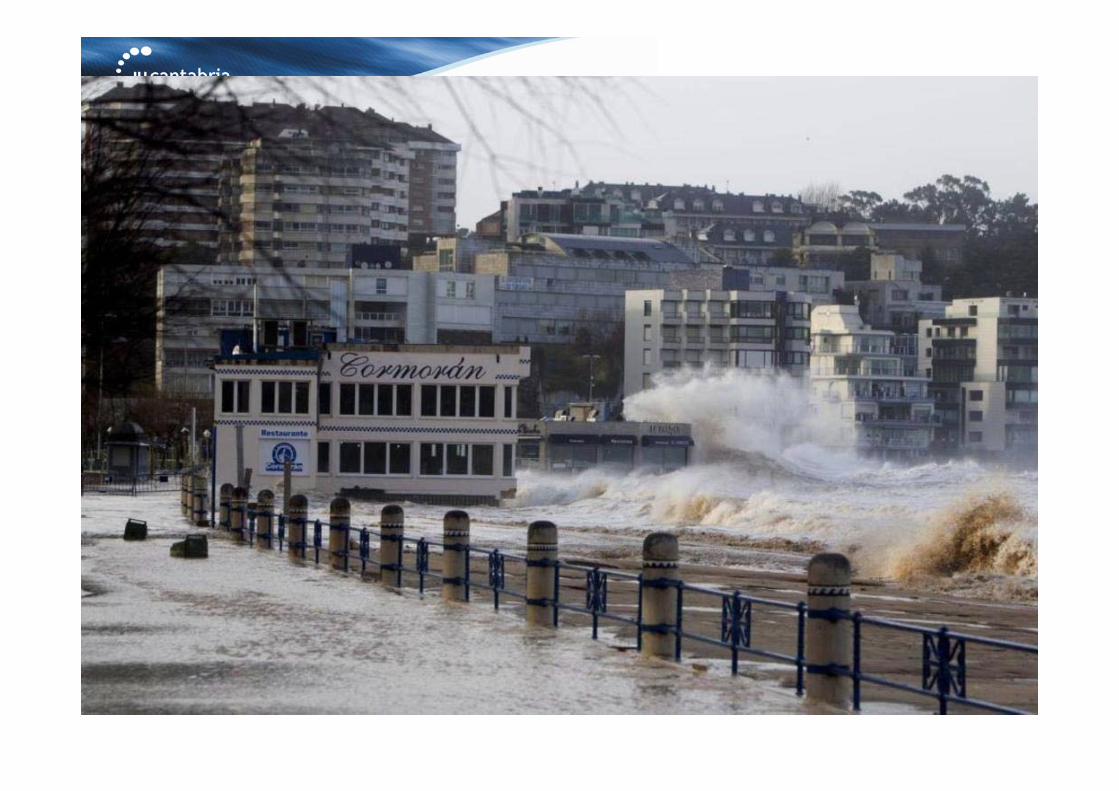
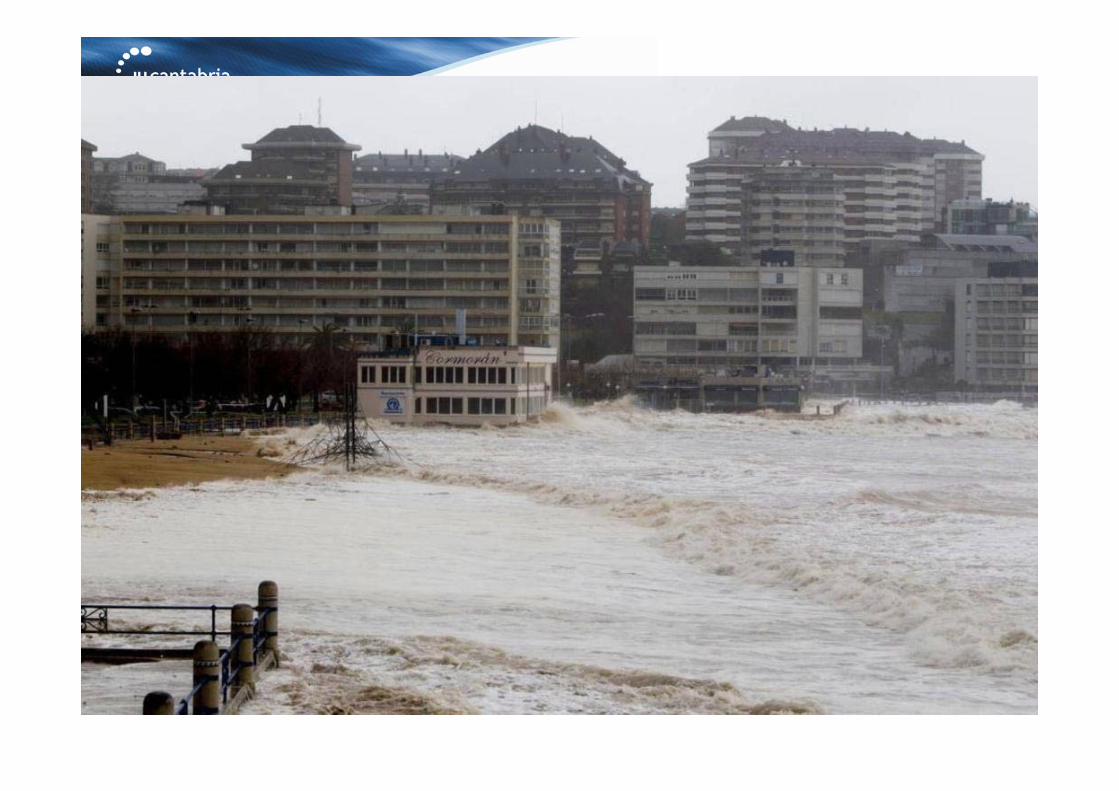
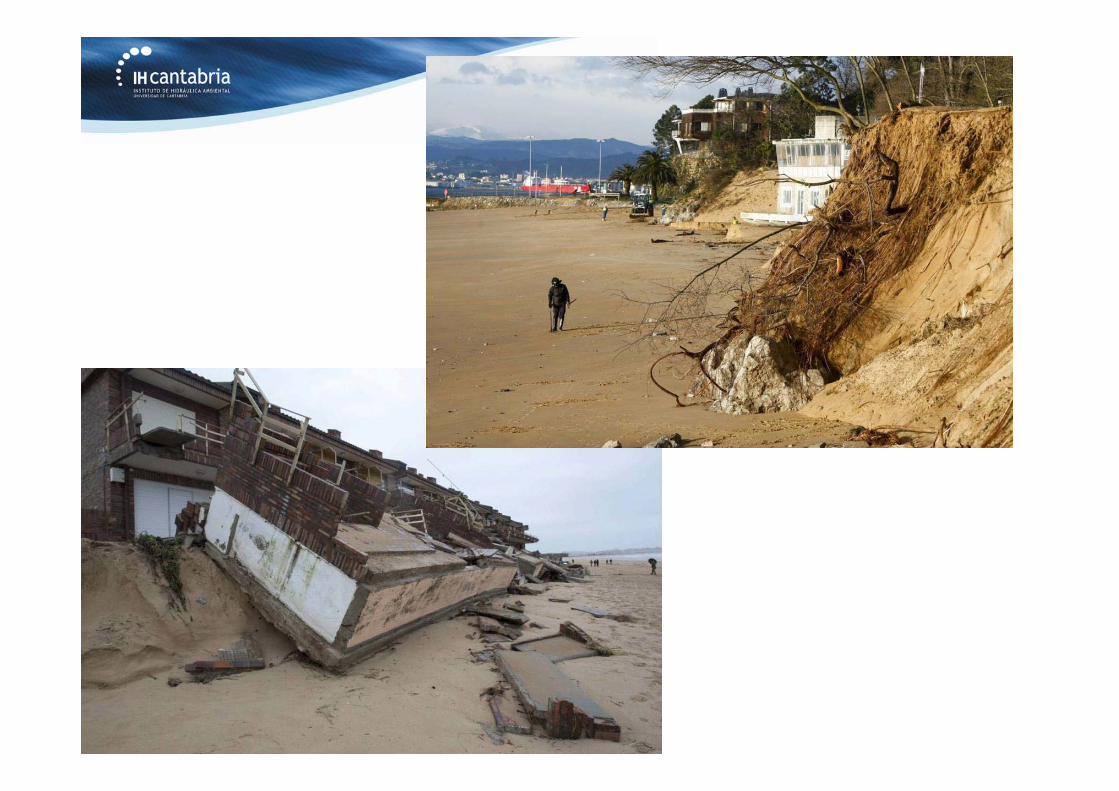
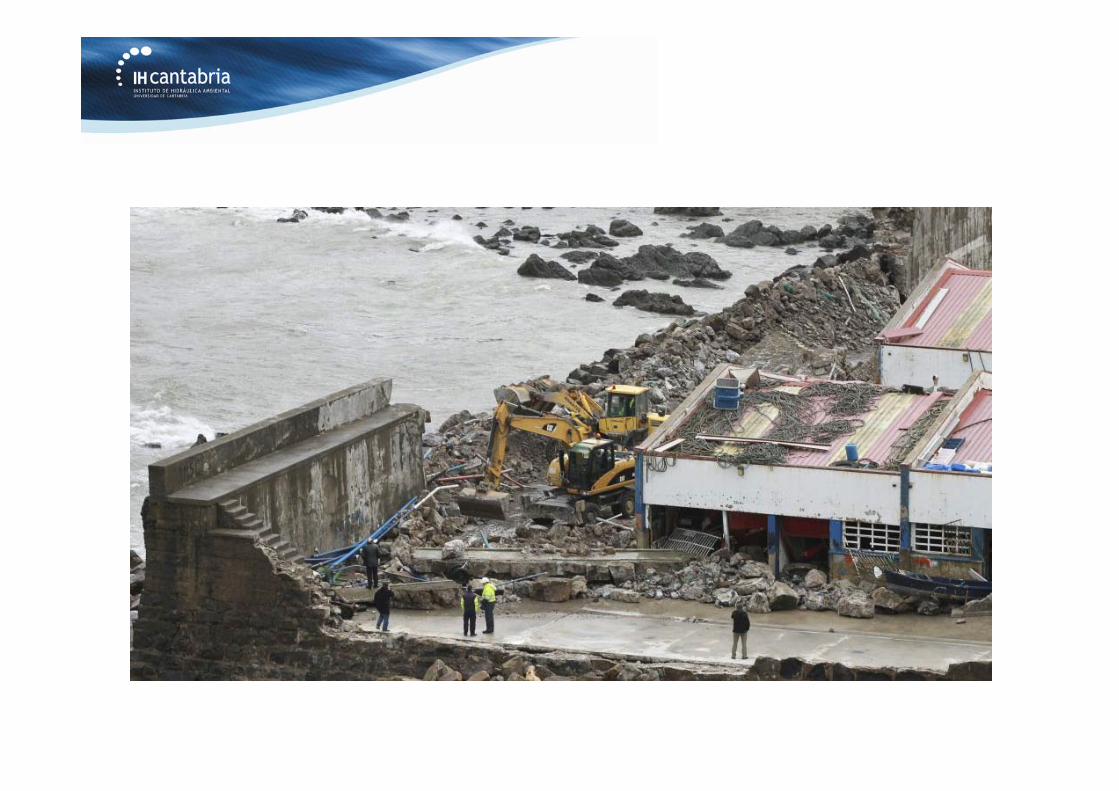
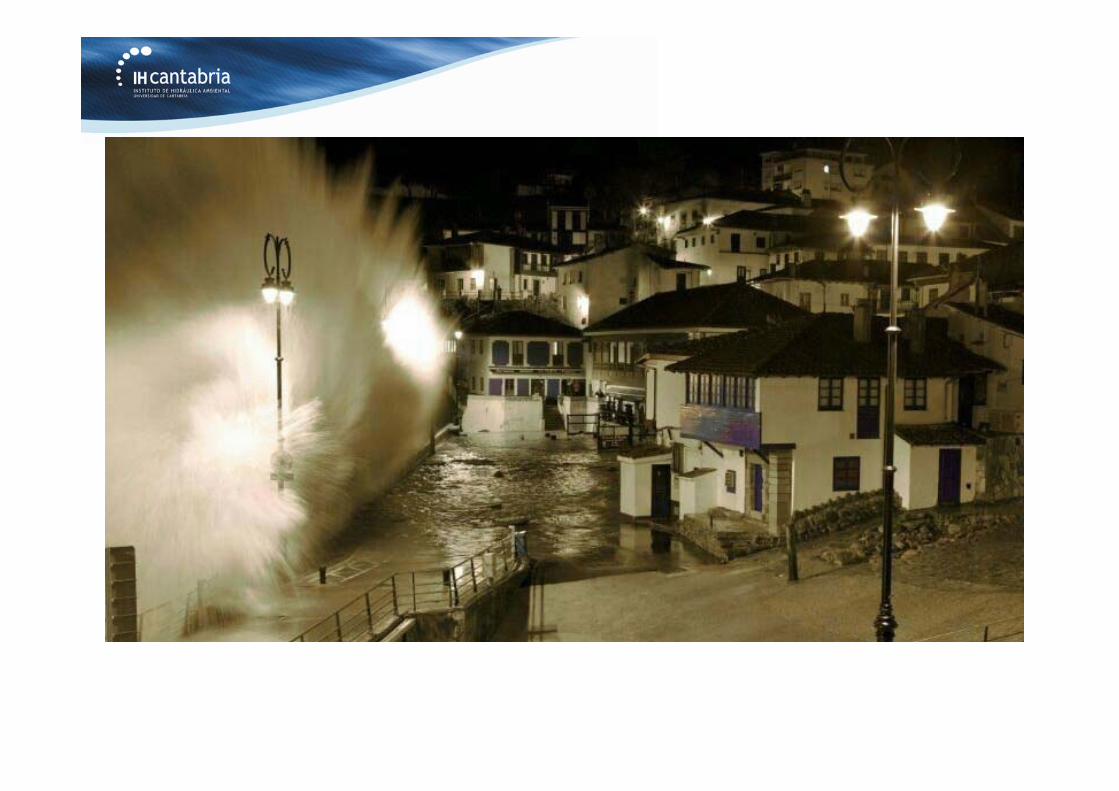
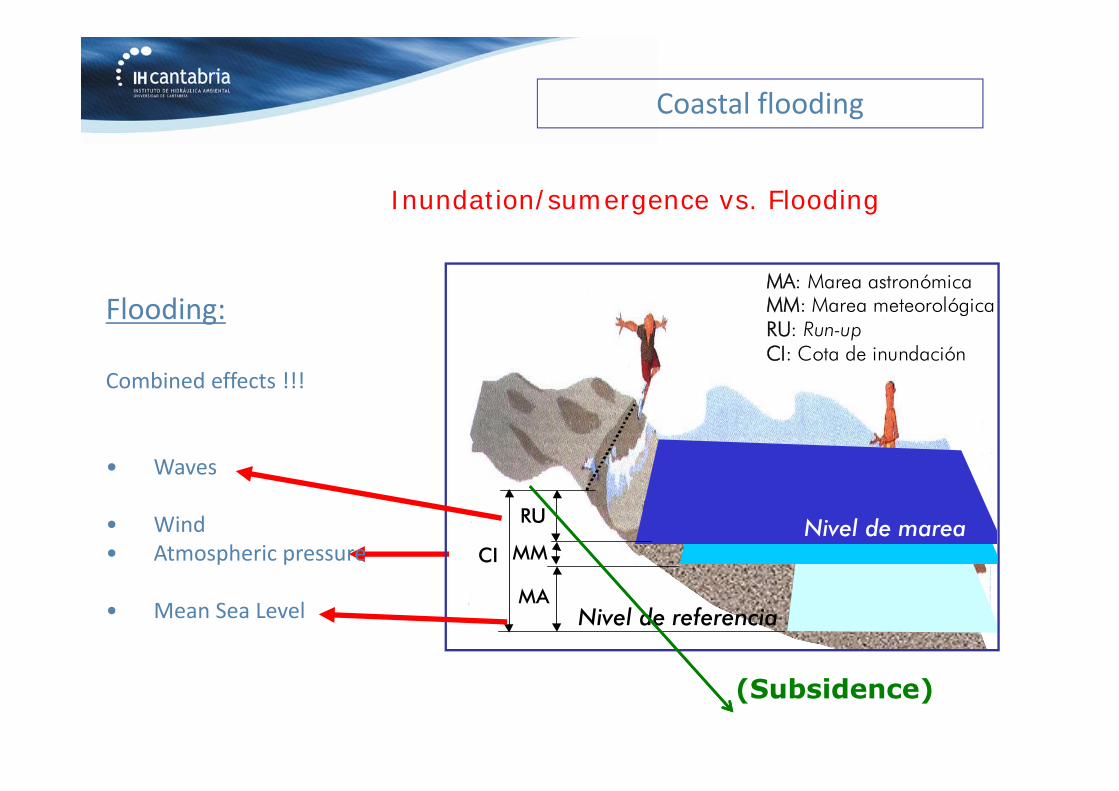
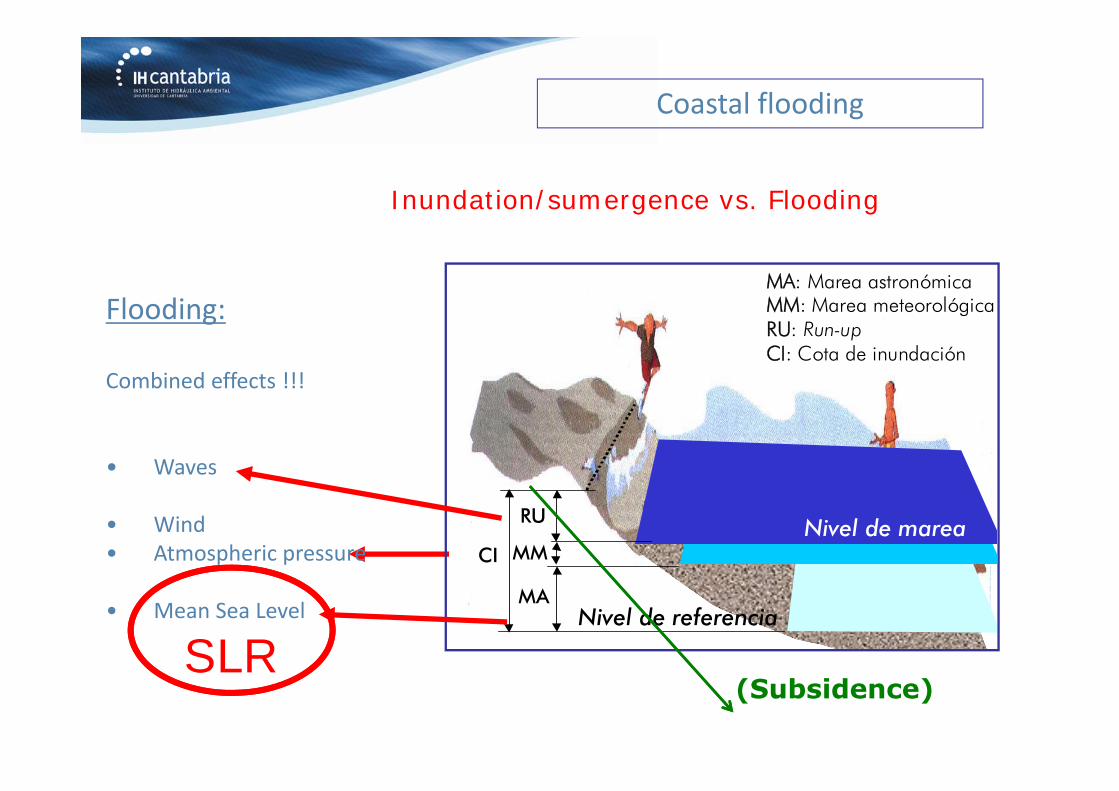
Coastal flooding
Flooding:
Combined effects !!!
• Waves
• Wind• Atmospheric pressure
• Mean Sea Level MA
MM
RU
CI
Nivel de referencia
MA: Marea astronómicaMM: Marea meteorológicaRU: Run-upCI: Cota de inundación
Nivel de marea
Inundation/sumergence vs. Flooding
(Subsidence)
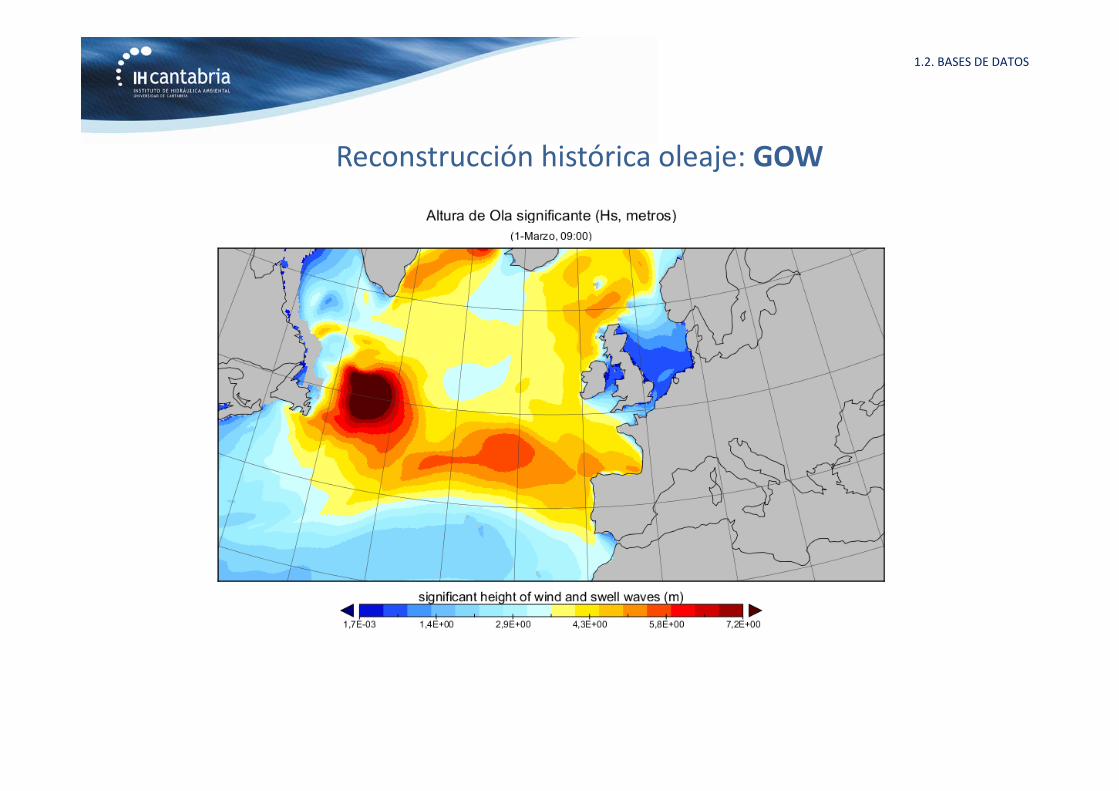
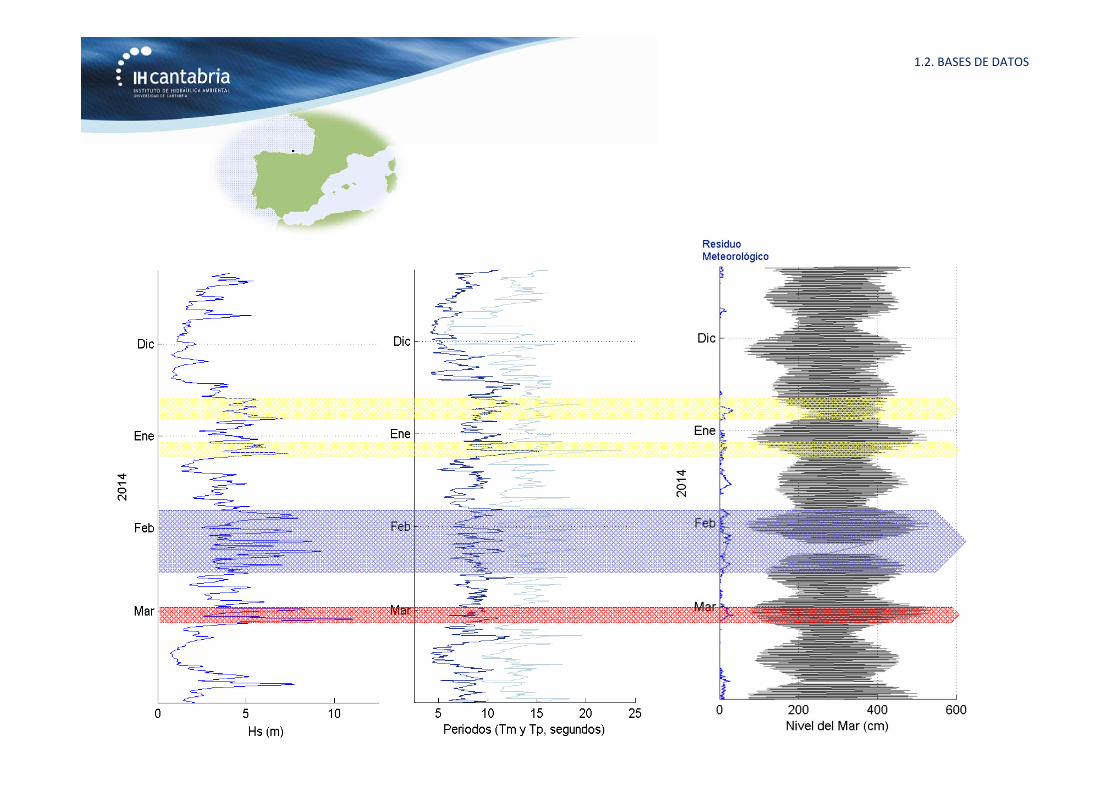
Reconstrucción histórica oleaje: GOW
1.2. BASES DE DATOS
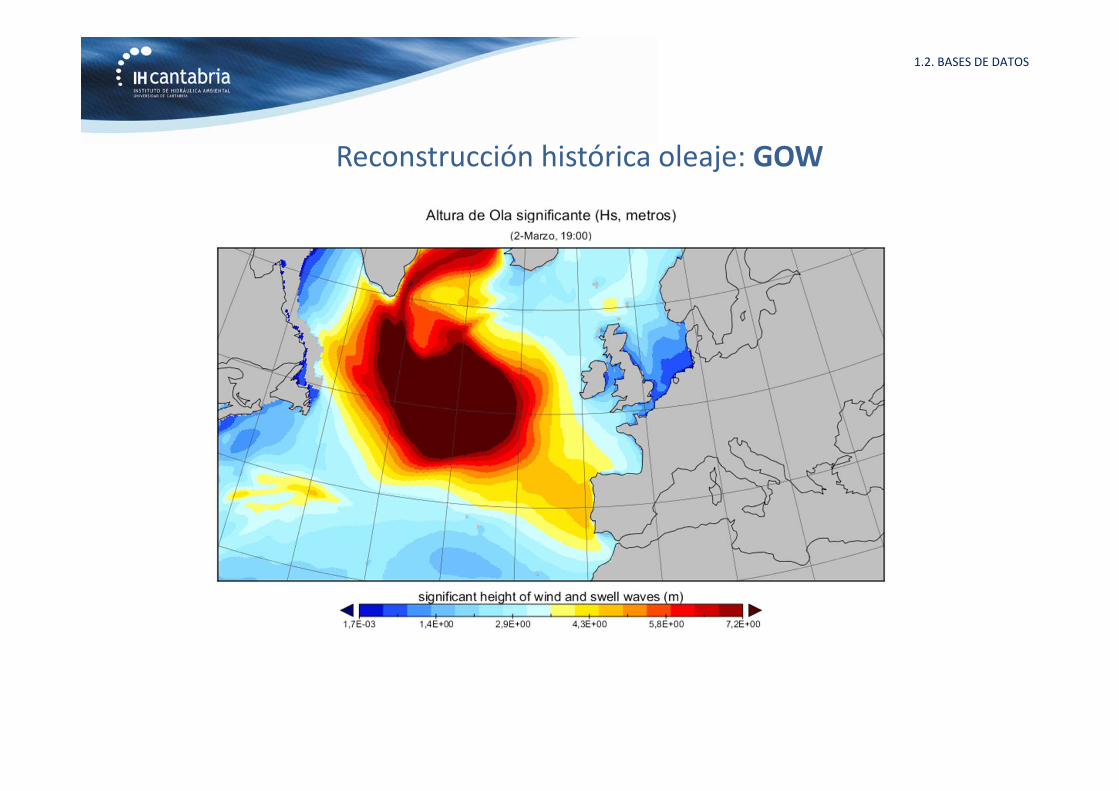
Reconstrucción histórica oleaje: GOW
1.2. BASES DE DATOS
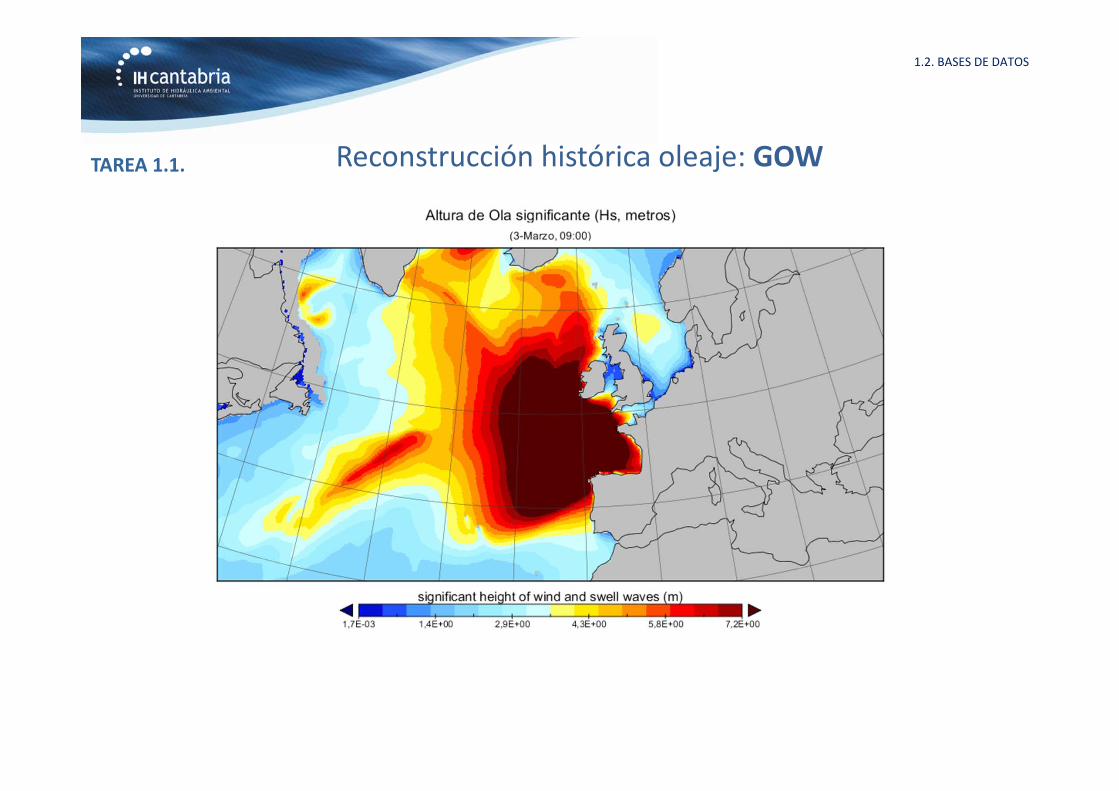
TAREA 1.1. Reconstrucción histórica oleaje: GOW
1.2. BASES DE DATOS
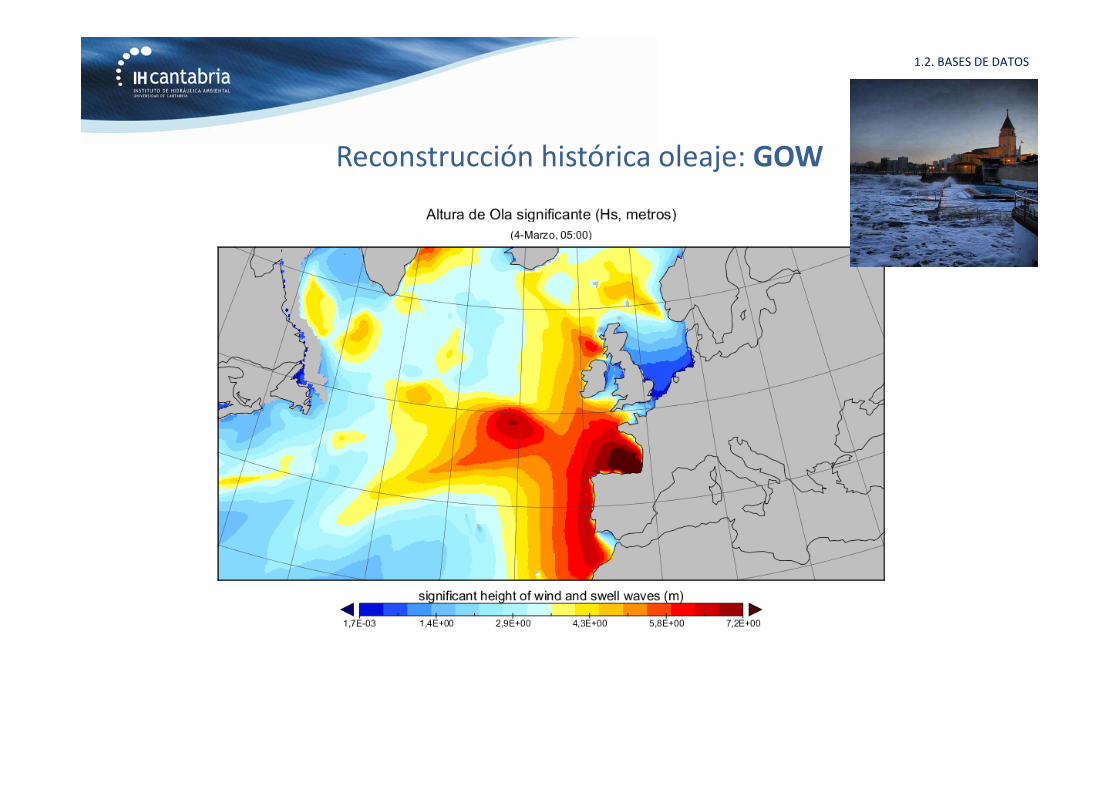
Reconstrucción histórica oleaje: GOW
1.2. BASES DE DATOS
1.2. BASES DE DATOS
Coastal flooding
Flooding:
Combined effects !!!
• Waves
• Wind• Atmospheric pressure
• Mean Sea Level MA
MM
RU
CI
Nivel de referencia
MA: Marea astronómicaMM: Marea meteorológicaRU: Run-upCI: Cota de inundación
Nivel de marea
Inundation/sumergence vs. Flooding
(Subsidence)SLR
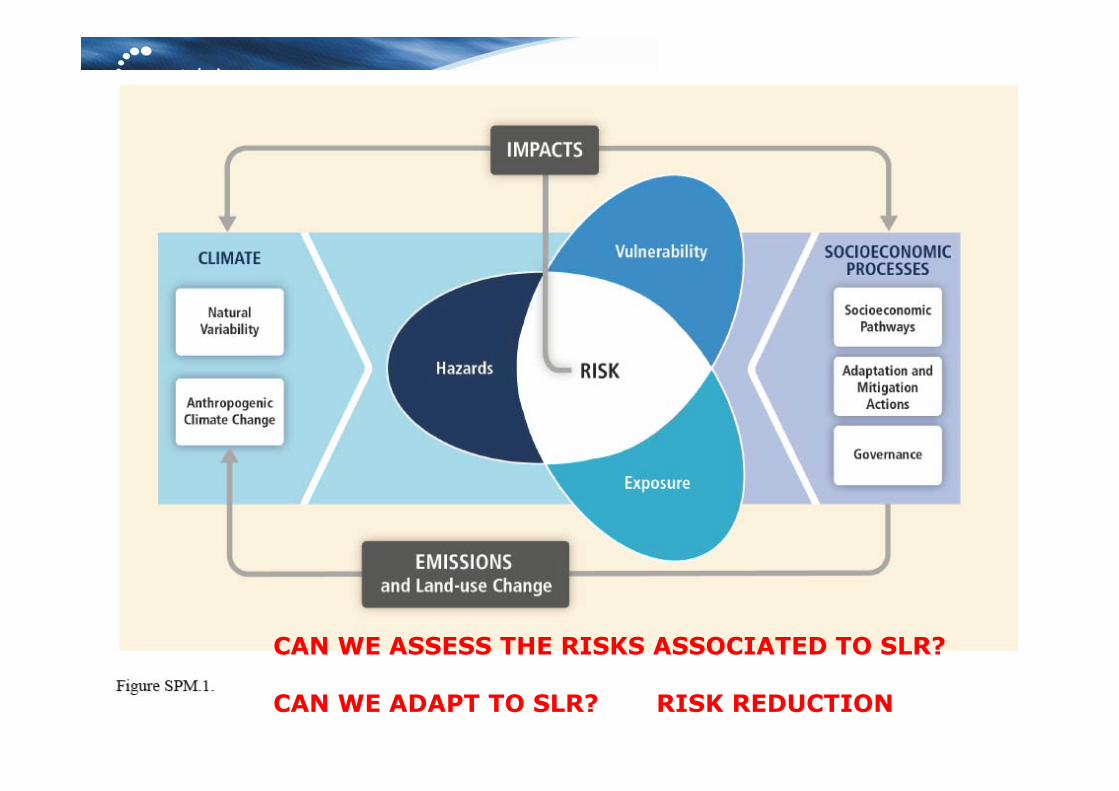
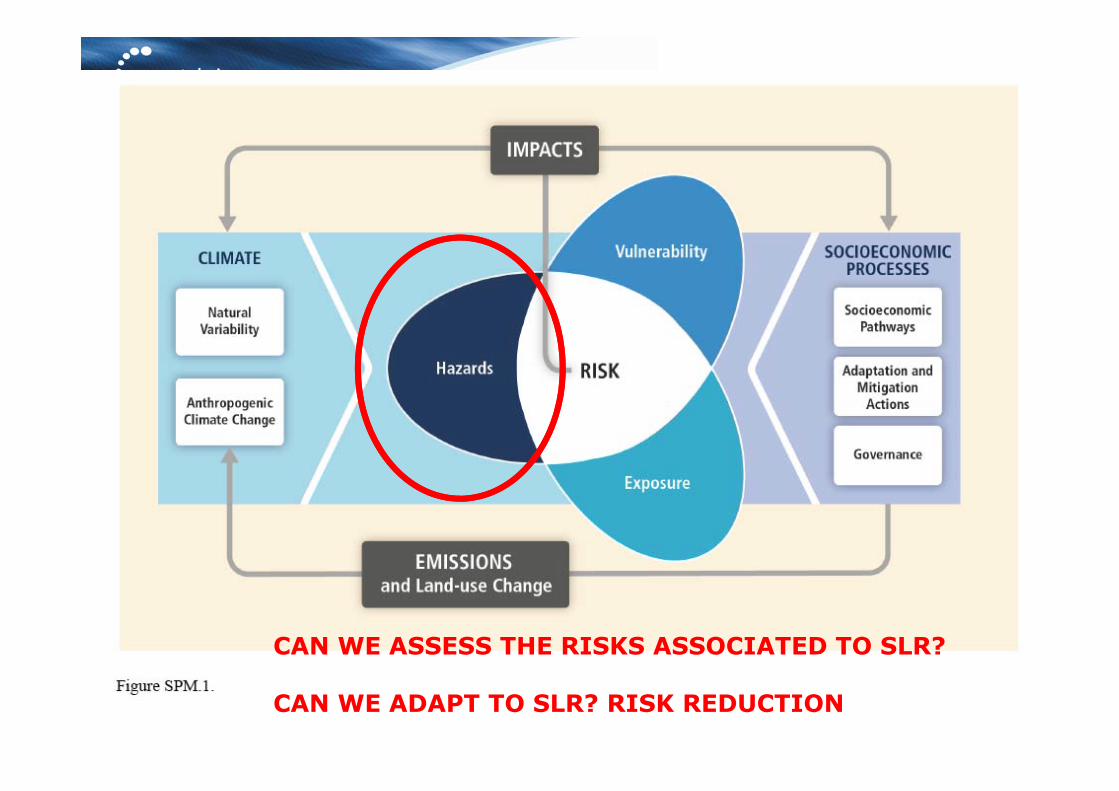
CAN WE ASSESS THE RISKS ASSOCIATED TO SLR?
CAN WE ADAPT TO SLR? RISK REDUCTION
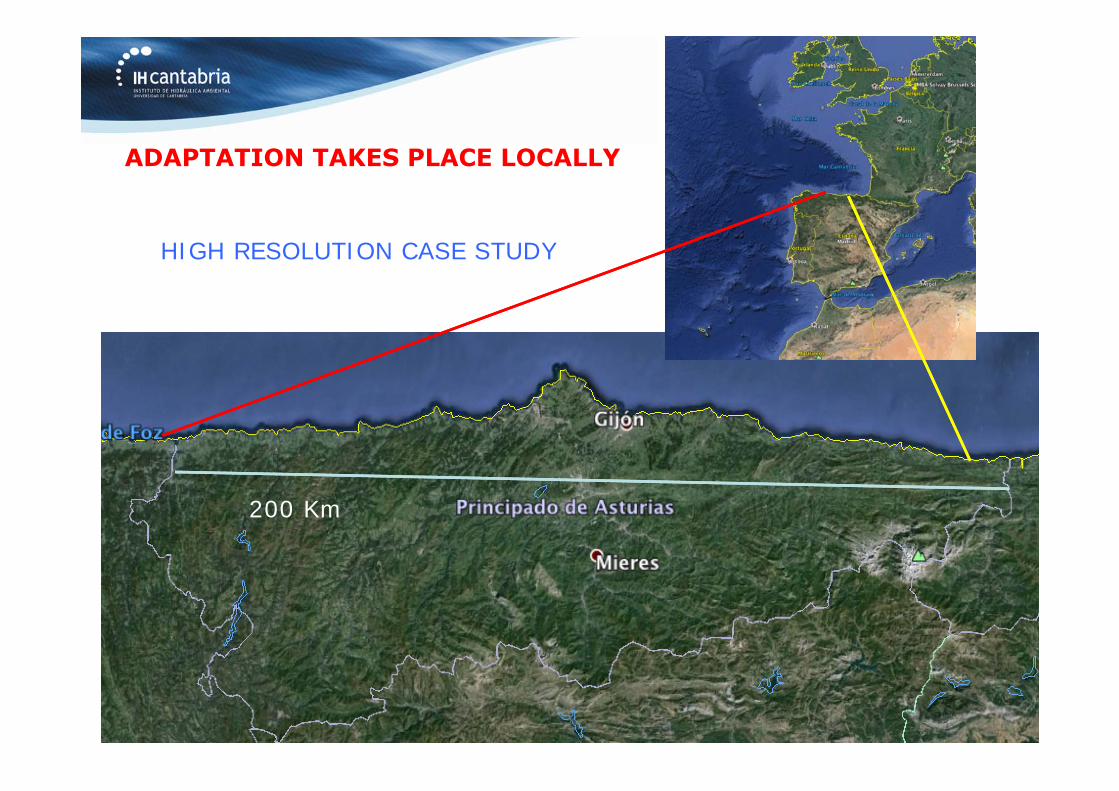
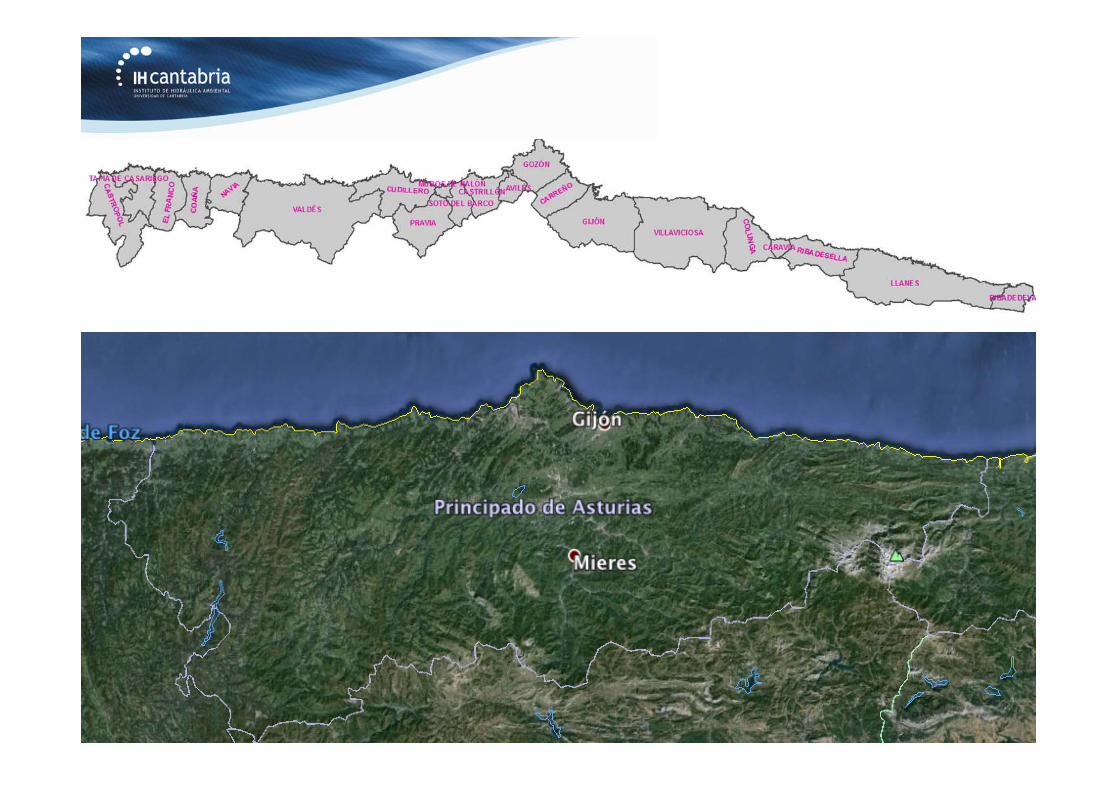
200 Km
HIGH RESOLUTION CASE STUDY
ADAPTATION TAKES PLACE LOCALLY
CAN WE ASSESS THE RISKS ASSOCIATED TO SLR?
CAN WE ADAPT TO SLR? RISK REDUCTION
WE NEED TO ASSESS HIGH RESOLUTION
HAZARDS BOTH HISTORIC AND PROJECTED TO
THE FUTURE
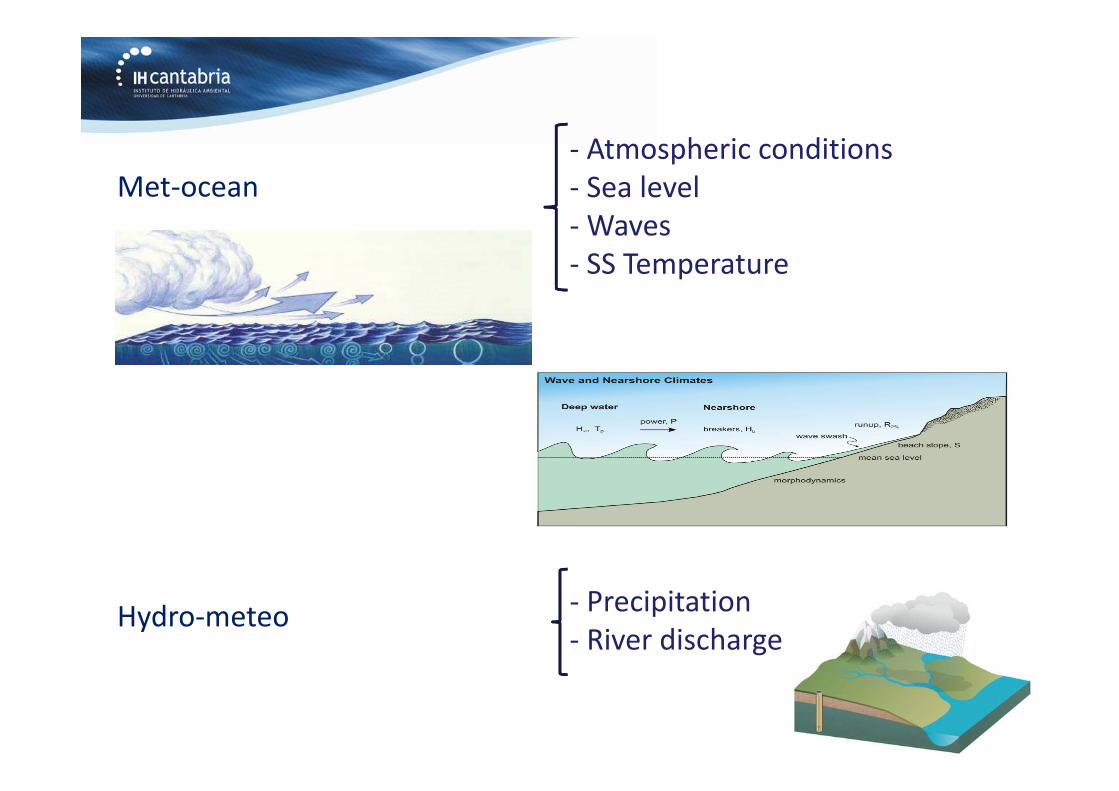
Met‐ocean‐ Atmospheric conditions‐ Sea level‐Waves‐ SS Temperature
Hydro‐meteo ‐ Precipitation‐ River discharge
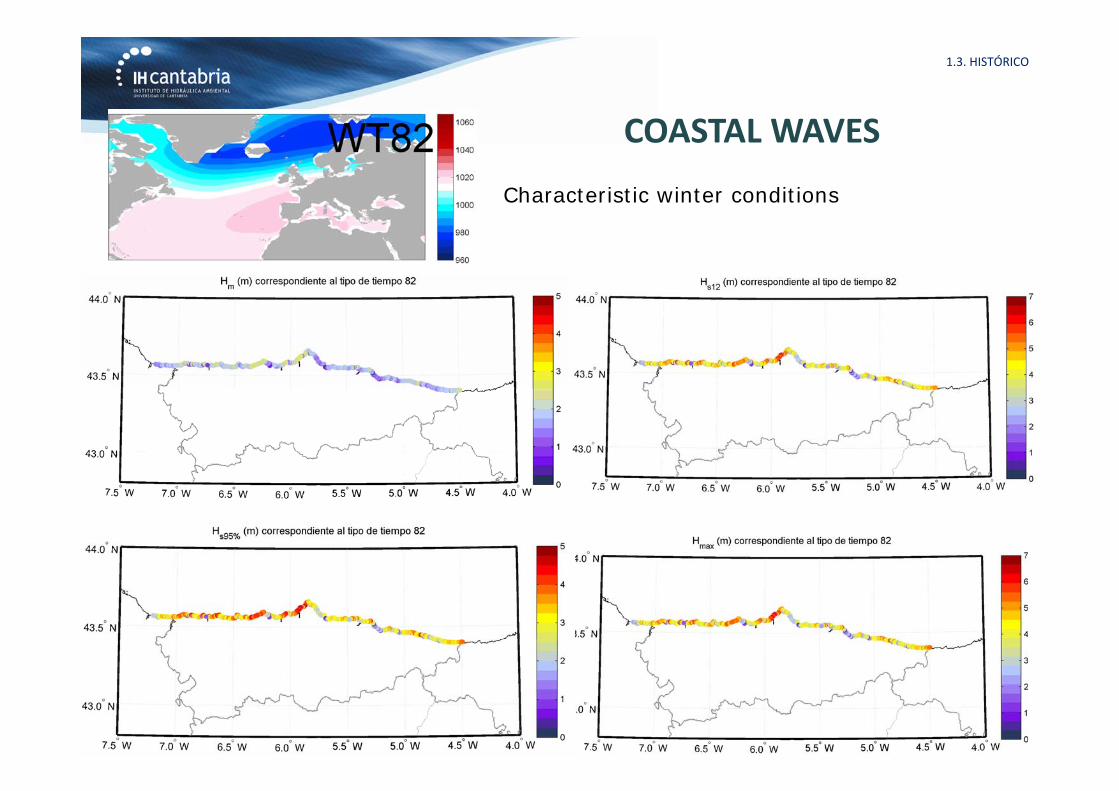
Characteristic winter conditions
COASTAL WAVES
1.3. HISTÓRICO
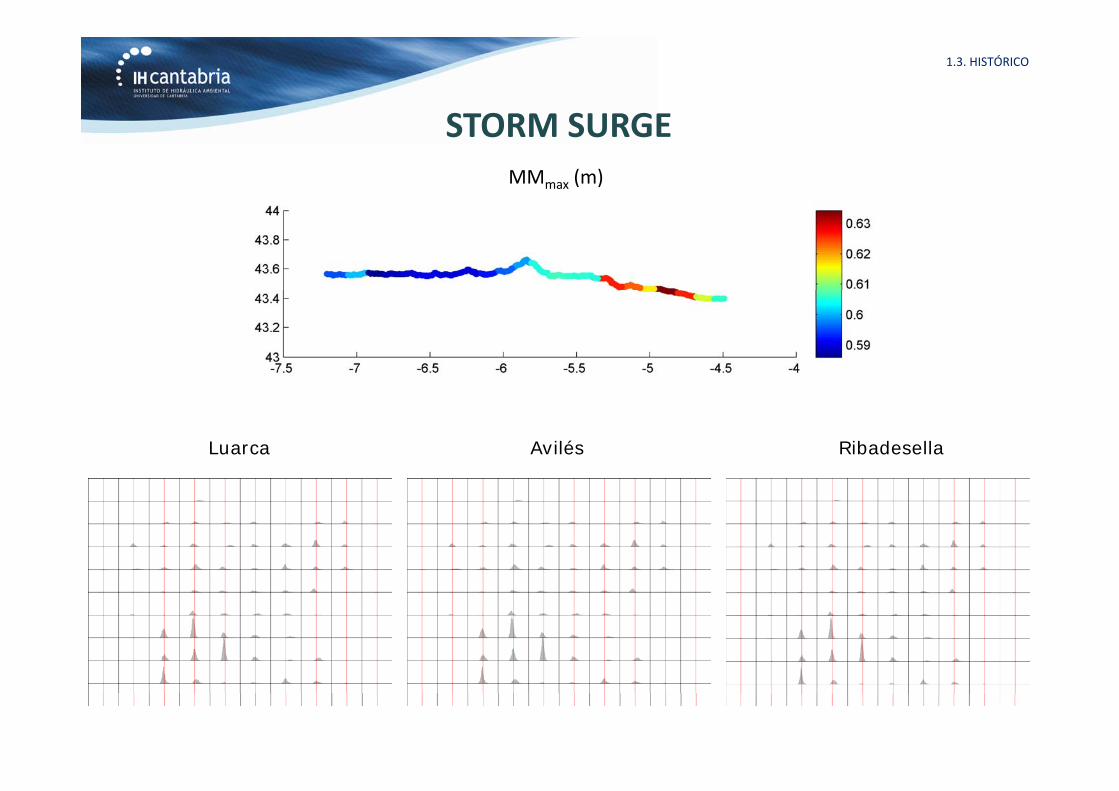
STORM SURGE
1.3. HISTÓRICO
MMmax (m)
RibadesellaAvilésLuarca
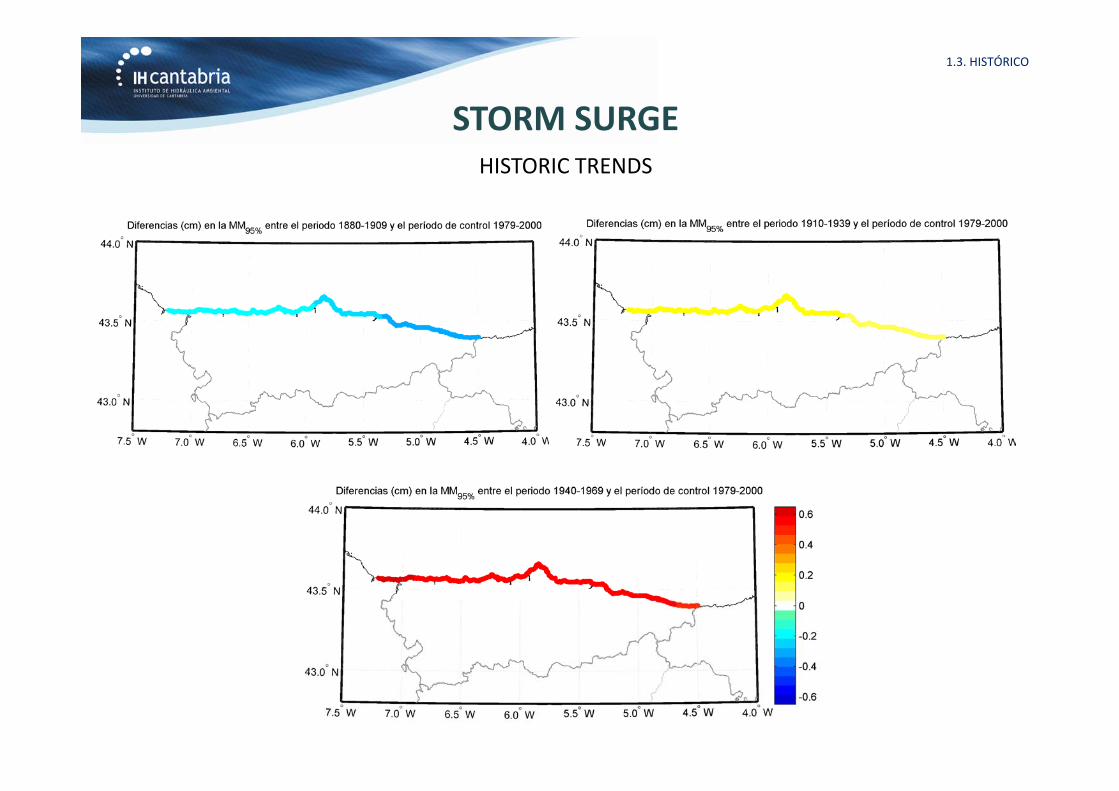
HISTORIC TRENDS
STORM SURGE
1.3. HISTÓRICO
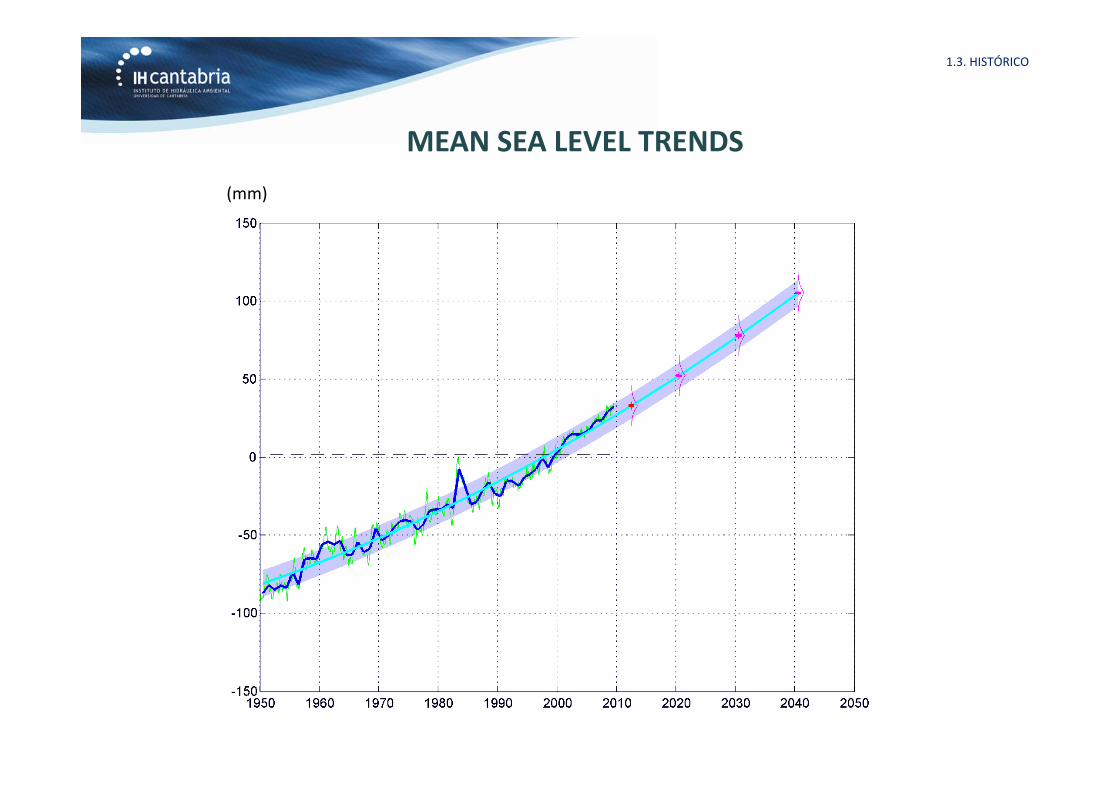
MEAN SEA LEVEL TRENDS(mm)
1.3. HISTÓRICO
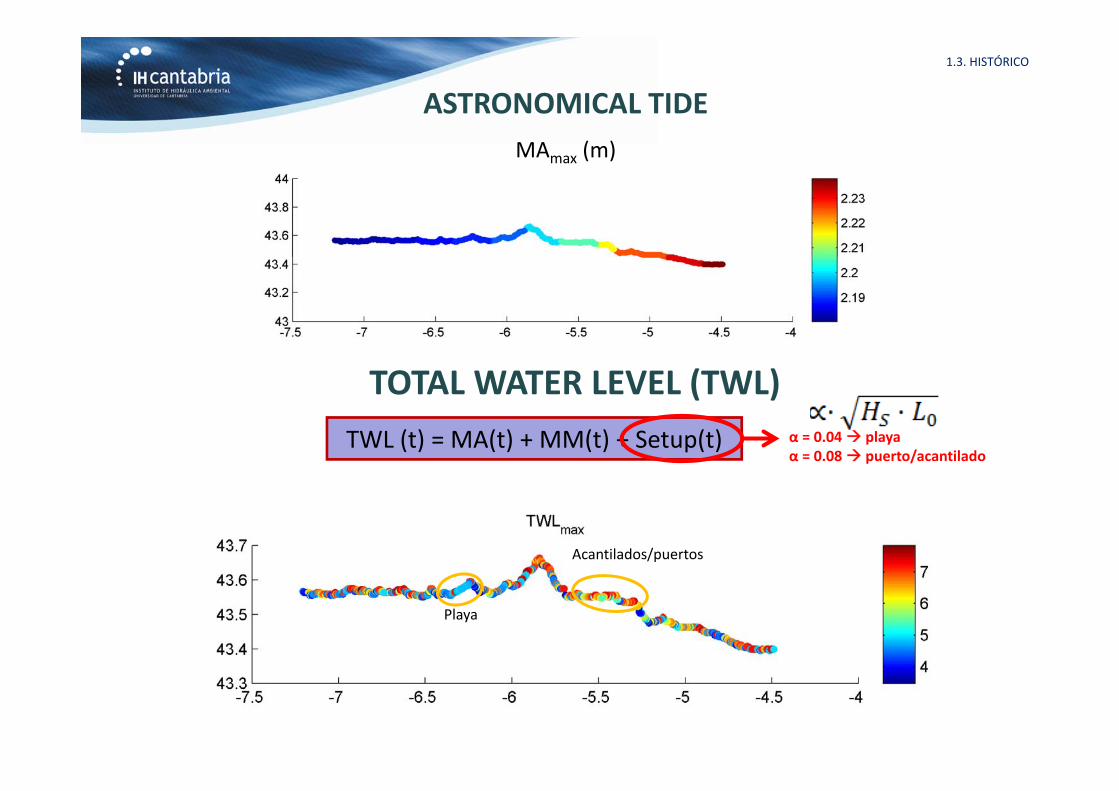
ASTRONOMICAL TIDEMAmax (m)
TWL (t) = MA(t) + MM(t) + Setup(t) α = 0.04 playaα = 0.08 puerto/acantilado
TOTAL WATER LEVEL (TWL)
Playa
Acantilados/puertos
1.3. HISTÓRICO
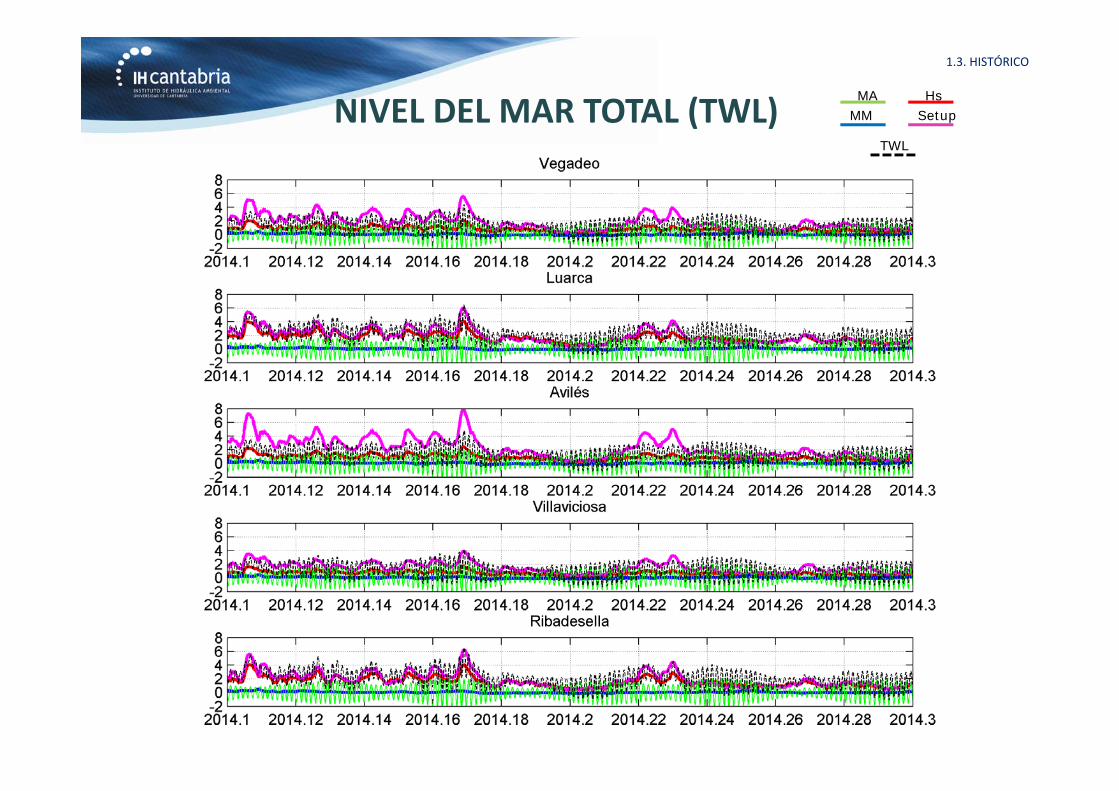
MAMM
HsSetup
TWL
NIVEL DEL MAR TOTAL (TWL)1.3. HISTÓRICO
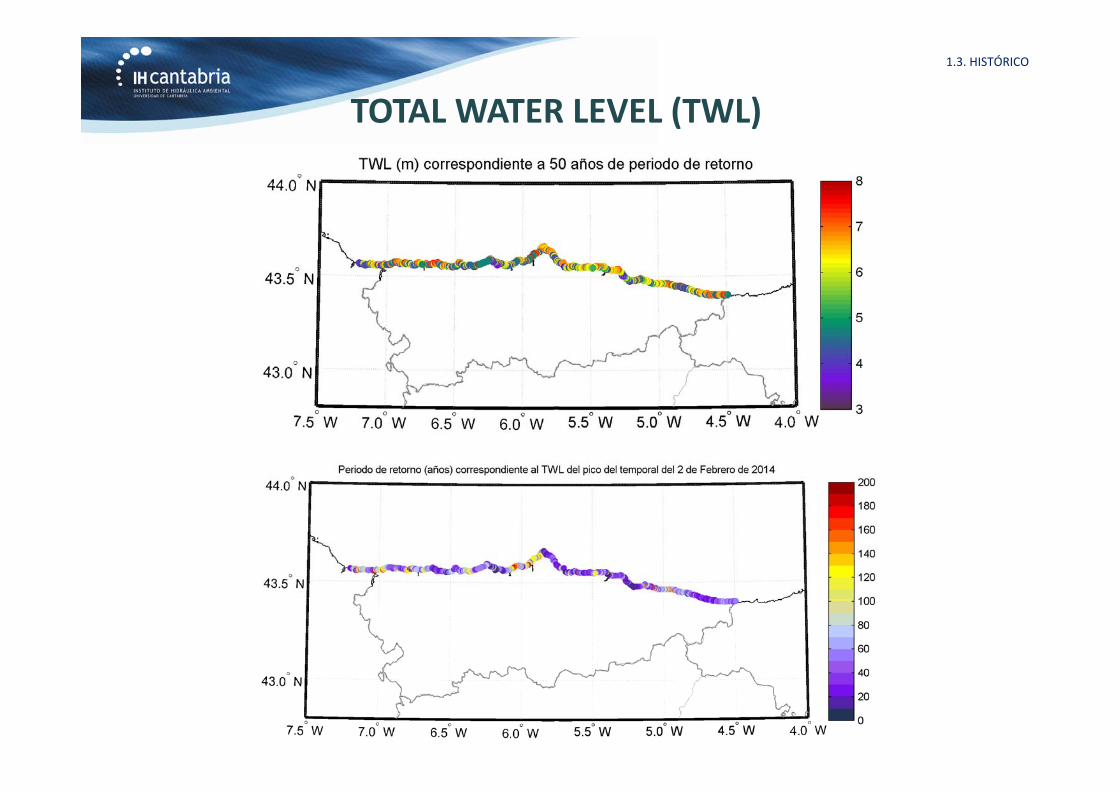
TOTAL WATER LEVEL (TWL)1.3. HISTÓRICO
PROJECTIONS
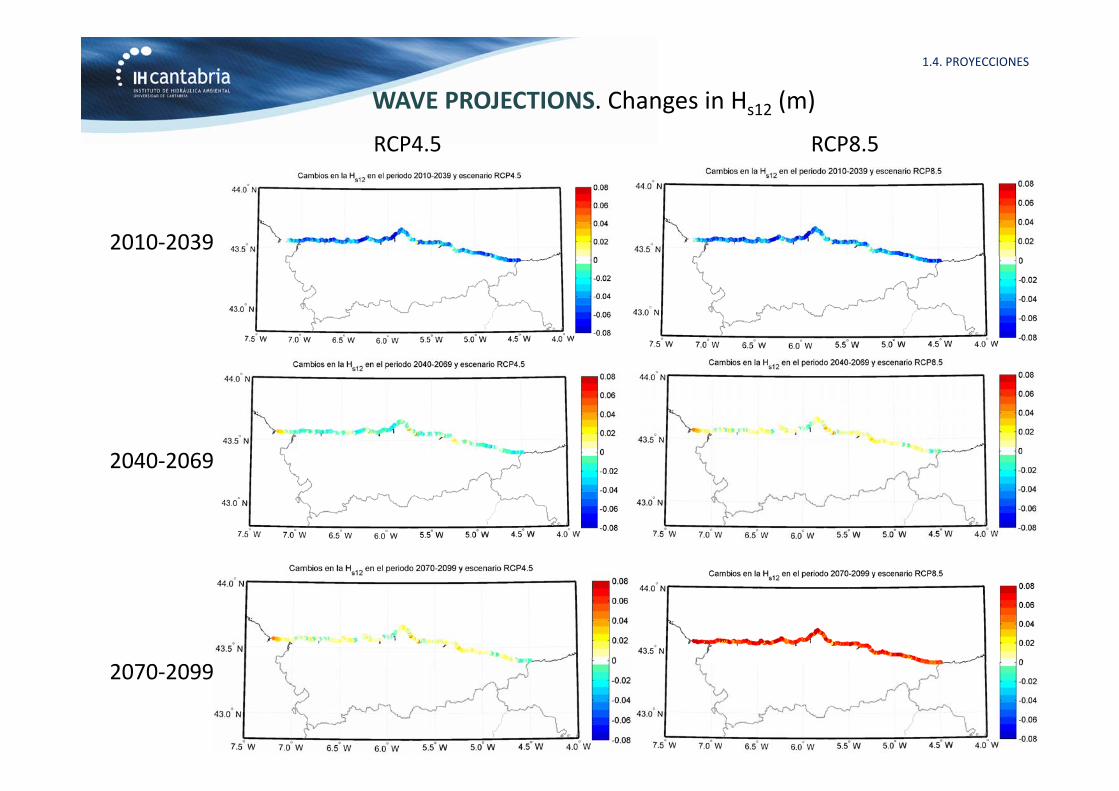
WAVE PROJECTIONS. Changes in Hs12 (m)
2010‐2039
2040‐2069
2070‐2099
RCP4.5 RCP8.5
1.4. PROYECCIONES
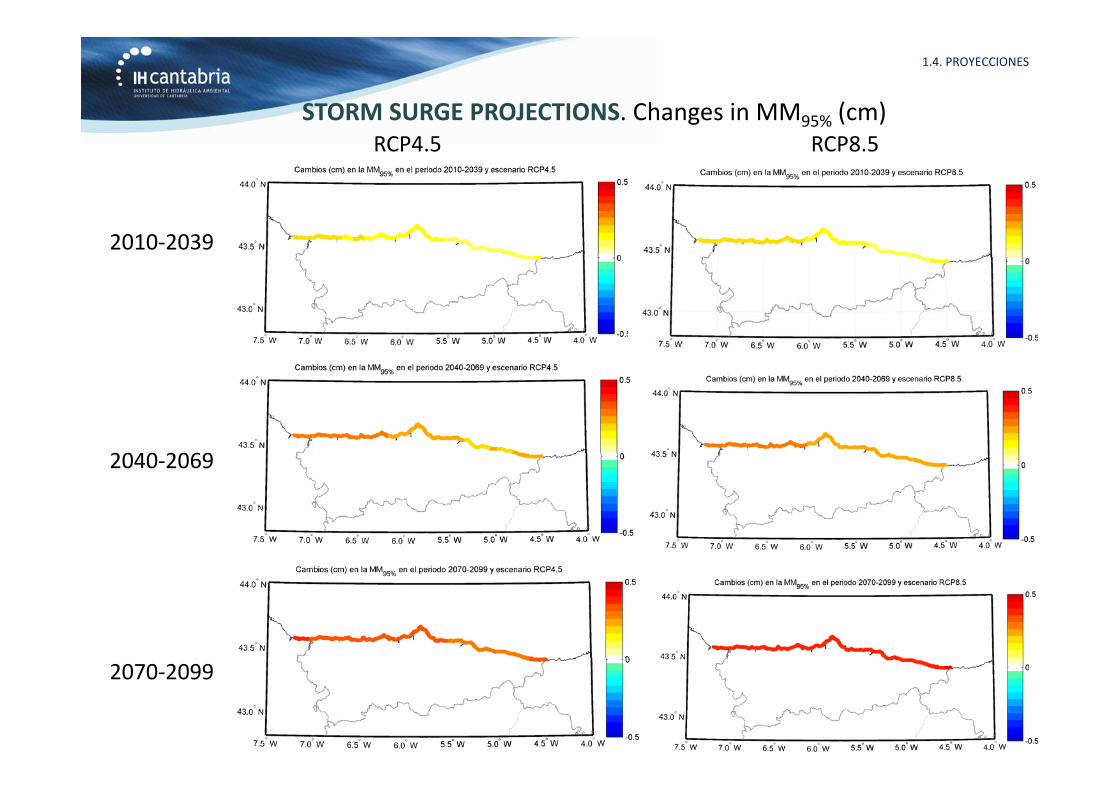
STORM SURGE PROJECTIONS. Changes in MM95% (cm)
2010‐2039
2040‐2069
2070‐2099
RCP4.5 RCP8.5
1.4. PROYECCIONES
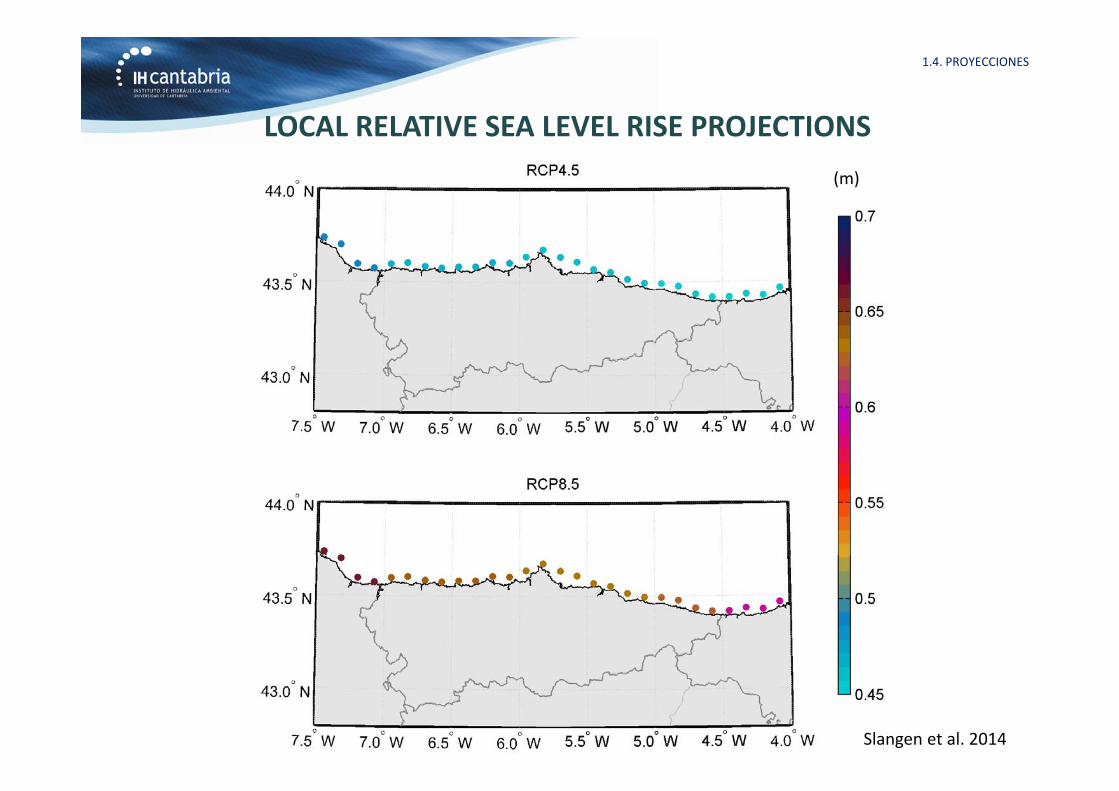
LOCAL RELATIVE SEA LEVEL RISE PROJECTIONS(m)
Slangen et al. 2014
1.4. PROYECCIONES
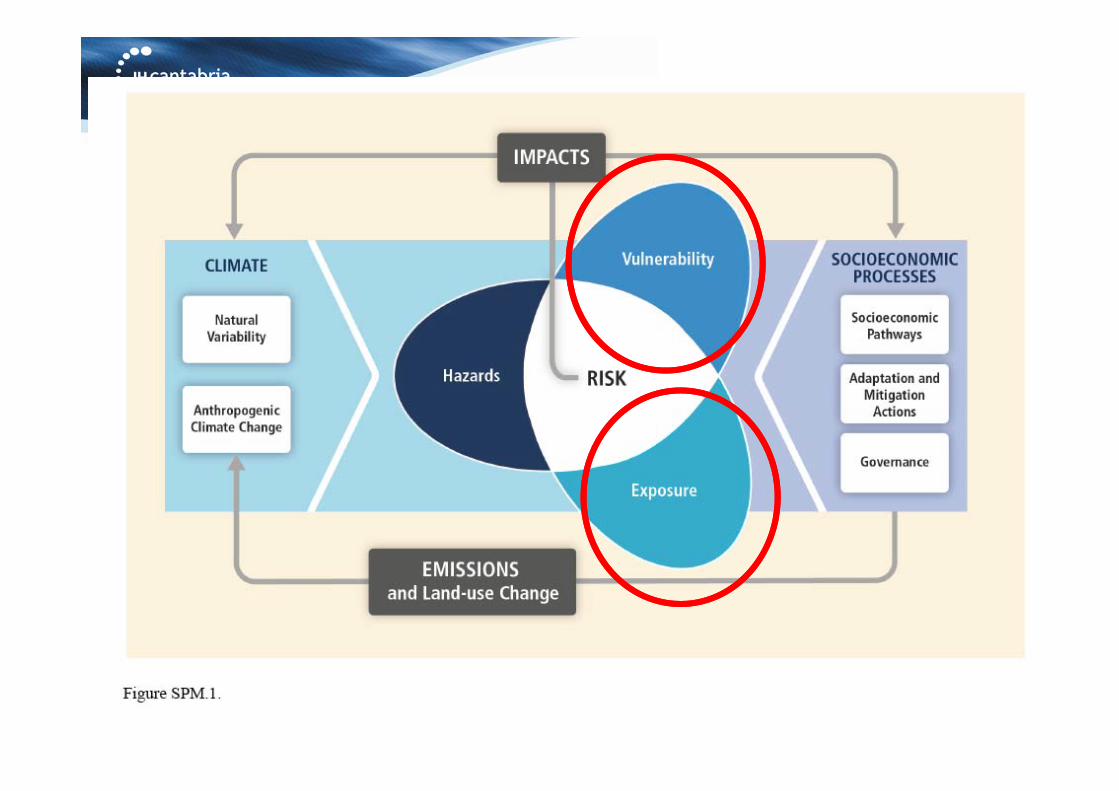
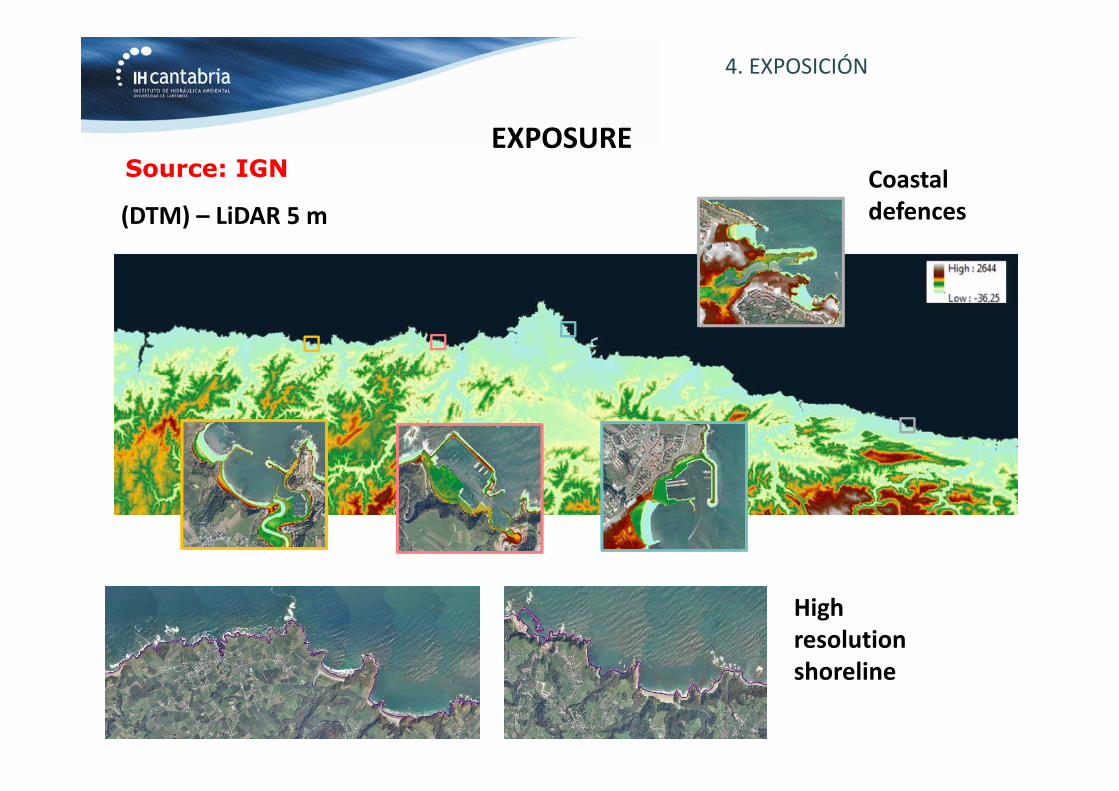
4. EXPOSICIÓN
EXPOSURE
(DTM) – LiDAR 5 m
High resolutionshoreline
Coastal defences
Source: IGN
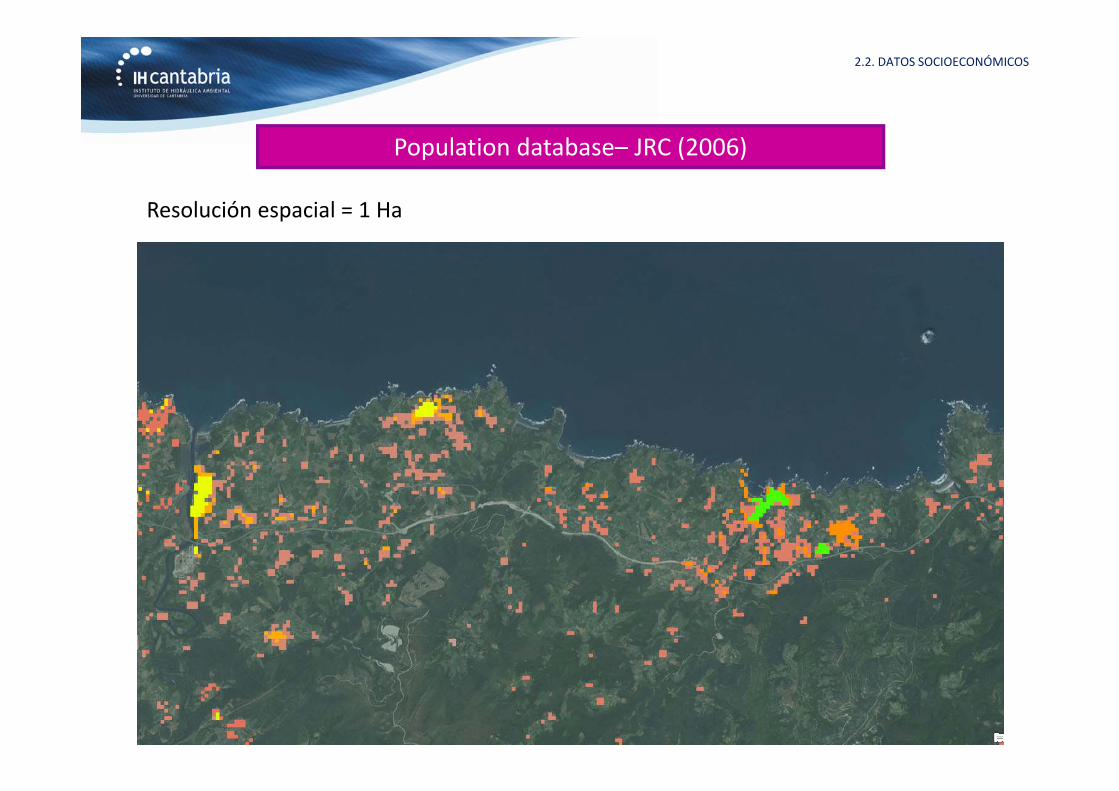
Population database– JRC (2006)
2.2. DATOS SOCIOECONÓMICOS
Resolución espacial = 1 Ha
2.2. DATOS SOCIOECONÓMICOS
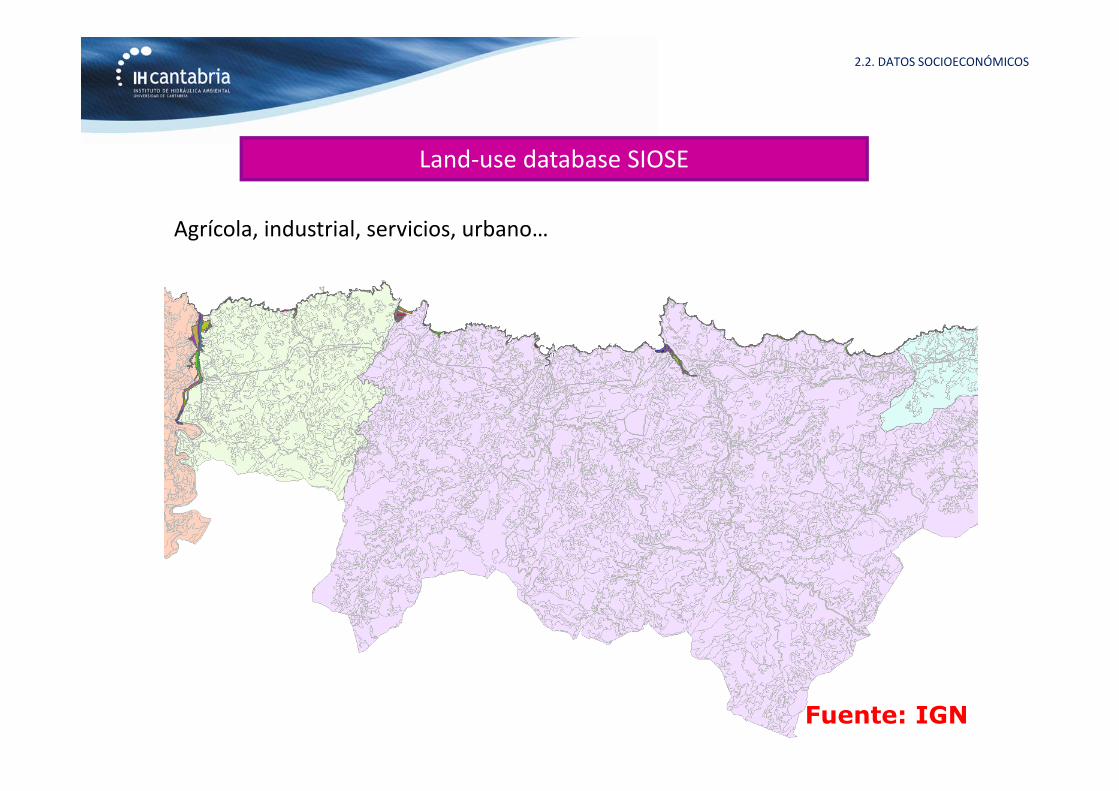
Land‐use database SIOSE
Agrícola, industrial, servicios, urbano…
Fuente: IGN

2.2. DATOS SOCIOECONÓMICOS
Base Cartográfica Numérica BCN25/BTN25
Base Cartográfica Numérica 1:25.000. Base de datos geográfica 2D de referencia a escala1:25.000 que cubre toda España.
• Edificios• Instalaciones industriales• Infraestructuras críticas• Redes de comunicación
Fuente: IGN
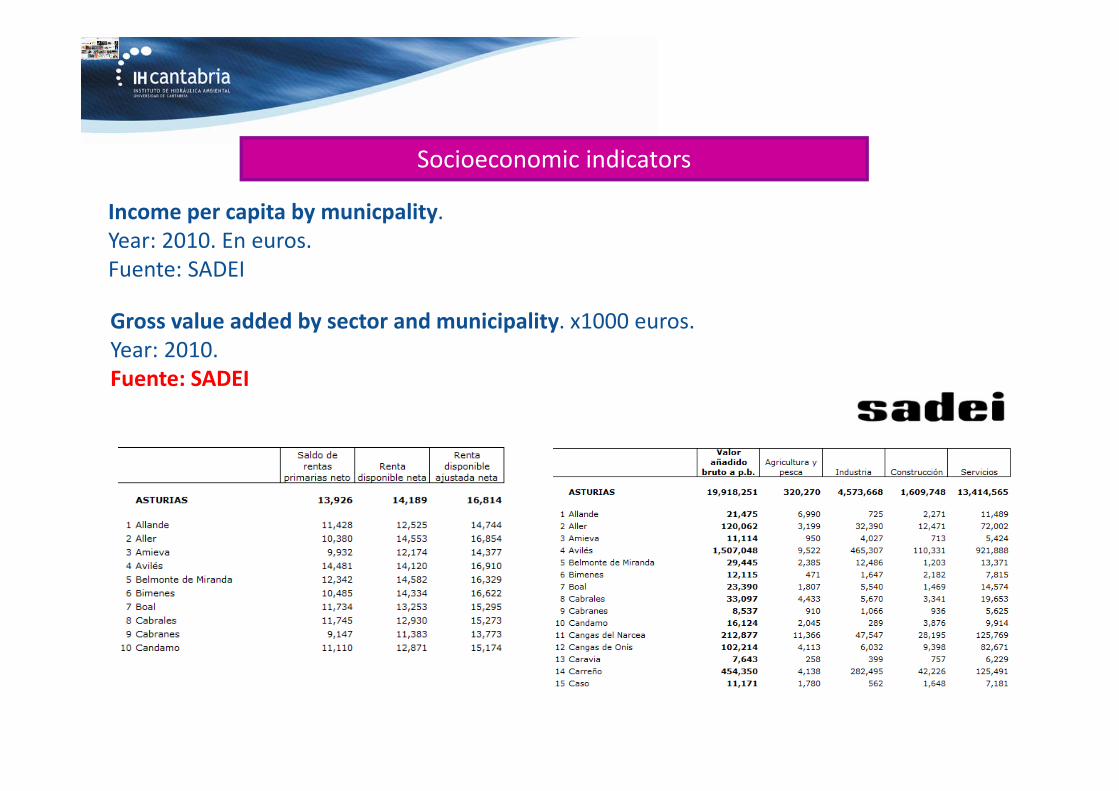
Socioeconomic indicators
Income per capita by municpality.Year: 2010. En euros.Fuente: SADEI
Gross value added by sector and municipality. x1000 euros.Year: 2010.Fuente: SADEI
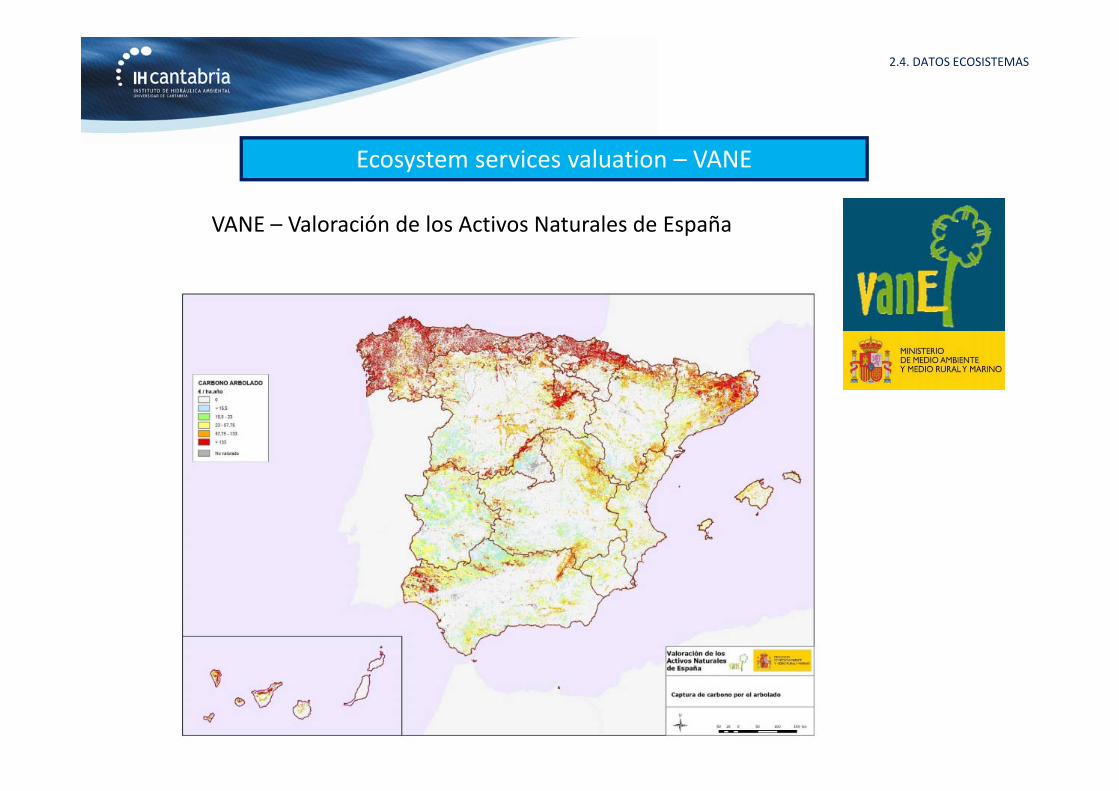
2.4. DATOS ECOSISTEMAS
Ecosystem services valuation – VANE
VANE – Valoración de los Activos Naturales de España

ASSESSING FLOODING IMPACTS
3.1. INUNDACIÓN
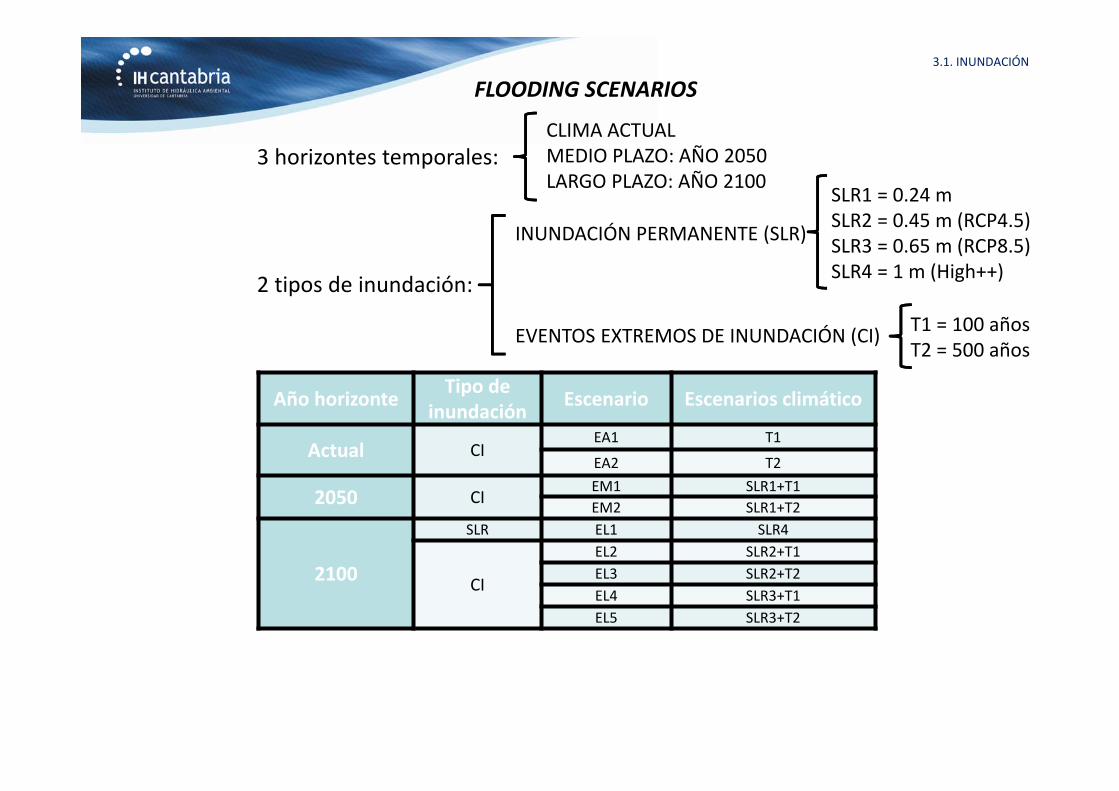
FLOODING SCENARIOS
Año horizonte Tipo de inundación Escenario Escenarios climático
Actual CIEA1 T1
EA2 T2
2050 CIEM1 SLR1+T1EM2 SLR1+T2
2100
SLR EL1 SLR4
CI
EL2 SLR2+T1EL3 SLR2+T2EL4 SLR3+T1EL5 SLR3+T2
3 horizontes temporales: CLIMA ACTUALMEDIO PLAZO: AÑO 2050LARGO PLAZO: AÑO 2100
2 tipos de inundación:
INUNDACIÓN PERMANENTE (SLR)
EVENTOS EXTREMOS DE INUNDACIÓN (CI) T1 = 100 añosT2 = 500 años
SLR1 = 0.24 mSLR2 = 0.45 m (RCP4.5)SLR3 = 0.65 m (RCP8.5)SLR4 = 1 m (High++)
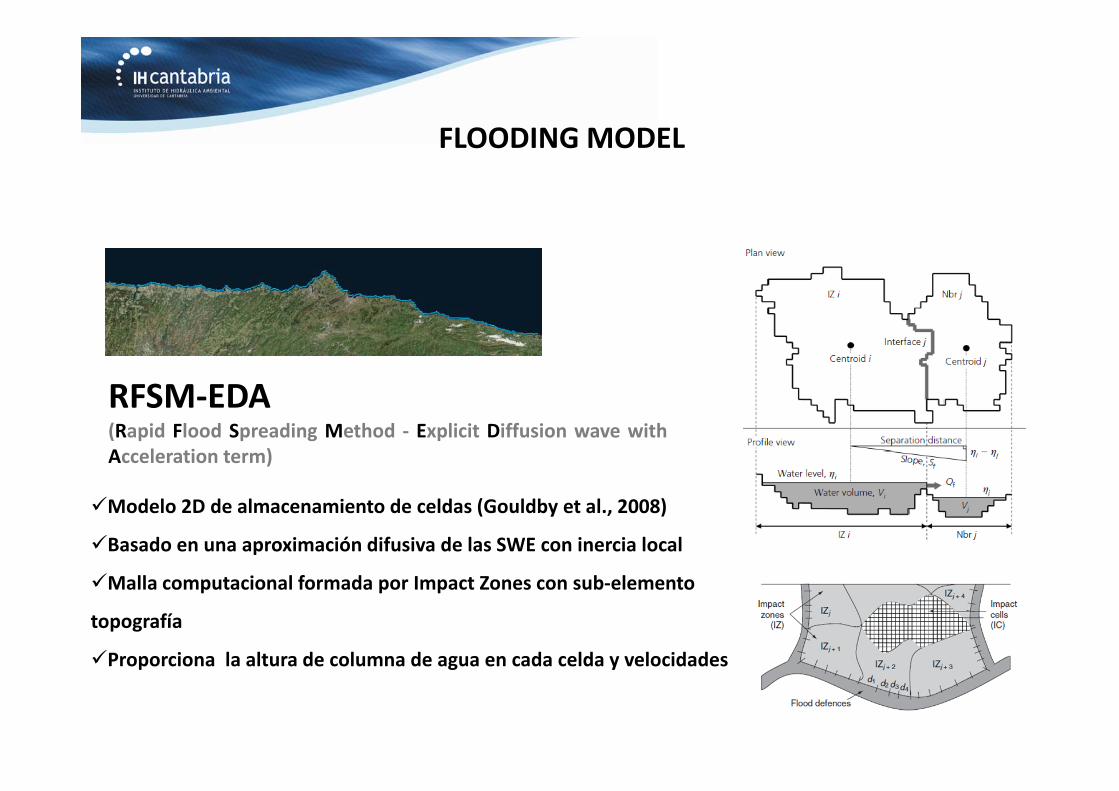
FLOODING MODEL
RFSM‐EDA(Rapid Flood Spreading Method ‐ Explicit Diffusion wave withAcceleration term)
Modelo 2D de almacenamiento de celdas (Gouldby et al., 2008)
Basado en una aproximación difusiva de las SWE con inercia local
Malla computacional formada por Impact Zones con sub‐elemento
topografía
Proporciona la altura de columna de agua en cada celda y velocidades

Distribución espacial de las mallas de inundación para RFSM‐EDA
MALLA 1MALLA 2
MALLA 3MALLA 4
MALLA 5MALLA 6
3.1. INUNDACIÓN
Modelado de la INUNDACIÓN
3.1. INUNDACIÓN
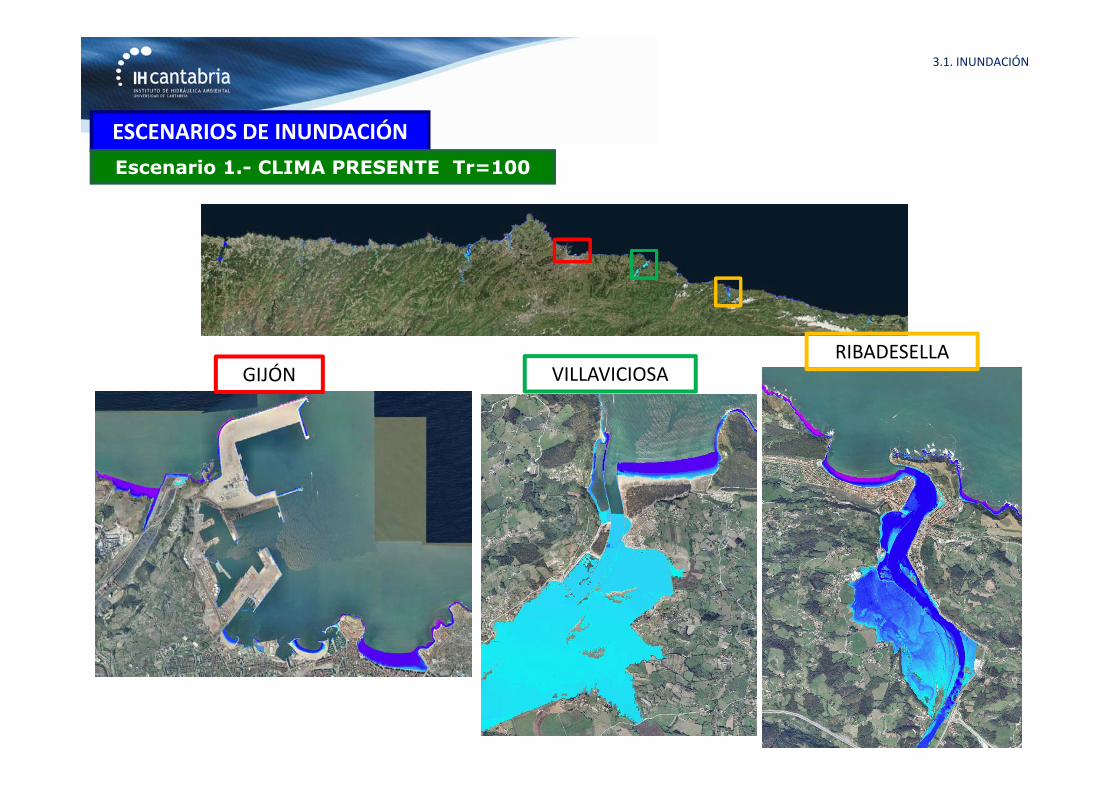
ESCENARIOS DE INUNDACIÓN Escenario 1.- CLIMA PRESENTE Tr=100
GIJÓN VILLAVICIOSARIBADESELLA
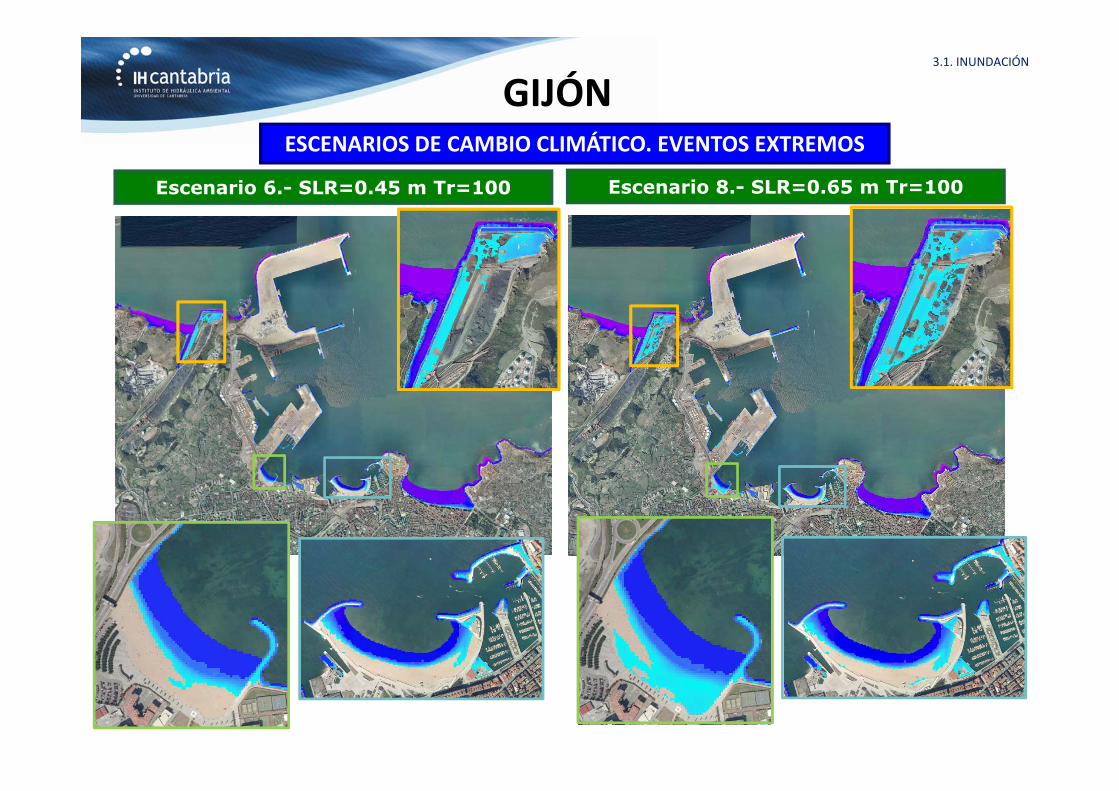
Escenario 6.- SLR=0.45 m Tr=100 Escenario 8.- SLR=0.65 m Tr=100
3.1. INUNDACIÓN
GIJÓNESCENARIOS DE CAMBIO CLIMÁTICO. EVENTOS EXTREMOS
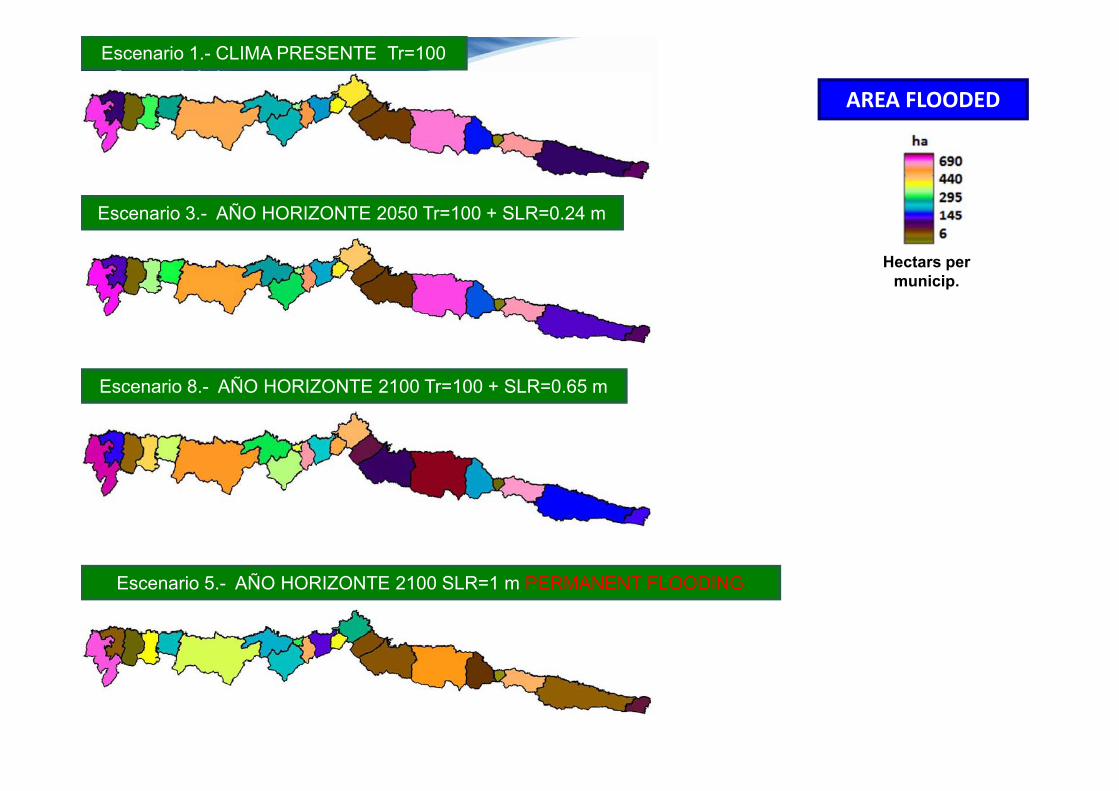
AREA FLOODED
Escenario 1.- CLIMA PRESENTE Tr=100
Escenario 3.- AÑO HORIZONTE 2050 Tr=100 + SLR=0.24 m
Escenario 8.- AÑO HORIZONTE 2100 Tr=100 + SLR=0.65 m
Escenario 5.- AÑO HORIZONTE 2100 SLR=1 m PERMANENT FLOODING
Hectars per municip.

ASSESSING CONSEQUENCES/RISK
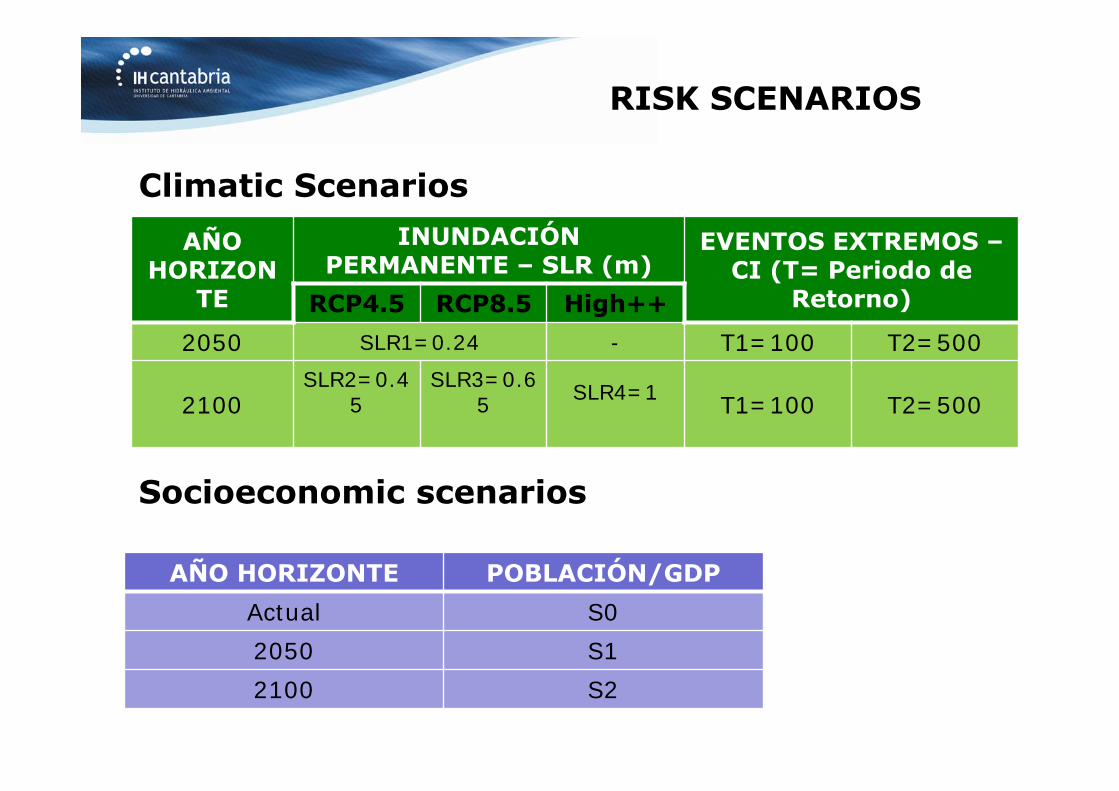
RISK SCENARIOS
Climatic Scenarios
Socioeconomic scenarios
AÑO HORIZONTE POBLACIÓN/GDPActual S02050 S12100 S2
AÑO HORIZON
TE
INUNDACIÓN PERMANENTE – SLR (m)
EVENTOS EXTREMOS –CI (T= Periodo de
Retorno)RCP4.5 RCP8.5 High++2050 SLR1=0.24 - T1=100 T2=500
2100SLR2=0.4
5SLR3=0.6
5 SLR4=1 T1=100 T2=500
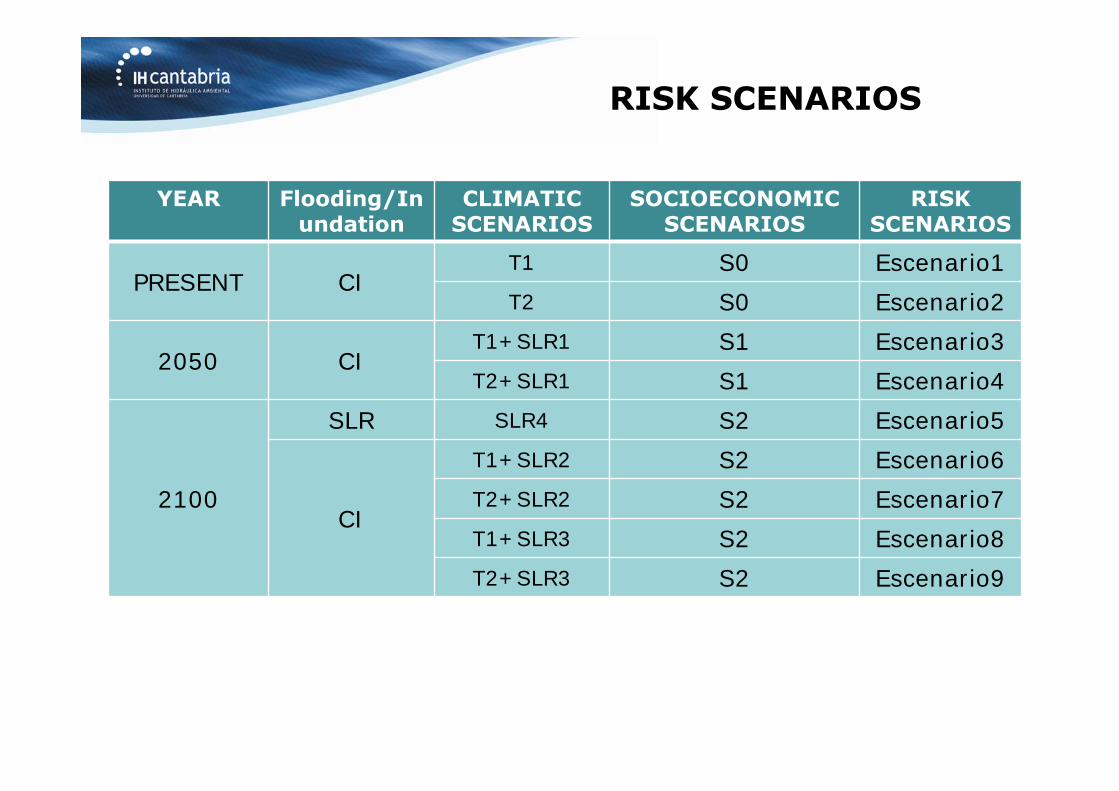
YEAR Flooding/Inundation
CLIMATIC SCENARIOS
SOCIOECONOMICSCENARIOS
RISKSCENARIOS
PRESENT CIT1 S0 Escenario1T2 S0 Escenario2
2050 CIT1+SLR1 S1 Escenario3T2+SLR1 S1 Escenario4
2100
SLR SLR4 S2 Escenario5
CI
T1+SLR2 S2 Escenario6T2+SLR2 S2 Escenario7T1+SLR3 S2 Escenario8T2+SLR3 S2 Escenario9
RISK SCENARIOS
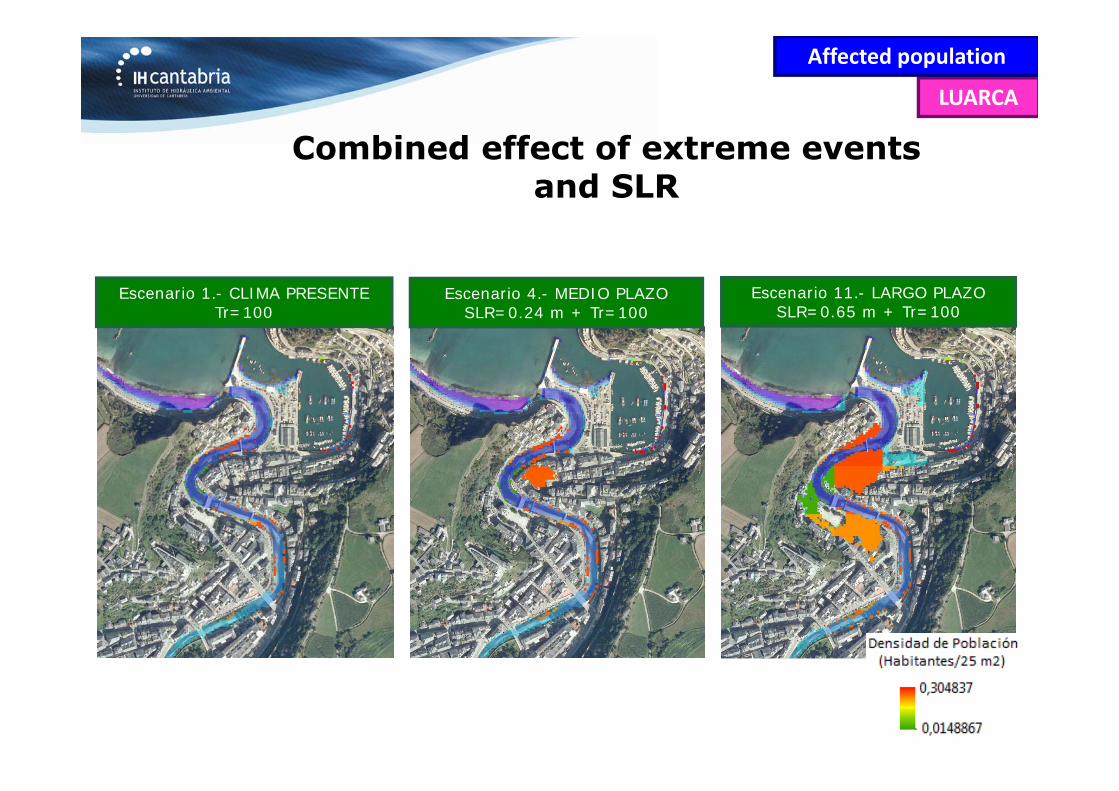
LUARCA
Escenario 1.- CLIMA PRESENTE Tr=100
Escenario 4.- MEDIO PLAZO SLR=0.24 m + Tr=100
Escenario 11.- LARGO PLAZO SLR=0.65 m + Tr=100
Combined effect of extreme eventsand SLR
Affected population
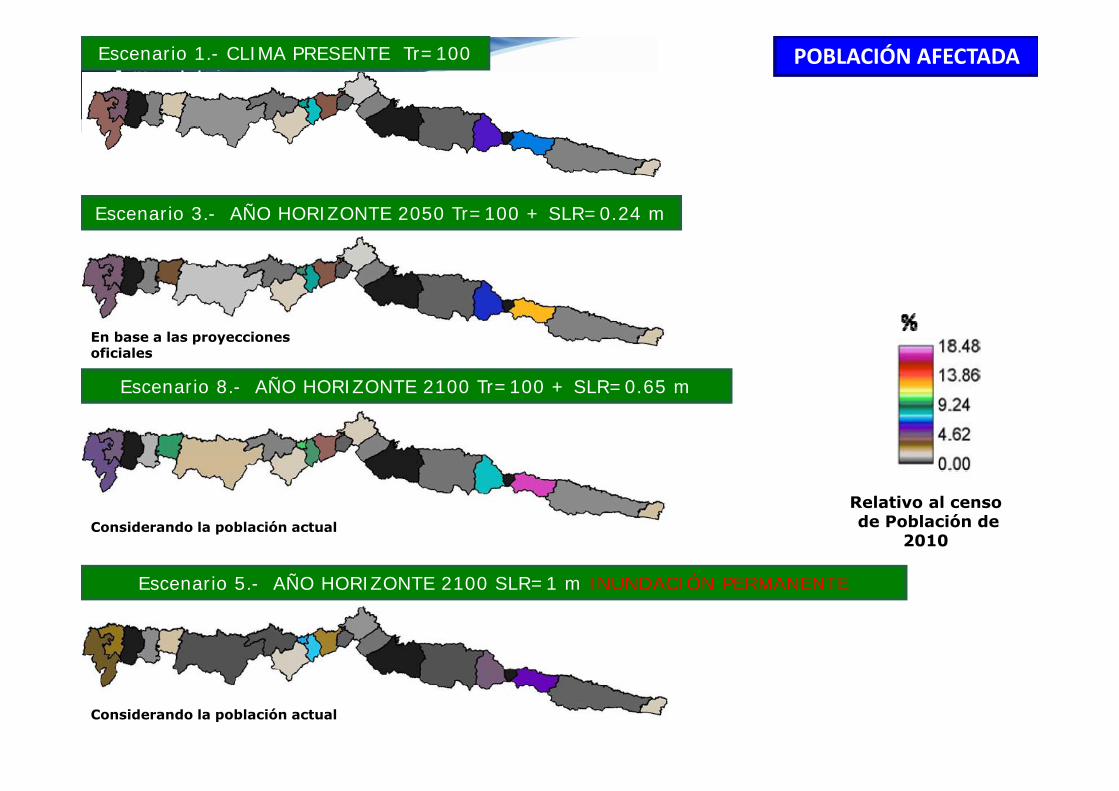
Escenario 1.- CLIMA PRESENTE Tr=100 POBLACIÓN AFECTADA
Escenario 3.- AÑO HORIZONTE 2050 Tr=100 + SLR=0.24 m
Escenario 8.- AÑO HORIZONTE 2100 Tr=100 + SLR=0.65 m
Escenario 5.- AÑO HORIZONTE 2100 SLR=1 m INUNDACIÓN PERMANENTE
Relativo al censode Población de
2010
En base a las proyecciones oficiales
Considerando la población actual
Considerando la población actual
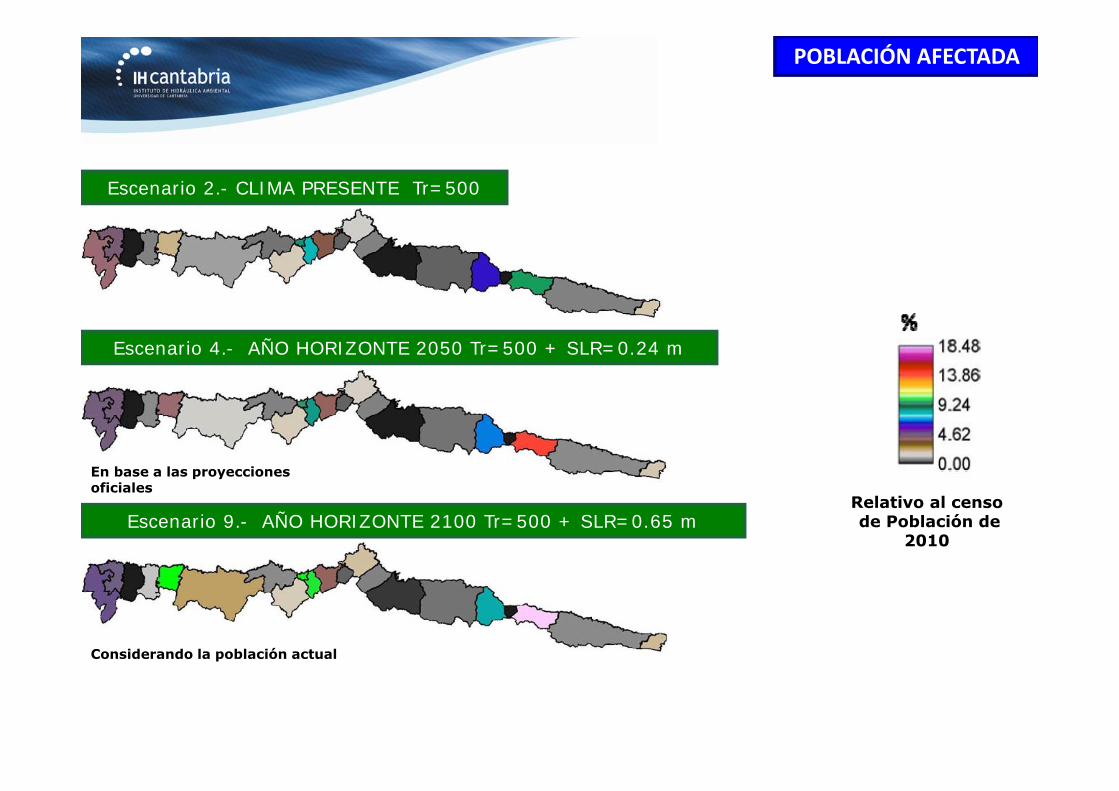
Escenario 2.- CLIMA PRESENTE Tr=500
POBLACIÓN AFECTADA
Escenario 4.- AÑO HORIZONTE 2050 Tr=500 + SLR=0.24 m
Escenario 9.- AÑO HORIZONTE 2100 Tr=500 + SLR=0.65 mRelativo al censode Población de
2010
En base a las proyecciones oficiales
Considerando la población actual
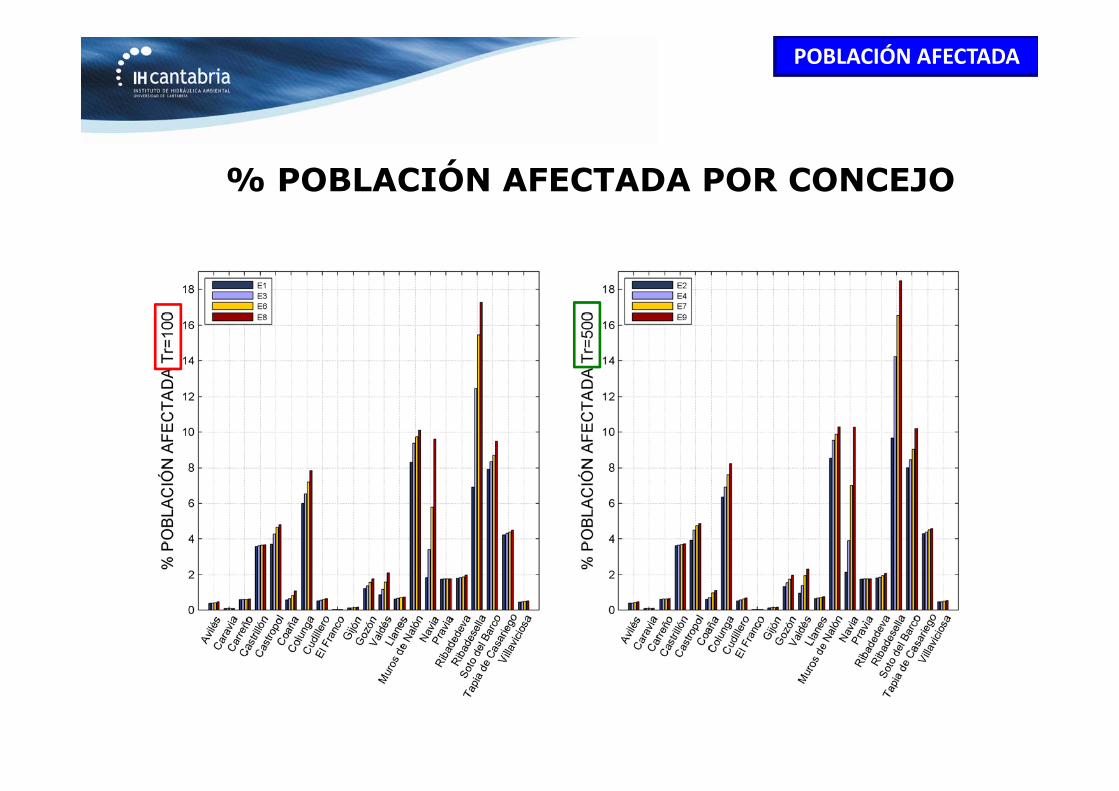
POBLACIÓN AFECTADA
% POBLACIÓN AFECTADA POR CONCEJO
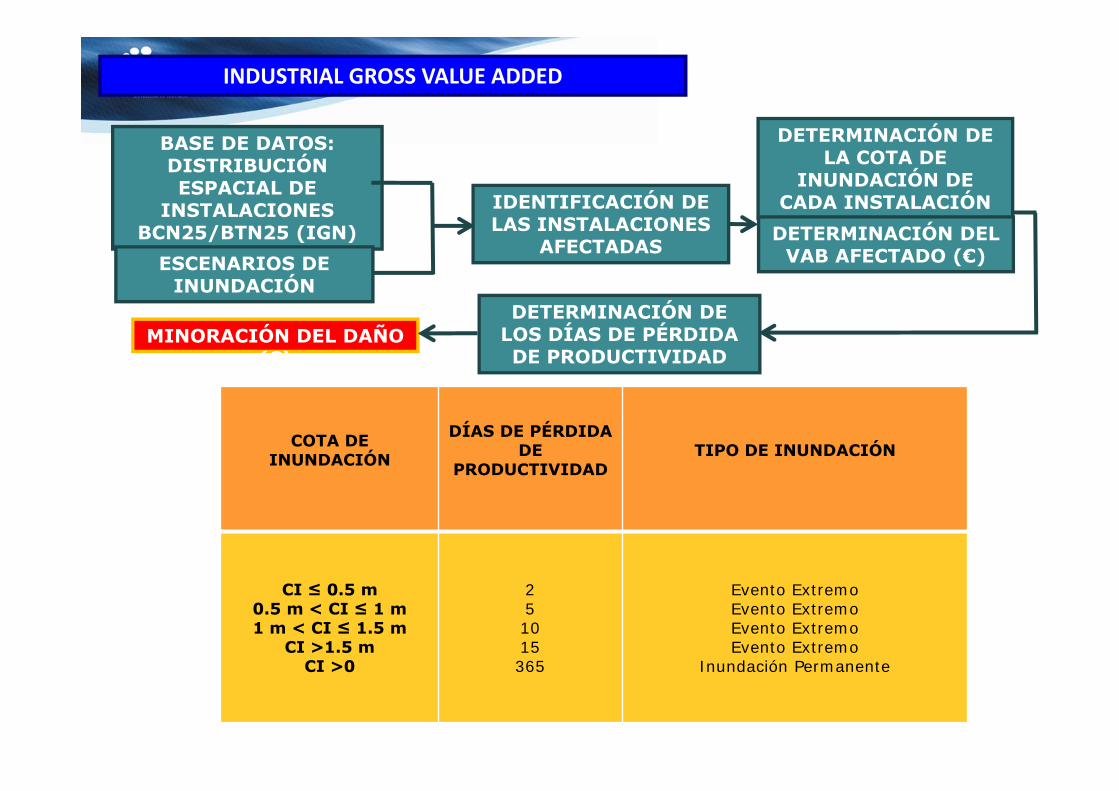
INDUSTRIAL GROSS VALUE ADDED
COTA DE INUNDACIÓN
DÍAS DE PÉRDIDA DE
PRODUCTIVIDAD TIPO DE INUNDACIÓN
CI ≤ 0.5 m0.5 m < CI ≤ 1 m1 m < CI ≤ 1.5 m
CI >1.5 mCI >0
251015365
Evento ExtremoEvento ExtremoEvento ExtremoEvento Extremo
Inundación Permanente
BASE DE DATOS: DISTRIBUCIÓN ESPACIAL DE
INSTALACIONESBCN25/BTN25 (IGN)
ESCENARIOS DE INUNDACIÓN
IDENTIFICACIÓN DE LAS INSTALACIONES
AFECTADAS
DETERMINACIÓN DE LA COTA DE
INUNDACIÓN DE CADA INSTALACIÓN
AFECTADA
DETERMINACIÓN DE LOS DÍAS DE PÉRDIDA DE PRODUCTIVIDAD
MINORACIÓN DEL DAÑO (€)
DETERMINACIÓN DEL VAB AFECTADO (€)
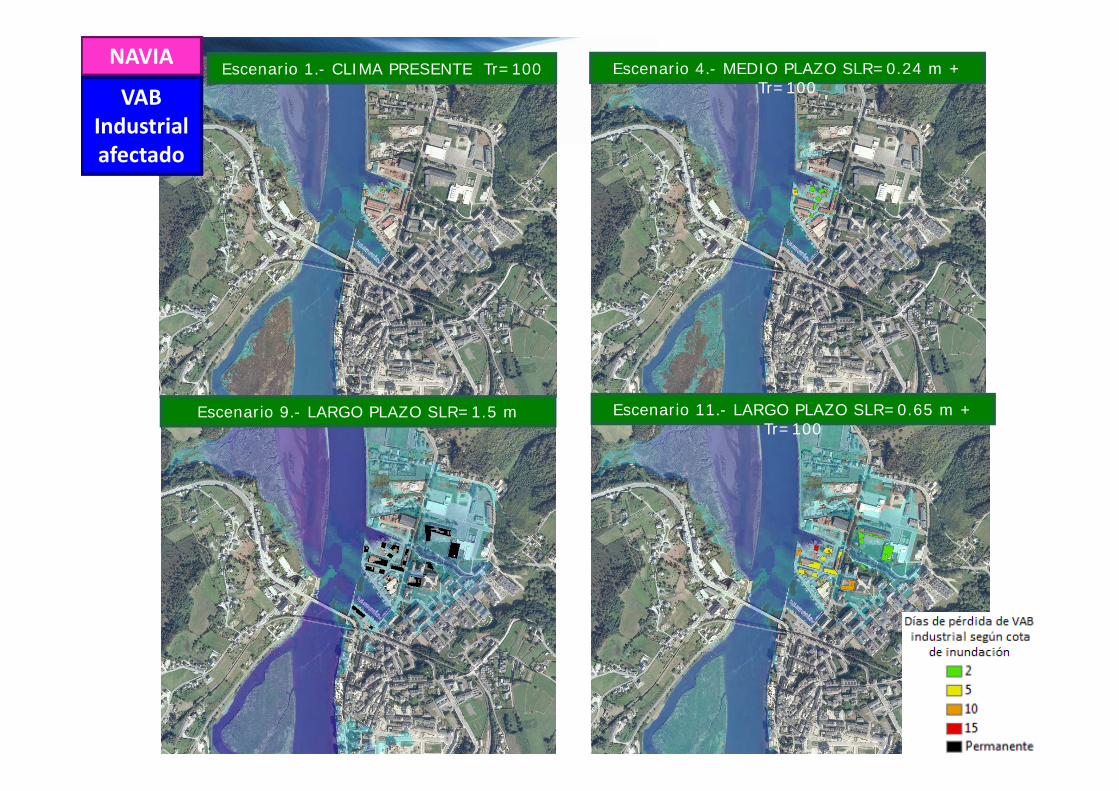
NAVIA Escenario 1.- CLIMA PRESENTE Tr=100 Escenario 4.- MEDIO PLAZO SLR=0.24 m + Tr=100
Escenario 9.- LARGO PLAZO SLR=1.5 m Escenario 11.- LARGO PLAZO SLR=0.65 m + Tr=100
VAB Industrialafectado
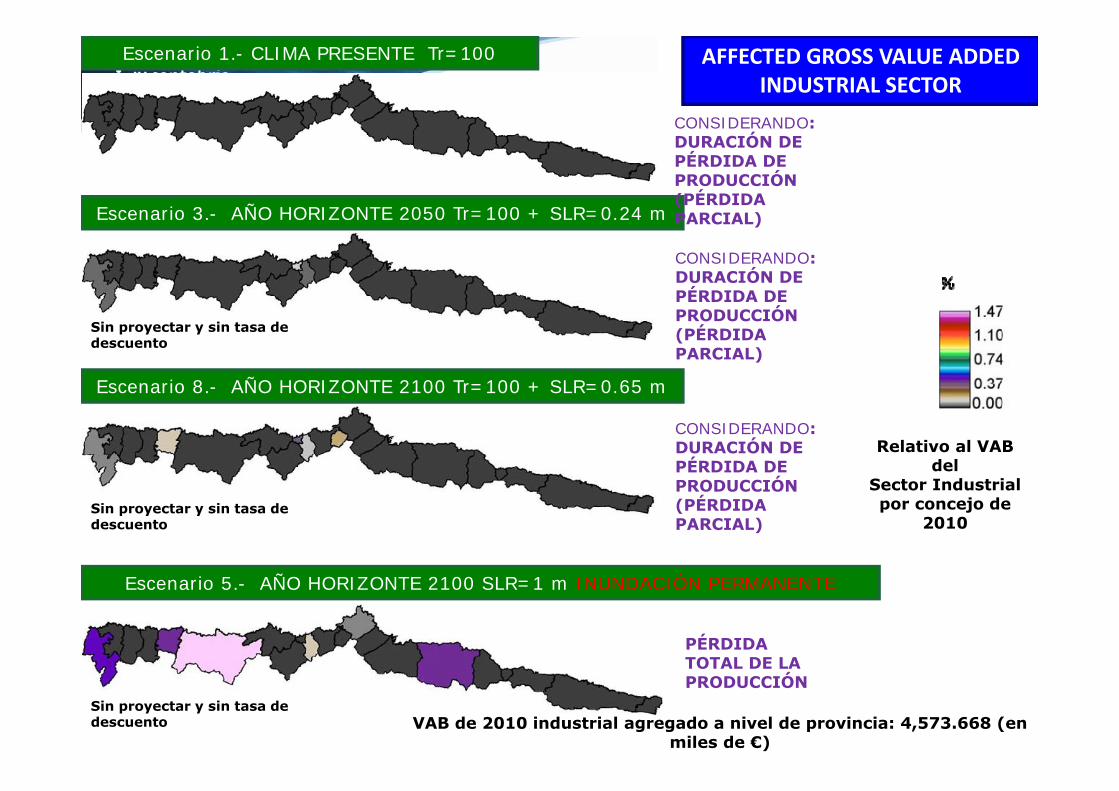
AFFECTED GROSS VALUE ADDED INDUSTRIAL SECTOR
Escenario 1.- CLIMA PRESENTE Tr=100
Escenario 3.- AÑO HORIZONTE 2050 Tr=100 + SLR=0.24 m
Escenario 8.- AÑO HORIZONTE 2100 Tr=100 + SLR=0.65 m
Escenario 5.- AÑO HORIZONTE 2100 SLR=1 m INUNDACIÓN PERMANENTE
PÉRDIDA TOTAL DE LA PRODUCCIÓN
CONSIDERANDO:DURACIÓN DE PÉRDIDA DE PRODUCCIÓN(PÉRDIDA PARCIAL)
CONSIDERANDO:DURACIÓN DE PÉRDIDA DE PRODUCCIÓN(PÉRDIDA PARCIAL)
CONSIDERANDO:DURACIÓN DE PÉRDIDA DE PRODUCCIÓN(PÉRDIDA PARCIAL)
Relativo al VAB del
Sector Industrial por concejo de
2010
VAB de 2010 industrial agregado a nivel de provincia: 4,573.668 (en miles de €)
Sin proyectar y sin tasa de descuento
Sin proyectar y sin tasa de descuento
Sin proyectar y sin tasa de descuento
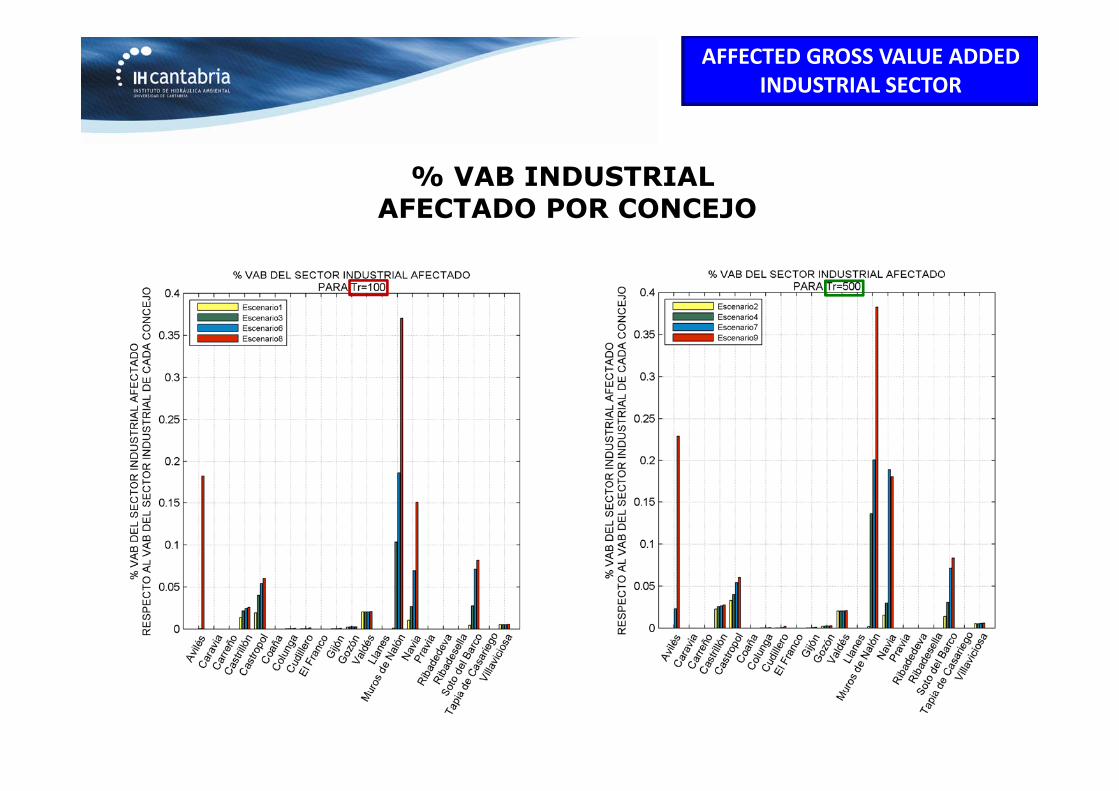
% VAB INDUSTRIALAFECTADO POR CONCEJO
AFFECTED GROSS VALUE ADDED INDUSTRIAL SECTOR
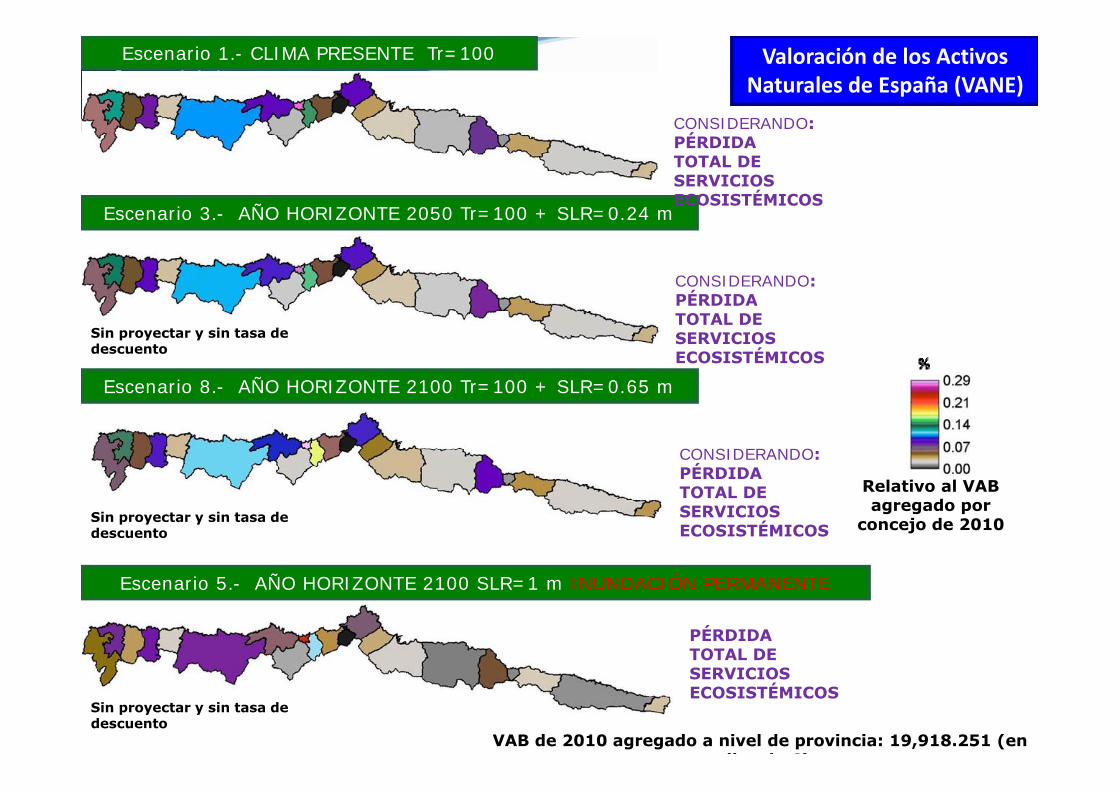
Valoración de los Activos Naturales de España (VANE)
Escenario 1.- CLIMA PRESENTE Tr=100
Escenario 3.- AÑO HORIZONTE 2050 Tr=100 + SLR=0.24 m
Escenario 8.- AÑO HORIZONTE 2100 Tr=100 + SLR=0.65 m
Escenario 5.- AÑO HORIZONTE 2100 SLR=1 m INUNDACIÓN PERMANENTE
PÉRDIDA TOTAL DE SERVICIOS ECOSISTÉMICOS
CONSIDERANDO:PÉRDIDA TOTAL DE SERVICIOS ECOSISTÉMICOS
CONSIDERANDO:PÉRDIDA TOTAL DE SERVICIOS ECOSISTÉMICOS
CONSIDERANDO:PÉRDIDA TOTAL DE SERVICIOS ECOSISTÉMICOS
Relativo al VAB agregado por
concejo de 2010
VAB de 2010 agregado a nivel de provincia: 19,918.251 (en il d €)
Sin proyectar y sin tasa de descuento
Sin proyectar y sin tasa de descuento
Sin proyectar y sin tasa de descuento

% VAB AFECTADO POR CONCEJOPOR PÉRDIDA DE SERVICIOS ECOSISTÉMICOS
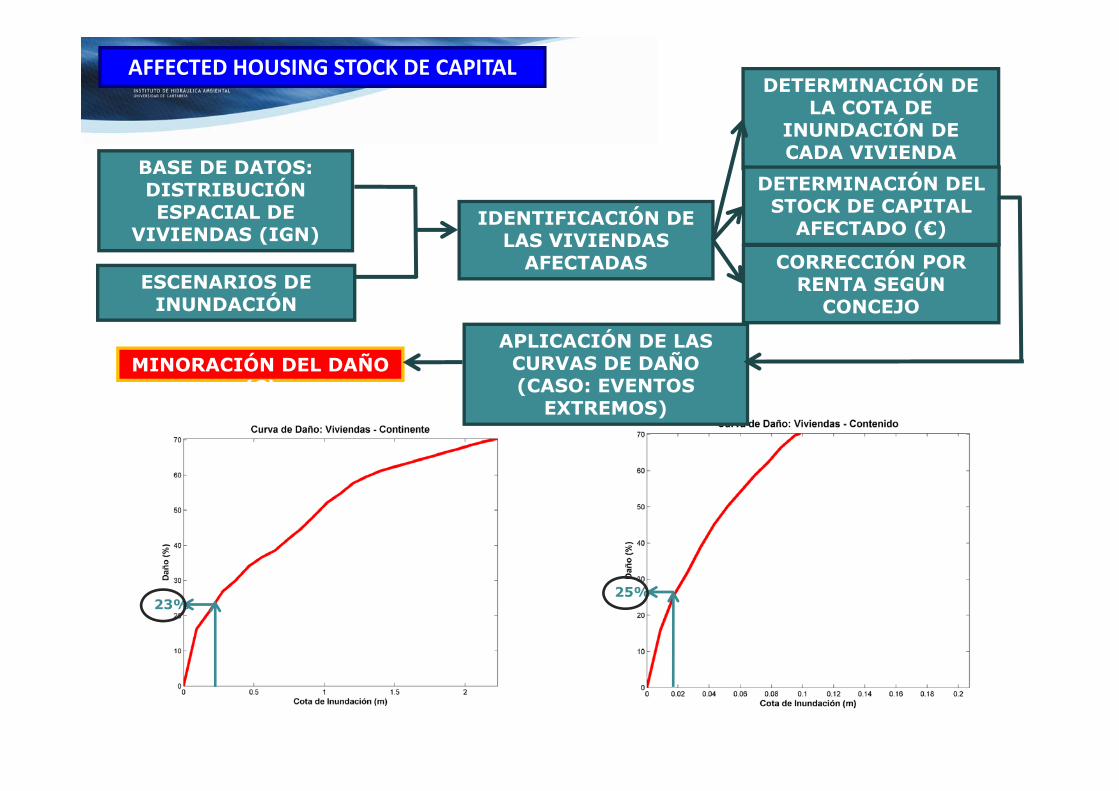
AFFECTED HOUSING STOCK DE CAPITAL
BASE DE DATOS: DISTRIBUCIÓN ESPACIAL DE
VIVIENDAS (IGN)
ESCENARIOS DE INUNDACIÓN
IDENTIFICACIÓN DE LAS VIVIENDAS
AFECTADAS
DETERMINACIÓN DE LA COTA DE
INUNDACIÓN DE CADA VIVIENDA
AFECTADA
APLICACIÓN DE LAS CURVAS DE DAÑO (CASO: EVENTOS
EXTREMOS)
23%25%
MINORACIÓN DEL DAÑO (€)
DETERMINACIÓN DEL STOCK DE CAPITAL
AFECTADO (€)
CORRECCIÓN POR RENTA SEGÚN
CONCEJO

NAVIA
StockViviendas afectado
Escenario 1.- CLIMA PRESENTE Tr=100 Escenario 4.- MEDIO PLAZO SLR=0.24 m + Tr=100
Escenario 9.- LARGO PLAZO SLR=1.5 m Escenario 11.- LARGO PLAZO SLR=0.65 m + Tr=100

LUARCA
StockViviendas afectado
Escenario 1.- CLIMA PRESENTE Tr=100
Escenario 4.- MEDIO PLAZO SLR=0.24 m + Tr=100
Escenario 11.- LARGO PLAZO SLR=0.65 m + Tr=100
Influencia de la combinación de Eventos Extremos y Subida del
Nivel del Mar a Medio y Largo Plazo
Relativo al Stock deCapital de vivienda de
2011
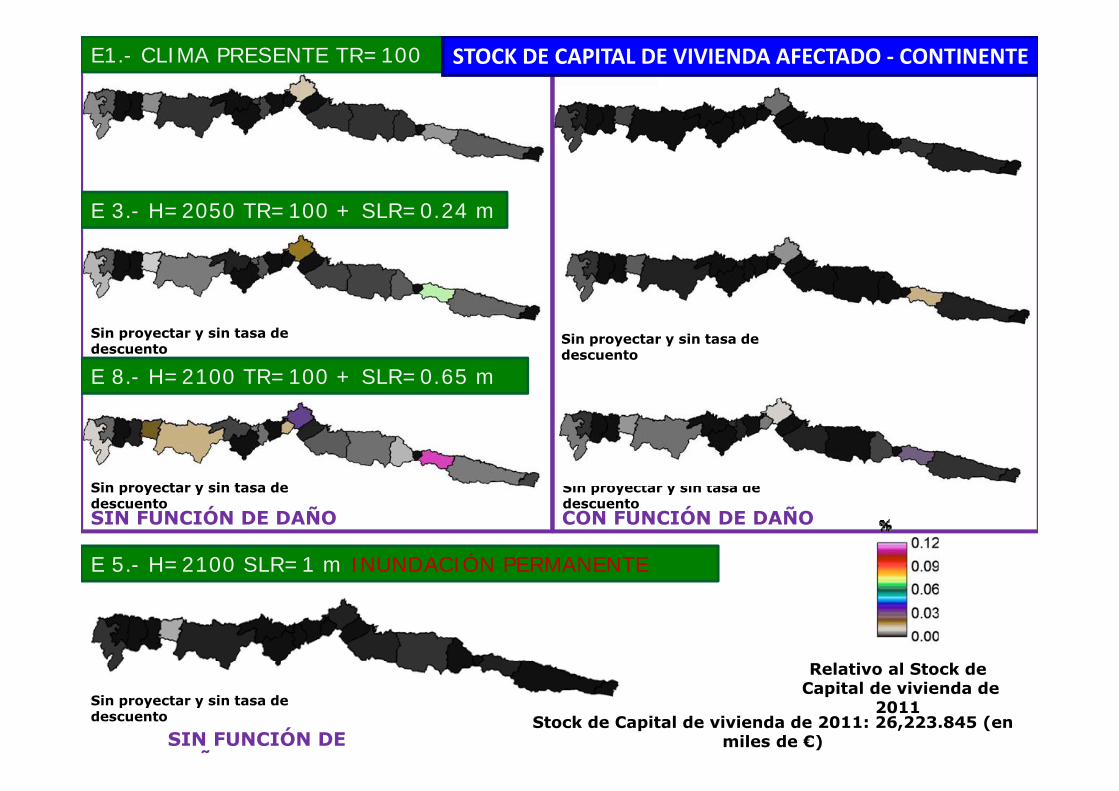
SIN FUNCIÓN DE DAÑO CON FUNCIÓN DE DAÑO
SIN FUNCIÓN DE DAÑO
E1.- CLIMA PRESENTE TR=100
E 3.- H=2050 TR=100 + SLR=0.24 m
E 8.- H=2100 TR=100 + SLR=0.65 m
E 5.- H=2100 SLR=1 m INUNDACIÓN PERMANENTE
STOCK DE CAPITAL DE VIVIENDA AFECTADO ‐ CONTINENTE
Sin proyectar y sin tasa de descuento
Sin proyectar y sin tasa de descuento
Sin proyectar y sin tasa de descuento
Sin proyectar y sin tasa de descuento
Sin proyectar y sin tasa de descuento
Stock de Capital de vivienda de 2011: 26,223.845 (en miles de €)
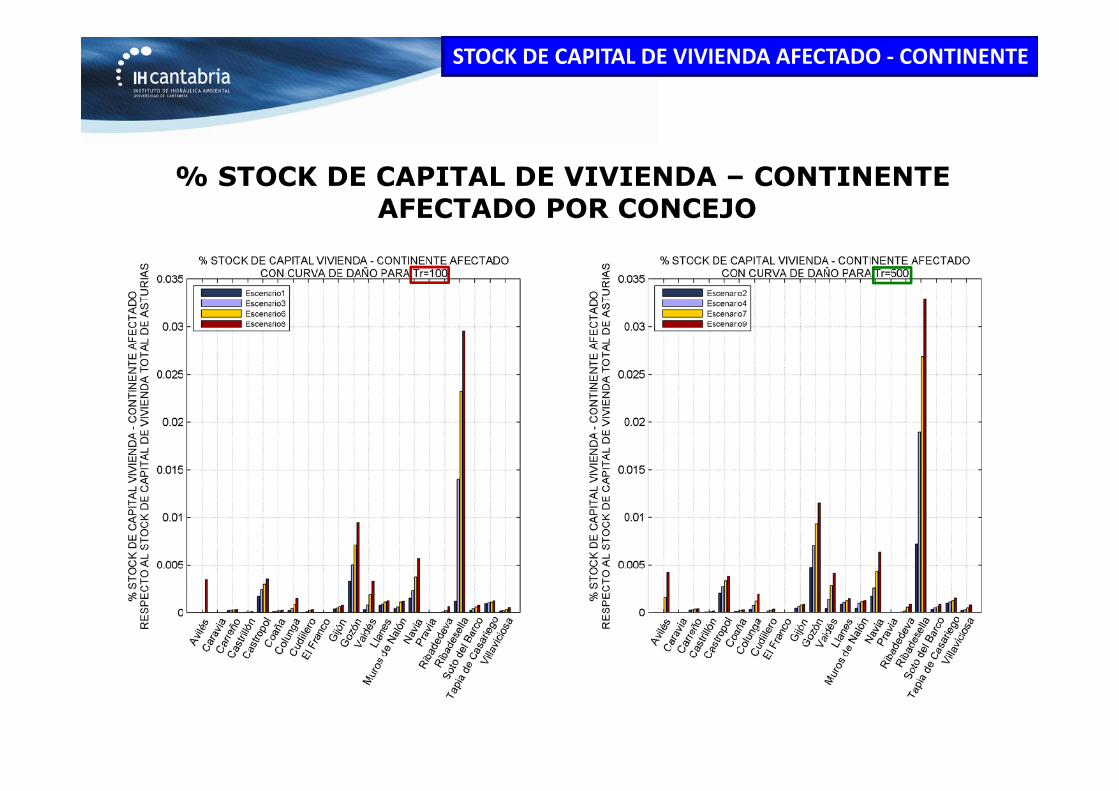
STOCK DE CAPITAL DE VIVIENDA AFECTADO ‐ CONTINENTE
% STOCK DE CAPITAL DE VIVIENDA – CONTINENTEAFECTADO POR CONCEJO
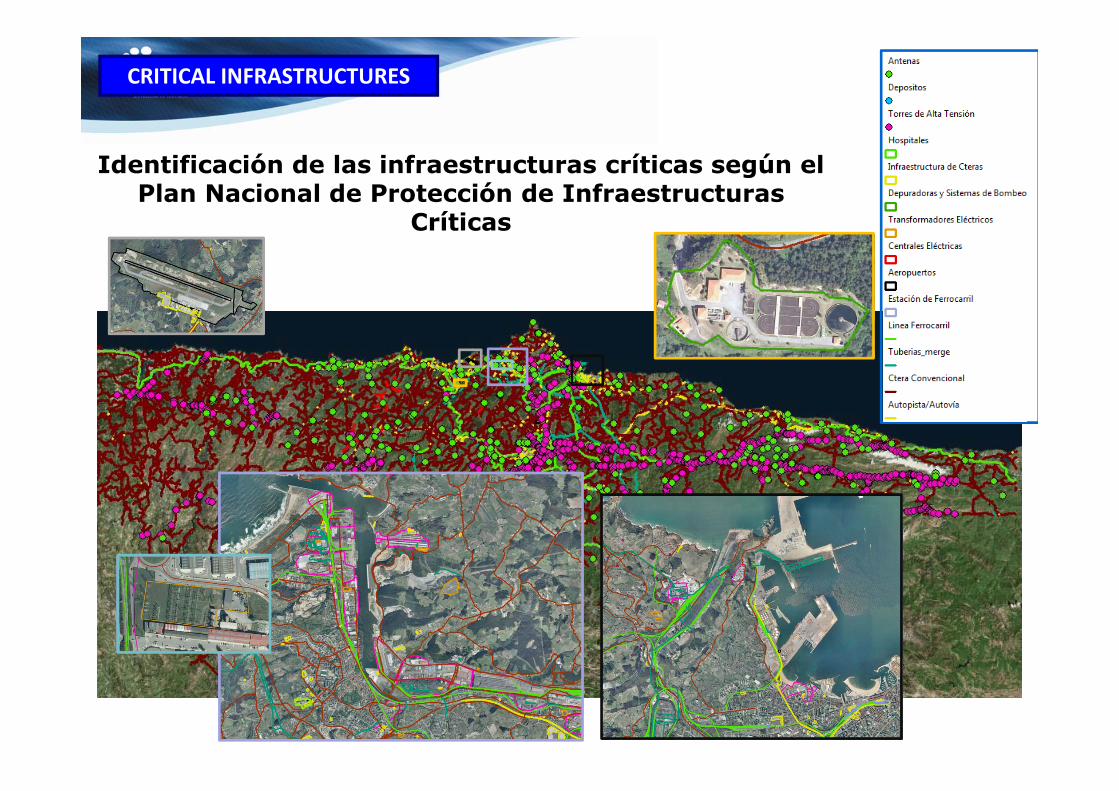
CRITICAL INFRASTRUCTURES
Identificación de las infraestructuras críticas según el Plan Nacional de Protección de Infraestructuras
Críticas
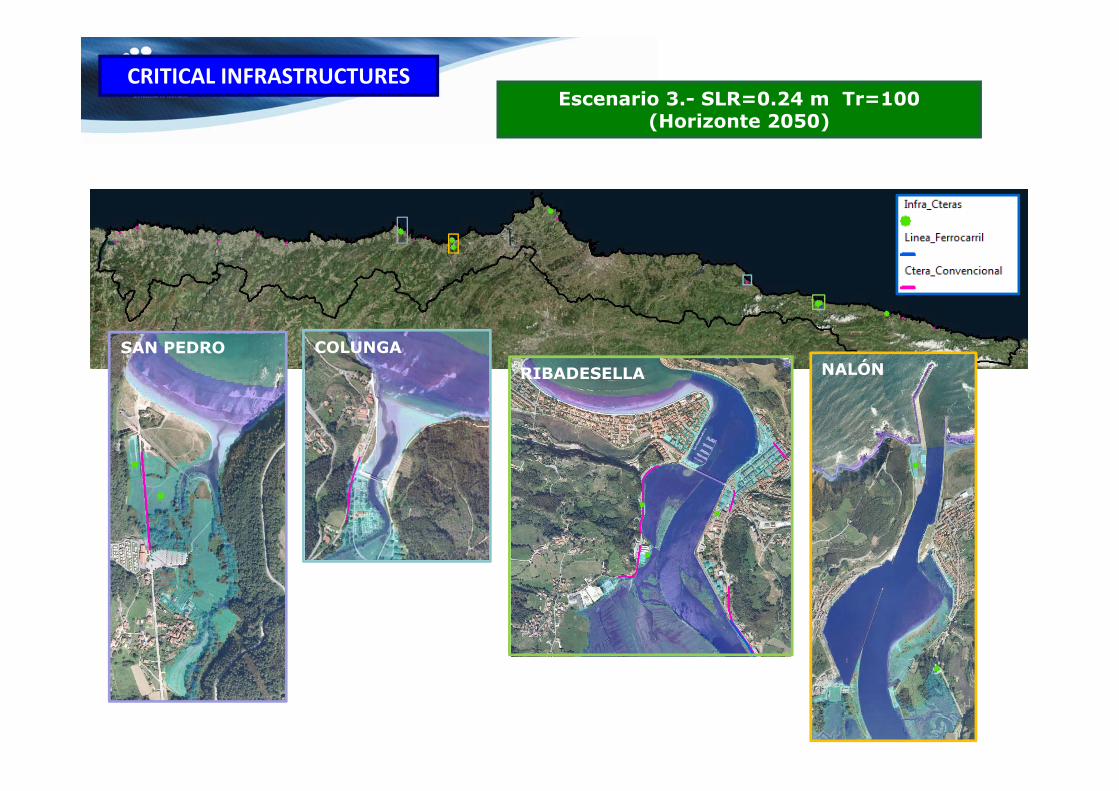
Escenario 3.- SLR=0.24 m Tr=100 (Horizonte 2050)
RIBADESELLACOLUNGA
NALÓNSAN PEDRO
CRITICAL INFRASTRUCTURES
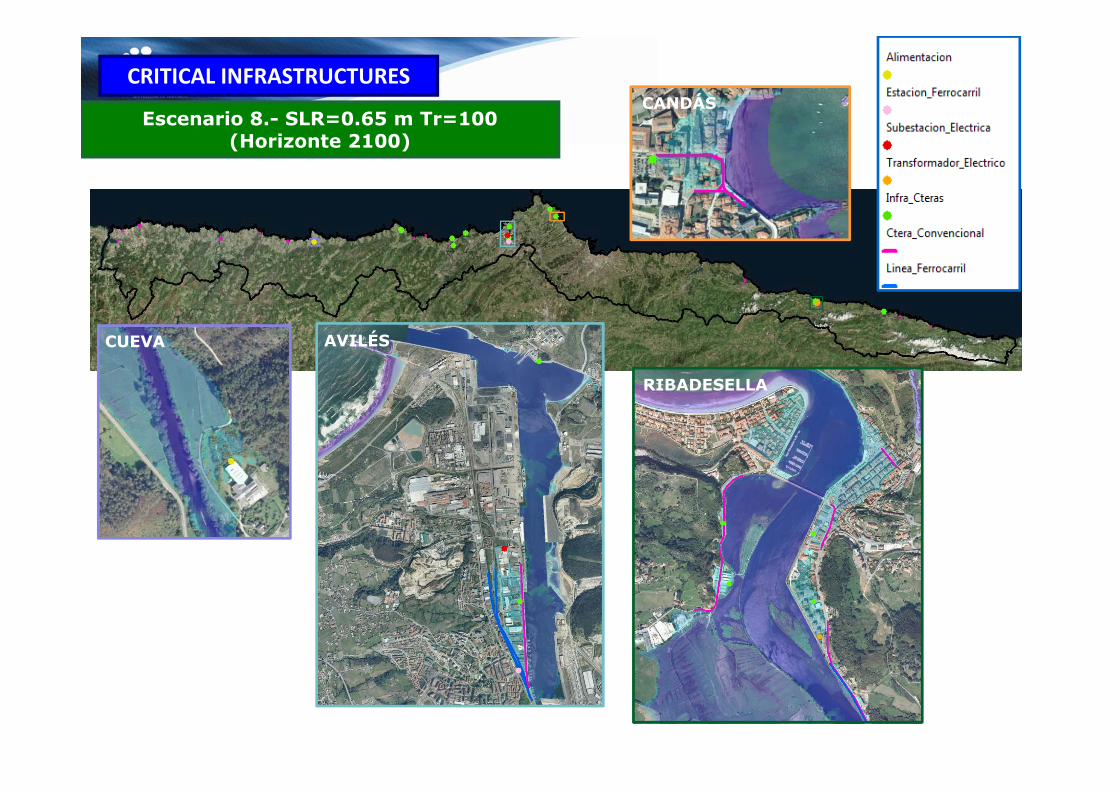
Escenario 8.- SLR=0.65 m Tr=100 (Horizonte 2100)
CANDÁS
RIBADESELLA
AVILÉSCUEVA
CRITICAL INFRASTRUCTURES
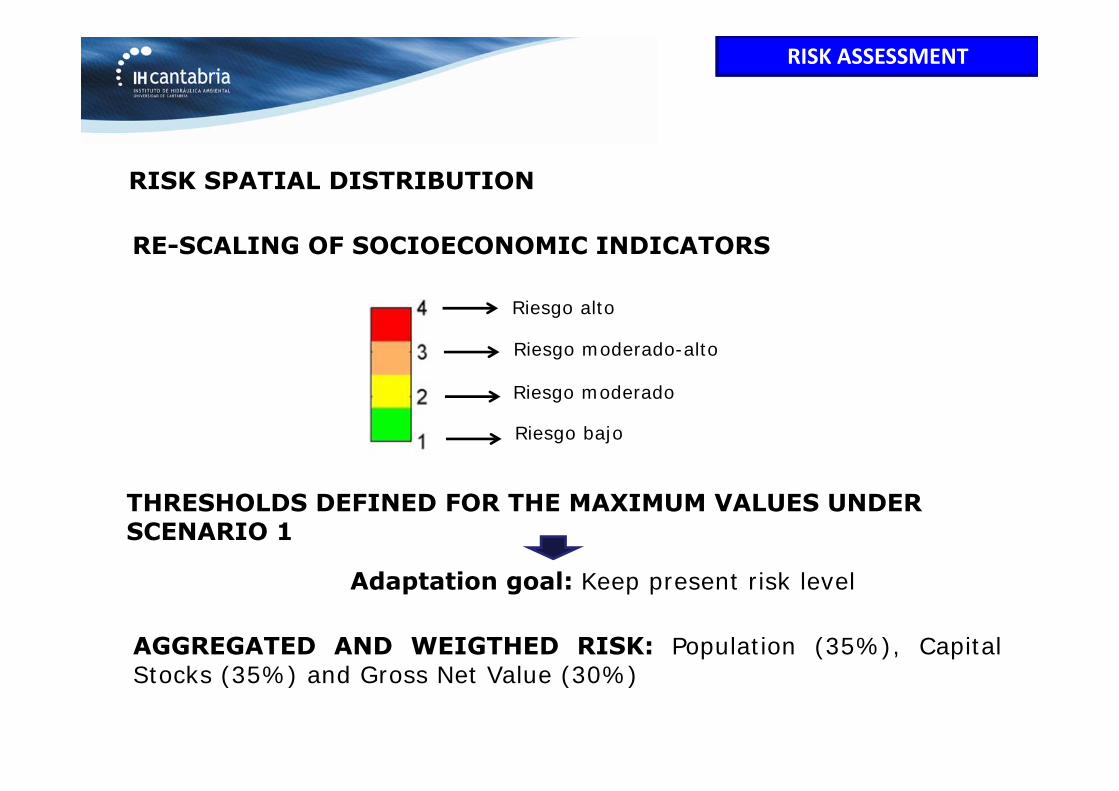
RISK ASSESSMENT
Adaptation goal: Keep present risk level
RISK SPATIAL DISTRIBUTION
Riesgo bajo
Riesgo moderado
Riesgo moderado-alto
Riesgo alto
THRESHOLDS DEFINED FOR THE MAXIMUM VALUES UNDER SCENARIO 1
AGGREGATED AND WEIGTHED RISK: Population (35%), CapitalStocks (35%) and Gross Net Value (30%)
RE-SCALING OF SOCIOECONOMIC INDICATORS
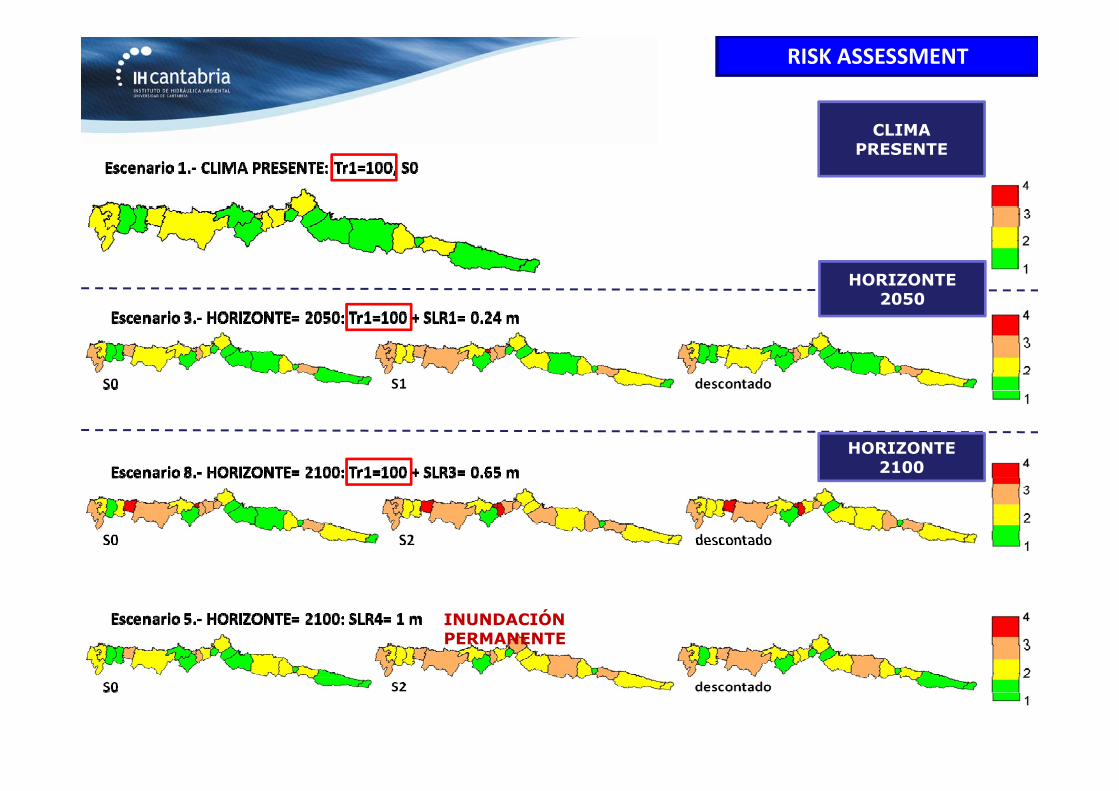
INUNDACIÓN PERMANENTE
HORIZONTE 2050
HORIZONTE 2100
CLIMA PRESENTE
RISK ASSESSMENT
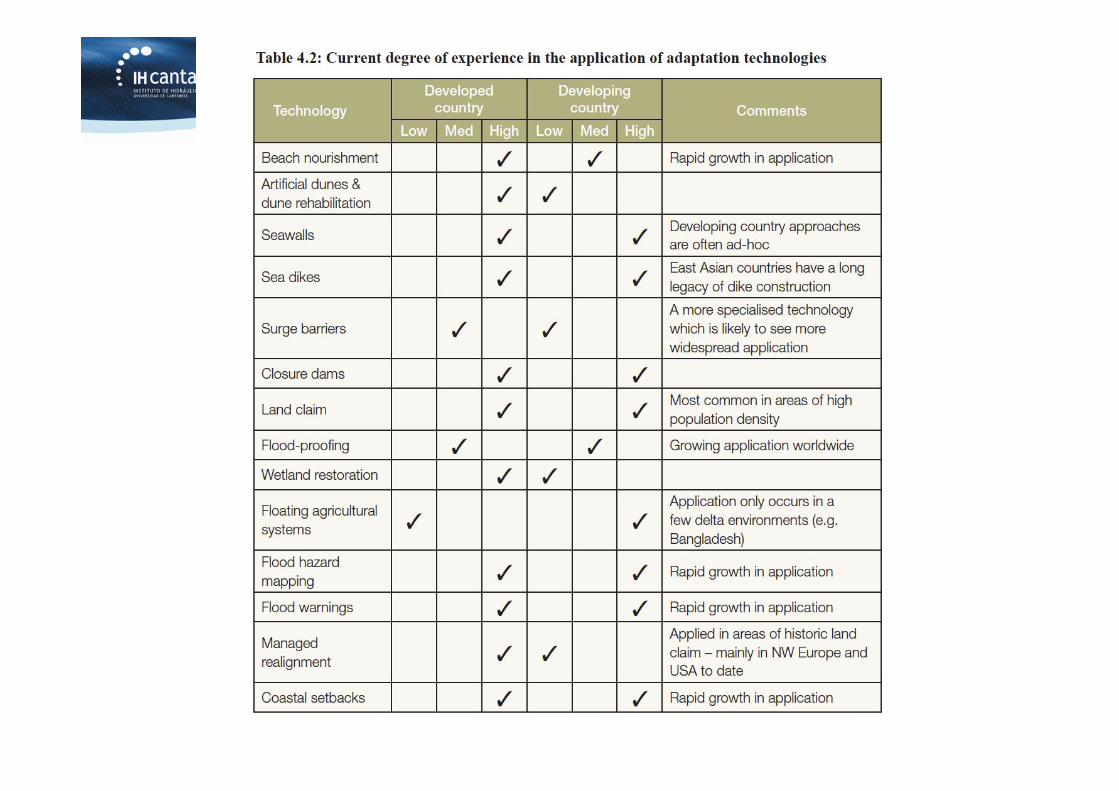
ALREADY OCCURINGADAPTATION IS
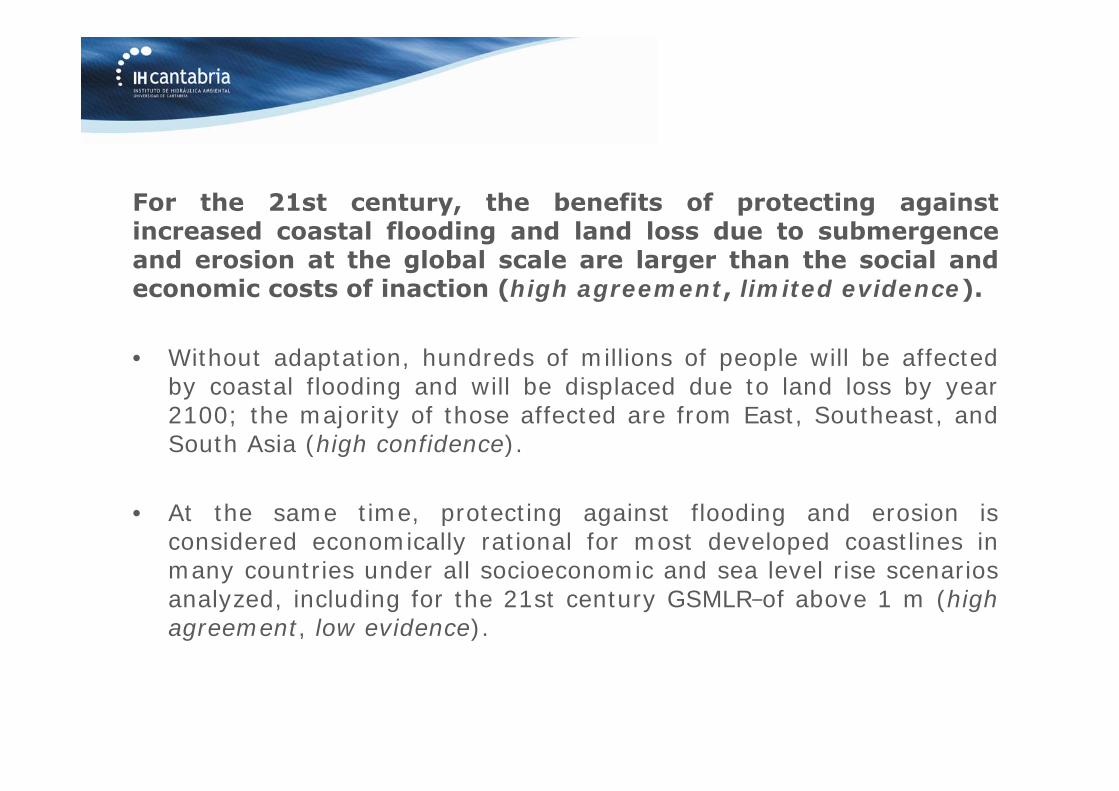
For the 21st century, the benefits of protecting againstincreased coastal flooding and land loss due to submergenceand erosion at the global scale are larger than the social andeconomic costs of inaction (high agreement, limited evidence).
• Without adaptation, hundreds of millions of people will be affectedby coastal flooding and will be displaced due to land loss by year2100; the majority of those affected are from East, Southeast, andSouth Asia (high confidence).
• At the same time, protecting against flooding and erosion isconsidered economically rational for most developed coastlines inmany countries under all socioeconomic and sea level rise scenariosanalyzed, including for the 21st century GSMLR of above 1 m (highagreement, low evidence).
The relative costs of adaptation vary strongly between andwithin regions and countries for the 21st century (highconfidence).
• Some low-lying developing countries (e.g., Bangladesh, Vietnam)and small island states are expected to face very high impacts andassociated annual damage and adaptation costs of severalpercentage points of gross domestic product (GDP).
• Developing countries and small island states within the tropicsdependent on coastal tourism will be impacted directly not only byfuture sea level rise and associated extremes but also by coralbleaching and ocean acidification and associated reductions intourist arrivals (high confidence).
The analysis and implementation of coastal adaptation hasprogressed more significantly in developed countries than indeveloping countries towards climate resilient and sustainablecoasts (high confidence).
• Given ample adaptation options, more proactive responses can bemade and based on technological, policy related, financial, andinstitutional support. Observed successful adaptations include majorprojects (e.g., Thames Estuary, Venice Lagoon, Delta Works) andspecific practices in both developed countries (e.g., Netherlands,Australia) and developing countries (e.g., Bangladesh).
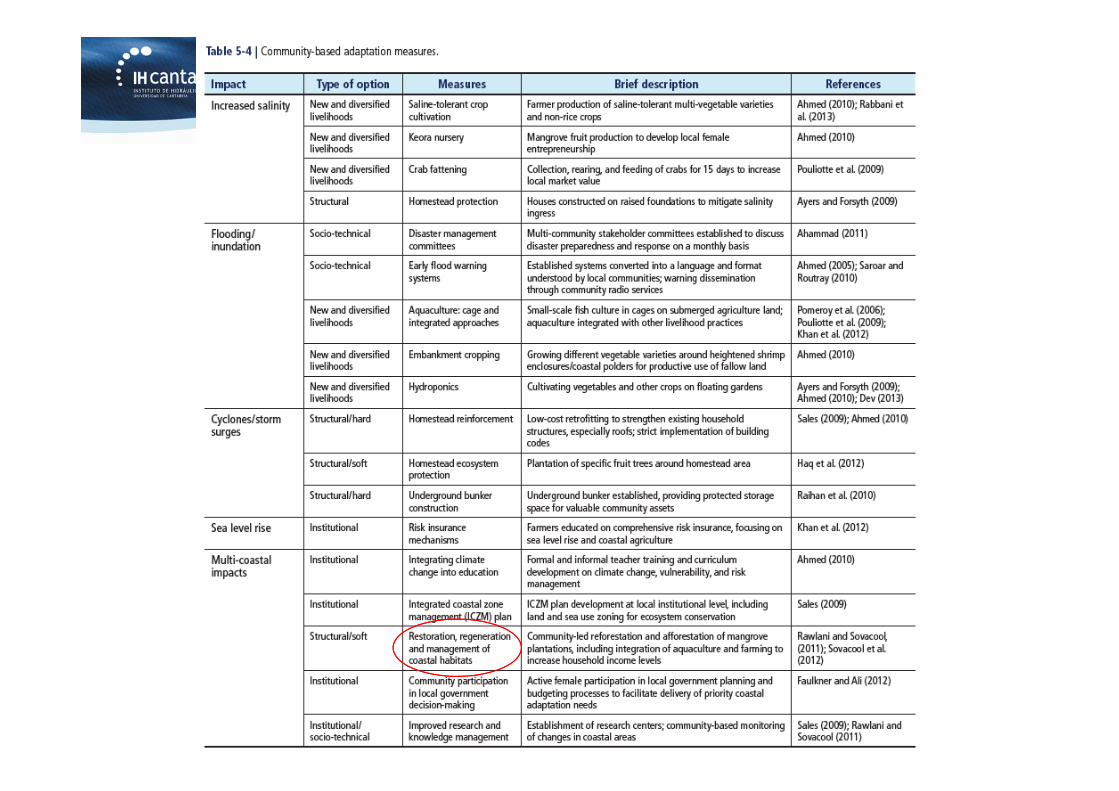
• More countries and communities carry out coastal adaptationmeasures including those based on integrated coastal zonemanagement, local communities, ecosystems, and disaster reduction,and these measures are mainstreamed into relevant strategies andmanagement plans (high confidence).
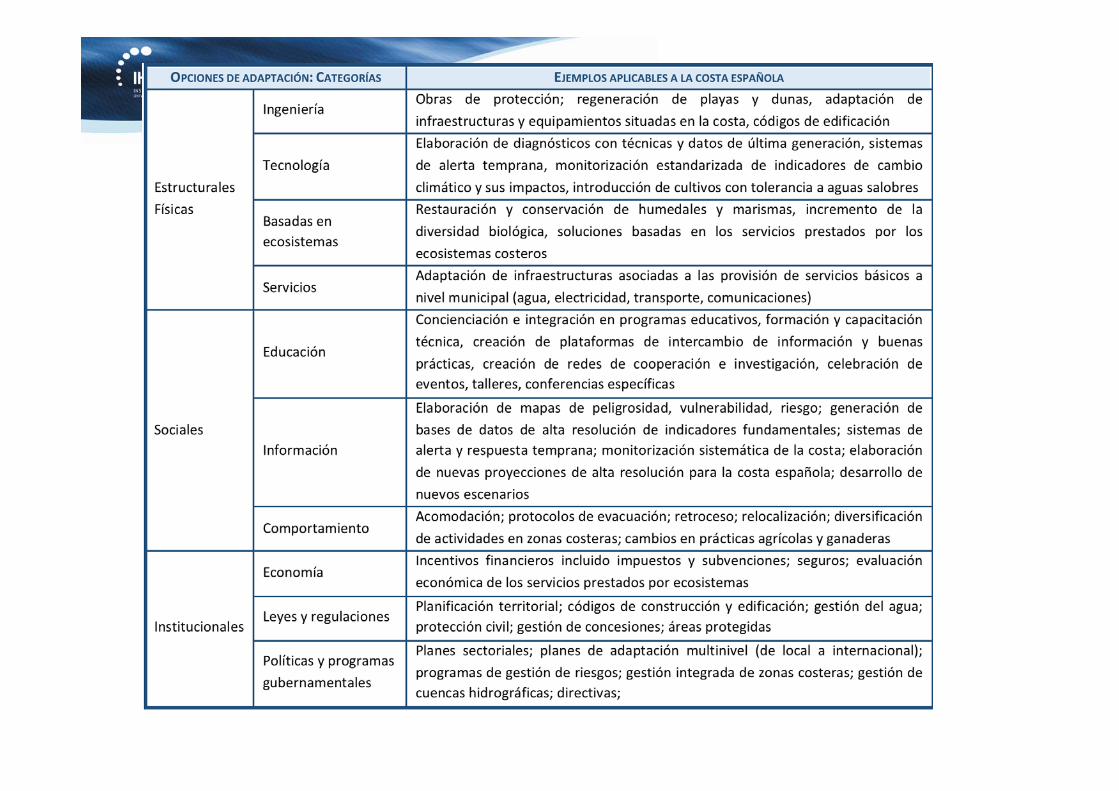
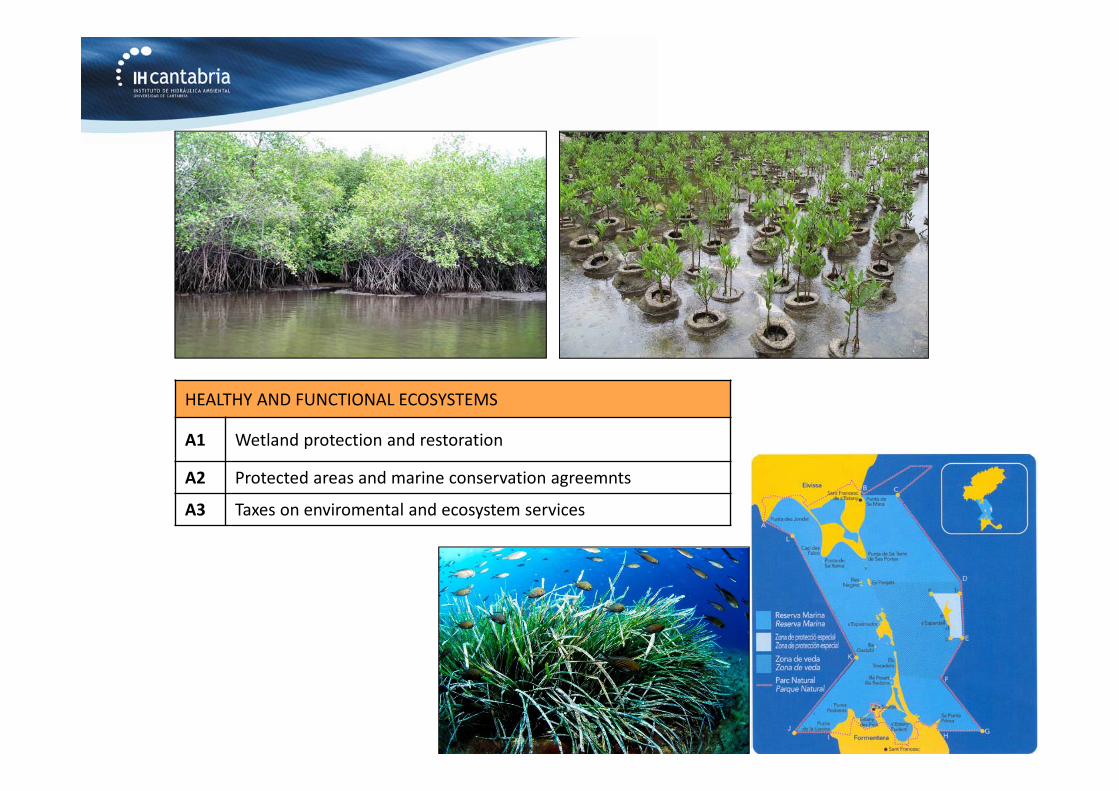
HEALTHY AND FUNCTIONAL ECOSYSTEMS
A1 Wetland protection and restoration
A2 Protected areas and marine conservation agreemnts
A3 Taxes on enviromental and ecosystem services
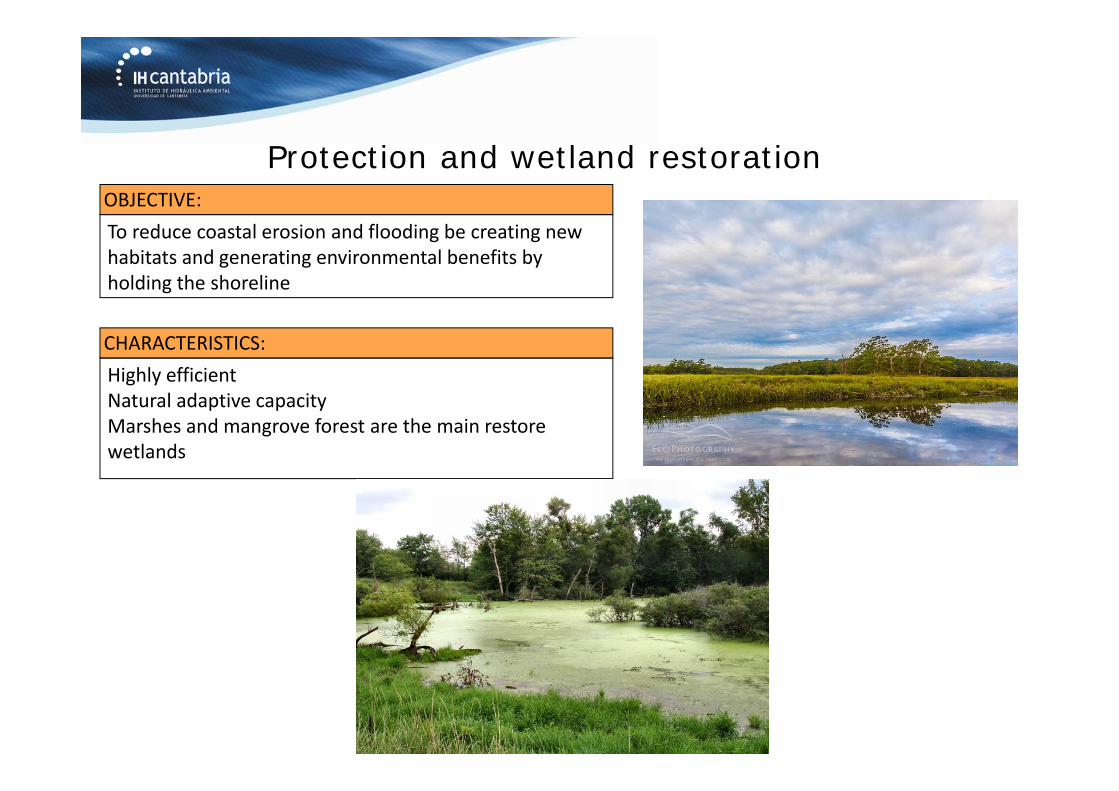
Highly efficientNatural adaptive capacityMarshes and mangrove forest are the main restore wetlands
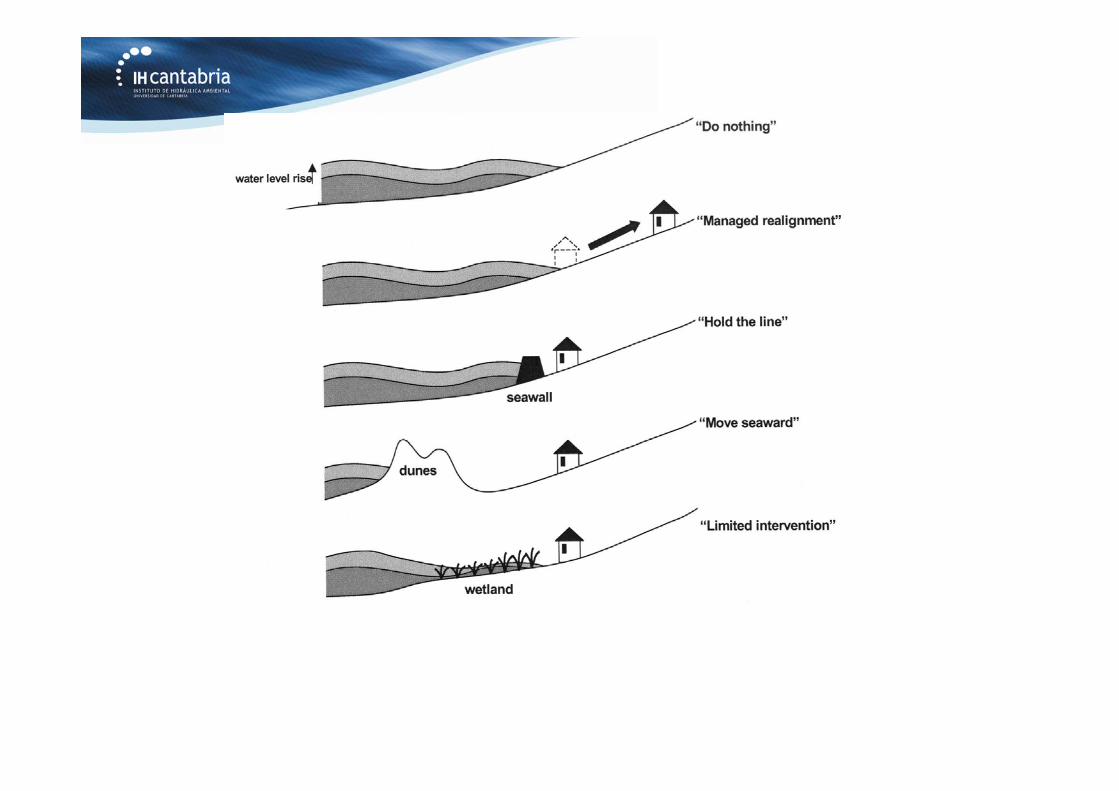
Protection and wetland restoration
To reduce coastal erosion and flooding be creating new habitats and generating environmental benefits by holding the shoreline
OBJECTIVE:
CHARACTERISTICS:
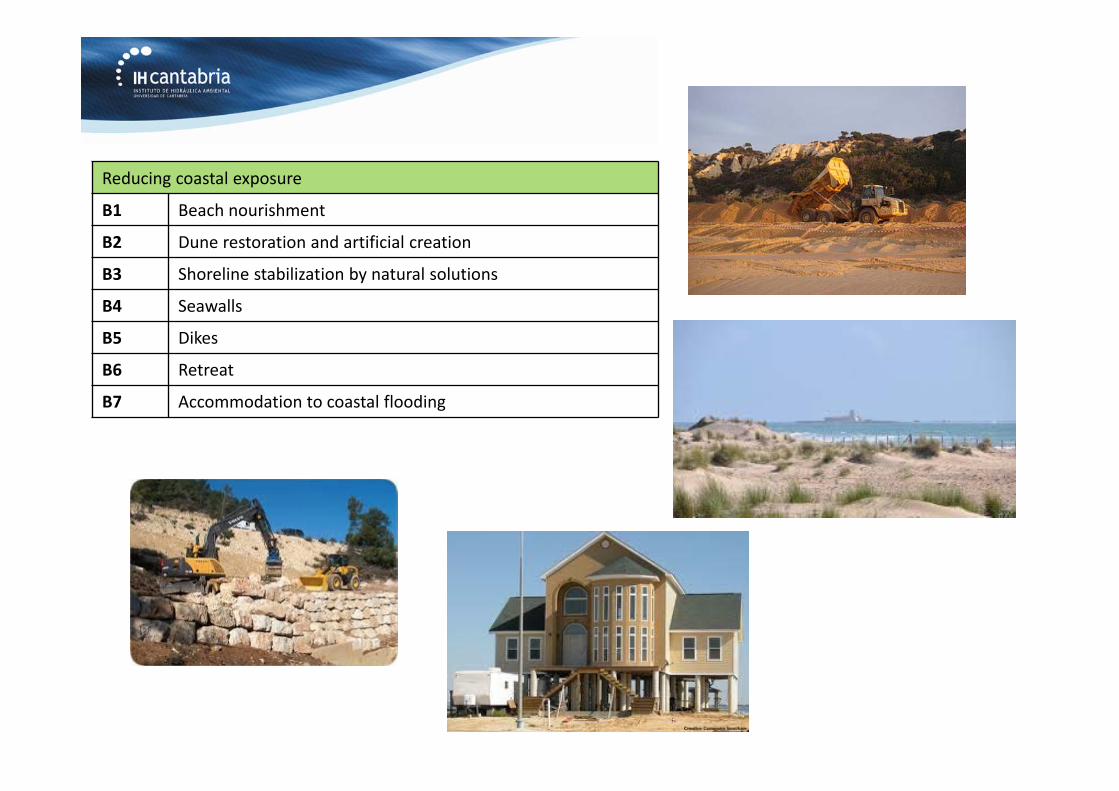
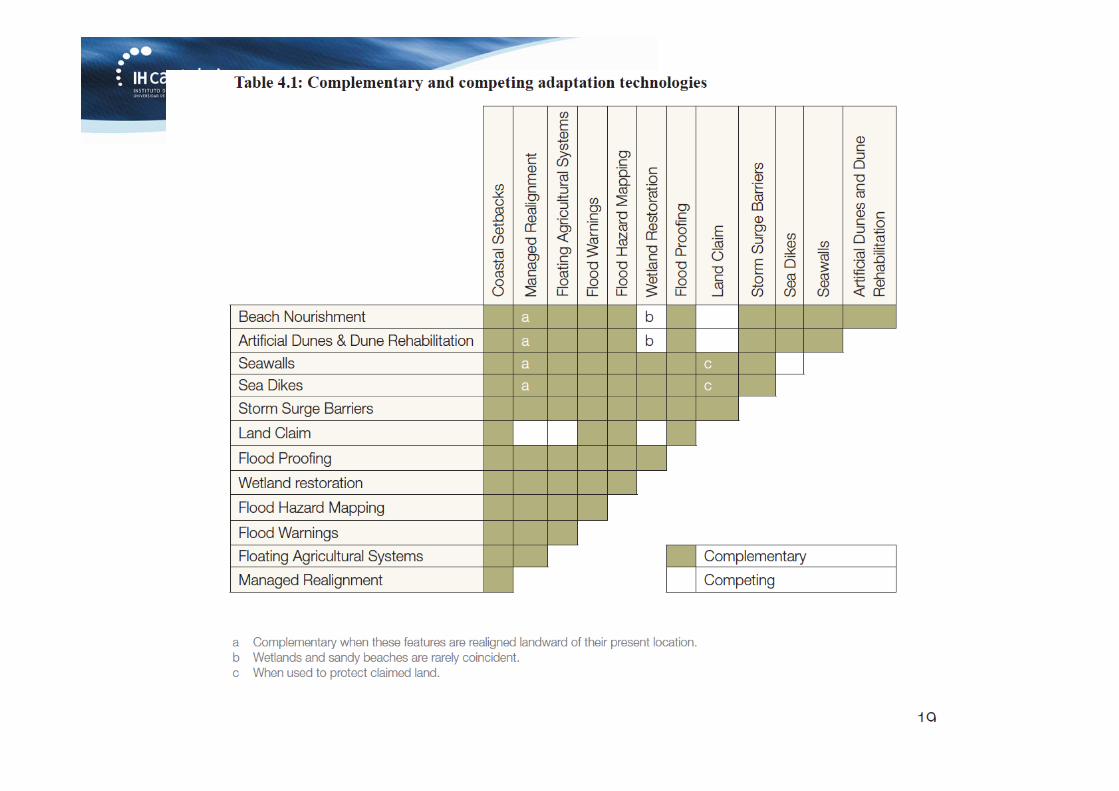
Reducing coastal exposure
B1 Beach nourishment
B2 Dune restoration and artificial creation
B3 Shoreline stabilization by natural solutions
B4 Seawalls
B5 Dikes
B6 Retreat
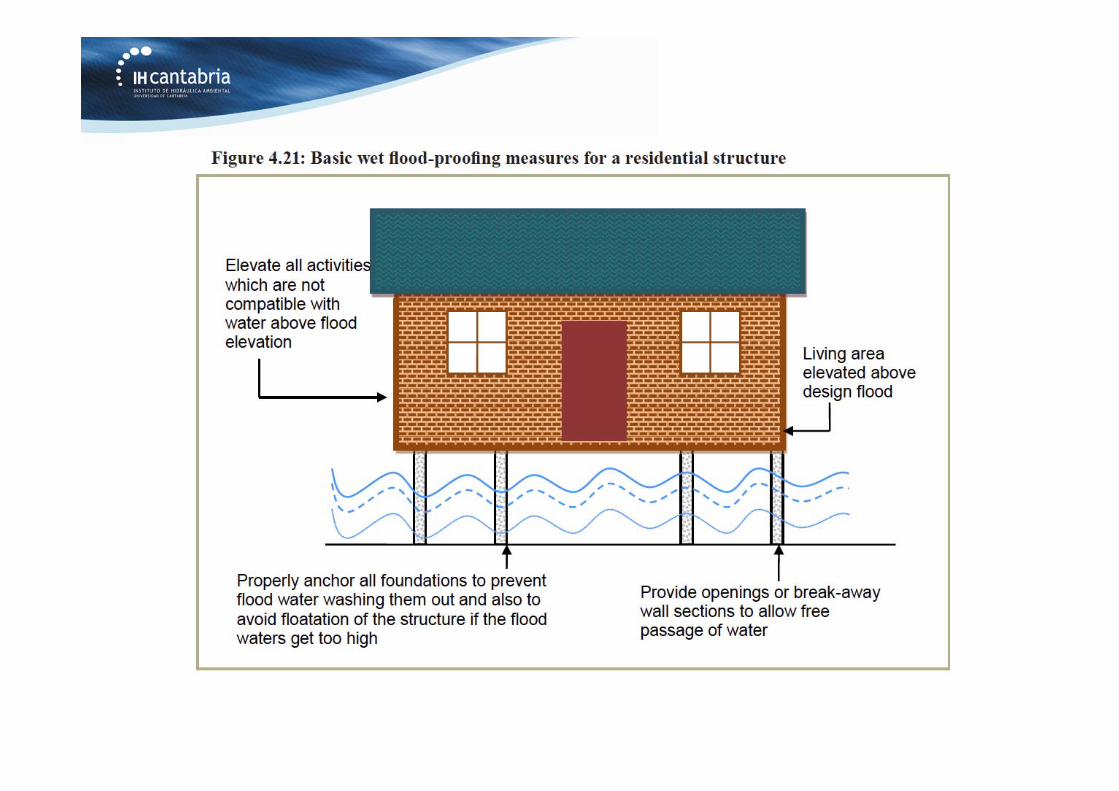
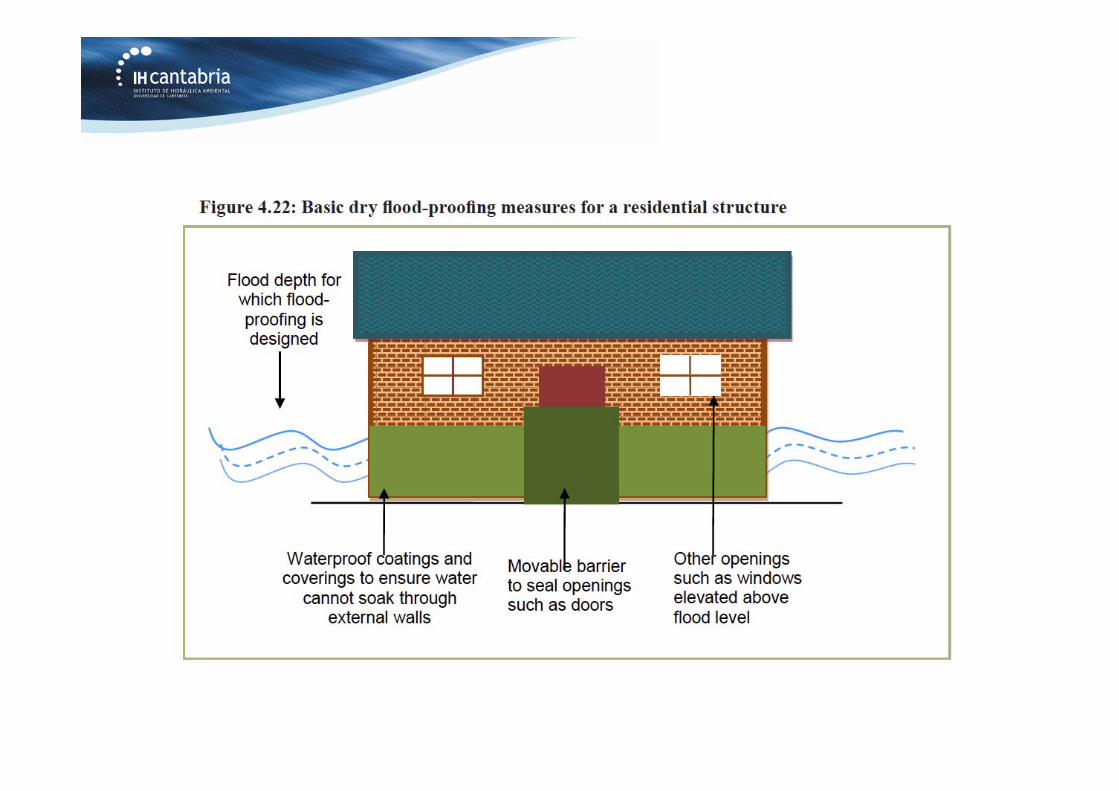
B7 Accommodation to coastal flooding
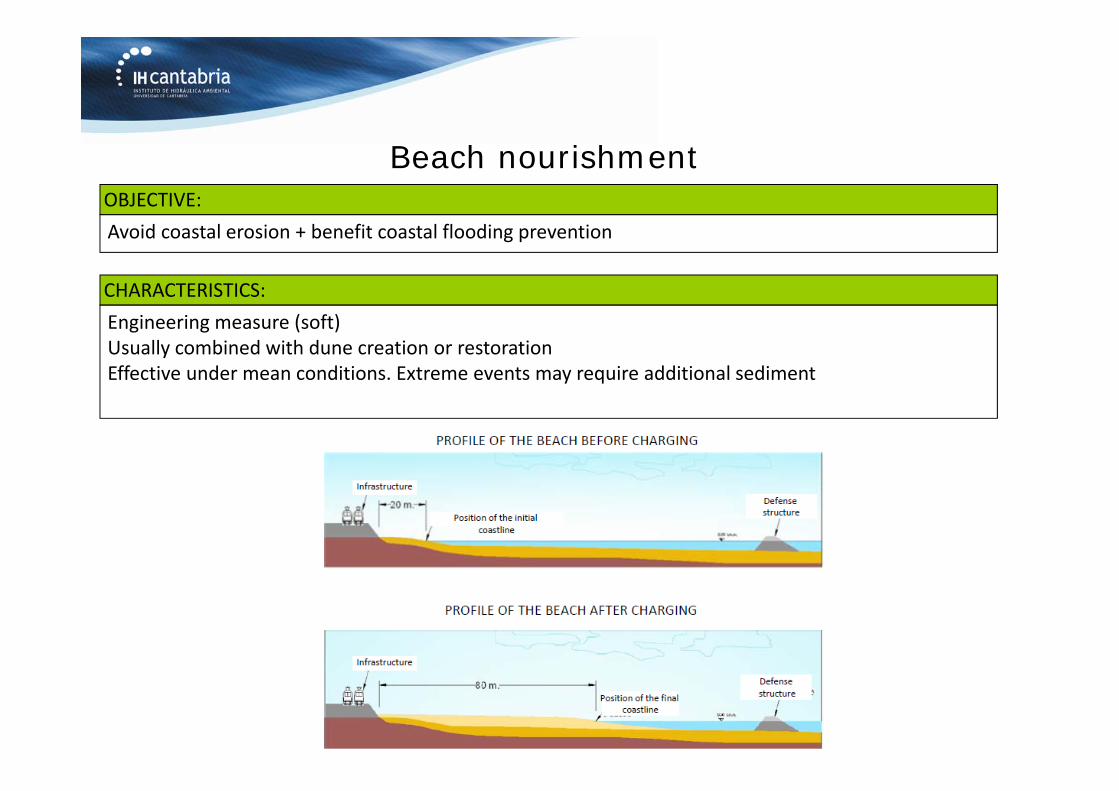
Engineering measure (soft)Usually combined with dune creation or restorationEffective under mean conditions. Extreme events may require additional sediment
CHARACTERISTICS:
Avoid coastal erosion + benefit coastal flooding preventionOBJECTIVE:
Beach nourishment
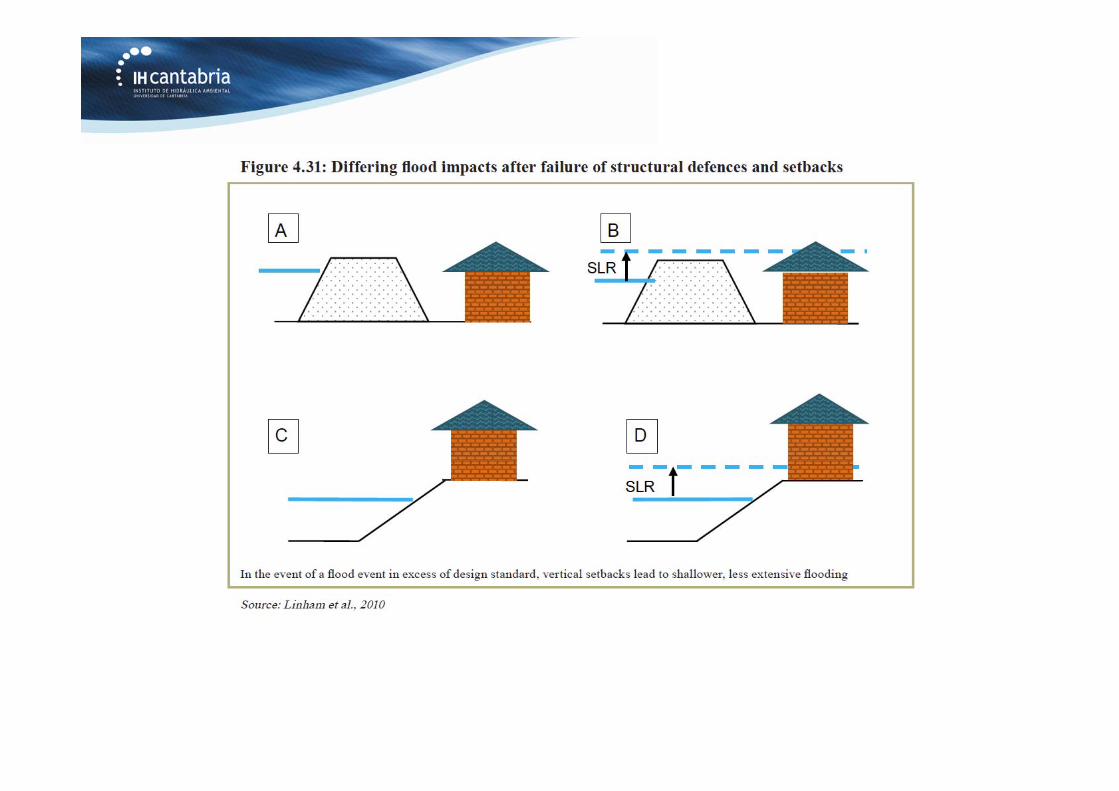
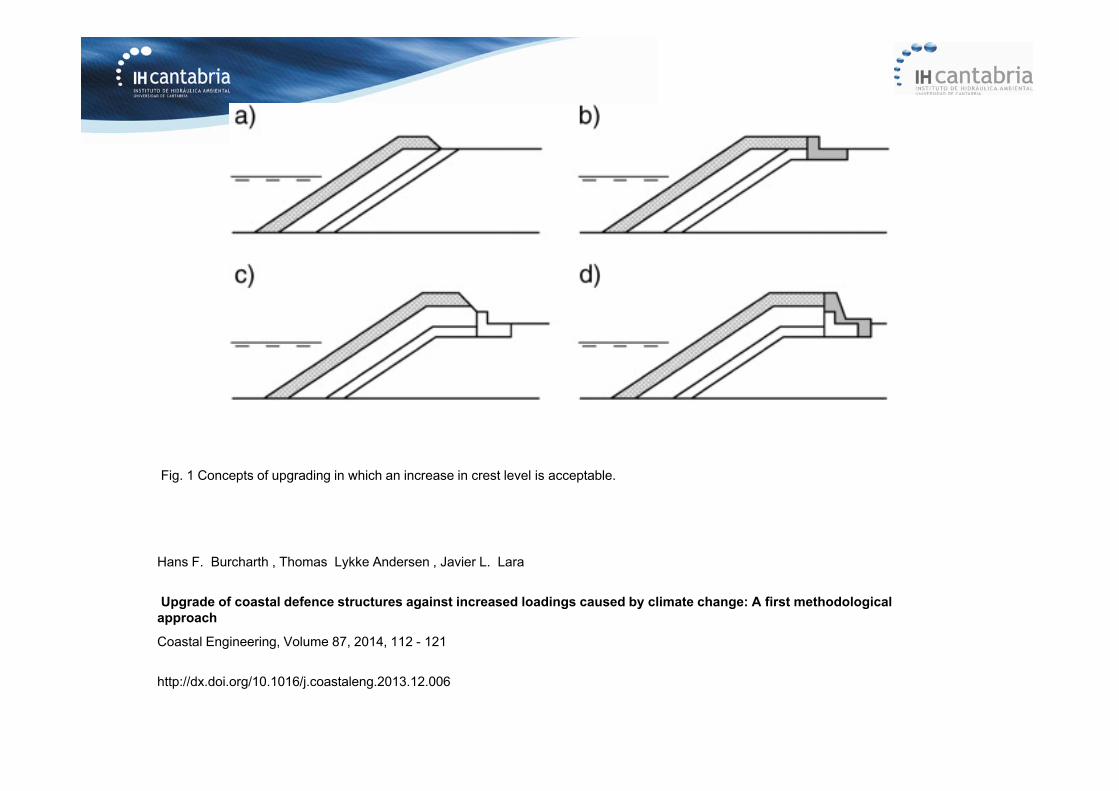
Fig. 1 Concepts of upgrading in which an increase in crest level is acceptable.
Hans F. Burcharth , Thomas Lykke Andersen , Javier L. Lara
Upgrade of coastal defence structures against increased loadings caused by climate change: A first methodological approach
Coastal Engineering, Volume 87, 2014, 112 - 121
http://dx.doi.org/10.1016/j.coastaleng.2013.12.006
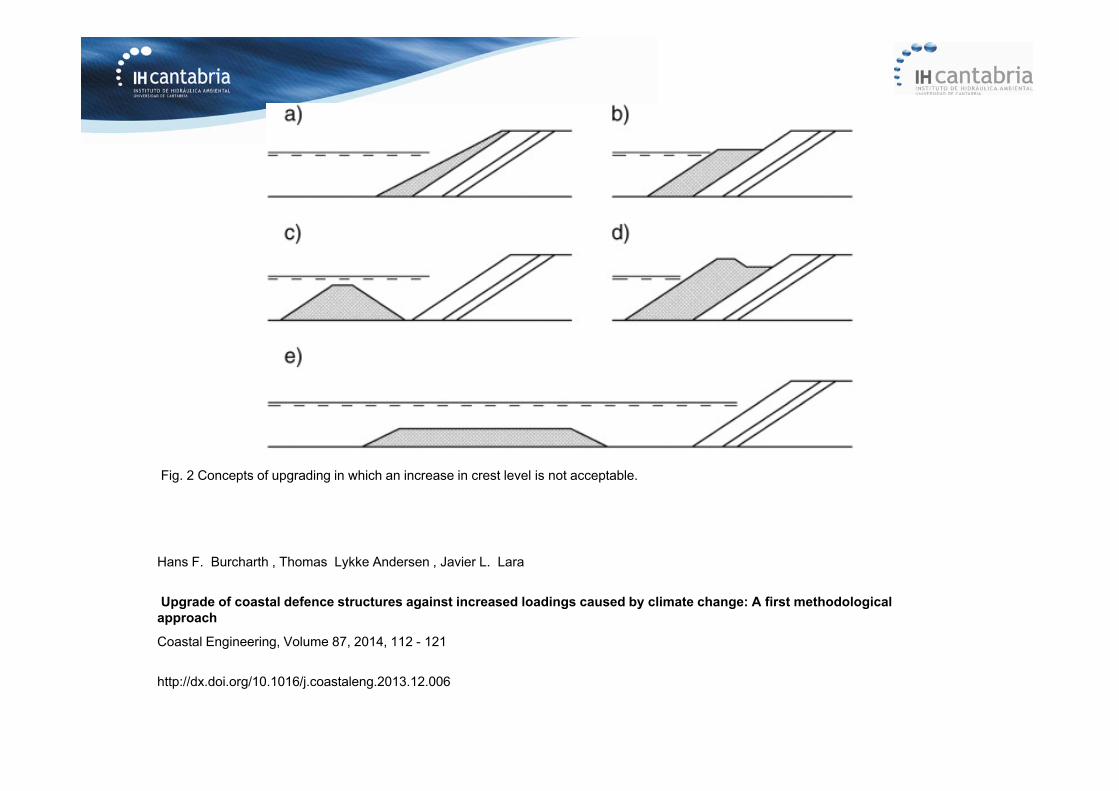
Fig. 2 Concepts of upgrading in which an increase in crest level is not acceptable.
Hans F. Burcharth , Thomas Lykke Andersen , Javier L. Lara
Upgrade of coastal defence structures against increased loadings caused by climate change: A first methodological approach
Coastal Engineering, Volume 87, 2014, 112 - 121
http://dx.doi.org/10.1016/j.coastaleng.2013.12.006
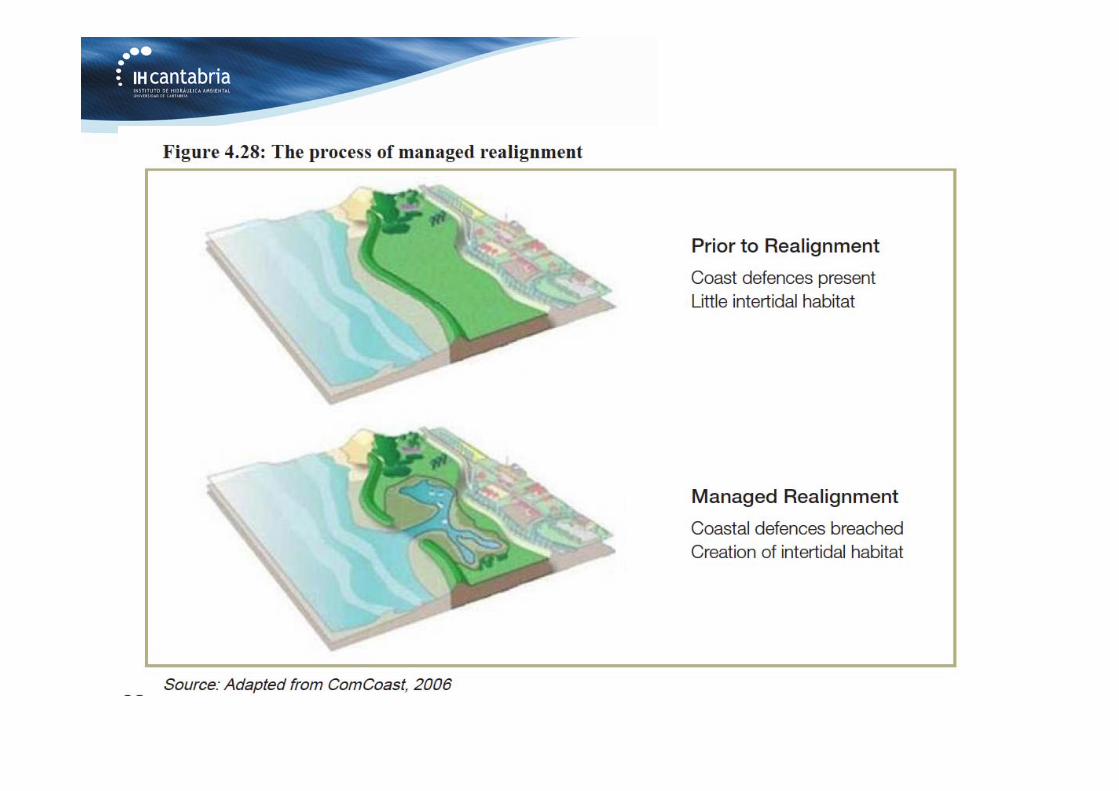

Medida: (retreat, coastalrealignment)
NAVIA
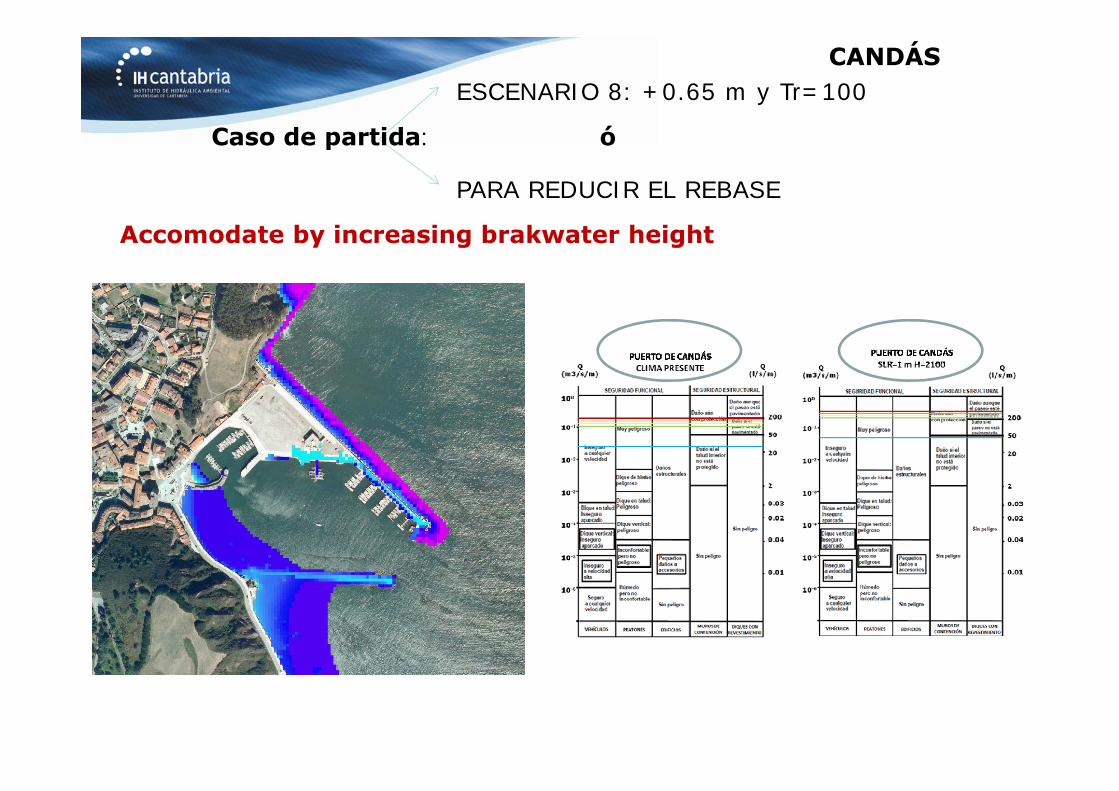
ESCENARIO 8: +0.65 m y Tr=100
PARA REDUCIR EL REBASE
Caso de partida: ó
Accomodate by increasing brakwater height
CANDÁS
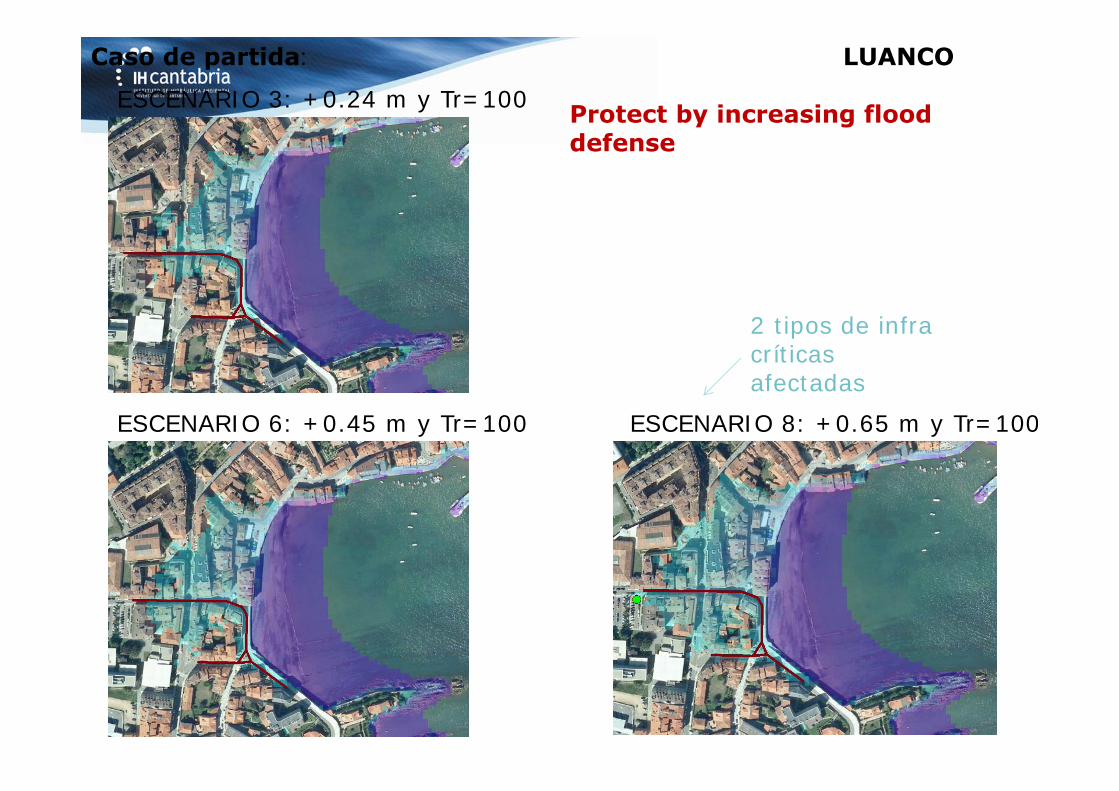
LUANCOCaso de partida:
ESCENARIO 3: +0.24 m y Tr=100 Protect by increasing flooddefense
ESCENARIO 6: +0.45 m y Tr=100 ESCENARIO 8: +0.65 m y Tr=100
2 tipos de infra críticas afectadas
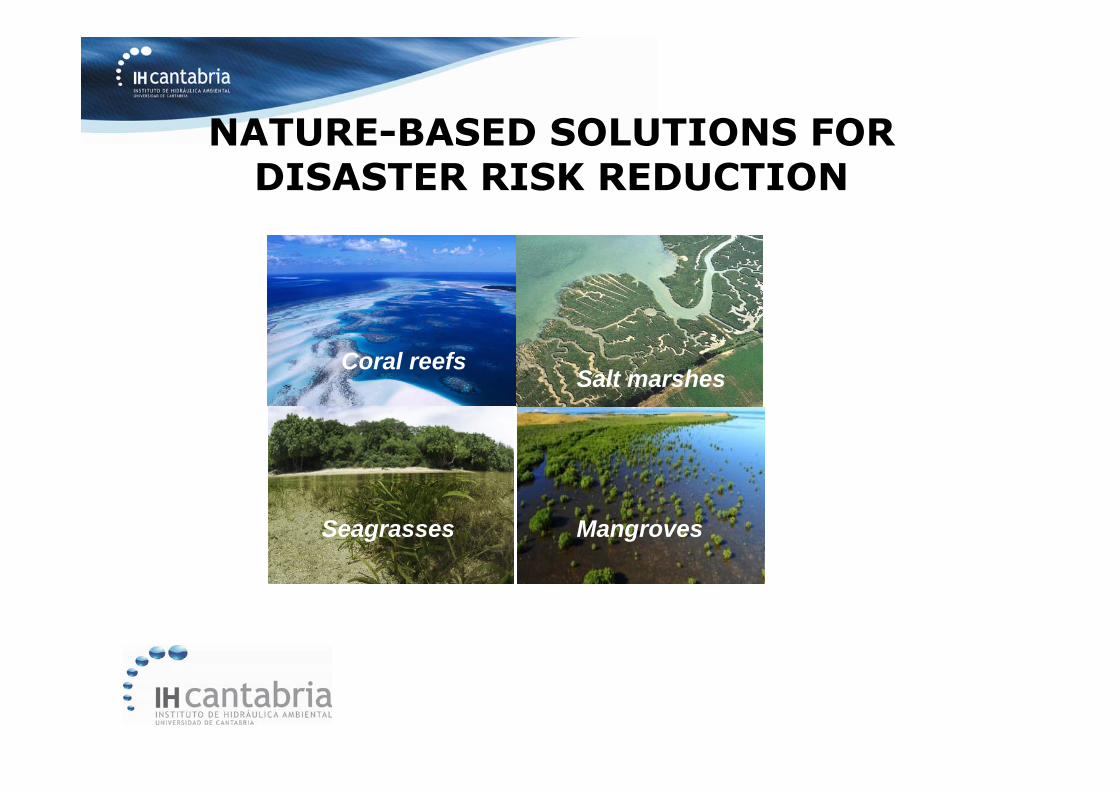
NATURE-BASED SOLUTIONS FOR DISASTER RISK REDUCTION
Coral reefs
Seagrasses
Salt marshes
Mangroves
Nature‐based Features (NBF) are those that may mimic characteristics of natural features but are created by human design, engineering, and construction to provide specific services such as coastal risk reduction or adaptation.
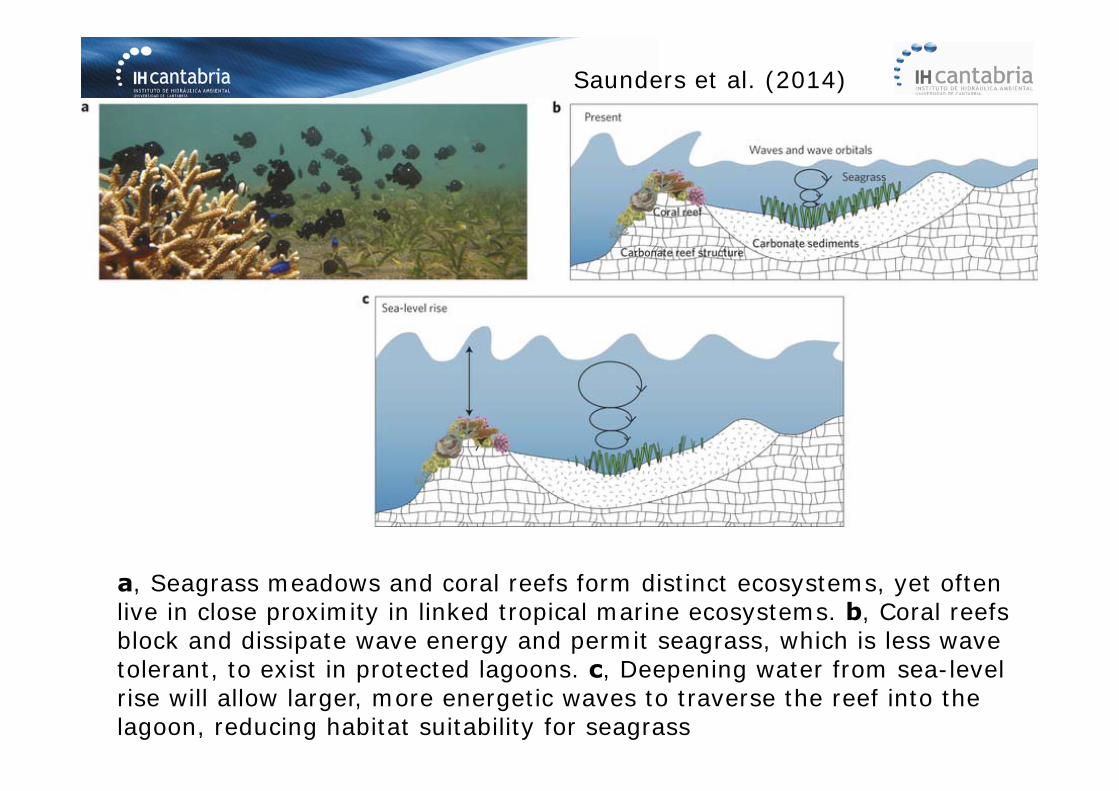
Saunders et al. (2014)
a, Seagrass meadows and coral reefs form distinct ecosystems, yet often live in close proximity in linked tropical marine ecosystems. b, Coral reefs block and dissipate wave energy and permit seagrass, which is less wave tolerant, to exist in protected lagoons. c, Deepening water from sea-level rise will allow larger, more energetic waves to traverse the reef into the lagoon, reducing habitat suitability for seagrass
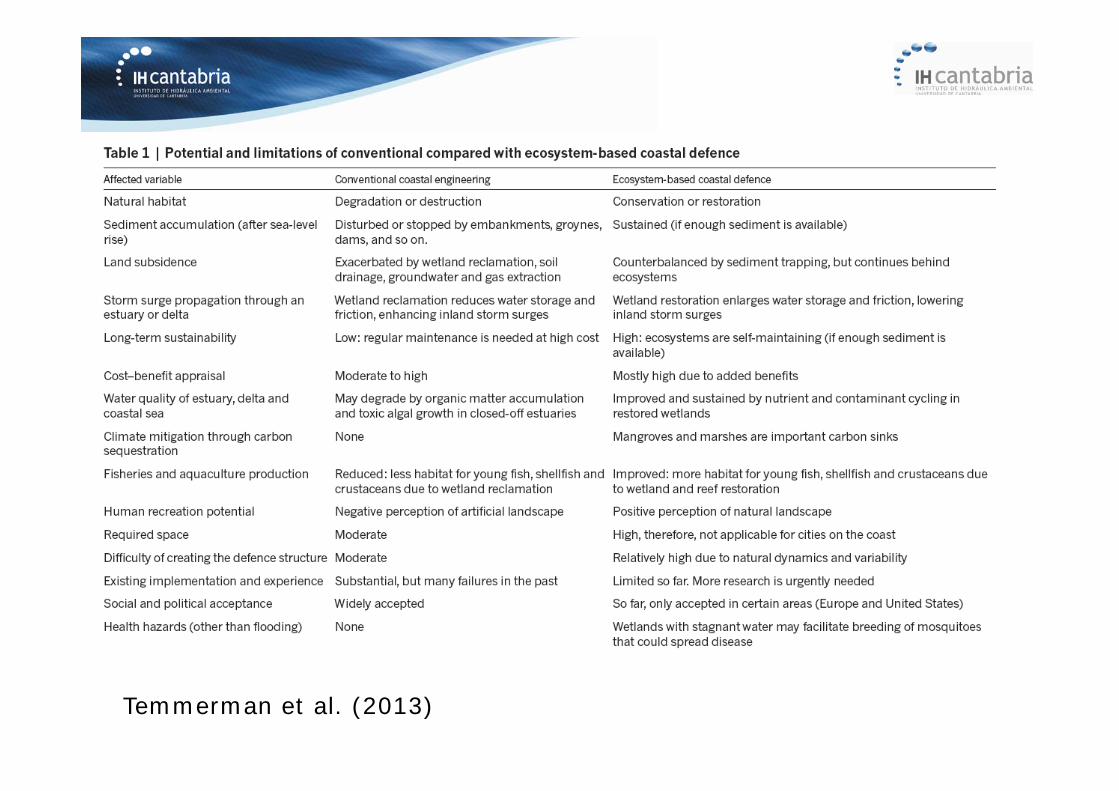
Temmerman et al. (2013)
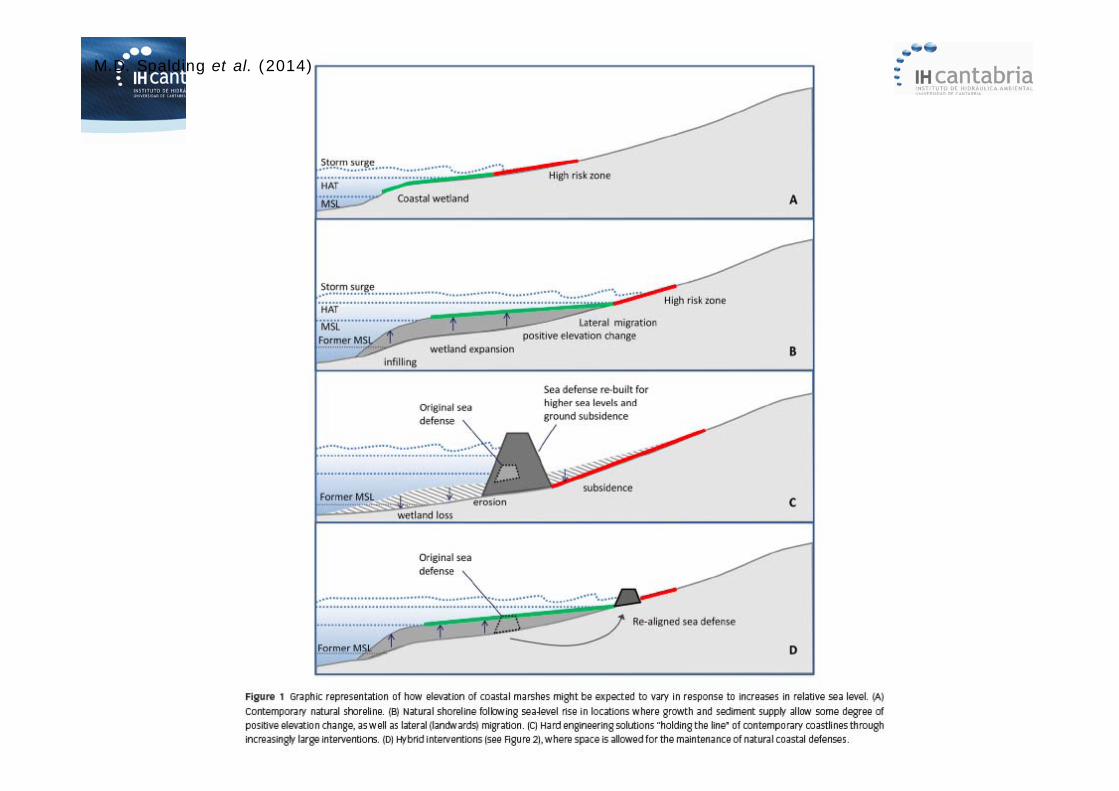
M.D. Spalding et al. (2014)
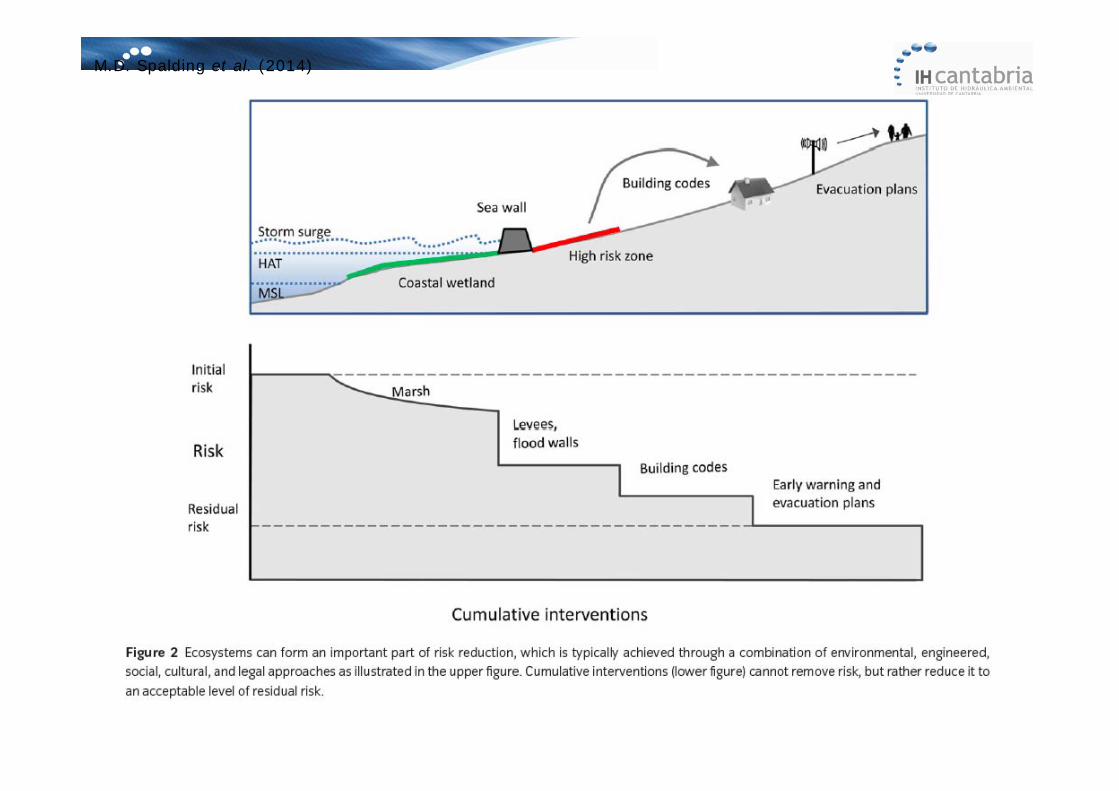
M.D. Spalding et al. (2014)
ADAPTATION STRATEGY
ADAPTING TO SEA LEVEL RISE
Iñigo Losada Rodríguez
[email protected] de Hidráulica Ambiental de Cantabria, “IH Cantabria”Universidad de Cantabria


![Septage_Management Advisory _July 3,2012[1]](https://static.fdocuments.in/doc/165x107/577cdaa41a28ab9e78a62384/septagemanagement-advisory-july-320121.jpg)