The new E.ON: intelligent power grids and customer solutions - … · 2020. 7. 21. · E.ON Russia...
227
2007 Annual Report +++ 01/23/2007 Study on Electricity Price Movements Creates Basis for Energy Policy Dialog +++ 02/02/2007 E.ON to File Final Bid for Endesa Today +++ Security of Supply +++ 02/03/2007 E.ON Creates a Unique Opportunity for Endesa Shareholders +++ 02/06/2007 More Transparency for the Power Market +++ 02/28/2007 E.ON Remains Committed to Its Offer for Endesa +++ 03/07/2007 E.ON in Favor of European Energy Market +++ 03/27/2007 E.ON Secures 9.9 Percent in Endesa +++ Climate Protection +++ 04/02/2007 E.ON Reaches Agreement with Enel and Acciona +++ 05/03/2007 E.ON Improves Earnings Forecast for 2007 +++ 05/09/2007 E.ON Posts Significant Earnings Improvement +++ 05/24/2007 E.ON Sets Course for Russian Power Market +++ 05/31/2007 E.ON to Step Up Growth Tempo +++ 06/20/2007 E.ON Sells ONE to Bid Consortium of France Télécom and Mid Europa Partners +++ 06/22/2007 E.ON to Build Pilot Plant for CO 2 Capture +++ 06/26/2007 E.ON Starts Share Buyback Program +++ 07/03/2007 Energy Summit: Germany Still Lacks Comprehensive Energy Strategy +++ Growth +++ 07/05/2007 E.ON Demands Harmonization of European Emissions Trading +++ 07/20/2007 E.ON Funding Research with €60 Million +++ 08/02/2007 E.ON Expanding Gas Production with Skarv-Idun +++ 08/07/2007 E.ON Buys Wind Farms in Spain and Portugal +++ Market-Oriented Organization +++ 08/07/2007 Transfer of Shareholdings in RAG Aktiengesellschaft +++ 08/14/2007 E.ON Continues on Growth Path +++ 08/21/2007 E.ON: Trading and Renewables to Be Based in Düsseldorf +++ 08/21/2007 E.ON Intends to Delist from New York Stock Exchange +++ Competition +++ 08/29/2007 E.ON Announces Plans to Build Another Wind Farm off the U.K. Coast +++ 09/11/2007 E.ON Listed as a Sustainable Company +++ 09/15/2007 E.ON about to Enter Russian Electricity Market +++ 09/18/2007 E.ON and Turcas to Build Power Plants in Turkey +++ 09/21/2007 E.ON Issued €3.5 Billion Benchmark Bond +++ 10/04/2007 E.ON Acquires Wind Farms in North America +++ 10/12/2007 E.ON Intends to Swap Assets with Statkraft and to Take Over 100 Percent of E.ON Sverige +++ Optimized Capital Structure +++ 10/15/2007 E.ON: Acquisition of Majority Stake in OGK-4 Signed and Sealed +++ 10/18/2007 E.ON Issued £1.5 Billion Benchmark Bond +++ 11/13/2007 E.ON Investment Program ahead of Schedule +++ 11/21/2007 E.ON Energy Trading: Senior International Trading Managers Complete New Management Board +++ 11/29/2007 E.ON Issued Swiss Franc Bond +++ 11/29/2007 E.ON Plans New Efficient Coal-Fired Power Plant in Belgium +++ 11/29/2007 E.ON Increases Syndicated Credit Facility to €15 Billion +++ 12/06/2007 E.ON Supports Next-Generation Engineers +++ 12/17/2007 Major Progress in Negotiations on Asset Swap between Gazprom and E.ON +++ We’re making it happen. +++
Transcript of The new E.ON: intelligent power grids and customer solutions - … · 2020. 7. 21. · E.ON Russia...

2007 Annual Report
+ + + 01/23/2007 Study on Electricity Price Movements Creates Basis for Energy Policy Dialog +++ 02/02/2007 E.ON to
File Final Bid for Endesa Today + + + Security of Supply +++ 02/03/2007 E.ON Creates a Unique Opportunity
for Endesa Shareholders +++ 02/06/2007 More Transparency for the Power Market +++ 02/28/2007 E.ON Remains
Committed to Its Offer for Endesa +++ 03/07/2007 E.ON in Favor of European Energy Market +++ 03/27/2007 E.ON
Secures 9.9 Percent in Endesa + + + Climate Protection +++ 04/02/2007 E.ON Reaches Agreement with Enel
and Acciona +++ 05/03/2007 E.ON Improves Earnings Forecast for 2007 +++ 05/09/2007 E.ON Posts Significant Earnings
Improvement +++ 05/24/2007 E.ON Sets Course for Russian Power Market +++ 05/31/2007 E.ON to Step Up Growth
Tempo +++ 06/20/2007 E.ON Sells ONE to Bid Consortium of France Télécom and Mid Europa Partners +++ 06/22/2007
E.ON to Build Pilot Plant for CO2 Capture +++ 06/26/2007 E.ON Starts Share Buyback Program +++ 07/03/2007 Energy
Summit: Germany Still Lacks Comprehensive Energy Strategy + + + Growth + + + 07/05/2007 E.ON Demands
Harmonization of European Emissions Trading +++ 07/20/2007 E.ON Funding Research with €60 Million +++ 08/02/2007
E.ON Expanding Gas Production with Skarv-Idun +++ 08/07/2007 E.ON Buys Wind Farms in Spain and Portugal +++
Market-Oriented Organization +++ 08/07/2007 Transfer of Shareholdings in RAG Aktiengesellschaft
+ + + 08/14/2007 E.ON Continues on Growth Path + + + 08/21/2007 E.ON: Trading and Renewables to Be Based in
Düsseldorf + + + 08/21/2007 E.ON Intends to Delist from New York Stock Exchange +++ Competition + + +
08/29/2007 E.ON Announces Plans to Build Another Wind Farm off the U.K. Coast +++ 09/11/2007 E.ON Listed as a
Sustainable Company +++ 09/15/2007 E.ON about to Enter Russian Electricity Market +++ 09/18/2007 E.ON and Turcas
to Build Power Plants in Turkey +++ 09/21/2007 E.ON Issued €3.5 Billion Benchmark Bond +++ 10/04/2007 E.ON Acquires
Wind Farms in North America +++ 10/12/2007 E.ON Intends to Swap Assets with Statkraft and to Take Over 100 Percent
of E.ON Sverige + + + Optimized Capital Structure +++ 10/15/2007 E.ON: Acquisition of Majority Stake in
OGK-4 Signed and Sealed +++ 10/18/2007 E.ON Issued £1.5 Billion Benchmark Bond +++ 11/13/2007 E.ON Investment
Program ahead of Schedule +++ 11/21/2007 E.ON Energy Trading: Senior International Trading Managers Complete New
Management Board +++ 11/29/2007 E.ON Issued Swiss Franc Bond +++ 11/29/2007 E.ON Plans New Efficient Coal-Fired
Power Plant in Belgium +++ 11/29/2007 E.ON Increases Syndicated Credit Facility to €15 Billion +++ 12/06/2007 E.ON
Supports Next-Generation Engineers +++ 12/17/2007 Major Progress in Negotiations on Asset Swap between Gazprom
and E.ON + + + We’re making it happen. + + +
2007
470.8
1,212.5
68,731
12,450
9,208
7,724
7,204
5,115
11,306
8,726
–24,138
1.9
55,130
137,294
14.5
9.1
3,417
87,815
11.06
78.12
4.10
2,5906
92.0
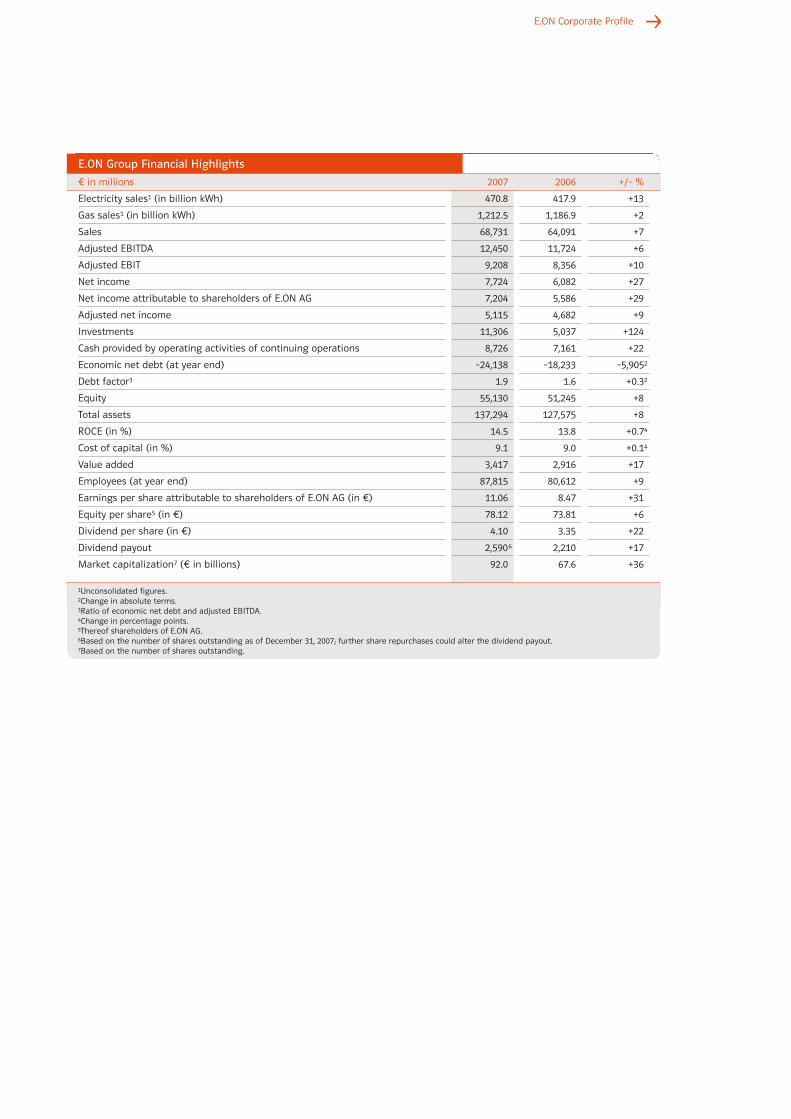
E.ON Group Financial Highlights
in millions
Electricity sales1 (in billion kWh)
Gas sales1 (in billion kWh)
Sales
Adjusted EBITDA
Adjusted EBIT
Net income
Net income attributable to shareholders of E.ON AG
Adjusted net income
Investments
Cash provided by operating activities of continuing operations
Economic net debt (at year end)
Debt factor3
Equity
Total assets
ROCE (in %)
Cost of capital (in %)
Value added
Employees (at year end)
Earnings per share attributable to shareholders of E.ON AG (in )
Equity per share5 (in )
Dividend per share (in )
Dividend payout
Market capitalization7 ( in billions)
+/– %
+13
+2
+7
+6
+10
+27
+29
+9
+124
+22
–5,9052
+0.32
+8
+8
+0.74
+0.14
+17
+9
+31
+6
+22
+17
+36
2006
417.9
1,186.9
64,091
11,724
8,356
6,082
5,586
4,682
5,037
7,161
–18,233
1.6
51,245
127,575
13.8
9.0
2,916
80,612
8.47
73.81
3.35
2,210
67.6
1Unconsolidated figures.2Change in absolute terms.3Ratio of economic net debt and adjusted EBITDA.4Change in percentage points.5Thereof shareholders of E.ON AG.6Based on the number of shares outstanding as of December 31, 2007; further share repurchases could alter the dividend payout.7Based on the number of shares outstanding.
E.ON Corporate Profile

E.ON Corporate Profile as of December 31, 2007
E.ON Energie ranks among Europe’s largest energy service providers and hasoperations in many Central European countries, including the Netherlands,Hungary, Slovakia, the Czech Republic, and Switzerland.
Central Europe market unit E.ON Energie AG, Munich, Germany 100%
in mill
New Market Units in 2008
With annual sales of more than 700 billion kilowatt-hours of natural gas,E.ON Ruhrgas is one of Europe’s premier gas companies and among the world’sbiggest investor-owned natural gas importers. Its customers include regionaland municipal energy utilities as well as industrial enterprises.
Pan-European Gas market unit E.ON Ruhrgas AG, Essen, Germany 100%
E.ON UK, one of the United Kingdom’s leading integrated energy utilities,provides power and gas service to customers across Britain.
U.K. market unit E.ON UK plc, Coventry, United Kingdom 100%
E.ON Sverige manages our energy operations in Northern Europe. It generates,distributes, markets, and delivers electricity and gas through more than 60 operating companies.
Nordic market unit E.ON Nordic AB, Malmö, Sweden 100%
E.ON U.S. is a diversified energy service provider. Its operations are focusedprimarily on the regulated electric and gas utility sector in Kentucky.
U.S. Midwest market unit E.ON U.S. LLC, Louisville, USA 100%
E.ON Energy Trading began operations in January 2008. It combines all ourEuropean trading activities, including electricity, gas, coal, oil, and CO2 allowances,enabling us to seize the opportunities created by the increasing integration ofEurope’s power and gas markets and of global commodity markets.
Energy Trading market unit E.ON Energy Trading AG, Düsseldorf, Germany 100%
E.ON Climate & Renewables is responsible for managing and expanding ourglobal renewables business and for coordinating climate-protection projects.Its generation portfolio consists of about 760 megawatts of generating capacityin Europe and 250 megawatts in North America. Roughly 3,500 megawatts ofnew capacity are at various stages of construction and planning.
Climate & Renewables market unit E.ON Climate & Renewables GmbH, Düsseldorf, Germany 100%
Corporate CenterE.ON AGDüsseldorf

4,6706,22232,029 24.7 9.3 2,917 3,811 2,581 44,051
2,5763,17622,745 15.0 8.8 1,062 3,041 2,424 12,214
1,1361,65712,584 9.2 9.5 –37 1,615 1,364 16,786
6701,0273,339 9.7 8.8 62 914 914 5,804
3885431,819 5.7 7.8 –142 216 690 2,977
AdjustedEBIT
AdjustedEBITDASales
ROCE(in %)
Cost ofcapital(in %)
Valueadded
Cashprovided by
operatingactivities
Invest-ments
Employees(at year
end) in millions
E.ON Russia Power oversees our power business in Russia. Through OGK-4, wehave around 8,600 megawatts of generating capacity in the fast-growing, heavilyindustrialized regions of Central Russia, Ural, and Western Siberia.
Russia market unit E.ON Russia Power, Russia 100%
E.ON Italia manages our power and gas business in Italy. We’re already active inItaly’s wholesale power and gas markets and in natural gas sales. The plannedacquisition of Endesa Italia, which we expect to be completed in 2008, will giveus about 5,000 megawatts of generating capacity in Italy, making us the country’sfourth-largest power producer.
Italy market unit E.ON Italia S.r.l., Milan, Italy 100%

We’ve worked hard over the past few years shaping E.ON to face the future challenges of Europe’senergy market. This relentless effort has made us a leading performer in our industry. But our com-pany has never rested on its success.
We want to add new chapters to our success story. For that, we need a strategy that’s right forall aspects of our business. In 2007, we announced our strategic objectives and launched a packageof targeted investment, organizational, and financial initiatives to achieve them.
• Invest in technologically advanced generating capacity and energy infrastructure to ensure+ + + security of supply + + + for the long term.
• Emphasize + + + climate protection + + + on a new scale and maintain a balanced energy mix.
• Achieve + + + growth + + + because strong market positions are a decisive advantage in Europe’s fiercely competitive energy market.
• Forge a + + + market-oriented organization + + + to seize the opportunities created by the integration of European energy markets.
• Spur + + + competition + + + in our industry because we believe that facing the heat of competition makes us better and enables us to provide our customers with the best productsand services.
• Optimize our + + + capital structure + + + to make E.ON stock an even more attractive invest-ment.
These are six key objectives by which we’ll measure our success in the years ahead. They’re the foundation of our corporate strategy. And we know that to be truly successful we need to achieveall of them.
We’re convinced that executing this strategy will enable us to continue to deliver sustainable,superior value to our customers, investors, and employees.
+ + + We’re making it happen. + + +

2
23–25
+ + + Growth + + +From zero to 8,600
77–79
+ + + Market-Oriented Organization + + +One market, one team
95–97
+ + + Security of Supply + + +A pipeline to security of supply
71–73
+ + + Climate Protection + + +Adding more wind to the mix
111–113
+ + + Competition + + +E.ON makes customer choice easy
11–13
+ + + Optimized Capital Structure + + +Towards an efficient debt-to-equity ratio

3To Our ShareholdersSupervisory Board Year in Review Combined Group Management Report Additional Information Market Units Corporate Governance Consolidated Financial Statements Tables and Explanations
Contents
To Our ShareholdersLetter to Shareholders
E.ON Stock
Board of Management
Supervisory BoardReport of the Supervisory Board
Members and Committees
Year in Review
Combined Group Management ReportCorporate Profile and Operating Environment
Earnings Situation
Financial Condition
Asset Situation
Financial Statements of E.ON AG
Employees
Research and Development
Corporate Responsibility
Risk Report
Forecast
Additional InformationStrategy and Planned Investments
New Technologies
Disclosure of Takeover Barriers1 and Explanatory
Report of the Board of Management
Market UnitsCentral Europe
Pan-European Gas
U.K.
Nordic
U.S. Midwest
Corporate GovernanceCorporate Governance Report
Compensation Report1
Consolidated Financial StatementsIndependent Auditor’s Report
Consolidated Statements of Income
Consolidated Balance Sheets
Consolidated Statements of Recognized
Income and Expenses
Consolidated Statements of Cash Flows
Notes to the Consolidated Financial Statements
Declaration of the Board of Management
Tables and ExplanationsOther Explanations Concerning the
IFRS Reconciliations
Other Directorships
Major Shareholdings
Glossary
Financial Calendar
Summary of Financial Highlights
122122
123
124
126
127
128
210
211211
212
214
216
221
222
44
8
14
1616
19
20
2626
36
48
54
55
56
60
61
62
68
7474
80
83
8686
92
100
104
108
114114
117
1Part of the Combined Group Management Report

Letter to Shareholders4
Last year, we presented our strategic road map for your company’s future development in
Europe’s converging energy markets. Our major investment program—€60 billion through
2010—and our targeted competition initiatives will accelerate integration and invigorate the
emerging EU-wide internal energy market. We’re seizing the new opportunities for further growth
created by this big market, primarily through the organic growth of our international business
but also through selective acquisitions. In business, nothing is more exciting—or more prof-
itable—than playing an active role in shaping a new market. We’ve seized this opportunity,
even though, as we saw in Spain, not every attempt to change outmoded structures is an
immediate success. Nevertheless, our agreement with Enel and Acciona will enable us to enter
highly attractive new markets like Spain and France and to strengthen our existing market
position in Italy. When these transactions are complete, no other energy company will match

To Our ShareholdersSupervisory Board Year in Review Combined Group Management Report Additional Information Market Units Corporate Governance Consolidated Financial Statements Tables and Explanations
5
our broad European footprint. E.ON already has operations in nearly 30 countries, with lead-
ing positions in key markets like Germany, the United Kingdom, Sweden, and Eastern Europe.
By setting the pace in Europe’s energy market, we’re unlocking the potential to grow and
create sustainable value.
At the same time, we again improved our key financial figures. We grew sales in 2007 by 7 per-
cent to €68.7 billion. Our adjusted EBIT of €9.2 billion surpassed the prior year’s record figure
by 10 percent. Our consistent success wouldn’t be possible without our employees’ hard work
and dedication. I’d like to take this opportunity to again thank them for their outstanding
performance. My thanks also go to our employee representatives for the constructive role
they play in our organization.
E.ON stock also performed extremely well in 2007, closing the year 42 percent higher. This is
particularly noteworthy, since our stock price had already risen by just over 17 percent in
2006. Including the dividend, E.ON stock rose by 45.6 percent in 2007, outperforming Germany’s
DAX 30 index (which gained 22.3 percent on the year) and the EURO STOXX 50 (which gained
9.7 percent). These are signals that the capital market supports our new growth strategy and
investment offensive.
The attractiveness of E.ON stock is enhanced by our investor-friendly dividend policy. At the
Annual Shareholders Meeting on April 30, 2008, we will propose that the dividend be raised
by 22 percent to €4.10 per share. Our dividend payout of €2.6 billion again makes us one of
the DAX 30’s leading dividend performers. We’ll continue to aim for a payout ratio of 50 to 60 per-
cent of adjusted net income. In view of our EBIT targets and the effects of our share buyback,
we expect to increase our dividend per share by an average of 10 to 20 percent per year
through 2010.
We expect adjusted EBIT for 2008 to surpass the high prior-year figure by 5 to 10 percent.
We anticipate a slight improvement in 2008 adjusted net income.
As you can see, our strategy is working. In May 2007, we presented a package of intertwined
investment, organizational, and financing initiatives. We’ve made very rapid progress imple-
menting them, in some cases even more rapid than originally anticipated.
We’re systematically implementing our €60 billion investment program. We successfully
entered Russia’s fast-growing electricity market by acquiring a majority stake in OGK-4, a Russian
power producer. OGK-4 operates four gas-fired power stations and one coal-fired power station
with an aggregate capacity of about 8,600 megawatts, giving it one of the most powerful and
efficient asset portfolios in Russia. Over the next three years, we intend to add 2,400 megawatts
of technologically advanced generating capacity. Our planned acquisition of Statkraft’s shares
in E.ON Nordic will, from a structural standpoint, strengthen our position in Northern Europe.
It will give us sole responsibility for this business, enabling us to develop it rapidly and ensure
that it has better prospects for the future. Our gas procurement strategy is also moving ahead
according to plan. In October, we acquired a stake in Skarv and Idun gas fields in the north-
ern Norwegian Sea. Together with other promising satellite fields, the area ranks among
Norway’s largest and most attractive undeveloped gas fields. The expansion of our global
renewables business has actually advanced faster than anticipated, which is why we’ve dou-
bled our originally planned investments through 2010 to €6 billion. In just a short time, we’ve
become one of the world’s top-ten wind-farm operators. Our new Climate & Renewables mar-
ket unit is responsible for managing the ambitious expansion program for our renewables
business. In August, we bought ENERGI E2 Renovables Ibéricas, which has wind-power opera-
tions in Spain and Portugal. We followed this up in October with the acquisition of Airtricity in

Letter to Shareholders6
the United States and Canada, marking our successful entry into the world’s most attractive
renewables market. We already operate 21 wind farms onshore and offshore in the United
Kingdom, with additional projects in planning. Among them is one of the world’s largest off-
shore wind farms, which will be located in the Thames estuary. E.ON continues to be involved
in a number of ambitious wind-power projects off Germany’s North Sea and Baltic Sea coasts.
Among them is Germany’s first large-scale wind farm, to be sited off the North Sea island of
Borkum.
Our expansion in Europe and—in the case of our renewables business—around the world has
made it necessary for E.ON to have a more market-oriented and more agile organizational
structure. We soon expect to have ten market units (and thus ten market unit lead companies),
twice as many as we had in 2007. Among them are new market units for renewables and for
trading, which will combine and realign our operations in these areas. Added to these are new
regional market units for Italy, Spain, and Russia where our businesses are achieving the nec-
essary mass. We responded early to E.ON’s increasing internationality and complexity by further
refining the group’s management structure. The purpose was to enable us to better manage
our international business and to focus E.ON even more systematically on growth, competitive-
ness, and customer proximity. We also added two new functions to our Board of Management.
We introduced the role of Chief Operating Officer, which is held by Johannes Teyssen, and a
position for Corporate Development/New Markets, which is held by Lutz Feldmann.
We’re also making good progress implementing our financial strategy. Our share buyback pro-
gram is proceeding according to schedule. We repurchased €3.5 billion of E.ON stock in 2007.
We intend to buy back another €3.5 billion of E.ON stock on-market in 2008. As planned, our
investment offensive and share buyback are increasing our debt-to-equity ratio, giving E.ON
a more efficient capital structure. We responded swiftly to a temporary improvement in the
financial markets with highly successful bond issues. We issued a €3.5 billion benchmark
bond in September, a £1.5 billion benchmark bond in October, and a CHF 425 million bond in
November. All three were significantly oversubscribed and successfully placed with a large
number of institutional investors. Our bond strategy is making an important contribution to
expanding our investor base. The market’s very positive response to these measures provides
clear evidence that investors support our corporate and financial strategy.
In my mind, the success of the European internal energy market is a key issue. We’re taking
action on a variety of fronts so that this important project moves forward. But I’m a realist.
It’s clear to me that the internal market remains a patchwork of different market structures
and regulatory regimes. One reason why it would be wrong to speak of an EU-wide energy
market is because national borders aren’t porous enough due to a lack of sufficient transfer
capacity. In addition, government policies in too many countries continue to distort energy
prices. These include Germany’s high electricity taxes and surcharges. Indeed, in many Euro-
pean countries, the government continues to call the shots in the energy industry; in others,
state control is resurgent. Germany, too, is again showing a marked tendency towards anti-
market interventionism.

7
The European Commission has recognized correctly that the internal energy market is now at
a critical phase and that it must seize the initiative to move the market forward. We support
the Commission’s efforts through a range of initiatives, such as improving market transparency
in Germany and increasing the country’s cross-border power transfer capacity. On the whole,
the Commission’s plan points in the right direction.
We also support Germany and Europe’s climate policy. This issue is important to me because
I’m convinced that the world finally needs to act to tackle climate change. This will only suc-
ceed if we get the most climate protection we can from each euro we invest. My impression,
though, is that the climate-policy debate in Germany pays too little attention to cost efficiency.
Many countries, particularly in Europe, rely on nuclear energy to help protect the earth’s climate.
Germany, by contrast, is on a course to phase out nuclear energy, which will prevent it from
achieving its ambitious climate-protection targets.
In Germany, we need to bring together policymakers, the public, and the energy industry for
an objective and honest dialog about energy policy. Germany’s energy industry—in part from
its own doing—finds itself in an image crisis, a crisis that now affects every project to build a
new power plant or new piece of energy infrastructure. If Germany can’t modernize its energy
asset base, the consequences for its international competitiveness and climate targets are
obvious. To me, this is one of the most important policy issues of 2008. I’m personally involved
in efforts to reinvigorate a broad and inclusive energy-policy debate. As an energy company,
we need the trust of policymakers and the public so that we can continue to operate success-
fully and create value for all our shareholders well into the future.
Sincerely yours,
Dr. Wulf H. Bernotat
To Our ShareholdersSupervisory Board Year in Review Combined Group Management Report Additional Information Market Units Corporate Governance Consolidated Financial Statements Tables and Explanations

E.ON StockE.ON stock is listed on all German stock exchanges. On
December 28, 2007, E.ON stock’s weighting in the DAX index
of Germany’s top blue chips was 10.06 percent, once again
the highest weighting in the index. E.ON stock is also included
in all major European stock indices. In the United States, E.ON
stock is traded in the form of American Depositary Receipts
(ADRs). Since being delisted from the New York Stock Exchange
on September 7, 2007, E.ON ADRs now trade on the over-the-
counter market. The conversion ratio between E.ON ADRs and
E.ON stock is three to one; that is, the value of three E.ON ADRs
is effectively that of one share of E.ON stock.
E.ON Stock’s Development in 2007In a strong stock market, the price of E.ON stock increased
by 41.6 percent in 2007. Shareholders who reinvested their
cash dividends saw the value of their E.ON portfolio increase
by 45.6 percent in 2007. E.ON thus outperformed the German
stock market (DAX +22.3 percent) and the European stock
market (EURO STOXX +9.7 percent). The performance of
European utility stocks as measured by the STOXX Utilities
(+21.6 percent) also fell short of E.ON stock’s performance.
8
2003 2004
per share
120
80
40
2005 2006
Stock Price at Year End
in %
10.06
4.12
18.93
Weighting of E.ON Stock in Major Indices
As of December 28, 2007
DAX
Dow Jones EURO STOXX 50
Dow Jones STOXX Utilities
2007
145.5951.74 67.06 87.39 102.83
E.ON Stock
E.ON stock closes year 41.6 percent higherManagement recommends 4.10 per share dividendDialog with investors intensified

E.ON Stock’s Long-Term DevelopmentLong-term investors who purchased 5,000 worth of E.ON stock
(then: VEBA stock) at the end of 1997 and reinvested their
cash dividends (including the special dividend in 2006) saw
the value of their investment rise to more than 15,943 by
the end of 2007. This represents an average annual return of
12.3 percent, higher than Germany’s DAX index (which advanced
6.6 percent per year on average over the same period) and
the broader European market (the EURO STOXX advanced
7.8 percent per year on average). European utility stocks as
measured by the STOXX Utilities index averaged 12.7 percent
growth per year during the same period.
Investors who purchased 5,000 worth of E.ON stock at the
end of 2002 and reinvested their cash dividends (including
the special dividend in 2006) saw the value of their investment
increase to 23,345 by the end of 2007, which represents an
average annual return of 36.1 percent. E.ON stock thus con-
siderably outperformed the DAX (+22.8 percent), the EURO
STOXX (+15.8 percent), and the STOXX Utilities (+26.9 percent).
9To Our ShareholdersSupervisory Board Year in Review Combined Group Management Report Additional Information Market Units Corporate Governance Consolidated Financial Statements Tables and Explanations
Share Buyback, Cancellation of SharesIn June 2007, E.ON began its previously announced share buy-
back program. By year end 2007, E.ON had repurchased nearly
28 million of its own shares with an aggregate purchase vol-
ume of 3.5 billion and sold put options on 10 million of its
own shares. In December 2007, we cancelled 25 million shares,
thereby reducing E.ON’s capital stock. The share buyback
program is an important step towards optimizing E.ON’s cap-
ital structure. It increases the attractiveness of E.ON stock,
since it positively influences earnings per share and the divi-
dend yield.
Dividend At the 2008 Annual Shareholders Meeting, management will
propose that the cash dividend be increased by 22 percent,
from 3.35 per share for the 2006 financial year to 4.10 per
share for the 2007 financial year. Since the 2002 financial year,
the dividend has thus increased from 1.75 to 4.10, which
represents an average of 18.6 percent per year. Based on E.ON
stock’s year end 2007 closing price, the dividend yield is 2.8 per-
cent. The dividend payout ratio is 50.6 percent of adjusted net
income (based on shares outstanding as of December 31, 2007;
further share repurchases could alter the dividend payout).
E.ON Stock Information
Type of shares Ordinary shares with no par value
Stock codes Germany USAWKN 761 440 Cusip No. 268 780 103ISIN DE 000 761 4406
Stock symbols Reuters BloombergFSE EONG.F FSE EOA GFXetra EONG.DE Xetra EOA GYADR EONGY.PK ADR EONGY US
Long-Term Development of E.ON Stock (10 Years)
Percentages
200
150
100
50
0
DAX EURO STOXX STOXX Utilities
1997 1998 1999 2000 2001 2002 2003 2004 2005 2006 2007
E.ON Stock Portfolio

E.ON Stock10
2003
7.11
–
2.00
1,312
51.74
34.67
51.74
656
33.9
45.39
114
38.5
807.84.8
2004
6.61
–
2.35
1,549
67.06
49.27
67.06
659
44.2
50.93
132
46.1
877.75.3
2005
11.24
5.52
2.75
4,6142
88.92
64.50
87.39
659
57.6
67.50
129
62.5
1,095.85.7
2006
8.47
7.10
3.35
2,210
104.40
82.12
102.83
660
67.6
73.81
139
92.5
1,539.36.0
2007
11.06
7.86
4.10
2,5903
146.06
96.05
145.59
632
92.0
78.12
186
136.2
2,350.95.8
Per share ()
Earnings attributable to the shareholders of E.ON AG
Earnings from adjusted net income
Dividend
Dividend payout ( in millions)
Twelve-month high
Twelve-month low
Year-end closing price
Number of shares outstanding (in millions)
Market capitalization4 ( in billions)
Book value5
Market-to-book ratio6 (percentage)
E.ON stock trading volume7 ( in billions)
Trading volume of all German stocks ( in billions)E.ON stock’s share of German trading volume (percentage)
1Adjusted for discontinued operations; figures up to and including 2005 calculated according to U.S. GAAP.2Includes special dividend of 4.25 per share.3Based on the number of shares outstanding as of December 31, 2007; further share repurchases could alter the dividend payout.4Based on shares outstanding.5Thereof the shareholders of E.ON AG.6Year-end stock price expressed as a percentage of book value per share.7On all German stock exchanges, including Xetra.
E.ON Stock Key Figures1
Shareholder Structure A survey conducted in December 2007 identified 75.2 percent
of the shares outstanding as being held by institutional
investors. According to the survey, institutional investors in
Germany hold 19.3 percent of the shares outstanding; those
outside of Germany hold 55.9 percent.
Investor RelationsIn 2007, we further enhanced our investor relations activities
with the aim of achieving even greater transparency for our
shareholders. Through our regular road shows and participa-
tion in capital market conferences, we deepened the long-
standing relationship of trust we enjoy with all capital mar-
ket participants as well as with people interested in E.ON
stock. We also intensified our dialog with retail investors at
many events.
+ + + Growth + + +
Capital Market Day 2007 in BudapestE.ON Capital Market Day in Budapest served to under-
score our commitment to our target markets in Eastern
Europe. The event provided an opportunity to learn
firsthand about our operations in the region and about
our clear strategy for what is one of Europe’s fastest-
growing markets.
Source: Thomson Financial (figures as of December 2007); based on 631,622,782 shares outstanding.
Percentages Germany 19.3 Outside Germany 55.9
Shares Held by Institutional Investors
26.7
14.4
5.1
2.3
6.3
1.1
19.3
USA and Canada
United Kingdom
France
Switzerland
Rest of Europe
Other
Germany

To have an efficient capital structure, you need the
right debt-to-equity ratio. That’s what we’re working
towards. We’ve also set a clear earnings target that
we call “ten until ten”: between now and 2010, we
aim to increase our adjusted EBIT by an average of
at least 10 percent per year.
The investment program announced in May 2007 is leading
to an increase in E.ON’s financing needs. With debt capital
markets growing in significance for our company, we are
intensifying our relations with debt capital investors and
analysts through a number of specifically tailored events.
Once a year, we invite analysts and institutional investors to
a Capital Market Day which is held at one of our market units.
It gives them the opportunity to hear firsthand the senior
management of our market and business units talk about
E.ON’s business from an operational perspective. The 2007
event was held in Budapest, Hungary, and focused on E.ON’s
activities in Eastern Europe. For 2008, we again plan to involve
specialists from our operating business in a variety of road
shows in major financial centers.
We pride ourselves on top-quality service and direct contact
with analysts and investors. At eon.com, you will find finan-
cial reports, management presentations, contact information,
as well as webcasts and podcasts of investor relations events
in both audio and video format.
In 2007, the quality of our work was again confirmed by positive
reviews by investors, analysts, and financial publications (includ-
ing the German business biweekly Capital and IR Magazine).
This praise motivates us to further enhance the transparency
of our financial communications in 2008.
+ + + Optimized Capital Structure + + +

1212

1313
Towards an efficient debt-to-equity ratio
E.ON launches a share buyback program.It started on June 27, 2007. The biggest share buyback program in E.ON’s
history.
We intend to buy back about 7 billion of our own stock by the end of
2008. Repurchased shares will later be cancelled, which will improve our
capital structure and at the same time make E.ON stock a more attractive
investment.
As planned, we reached the midway point by year end 2007, having pur-
chased 3.5 billion in E.ON stock on-market. This increased our debt factor
from 1.6 to 1.9, moving us markedly closer to our target debt factor of 3.
Over the same period, E.ON stock has performed well, indicating that
investors support our strategic course.
The stock buyback program will continue and be completed on schedule
by the end of 2008.
In 2007, we also had a successful start to our financing program. We issued
a total of roughly 6 billion in bonds in a number of currencies in interna-
tional capital markets. Our bonds were significantly oversubscribed, which
reflects the capital market’s trust in our company.
Solid stock price performance,oversubscribed bonds: the capitalmarket signals its support forE.ON’s financing initiatives.
At eon.com, you’ll find weeklyupdates about the status of ourbuyback program.
E.ON Stock Performance in 2007 after Announcement of the Investment and Share Buyback Programs
Percentages
130
120
110
100
90
E.ON DAX 30 STOXX Utilities
5/30 6/18 7/07 7/26 8/14 9/02 9/21 10/10 10/29 11/17 12/06 12/25
+24%
+9%
+4%

Board of Management14
Dr. Burckhard Bergmann Dr. Wulf H. Bernotat Christoph Dänzer-Vanotti Dr. Marcus Schenck Dr. Johannes Teyssen Lutz Feldmann

15To Our ShareholdersSupervisory Board Year in Review Combined Group Management Report Additional Information Market Units Corporate Governance Consolidated Financial Statements Tables and Explanations
Executive Vice PresidentsKiran Bhojani, Düsseldorf
Dr. Peter Blau, Düsseldorf
Gert von der Groeben, Düsseldorf
Heinrich Montag, Düsseldorf
Dr. Hans Michael GaulBorn 1942 in DüsseldorfMember of the Board of Management since 1990Corporate Planning & Controlling, Mergers & Acquisitions, Legal AffairsDüsseldorf (until March 31, 2007)
Dr. Wulf H. BernotatBorn 1948 in Göttingen Member of the Board of Management since 2003Group Executive Human Resources, Investor Relations, Group Audit,Corporate Communications, Economic and Public AffairsChairman and CEO, Düsseldorf
Dr. Johannes TeyssenBorn 1959 in HildesheimMember of the Board of Management since 2004Corporate Planning & Controlling, Infrastructure Management,Group Procurement, Marketing & Sales, Upstream/Generation,Trading & Portfolio Optimization, Düsseldorf (Vice Chairman since March 1, 2008)
Dr. Burckhard BergmannBorn 1943 in Sendenhorst/Beckum Member of the Board of Management since 2003Gas Procurement, Gas Production, Group Regulatory Management Düsseldorf (until February 29, 2008)
Christoph Dänzer-VanottiBorn 1955 in FreiburgMember of the Board of Management since 2006Corporate Responsibility, E.ON Academy, Facility Management,Real Estate, OneE.ON, Human Resources/Organization, Düsseldorf
Lutz FeldmannBorn 1957 in Bonn Member of the Board of Management since 2006Mergers & Acquisitions, Legal Affairs, Corporate Development/New Markets, Düsseldorf
Dr. Marcus SchenckBorn 1965 in MemmingenMember of the Board of Management since 2006Finance, Accounting, Tax, IT, Düsseldorf

Report of the Supervisory Board
In the year under review, the Supervisory Board thoroughly
examined E.ON’s situation. The E.ON AG Board of Manage-
ment regularly provided us with timely and comprehensive
information. We continually monitored the management of
the Company and advised the Board of Management.
At the Supervisory Board’s three regular meetings and four
extraordinary meetings in 2007, we discussed in depth all
issues relevant to E.ON. Between meetings, the Board of
Management provided the Supervisory Board with written
reports on business transactions of key importance to E.ON.
Furthermore, the Chairman of the Supervisory Board was
informed on an ongoing basis about all significant business
transactions as well as the development of key financial
?figures.
Corporate Strategy and Planned Acquisitions and DisposalsAn important topic of our discussions was the package of
strategic initiatives, announced in May 2007, for the further
development of the E.ON Group. The package’s main ele-
ments were:
• business management and organizational structure
• growth investments
• climate protection and customer orientation
• earnings growth
• financial strategy.
The Board of Management provided us with comprehensive
information about how further optimizing the way E.ON
manages its businesses would enable it to seize the oppor-
tunities created by the ongoing integration of Europe’s
?energy markets, improve its operating performance, pursue
ambitious climate-protection objectives, sustainably enhance
earnings, and achieve and actively manage a significantly
more efficient capital structure. The Board of Management
also presented a substantial investment program to ensure
that E.ON continues to grow and enhance value well into
the future.
Furthermore, the Board of Management informed us about
the latest developments in E.ON’s initial plan, which was to
acquire all of Spanish energy utility Endesa, and about the
agreement it subsequently reached with Enel and Acciona
under which it will acquire an extensive portfolio of assets,
with operations primarily in Spain, Italy, and France.
Other important topics of our discussions and resolutions
were the activities surrounding E.ON’s entry into the Russian
electricity market and the systematic expansion of its renew-
ables operations. The Board of Management provided us with
detailed information, in particular about the privatization of
the Russian electricity market and the acquisition of OGK-4,
a Russian power producer, as well as the purchase of wind-farm
operators in Europe and North America.
In addition, the Board of Management reported in detail
about a variety of strategically relevant projects, in particular
natural gas storage projects in Austria and Germany, the
acquisition of gas production licenses in the Norwegian North
Sea, the planned acquisition of a stake in the Siberian natu-
ral gas field Yushno Russkoye, the participation in the
construc?tion of the Skanled gas pipeline in Northern
Europe, and the disposal of E.ON’s stake in RAG. We were also
informed about the planned acquisition of Statkraft’s 44.6-
percent stake in E.ON Sverige.
Energy Policy and Regulatory EnvironmentThe Board of Management provided us with detailed infor-
mation about developments in the policy and regulatory
environment of the electricity and gas industries. We dealt
extensively with the relevant legislative and regulatory
processes and their effects on our markets and the E.ON
Group. Key topics were:
• the European Union’s comprehensive package of energy-
policy proposals
• the European Union’s climate policy and the develop-
ment of the EU-wide emissions trading scheme (“ETS”),
including Germany’s national allocation plan for phase
two of the ETS
• the Commission’s third package of internal energy ?mar-
ket legislation, including the proposed unbundling of
network operations
• the network charge approvals processes of the German
Federal Network Agency
16

• the German federal government’s climate and environ-
mental policy
• the amendment of Germany’s law against restraints on
competition.
In this context, we also thoroughly discussed issues sur-
rounding the energy summit initiated by the German chan-
cellor to discuss Germany’s future energy mix.
Financial Situation and Medium-Term Plan We discussed in detail the financial situation of the major
group companies in relation to developments in European
and global energy markets, about which the Board of Man-
agement continually informed us. We also discussed thor-
oughly the E.ON Group’s medium-term plan for the period
2008 through 2010, including planned investments and the
main topics of groupwide human resources. Furthermore,
the Board of Management regularly informed us about the
scope of E.ON’s use of derivative financial instruments.
Corporate Governance We also regularly discussed the further development of
E.ON’s corporate governance policies. We assured ourselves
that in the 2007 financial year E.ON AG complied with the
corporate governance principles contained in the Declara-
tion of Compliance it had issued on December 13, 2006.
E.ON’s Declaration of Compliance with the German Corpo-
rate Governance Code pursuant to Section 161 of the Ger-
man Stock Corporation Act is published on the Internet at
www.eon.com.
Committee Meetings The Supervisory Board’s Executive Committee discussed
reports from the Board of Management in detail at four
meetings. In particular, it prepared the meetings of the
Supervisory Board. It also discussed and passed resolutions
on matters relating to the Board of Management, such as
the appointment of Dr. Teyssen to serve as Vice Chairman of
the Board of Management and the Board of Management’s
compensation. Matters including the final offer for Endesa
were discussed at two joint meetings with the Finance and
Investment Committee.
The Finance and Investment Committee held seven meet-
ings to discuss reports from the Board of Management.
These ?comprehensive reports focused on the takeover offer
for the Spanish utility Endesa, the share buyback program,
gas-storage and wind-power projects in Europe and North
America, the acquisition of a stake in Norwegian gas fields
and in a power producer in Russia. Other topics of detailed
discussion were planned financing measures, the acquisition
of Statkraft’s shares in E.ON Sverige, and the medium-term
plan. At these meetings, the committee also prepared Super-
visory Board ?resolutions on transactions requiring the
Supervisory Board’s approval and/or made such resolutions
itself in accordance with the Supervisory Board’s policies
and ?procedures. Between its meetings, the committee dis-
cussed and approved by means of written correspondence in
three cases: power plant projects in Germany and Russia and
certain financing measures.
At its five meetings the Audit Committee devoted particular
attention to the Financial Statements of E.ON AG, the E.ON
Annual Report, the Interim Reports, accounting issues, risk
management, and E.ON’s dealings with its Independent
Auditor. The committee also thoroughly discussed the rules
for the approval of non-auditing services performed by the
Independent Auditor, E.ON’s insurance strategy, E.ON’s com-
pliance system, and the system to ensure the correctness of
the Annual and Interim Reports, which must be attested to
under German law.
Examination and Approval of the Financial State-ments of E.ON AG, Approval of the ConsolidatedFinancial Statements, Proposed Dividend PricewaterhouseCoopers Aktiengesellschaft, Wirtschafts?prü-
fungsgesellschaft, Düsseldorf, the Independent Auditor cho-
sen by the Annual Shareholders Meeting and appointed by
the Supervisory Board, audited and submitted an un?quali-
fied opinion on the Financial Statements of E.ON AG and the
Combined Group Management Report for the year ended
December 31, 2007. The same applies to the Consolidated
Financial Statements prepared in accordance with Interna-
tional Financial Reporting Standards (“IFRS”). The Consolidat-
ed Financial Statements prepared in accordance with IFRS
exempt E.ON AG from the requirement to publish Consoli-
dated Financial Statements in accordance with the German
Commercial Code. Furthermore, the auditors examined E.ON
AG’s risk detection system. This examination revealed that
the system is fulfilling its tasks. After being subject to a pre-
liminary review by the Audit Committee, the Financial State-
ments, the Combined Group Management Report and the
Independent Auditor’s Report were given to all the members
of the Supervisory Board. The Audit Committee and the
Supervisory Board, at its meeting to approve the Financial
Statements, also reviewed these documents in detail, with the
Independent Auditor present on both occasions.
17To Our ShareholdersSupervisory Board Year in Review Combined Group Management Report Additional Information Market Units Corporate Governance Consolidated Financial Statements Tables and Explanations

Report of the Supervisory Board
At our meeting on March 5, 2008, we examined—with knowl-
edge of, and reference to, the Independent Auditor’s Report
and the results of the preliminary review by the Audit Com-
mittee—the Financial Statements of E.ON AG, the Consolidated
Financial Statements, the Combined Group Management
Report, and the Board of Management’s proposal regarding
the appropriation of net income available for distribution. We
found no reasons for objections regarding these documents.
In addition, the Combined Group Management Report was in
line with the Board of Management’s reports to the Supervi-
sory Board. We approved the Independent Auditor’s Report.
We approved the Financial Statements of E.ON AG prepared
by the Board of Management and the Consolidated Financial
Statements. The Financial Statements are thus adopted. We
agree with the Combined Group Management Report and, in
particular, with its statements concerning E.ON’s future
development.
We examined the Board of Management’s proposal for
appro?pri?ating income available for distribution, which
includes a cash dividend of €4.10 per ordinary share, also
taking into consideration the Company’s liquidity and its
finance and investment plans. The proposal is in the Compa-
ny’s interest with due consideration for the shareholders’
interests. We therefore agree with the proposal for appropriat-
ing net income available for distribution.
Personnel Changes on the Board of Management At the Supervisory Board meeting on May 30, 2007, we reap-
pointed Dr. Wulf H. Bernotat to serve as a member and as
Chairman of the Board of Management for the period May 1,
2008, to April 30, 2010.
At the Supervisory Board meeting on December 17, 2007, we
appointed Dr. Johannes Teyssen to serve as Vice Chairman
of the Board of Management effective March 1, 2008.
Dr. Hans Michael Gaul and Dr. Burckhard Bergmann retired
from the Board of Management at the end of March 2007
and the end of February 2008, respectively. Dr. Bergmann’s
retirement from the E.ON AG Board of Management also
ends his term as Chairman of the Board of Management of
E.ON Ruhrgas AG. We would like to take this opportunity to
again thank Dr. Gaul and Dr. Bergmann for their excellent
service to the E.ON Group. They played key roles in the trans-
formation of E.ON into a focused power and gas company
and dedicated themselves to the Company’s successful
development.
Personnel Changes on the Supervisory BoardIn 2007, there were personnel changes on the Supervisory
Board among the shareholder representatives and among
the employee representatives.
Effective June 30, 2007, Dr. Gerhard Cromme ended his service
on the Supervisory Board and on the Finance and Investment
Committee. E.ON’s transformation into a leading international
energy company benefited from Dr. Cromme’s wise counsel
and business acumen. We would like to take this opportunity
to again thank him for his dedicated service.
We were pleased to be able to have Dr. Theo Siegert join the
Supervisory Board as Dr. Cromme’s successor effective July 4,
2007. Prof. Dr. Ulrich Lehner was elected as the new member
of the Finance and Investment Committee.
Seppel Kraus ended his service on the Supervisory Board
effective July 31, 2007. We would like to take this opportunity
to again thank him for his dedication and for the construc-
tive way he approached his Supervisory Board duties. As his
successor, Sven Bergelin was appointed to the Supervisory
Board as an employee representative effective August 1,
2007. Ulrich Otte, who ended his service on the Supervisory
Board on December 31, 2006, was succeeded by Hans Wollitzer
as an employee representative effective January 4, 2007, in
accordance to an order issued by the commercial court. At
our meeting on March 6, 2007, we elected Gabriele Gratz to
succeed Mr. Otte as a member of the Audit Committee.
The Supervisory Board wishes to thank the Board of Man-
agement, the Works Councils, and all the employees of the
E.ON Group for their dedication and hard work.
Düsseldorf, March 5, 2008
The Supervisory Board
Ulrich Hartmann
Chairman
18

19To Our ShareholdersSupervisory Board Year in Review Combined Group Management Report Additional Information Market Units Corporate Governance Consolidated Financial Statements Tables and Explanations
Supervisory Board
Honorary Chairman
Prof. Dr. Günter VogelsangDüsseldorf
Supervisory Board
Ulrich HartmannDüsseldorf
Chairman
Hubertus SchmoldtChairman of the Board of Management,
Industriegewerkschaft Bergbau,
Chemie, Energie, Hanover
Deputy Chairman
Dr. Karl-Hermann BaumannMunich
Sven BergelinDirector, National Energy Working Group,
Unified Service Sector Union, ver.di,
Berlin
(since August 1, 2007)
Dr. Rolf-E. BreuerFrankfurt am Main
Dr. Gerhard CrommeChairman of the Supervisory Board,
ThyssenKrupp AG, Düsseldorf
(until June 30, 2007)
Gabriele GratzChairwoman of the Works Council,
E.ON Ruhrgas AG, Essen
Wolf-Rüdiger HinrichsenDeputy Chairman of the Combined
Works Council, E.ON AG, Düsseldorf
Ulrich HockerGeneral Manager, German
Investor Protection Association,
Düsseldorf
Eva KirchhofDiploma Physicist, Munich
Seppel KrausLabor Union Secretary, Munich
(until July 31, 2007)
Prof. Dr. Ulrich LehnerPresident and Chief Executive Officer,
Henkel KGaA, Düsseldorf
Dr. Klaus LiesenHonorary Chairman of the Supervisory
Boards, E.ON Ruhrgas AG, Essen, and
Volkswagen AG, Wolfsburg
Erhard OttMember of the Board of Management,
Unified Service Sector Union, ver.di,
Berlin
Hans PrüferChairman of the Combined Works
Council, E.ON AG, Düsseldorf
Klaus Dieter RaschkeChairman of the Combined Works
Council, E.ON Energie AG, Hanover
Dr. Henning Schulte-NoelleChairman of the Supervisory Board,
Allianz SE, Munich
Dr. Theo SiegertManaging Partner, de Haen-Carstanjen
& Söhne, Düsseldorf
(since July 4, 2007)
Prof. Dr. Wilhelm SimsonMunich
Gerhard SkupkeChairman of the Central Works Council,
E.ON edis AG, Fürstenwalde an der Spree
Dr. Georg Freiherr von WaldenfelsFormer Minister of State, Attorney,
Munich
Hans WollitzerChairman of the Central Works Council,
E.ON Energie AG, Munich
(since January 4, 2007)
Supervisory Board Committees
Executive CommitteeUlrich Hartmann, Chairman
Wolf-Rüdiger Hinrichsen
Hubertus Schmoldt
Dr. Henning Schulte-Noelle
Audit CommitteeDr. Karl-Hermann Baumann,
Chairman
Gabriele Gratz (since March 6, 2007)
Ulrich Hartmann
Klaus Dieter Raschke
Finance and Investment CommitteeUlrich Hartmann, Chairman
Dr. Gerhard Cromme (until June 30, 2007)
Wolf-Rüdiger Hinrichsen
Prof. Dr. Ulrich Lehner (since July 1, 2007)
Hubertus Schmoldt
Nomination Committee (since December 17, 2007)
Ulrich Hartmann
Prof. Dr. Ulrich Lehner
Dr. Henning Schulte-Noelle

Year in Review20
AprilE.ON introduces a new Board of Management structure to
further enhance the E.ON Group’s market orientation and
pave the way for further growth. In addition to a Chief Exec-
utive Officer a Chief Financial Officer, and a Chief Human
Resources Officer, the Board of Management now has a Chief
Operating Officer and a member responsible for Corporate
Development/New Markets.
E.ON signs an agreement with Enel, an Italian energy utility,
and Acciona, a Spanish construction company, to end the
impasse in the attempted takeover of Endesa. E.ON agrees
not to acquire a minority stake in Endesa. In exchange, Enel
and Acciona agree to make a takeover bid for Endesa. When
the two companies acquire control of Endesa, E.ON will have
the opportunity to acquire an extensive portfolio of assets
including operations in Spain, Italy, and France. The transac-
tion is expected to close in 2008.
The E.ON Energy Research Center, a partnership between E.ON
and RWTH Aachen University in western Germany, begins
operations. E.ON will provide the center with about €40 mil-
lion in funding for the next ten years. Energy efficiency and
climate protection are at the center of E.ON’s enhanced
research and development effort.
MayE.ON presents a package of strategic initiatives and a €60 bil-
lion expanded investment program. E.ON further optimizes
its organizational structure and the way it manages its
business so that it can better seize the opportunities created
by the ongoing integration of Europe’s energy markets,
improve its performance, sustainably enhance earnings, and
achieve a significantly more flexible capital structure.
JanuaryA storm causes widespread damage to the electric distribution
system in southern Sweden, leaving about 170,000 E.ON cus-
tomers without power. Through the hard work and dedication
of E.ON technicians, service is quickly restored in most areas.
E.ON’s upstream natural gas business achieves another
success when E.ON Ruhrgas is awarded three more licenses
to explore for gas in the Norwegian North Sea. One of the
licenses names E.ON Ruhrgas Norge as the operator.
FebruaryE.ON spurs retail competition in Germany by launching a
new subsidiary called E WIE EINFACH (“E as in Easy”). It’s
Germany’s first energy retailer to offer economically priced
power and gas service to homes and small businesses
nationwide. At year end, the company already has more
than 450,000 customer accounts.
As part of E.ON’s package of initiatives to promote competition,
E.ON Ruhrgas holds its first auction of natural gas storage
capacity, auctioning a total of 200 million cubic meters of
capacity at facilities in Germany.
+ + + Security of Supply + + + Climate Protection + + + Growth + + + Market-Oriented Organization + + + Competition + + + Optimi

21To Our ShareholdersSupervisory Board Year in Review Combined Group Management Report Additional Information Market Units Corporate Governance Consolidated Financial Statements Tables and Explanations
AugustE.ON expands into new markets and grows its renewables
business by acquiring ENERGI E2 Renovables Ibéricas, a wind-
farm operator with about 260 megawatts of generating
capacity in Spain and Portugal, from Dong Energy, a Danish
energy company.
E.ON files to delist its American depositary receipts from the
New York Stock Exchange and deregister and end its reporting
obligations with the U.S. Securities and Exchange Commission.
The delisting takes effect after the close of trading on Sep-
tember 7, 2007.
SeptemberE.ON is admitted into the Dow Jones Sustainability Index,
the world’s leading index of its type, making E.ON stock even
more attractive to investors who look for companies with a
strong commitment to corporate responsibility.
E.ON decides on Wilhelmshaven, a port city in northwest
Germany, as the site where it will build the world’s first coal-
fired power plant with a thermal efficiency of more than
50 percent. The plant, part of innovate.on, will have an
installed capacity of 500 megawatts, cost about €1 billion
to build, and enter service in 2014. Key to the plant’s suc-
cess are materials that can withstand steam temperatures
of 700 degrees Centigrade (about 1,300 degrees Fahrenheit).
JuneE.ON divests its last remaining non-core asset by signing an
agreement to sell its 50.1-percent stake in ONE GmbH, an
Austrian telecommunications company, to a consortium con-
sisting of France Télécom und Mid Europa Partners, a private
equity firm.
E.ON makes an important contribution to the future of climate
protection by becoming Europe’s first company to test a
process for capturing up to 90 percent of the carbon dioxide
contained in conventional power plant emissions. The test,
conducted in Sweden, is part of a research initiative called
innovate.on.
E.ON begins a share buyback program under which it will
repurchase around €7 billion of its own stock by the end of
2008, about half of this figure in 2007. The purpose of the
program is to optimize E.ON’s capital structure.
JulyE.ON proposes a package of reforms to harmonize and
enhance the efficiency and transparency of the EU Emission
Trading Scheme (“ETS”). Optimizing the ETS is a crucial step
towards enabling the EU to achieve its emission-reduction
targets while maintaining its economic competitiveness.
zed Capital Structure + + + Security of Supply + + + Climate Protection + + + Growth + + + Market-Oriented Organization + + + Competition + + +
Year in Review22
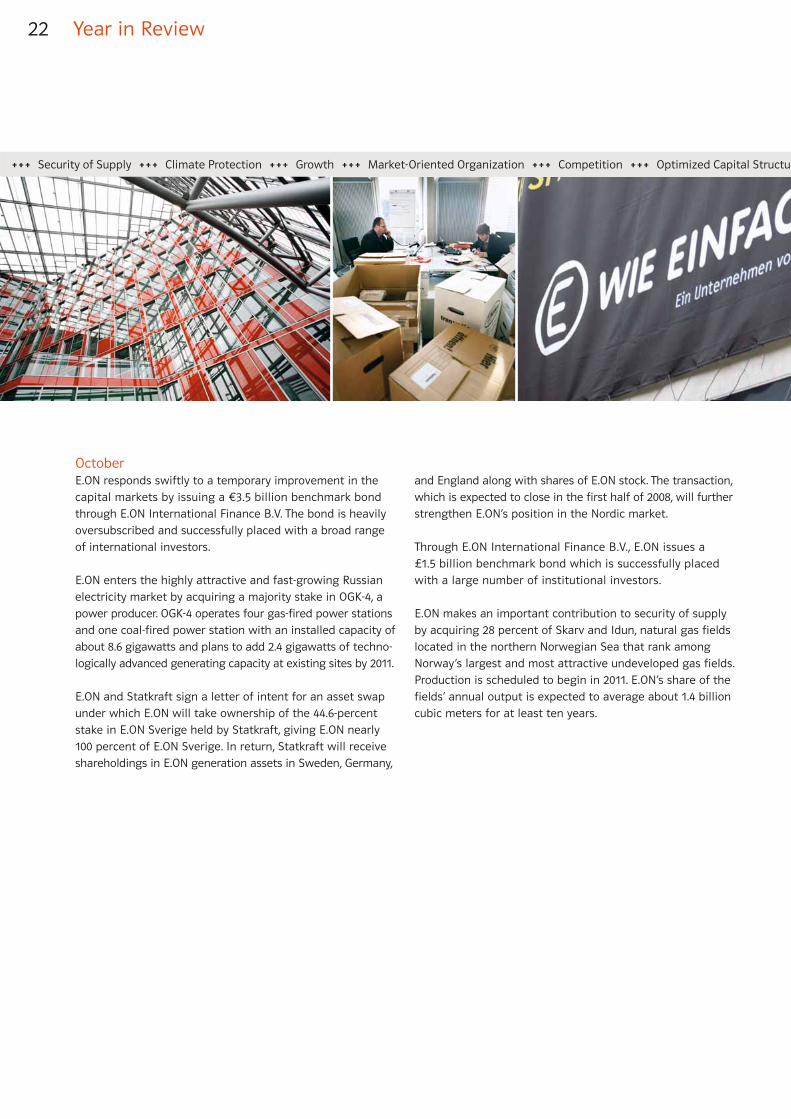
OctoberE.ON responds swiftly to a temporary improvement in the
capital markets by issuing a €3.5 billion benchmark bond
through E.ON International Finance B.V. The bond is heavily
oversubscribed and successfully placed with a broad range
of international investors.
E.ON enters the highly attractive and fast-growing Russian
electricity market by acquiring a majority stake in OGK-4, a
power producer. OGK-4 operates four gas-fired power stations
and one coal-fired power station with an installed capacity of
about 8.6 gigawatts and plans to add 2.4 gigawatts of techno-
logically advanced generating capacity at existing sites by 2011.
E.ON and Statkraft sign a letter of intent for an asset swap
under which E.ON will take ownership of the 44.6-percent
stake in E.ON Sverige held by Statkraft, giving E.ON nearly
100 percent of E.ON Sverige. In return, Statkraft will receive
shareholdings in E.ON generation assets in Sweden, Germany,
and England along with shares of E.ON stock. The transaction,
which is expected to close in the first half of 2008, will further
strengthen E.ON’s position in the Nordic market.
Through E.ON International Finance B.V., E.ON issues a
£1.5 billion benchmark bond which is successfully placed
with a large number of institutional investors.
E.ON makes an important contribution to security of supply
by acquiring 28 percent of Skarv and Idun, natural gas fields
located in the northern Norwegian Sea that rank among
Norway’s largest and most attractive undeveloped gas fields.
Production is scheduled to begin in 2011. E.ON’s share of the
fields’ annual output is expected to average about 1.4 billion
cubic meters for at least ten years.
+ + + Security of Supply + + + Climate Protection + + + Growth + + + Market-Oriented Organization + + + Competition + + + Optimized Capital Structur

NovemberE.ON, ThyssenKrupp, and RWE, which together own 90 percent
of RAG’s stock, sell their share packets to the buyer, RAG
Stiftung, for a symbolic price of €1 each.
E.ON successfully concludes an increase of its existing syndi-
cated credit facility from €10 billion to €15 billion. The €5 billion
increase is placed within just a few weeks and is significantly
oversubscribed despite a difficult market environment.
DecemberE.ON acquires Airtricity Inc. and Airtricity Holding (Canada)
Ltd., the North American activities of Airtricity Holding Ltd.,
an Ireland-based wind-farm operator. These activities consist
of about 250 megawatts of installed wind power capacity.
This increases E.ON’s wind power capacity to around 900 mega-
watts, making E.ON one of the world’s largest wind-farm
operators.
re + + + Security of Supply + + + Climate Protection + + + Growth + + +
Whether it’s entering new markets, expanding existing
market positions, or growing organically, growth is
essential to our business. And it has to create value.
Like our 60 billion investment program.
+ + + Growth + + +

24

E.ON enters the Russian electricity market.Russia has one of the world’s largest electricity markets. And with annual growth of 5 percent,
it’s also one of the fastest growing. The acquisition OGK-4 gives us a leading position in this
important market.
OGK-4 operates four gas-fired power stations and one coal-fired power station with an aggre-
gate installed capacity of 8,600 megawatts. By investing 4.6 billion for 76.1 percent of OGK-4,
we acquired an asset portfolio that’s among the best and most efficient in Russia, consisting of
relatively new and technologically advanced generating units with high load factors. Moreover,
they’re located in the fastest-growing regions of the country. That’s what we call a value-enhanc-
ing investment.
More than 2,400 miles separate OGK-4’s westernmost and easternmost power stations. That gives
an indication of Russia’s vast size. And its market potential. At 4,800 megawatts of capacity,
Surgutskaya 2 in Siberia is already one of the world’s biggest power stations. By 2010, it will be
800 megawatts bigger. Altogether, 2,400 megawatts of capacity will be added to OGK-4’s existing
facilities over the next few years. It’s part of our plan to work with OGK-4 to actively seize oppor-
tunities for organic growth in Russia’s rapidly expanding—and highly promising—electricity market.
Surgutskaya 2 has4,800 megawatts ofinstalled capacity,making it one of thelargest power stationsin the world.
25
Добро пожаловать в компанию «Э.ОН»! From zero to 8,600

Combined Group Management Report
Corporate Profile and Operating Environment
Corporate Structure and Operations in 2007
E.ON is one of the world’s largest investor-owned energy
services providers. Our roughly 88,000 employees generated
68.7 billion in sales in 2007. E.ON operates along the entire
value chain in power and gas. These operations are organized
in market units in line with the structure of our respective
target markets. We are focused on our target markets:
Central Europe, the United Kingdom, Northern Europe, and
the Midwestern United States. In 2008, we have added, or
intend to add, two geographically segmented market units
(Russia and Italy) and two functionally segmented market
units (Climate & Renewables and Energy Trading). The result-
ing changes to our market unit structure and segment report-
ing are discussed in the Forecast on page 68.
The Corporate Center’s main tasks are to manage E.ON as
an integrated energy company, chart E.ON’s strategic course,
manage and secure necessary financing, manage business
issues that transcend individual markets, manage risk, and
continually optimize the group’s business portfolio. We take
a value-oriented management approach aimed at improving
our competitiveness and delivering profitable growth.
The Corporate Center/New Markets segment consists of
Düsseldorf-based E.ON AG and the ownership interests man-
aged directly by E.ON AG itself. The new market units
26
Adjusted EBIT up 10 percentCash provided by operating activities above prior-year levelManagement to propose raising dividend to 4.10Higher adjusted EBIT expected for 2008
E.ON Group1
in millions
Sales
Adjusted EBITDA
Adjusted EBIT
Net income
Net income attributable toshareholders of E.ON AG
Adjusted net income
ROCE (in %)
Value added
Cash provided by operating activ-ities of continuing operations
Economic net debt (at year end)
Investments
Employees (at year end)
2006
64,091
11,724
8,356
6,082
5,586
4,682
13.8
2,916
7,161
–18,233
5,037
80,612
+/– %
+7
+6
+10
+27
+29
+9
+0.72
+17
+22
–32
+124
+9
2007
68,731
12,450
9,208
7,724
7,204
5,115
14.5
3,417
8,726
–24,138
11,306
87,815
1All subsequent commentary for the E.ON Group also applies to E.ON AG.2Change in percentage points.

(except Energy Trading) will also be allocated to this seg-
ment until the end of 2008. In 2007, this applies to our major-
ity stakes in OGK-4 (a Russian power producer), ENERGI E2
Renovables Ibéricas (a wind-farm operator in Spain), and Air-
tricity (a wind-farm operator in North America), all of which
were acquired in the second half of 2007. We also allocate
consolidation effects at the group level to this segment.
The lead companies of the Central Europe, Pan-European Gas,
U.K., Nordic, and U.S. Midwest market units are responsible
for managing our target markets. Business units manage
day-to-day operations.
Based in Munich, Germany, E.ON Energie is the lead company
of the Central Europe market unit, which is responsible for
our electricity business and downstream gas business in
Central Europe.
With operations mainly in Germany, the Netherlands, and Italy,
the Central Europe West Power and West Gas businesses
engage in:
• electric generation at conventional, nuclear, and renew-
able-source facilities
• electric transmission via high-voltage and ultrahigh-volt-
age wires networks
• regional distribution of electricity, gas, and heat
• power trading and electricity, gas, and heat sales.
The Central Europe East business consists of our sharehold-
ings in regional electric and gas distributors in the Czech
Republic, Slovakia, Hungary, Bulgaria, and Romania.
In 2007, E.ON Energie supplied power and gas to about
17 million customers in and outside Germany. This figure
includes customers served by key minority shareholdings.
Essen-based E.ON Ruhrgas is the lead company of the Pan-
European Gas market unit and responsible for managing our
natural gas business in Europe, which is vertically integrated
along the value chain. E.ON Ruhrgas E&P operates upstream
in gas exploration and production. The midstream business
combines gas procurement and sales and manages the
entire technical infrastructure. E.ON Gastransport provides
gas transport services. E.ON Ruhrgas International and Thüga
are responsible for managing downstream shareholdings.
In Germany Thüga’s portfolio consists primarily of minority
stakes in regional utilities. In Italy Thüga has, up till now,
mainly acquired majority stakes in regional gas utilities.
E.ON Ruhrgas International mainly has ownership interests
in energy utilities in other European countries, primarily in
Eastern Europe.
Coventry-based E.ON UK is the lead company of our U.K.
market unit. It runs our energy business in the United King-
dom. The regulated business consists of Central Networks,
which operates an electricity distribution business. The non-
regulated business includes the Energy Wholesale, Retail,
and Energy Services businesses. The Energy Wholesale busi-
ness covers activities including power generation, energy
trading, operation and maintenance of combined heat and
power plants, development and operation of renewable
energy sites, and power station development and operation.
The Retail business includes sales of electricity and gas ser-
vices to residential, business, and industrial customers. As of
December 31, 2007, E.ON UK supplied approximately 8 million
customer accounts, of which 7.4 million were residential and
0.6 million were business customer accounts.
Based in Malmö, Sweden, E.ON Nordic is the lead company
of the Nordic market unit. E.ON Nordic currently operates
through E.ON Sverige, an integrated energy company in
which it holds a majority stake. E.ON Sverige operates pri-
marily in Sweden but also operates on a smaller scale in
Denmark and Finland.
Day–to-day operations consist of power generation, heat
production, power and gas distribution, power, gas, and heat
sales, and energy trading. At year end 2007, E.ON Nordic sup-
plied roughly 1 million customer accounts.
Our U.S. Midwest market unit primarily operates our regu-
lated utility business in Kentucky, USA. The regulated utility
business is composed of two companies, Louisville Gas and
Electric Company (“LG&E”) and Kentucky Utilities Company
(“KU”), which are owned and managed by E.ON U.S., Louisville,
Kentucky, USA. LG&E and KU both operate vertically integrated
businesses where customers benefit from combined electric
generation, transmission, distribution, and retail services.
In addition, LG&E provides natural gas distribution services
within its customer territory.
Together, LG&E and KU distribute electricity to approximately
0.9 million customers, predominantly in Kentucky. They serve
several classes of customers including residential, commer-
cial and industrial, as well as municipalities. LG&E distributes
natural gas to approximately 0.3 million customers in
Kentucky.
The non-regulated business consists primarily of the Argen-
tine gas distribution operations, in which E.ON U.S. owns
interests in two companies.
27To Our ShareholdersSupervisory Board Year in Review Combined Group Management Report Additional Information Market Units Corporate Governance Consolidated Financial Statements Tables and Explanations

Corporate Profile and Operating Environment28
Corporate CenterE.ON AG, Düsseldorf
E.ON Group: Market Units, Lead Companies, Businesses, and Main Facilities1
Central EuropeE.ON Energie AGMunich, 100%
Central Europe West PowerCentral Europe West GasCentral Europe EastOther/Consolidation
Up-/MidstreamDownstreamShareholdingsOther/Consolidation
Regulated BusinessNon-regulated Business
Other/Consolidation
Regulated BusinessNon-regulated Business
Other/Consolidation
Regulated BusinessNon-regulated Business
GermanyMunichHanoverLandshutBayreuthRegensburgHelmstedtQuickbornKasselFürstenwalde an der SpreeErfurtPaderbornCologne
NetherlandsThe HagueVoorburg
HungaryBudapest
Czech RepublicČeské Budějovice
ItalyMilanDalmine
SlovakiaBratislava
RomaniaBacau|aşi
BulgariaVarnaGorna
GermanyEssenMunichNurembergSaarbrückenFrankfurt/MainErfurtEmstekFriedeburg/Etzel
HungaryBudapest
RomaniaTârgu Mures
FinlandEspoo
LatviaRiga
LithuaniaVilnius
SlovakiaBratislava
RussiaMoskow
United KingdomLondonAberdeen
NorwayStavanger
ItalyVerona
SwitzerlandZug
United KingdomCoventryNottingham
SwedenMalmö
FinlandHelsinki
USALouisvilleLexington
Pan-European GasE.ON Ruhrgas AGEssen, 100%
U.K.E.ON UK plcCoventry, 100%
NordicE.ON Nordic ABMalmö, 100%
U.S. MidwestE.ON U.S. LLCLouisville, 100%
1Corporate structure through December 31, 2007.

29To Our ShareholdersSupervisory Board Year in Review Combined Group Management Report Additional Information Market Units Corporate Governance Consolidated Financial Statements Tables and Explanations
Sales Markets and Market Positions
Central EuropeNo. 2 in power generation
No. 1 in power and gas sales
Pan-European GasNo. 1 in gas supply in Europe
U.K.No. 2 in power generation
No. 3 in power and gas sales
NordicNo. 4 in power generation
No. 3 in power sales
U.S. MidwestNo. 1 in power generation in Kentucky
No. 1 in power and gas sales in Kentucky
New Markets By acquiring OGK-4 in 2007, E.ON has become one of Russia’s
leading thermal power producers. By acquiring Airtricity
North America and ENERGI E2 Renovables Ibéricas, E.ON
now ranks among the world’s biggest wind-power producers.
Strategy
Thanks to our targeted growth and integration strategy,
E.ON ranks among Europe’s leading integrated power and
gas companies.
The foundation of our industry leadership is our integrated
business model with operations along the entire value
chain.
• We’re vertically integrated, with operations upstream
(power generation and natural gas production), mid-
stream (wholesale), and downstream (end-customer
supply), enabling us to optimize our business while at
the same time managing risks.
• We’re horizontally integrated in order to leverage power-
gas convergence (in particular due to the increasingly
important role natural gas plays in power generation
and in end-customer supply), providing us with synergy
and growth potential.
• The expansion of the European Union and the regional
integration of our operations offer additional growth
potential and, increasingly, opportunities to optimize our
risk position and asset portfolio.
E.ON is therefore superbly positioned to meet the new chal-
lenges of Europe’s changing energy marketplace.
Energy Policy and Regulatory Environment
EuropeIn the spring of 2007, the European Council of the Heads of
State or Government, under Germany’s presidency, endorsed
an integrated European energy and climate policy. It includes
legislation for the completion of the internal energy market,
an ambitious climate-protection package, and targets for expand-
ing renewable electricity and enhancing energy efficiency.
In September 2007, the Commission adopted a third package
of liberalization legislation. Its purpose is to give new momen-
tum to Europe’s internal market for electricity and natural gas.
It includes far-reaching structural measures which include
proposals for the ownership unbundling of electricity and gas
transmission networks from generation/import and supply
as well as proposals for the regulation of the generation and
wholesale market.
In addition, in early 2007 the European Council agreed on
comprehensive climate-protection targets for the year 2020.
The Council adopted the binding target proposed by the
Commission that the Community reduce its total green-
house-gas (”GHG”) emissions by at least 20 percent by 2020
compared with 1990 levels. Another target is for the Commu-
nity to expand its renewables capacity such that it meets
20 percent of its electricity needs from renewable sources
by 2020.
The Council also aims to significantly increase the EU’s ener-
gy efficiency, endorsing the Commission’s estimate that the
Community can reduce its energy consumption by 20 per-
cent by 2020.
The member states are left to decide on their own energy
mix. In view of nuclear energy’s significant contribution to
the EU’s energy supply, the Council emphasized the need for
a broad-based dialog on the opportunities and risks of
nuclear energy in the Community.

Corporate Profile and Operating Environment
GermanyAgainst the background of EU climate-protection targets, in
August 2007 the German federal cabinet adopted an Inte-
grated Climate Protection and Energy Package aimed at set-
ting global standards. To implement the package’s central
policy objectives, the federal cabinet adopted a comprehen-
sive set of initiatives on December 5, 2007.
Their central objective is to reduce Germany’s GHG emis-
sions by 40 percent by 2020 compared with 1990 levels by,
among other strategies, enhancing energy efficiency and
increasing the use of low-emission generation technologies.
Another objective is for the country to derive 25 to 30 per-
cent of its electricity from renewables.
The Emissions Trading directive requires each EU member
state to submit a national allocation plan (NAP) for emission
allowances to the European Commission for approval. Ger-
many’s NAP for phase two of emission-allowance trading, as
approved by Brussels, took effect in August 2007 as the Ger-
man Allocation Law 2012. This law reduces the total alloca-
tion for phase two (2008–2012) compared with phase one.
The annual allocation to participants in emission trading in
Germany for the period 2008–2012 was cut by nearly 10 per-
cent to 453 million metric tons of carbon dioxide.
Network Fee Approvals ProcessIn early July and early October 2007, respectively, electricity
and natural gas network operators were required, for the
second time, to submit their network charges to the appro-
priate regulatory agency for approval. The second round will
set network fees for 2008 and thus serve as the basis for the
incentive-based regulation system which begins in 2009. As
in the first round, there have been delays in the issuing of
rulings. The Federal Network Agency, for example, has only
issued a few rulings for electricity networks owned by com-
petitors. The first rulings for E.ON Energie subsidiaries are
due soon. Delays are also expected in the gas sector, for
which the approvals process began three months later.
Incentive-Based RegulationGermany’s incentive regulation ordinance took effect in
November 2007, with incentive regulation to begin on Janu-
ary 1, 2009. It is now up to the Federal Network Agency and
state-level regulatory agencies to design and implement an
incentive-based regulation system. The Federal Network
Agency has the authority, among other things, to define the
allowed return on equity, the parameters of benchmarking,
and the investment budgets for network expansion.
Gas Network AccessIn the first half of 2006, Germany’s natural gas industry
designed a cooperation agreement on the future modalities
of network access. The German Federal Network Agency
ruled on November 17, 2006, that one of the two types of
access contained in the cooperation agreement—single
booking—contravenes German law. This made it necessary
to revise the cooperation agreement. The agency approved
the revised agreement, dated June 1, 2007, which took effect
on October 1, 2007.
Since the beginning of the gas industry fiscal year on Octo-
ber 1, 2007, transport customers may only use the other
type of network access contained in the cooperation agree-
ment—the two-contract model, which consists of one entry
and one exit contract—to reach end-customers. Network
access contracts that were concluded after the cooperation
agreement took effect (July 19, 2006) were changed to the
two-contract model by April 1, 2007. All earlier network access
contracts were so modified by October 1, 2007.
The two-contract model is applied in discrete geographical
areas of Germany’s gas transport pipeline system called
market areas. At the time the discussions started, Germany
had more than 20 market areas within which capacity could
be freely aggregated. The Federal Network Agency and policy-
makers called for this number to be reduced significantly.
E.ON Gastransport, reduced the number of its market areas
from four to two: one for low-caloric (L) and one for high-
caloric (H) gas. Market area operators are currently holding
negotiations on further combinations of market areas to
take effect on October 1, 2008, at which time it is anticipated
that Germany will have about ten market areas.
30

31To Our ShareholdersSupervisory Board Year in Review Combined Group Management Report Additional Information Market Units Corporate Governance Consolidated Financial Statements Tables and Explanations
In late 2007, the German Federal Network Agency initiated
consultation proceedings with the aim of fundamentally
reforming the gas industry’s control- and balancing-energy
market. The agency aims for the reform to take effect by
October 1, 2008. Energy industry trade associations are cur-
rently in negotiations with the agency to define the target
model for the reforms.
Revisions to German Antitrust LawIn December 2007, Germany enacted amendments to its law
against restraints on competition. Section 29 of the amended
law contains provisions that considerably broaden antitrust
oversight in Germany’s electricity and natural gas markets.
Under the amended provisions, a supplier can be accused of
anticompetitive behavior if it charges prices that are less
favorable than other suppliers or if a supplier holding a
dominant position in an energy market charges prices that
disproportionately exceed its costs.
In contrast to the EU’s objective of spurring competition,
Germany’s revised antitrust law could subject hitherto
unregulated sectors like power generation and trading/mar-
keting to stricter—and non-market-oriented—state control.
Competition InitiativesIn 2006, E.ON launched a number of initiatives to spur energy-
market competition in Germany and Europe. Among them
was a series of rapid-response measures along the entire value
chain which we fully implemented in 2007. These measures
included the expansion of cross-border power transfer capac-
ity between Germany and neighboring countries, the publi-
cation of key information about our available generating
capacity, the marketing of our generating capacity in Germany
via the European Energy Exchange in Leipzig, and the reduc-
tion in the number of market areas in E.ON Gastransport’s
gas transmission system from four to two: one for H gas and
one for L gas. As part of our effort to enhance transparency,
in 2007 we began publishing detailed information about our
generation fleet in Germany at www.eon-schafft-transparenz.de.
The Website at this URL is also in English.
Economic Environment
The global economy was in very robust condition in 2007
when financial markets became less stable in the summer in
the wake of the mortgage-lending crisis in the United States.
According to an estimate by the German Council of Economic
Experts (“GCEE”), global gross domestic product (“GDP”)
increased by 3.7 percent in real terms, slightly behind the
2006 growth rate of 3.9 percent. Oil prices, which at times
nearly reached $100 a barrel, continued to dampen economic
growth and fuel fears of inflation. Expansion differed by
region, with significant economic growth in China and other
emerging countries, weaker growth in Japan, and slightly
flatter growth in the European Union. The GCEE estimates
that the U.S. economy grew at a markedly slower pace in
2007 as a result of the financial crisis.
Eurozone economic expansion was very solid in 2007, with
support from investment and slightly weaker consumption.
Growth in the United Kingdom and Sweden was driven by
consumption and investment with less impetus from exports.
According to the GCEE, the dynamic economic growth in
new EU member states continued in 2007. Poland benefited
from buoyant demand for investment goods, the Czech
Republic from solid consumer demand, and Slovakia from
significantly higher exports. Economic growth was weaker in
Germany due to the VAT increase that took effect at the start
of the year but did not stall, as some observers had feared.
The effect of high global energy prices on the domestic
economy was mitigated by the simultaneous depreciation
of the U.S. dollar.
Germany
Annual change in percent
2007 GDP Growth in Real Terms
2.5
France 1.9
1.8
3.0
2.7
2.9
2.1
2.0
Italy
Spain
Eurozone
UnitedKingdom
2.6
Sweden
EU16
EU27
USA
Japan
3.3
3.7
0 1.0 2.0 3.0 4.0 5.0
Sources: German Council of Economic Experts (November 2007),German Federal Statistical Office.

Energy Industry
Consumption of primary energy in Germany, our most impor-
tant sales market, declined by 5 percent year on year to
472 million metric tons of coal equivalent (“MTCE”) due to
milder temperatures. Consumption of petroleum fell by 10 per-
cent to 160 MTCE. Petroleum remained by far Germany’s most
important energy source, accounting for 33.8 percent of energy
consumed. Natural gas consumption declined by 4.5 percent
to 107 MTCE. Slightly less natural gas was used to generate
electricity. The industrial segment also consumed less natural
gas than in the previous year. Consumption of hard coal rose
by 1.5 percent to 66.6 MTCE due to higher demand in the elec-
tricity and steel industries. Lignite consumption increased by
about 3 percent to 55.2 MTCE due to higher demand from
power producers. Nuclear power production declined by 16 per-
cent to 52.3 MTCE because some power stations were not, or
were only partially, in service. Hydroelectric generation rose
slightly. Generation from wind and from other energy sources
increased by 30 percent and 18 percent, respectively. Renew-
ables’ share of primary energy consumption rose from 5.4 per-
cent in 2006 to 6.6 percent in 2007.
Total gross generation in Germany declined by 0.8 percent,
from 636.8 billion kilowatt-hours (“kWh”) in 2006 to 631.5 bil-
lion kWh in 2007. Nuclear and petroleum’s share of genera-
tion was significantly lower, whereas more electricity was
produced from lignite, hard coal, natural gas, and renewables.
Electricity consumption in England, Wales, and Scotland reported
provisionally by the National Grid was 337.7 billion kWh dur-
ing 2007, which is down on 2006 consumption (350 billion KWh).
Gas consumption was 1,053 billion kWh, representing a slight
increase from the prior year.
The Nordic region consumed about 3 billion kWh more elec-
tricity than in the previous year. Consumption was lower at
the beginning of 2007 due to considerably warmer weather
compared with 2006, when the Nordic region experienced a
cold winter. From the beginning of the summer and through-
out the remainder of 2007, temperatures were closer to nor-
mal, and demand increased continually compared with 2006,
a year with warmer-than-normal temperatures during this
period. Net imports to Nordic from surrounding countries
decreased to 2.7 billion kWh during the year compared with
a net import of over 11 billion kWh in the prior year. Net
exports to Germany increased to 7.3 billion kWh compared
with 1.5 billion kWh in 2006. The hydrological situation dur-
ing 2007 was well above normal. The year started and ended
with almost the same reservoir levels, about 7 billion kWh
above normal.
Corporate Profile and Operating Environment32
Percentages
Petroleum
Natural gas
Hard coal
Lignite
Nuclear
Hydro, wind
Other, including net power imports/exports
Total
2007
33.8
22.7
14.1
11.7
11.1
1.5
5.1
100.0
2006
35.5
22.6
13.2
10.8
12.5
1.3
4.1
100.0
Source: AG Energiebilanzen (preliminary figures).
2007 Primary Energy Consumption in Germany by Energy Source
Source: BDEW (preliminary figures).
Percentages Total 631.5 billion kWh
2007 Net Generation in Germany by Energy Source
22.2
24.7
22.4
Nuclear
Lignite
Hard coal
11.6
1.3
4.3
6.3
7.2
Natural gas
Petroleum
Hydro
Wind
Other

Electricity consumption in the Midwestern United States
increased by approximately 3.5 percent in 2007 due to
increased demand caused by colder-than-normal weather in
February and warmer weather during the summer months.
Natural gas consumption increased by approximately 6 per-
cent in 2007 due primarily to higher residential and commer-
cial volumes caused by colder weather in early 2007.
Energy Price Developments
Throughout 2007, European power and natural gas markets
were driven by three main factors:
• oil, coal, and CO2 allowance prices
• warm weather
• the hydrological balance in the Nordic region.
Although prices declined on most European power and gas
markets in the first weeks of 2007, they rose again starting
in March in response to higher coal, oil, and phase-two CO2
allowance prices.
Higher coal prices sent German power prices to 62 per
megawatt-hour in October 2007, a new all-time high. At the
end of the year, German prices stood at 61 per megawatt-
hour (“MWh”).
33To Our ShareholdersSupervisory Board Year in Review Combined Group Management Report Additional Information Market Units Corporate Governance Consolidated Financial Statements Tables and Explanations
The price of Brent crude oil increased significantly beginning
in January 2007 due to renewed tension in the Middle East
and Nigeria and lower oil-product inventories in the United
States. The remarkable depreciation of the U.S. dollar
against other currencies also contributed to the strong rise
in dollar-denominated Brent crude oil prices. At the end of
December 2007, Brent was quoted at close to $96 per barrel,
about $46 per barrel higher than in January 2007.
Coal prices have moved continually higher in 2007, particu-
larly in the last two quarters. In December, coal was selling
for $117 per metric ton, the highest level since June 2004. The
increase was mainly due to sustained strong demand in the
Pacific market, high freight rates (which account for about
30 percent of the price of coal), and the weaker dollar, which
improves the purchasing power of local currencies.
Phase-two CO2 allowance prices increased in response to
high oil and gas prices compared to more stable hard coal
prices and the European Commission’s decision to reduce
the caps on installations proposed by the member states in
the beginning of the year.
Wholesale Electricity Price Movements in E.ON’s Core Markets
/MWh1
80
70
60
50
40
30
20
10
1/1/06 4/1/06 7/1/06 10/1/06 1/1/07 4/1/07 7/1/07 10/1/07
U.K. BaseloadU.S. Baseload
EEX BaseloadNord Pool Baseload
1For next-year delivery.
CO2 Emission Allowance Price Movements in Europe
/metric ton
30
20
10
0
1/1/06 4/1/06 7/1/06 10/1/06 1/1/07 4/1/07 7/1/07 10/1/07
Phase-two allowances Phase-one allowances

Corporate Profile and Operating Environment34
Crude Oil and Natural Gas Price Movements in E.ON’s Core Markets
/MWh
60
50
40
30
20
10
1/1/06 4/1/06 7/1/06 10/1/06 1/1/07 4/1/07 7/1/07 10/1/07
$/bbl
90
80
70
60
50
40
Brent crude oil front month $/bblU.K. front month natural gas /MWh
German natural gas import price /MWhBunde front month natural gas /MWh
U.S. front month natural gas /MWhAverage monthly prices
Power and Gas Sales
The E.ON Group increased its power sales volume by 13 per-
cent, from 417.9 billion kWh in the prior year to 470.8 billion kWh
in 2007. Central Europe’s 17-percent increase in volume is
predominantly attributable to significantly higher deliveries
onto its network of electricity pursuant to Germany’s Renew-
able Energy Law. Under this law, network operators must
give priority to electricity from renewable-source generating
units. A mechanism has been established for network opera-
tors and energy retailers to pass the higher cost of renew-
able-source electricity through to all end-customers. However,
the costs typically could not be completely passed through,
particularly in the residential segment where basic utility
service uses integrated prices. Central Europe also benefited
from higher sales volumes to sales and trading partners.
U.K. sold 5 percent more electricity, Nordic 7 percent more,
and U.S. Midwest 2 percent more. The respective factors
were higher wholesale volumes, higher hydroelectric pro-
duction in Sweden, and favorable temperatures in Kentucky
compared with the prior year.
Natural gas sales volumes increased by 2 percent year on
year, from 1,186.9 billion kWh to 1,212.5 billion kWh. This was
mainly due to the full-year inclusion of Hungary’s E.ON
Földgáz at Pan-European Gas, which increased its sales vol-
ume by 2 percent. In addition, higher wholesale volumes
enabled U.K. to increase its gas deliveries by 1 percent, while
low temperatures in the Midwestern United States early in
the year enabled U.S. Midwest to sell 10 percent more natu-
ral gas. By contrast, higher temperatures in Europe com-
pared with the prior year served to reduce sales volumes
by 2 percent at Central Europe and 9 percent at Nordic.
Billion kWh Total: 470.8
2007 Power Sales1
Central Europe
U.K.
Nordic
U.S. Midwest
313.7
77.8
43.4
35.9
1Unconsolidated figures.

35To Our ShareholdersSupervisory Board Year in Review Combined Group Management Report Additional Information Market Units Corporate Governance Consolidated Financial Statements Tables and Explanations
Power and Gas Procurement
The Central Europe market unit met 134.6 billion kWh, or
about 41 percent, of its power requirements with electricity
from its own generating facilities. Central Europe purchased
192.6 billion kWh of electricity from jointly owned power
plants and outside sources, about 28 percent more than in
the prior year. Overall, power procurements rose by 16 per-
cent to 327.2 billion kWh.
As in the past, in 2007 Pan-European Gas purchased natural
gas from German producers and five export countries, which
accounted for the following percentages of its total procure-
ments of 698 billion kWh:
• Germany: 18 percent
• Russia: 26 percent
• Norway: 25 percent
• Netherlands: 17 percent
• United Kingdom: 10 percent
• Denmark: 3 percent
• Other: 1 percent
Billion kWh Total: 1,212.5
2007 Gas Sales1
1Unconsolidated figures.
Pan-European Gas
Central Europe
U.K.
Nordic
U.S. Midwest
910.3
126.2
157.1
5.3
13.6
The U.K. market unit backed 41.2 billion kWh, or about 53 per-
cent, of its power requirements of 77.9 billion kWh with elec-
tricity from its own power plants. U.K. purchased 36.7 billion
kWh of electricity from jointly owned power plants and third
parties. Owned generation increased by 5.3 billion kWh from
2006.
Nordic covered about two thirds of its total power require-
ments of 45.5 billion kWh with power from its own generat-
ing facilities. Nordic purchased 15.3 billion kWh of electricity
from jointly owned power plants and outside sources com-
pared with 14.8 billion kWh in the prior year.
U.S. Midwest procured 36.7 billion kWh of electricity in 2007,
of which about 92 percent was at its own facilities. It pro-
cured 2.9 billion kWh from outside sources, 12 percent less
than in the previous year.

Earnings Situation
Conversion of Group Reporting Policies to Interna-tional Financial Reporting Standards (“IFRS”)
Through the end of the 2006 financial year, E.ON AG pre-
pared its Consolidated Financial Statements in accordance
with accounting principles generally accepted in the United
States of America (“U.S. GAAP”). Effective January 1, 2007, we
apply International Financial Reporting Standards (“IFRS”),
which are applicable in the European Union and which
deviate substantially from U.S. GAAP in a number of respects.
Detailed explanatory notes on the conversion of Group
Reporting Policies to IFRS and IFRS reconciliations can be
found on pages 203–209 of the Condensed Consolidated
Interim Financial Statements and on page 211.
Business Development
Economic development in 2007 had no noteworthy effect on
our business. While energy consumption declined in Germany
and in the sales territory of our U.K. market unit, electricity
and gas consumption increased slightly in Northern Europe
and in Kentucky. On the whole, our business developed well.
We increased adjusted EBIT more than we had anticipated
at year end 2006. Three of our market units—U.K., Nordic, and
U.S. Midwest—operate outside the eurozone. With the excep-
tion of U.S. Midwest, the respective foreign-exchange rates
did not have a significant impact on our earnings situation.
The transactions listed below influenced our business in
2007.
Transactions in 2007
AcquisitionsENERGI E2 Renovables IbéricasOn August 13, 2007, E.ON Climate & Renewables GmbH acquired
a 100-percent stake in ENERGI E2 Renovables Ibéricas S.L.U.
(“E2-I”), Madrid, Spain. The purchase price totaled roughly
481 million. E2-I and its affiliated companies were fully con-
solidated as of August 31, 2007. Through its affiliated and
associated companies, E2-I primarily operates wind farms in
Spain and Portugal with an installed generating capacity of
about 260 MW. A more extensive development project pipe-
line is in place for the coming years.
OGK-4On October 12, 2007, E.ON acquired from the Russian govern-
ment holding company RAO UES a majority stake in the
Russian power-plant company OAO OGK-4 (“OGK-4”). After
the acquisition of additional smaller tranches following the
purchase of the majority stake, E.ON holds 72.7 percent of
OGK-4 as of the balance sheet date. The total expense
incurred for this acquisition, which includes a contractually
agreed capital increase of 1.3 billion to finance the invest-
ment program planned for the coming years, was approxi-
mately 4.4 billion. Under Russian capital-markets legisla-
tion, E.ON was required to make a public offer to purchase
the remainder of the shares held by the minority sharehold-
ers of OGK-4, and this offer, at a price of 3.3503 rubles per
share, was made public on November 15, 2007. The accep-
tance period ended on February 4, 2008. E.ON was thus able
to acquire additional shares equivalent to approximately
3.4 percent of OGK-4 and increase its total ownership stake
to 76.1 percent. As was expected, RAO UES did not accept
the offer for its remaining 22.5-percent stake in OGK-4. OGK-4
operates conventional power plants at five locations with
a total installed capacity of 8.6 gigawatts (“GW”) and plans
to build additional power plants with a capacity of about
2.4 GW at its existing locations by 2011. The initial recog-
nition of the company in the E.ON Consolidated Financial
Statements took place in the fourth quarter of 2007.
Skarv and IdunIn October 2007, E.ON Ruhrgas acquired a 28-percent stake in
Skarv and Idun, important Norwegian natural gas fields. The
purchase price including incidental acquisition expenses
amounted to 641 million. E.ON’s share of the investments
for developing these fields is around $1.4 billion. Skarv and
Idun are both in the northern Norwegian Sea, just below
the Arctic Circle. The reserves acquired by E.ON are roughly
18.4 million standard cubic meters oil equivalent.
AirtricityOn December 18, 2007, E.ON North America Holdings LLC
acquired all the shares of Airtricity Inc., Chicago, Illinois, USA,
for a purchase price of approximately 580 million. Airtricity
operates a number of wind farms in the U.S. states of Texas
and New York with a total installed capacity of around 250 MW.
Full consolidation of the Airtricity companies took place on
December 31, 2007.
36

DivestmentsONEE.ON and its partners Telenor and Tele Danmark signed a
contract in June 2007 to sell their shares in the Austrian
telecommunications company ONE to a consortium of bid-
ders consisting of France Télécom and the financial investor
Mid Europa Partners. The transfer of E.ON’s 50.1-percent
stake became effective on October 2, 2007. E.ON realized
cash proceeds of around 569 million from the sale, includ-
ing the consideration for the shareholder loans granted, as
well as a disposal gain of 321 million.
RAGOn August 7, 2007, E.ON, ThyssenKrupp, and RWE came to an
agreement with the RAG-Stiftung to sell to it their shares in
RAG. The three shareholding companies held a total of 90 per-
cent of the share capital of RAG. The block of E.ON shares
was transferred on November 30, 2007, at a purchase price
of 1.
Discontinued OperationsWKEThrough its wholly owned subsidiary Western Kentucky Energy
Corp. (“WKE”), Henderson, Kentucky, USA, E.ON U.S. has a
25-year lease on and operates the generating facilities of
Big Rivers Electric Corporation (“BREC”), a power generation
cooperative in western Kentucky, and a coal-fired facility
owned by the city of Henderson, Kentucky, USA. In March
2007, E.ON U.S. entered into a termination agreement with
BREC to terminate the lease and the operational agree-
ments for nine coal-fired plants and one oil-fired electricity
generation unit in western Kentucky. The closing of the
agreement is subject to a number of conditions, including
review and approval by various regulatory agencies and
obtaining the consent of other interested parties. Subject to
such contingencies, the parties expect to complete the ter-
mination transaction by mid–2008. WKE therefore continued
to be classified as a discontinued operation.
Development of Significant Line Items of theConsolidated Statements of Income
Own work capitalized increased by 31 percent, or 122 mil-
lion, to 517 million in 2007 (2006: 395 million) and resulted
primarily from engineering services rendered in connection
with new construction projects.
Other operating income declined by 2 percent, from 7,914 mil-
lion in the prior year to 7,776 million. Gains on the disposal
of investments totaled 1.6 billion in 2007, gains on deriva-
tive financial instruments totaled 1.8 billion, and income from
exchange-rate differences totaled 3.3 billion. Miscellaneous
other operating income in 2007 consisted primarily of reduc-
tions of valuation allowances on accounts receivable, rental
and leasing income, the sale of scrap metal and materials, as
well as compensation payments received for damages.
Costs of materials rose by 3,515 million, from 46,708 mil-
lion in the prior year to 50,223 million in 2007. The increase
is primarily attributable to higher expenses resulting from
significantly higher electricity deliveries onto Central
Europe’s transmission system pursuant to Germany’s Renew-
able Energy Law.
Personnel costs increased slightly, from 4,529 million in
2006 to 4,597 million in 2007. Personnel costs rose by
137 million at the U.K. market unit mainly due to staff addi-
tions in a new business, but declined by 68 million at Cen-
tral Europe primarily due to lower provisions for part-time
work programs for employees approaching retirement age.
37To Our ShareholdersSupervisory Board Year in Review Combined Group Management Report Additional Information Market Units Corporate Governance Consolidated Financial Statements Tables and Explanations

Earnings Situation
Depreciation, amortization, and impairment charges of
3,194 million in 2007 were below the prior-year figure of
3,670 million. The decline is principally attributable to lower
impairment charges, which in the prior year consisted of
impairment charges at Central Europe (236 million) mainly
due to regulatory issues, at U.K. (204 million) mainly on gas
storage and combined heat and power plants, at Nordic
(70 million) on the heating business, and at Pan-European
Gas (73 million) in part on an administration building.
These effects were partially offset by higher depreciation
and amortization.
Other operating expenses declined by 18 percent, or
2,183 million, to 9,724 million (prior year: 11,907 million).
This is mainly attributable to lower realized losses on currency
differences of 3,218 million (prior year: 4,447 million) and
lower losses on derivative financial instruments of 1,331 mil-
lion (prior year: 3,052 million) at the U.K., Pan-European Gas,
and Nordic market units.
Income from companies accounted for under the equity
method was 1,147 million compared with 748 million in 2006.
The 53-percent increase resulted principally from higher
equity earnings at Pan-European Gas. This market unit’s prior-
year equity earnings were adversely affected primarily by
impairment charges relating to regulatory issues. Income
from companies accounted for under the equity method in
2007 was also higher due to deferred tax income resulting
from the reform of Germany’s corporate tax laws.
Earnings
Adjusted earnings before interest and taxes (“adjusted
EBIT”) is used as the key figure at E.ON for purposes of inter-
nal management control and as an indicator of a business’s
long-term earnings power. We believe adjusted EBIT is a suit-
able metric for evaluating the operating performance of our
market units.
Adjusted EBIT is derived from income/loss from continuing
operations before taxes and adjusted to exclude certain
special items. The adjustments include adjusted net interest
income, net book gains, cost-management and restructuring
expenses, and other non-operating income and expenses.
Adjusted net interest income is calculated by taking the net
interest income shown in the income statement and adjust-
ing it using economic criteria and excluding certain special
items, i.e., the portions of interest expense that are non-
operating. Net book gains are equal to the sum of book
gains and losses from disposals, which are included in other
operating income and other operating expenses. Cost-man-
agement and restructuring expenses are non-recurring in
nature. Other non-operating earnings encompass other non-
operating income and expenses that are unique or rare in
nature. Depending on the case, such income and expenses
may affect different line items in the income statement. For
example, effects from the marking to market of derivatives
are included in other operating expenses and income, while
impairment charges on property, plant, and equipment are
included in depreciation, amortization, and impairments.
Net Income
Net income attributable to shareholders of E.ON AG of
7.2 billion was 29 percent above the prior-year level.
38
+/– %
+10
–
–
–
–
+81
–
+39
–57
+27+29
+5
in millions
Adjusted EBIT
Adjusted interest income (net)
Net book gains
Restructuring and cost-manage-ment expenses
Other non-operating earnings
Income/Loss from continuingoperations before taxes
Income taxes
Income/Loss from continuingoperations
Income/Loss from discontinuedoperations, net
Net incomeShareholders of E.ON AGMinority interests
2007
9,208
–960
1,345
–77
167
9,683
–2,289
7,394
330
7,7247,204
520
2006
8,356
–948
829
–
–2,890
5,347
–40
5,307
775
6,0825,586
496
Net Income
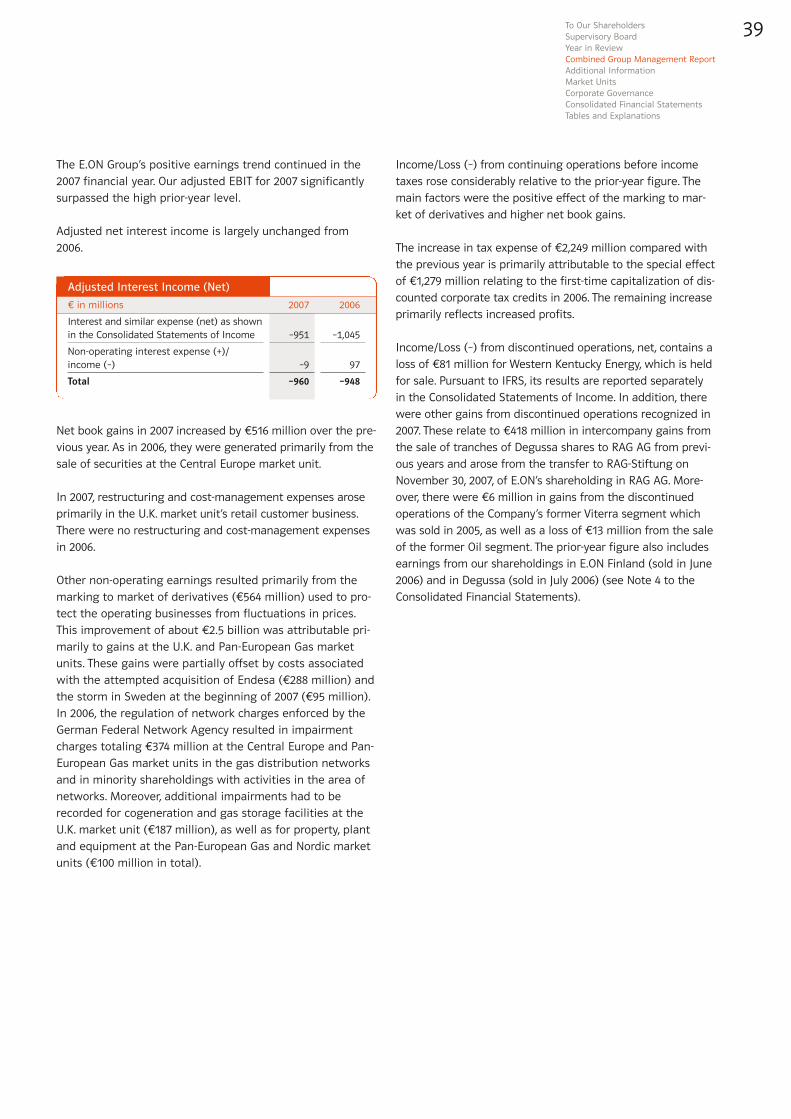
The E.ON Group’s positive earnings trend continued in the
2007 financial year. Our adjusted EBIT for 2007 significantly
surpassed the high prior-year level.
Adjusted net interest income is largely unchanged from
2006.
Net book gains in 2007 increased by 516 million over the pre-
vious year. As in 2006, they were generated primarily from the
sale of securities at the Central Europe market unit.
In 2007, restructuring and cost-management expenses arose
primarily in the U.K. market unit’s retail customer business.
There were no restructuring and cost-management expenses
in 2006.
Other non-operating earnings resulted primarily from the
marking to market of derivatives (564 million) used to pro-
tect the operating businesses from fluctuations in prices.
This improvement of about 2.5 billion was attributable pri-
marily to gains at the U.K. and Pan-European Gas market
units. These gains were partially offset by costs associated
with the attempted acquisition of Endesa (288 million) and
the storm in Sweden at the beginning of 2007 (95 million).
In 2006, the regulation of network charges enforced by the
German Federal Network Agency resulted in impairment
charges totaling 374 million at the Central Europe and Pan-
European Gas market units in the gas distribution networks
and in minority shareholdings with activities in the area of
networks. Moreover, additional impairments had to be
recorded for cogeneration and gas storage facilities at the
U.K. market unit (187 million), as well as for property, plant
and equipment at the Pan-European Gas and Nordic market
units (100 million in total).
Income/Loss (–) from continuing operations before income
taxes rose considerably relative to the prior-year figure. The
main factors were the positive effect of the marking to mar-
ket of derivatives and higher net book gains.
The increase in tax expense of 2,249 million compared with
the previous year is primarily attributable to the special effect
of 1,279 million relating to the first-time capitalization of dis-
counted corporate tax credits in 2006. The remaining increase
primarily reflects increased profits.
Income/Loss (–) from discontinued operations, net, contains a
loss of 81 million for Western Kentucky Energy, which is held
for sale. Pursuant to IFRS, its results are reported separately
in the Consolidated Statements of Income. In addition, there
were other gains from discontinued operations recognized in
2007. These relate to 418 million in intercompany gains from
the sale of tranches of Degussa shares to RAG AG from previ-
ous years and arose from the transfer to RAG-Stiftung on
November 30, 2007, of E.ON’s shareholding in RAG AG. More-
over, there were 6 million in gains from the discontinued
operations of the Company’s former Viterra segment which
was sold in 2005, as well as a loss of 13 million from the sale
of the former Oil segment. The prior-year figure also includes
earnings from our shareholdings in E.ON Finland (sold in June
2006) and in Degussa (sold in July 2006) (see Note 4 to the
Consolidated Financial Statements).
39To Our ShareholdersSupervisory Board Year in Review Combined Group Management Report Additional Information Market Units Corporate Governance Consolidated Financial Statements Tables and Explanations
in millions
Interest and similar expense (net) as shownin the Consolidated Statements of Income
Non-operating interest expense (+)/income (–)
Total
2007
–951
–9
–960
2006
–1,045
97
–948
Adjusted Interest Income (Net)

Earnings Situation
Adjusted Net Income
Net income reflects not only our operating performance but
also special effects such as the marking to market of deriva-
tives. Adjusted net income is an earnings figure after interest
income, incomes taxes, and minority interests that has been
adjusted to exclude certain special effects. In addition to the
marking to market of derivatives, the adjustments include book
gains and book losses on disposals, restructuring expenses,
other non-operating income and expenses (after taxes and
minority interests) of a special or rare nature. Adjusted net
income also excludes income/loss (–) from discontinued oper-
ations and from the cumulative effect of changes in IFRS prin-
ciples (after taxes and minority interests), as well as special
tax effects. Special tax effects relate mainly to changes in the
tax laws of Germany and the United Kingdom.
Sales
Our sales in 2007 increased to 68.7 billion thanks exclusively
to the significant increase—4.6 billion—achieved by the
Central Europe market unit.
Central Europe grew sales by about 4.8 billion relative to
the prior-year period. Sales at Central Europe West Power
were 4.5 billion higher due primarily to the passthrough
of the significantly greater volume of electricity procured
under Germany’s Renewable Energy Law, higher electricity
prices, and increased sales in the power trading business.
Sales at Central Europe West Gas were about 690 million
lower due primarily to mild temperatures in the first quarter
and the resulting decline in sales volumes. Central Europe
East increased sales by about 620 million. The main drivers
were higher electricity prices in Hungary and the Czech
Republic, the inclusion for the entire year of the results of
two Czech subsidiaries (JČP and Teplárna Otrokovice), and
currency effects. The significant increase in sales recorded
in the Other/Consolidation segment is mainly attributable
to the inclusion of Italy’s Dalmine for the entire year.
Pan-European Gas’s sales declined by 1 percent to 22,745 mil-
lion (prior year: 22,947 million). Sales at Upstream/Midstream
of 17,738 million were 6 percent below the prior-year fig-
ure of 18,889 million. The slight increase in sales volumes
was counteracted by energy price developments and com-
petitive pressure on sales prices in the midstream business.
Upstream sales declined by 26 million due mainly to lower
sales prices. Lower sales at Upstream/Midstream were
40
+/– %
+18
–1
+1
+18
–6
–
+7
in millions
Central Europe
Pan-European Gas
U.K.
Nordic
U.S. Midwest
Corporate Center/New Markets
Total
2007
32,029
22,745
12,584
3,339
1,819
–3,785
68,731
2006
27,197
22,947
12,518
2,827
1,930
–3,328
64,091
Sales
+/– %
+29
–
–
–
–
–
–
+9
in millions
Net income attributable toshareholders of E.ON AG
Net book gains
Restructuring and cost-management expenses
Other non-operating earnings
Taxes and minority interests on non-operating earnings
Special tax effects
Income (+)/loss (–) fromdiscontinued operations, net
Total
2007
7,204
–1,345
77
–167
–142
–182
–330
5,115
2006
5,586
–829
–
2,890
–921
–1,279
–765
4,682
Adjusted Net Income

nearly offset by positive effects at Downstream Sharehold-
ings, where sales increased by 852 million, or 18 percent,
from 4,773 million in 2006 to 5,625 million in 2007. This is
mainly attributable to sales development at E.ON Ruhrgas
International which benefited principally from the fact that
E.ON Földgáz Trade and E.ON Földgáz Storage were consoli-
dated E.ON companies for all of 2007. These subsidiaries
became consolidated E.ON companies on March 31, 2006.
The sales declines at the other Downstream Shareholdings
companies were primarily weather-driven. Thüga recorded
lower sales. The main factors were lower power and gas sales
volumes resulting primarily from warmer weather compared
with the prior year. Higher electricity and gas prices and a
positive sales effect stemming from changes to Thüga Italia’s
scope of consolidation were not sufficient to offset this
development.
The U.K. market unit increased its sales slightly in 2007 com-
pared with the prior year. Sales in the Non-regulated busi-
ness, which is primarily comprised of the Energy Wholesale
(generation and trading), Retail and the Energy Services
businesses in the United Kingdom, increased by 95 million,
from 12,031 million in 2006 to 12,126 million in 2007. This
1-percent increase was primarily attributable to higher
average retail prices in 2007 offset by lower sales volumes
compared with 2006 in the Retail business and higher sales
volumes from the Energy Wholesale business. Sales in the
Regulated business, which is primarily comprised of the U.K.
distribution operations, increased to 888 million in 2007
from 858 million in 2006. The sales increase of 30 million,
or 3 percent, was principally attributable to tariff changes.
Sales attributed to Other/Consolidation consist almost
entirely of the elimination of intrasegment sales and had a
negative impact on sales of 430 million in 2007, as com-
pared to a negative impact of 371 million in 2006.
Nordic’s sales increased by 512 million compared with the
prior year. Sales in the Non-regulated business increased
as a result of significantly higher electricity volumes sold at
Nord Pool and the positive impact of hedging activities.
The increase in power sales was to some extent offset by
weather-driven declines in gas and heat sales. Sales in the
Regulated business increased by 4 million, mainly based
on a tariff adjustment to cover inreased costs for line loss
in 2006. This increase was partly offset by a decrease in
transported gas volumes.
Sales of U.S. Midwest’s Regulated business, which is com-
prised of the utility operations of LG&E and KU, decreased
by 103 million to 1,766 million in 2007, from 1,869 million
in 2006. The 6-percent decrease was attributable to the strong
euro (156 million). In local currency, sales of the Regulated
business increased as a result of higher power retail sales
partially offset by lower gas prices. Sales at the Non-regu-
lated business decreased primarily due to the strong euro.
Sales in local currency were relatively flat.
Intersegment sales of approximately –4 billion were netted
out in the Corporate Center/New Markets segment. Sales of
Russian power producer OGK-4 and wind-farm operator E2-I
were 248 million and 5 million, respectively.
Adjusted EBIT
Central Europe’s adjusted EBIT exceeded the prior-year
figure by about 435 million, or 10 percent.
Central Europe West Power increased adjusted EBIT by
509 million year on year to 4,145 million. Gross margin
effects, the necessary revaluation of provisions for nuclear
waste management, and the absence of aperiodic nega-
tive effects recorded in the prior-year period were partially
mitigated by higher electricity procurement costs and higher
expenditures resulting in particular from an increase in
the amount of renewable-source electricity delivered onto
the network. Adjusted EBIT was also adversely affected by
the outages at Krümmel and Brunsbüttel (jointly owned
nuclear power stations that have been out of service since
41To Our ShareholdersSupervisory Board Year in Review Combined Group Management Report Additional Information Market Units Corporate Governance Consolidated Financial Statements Tables and Explanations
+/– %
+10
+10
–8
+31
–9
–
+10
in millions
Central Europe
Pan-European Gas
U.K.
Nordic
U.S. Midwest
Corporate Center/New Markets
Total
2007
4,670
2,576
1,136
670
388
–232
9,208
2006
4,235
2,347
1,239
512
426
–403
8,356
Adjusted EBIT

Earnings Situation
the middle of 2007), provisions for obligations in network
operations, higher maintenance and IT costs, and lower
results from network activities. Another negative factor
was lower equity earnings from associated companies due
to the absence of positive non-recurring effects recorded
in 2006. Higher group internal cost allocation and negative
effects relating to new sales operations (mainly the buildup
of E WIE EINFACH, our new retail subsidiary in Germany)
also served to mitigate to some extent Central Europe
West Power’s positive earnings performance.
Adjusted EBIT of 200 million at Central Europe West Gas was
70 million below the prior-year figure due primarily to the
very mild winter and the resulting decline in sales volumes.
Central Europe East’s earnings performance was very posi-
tive, with adjusted EBIT climbing by 30 percent year on year
to 361 million. The increase results primarily from higher
gross margins in Hungary and Romania along with positive
earnings contributions from JČP and Teplárna Otrokovice,
whose results were included for only part of the prior year.
Positive currency effects and higher equity earnings from
associated companies also served to increase adjusted EBIT.
Adverse effects included weather-driven declines in sales
volumes, particularly in the Czech Republic.
Adjusted EBIT of –36 million recorded under Other/Con-
solidation was 99 million below the prior-year figure as a
result of lower results from realized currency hedging
transactions, lower earnings from the sale of securities,
and higher other expenditures.
Pan-European Gas’s adjusted EBIT of 2,576 million was
229 million, or 10 percent, above the prior-year figure. The
increase is attributable to Downstream Shareholdings, where
adjusted EBIT rose from 453 million to 987 million, an
increase of 534 million or 118 percent. The increase in adjusted
EBIT at the E.ON Földgáz companies was the main factor. It
resulted from their inclusion, for the first time, for an entire
year and from a regulation-driven settlement for price adjust-
ments not taken in prior years. The absence of impairment
charges taken on certain shareholdings at Thüga in 2006 had
a positive effect on adjusted EBIT in 2007. Other positive fac-
tors included higher book gains on the sale of shareholdings
at Thüga Deutschland, higher equity earnings from associated
companies reflecting deferred tax income resulting from
Germany’s corporate tax reform.
Adjusted EBIT at the midstream business was 235 million
lower than the figure for the prior year, mainly due to a
decline in gross margins brought on by lower earnings from
storage valuation, competition-driven price measures, and
results of short-term trading transactions. The earnings
decline was mitigated by the absence in the current year of
the adverse earnings effect recorded in the prior year result-
ing from the fact that procurement prices are adjusted more
rapidly than sales prices. This effect was only partially offset
by higher equity earnings from associated companies, in
particular from Gazprom.
Adjusted EBIT in the upstream business fell by 89 million
due to lower gas sales prices, higher impairment charges
on exploration activities in the German and U.K. North Sea,
and higher gas field operating costs and write-downs due
to the start of production at new fields.
The U.K. market unit delivered an adjusted EBIT of 1,136 mil-
lion in 2007, of which 509 million was in the Regulated busi-
ness and 762 million in the Non-regulated business. Adjust-
ed EBIT at the Regulated business increased by 21 million
principally due to tariff increases. Adjusted EBIT at the Non-
42

regulated business decreased by 89 million. The key fea-
tures were lower retail margins due to the price reduction
and lower retail sales volumes due to both warmer weather
and lower customer numbers. These effects were partially
offset by the avoidance of the high gas input costs during
the first quarter of 2006 caused by gas supply issues and
cold weather, increased margins from the gas power stations,
and improved station availability. Adjusted EBIT recorded under
Other/Consolidation was 35 million lower that in the prior
year, mainly due to the transfer of some activities to the cen-
ter from the business units and a number of items account-
ed for centrally such as foreign-exchange hedging.
Nordic’s adjusted EBIT increased by 158 million year on year
to 670 million. Adjusted EBIT at the Non-regulated business
rose from 342 million to 488 million, due mainly to higher
electricity volumes (primarily from hydro production due
to an above-normal inflow to winter reservoirs) plus higher
average wholesale price levels achieved through hedging
activities. The Non-regulated business was negatively affect-
ed by a change in the estimate for future nuclear decommis-
sioning costs. The retail and heat businesses performed bet-
ter than in the prior year despite lower volumes. The retail
business benefited from lower operating costs and higher
intercompany offsets resulting from contracts within the
market unit. The positive development in the heat business
was mainly a result of more cost-efficient production. Adjust-
ed EBIT of 220 million for the Regulated business rose by
10 percent due mainly to increased network tariffs based on
higher costs for line loss in previous years. Adjusted EBIT at
the gas distribution business was at the same level as the
prior year. On January 14, 2007, a storm in southern Sweden
caused substantial damage to the electricity distribution sys-
tem in some areas. The costs of repair work and compensa-
tion of customers were approximately 95 million. Storm-
related costs do not affect adjusted EBIT, as this event was
exceptional in nature.
Adjusted EBIT at the U.S. Midwest market unit decreased by
9 percent, from 426 million in 2006 to 388 million in 2007.
Adjusted EBIT at the Regulated business decreased by 38
million or 9 percent, from 431 million in 2006 to 393 mil-
lion in 2007. The decrease is primarily attributable to the
stronger euro (36 million). In local currency, adjusted EBIT
was slightly lower than in the previous year. Lower off-sys-
tem electric sales and lower gas margins as a result of the
timing of gas cost recoveries from customers were generally
offset by higher retail electric volumes and earnings from
higher environmental cost recoveries. Adjusted EBIT at E.ON
U.S.’s Non-regulated business was flat compared to prior year.
Adjusted EBIT recorded under Corporate Center/New Markets
was –232 million (2006: –403 million). Adjusted EBIT at
OGK-4 and E2-I was insignificant.
43To Our ShareholdersSupervisory Board Year in Review Combined Group Management Report Additional Information Market Units Corporate Governance Consolidated Financial Statements Tables and Explanations

Earnings Situation
ROCE and Value Added
Groupwide Value-Oriented Management ApproachOur corporate strategy is aimed at delivering sustainable
growth in shareholder value. We have put in place a group-
wide planning and controlling system to assist us in plan-
ning and managing E.ON as a whole and our individual busi-
nesses with an eye to increasing their value. This system
ensures that our financial resources are allocated efficiently.
E.ON’s key performance metrics are return on capital
employed (“ROCE”) and value added. To monitor the periodic
performance of our business segments, we compare each
segment’s ROCE with its business-specific cost of capital. In
addition to ROCE, which is a relative performance metric, we
also measure performance using valued added, which is an
absolute performance metric.
Cost of CapitalThe cost of capital is determined by calculating the weighted-
average cost of equity and debt. This average represents the
market-rate returns expected by stockholders and creditors.
The cost of equity is the return expected by an investor in
E.ON stock. The cost of debt equals the long-term financing
terms (after taxes) that apply in the E.ON Group. The para-
meters of the cost of capital determination are reviewed on
an annual basis. The cost of capital is adjusted if there are
significant changes.
Due to significant changes in a number of the parameters,
we adjusted our cost of capital in the 2007 financial year.
The table at right illustrates the derivation of cost of capital
before and after taxes for 2007 and 2006. Deviations result in
particular from a decline in interest-rate levels and a change
in E.ON’s debt-to-equity ratio. We currently use a debt-to-
44
equity ratio of 35 to 65 for the E.ON Group. This figure reflects
a target capital structure derived from the market value of
E.ON’s equity and a level of debt commensurate with E.ON’s
target rating.
Overall, the new determination of the parameters led to a
slight increase in the E.ON Group’s average cost of capital
for 2007, which increased from 5.9 percent to 6.1 percent
after taxes and from 9.0 percent to 9.1 percent before taxes.
We also adjusted the individual market units’ minimum
ROCE requirements, which for 2007 were between 7.8 per-
cent and 9.5 percent before taxes.
Effective 2008, the cost of capital was adjusted again to
reflect the corporate tax reform laws that took effect in Ger-
many and the United Kingdom on January 1, 2008. The E.ON
Group’s average cost of capital is now 6.3 percent after taxes
and 8.6 percent before taxes.
2007
4.3%
4.0%
0.85
7.7%
33%
11.5%
4.7%
1.6%
3.1%
65%
35%
6.1%
9.1%
2006
5.1%
5.0%
0.7
8.6%
35%
13.2%
5.6%
2.0%
3.6%
45%
55%
5.9%
9.0%
Risk-free interest rate
Market premium1
Beta factor2
Cost of equity after taxes
Tax rate
Cost of equity before taxes
Cost of debt before taxes
Tax shield (tax rate: 35 %)3
Cost of debt after taxes
Share of equity
Share of debt
Cost of capital after taxes
Cost of capital before taxes
Cost of Capital
1The market premium reflects the higher long-term returns of the stock marketcompared with German treasury notes.
2The beta factor is used as an indicator of a stock’s relative risk. A beta of morethan one signals a higher risk than the risk level of the overall market; a betafactor of less than one signals a lower risk.
3The tax shield takes into consideration that the interest on corporate debtreduces a company’s tax burden. For 2007, the tax rate relevant for this calcula-tion deviated slightly from the E.ON Group’s average tax rate.

Analyzing Value Creation by Means of ROCE andValue AddedROCE is a pretax total return on capital. It measures the sus-
tainable return on invested capital generated by operating a
business. ROCE is defined as the ratio of adjusted EBIT to
capital employed.
Capital employed represents the interest-bearing capital tied
up in the group. Capital employed is equal to a segment’s
operating assets less the amount of noninterest-bearing
available capital. Goodwill from acquisitions is included at
acquisition cost, as long as this reflects its fair value.
As in the prior year, capital employed does not include the
marking to market of other share investments. The purpose
is to provide us with a more consistent picture of our ROCE
performance. Other share investments are recorded in the
Consolidated Balance Sheets at their mark-to-market valua-
tion. However, changes in their market value do not affect
adjusted EBIT but are included in equity, resulting in neither
profit nor loss. This applies in particular to our shares in
Gazprom.
Value added measures the return that exceeds the cost of
capital employed. It is calculated as follows:
Value added = (ROCE – cost of capital) x capital employed
The table at right shows the E.ON Group’s ROCE, value
added, and their derivation.
45To Our ShareholdersSupervisory Board Year in Review Combined Group Management Report Additional Information Market Units Corporate Governance Consolidated Financial Statements Tables and Explanations
2006
8,356
61,698
21,303
4,199
9,760
12,561
5,614
36,149
6,267
61,491
60,756
13.8%
9.0%
2,916
2007
9,208
69,597
22,994
3,811
9,064
13,317
6,024
35,132
9,692
67,935
63,287
14.5%
9.1%
3,417
in millions
Adjusted EBIT
Goodwill, intangible assets, andproperty, plant, and equipment
+ Shares in affiliated and associatedcompanies and other share invest-ments
+ Inventories
+ Accounts receivable
+ Other noninterest-bearing currentassets and deferred tax assets
– Noninterest-bearing provisions1
– Noninterest-bearing liabilities anddeferred tax liabilities
– Adjustments2
Capital employed in continuingoperations (at year end)
Capital employed in continuingoperations (annual average)3
ROCE
Cost of capital
Value added
E.ON Group ROCE and Value Added
1Noninterest-bearing provisions mainly include current provisions. In particular,they do not include provisions for pensions or for nuclear waste management.
2Capital employed is adjusted to exclude the mark-to-market valuation of othershare investments (including related deferred-tax effects) and operating liabili-ties for certain purchase obligations to minority shareholdings pursuant to IAS 32.The adjustment to exclude the mark-to-market valuation of other share invest-ments applies primarily to our shares in Gazprom.
3In order to better depict intraperiod fluctuations in capital employed, annualaverage capital employed is calculated as the arithmetic average of theamounts at the beginning of the year, the end of the year, and the balance-sheet dates of the three interim reports. Capital employed in continuing opera-tions amounted to 62,374 million, 62,004 million, and 62,630 million atMarch 31, June 30, and September 30, 2007, respectively.

Earnings Situation
ROCE and Value Added Performance
Our integration and growth strategy is reflected in an addi-
tional improvement of the E.ON Group’s ROCE and value
added performance. In 2007, our ROCE and value added were
again higher compared with the prior year. With a ROCE of
14.5 percent, we substantially exceeded our cost of capital.
Value added increased to 3.4 billion in 2007.
Central EuropeThe Central Europe market unit significantly increased both
its ROCE and value added in 2007. Positive price effects and
operating improvements in conjunction with a significant
reduction in the capital basis led to a positive ROCE perform-
ance. Capital employed declined despite higher investments
mainly because of a reduction in working capital, positive
effects from changes in deferred taxes, and the sale of share-
holdings. Central Europe’s medium-term investment plan of
14 billion will lead to an increase in capital employed that
cannot be perpetually offset by further improvements in
working capital.
Pan-European GasPan-European Gas achieved a slight increase in both ROCE
and valued added in 2007. The main driver was the earnings
improvement in the downstream business that resulted in
particular from the earnings increase at shareholdings in
Hungary and the absence of non-recurring adverse earnings
effects relating to the regulation of network charges. In
addition, E.ON Földgáz benefited from a regulation-driven
settlement for price adjustments not taken in prior years.
Despite a higher capital basis resulting from an increase in
investments, these positive effects led ROCE to increase
slightly, from 14.8 to 15.0 percent.
46
2007
4,670
18,943
24.7%
9.3%
2,917
2006
4,235
19,818
21.4%
9.0%
2,457
2007
2,576
17,130
15.0%
8.8%
1,062
2006
2,347
15,855
14.8%
8.2%
1,046
2007
1,136
12,368
9.2%
9.5%
–37
2006
1,239
12,822
9.7%
9.2%
64
ROCE and Value Added by Segment
U.K.Pan-European Gas1Central Europe
1Capital employed is adjusted to exclude the mark-to-market valuation of other share investments. This applies primarily to our shares in Gazprom.
in millions
Adjusted EBIT
÷ Capital employed
= ROCE
Cost of capital
Value added

U.K.U.K.’s ROCE declined to 9.2 percent in 2007. The primary neg-
ative factor was the decline in the operating earnings contri-
bution from the retail business, which was partially offset by
a decrease in the capital basis resulting from a reduction in
working capital.
NordicIn 2007, Nordic increased its ROCE to 9.7 percent, markedly
surpassing its cost of capital. This value creation is principally
due to the significant year-on-year increase in adjusted
EBIT Nordic achieved, which more than offset an invest-
ment-driven increase in capital employed.
U.S. MidwestU.S. Midwest’s ROCE declined slightly compared with the
prior year, resulting primarily from timing effects in the
recovery of gas procurement costs from customers. This
effect does not constitute a lasting reduction in ROCE.
47To Our ShareholdersSupervisory Board Year in Review Combined Group Management Report Additional Information Market Units Corporate Governance Consolidated Financial Statements Tables and Explanations
2007
670
6,886
9.7%
8.8%
62
2006
512
6,423
8.0%
9.0%
–64
2007
388
6,780
5.7%
7.8%
–142
2006
426
7,118
6.0%
8.0%
–142
2007
–232
1,180
–
–
–
2006
–403
–1,280
–
–
–
2007
9,208
63,287
14.5%
9.1%
3,417
2006
8,356
60,756
13.8%
9.0%
2,916
E.ON GroupCorporate Center/New MarketsU.S. MidwestNordic

Investments
In late May 2007, E.ON presented its corporate strategy for
the future. The centerpiece is an investment program under
which we plan to invest 60 billion through 2010 to expand
our business and achieve selective growth in our European
core market and in adjacent growth regions. Seventy per-
cent of the program represents growth. One key focus, for
which we have earmarked 12 billion, is the construction of
new power plants.
We already began to implement the investment program in
the second half of 2007. For 2007 as a whole, the E.ON Group
invested 11.3 billion. Of this figure, we invested 6.9 billion
in intangible assets and property, plant, and equipment com-
pared with 4.1 billion in the prior year. Share investments
totaled 4.4 billion versus 0.9 billion in the prior year.
In 2007, Central Europe invested 302 million more than in
the prior year. Investments in intangible assets and property,
plant, and equipment totaled 2,390 million compared with
1,883 million in 2006. The additional investments went
towards power generation projects currently under way, par-
ticularly those in Germany and Italy, and investments in off-
shore network infrastructure. Share investments of 191 mil-
lion were 205 million below the prior-year figure.
Pan-European Gas invested 2,424 million. Of this figure,
1,381 million (prior year: 377 million) went towards intan-
gible assets and property, plant, and equipment. Here, the
purchase of Skarv and Idun gas fields (641 million) and the
construction of new gas pipelines Lauterbach-Scheidt and
Rothenstadt-Schwandorf (160 million) constituted the biggest
investments. Share investments of 1,043 million (prior year:
505 million) almost exclusively reflect the acquisition of
Contigas Deutsche Energie-AG from the Central Europe
market unit. A corresponding offsetting item was recorded
in the Corporate Center/New Markets segment.
U.K.’s investments were 501 million higher, primarily due to
increased additions to property, plant, and equipment. The
non-regulated business increased investment in the devel-
opment of new generation capacity and gas storage. Expen-
diture in the regulated business increased in line with the
allowance granted under the five-year regulation review.
Throughout 2007, Nordic continued its challenging invest-
ment plan to increase its generating capacity and further
improve security of supply, investing 272 million more than
in 2006. Nordic invested 892 million (prior year: 592 mil-
lion) in intangible assets and property, plant, and equipment
to maintain and expand existing production plants and to
upgrade and extend the distribution network. Share invest-
ments totaled 22 million compared with 50 million in 2006.
Financial Condition48
+/– %
+13
+175
+58
+42
+73
–
+124+182
in millions
Central Europe
Pan-European Gas
U.K.
Nordic
U.S. Midwest
Corporate Center/New Markets
TotalOutside Germany
2007
2,581
2,424
1,364
914
690
3,333
11,3069,058
2006
2,279
882
863
642
398
–27
5,0373,212
Investments
2007
11,306
1,150
198
–
12,654
in millions
Cash-effective investments
Debt acquired
Long-term rental and leasing obligations
Asset swaps
Total
Economic Value of Investments
2007 Investments
Corporate Center/New Markets
Central Europe
Pan-European Gas
U.K.
Nordic
U.S. Midwest
30
23
21
12
8
6
Percentages Total: 11,306 million

U.S. Midwest’s investments of 690 million were 73 percent
above the prior-year figure, primarily due to increased spend-
ing for SO2 emission-abatement equipment and the new
baseload unit under construction at the Trimble County
plant. This unit is expected to go into service in 2010.
In addition to the offsetting item recorded for the intragroup
acquisition of Contigas Deutsche Energie-AG, the Corporate
Center/New Market segment’s investments primarily reflect
expenditures to acquire ENERGI E2-I Renovables Ibéricas
and Airtricity North America, both of which are wind-farm
operators, and OGK-4, a major Russian power producer.
Share Buyback
E.ON repurchased 3.5 billion of its own shares on-market in
2007, acquiring 27,974,944 shares at an average price of
125.1120 between June and December 2007. E.ON also sold
put options on 10 million of its own shares in 2007 with an
average exercise price of 114.2757. These options may be
exercised between August and October 2008. The share buy-
back is expected to be fully completed by the end of 2008.
Cash Flow and Financial Condition
E.ON presents its financial condition using, among other
financial measures, cash provided by operating activities of
continuing operations and economic net debt.
Cash provided by investing activities was –8,789 million
(prior year: –4,457 million). Spending on investments in
property, plant, and equipment and on share investments
rose significantly over the previous year, from 5,037 million
to 11,306 million. By contrast, proceeds from the sale of
shareholdings declined to 1,431 million (prior year:
3,877 million). The reallocation of long-term deposits resulted
in an increase in cash of 800 million. Cash provided by
financing activities amounted to 1,808 million due to the
cash inflows from borrowing exceeding the cash outflows
relating to the share buyback and the dividend payout. Note
29 to the Consolidated Financial Statements contains further
information about the Consolidated Statements of Cash Flows.
The E.ON Group’s cash provided by operating activities was
22 percent higher in 2007 than in 2006.
Central Europe’s cash provided by operating activities of
3,811 million was on par with the prior-year level. The main
positive factors were a reduction in working capital and a
higher cash-effective electricity margin. Cash provided by
operating activities was adversely affected by the regulation
of network charges, outages at jointly owned nuclear power
stations, higher expenditures for electricity purchased pur-
suant to Germany’s Renewable Energy Law, and a weather-
driven decline in natural gas sales volumes. Higher group
charges and negative effects relating to new sales opera-
tions (mainly the buildup of E WIE EINFACH, our new retail
subsidiary in Germany) also served to reduce cash provided
by operating activities.
49To Our ShareholdersSupervisory Board Year in Review Combined Group Management Report Additional Information Market Units Corporate Governance Consolidated Financial Statements Tables and Explanations
in millions
Cash provided by operating activitiesof continuing operations
Cash provided by (used for) investingactivities of continuing operations
Cash provided by (used for) financingactivities of continuing operations
Net increase (decrease) in cash andcash equivalents maturing
Liquid funds as shown on December 31
2007
8,726
–8,789
1,808
1,745
7,075
2006
7,161
–4,457
–5,860
–3,156
6,189
Consolidated Statements of Cash Flows (Summary)
+/–
+9
+2,437
+891
+199
–165
–1,806
+1,565
+196
+6,073
–2,446
in millions
Central Europe
Pan-European Gas
U.K.
Nordic
U.S. Midwest
Corporate Center/New Markets
Cash provided by operatingactivities of continuingoperations
Maintenance investments
Growth and replacementinvestments, acquisitions, other
Cash-effective effects from disposals
2007
3,811
3,041
1,615
914
216
–871
8,726
1,984
9,322
1,431
2006
3,802
604
724
715
381
935
7,161
1,788
3,249
3,877
Cash Provided by Operating Activities of Continuing Operations
Financial Condition
Pan-European Gas recorded a substantial improvement in
cash provided by operating activities in 2007. This is mainly
attributable to the inclusion of the E.ON Földgáz companies,
which were not consolidated until March 31, 2006, and nega-
tively impacted cash provided by operating activities in the
prior-year period due to a buildup of working gas in storage
at E.ON Földgáz Trade. In addition, there were positive
effects at E.ON Ruhrgas from storage usage in the period
under review. Higher advance payments from customers and
lower tax payments were other positive factors in 2007.
Higher non-recurring dividend payments compared with the
prior year also contributed to the increase in cash provided
by operating activities.
Cash provided by operating activities at the U.K. market unit
was significantly higher year on year. The improvement was
mainly due to the following factors:
• improved operational performance from the Retail busi-
ness which has delivered a reduction in debtor days
• strong profits from the fourth quarter of 2006 collected
as cash in 2007.
Market commodity prices declined in 2007. This resulted in
lower commodity purchase costs but also triggered a retail
price reduction for our customers. Lower commodity pur-
chase costs reduced cash outflows immediately. However,
the impact of the lower retail sales prices is delayed from a
cash inflow perspective due to quarterly billing cycles and
customer payment profiles.
Nordic’s cash provided by operating activities increased sig-
nificantly compared with the prior year. Positive effects from
higher power sales volumes and higher average wholesale
price levels achieved through hedging activities were offset
by cash-effective payments for the January storm and by
higher income tax payments.
Cash provided by operating activities at U.S. Midwest was
lower mainly due to increased pension contributions made
in 2007 and the strong performance of the euro.
The Corporate Center/New Markets segment’s cash provided
by operating activities was considerably below the prior-year
level, due mainly to higher tax payments.
In general, surplus cash provided by operating activities at
Central Europe, U.K., and U.S. Midwest is lower in the first
quarter of the year (despite the high sales volume typical of
this season) due to the nature of their billing cycles, which
in the first quarter are characterized by an increase in
receivables combined with cash outflows for goods and
services. During the remainder of the year, there is typically
a corresponding reduction in working capital, resulting in
surplus cash provided by operating activities, although sales
volumes in these quarters (with the exception of U.S. Mid-
west) are actually lower. The fourth quarter is characterized
by an increase in working capital. At Pan-European Gas, by
contrast, cash provided by operating activities is recorded
principally in the first quarter, whereas there are cash out-
flows for intake at gas storage facilities in the second and
third quarters.
Net financial position equals the difference between our
total financial liabilities and our total liquid funds and non-
current securities. Our net financial position of –7,494 mil-
lion was 7,357 million below the figure reported as of
December 31, 2006 (–137 million). The main factors were
the significant increase in investments along with expendi-
tures for the share buyback program.
Net financial position includes liquid funds and non-current
securities in the amount of 13,970 million (prior year:
13,335 million). Non-current securities consist mainly of
highly liquid, fixed-return securities. Only a very small por-
tion consists of direct subprime investments for which we
estimate a maximum risk of loss of 10 million.
Besides financial liabilities, there are other line items that
are debt-like. These are mainly provisions for pensions and
provisions for nuclear waste management. To provide a
more meaningful description of E.ON’s actual financial situa-
tion, starting with the first quarter of 2007 we have been
reporting a new key figure, “economic net debt.” This key
figure supplements net financial position with provisions for
pensions and provisions for waste management and asset
retirement obligations (less prepayments).
50

Financial Strategy
As part of E.ON’s new strategic direction, we also further
developed our financial strategy. It has four key elements:
• E.ON’s rating target is single A flat/A2. We defined this
as our rating target as part of our original plan to
acquire Endesa and confirmed it as our rating target in
May 2007. Compared with our former target (strong sin-
gle A), the new rating target enables us to increase our
leverage, thereby improving our capital structure while
ensuring our access to financing.
• To manage our capital structure we introduced a new
steering measure: the debt factor. The debt factor is our
economic net debt divided by adjusted EBITDA. Economic
net debt includes not only our financial liabilities but also
our provisions for pensions and asset retirement obliga-
tions. We have defined 3 as our target debt factor, which
is derived from our target rating.
• We intend to actively manage our capital structure. We
will use the debt factor to continually monitor—and if
necessary, optimize—our capital structure. If our debt
factor is significantly above 3, strict investment disci-
pline will be called for. In the case of strategically impor-
tant investments, we would have to utilize alternative
financing concepts in the form of portfolio measures or
capital increases. If it becomes apparent that our debt
factor will fall and remain significantly below 3, we will
return capital to our shareholders, for example through
higher dividend payments or share buybacks. But we
will always give priority to value-enhancing investments.
• Our target dividend payout ratio remains at 50 to 60 per-
cent of adjusted net income.
To supplement our investment program, we are conducting a
7 billion share buyback. We expect the buyback to be com-
pleted by the end of 2008 at the latest, by which time we will
also achieve our target debt factor.
Compared with the figure as of December 31, 2006
(–18,233 million), economic net debt increased by 5,905 mil-
lion to –24,138 million. The main factor was the change in
our net financial position (–7,357 million). Positive factors
included the reduction of 1,072 million in provisions for
pensions and the reduction of 390 million in provisions for
nuclear waste management.
Pension obligations declined compared with year end 2006
due principally to actuarial gains attributable to higher inter-
est rates used to calculate the defined benefit obligation.
Debt factor is the ratio between economic net debt and
adjusted EBITDA. Our debt factor as of year end 2007 was
1.9 compared with 1.6 as of year end 2006.
51To Our ShareholdersSupervisory Board Year in Review Combined Group Management Report Additional Information Market Units Corporate Governance Consolidated Financial Statements Tables and Explanations
in millions
Liquid funds
Non-current securities
Total liquid funds and non-currentsecurities
Financial liabilities to banks andthird parties
Financial liabilities to group companies
Total financial liabilities
Net financial position
Provisions for pensions
Non-contractual nuclear wastemanagement obligations
Contractual nuclear waste management obligations
Other asset retirement obligations
Less prepayments to Swedishnuclear fund
Economic net debt
Adjusted EBITDA
Debt factor
2007
7,075
6,895
13,970
–19,357
–2,107
–21,464
–7,494
–2,890
–10,155
–3,635
–1,244
1,280
–24,138
12,450
1.9
December 31
2006
6,189
7,146
13,335
–11,465
–2,007
–13,472
–137
–3,962
–10,545
–3,683
–1,196
1,290
–18,233
11,724
1.6
Economic Net Debt

Financial Condition
Financial Policy and Initiatives
Our investment program and share buyback program are
financed by means of liquid funds, cash provided by operating
activities, and debt. Our financial policy is designed to give
E.ON access to a variety of financial resources at any time.
As a rule, external financing is carried out by E.ON AG or via
our Dutch financing company E.ON International Finance B.V.
under guarantee of E.ON AG and the funds are onlent as needed
within the Group.
Our financial policy is based on the following principles. First,
we use a variety of markets and debt instruments to maximize
the diversity of our investor base. Second, we issue bonds with
maturities that give our debt portfolio a broadly balanced
maturity profile. Third, we combine large-volume benchmark
issues with smaller issues that take advantage of market
opportunities as they arise.
In October 2007, E.ON launched its financing program with a
3.5 billion benchmark bond, followed by a £1.5 billion bench-
mark bond (also in October) and a debut CHF 425 million
bond in the Swiss bond market (in November). Our bonds
denominated in euros and pounds sterling were significantly
oversubscribed and placed with a large number of institu-
tional investors. The Swiss-franc bonds were publicly offered
in Switzerland only and were also placed with a large number
of investors. Our successful bond issues demonstrate that
investors support our corporate and financial strategy.
The following E.ON bonds are outstanding:
52
Bonds Issued by E.ON International Finance
Issue volumeand currency
EUR 4,250 million
CHF 200 million
GBP 500 million
EUR 1,750 million
CHF 225 million
EUR 900 million
EUR 1,750 million
GBP 600 million
GBP 975 million
GBP 900 million
Term
7 years
3 years
10 years
5 years
7 years
15 years
10 years
12 years
30 years
30 years
Maturity
May 2009
Dec 2010
May 2012
Oct 2012
Dec 2014
May 2017
Oct 2017
Oct 2019
June 2032
Oct 2037
Coupon
5.750%
3%
6.375%
5.125%
3.25%
6.375%
5.5%
6%
6.375%
5.875%
Listing
Luxembourg
SWX Swiss Exchange
Luxembourg
Luxembourg
SWX Swiss Exchange
Luxembourg
Luxembourg
Luxembourg
Luxembourg
Luxembourg

In the secondary market, E.ON bonds developed differently
in the first half and the second half of 2007. In the first half
of the year, the risk premiums (spreads) of E.ON bonds nar-
rowed (for our euro-denominated bonds) or remained largely
unchanged (for our bonds denominated in British pounds
sterling). In the second half of the year, the spreads widened
significantly driven by the mortgage-lending crisis in the
United States and a negative overall mood in the market.
Credit default swaps, indicators of the current price of hedg-
ing E.ON’s credit risk, followed this pattern.
E.ON bonds are included in all relevant bond indices, in par-
ticular the iBoxx Utilities A, iBoxx Utilities, and iBoxx Non-
Financials A. Selection for inclusion in indices is subject to
criteria, such as a bond’s rating, maturity, and minimum
trading volume.
E.ON bonds were issued under our existing Debt Issuance
Program (“DIP”). In December 2007, the DIP’s volume was
raised from 10 billion to 30 billion. Translated into our
reporting currency, we had 13 billion in bonds outstanding
under our DIP at year end 2007.
In addition to our DIP, we have a 10 billion European Com-
mercial Paper under which we can issue short-term commer-
cial paper. We had utilized 1.8 billion of this program as of
year end 2007.
E.ON successfully increased its existing syndicated credit
facility from 10 billion to 15 billion. The facility consists of
two tranches. The increase was achieved by raising the
short-term tranche from 5 billion to 10 billion. The short-
term tranche was also extended for an additional 364 days
to November 27, 2008. The long-term tranche has a volume
of 5 billion and matures on December 2, 2011. As of year
end 2007, our credit facility had not been utilized. Notes 26
and 27 to the Consolidated Financial Statements contain
detailed information about E.ON’s liabilities, contingencies,
and commitments.
Following the announcement of our new investment plan
for the period 2007–2010, on May 31, 2007, Moody’s con-
firmed its long-term rating for E.ON at A2 with a stable out-
look. Previously, Moody’s had reduced its long-term rating
for E.ON from Aa3 to A2 following E.ON’s announcement
that it had signed an agreement with Enel and Acciona to
acquire certain assets. Moody’s short-term rating for E.ON
remained unchanged at P-1.
On June 12, 2007, Standard & Poor’s lowered its long-term
rating for E.ON from AA- to A (stable outlook) and its short-
term rating from A-1+ to A-1 following the announcement of
E.ON’s revised strategy on May 31, 2007.
Moody’s A2 rating and Standard & Poor’s A rating take into
consideration the increase in our planned investments and
the resulting increase in our debt. Both agencies anticipate
that the key figures relevant for E.ON’s rating will remain
compatible with the A2 and A ratings despite our increased
investments and debt.
53To Our ShareholdersSupervisory Board Year in Review Combined Group Management Report Additional Information Market Units Corporate Governance Consolidated Financial Statements Tables and Explanations
Outlook
Stable
Stable
Moody’s
Standard & Poor’s
Longterm
A2
A
Shortterm
P-1
A-1
E.ON AG Ratings

Asset Situation
As of December 31, 2007, total equity and liabilities amounted
to 137.3 billion, 9.7 billion more than the figure for Decem-
ber 31, 2006. Non-current assets increased by 10 percent, due
principally to the inclusion of our new activities in Russia,
Portugal, Spain, and the United States. As of the balance-
sheet date, non-current assets and current assets accounted
for 77 percent and 23 percent, respectively, of total equity
and liabilities, largely unchanged from year end 2006. Our
equity ratio was 40 percent, also unchanged from December 31,
2006.
The following key figures underscore that the E.ON Group
has a solid asset and capital structure:
• Non-current assets are covered by equity at 52 percent
(year end 2006: 53 percent).
• Non-current assets are covered by long-term capital at
102 percent (year end 2006: 102 percent)
Notes 4 to 18 to the Consolidated Financial Statements
contain additional information about our asset situation.
Our positive earnings situation, solid increase in value, and
good financial key figures are indicative of the E.ON Group’s
outstanding financial condition at year end 2007.
54
in millions
Non-current assets
Current assets
Total assets
Equity
Non-current liabilities
Current liabilities
Total equity and liabilities
Dec. 31, 2007
105,804
31,490
137,294
55,130
52,402
29,762
137,294
%
77
23
100
40
38
22
100
Dec. 31, 2006
96,488
31,087
127,575
51,245
46,947
29,383
127,575
%
76
24
100
40
37
23
100
Consolidated Assets, Liabilities, and Equity

55To Our ShareholdersSupervisory Board Year in Review Combined Group Management Report Additional Information Market Units Corporate Governance Consolidated Financial Statements Tables and Explanations
Financial Statements of E.ON AG
E.ON AG prepares its Financial Statements in accordance with
the German Commercial Code and the German Stock Corpo-
ration Act. E.ON AG’s net income for 2007 amounts to 5,116 mil-
lion compared with 2,572 million in the prior year. After
transferring 2,526 million to retained earnings, net income
available for distribution totals 2,590 million.
E.ON AG’s income from equity interests increased by 3,534 mil-
lion to 7,244 million, primarily because certain non-recurring
effects led to higher income transferred under profit- and loss-
pooling agreements. Income transferred under profit- and
loss-pooling agreements (including income from group allo-
cations) with E.ON Energie AG totaled 4,806 million and
with E.ON Ruhrgas Holding GmbH 2,090 million.
The negative figure recorded under other expenditures and
income (net) improved by 331 million year on year to –250 mil-
lion. This resulted from the one-time discounting of long-term
noninterest-bearing tax credits that occurred in the prior year
and the revaluation of provisions for pensions.
Twenty-five million of the shares purchased under the share
buyback program were cancelled in 2007, which reduced
E.ON AG’s capital stock by 65 million. The 65 million was
added to additional paid-in capital pursuant to Section 237,
Paragraph 5 of the German Stock Corporation Act; this
reduced retained earnings by 3,114 million.
Income taxes include current taxes for 2007 and the prior year.
In 2006, the first-time capitalization of noninterest-bearing
tax credits reduced the tax expense pursuant to new stan-
dards contained in Germany’s Bill on the Tax Features for the
Introduction of the European Corporation, partially offset by
the effects of supplementary tax payments for previous years.
At the Annual Shareholders Meeting on April 30, 2008, man-
agement will propose that net income available for distribu-
tion be used to pay a cash dividend of 4.10 per share, a
22 percent increase. The solid development of our operating
earnings enables us to pay out a higher dividend for the
ninth year in a row. We believe this makes E.ON stock even
more attractive to investors.
If the number of ordinary shares is reduced as a result of
the repurchase of own shares by the time of the Annual
Shareholders Meeting, we plan to amend the proposed reso-
lution in such a way that the amount proportionate to those
repurchased shares (at an unchanged distribution of 4.10
per ordinary share) be carried forward as income.
The complete Financial Statements of E.ON AG, with the
unqualified opinion issued by the auditors, Pricewaterhouse-
Coopers Aktiengesellschaft, Wirtschaftsprüfungsgesellschaft,
Düsseldorf, will be announced in the electronic Bundes-
anzeiger. Copies are available on request from E.ON AG and
at www.eon.com.
Disclosures on Takeover Barriers
The disclosers pursuant to Section 289, Paragraph 4, and Sec-
tion 315, Paragraph 4 of the German Commercial Code are in
the chapter Disclosures on Takeover Barriers and Explana-
tory Report of the Board of Management on pages 83–84 of
this report.
in millions
Intangible assets and property,plant, and equipment
Financial assets
Non-current assets
Receivables from affiliatedcompanies
Other receivables and assets
Liquid funds
Current assets
Total assets
Equity
Special items with provisioncomponent
Provisions
Liabilities to affiliated companies
Other liabilities
Total equity and liabilities
2007
158
27,667
27,825
20,466
2,569
1,634
24,669
52,494
14,076
414
3,191
30,388
4,425
52,494
December 31
2006
166
22,253
22,419
18,779
2,667
338
21,784
44,203
14,669
410
3,150
23,785
2,189
44,203
Balance Sheets of E.ON AG (Summary) in millions
Income from equity interests
Interest income
Other expenditures and income
Income from continuing operationsbefore income taxes
Income taxes
Net income
Net income transferred to retainedearnings
Net income available fordistribution
2007
7,244
–557
–250
6,437
–1,321
5,116
–2,526
2,590
2006
3,710
–539
–581
2,590
–18
2,572
–362
2,210
Income Statement of E.ON AG (Summary)

Strategic Human Resources (“HR”)
HR at the E.ON Group is based on OneHR, our groupwide HR
strategy. OneHR is derived from E.ON’s corporate strategy,
the E.ON values and behaviors, and the changing environ-
ment in which our company operates. HR forms the founda-
tion on which E.ON employees and managers successfully
execute our corporate strategy. We’ve defined 11 strategic
fields of action which encompass specific initiatives and pro-
grams.
Two of the principal challenges of today’s labor market are
a declining number of qualified candidates and an aging
workforce. We meet these challenges through concrete ini-
tiatives that comprise the Demographics/Staff Planning
field of action. The purpose of these initiatives is to identify
demographic risks early. Closely related are our activities to
maintain our people’s employability and retain their expert-
ise and experience for our company. For this purpose,
E.ON Academy continues to further enhance our groupwide
employee education programs and create new learning
methods, such as the establishment of function-specific
academies for all relevant job families.
We adopted an employer brand with the slogan “Your energy
shapes the future” to help us compete for the best job candi-
dates and secure E.ON a lasting position as a top employer.
The purpose of our Talent Management activities is to identify,
recruit, develop, and retain people with high potential. It
includes our targeted support for top-talented female employees
and our programs to further expand international employee
exchange. These measures are designed to promote diversity
and equality, contribute substantially to the company’s success,
and reflect E.ON’s increasing internationalization.
Our company faces special challenges when its structure
changes through the creation or integration of new units.
The Change Management field of action aims to support
change processes and prepare our managers for dealing
with change.
The Life Balance field of action consists of a wide variety of
programs, from flex-work to childcare and eldercare services.
The aim is to establish a healthy work-life balance as a com-
pany value and to cultivate a work environment that enables
our employees to balance their career with their family and
personal lives.
Many of our existing HR activities are already based on the
fields of action and our HR strategy of recruiting and retain-
ing the best employees, helping employees acquire the skills
they need to move into management functions, and creating
an attractive work environment.
Employees56
People Vision
People Mission
People Strategy
Operational Excellence
Best People Right Leaders Energizing Environment
Demographics/
Workforce Planning
Competence Management
Employer Branding
Diversity
Employability
We strive for cost-efficient, professional, and competitive operational excellence
Leadership
Talent Management
Performance Management
Change Management
Life Balance
Health Management
Common HR Standards Common HR Services Common HR IT Systems
HR enables E.ON's
employees and leaders to fulfill E.ON's vision

57To Our ShareholdersSupervisory Board Year in Review Combined Group Management Report Additional Information Market Units Corporate Governance Consolidated Financial Statements Tables and Explanations
Occupational Safety
E.ON continues to be a leader in occupational health and
safety. And we continue to improve. In 2007, E.ON recorded a
lost-time injury frequency (“LTIF”: the number of lost-time
job-related injuries per million hours work) of 3, a 25-percent
improvement on the prior-year figure. This improvement is
the result of our systematic commitment to promoting a
safety culture among E.ON employees and the contractor
employees who work at our facilities and above all the link-
ing of occupational safety to management incentives as well
as a continual reporting process. Despite these efforts, we
regret to report that four E.ON employees and nine contrac-
tor employees lost their lives on the job in 2007. This is un-
acceptable and has spurred us to initiate a comprehensive
package of measures to do even more to promote a safety
culture. As part of a project called Safe.TEG, top executives
will undergo an external assessment to help them take a
self-critical approach towards identifying potential areas for
improvement. We will also continue with our Supplier Man-
agement project, which is aimed at ensuring that contractor
employees enjoy the same occupational safety as E.ON
employees, and expand our reporting system in order to
increase transparency. In addition, E.ON established Execu-
tive Safety Councils to ensure that safety always comes first
in our operations.
Health Management
E.ON has a long tradition of employee health management.
Colon cancer screening, smoke cessation courses, and a vari-
ety of company sports programs are just some of our offer-
ings. By embedding health management in our OneHR strat-
egy and coordinating it centrally at the Corporate Center,
we’re underscoring our belief that investing in our employ-
ees’ health adds sustainable value to our organization.
Employer Branding
E.ON was chosen as one of Germany’s top 20 employers of
2007 in an employer ranking conducted by karriere magazine
and the geva-institut. E.ON Ruhrgas again performed
extremely well in external rankings and was chosen as one
of Germany’s Best Employers of 2007 and one of the Best
Workplaces in Europe 2007, a ranking of the top 100 employ-
ers in Europe.
In winter semester 2007/2008, a program called E.ONSup-
portINGStudents was introduced across Germany. The pro-
gram supports engineering students by offering them insights
into engineering’s practical applications, opportunities to
network, mentoring, and financial support. The program will
admit 30 students from across Germany each year.
E.ON Graduate Program
Since it was launched in 2005, this program has accepted
120 trainees groupwide, of whom 45 have already completed
the program successfully and started their careers with our
company. In the fall of 2007, E.ON Gas Distributie in Romania
became our first subsidiary in Eastern Europe to take part in
the program.
HR Development: Talent Management
We launched our new Senior Management Potentials pro-
gram in July 2007. The revamped program offers promising
employees a variety of individually tailored learning and
development opportunities to help them acquire the personal
and professional skills they need to become senior managers.
Global Placement supports these employees along their
development path towards senior management by ensuring
that they are given preference in our systematic, groupwide
hiring processes.
Groupwide training and development expenses (course
costs) amounted to around 78 million in 2007 (excluding
OGK-4, Airtricity, and E2-I). The majority of this training is
conducted by E.ON Academy, our corporate university.
1.20.8
1.20.8
U.S. Midwest
4.54.2
1.72.6
Nordic
6.24.8
2.93.7
U.K.
6.35.4
4.43.0
Central Europe
8.25.8
4.13.7
Pan-EuropeanGas2
6.05.0
4.03.0
E.ON Group
Lost-time Injury Frequency1
1The number of lost-time job-related injuries per million hours work.2Excludes E.ON Gaz România.
0 1 2 3 4 5 6 7 8
2004 2005 2006 2007
2007 Target

Top Executives
The E.ON Group’s increasing international expansion has a
direct impact on how we manage the careers of our top
executives. In addition to an increase in the number of
manager exchanges between market units, top managers
increasingly require international experience. Proven E.ON
managers, including members of the Executive Pool, were
selected for key positions in our newly acquired companies,
while some country-specific management positions were filled
with managers from the region. At the companies we acquired,
we were successful in retaining the existing leadership.
Compensation, Pension Plans,Employee Participation
Attractive compensation and appealing fringe benefits are
essential to a competitive work environment. By redesigning
and standardizing our company pension plans in Germany,
we have ensured that these features will remain key compo-
nents of E.ON’s attractive compensation plans going forward.
Another factor in employee retention is enabling them to
participate in their company’s success. In 2007, Level 3 senior
managers in Germany were included in the second tranche
of the E.ON Share Performance Plan, broadening access to
the program beyond top executives. In addition, we increased
the appeal of the employee stock purchase program by
increasing the company’s contribution. In 2007, 22,184 employees
purchased a total of 373,905 shares of E.ON stock. Participa-
tion increased to 59 percent from 54 percent in the prior year.
Employees in the United Kingdom also have a Share Incentive
Plan that enables them to buy E.ON stock at favorable terms.
Embedding OneE.ON in the Workplace
Launched in 2004, OneE.ON is a process for cultivating a
shared vision and shared values and behaviors across our
organization. Regular corporate activities help embed our
guiding principles in the workplace. In May 2007, we held the
first E.ON Olympics. Under the slogan Sports Unite, the event
brought together 900 E.ON employees at Munich’s Olympic
Stadium, where they demonstrated their drive for excellent
performance and their teamwork in 17 individual and team
disciplines.
In June 2007, we held our third OneE.ON Day. The event
focused on two themes, improving teamwork and negotiat-
ing change.
E.ON Employee Opinion Survey (“EOS”)
In September 2007, we conducted our third groupwide EOS.
Eighty-one percent of employees participated. The EOS is a
recognized and well-established management and commu-
nications tool that supports the implementation of E.ON’s
strategy and facilitates dialog between employees and man-
agement.
According to the survey, employee satisfaction stands at
around 80 percent, which represents a high to very high level
compared with other large corporations. The survey also
showed increases in employees’ identification with E.ON,
their commitment to our corporate values, and their trust in
E.ON’s management. The focus areas for 2008 are to support
change processes and to fine-tune our organization so that
it enables our employees to deliver their best performance.
Workforce
On December 31, 2007, the E.ON Group had 87,815 employees
worldwide, about 9 percent more than at year end 2006. In
addition, E.ON had 2,656 apprentices and 287 board members
and managing directors.
The slight increase in Central Europe’s workforce compared
with year end 2006 was due primarily to the hiring of former
apprentices who had completed their training.
Employees58
+/– %
+1
–2
+7
+2
+3
–
+9
–
Central Europe
Pan-European Gas
U.K.
Nordic
U.S. Midwest
Corporate Center/New Markets2
Total
Discontinued operations3
2007
44,051
12,214
16,786
5,804
2,977
5,983
87,815
474
December 31
2006
43,546
12,417
15,621
5,693
2,890
445
80,612
473
Employees1
1Figures do not include apprentices, managing directors, and board members.2Includes OGK-4, E.ON Climate & Renewables.3Consists of WKE.

59To Our ShareholdersSupervisory Board Year in Review Combined Group Management Report Additional Information Market Units Corporate Governance Consolidated Financial Statements Tables and Explanations
The number of employees at Pan-European Gas declined
mainly due to efficiency-enhancement measures at E.ON Gaz
Distributie in Romania.
U.K.’s workforce was higher due to headcount increases in
the Retail and Energy Services businesses.
The increase in Nordic’s workforce was primarily the result
of the strategy in some business areas to replace contractor
staff with internal staff and the acquisition of an energy services
company.
The number of employees at U.S. Midwest rose by about 3 per-
cent since year end 2006 due mainly to the construction of
the Trimble County 2 generating unit and capital expansion
projects.
At year end 2007, the Corporate Center/New Markets segment
had 5,983 employees. This increase is primarily attributable
to the acquisition of OGK-4 (a Russian power producer with
approximately 5,300 employees) and wind-farm operators
E2-I and Airtricity.
Gender and Age Profile, Part-Time Staff
At the end of 2007, around 28 percent of our employees were
women. Going forward, we want this figure to increase,
particularly the percentage of women in management posi-
tions. Currently, 10 percent of our senior managers and 4 per-
cent of our top executives are women.
At year end 2007, our average employee was about 41 years
old and had worked for us for about 14 years. A total of 6,195
E.ON Group employees were on a part-time schedule, of whom
4,438, or 72 percent, were women. Employee turnover result-
ing from voluntary terminations averaged around 4 percent
across the organization.
Geographic Profile
At year end 2007, the E.ON Group employed 53,200 people,
or 60.6 percent of our workforce, outside Germany. This rep-
resents an increase from the figure of 46,598 employees, or
57.8 percent of our workforce, for year end 2006. This is
largely attributable to the acquisition of OGK-4, a Russian
power producer.
Apprentice Programs
E.ON has always placed great emphasis on apprentice pro-
grams. In 2007, apprentices accounted for more than 7 per-
cent of the E.ON Group’s workforce in Germany, a further
improvement from the prior years.
Established in 2003, the E.ON training initiative continued in
2007. Beyond our regular apprenticeship programs, over 600
young people in Germany were offered prospects for the
future through vocational training or an internship to prepare
them for training. In another component of our training ini-
tiative , 430 disadvantaged young people received prepara-
tory training for a future apprenticeship at 19 project locations.
Germany
United Kingdom
Romania
Sweden
Russia
Hungary
USA and Canada
Czech Republic
Bulgaria
Other2
Dec. 31, 2007
37,414
17,143
10,568
5,466
5,320
4,958
3,077
2,562
2,357
1,893
Employees by Region1
1Includes board members, managing directors, and apprentices.2Includes Italy, the Netherlands, Poland, Finland, Norway, Denmark, and certainother countries.
Central Europe
Pan-European Gas
E.ON AG/Other
E.ON Group
Dec. 31, 2007
2,369
276
11
2,656
Apprentices in Germany

60
Research and Development (“R&D”)
In 2007, E.ON significantly enhanced its R&D to promote the
introduction of new technologies. Our wide range of R&D
activities aims to increase energy efficiency, conserve resources,
and improve economic efficiency.
R&D expenditures totaled 37 million in 2007 against 27 mil-
lion in the prior year. Overall, 190 employees work in R&D at the
E.ON Group: 70 at Central Europe, 55 at U.K., 34 at Pan-European
Gas, 24 at Nordic, and 7 at U.S. Midwest.
Innovative ideas often result from the interaction between
basic research and practical experience. For this reason, E.ON
enhanced its support for basic research and increased funding
for energy research at universities and institutes to 5.5 million.
E.ON’s investments in new technology (which include support
for university research, R&D, and demonstration projects)
totaled 83 million in 2007 compared with 57 million in the
prior year.
Innovative technologies are the backbone of our company.
As part of our groupwide research initiative called innovate.on,
we launched a number of large-scale demonstration projects
for new technologies in 2007. Going forward, we will continue
to focus on promising key technologies that will help us meet
the challenge of delivering an economically priced, environ-
mentally friendly, and secure supply of energy. Once devel-
oped in our R&D programs, processes are put into practical
application.
Examples of our R&D projects in 2007:
• carbon capture at Karlshamn power plant in Sweden
• research on carbon storage as part of an EU project in
Germany
• upgrading of biogas to pipeline quality for injection
into the natural gas pipeline system at demonstration
facilities in Germany
• a pilot unit to study the corrosive effects of co-firing
biomass in the United Kingdom
• applied research through the test of batteries to store
electricity in the United Kingdom
• scientific field study with approximately 80 heat pumps
that have replaced old oil furnaces in residential dwellings
• tests with a variety of natural gas heat pumps that con-
serve fuel by tapping a renewable resource: the heat of
outside air.
A detailed description of our activities in the area of new
technologies is on pages 80–82 of this report.
This program has been a true success over the past ten
years, with over 75 percent of its graduates having found an
apprenticeship or a job. We have another program aimed at
helping physically and mentally challanged people find a job
at an E.ON company in Germany. The program is part of a
national initiative run by German Federal Ministry for Labor
and Social Security.
Overview of the Compensation Systems for theBoard of Management and Supervisory Board
We have compiled a Compensation Report for the 2007
financial year which provides an overview of the compensa-
tion systems for the Board of Management and Supervisory
Board and each board member’s compensation within the
E.ON Group. The report applies the regulations of the Ger-
man Commercial Code amended to reflect the Management
Board Compensation Disclosure Law as well as the princi-
ples of the German Corporate Governance Code. The Com-
pensation Report, which is to be considered part of this
Combined Group Management Report, can be found in the
Corporate Governance Report on pages 117–121 and there-
fore does not appear here. Information about board com-
pensation for E.ON AG is shown in the Notes to the Financial
Statements of E.ON AG.

61To Our ShareholdersSupervisory Board Year in Review Combined Group Management Report Additional Information Market Units Corporate Governance Consolidated Financial Statements Tables and Explanations
Corporate Responsibility (“CR”)
CR is becoming an increasingly important issue, both in our
view and that of the general public. The framework for our CR
efforts is the continually changing economic, environmental,
and social landscape within which we operate as well as the
many and varied expectations and interests of our stakeholders.
We strive to be an energy-industry leader in CR. Our aim is to
earn, maintain, and enhance our stakeholders’ trust and to
anticipate changes in our business environment and incorpo-
rate these insights into our decision-making processes, enabling
us to actively manage commercial opportunities and risks
and maximize shareholder value and the benefit to society.
We enlarged our CR organization in 2007 with the aim of
making CR an even more integral part of our corporate cul-
ture and business processes. We added staff, including staff
with international experience, to the CR department in the
Corporate Center to give it the resources to engage in the
strategic development and groupwide implementation of
our CR strategy. Our CR Council, which was formed in 2005,
is our groupwide committee for CR issues. It is composed of
board members from our market units, professional staff
from departments in the Corporate Center, and an employee
representative. The council advises and supports the E.ON
Board of Management in identifying groupwide CR focus
areas and setting objectives. CR managers and departments
at our market units are responsible for overseeing the imple-
mentation of CR initiatives.
We defined a groupwide climate-protection target in 2007.
By 2030 we aim to halve our specific carbon-dioxide emissions
compared with 1990 levels. To meet this target, we plan to
make substantial investments in renewables and in more
efficient power plants. In 2007, we also redesigned our group-
wide “Energy for Children” initiative, which focuses on early
childhood education in energy and environmental issues. We
plan to launch the initiative in 2008.
E.ON’s commitment to transparent reporting is demonstrated
by the CR Report we published in May 2007, which received
an A+ rating—the highest rating possible—from the interna-
tionally recognized Global Reporting Initiative. This rating
was one of the reasons E.ON was for the first time included
in the Dow Jones Sustainability World and STOXX indices as
a responsible company. Our performance in other external
ratings improved, as well. For example, we moved from 25th
to 16th position in Accountability’s international rating of
Fortune 100 companies.
In 2008, we will roll out a revamped CR strategy that better
embeds CR in our corporate strategy. Going forward, one of
our key tasks will be to integrate the new market units into
our CR effort.
Our new CR Report will be published in May 2008 and will
also be available at www.eon.com.

Risk Report62
Risk Management System
E.ON views the management of opportunities and risks as
a normal and conscious aspect of managing our business.
Consequently, our risk management system consists of a
number of components that are embedded into E.ON’s entire
organizational structure and processes. As a result, our risk
management system is an integral part of our business and
decision-making processes. The key components of our risk
management system include our groupwide guidelines and
reporting systems; our standardized groupwide strategy,
planning, and controlling processes; Internal Audit activities;
the separate groupwide risk reporting conducted pursuant to
the Corporate Sector Control and Transparency Act (“KonTraG”);
and the establishment of risk committees. Our risk manage-
ment system is designed to enable management to recog-
nize risks early and to take the necessary countermeasures. We
continually review our groupwide planning, controlling, and
reporting processes to ensure they remain effective and effi-
cient. As required by law, the effectiveness of our risk man-
agement system is reviewed regularly by our Internal Audit
and our Independent Auditors.
Risk Management and Insurance
E.ON Risk Consulting GmbH, a wholly owned subsidiary of
E.ON AG, is responsible for insurance-risk management in
the E.ON Group. It develops and optimizes solutions for E.ON’s
operating risks by using insurance and insurance-related
instruments and secures the necessary coverage in interna-
tional insurance markets. To this end, E.ON Risk Consulting
GmbH is, among other things, responsible for management
of client data and insurance contracts, the accounting of risk
covering and claims, and all associated reporting.
Risk Committee
Pursuant to the provisions of Section 91, Paragraph 2 of the
German Stock Corporation Act relating to the establishment
of a risk-monitoring and early warning system and to the mini-
mum requirements for risk management and for the use of
financial instruments at industrial companies contained in
the German Minimum Requirements for Risk Management
(“MaRisk”), the E.ON AG Board of Management has estab-
lished a Risk Committee for E.ON AG. The Risk Committee,
which consists of representatives of key E.ON AG divisions
and departments, is responsible for ensuring that the risk
strategy for commodity and credit risks defined by the
Board of Management is implemented, complied with, and
further developed.
Risk Situation
In the normal course of business, we are subject to a number
of risks that are inseparably linked to the operation of our
businesses. The E.ON Group, and thus E.ON AG, is exposed to
the following categories of risk:
Market RisksOur market units operate in an international market environ-
ment that is characterized by general risks relating to the
business cycle and by increasingly intense competition that
could reduce our margins. Liberalization of the German elec-
tricity market caused prices to decrease beginning in 1998.
Since 2001, prices have increased. Retail prices now exceed
1998 levels, and prices for sales to distributors and industrial
customers have also increased. These price increases have
generally been driven by increases in the price of fuel as well
as additional taxes and levies. There was strong public criti-
cism in the fall of 2007 in response to the announcement of
electricity increases to take effect on January 1, 2008. Faced
with rising energy costs, we cannot rule out the possibility
of future electricity price increases. As a result, we expect
to face increasing political pressure. Adjusted for taxes and
other levies, German wholesale and retail electricity prices
are in the midrange for Europe. Outside Germany, increased
competition from new market entrants and existing market
participants could adversely affect our U.K. or Swedish mar-
ket share in both the retail and wholesale sectors. In addi-
tion to our operations in the United Kingdom and the Nordic
countries, we are also subject to competitive pressure on
margins in Eastern and Southern Europe and in other elec-
tricity markets where we are already present or in new elec-
tricity markets we may enter. E.ON Ruhrgas also faces risks
associated with increased competition in the gas sector. We
use a comprehensive sales management system and inten-
sive customer management to minimize these risks.

63To Our ShareholdersSupervisory Board Year in Review Combined Group Management Report Additional Information Market Units Corporate Governance Consolidated Financial Statements Tables and Explanations
Commodity Price Risks The E.ON Group’s business operations are exposed to com-
modity price risks. In order to limit our exposure to these risks,
we pursue systematic risk management. The key elements of
our risk management are, in addition to the above-mentioned
binding groupwide guidelines and groupwide reporting sys-
tem, the use of quantitative key figures, the limitation of
risks, and the strict separation of functions between depart-
ments. To limit commodity price risks, we utilize derivative
financial instruments that are commonly used in the market-
place. These instruments are transacted with financial insti-
tutions, brokers, power exchanges, and third parties whose
creditworthiness we monitor on an ongoing basis.
Our energy business mainly uses electricity, gas, coal, carbon
emission, and oil price hedging transactions to limit its
exposure to risks resulting from price fluctuations, to opti-
mize systems and load balancing, and lock in margins. Our
energy business also engages in proprietary commodity
trading in accordance with detailed guidelines and within
narrowly defined limits. The face value of energy derivatives
amounted to 57,204 million as of December 31, 2007. Their
market value was –353 million.
Financial RisksWe also use systematic risk management to manage our
interest-rate and currency risks.
As of December 31, 2007, the nominal value of interest rate
and foreign currency derivatives was 48,238 million; their
market value was 615 million.
E.ON’s operating activities and use of derivative financial
instruments expose E.ON to credit default risks. We use a
groupwide credit risk management system to systematically
monitor the creditworthiness of our business partners and
regularly calculate our credit default risk. We review our
business partners’ credit ratings by means of existing crite-
ria for creditworthiness.
Furthermore, there are potential risks due to possible changes
in the value of short-term and long-term securities. These
risks are managed by appropriate asset management. We
carry out both short-term and long-term financial planning
to monitor and manage liquidity risks.
Strategic RisksOur business strategy involves acquisitions and investments
in our core business. This strategy depends in part on our
ability to successfully identify and acquire companies that
enhance our energy business on acceptable terms. In order
to obtain the necessary approvals for acquisitions, we may
be required to divest other parts of our business or to make
concessions or undertakings which materially affect our
operations. In addition, there can be no assurances that we
will be able to achieve the benefits we expect from any
acquisition or investment. For example, we may fail to retain
key employees, may be unable to successfully integrate new
businesses with our existing businesses, may incorrectly
judge expected cost savings, operating profits, or future mar-
ket trends and regulatory changes, or may spend more on
the acquisition, integration, and operations of new businesses
than anticipated. Furthermore, investments and acquisitions
in new geographic areas or lines of business require us to
become familiar with new markets and competitors and
expose us to commercial and other risks. These considera-
tions also apply to the package of strategic initiatives we
adopted in 2007 and to our 60 billion investment program
for the period through 2010.

Risk Report64
We have comprehensive processes in place to manage these
potential risks. These processes include, in addition to the
relevant company guidelines and manuals, comprehensive due
diligence, legally binding contracts, a multi-stage approvals
process, and shareholding and project controlling. Compre-
hensive post-acquisition integration projects also contribute
to successful integration.
Operational RisksTechnologically complex production facilities are involved in
the production and distribution of energy. Significant parts
of Europe and North America have experienced major power
outages in recent years. The reasons for these outages vary,
although generally they involved a locally or regionally inad-
equate balance between power production and consump-
tion, with single failures triggering a cascade-like shutdown
of lines and power plants following overload or voltage
problems. The likelihood of this type of problem has increased
in recent years following the liberalization of EU electricity
markets, partly due to an emphasis on unrestricted cross-bor-
der physically settled electricity trading that has resulted in
a substantially higher load on the international network,
which was originally designed mainly for purposes of mutual
assistance and operations optimization. As a result, there
are transmission bottlenecks at many locations in Europe,
and the high load has resulted in lower levels of safety
reserves in the network. In Germany, where power plants
are located in closer proximity to population centers than in
many other countries, the risk of blackouts is lower due to
shorter transmission paths and a strongly meshed network.
In addition, the spread of a power failure is less likely in Ger-
many due to the organization of the German power grid into
four balancing zones. Nevertheless, our German or interna-
tional electricity operations could experience unanticipated
operating or other problems leading to a power failure or shut-
down. Operational failures or extended production stoppages
of facilities or components of facilities could negatively impact
our earnings.
The following are among the comprehensive measures we
take to address these risks:
• systematic employee training, advanced training, and
qualification programs
• further refinement of our production procedures and
technologies
• regular facility and network maintenance and inspec-
tion
• company guidelines as well as work and process instruc-
tions
• quality management, control, and assurance
• project, environmental, and deterioration management
• crisis-prevention measures and emergency planning.
Should an accident occur despite the measures we take, we
have a reasonable level of insurance coverage.
In addition, there are currently certain risks relating to legal
proceedings resulting from the E.ON Group’s operations.
These in particular include legal actions and proceedings
concerning alleged price-fixing agreements and anticompeti-
tive practices. In addition, there are lawsuits pending against
E.ON AG and U.S. subsidiaries in connection with the disposal
of VEBA Electronics in 2000. E.ON Ruhrgas is a party to a
number of different arbitration proceedings in connection
with the acquisition of Europgas a.s. and in connection with
gas delivery contracts entered into with Gas Terra B.V.,
Gasversorgung Süddeutschland GmbH, and Norsk Hydro
Produksjon ASA. Court actions, governmental investigations,
and proceedings, and other claims could be instituted or
asserted in the future against companies of the E.ON Group.
We attempt to minimize the risks of current and future legal
proceedings by managing these proceedings appropriately
and by designing appropriate contracts prior to agreements
being concluded.
Increasing competition in the natural gas market and increas-
ing trading volumes at notional trading points and gas
exchanges could result in risks for natural gas purchased
under long-term take-or-pay contracts. On the other hand,
these contracts between producers and importers are sub-
ject to periodic adjustments to current market forces.

65To Our ShareholdersSupervisory Board Year in Review Combined Group Management Report Additional Information Market Units Corporate Governance Consolidated Financial Statements Tables and Explanations
External RisksThe political, legal, and regulatory environment in which the
E.ON Group does business is a source of external risks. Changes
to this environment can lead to considerable uncertainty with
regard to planning.
• In December 2007, Germany enacted amendments to its
law against restraints on competition that will lead to a
considerable broadening of antitrust oversight in Ger-
many’s electricity and natural gas markets. The amend-
ments took effect on January 1, 2008. We are currently
unable to quantify the effects the amendments will
have on E.ON. The German Federal Cartel Office (“FCO”)
is expected to launch a test proceeding in the energy
industry some time in 2008.
• As part of an anticompetitive practices case, the FCO is
investigating the treatment of CO2 emission allowances
as a cost factor in the price of electricity. The outcome
of the proceeding against E.ON is uncertain.
• The European Commission carried out investigations at
the premises of several energy companies in Europe,
including E.ON AG and some of its affiliates, in May and
December 2006. These were followed by requests for
information regarding a number of regulatory and energy-
market-related issues of E.ON Energie and E.ON Ruhrgas.
The two companies have responded to these requests.
On July 18, 2007, the Commission initiated formal antitrust
proceedings against E.ON Ruhrgas and Gaz de France
for alleged infringements of Article 81 of the European
Community Treaty. The Commission has pointed out that
the initiation of proceedings does not imply that there
is conclusive proof of an infringement. In connection
with the investigations in the electricity sector, E.ON has
proposed to the Commission to divest its transmission
system and a certain amount of generating capacity.
After conducting a market test, the Commission will
make a legally binding decision and not continue any
antitrust proceedings relating to the electricity sector.
• E.ON Ruhrgas filed a complaint with the State Superior
Court in Düsseldorf against the FCO’s decision of Janu-
ary 13, 2006, relating to long-term gas supply contracts;
the complaint related mainly to the competitive injunc-
tion contained in the FCO’s order. The court dismissed
this complaint on October 4, 2007. E.ON Ruhrgas has
appealed the court’s decision to the Federal Supreme
Court of Justice, Germany’s highest appellate court for
civil and criminal cases.
• In September 2007, the European Commission published
draft versions of a third package of energy legislation
designed to establish a competitive, non-discriminatory,
and transparent EU internal energy market. E.ON expressly
supports these objectives. In our view, however, some of
the proposed measures and mechanisms will not serve
to promote competition or the development of cross-
border regional markets. In particular, this applies to
regulatory oversight over power and gas trading and to
the ownership unbundling of electricity and transmis-
sion systems or, as an alternative, the creation of inde-
pendent system operators. E.ON believes that requiring
companies to relinquish ownership of assets and regu-
lating competitive markets will not serve to enhance
competition, ensure non-discriminatory access to net-
work infrastructure, or integrate regional markets. We
believe it makes more sense to systematically move
forward with European market integration, particularly
by expanding cross-border transfer infrastructure,
further integrating cross-border energy trading, and
prudently applying existing competition and antitrust
mechanisms.
• Germany’s incentive regulation ordinance took effect in
November 2007, with incentive regulation to begin on
January 1, 2009. Under Germany’s Energy Law of 2005,
the current cost-based, rate-of-return model for network
charges is to be replaced by incentive regulation in
order to create additional incentives for enhancing the
efficiency of network operations. In principle, we sup-
port the rapid introduction of a reasonable incentive
system. However, a number of useful suggestions made
by network operators affected by the legislation were
not incorporated into the incentive regulation ordi-
nance. It remains to be seen whether the regulations
will in all areas lead to efficiency-enhancement targets
that can be achieved and surpassed. Germany’s Federal
Network Agency must establish benchmarks for all
affected network operators by the middle of 2008 and is
currently developing a methodology and establishing
criteria. Because the Federal Network Agency must still
determine major parameters (namely, the benchmarks
themselves as well as the allowed return on equity and
the investment budgets), we cannot at this time reliably
assess the consequences of incentive regulation.
• Currently, E.ON Gastransport’s network charges are mar-
ket based. We cannot rule out the possibility that the
Federal Network Agency rules against market-based net-
work charges during the course of 2008. In this case,
E.ON Gastransport could be migrated to the incentive
system effective January 1, 2010.

Risk Report
• The second round of the network charges approvals
process for 2008 is currently under way. The results will
serve as the basis for the incentive regulation system.
We cannot rule out the possibility that this will pose a
risk to our future earnings situation, since it is becoming
apparent that the Federal Network Agency is interpret-
ing the law in a one-sided manner prejudicial to network
operators. In addition, if the Federal Network Agency
significantly reduces the network charges submitted for
approval, it may, in individual cases, be necessary for us
to record impairment charges on our network operators
affected by such rulings.
• In late 2007, the German Federal Network Agency initiated
consultation proceedings to reform the model for the
Germany’s gas industry’s control- and balancing-energy
market. The agency envisages a fundamental reform of
the control- and balancing-energy market. Energy indus-
try trade associations are currently in negotiations with
the agency to define a target model. Although it is unclear
at this time what the target model will look like, the new
model is supposed to be introduced on October 1, 2008,
resulting in legal uncertainty for market participants. It
is doubtful whether the target model can be fully imple-
mented on October 1, since it is unlikely that all the nec-
essary preconditions will be in place by this date.
• Legal uncertainty surrounding the implementation of
national allocation plans in certain EU member states
could result in some installations in the energy industry
affected by emission-allowance trading having difficul-
ties with allocation of CO2 emission allowances.
• In January 2008, the European Commission presented a
package of legislative proposals on the implementation
of EU climate-protection targets, the continuation of
emission-allowance trading, carbon storage, and support
for renewable-source electricity. The environmentally
motivated reorganization of Europe’s energy supply sys-
tem will affect energy companies but also create new
lines of business.
We try to manage these risks by engaging in an intensive
and constructive dialog with government agencies and
policymakers.
We could be subject to environmental liabilities associated
with our nuclear and conventional power operations that
could materially and adversely affect our business. In addi-
tion, new or amended environmental laws and regulations
may result in significant increases in our costs.
E.ON Ruhrgas currently obtains approximately 26 percent of
its total natural gas supply from Russia pursuant to long-
term supply contracts. Recent events in some Eastern Euro-
pean countries have heightened concerns in parts of West-
ern Europe about the reliability of Russian gas supplies.
Historically cold temperatures in Russia in the winter of
2005–2006 increased gas consumption, leading some West-
ern European countries to report declines in pressure in gas
pipelines and shortfalls in the volume of gas they received
from Russia. In addition, a dispute between Russia and
Ukraine over the imposition of significant price increases on
Russian gas delivered to Ukraine at the beginning of 2006
led to interruptions in the supply of Russian gas to Ukraine
(and through Ukraine to other countries) in early 2006. In
late 2006, a similar price dispute between Russia and
Belarus led to Belarus blocking the transit of gas and oil
through that country, while in early 2007 Poland attempted
to raise transit fees charged for Russian gas and oil being
shipped to Western Europe through Poland, leading to spec-
ulation that Gazprom might retaliate by halting gas and oil
shipments. Economic or political instability or other disrup-
tive events in any transit country through which Russian gas
must pass before it reaches its final destination in Western
Europe can have a material adverse effect on the supply of
such gas, and all such events are completely outside the
control of E.ON Ruhrgas. Although E.ON Ruhrgas has to date
not experienced any interruptions in supply or declines in
delivered gas volumes below those guaranteed to it under
its long-term contracts, no assurance can be given that such
66

interruptions or declines will not occur. Any prolonged inter-
ruption or decline in the amount of gas delivered to E.ON
Ruhrgas under its contracts with Gazprom, its subsidiaries or
any other party would result in E.ON Ruhrgas having to use
its storage reserves to make up the shortfall with respect to
amounts it is contracted to deliver to customers and could
have a material adverse effect on E.ON’s results of operations
and financial condition.
The demand for electric power and natural gas is seasonal,
with our operations generally experiencing higher demand
during the cold weather months of October through March
and lower demand during the warm weather months of
April through September. The exception to this is our U.S.
power business, where hot weather results in an increased
demand for electricity to run air conditioning units. As a
result of these seasonal patterns, our sales and results of
operations are higher in the first and fourth quarters and
lower in the second and third quarters, with the U.S. power
business having its highest revenues in the third quarter
and secondary peaks in the first and fourth quarters. Rev-
enues and results of operations for all of our energy opera-
tions can be negatively affected by periods of unseasonably
warm weather during the autumn and winter months, as
occurred at some of our market units in 2006 and/or 2007.
Our Nordic market unit could be negatively affected by a
lack of precipitation (which would lead to a decline in hydro-
electric generation, as occurred in 2006), and our European
energy operations could also be negatively affected by a
summer with higher-than-average temperatures to the
extent our plants would be required to reduce or shut down
operations due to a reduction in the availability of cooling
water. We expect seasonal and weather-related fluctuations
in sales and results of operations to continue.
IT RisksThe operational and strategic management of the E.ON
Group relies heavily on complex information technology. Our
IT systems are maintained and optimized by qualified E.ON
Group experts, outside experts, and a wide range of techno-
logical security measures. In addition, the E.ON Group has in
place a range of technological and organizational measures
to counter the risk of unauthorized access to data, the mis-
use of data, and data loss.
Management’s Evaluation of the Risk Situation
During the year under review, the E.ON Group’s risk situation
did not change substantially from the prior year. From today’s
perspective, we do not perceive any risks in the future that
would threaten the existence of the E.ON Group or individual
market units.
67To Our ShareholdersSupervisory Board Year in Review Combined Group Management Report Additional Information Market Units Corporate Governance Consolidated Financial Statements Tables and Explanations

Forecast
New Organizational Structure
By further optimizing our organizational structure, we aim to
take advantage of the opportunities created by the ongoing
integration of European and global energy markets.
To seize the earnings and growth opportunities of energy-
market integration, we are taking action to organize and
manage our businesses—in particular our energy trading
and power generation businesses—on a pan-European scale.
At the start of 2008, we centralized all our European trading
activities in power, gas, coal, oil, and CO2 emission allowances.
We also combined our renewables operations (with the excep-
tion of hydroelectricity) and our climate-protection operations
and plan to expand this business globally.
In October 2007, we acquired a majority stake in OGK-4, a
major Russian power producer, marking our successful entry
into one of the world’s most interesting and fastest-growing
electricity markets.
Pursuant to the agreement we concluded with Enel and
Acciona in April 2007, we will acquire a substantial portfolio
of assets in 2008, primarily in Spain, Italy, and France.
In view of these changes, the following new market unit
lead companies have, or will, become operational in 2008:
• E.ON Energy Trading, Düsseldorf, began operations at
the start of 2008. It combines all our European trading
activities in electricity, gas, coal, oil, and CO2 allowances.
• E.ON Climate & Renewables, Düsseldorf, is responsible
for managing and expanding our global renewables
business and for coordinating climate-protection projects.
Its generation portfolio consists of about 760 MW of
generating capacity in Europe and 250 MW in North
America. Roughly 3,000 MW of new capacity are at vari-
ous stages of construction and planning.
• E.ON Russia Power oversees our power business in Russia.
Through OGK-4, we have around 8,600 MW of generating
capacity in the fast-growing, heavily industrialized regions
of Central Russia, Ural, and Western Siberia.
• E.ON Italia, Milan, manages our power and gas business
in Italy. E.ON is already active in Italy’s wholesale power
and gas markets and in natural gas sales. The planned
acquisition of Endesa Italia will give us about 5,000 MW
of generating capacity in Italy, making us the country’s
fourth-largest power producer.
Initially, only Energy Trading will be disclosed as a separate
reporting segment in the 2008 financial year. The other share-
holdings will be combined in the Corporate Center/New Markets
segment. During the course of the year, we will decide on
the future form of our segment reporting based on the new
market units’ respective business development, volume, and
significance.
Macroeconomic Situation
The German Council of Economic Experts (“GCEE”) predicts
that the global economy will expand at a slower pace in 2008
than in 2007. In view of the U.S. economy’s expected weak-
ness, brought on by the mortgage lending crisis and slower
growth in domestic demand, the EU and Japan are also expected
to expand at a slower pace.
Energy prices will lead to lower inflation in the United States,
whereas inflation in the EU is expected to stay at the same
level as in 2007.
The GCEE expects the EU economy to grow by 2.3 percent in
real terms. Economic growth in some EU countries relevant
for our operations (Spain, Sweden, the Netherlands) is fore-
cast to be above average, in others (Germany, the United
Kingdom, France) below average. Central and Eastern Euro-
pean countries are expected to continue on their robust,
largely domestically driven growth path, although at a slightly
slower pace.
The GCEE expects Germany’s economy to expand by 1.9 per-
cent in 2008 in real terms and consumer prices to rise by
2.2 percent, maintaining their high rate of increase.
68

Energy Industry
The future development of Germany’s energy industry will
be determined in part by the German federal government’s
Integrated Climate Protection and Energy Package. Its pur-
pose is to substantially change Germany’s energy mix, which
would have considerable consequences for our business.
The policy’s targets for 2020 are for Germany to:
• derive 25 to 30 percent of its electricity from renewable
sources
• derive 25 percent from cogeneration
• achieve an additional reduction in electricity consump-
tion of up to 11 percent.
On the other hand, the debate about the allocation of CO2
emission allowances in Europe underscores the importance
of establishing a transparent and properly designed emission
trading scheme as a mechanism for enhancing climate pro-
tection. Substantial uncertainty currently surrounds forecasts
of CO2 emission allowance prices. The future development of
prices depends primarily on how restricted the allocation of
allowances is. The long-term development of allowance prices
will be determined primarily by the way emissions trading is
handled on a global scale.
Industry observers predict that prices will remain at high levels
for the foreseeable future. The International Energy Agency
made a significant upward correction to its long-term oil
price projection compared with last year. The reason for the
correction is that the oil price increases of the last three
years have not had the same negative impact on the global
economy that they had in the 1980s. Natural gas and oil products
are competing fuels in many applications, so their prices
will likely continue to move in tandem in the future. As for
coal, increased production in conjunction with increased
demand is expected to result in stable price development
over the long term, leading to a wider spread between coal
and oil prices.
Supported by European subsidy programs, renewable energies
are playing an increasingly important role and account for
a continually increasing share of the energy supply.
The global supply of uranium is secure, access to it is very good,
and uranium has a high energy content. These three factors
serve to enhance nuclear power’s role in energy supply and
its contribution to security of supply. Furthermore, as an
emission-free energy source, nuclear power is a significant
factor in Europe’s ability to achieve its emission-reduction
targets under the Kyoto Protocol. In the EU, these aspects are
receiving considerable attention in the policymaking debate
about nuclear energy and have led some countries to extend
the operating lives of existing nuclear power stations and to
build new ones.
Employees
The E.ON Group’s workforce is expected to increase to 95,000
(excluding trainees, board members, and managing directors)
by year end 2008, with the growth coming primarily through
the addition of our new market units and hiring at the U.K.
market unit.
Earnings
For 2008 we expect the E.ON Group’s adjusted EBIT to again
surpass the high prior-year figure and to increase by 5 to
10 percent. Our forecast includes our expectation to acquire,
during the course of 2008, a substantial portfolio of assets
as part of our agreement with Enel and Acciona. Further
earnings drivers will be operational improvements in our
electricity business as well as the ongoing implementation
of efficiency-oriented measures.
We anticipate a slight increase in adjusted net income for
2008, with operating improvements partially offset by higher
interest expenses.
In 2008, we have made substantial changes to our organiza-
tional structure, in particular the centralization of our European
trading operations. Consequently, a segmented comparison
with prior-year figures would have little informational value.
Therefore, for 2008 we will issue earnings forecasts for the
E.ON Group only, not for our individual market units.
69To Our ShareholdersSupervisory Board Year in Review Combined Group Management Report Additional Information Market Units Corporate Governance Consolidated Financial Statements Tables and Explanations

Dividends
We will continue with our dividend payout ratio of 50 to
60 percent of adjusted net income. In view of our EBIT targets
and the effects of our share buyback, we expect to continue
to increase our dividend per share by an average of 10 to
20 percent per year for the period through 2010.
Investments
Our investment plan reflects the implementation of the
growth plan we announced in May 2007. Our investments in
organic and external growth will serve to cement and system-
atically enlarge our strong market positions in power and
gas. E.ON plans to invest a total of approximately 28 billion
in 2008.
About 16 percent of these investments are for maintenance
and replacement in our existing business and about 84 per-
cent for growth. Investments are significantly higher relative
to 2007, primarily due to our planned external growth initiatives.
The figure shown under Corporate Center/New Markets pri-
marily reflects the acquisition of assets pursuant to E.ON’s
agreement with Enel und Acciona and the planned asset swap
with Statkraft. The figure for Central Europe includes the
planned acquisition of operations in France, which is also
part of the agreement with Enel and Acciona. The figure for
Pan-European Gas includes the acquisition of a stake in
Yushno Russkoye.
Organic growth investments total about 6.3 billion and will
serve mainly to increase our electric generating capacity,
expand our renewables business, and enlarge our upstream
and midstream natural gas businesses.
About 4.5 billion of our investments will serve to maintain
and replace existing facilities. The main focus will be to
secure our existing generating capacity and to update and
maintain our electric distribution and transmission systems.
Financial Situation
Through 2010, we intend to take on a total of approximately
30 billion in debt at the corporate level. This includes the
refinancing of existing bonds. We aim to achieve a broad
mix of different markets, investors, currencies, and maturities.
Opportunities
Based on groupwide guidelines, the lead companies of all
our market units as well as certain departments at E.ON AG
report, on a yearly basis at the end of the fourth quarter, their
opportunities that are sufficiently concrete and substantial.
An opportunity is substantial within the meaning of E.ON
guidelines if it could have a significantly positive effect on
a market unit’s asset, financial, or earnings situation.
Positive developments in interest rates, foreign currency rates,
and market prices for the commodities electricity, natural gas,
coal, oil, and carbon can create opportunities for our business
operations.
The Energy Trading market unit, which began operations at
the start of 2008, will enable us to seize opportunities created
by the increasing integration of the European power and
gas markets and of global commodity markets. In view of
market developments in the United Kingdom and Continental
Europe, trading at European gas hubs can create additional
sales and procurement opportunities.
Forecast70
Economic Value of 2008 Planned Investments1
Central Europe
Pan-European Gas
U.K.
Nordic
U.S. Midwest
Corporate Center/New Markets
19
11
6
4
3
57
Percentages Total: 28 billion
1Cash-effective capital investments plus debt acquired, long-term rental and lease obligations, and asset swaps.

In addition, the ongoing optimization of natural gas transport
and storage rights could yield additional opportunities.
Periods of exceptionally cold weather—very low average
temperatures or extreme daily lows—in the fall and winter
months can create opportunities for us to meet higher demand
for electricity and natural gas. Periods of exceptionally hot
weather in the summer months can create opportunities for
our U.S. Midwest market unit to meet the greater demand
for electricity resulting from increased air conditioning use.
The E.ON procurement network enables us to achieve con-
siderable synergies by aggregating procurement volume
internationally. Transferring best practices groupwide also
enables us to further reduce the cost of the goods and ser-
vices we procure. In particular, the optimization of technical
specifications for procurement amounts and the use of proven,
uniform procurement processes across the organization can
yield cost advantages. In view of our upcoming major invest-
ments in new generating capacity, the pooling of expertise
at the New Build unit and the Climate & Renewables market
unit in 2007 paved the way for us to centralize procurement
for all power plant construction projects and to best realize,
across all our markets, synergies in technology and procurement.
Our investment policy is aimed at strengthening and enlarg-
ing our leading position in our target markets and enabling
us to systematically seize opportunities, including opportuni-
ties in future markets.
Overall, we expect the E.ON Group’s business to develop posi-
tively in 2008 and 2009. From today’s perspective, we are
unable to issue a reliable forecast for 2009 due to uncertainty
surrounding economic, foreign-currency, regulatory, techno-
logical, and competition-related developments.
To Our ShareholdersSupervisory Board Year in Review Combined Group Management Report Additional Information Market Units Corporate Governance Consolidated Financial Statements Tables and Explanations
This Combined Group Management Report contains certain forward-looking statementsbased on E.ON management’s current assumptions and forecasts and other currentlyavailable information. Various known and unknown risks, uncertainties, and other factorscould lead to material differences between E.ON’s actual future results, financial situation,development or performance and the estimates given here. E.ON assumes no liabilitywhatsoever to update these forward-looking statements or to conform them to futureevents or developments.
We’ve pledged to halve our relative carbon-dioxide
emissions. It’s a pledge we aim to keep. That’s why
we’re investing 6 billion in renewables through
2010. And why every new conventional power plant
we build in Europe will emit significantly less CO2
than the benchmarks set by the EU.
+ + + Climate Protection + + +

72

73
More wind farms are underconstruction or in planning andwill be completed within thenext four years.
Adding more windto the mix
E.ON acquires a wind-farm operator inSpain and Portugal.In August 2007, we significantly expanded our
wind-power business and entered the highly
attractive Spanish and Portuguese wind-power
markets by acquiring ENERGI E2 Renovables
Ibéricas.
Our new subsidiary, which now does business as
E.ON Renovables Iberia, has about 260 megawatts
of installed renewables capacity, predominantly
wind power. It’s an ideal platform from which to
expand our wind-power business in Southern
Europe.
Wind power, which emits no CO2, is an important
ingredient in a climate-friendly energy mix. With
high-quality wind farms in favorable locations
like the Iberian Peninsula, we can help protect
the climate in an economically sensible way.
We also entered the world’s most attractive
renewables market by acquiring Airtricity in
North America. With a total installed wind-power
capacity of about 900 megawatts, we now rank
among the world leaders in this generation tech-
nology. And by sharing expertise and best prac-
tices across our global organization, we can make
our wind-power operations even more efficient.
Wind power is just one of the ways E.ON fosters
climate protection. We also actively support the
EU’s energy-policy agenda and are working hard
to reduce our generation fleet’s CO2 emissions.

Strategy and Planned Investments74
The foundation for our targeted growth strategy is an inte-
grated business model that creates value through vertical
integration along the entire value chain, horizontal integration
between power and gas, and regional integration of European
markets.
Our presence in all of Europe’s main energy markets gives us
an outstanding market position and the world’s most geo-
graphically diversified generation portfolio. Although our bid
for Endesa wasn’t successful, the agreement we reached
with Enel and Acciona will significantly strengthen our posi-
tion across Europe.
E.ON is superbly positioned to meet the new challenges of
its changing European market environment. We’re well on
the way towards realizing our vision of becoming the world’s
leading power and gas company.
European Market and CompetitionThe environment for E.ON’s strategy is influenced mainly by
the following factors:
• Europe’s energy markets are becoming more integrated
as an EU-wide internal market for energy begins to take
shape.
• Competition is increasing as markets become more
liberalized.
• EU and national governments are enacting climate-
protection measures which aim to reduce CO2 emis-
sions, particularly in the power generation industry.
• Energy companies are expected to ensure security of
supply in an environment of increasingly scarce primary
energy sources and scarcity at other links of the value
chain, including generation equipment, engineering per-
sonnel, and sites suitable for building new power plants.
• A number of countries in and on the periphery of Europe
are becoming attractive growth markets.
Our strategy for the future contains our endorsement of
open and integrated energy markets and our active support
of the EU’s energy-policy agenda. In Germany, the measures
we’ve taken include the expansion of power and gas cross-
border transfer capacity, an initiative to deliver greater
transparency on the availability of our generation fleet, and
the creation of E WIE EINFACH (“E as in Easy”), our new nation-
wide power and gas retail subsidiary, which sends a clear
signal for more competition in Germany’s retail market.
Our presence in all the major European energy markets enables
us to benefit substantially from Europe’s ongoing market lib-
eralization. We’re also combining some operations in order
to seize opportunities created by the integration of European
energy markets. A noteworthy example of this is our new
Energy Trading market unit which brings together the trading
operations formerly carried out by a number of our organiza-
tional entities across Europe.
Power Generation Europe will need to add generating capacity in the years ahead
to ensure that it maintains a secure and reliable supply of
electricity. During this process, we’ll invest to maintain and
grow our generation portfolio in order to cement and expand
our market position, while at the same time setting new
standards for energy efficiency and environmental protection.
Security of Supply + + + Climate Protection + + + Growth
E.ON invests in state-of-the-art generation technology.Datteln 4 is a state-of-the-art coal-fired generating unit
we’re building about 15 miles north of Dortmund in
west-central Germany. As with all our new power plants,
Datteln 4 incorporates the best available technology
and practices. In fact, Datteln 4 and two other E.ON
power plants—Maasvlakte 3 in the Netherlands and
Staudinger 6 in Germany—will have the same design,
which will reduce costs substantially. And all three will
have a high thermal efficiency (about 46 percent),
enabling them to emit roughly 20 percent less CO2 than
a typical coal-fired plant.

75To Our ShareholdersSupervisory Board Year in Review Combined Group Management Report Additional Information Market Units Corporate Governance Consolidated Financial Statements Tables and Explanations
We intend to expand our installed generating capacity in
Europe by 50 percent to 69 GW by 2010. The assets we expect
to acquire in France, Italy, and Spain under our agreement
with Enel and Acciona will put us a long way towards achiev-
ing this goal. Most of the rest of our capacity growth will
come from the construction of new power plants.
Type
Hard coal
CCGT
Renewables
Total
Country
DE
DE
DE
NL
GB
US
BE
RU
EU
DE
DE
IT
HU
SK
GB
SE
RU
RU
RU
EU
EU/US
Unit
Datteln 4
Staudinger 6
50 Plus
Maasvlakte 3
Kingsnorth
Trimble County 2
Antwerp
Berezovskaya
Other projects
Irsching 5
Irsching 4
Livorno Ferraris
Gönyü 1
Malzenice
Grain
Malmö
Shaturskaya
Surgutskaya
Yaivinskaya
Other projects
Miscellaneous
Nameplatecapacity
in MW
1,100
1,100
550
1,100
1,600
750
1,100
800
2,000
845
530
800
400
400
1,275
440
410
800
400
3,200
3,500
23,100
Entersservice
2011
2013
2014
2012
2013
2010
2014
2010
>2014
2009
2011
2008
2010
2010
2010
2009
2009
2010
2010
>2011
by 2011
Major Planned Power Plant Construction Projects1
1Excludes construction projects resulting from the acquisition of Viesgo.
Natural Gas Production To help secure Europe’s supply of natural gas, our main
upstream objective is to source at least 10 billion cubic meters
of natural gas per year from our own production assets. Our
acquisition in mid-2007 of a stake in Skarv and Idun, gas
fields in the Norwegian Sea, brought us a good deal closer
to this objective. We plan to achieve additional growth in
our production portfolio through the acquisition of stakes in
other gas fields and through our own exploration projects.
Natural Gas StorageWe intend to double our working gas capacity in Northwest-
ern Europe by 2015 in order to enhance supply reliability and
respond more flexibly to fluctuations in demand. We’ll achieve
this goal mainly by increasing capacity at existing storage
facilities.
Security of Supply + + + Climate Protection + + + Growth
E.ON builds its first power plant in Italy.With a thermal efficiency of 58 percent, our new com-
bined-cycle gas turbine in Livorno Ferraris, Italy, sets new
standards for environmental performance. The 800 MW
unit, which is scheduled to begin commercial operation
in the second half of 2008, will generate enough electric-
ity to supply a city the size of Milan, which has 1.2 million
inhabitants. It ideally complements our existing operations
in Italy’s power trading and wholesale market.

Strategy and Planned Investments76
RenewablesOne of our strategic priorities is to expand our renewables
business worldwide. Our successful acquisitions—ENERGI E2
Renovables Ibéricas in Spain and Portugal and Airtricity North
America—gave us an installed wind-power capacity of about
900 MW at year end 2007. Going forward, our focus will be
on completing the approximately 3,500 MW of renewables
projects we have under construction and in planning as well
as developing other renewables technologies.
New MarketsWe also aim to grow by entering new markets and by
acquiring shareholdings through the privatization of state-
owned energy companies. We successfully entered Russia’s
attractive electricity market by acquiring OGK-4, a power
producer. We’re examining privatization opportunities in, for
example, Southeastern Europe and Turkey.
Climate ProtectionOur climate-protection target is to halve our specific CO2
emissions by 2030 compared with 1990 levels by deploying
new technologies (such as carbon capture and storage in
conventional power plants) and by expanding our renewable-
source generating capacity.
Our investment plan shows that we’re implementing the growth
program we announced in May 2007. Our investments in
organic and external growth will serve to cement and system-
atically enlarge our strong market positions in power and gas.
The E.ON Group’s medium-term plan for the period 2008–2010
contains investments totaling €49.9 billion, 27 percent of
which are earmarked for maintaining our existing business
and 73 percent for growth.
The plan reflects our reporting structure for the 2007 financial
year (see the E.ON Corporate Profile on the inside front cover
of this report). Investments in new markets are shown in the
Corporate Center/New Markets segment. The new Climate &
Renewables market unit, which will be responsible for our
renewables business, began operations on January 1, 2008.
For the purposes of this report, renewables investments are
allocated to the market units under the reporting structure
in effect in 2007.
Central Europe plans to invest €14.3 billion between 2008
and 2010, mainly in the construction and modernization of
power plants. Key components are the maintenance and
expansion of our generation portfolio in Western Europe. In
addition to our investments in coal-fired power plants in
Central Europe
Pan-European Gas
U.K.
Nordic
U.S. Midwest
Corporate Center/New Markets
28.7
12.0
11.4
6.0
3.4
38.5
Percentages Total: €49.9 billion
Economic Value of PlannedInvestments (2008–2010)1
1Cash-effective capital investments plus debt acquired, long-term rental andlease obligations, and asset swaps.
Security of Supply + + + Climate Protection + + + Growth
E.ON acquires wind farms in North America.The acquisition of Airtricity North America marks the
first time E.ON’s renewables business has established a
strong market position with substantial growth potential
outside of Europe. The move expands our wind-power
portfolio—we now rank among the world’s biggest wind-
farm operators—and makes it more geographically diverse.

Germany, we plan to build a coal-fired power plant in the
Netherlands (Maasvlakte) and another in Belgium (Antwerp).
Two additional combined-cycle gas turbines (“CCGTs”) will be
built at Irsching power station. Central Europe is also planning
to build a number of coal-fired and gas-fired power plants in
Eastern Europe, including Slovakia (Malzenice) and Hungary
(Gönyü). Another focus will be on the expansion of Central
Europe’s renewable-source generating capacity and invest-
ments in its power and gas networks, of which the largest
single investment will be for the infrastructure necessary to
connect offshore wind turbines to the transmission system.
Pan-European Gas plans to invest €6 billion, mainly in its gas
production portfolio. Investments in transport and storage
infrastructure are also planned in order to make gas procure-
ment more flexible and to ensure supply security.
U.K. plans to invest a total of about €5.7 billion. One focus
will be on renewing its generation fleet by building a highly
efficient coal-fired power plant and two gas-fired combined
heat and power (“CHP”) plants. U.K. also plans to increase its
renewable-source power and heat generating capacity, par-
ticularly in wind power. Investments are likewise earmarked
for the modernization of the distribution system.
Nordic plans to invest €3 billion, mainly to update its electric
distribution network in Sweden and to update, expand, and
enhance the performance of its generation portfolio. Among
these projects is the completion of the CHP plant under con-
struction in Malmö.
U.S. Midwest’s planned investments of €1.7 billion include
environmental protection measures at existing power plants
and improvements to power and gas networks. The comple-
tion of Trimble County 2, a coal-fired generating unit, is the
largest single project.
Our investment plan also includes the planned acquisition of
assets in France, Italy, and Spain under the agreement we
reached with Enel and Acciona as well as other growth invest-
ments in new markets.
European energy markets are changing rapidly.
We’re changing with them. We’ve adjusted our organi-
zational structure for three key business areas—
energy trading, renewables, and the construction
of conventional power plants—to make them more
focused, integrated, and market-oriented.
+ + + Market-OrientedOrganization + + +

Weitere Informationen7878

7979
One market, one teamE.ON combines its European energy-trading operations.With E.ON Energy Trading, we’ve created a single, strategically focused company that
brings together all of our European energy-trading operations. The new company began
to move into its state-of-the-art, red-glass-and-steel headquarters in Düsseldorf in
January 2008.
A single company is the right organization for the future of European energy trading.
And the future is now. Our energy traders already work across national borders in all
key commodities: coal, gas, electricity, oil, and emission allowances. They think, plan,
and act on a European scale to seize the new earnings and growth opportunities created
by the integration of Europe’s energy markets. By adjusting the structure of our trading
business, we’ve forged an organization that can continue to generate significant value
going forward. And become one of Europe’s leading energy trading companies.
The creation of E.ON Energy Trading will enable us to combine our presence along the
entire value chain with our deep market expertise to leverage synergies and achieve
additional growth.
The move to Düsseldorf signalsthat E.ON is entering the future ofEuropean energy trading.
We’ve created a new market unitthat pools our trading expertisefrom regional locations acrossEurope.

New Technologies
Securing tomorrow’s supply of energy has never been more
important than it is today. To make sustainable energy a
reality and at the same time to provide E.ON with a techno-
logical platform for sustainable business success, we research,
develop, and use new technologies. This gives us a competi-
tive advantage and makes us an even more attractive employer
for top engineers. We’re finding solutions to tomorrow’s
energy challenges and living up to our commitment to corpo-
rate responsibility.
E.ON experts review our large portfolio of research projects
along the entire value chain and identify promising techno-
logies with economic potential. Key technologies receive tar-
geted investment to refine them further. Such technologies
must meet sustainability criteria and offer sufficient economic
potential. We’ve pooled these technologies into innovate.on,
our groupwide research initiative, and are actively involved
in a number of projects. Our broad international presence
enables us to develop technologies at locations where the
conditions are particularly favorable.
Investments
E.ON has significantly increased its investments in new tech-
nologies in recent years to meet the growing demand for
technical solutions. The increases primarily reflect higher
investments in large-scale demonstration projects in which
key technologies are refined for commercial use. We’ve also
increased our financial support for basic research at universi-
ties in order to further spur the development of new ideas and
approaches and to establish closer relationships with next-
generation engineers and researchers in the energy sciences.
Key Projects in 2007
Universities and Research InstitutesE.ON and RWTH Aachen University entered into a partnership
in 2006 to found the E.ON Energy Research Center (“ERC”)
on the RWTH campus. E.ON agreed to provide the ERC with
€40 million in funding over ten years. In 2007, faculty and
staff at four of the ERC’s five institutes began holding classes
and launched a number of projects. In addition to E.ON-funded
research, the ERC will conduct research projects financed by
other sources. The ERC’s research budget for 2007 totaled
€7.5 million, of which we contributed €2.5 million.
80
+ + + Climate Protection + + + Security of Supply + + +
E.ON supports research center.The E.ON Energy Research Center, a partnership between
E.ON and RWTH Aachen University, began operations in
2007. E.ON will fund the center with about 40 million
over the next ten years. Energy efficiency and climate
protection are central to E.ON’s enhanced research and
development effort.
0 20 40 60 80
2007 83
2006
2005 25
E.ON’s Investments in New Technologies
Support for university research,demonstration projects
Research and development
57
in millions

In 2007, we solicited grant proposals for research into energy
storage. The program is part of our international research
initiative. With an annual grant fund totaling roughly €6 mil-
lion, this is the first time E.ON has offered grants on this
scale. In response, we received a large number of grant pro-
posals from researchers at institutions in 11 countries. One
focus is on storage solutions for renewable-source electricity,
which is currently one of the central challenges facing the
energy industry. In 2008, we’ll solicit grant proposals on
another research topic. Information about the 2008 grant
program will be available at eon.com.
E.ON has partnered with other major corporations and the
U.K. government to found the Energy Technology Institute
(“ETI”) to support energy research at a number of universities
in central England. The ETI will receive about €1.4 billion in
funding over the next ten years, €66 million of which will
come from E.ON UK. Each pound of corporate funding will be
matched by the U.K. government.
innovate.onOur groupwide research initiative, innovate.on, has enabled us
to reach important milestones in the development of key
technologies.
We’ve chosen Wilhelmshaven in northwest Germany as the
site for the world’s first coal-fired power plant to have a
thermal efficiency of more than 50 percent. The plant will
have an installed generating capacity of 500 MW. A number
of related research projects were conducted in 2007, primarily
to test the new materials necessary to withstand steam
temperatures of 700 degrees Centigrade (nearly 1,300 degrees
Fahrenheit).
Carbon capture and storage (“CCS”) has the potential to sig-
nificantly reduce the CO2 emissions of fossil-fuel-fired gener-
ation. We’re currently looking at three carbon-capture tech-
nologies (pre-combustion, post-combustion, and oxyfuel). In
the United States, we’re part of the FutureGen Alliance
which is developing the world’s first commercial-scale coal-
fired power plant that will capture and permanently store
CO2 deep beneath the earth. All methods of carbon capture
consume energy, making power generation less efficient.
FutureGen will use pre-combustion carbon capture, which
requires less energy than other methods.
Post-combustion capture, in which CO2 is extracted from flue
gas using various solvents, requires comparatively more
energy but offers an important advantage: power plants
could be retrofitted with this technology. In partnership with
Alstom, a French manufacturer of power generation equip-
ment, we’re testing a new capture process in a pilot unit at
Karlshamn power station in Sweden. The process, which uses
chilled ammonia, promises to be less energy intensive. The
Alstom test unit, with 5 MW of thermal capacity, begins
operational trials at Karlshamn in 2008. If the test results are
positive, the efficiency gains would result in the conserva-
tion of significant amounts of fuel.
In oxyfuel combustion, coal or natural gas is burned in pure
oxygen instead of air, as in today’s generating units. Com-
pared with other methods of carbon capture, oxyfuel com-
bustion is at the earliest stage of development. In 2007, we
began testing a 1 MW oxyfuel pilot unit at Ratcliffe power
station in England. The purpose of the tests is to learn more
about combustion processes under these special conditions.
81To Our ShareholdersSupervisory Board Year in Review Combined Group Management Report Additional Information Market Units Corporate Governance Consolidated Financial Statements Tables and Explanations
Security of Supply + + + Climate Protection + + + Growth
E.ON to build a next-generation coal-fired power plantin Wilhelmshaven.E.ON will invest about 1 billion to build the world’s first
coal-fired power plant with a thermal efficiency of more
than 50 percent. The plant, part of our innovate.on research
initiative, will be located in Wilhelmshaven in northwest
Germany, have 500 MW of capacity, and enter service in
2014. Less carbon intensive than today’s coal-fired
plants, our Wilhelmshaven facility will help enhance
security of supply while protecting the earth’s climate.

New Technologies
In 2007, we took an important step forward with the con-
struction of two facilities that upgrade biogas to pipeline
quality. The facilities, in Ketzin and Schwandorf, Germany,
have tested a process called pressure swing absorption that
can be used to upgrade biogas (which is about 50 percent
methane) to the same quality as natural gas (which is more
than 95 percent methane). Upgraded biogas can then be
injected into the natural gas pipeline system. The advantage
of upgrading biogas is that, after injection into the pipeline
system, it can be used in the same energy-efficient applica-
tions that natural gas is. Most existing biogas operations use
biogas on the site where it is produced in order to generate
electricity and heat. Unfortunately, much energy is lost in
many of these applications. First, biogas-fired generating
units typically have a comparatively low thermal efficiency.
Second, the units are often located in rural areas where
much of the heat they produce is lost because there’s no dis-
trict-heating network nearby for it to be piped into. Upgrad-
ing biogas to pipeline quality makes it possible to avoid
these drawbacks.
For several years now, a team of E.ON experts in the United
Kingdom has been exploring the possibility of harnessing
marine energy. The conditions off the U.K. coast are particu-
larly favorable for this technology. In 2007, the team decided
on the size and type of equipment to be tested. The turbines,
which will be fixed to the seabed, will be capable capturing
tidal-stream energy in both directions (flood and ebb). Plans
call for the facility to enter service in 2011 and for its capac-
ity to be gradually expanded to several megawatts.
Germany’s first offshore wind farm, alpha ventus, took an
important step closer to becoming a reality with the purchase
of six wind turbines with an aggregate capacity of 30 MW. In
Germany, wind farms must be sited further out to sea. This
creates significant technical challenges: alpha ventus, a joint
project of E.ON and two other energy companies, will be sited
in the North Sea 45 kilometers (28 miles) offshore in 30 meters
(100 feet) of water. This facility, an example of cutting-edge
engineering, is scheduled to enter service in 2008.
Renewables have an enormous, as-yet-untapped potential in
numerous applications. In 2007, we began laboratory and field
tests on natural gas heat pumps from a variety of manufactur-
ers and worked with the manufacturers to further improve
the pumps’ performance. Natural gas heat pumps are space-
heating devices that draw 25 percent of the heat they produce
from a renewable source (the heat contained in the air out-
side the home or building being heated), resulting in lower
heating costs.
82
+ + + Climate Protection + + + Security of Supply + + +
E.ON to harness marine energy.To help protect the earth’s climate, E.ON is doing more
than reducing the carbon intensity of its conventional
generation fleet. We’re working to harness the clean
energy of the ocean tides. E.ON UK is planning to build
one of the world’s largest tidal energy power plants. The
plant, to be sited off the coast of Wales, would generate
enough electricity to power 5,000 homes.

83To Our ShareholdersSupervisory Board Year in Review Combined Group Management Report Additional Information Market Units Corporate Governance Consolidated Financial Statements Tables and Explanations
Disclosure of Takeover Barriers and ExplanatoryReport of the Board of Management
Disclosures Pursuant to Section 289, Paragraph 4,and Section 315, Paragraph 4 of the GermanCommercial Code (Part of the Combined GroupManagement Report)
Composition of Share CapitalThe share capital shall total €1,734,200,000.00 and consist of
667,000,000 bearer shares without nominal value. Each share
of stock grants the same rights and one vote at a Sharehold-
ers Meeting.
Restrictions on Voting Rights or the Transfer ofSharesShares acquired by an employee under the Company-sponsored
employee stock purchase program are subject to a blackout
period that begins the day ownership of such shares is
transferred to the employee and that ends on December 31
of the next calendar year plus one (that is, if ownership is
transferred on July 1, 2008, the blackout period extends to
December 31, 2010). As a rule, an employee may not sell such
shares until the blackout period has expired.
Pursuant to Section 71b of the German Stock Corporation
Act, the Company’s own shares give it no rights, including
no voting rights.
Legal Provisions and Rules of the Company’s Articlesof Association regarding the Appointment andRemoval of Board of Management Members andAmendments to the Articles of AssociationPursuant to the Company’s Articles of Association, the Board
of Management shall consist of at least two members. The
appointment of deputy Board of Management members is
permissible. The Supervisory Board shall decide on the number
of members as well as on their appointment and dismissal.
The Supervisory Board shall appoint members to the Board
of Management for a term not exceeding five years; a mem-
ber may be appointed for another term of office or the term
of office of a member may be extended for an additional
term not exceeding five years; appointment requires at least
two thirds of the votes of Supervisory Board members. If
two or more persons are appointed as members of the Board
of Management, the Supervisory Board may appoint one of
the members as Chairperson of the Board of Management. If
a Board of Management member is absent, in the event of
an urgent matter, the court shall make the necessary appoint-
ment upon petition by a concerned party. The Supervisory
Board may revoke the appointment of a member of the Board
of Management and the Chairperson of the Board of Man-
agement for serious cause (for further details, see Sections
84 and 85 of the German Stock Corporation Act and Sections
31 and 33 of the German Codetermination Act of 1976).
Pursuant to Section 179 of the German Stock Corporation Act,
an amendment to the Articles of Association shall require a
resolution of the Shareholders Meeting. Resolutions of the
Shareholders Meeting shall require a simple majority and, in
cases where a majority of the share capital is required, a
simple majority of the share capital represented, unless the
law or the Articles of Association explicitly prescribe other-
wise. The Articles of Association contain no other provisions
regarding amendments.
The Supervisory Board is authorized to decide by resolution
on amendments to the Articles of Association that affect
only their wording (Section 24 of the Articles of Association).
Furthermore, the Supervisory Board is authorized to revise
the wording of Section 3 of the Articles of Association after
complete or partial consummation of the increase of the
share capital in accordance with the respective utilization of
the authorized capital and—if the authorized capital has not
been utilized at all or not completely by April 27, 2010—after
the expiration of the authorization period. Furthermore,
the Supervisory Board is authorized to adapt the wording
of Section 3 of the Articles of Association according to the
utilization of the conditional capital.
Board of Management’s Power to Issue or BuyBack SharesPursuant to a resolution of the Shareholders Meeting of May 3,
2007, the Board of Management is authorized, until November 3,
2008, to acquire own shares up to a total of ten percent of
the share capital. The shares acquired and other own shares
that are in possession of or to be attributed to the Company
pursuant to Sections 71a et seq. of the German Stock Corpo-
ration Act must altogether at no point account for more

Disclosure of Takeover Barriers and Explanatory Report of the Board of Management
84
than ten percent of the share capital. The resolution, which
is published on the Company’s Website, contains standard
provisions regarding how shares may be acquired and how
acquired shares may be used, including the authorization to
cancel them.
Pursuant to Section 3, Paragraph 2 of the Articles of Associa-
tion, the Board of Management is, subject to the approval of
the Supervisory Board, authorized to increase the Company’s
share capital until April 27, 2010, by up to €540,000,000 by
issuing new bearer shares with no-par value against contri-
bution in cash and/or in kind once or several times (authorized
capital pursuant to Section 202 et seq. of the German Stock
Corporation Act). See Note 19 to the Consolidated Financial
Statements for more information about authorized capital.
Pursuant to a resolution of the Annual Shareholders Meeting
of April 30, 2003, the Board of Management is authorized,
subject to the approval of the Supervisory Board, until April 30,
2008, to issue, once or several times, bonds with conversion
or option rights for shares of E.ON AG with a maximum matu-
rity of 20 years from issue. The aggregate face value of the
bonds must not exceed €5,000,000,000. The aggregate face
value of the shares to be granted in the event of conversion
or option rights from this authorization being issued is
€175,000,000 at the most. Therefore, pursuant to Section 3,
Paragraph 3 of the Articles of Association, the Company’s
share capital shall be conditionally increased by up to
€175,000,000 (see Note 19 to the Consolidated Financial
Statements). The bonds may also be issued in exchange for
contributions in kind if the value of these contributions in
kind is at least equivalent to the issue price. The resolution,
which is published on the Company’s Website, contains stan-
dard provisions regarding conversion rights and obligations,
dilution protection, and, to the extent legally permissible,
the exclusion of the shareholders’ right of subscription.
Significant Agreements to which the Company Is aParty that Take Effect on a Change of Control ofthe Company Following a Takeover BidThe ministerial approval of the German Federal Minister of
Economics and Technology dated July 5/August 18, 2002,
on the proposed mergers of E.ON/Gelsenberg and E.ON/
Bergemann contains the following condition: at the direction
of the Federal Ministry of Economics and Technology, E.ON
must sell all shares in Ruhrgas AG held by it or affiliated
companies to a third party if another company acquires a
voting-rights or share-capital majority in E.ON and the
acquirer gives reasonable cause for concern that the Federal
Republic of Germany’s energy policy interests will be nega-
tively affected. The acquirer of Ruhrgas shares requires the
prior approval of the Federal Ministry of Economics and
Technology; such prior approval may be denied only if the
acquirer gives reasonable cause for concern that the Federal
Republic of Germany’s energy policy interests will be nega-
tively affected. This obligation is valid for a period of ten
years after the mergers’ consummation.
In accordance with standard market practice in comparable
contracts, the credit and guarantee facilities (“Avales”) (see
Note 26 to the Consolidated Financial Statements) contain
change-of-control clauses that give the creditor the right of
cancellation. In addition, the bonds issued in 2007 by E.ON
International Finance B.V. and guaranteed by E.ON (see Note
26 to the Consolidated Financial Statements) contain a stan-
dard change-of-control clause that is considered good corpo-
rate governance practice.
Settlement Agreements between the Company andBoard of Management Members in the Case of aChange-of-Control EventIn the event of a premature loss of a Board of Management
position due to a change-in-control event, the service agree-
ments of Board of Management members entitle them to
severance and settlement payments (see the detailed pres-
entation in the Compensation Report).

Explanatory Report of the Board of Managementon the Disclosures Pursuant to Section 289,Paragraph 4, and Section 315, Paragraph 4 of theGerman Commercial Code
The Board of Management has read and discussed the dis-
closures pursuant to Section 289, Paragraph 4, and Section 315,
Paragraph 4 of the German Commercial Code contained in
the Combined Group Management Report for the year ended
December 31, 2007, and issues the following declaration
regarding these disclosures:
The disclosures pursuant to Section 289, Paragraph 4, and
Section 315, Paragraph 4 of the German Commercial Code
contained in the Company’s Combined Group Management
Report are correct and conform with the Board of Manage-
ment’s knowledge. The Board of Management therefore con-
fines itself to the following statements:
Beyond the disclosures contained in the Combined Group
Management Report (and legal restrictions such as the
exclusion of voting rights pursuant to Section 136 of the Ger-
man Stock Corporation Act), the Board of Management is
not aware of any restrictions regarding voting rights or the
transfer of shares. The Company is not aware of shareholdings
in the Company’s share capital exceeding ten out of one
hundred voting rights, so that information on such share-
holdings is not necessary. There is no need to describe shares
with special control rights (since no such shares have been
issued) or special restrictions on the control rights of employees
shareholdings (since employees who hold shares in the
Company’s share capital exercise their control rights directly,
just like other shareholders).
With regard to the Board of Management’s power to issue
or buy back shares, the Board of Management intends to ask
the 2008 Annual Shareholders Meeting to issue it a new
authorization to acquire own shares.
To the extent that the Company has agreed to settlement
payments for Board of Management members in the case of a
change of control, the purpose of such agreements is to pre-
serve the independence of Board of Management members.
Düsseldorf, February 2008
E.ON AG
Board of Management
85To Our ShareholdersSupervisory Board Year in Review Combined Group Management Report Additional Information Market Units Corporate Governance Consolidated Financial Statements Tables and Explanations

europe.onE.ON launched a restructuring project in 2006 called europe.on
in order to better seize growth opportunities created by
the integration of European energy markets. As part of this
project, E.ON optimized its existing regional market struc-
tures in Europe and created new functionally oriented (as
opposed to geographically oriented) units that will pool
knowledge from across the organization and manage their
business on a European and, in some cases, global scale.
This groupwide project affects a number of activities at the
Central Europe market unit.
• Central Europe’s energy-trading operations (power, gas,
coal, oil, and CO2 emission allowances) at E.ON Sales &
Trading (“EST”) and E.ON Benelux will be transferred to
Central Europe Market Unit
the new Energy Trading market unit. EST’s wholesale and
marketing operations will remain part of the Central
Europe market unit.
• A New Build unit (“NBU”) will be formed at Central Europe
to manage the expansion of E.ON’s diversified and climate-
friendly generation portfolio. The NBU will be part of
E.ON Kraftwerke (“EKW”) and be responsible for the plan-
ning and construction of all of E.ON’s new conventional
power plants in Europe, ensuring that these projects are
even more closely tailored to the conditions on the
European market. In addition, all of E.ON’s engineering
expertise will in the future be combined in E.ON Engineer-
ing, E.ON’s groupwide engineering arm which is part of
the Central Europe market unit.
• A competence center for conventional generation will be
established at EKW, one for nuclear generation at E.ON
Kernkraft (“EKK”), and one for hydroelectricity at the
Nordic market unit. The purpose of the groupwide compe-
tence centers is to promote process optimization and
the implementation of best practices across the entire
organization.
• With the exception of hydroelectricity, E.ON’s renewables
operations will be managed by the new Climate & Renew-
ables market unit.
Adjusted EBIT surpasses prior-year figureeurope.on project key theme in 2007regi.on project launched
+/– %
+18
+8
+10
+3.31
+0.31
+19
–
+13
+1
2006
27,197
5,747
4,235
21.4
9.0
2,457
3,802
2,279
43,546
€ in millions
Sales
Adjusted EBITDA
Adjusted EBIT
ROCE (in %)
Cost of capital (in %)
Value added
Cash provided by operatingactivities
Investments
Employees (at year end)
2007
32,029
6,222
4,670
24.7
9.3
2,917
3,811
2,581
44,051
1Change in percentage points.
Central Europe
86

• To establish a consistent organization for its gas-storage
activities, E.ON will create a new subsidiary to be managed
by E.ON Ruhrgas.
• All of Central Europe’s operating activities in Italy, with
the exception of trading activities, will be transferred to
the new Italy market unit.
The new organizational structure will enable Central Europe
to share its expertise—particularly in power generation—
across the E.ON Group and continue to seize growth oppor-
tunities in Central Europe. The project is being implemented,
and the new companies and organizational units will begin
operations, in 2008.
regi.onCentral Europe also launched a project called regi.on in 2007.
Its purpose is to restructure our regional distribution compa-
nies (“RDCs”) in Germany in order to adapt their organiza-
tional structure to the new requirements of their customers,
market, and regulatory environment. Central Europe will con-
tinue to take a decentralized, regional approach that stresses
strong relationships with local business partners. Neverthe-
less, regi.on will lead to important changes at all key links of
the RDCs’ value chain (network, marketing, shared services):
• A new marketing management arm will be created to
coordinate and conduct strategic planning for power
and gas marketing across Germany. The operational side
of the marketing business will continue to be managed
on a regional basis.
• The network companies will be reintegrated into the RDCs.
Within each RDC, the network company and network
operations will be made organizationally separate from
technical network services functions.
• The RDCs’ metering, billing, receivables management,
and customer service functions will be combined in two
regional shared services companies.
Plans call for the new organizational structure to be imple-
mented in 2008.
Energy Price Discussion in Germany Higher energy prices have led to an intense and at times
highly emotional public debate in Germany. Increasingly, the
debate is finding resonance with the media, consumer pro-
tection organizations, antitrust authorities, and policymakers.
Some people have accused energy companies of price fixing
and market manipulation. The tone of the debate worsened
when many energy companies announced price increases
for power and gas service. Central Europe’s RDCs in Germany
raised their prices effective January 1, 2008.
87To Our ShareholdersSupervisory Board Year in Review Combined Group Management Report Additional Information Market Units Corporate Governance Consolidated Financial Statements Tables and Explanations
The Central Europe market unit denies completely any and
all accusations regarding allegedly unjustified or inexplicable
price increases, abuse of market power, price fixing, and
market manipulation.
Central Europe WestIn February 2007, the Central Europe market unit became a
pacesetter for power and gas retail competition in Germany
by creating a new retail subsidiary called E WIE EINFACH
(“E as in Easy”: “EWI”). EWI began marketing power and gas
services to residential and small-business customers across
Germany on April 1, 2007. By the end of the year, EWI already
had more than 450,000 customer accounts. EWI is currently
the only gas retailer to offer residential and small-business
customers nationwide an alternative to their incumbent sup-
plier. By creating EWI, Central Europe is successfully putting
into practice its commitment to energy-market competition in
Germany.
E.ON Energie AG’s stake in E.ON IS was transferred to E.ON
effective December 31, 2007. E.ON IS is the E.ON Group’s IT
service provider and a leading full-service provider for the
European energy industry.
BKB was transferred from EWK to E.ON Energie AG effective
October 1, 2007. BKB is now a wholly owned subsidiary of
E.ON Energie AG. Reorganization of BKB is planned for 2008.
BKB’s lignite-fired power generation business will be trans-
ferred to EKW. Waste incineration is now BKB’s core business.
Central Europe EastThe E.ON Czech Group (“E.ON Czech”) strengthened its com-
petitive position in the Czech natural gas market through an
asset swap with RWE in 2006 and through the purchase of
shares in Jihočeská plynárenská (“JČP”) from Oberösterreichische
Ferngas. Following the takeover offer and the squeeze-out
process, E.ON Czech became JČP’s sole shareholder in late
January 2007. JČP’s operating entities were merged into E.ON
Czech’s network, marketing, and service companies effective
January 1, 2007. The integration of JČP enables E.ON Czech to
offer customers both power and natural gas along with
related services.

Central Europe Market Unit
Central Europe created a Slovakian stock corporation called
E.ON Slovensko a.s. on September 22, 2007. With an organiza-
tional structure similar to those in other Eastern European
countries, it will serve as the holding company for Central
Europe’s interests in Slovakia.
The European Bank for Reconstruction and Development
(“EBRD”) acquired a 9.8-percent stake in E.ON Energie România
(“EER”), the holding company for Central Europe’s interests
in Romania, on October 11, 2007. The purpose, as previously
in Bulgaria and Slovakia, is to help shield the business from
political and regulatory risks. In contrast to the loan model
used by the EBRD for its interest in E.ON companies in Bul-
garia and Slovakia, the EBRD used an equity model for its
interest in EER. Central Europe transferred its shares in E.ON
Moldova, a regional electricity distributor, to EER prior to the
transaction with the EBRD. Following the completion of legal
unbundling, EER holds 51 percent of E.ON Moldova Distributie
(its network subsidiary) and 51 percent of E.ON Moldova
Furnizare (its marketing subsidiary). The EBRD has an indirect
stake of 5 percent in both companies.
ZEUS, which stands for Central European synergies, is a pro-
gram launched in 2005 to harmonize processes among our
subsidiaries in the Czech Republic, Slovakia, Hungary, Romania,
and Bulgaria. ZEUS is now in the implementation phase. In
2007, E.ON Czech became the first company in the ZEUS
project to adopt the new organizational architecture for its
finance, accounting, controlling, procurement, and logistics
departments and implement the necessary IT infrastructure.
New organizational architectures will be rolled out by 2010
at all companies involved in ZEUS. The collaboration of the five
Eastern European subsidiaries is expected to result in lasting
savings through, for example, joint tenders for bids and lower
operating expenditures. Harmonized processes and a shared
IT landscape will serve as the basis for business performance
management, which will yield further efficiency gains.
Companies in Central Europe East completed implementation
of the legal unbundling of their power and gas network and
marketing operations in compliance with EU directives: in
Bulgaria effective January 1, in the Czech Republic effective
April 1 for the gas business (the electricity business effective
January 1, 2006), in Romania effective April 6, and in Hungary
and Slovakia effective July 1, 2007. Legal unbundling of network
and marketing operations encompasses the separation of a
wide variety of functions including accounting, controlling,
information processes, organization, and non-discrimination
management.
88
E.ON Sales & Trading (“EST”): from Power PlantDispatch to Key Account SalesIn 2007, EST served as Central Europe’s wholesale power sub-
sidiary, combining power trading and power sales to large
customers. EST works closely with Central Europe’s national
subsidiaries and the other E.ON market units throughout
Europe. It also coordinates the dispatch of Central Europe’s
generation portfolio and offers system services to network and
power plant operators. EST is also responsible for optimizing
emission-allowance trading for the entire market unit.
EST’s power sales business developed successfully in 2007.
By offering innovative products and energy solutions, EST
cemented its strong position in Germany and, despite an
often difficult operating environment, expanded its operations
in neighboring European markets.
EST’s power-trading operation makes a key contribution to
optimizing the dispatch of Central Europe’s generation
portfolio and ensuring that it meets electricity needs across
Continental Europe. EST traded about 364 billion kWh of elec-
tricity in 2007. It traded actively on all major power exchanges
in Continental Europe. EST focused its trading operations on
Germany, Austria, the Benelux countries, and France. Other
important markets included southern and eastern European
countries, where EST contributed to the procurement opera-
tions of Central Europe’s national subsidiaries by systema-
tically utilizing all available power procurement options:
intraregional power imports and exports and bilateral trans-
actions within the individual countries.
Power Trading Volume
Billion kWh
Sales
Purchases
Total
2007
153.7
210.3
364.0
2006
201.6
222.8
424.4
+/– %
–24
–6
–14

89To Our ShareholdersSupervisory Board Year in Review Combined Group Management Report Additional Information Market Units Corporate Governance Consolidated Financial Statements Tables and Explanations
Generation Portfolio In 2007, Central Europe’s nuclear portfolio again operated safely
and reliably, achieving an average availability of 85.6 percent
and generating a total of 63 billion kWh of electricity. The
average availability of nuclear power stations operated by
EKK and of nuclear power stations in which EKK has an owner-
ship interest declined compared with 2006. The main reasons
for the decline were unscheduled outages at Krümmel and
Brunsbüttel (jointly owned nuclear power stations that are
operated by Vattenfall Europe Nuclear Energy) and a major
scheduled overhaul at Unterweser nuclear power station. We
expect Krümmel and Brunsbüttel to return to service in 2008.
Central Europe owns and operates 87 hydroelectric plants
and operates an additional 45, providing an economically
priced and environmentally friendly source of electricity.
Generation at run-of-river and pumped-storage plants and
at renewable-source generating facilities such as biomass
and wind-power plants totaled roughly 9 billion kWh in 2007.
In Germany, Central Europe owns and operates coal-, gas-,
and oil-fired generating facilities which together produced
some 63 billion kWh of electricity in 2007—enough to meet
about 10 percent of the country’s electricity needs. This ranks
EKW among Germany’s biggest conventional generators.
It’s estimated that over the next 15 years Germany will need
to replace up to 40,000 MW of generating capacity. Sizeable
replacement investments will also be necessary in other
European countries. We are currently evaluating the conse-
quences that Germany’s National Allocation Plan for phase
two of the EU Emissions Trading Scheme could have on power
plant replacement. The need to purchase more CO2 emission
allowances could render older generating facilities uneconom-
ical at an earlier date. On the other hand, extending the
operating lives of Germany’s nuclear power stations would
reduce the need to replace older facilities. Over the next
three years, Central Europe plans to invest about €6.3 billion
in its generation fleet.
Central Europe is currently carrying out a number of power
plant projects. Datteln 4, a new coal-fired unit with a name-
plate electric generating capacity of 1,100 MW, is under con-
struction at Datteln power station. It will produce electricity
and district heat and replace and enlarge Datteln’s existing
generating capacity. The new unit 4 at Irsching power station
is the world’s most powerful gas turbine. Following success-
ful operational tests, it will be expanded into a combined-cycle
gas turbine (“CCGT”) with an electric generating capacity of
530 MW. Datteln 4 and Irsching 4 are both scheduled to enter
service in 2011. Irsching 5, an 845 MW CCGT also currently under
construction, will become operational in 2009. Central Europe
intends to enter the Italian generation market by constructing
an 800 MW CCGT in Livorno Ferraris. The unit, which will be
completed in 2008, will be managed by the new Italy market
unit. A new coal-fired unit with a nameplate electric gener-
ating capacity of 1,100 MW is planned for Maasvlakte power
station located in the harbor area of Rotterdam. The unit is
expected to enter service in 2012. Also in planning is a new
coal-fired unit with a nameplate electric generating capacity
of 1,100 MW to be built at Staudinger power station.
A key component of Central Europe’s long-term generation
strategy is to maintain and expand its baseload capacity.
Consequently, in 2007 the company pushed forward with its
plans to build two more coal-fired generating units. One, to
be built in Wilhelmshaven in northwest Germany, is a 550 MW
coal-fired unit with a record-setting thermal efficiency of more
than 50 percent. The other is a 1,100 MW coal-fired unit to be
built in Antwerp, Belgium. The latter is identical in design to
the Maasvlakte, Staudinger, and Datteln coal-fired units,
which will serve to reduce construction costs.
Megawatts
Nuclear
Lignite
Hard coal
Natural gas
Oil
Hydro
Other
In Germany
Hard coal
Natural gas
Other
Outside Germany
Total
2007
8,548
1,314
7,466
4,219
1,145
3,153
406
26,251
1,099
1,039
90
2,228
28,479
December 31
2006
8,473
1,315
7,461
4,121
1,153
3,113
367
26,003
1,085
997
87
2,169
28,172
Attributable Generation Capacity

Central Europe Market Unit
Central Europe plans to expand its generation portfolio in
Central Europe East, as well, in order to back its strong posi-
tion in power distribution with its own generation assets.
Central Europe, which currently supplies about 44.5 billion
kWh of electricity in Central Europe East but only generates
about 1 billion kWh there, is committed to having a genera-
tion portfolio diversified by geography and fuel. In planning
are a 400 MW CCGT in Hungary (Gönyü) and a 400 MW CCGT
in Slovakia (Malzenice). Both are scheduled to enter service
in 2010. Central Europe is also studying whether to become
involved in a project to build and operate a nuclear power
station in Belene, Bulgaria, and hard-coal-fired and CHP units
in Romania.
Electricity NetworkE.ON Netz, which owns and operates Central Europe’s electric
transmission system in Germany, is responsible for planning,
constructing, maintaining, and operating this infrastructure.
More than 260 electricity traders used Central Europe’s wires
network as an energy pathway in 2007. The system’s peak
load was 20,671 MW, 2.4 percent above the prior-year figure.
At more than 140,000 square kilometers, E.ON Netz’s service
territory covers more than one third of Germany and extends
from the North Sea to the Alps. Its wires network is approxi-
mately 32,500 circuit-kilometers in length.
Overall, Central Europe’s electricity networks were again
extremely reliable in 2007.
Kyrill, a low-pressure system with hurricane-force winds,
damaged large sections of the network on January 18–19, 2007.
There were no outages in E.ON Netz’s ultrahigh-voltage sys-
tem. About 750,000 customers of Central Europe’s distribution
system operators experienced short power outages. By the
evening of January 19, only about 100,000 customers were
still without power. Service was restored to all customers by
the evening of January 20.
The loads placed on the electricity network by power trading
and wheeling have increased continually in recent years and
will increase further in the future. The higher loads result in
part from the increasing amount of wind power delivered
onto the system. Going forward, this amount will increase
further as offshore wind farms come online, creating an even
greater need for interregional electricity movements. As
studies by the German Energy Agency demonstrate, the elec-
tricity network will have to be expanded to handle these
demands. Many network expansion projects are already in
the approval phase.
A key component of E.ON’s competition initiative is to expand
Germany’s cross-border power infrastructure in order to
improve power transfer with its neighbors (such as the Bene-
lux countries and Austria) and to eliminate bottlenecks.
Power and Gas SalesCentral Europe grew power sales by 45.5 billion kWh to
313.7 billion kWh. The increase is mainly attributable to higher
deliveries onto Central Europe’s network of electricity pur-
suant to Germany’s Renewable Energy Law and to higher
volumes sold to sales and trading partners. Furthermore,
results include the sales volume of Italy’s Dalmine for all twelve
months compared with only one month in the previous year.
90
+ + + Competition + + +
E.ON enhances transparency in the generation business.E.ON was the first power producer in Germany to publish
comprehensive information about the availability of its
conventional generation portfolio: for each individual
generating unit, for each day, 365 days in advance. The
level of detail at www.eon-schafft-transparenz.de makes
it easier for power traders and wholesalers to analyze
the emerging supply and demand situation and forecast
prices with greater precision. The Website is in German
and English. E.ON’s transparency initiative is helping
pave the way for Europe to have a truly competitive
electricity market.

of owned generation, are due to the feed-in of more electricity
under Germany’s Renewable Energy Law and an increase in
trading activities. The above-mentioned consolidation effects
also served to increase the amount of electricity procured
from outside sources.
Sales and Earnings DevelopmentCentral Europe grew sales by about €4.8 billion relative to the
prior year. Adjusted EBIT exceeded the prior-year figure by
€435 million, with Central Europe’s businesses developing as
follows:
91To Our ShareholdersSupervisory Board Year in Review Combined Group Management Report Additional Information Market Units Corporate Governance Consolidated Financial Statements Tables and Explanations
The decline in gas sales volumes is attributable to the unsea-
sonably warm weather across many parts of Europe in the
winter and spring months. Although the inclusion of newly
consolidated companies, mainly JČP of the Czech Republic
(since September 2006) and Dalmine of Italy, had a positive
effect on gas sales volumes, overall Central Europe sold 2 per-
cent less natural gas than in the prior year.
Power Generation and ProcurementCentral Europe utilized its flexible mix of generation assets to
meet about 41 percent of its electricity requirements, com-
pared with 47 percent in the prior year. It procured 46.7 billion
kWh more electricity from outside sources than in the prior
year. This increase, and the corresponding decline in the share
€ in millions
Sales1
Adjusted EBITDA
Adjusted EBIT
Financial Highlights by Business
2006
18,829
4,596
3,636
2007
23,293
5,102
4,145
2006
4,368
496
270
2007
3,676
419
200
2006
3,469
498
266
2007
4,087
597
361
Central Europe East
2006
531
157
63
2007
973
104
–36
2006
27,197
5,747
4,235
2007
32,029
6,222
4,670
1Trading operations are recognized net.
Power Gas
Central Europe West Other/Consolidation Central Europe
Power Sales by Customer Segment1
Billion kWh
Residential and smallcommercial
Industrial and largecommercial
Sales partners
Power sales
2007
44.1
83.7
185.9
313.7
2006
45.3
77.2
145.7
268.2
+/– %
–3
+8
+28
+17
1Excludes trading operations, which are recognized net under IFRS.
Gas Sales by Customer Segment
Billion kWh
Residential and smallcommercial
Large industrial andcommercial
Sales partners
Gas sales
2007
39.2
59.5
27.5
126.2
2006
44.6
53.2
30.7
128.5
+/– %
–12
+12
–10
–2
Power Procurement1
Billion kWh
Owned generation
Purchasesfrom jointly owned power plantsfrom outside sources
Power procured
Station use, line loss,pumped-storage hydro
Power sales
2007
134.6
192.6
8.3184.3
327.2
–13.5
313.7
2006
131.3
149.9
12.3137.6
281.2
–13.0
268.2
+/– %
+3
+28
–33+34
+16
–
+17
1Excludes trading operations, which are recognized net under IFRS.
Sources of Owned Generation
Nuclear
Hard coal
Oil, natural gas
Lignite
Hydro
Other
46.2
31.6
6.9
6.4
5.4
3.5
Percentages

Contributions to Security of SupplyPan-European Gas implemented a number of projects in 2007
aimed at securing Europe’s supply of natural gas for the
long term.
In June 2007, E.ON Ruhrgas became involved in a joint ven-
ture to plan Skanled, a new pipeline to transport natural gas
from western Norway to southeastern Norway, Sweden, and
Denmark. With a 15-percent stake, E.ON Ruhrgas is one of the
biggest partners in the project, which includes a total of ten
companies from Norway, Sweden, Denmark, Germany, and
Poland. A decision on the project will be made by the end of
2009. If Skanled goes forward, it will have a capacity of about
7 billion cubic meters (“bcm”) per year, cost about €900 mil-
lion to build, and become operational by 2012 at the latest.
In November 2007, E.ON Ruhrgas concluded a long-term agree-
ment to lease and develop underground caverns in Etzel,
Germany, as a natural gas storage facility. The facility, which
will have a working gas capacity of up to 2.5 bcm, is due to
enter service in stages beginning in 2011. Underground stor-
age facilities provide a way to adjust the procurement of
natural gas from producer countries (which takes place at
about the same rate throughout the year) and the supply of
gas to customers (which is subject to significant seasonal
fluctuations).
+/– %
–1
+3
+10
+0.21
+0.61
+2
+403
+175
–2
2006
22,947
3,092
2,347
14.8
8.2
1,046
604
882
12,417
€ in millions
Sales
Adjusted EBITDA
Adjusted EBIT
ROCE (in %)
Cost of capital (in %)
Value added
Cash provided by operatingactivities
Investments
Employees (at year end)
2007
22,745
3,176
2,576
15.0
8.8
1,062
3,041
2,424
12,214
1Change in percentage points.
Pan-European Gas
92
Pan-European Gas Market Unit
Adjusted EBIT up 10 percentEurope’s natural gas supply secured for long termClimate-protection initiative launched

On October 1, 2007, the third expansion phase of the Inter-
connector, a submarine gas pipeline from Zeebrugge (Belgium)
to Bacton (United Kingdom), became operational, increasing
the pipeline’s capacity by 2 bcm to 25.5 bcm per year. E.ON
Ruhrgas has a roughly 24-percent stake in the Interconnector.
New Biomethane Company FoundedIn February 2007, E.ON Ruhrgas founded a Germany-based com-
pany, E.ON Bioerdgas, that will focus on the production and
use of biomethane, also known as renewable natural gas and
pipeline-quality biogas. The new company’s mission will be
to realize biogas’s full economic and environmental potential.
Biomethane has the same broad range of applications as
natural gas. It can be used as a fuel for electric generation or
space heating and has already been used successfully as an
alternative vehicle fuel. Biomethane is significantly more
efficient than any other biofuel, including ethanol. Because it
is carbon neutral, energy derived from biomass helps protect
the earth’s climate.
Before it can be injected into the natural gas pipeline system,
biogas must be upgraded to biomethane by removing carbon
dioxide. E.ON’s Schwandorf biomethane production facility—
the first in Germany—became operational at the start of 2008.
It ranks among the largest facilities that can be built using
today’s technology. We have other facilities in planning.
New Market Unit StructureE.ON’s new market unit structure, which took effect at the
start of 2008, had a number of effects on Pan-European Gas.
The E.ON Group will combine all its gas storage operations
in Europe in a new unit at Pan-European Gas. Thüga’s Italian
business was transferred to the new Italy market unit, oper-
ations in France will be transferred to Central Europe’s France
business unit, E.ON Bioerdgas was transferred to the new
Climate & Renewables market unit, and E.ON Ruhrgas’s trad-
ing operations were transferred to the new Energy Trading
market unit.
Preparations for Entering the LNG Business In 2007, E.ON Ruhrgas continued its preparations to enter the
liquefied natural gas (“LNG”) business. In May, it booked about
1.7 bcm of annual regasification capacity at an LNG terminal
on the Isle of Grain in the United Kingdom. The agreement
runs through 2029, with regular operations expected to begin
in October 2010. The project has synergy potential, since E.ON
93To Our ShareholdersSupervisory Board Year in Review Combined Group Management Report Additional Information Market Units Corporate Governance Consolidated Financial Statements Tables and Explanations
Ruhrgas would be able to supply fuel to a gas-fired generating
unit E.ON UK is building near the Isle of Grain terminal. The
terminal’s capacity is being expanded by roughly 6.7 bcm for
an eventual total of roughly 20 bcm per year.
E.ON Ruhrgas is studying whether to build an LNG terminal
in Wilhelmshaven, a port city in northwest Germany. In
August 2007, E.ON Ruhrgas filed to make changes to its exist-
ing terminal construction permit. The process of selecting the
building contractor, who will deliver the terminal turn-key ready,
has been under way since September 2007. E.ON Ruhrgas
also launched an open season in which market participants
can declare their interest in booking capacity, ensuring that
third parties will have non-discriminatory access to the planned
terminal’s capacity. If an investment decision is made in 2008,
the Wilhelmshaven terminal could enter service during the
2011/2012 gas industry fiscal year.
To pave the way for the construction of an LNG terminal in
Le Havre, France, in June 2007, E.ON Ruhrgas concluded an
agreement in principle and acquired a 24.5-percent stake in
Gaz de Normandie SAS, Paris, the company that will undertake
the project. Plans call for the terminal to have a capacity of
about 9 bcm per year, of which E.ON Ruhrgas’s share would be
3 bcm per year. Following the completion of additional studies
and planning, the terminal could enter service as early as 2011.
The Le Havre terminal would simplify E.ON Ruhrgas’s access
to the French market.
E.ON Ruhrgas also made further progress with its plan, begun
in 2006, to build an LNG terminal on the Croatian island of
Krk. For this purpose, a consortium, which includes E.ON
Ruhrgas, formed a Zagreb-based company called Adria LNG
d.o.o. Plans call for the terminal to have an initial capacity of
approximately 10 bcm per year and for this capacity later to
be expanded to 15 bcm per year. Following the completion
of additional studies and planning, the terminal could enter
service in early 2012. The final decision on the construction
of the terminal will be made in 2008.
E.ON Ruhrgas is holding intensive talks with possible suppliers
in Africa and the Middle East in order to procure LNG for the
planned terminal projects.
93

Pan-European Gas Market Unit
Pipeline System and Underground Storage FacilitiesAt year end 2007, E.ON Ruhrgas’s pipeline system had a total
length of 11,602 kilometers compared with 11,611 kilometers
a year earlier. The total installed power of E.ON Ruhrgas’s
28 compressor stations was unchanged at 908 megawatts. The
working gas capacity of E.ON Ruhrgas’s owned, jointly owned,
project-company-owned, and leased underground storage
facilities is approximately 5.2 bcm. The maximum withdrawal
rate of these facilities is 5.8 million cubic meters (“mcm”) per
hour. Over the next several years, E.ON Ruhrgas will further
expand its storage facilities in Bierwang, Epe, and Etzel, Ger-
many. It is also studying new storage opportunities in Germany
(Lower Saxony and Bavaria) and Austria.
Gas Release Program (“GRP”) ContinuedIn 2002, E.ON Ruhrgas agreed to conduct a GRP which involves
holding six annual auctions for a total of 200 billion kWh of
the natural gas from its long-term import contracts. The GRP
is part of the ministerial approval of E.ON’s acquisition of
Ruhrgas. E.ON Ruhrgas held the fifth GRP auction in 2007.
Thirteen bidders were awarded a total of about 33 billion kWh
of natural gas in the online auction. The transfer point is
Waidhaus on the German-Czech border. The GRP has achieved
its purpose of increasing liquidity and stimulating competition
in Germany’s gas market.
Climate-Protection Initiative LaunchedIn December 2007, E.ON Ruhrgas launched a climate-protection
initiative in Germany. It will invest more than €200 million
in the initiative from 2007 through 2012. The initiative has six
focus areas:
• Advanced training for plumbing, heating, and air-condi-
tioning technicians: E.ON Ruhrgas supports the advanced
training programs offered by ZVSHK, a German plumbing
and heating trade association, to technicians specializing
in natural gas applications.
• Natural gas space heating and solar thermal: natural gas
heat is already more efficient than oil heat. Adding solar
thermal equipment to gas heating systems can reduce
fuel consumption—and thus CO2 emissions—by up to
40 percent.
• Natural gas for the environment: this is an existing
communications platform through which gas companies
and gas industry trade associations in Germany provide
information about innovative gas heating applications.
94
• Natural gas heat pumps: E.ON Ruhrgas will work with
equipment manufacturers and other gas companies to
refine this new, green, and climate-friendly home heat-
ing technology and make it more price-competitive.
• Biomethane and vehicle fuels: biomethane is natural
gas that has been upgraded to the same methane con-
tent as natural gas so that it can be injected into the
gas pipeline system. When used as a vehicle fuel, bio-
methane can help reduce greenhouse-gas emissions in
the transportation sector.
• Fuel cells: when gas-fired fuel cells become more afford-
able, they will offer a viable, near-zero-emission technology.
Until hydrogen fuel cells are perfected, natural gas is the
fuel cell technology of choice.
Natural Gas Production Higher Natural gas production increased by 10 percent year on year
to 795 mcm. The increase results from the fact that production
in newly operational fields (Merganser from December 2006
and Minke from June 2007) and the beginning of gas produc-
tion in the Njord field more than offset the natural production
decline in other fields. Production of oil and condensates
totaled about 5 million barrels, essentially unchanged from
the prior year.
+ + + Security of Supply + + + Growth + + +
E.ON expands its natural gas production.E.ON expanded its gas procurement portfolio by acquir-
ing 28 percent of Skarv and Idun, natural gas fields that
rank among Norway’s largest and most attractive. E.ON’s
share of the fields’ annual output is expected to average
about 1.4 bcm for at least ten years and will make an
important contribution to security of supply. E.ON also has
a 30-percent stake in the Njord field in the Norwegian Sea,
which has about 10 bcm of gas reserves.

Upstream Operations StrengthenedPan-European Gas’s objective is to procure 10 bcm of natural
gas annually from its own production assets. In August 2007,
we acquired 28 percent of Skarv and Idun, large gas fields
located in the northern Norwegian Sea just below the arctic
circle, moving us a great deal closer to our objective. The
purchase price, including acquisition expenses, was €641 mil-
lion. E.ON’s share of the investments to develop the fields will
come to approximately $1.4 billion. E.ON’s stake in the fields’
reserves amounts to 18.4 million standard cubic meters of oil
equivalent. Along with other promising satellite fields, the area
ranks among Norway’s largest and most attractive undevel-
oped gas fields. Production is scheduled to begin in 2011.
E.ON’s share of the fields’ annual output is expected to aver-
age about 1.4 bcm for at least ten years.
Exploration drilling conducted in 2007 in the Huntington
Prospect in the U.K. North Sea was successful. In addition, an
appraisal well was spudded; it will be used to determine more
exactly the size of the discovery. E.ON Ruhrgas UK North Sea
has a 25-percent stake in Huntington, which will be developed
over the next three years. Exploration drilling in the North
West Flank of the Njord field in the Norwegian North Sea also
discovered reserves.
In 2007, E.ON Ruhrgas expanded its upstream operations to
more countries. In late June, it signed an agreement to acquire
a shareholding in Egypt, enabling it to enter one of North
Africa’s most significant natural gas regions. E.ON Ruhrgas
is also exploring other projects in Africa and the Middle East.
With competition for dwindling resources getting keener
and energy consumption rising, securing tomorrow's
energy supply has never been more important than it
is today. We’re doing our part by investing in new
sources and pathways for natural gas, by spurring
innovation, and by increasing our generating capacity
in Europe by 50 percent over the next three years.
We’re investing €12 billion through 2010 in technologi-
cally advanced and climate-friendly power plants.
+ + + Security of Supply + + +

96

A pipeline to security of supply
E.ON is building Europe’s largest biomethane production facility.Schwandorf, a town of 28,000 in southeastern Germany, is surrounded by fertile soil where
farmers grow rich crops of corn and wheat. That’s what made it interesting to E.ON.
We’re going to use some of these crops as energy crops: biomass from which we’ll pro-
duce biogas that will be upgraded to biomethane, which has the same quality as the
natural gas used to heat homes and businesses. Biomethane is carbon neutral, so it
helps protect the earth’s climate. It also helps conserve fossil fuels and reduce Europe’s
dependence on imported energy sources.
By building a state-of-the-art biomethane facility, we’re not only finding new uses for
biogas but also helping secure Europe’s energy supply. The Schwandorf plant will pro-
duce 1,000 cubic meters of biomethane per hour and inject it into the local pipeline sys-
tem. That’s enough gas to supply about 5,000 homes.
As competition for energy resources becomes increasingly intense, continuity and relia-
bility are the keys to security of supply and climate protection. Biomethane is one of the
ingredients in our diversified gas production portfolio. But we’re also working on other
ways to enhance security of supply. We’re researching and developing the energy
sources and technologies of tomorrow, from harnessing the energy of the seas to study-
ing the potential of micro algae. Only a balanced energy mix can secure the supply of
energy far into the future.
Studies show that biomethanecould meet up to 10 percent
of Germany’s residential naturalgas needs.
97
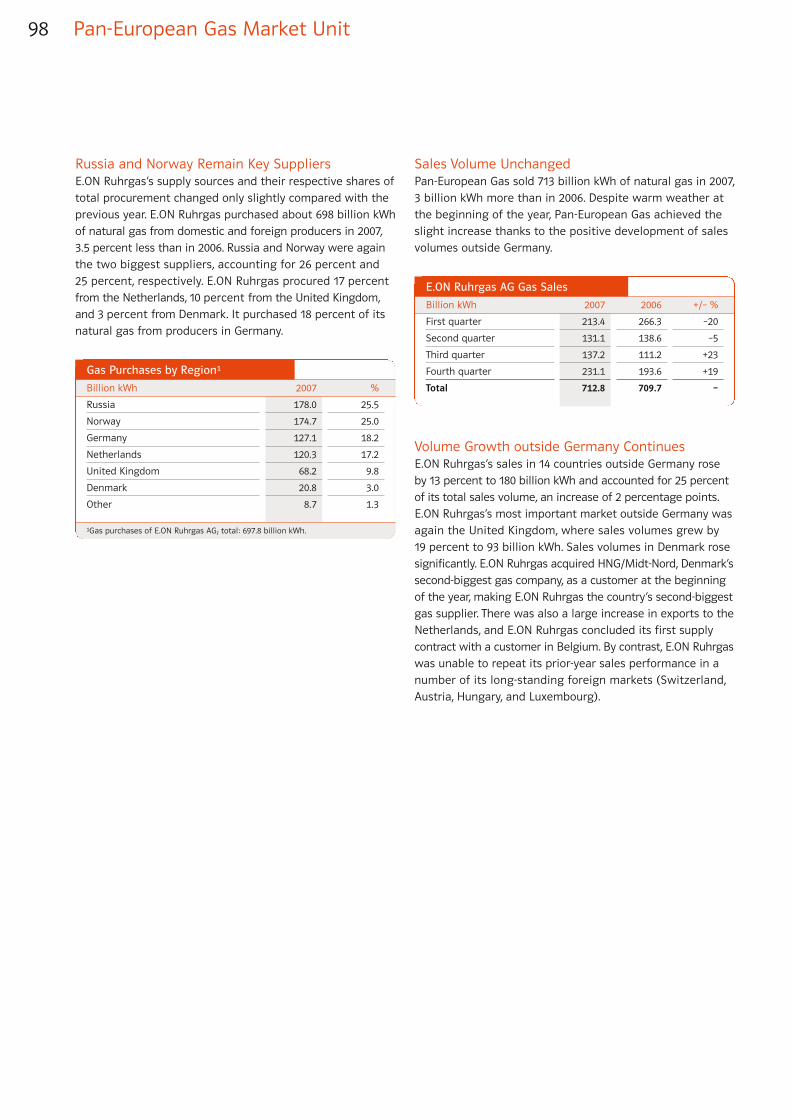
Pan-European Gas Market Unit
Russia and Norway Remain Key SuppliersE.ON Ruhrgas’s supply sources and their respective shares of
total procurement changed only slightly compared with the
previous year. E.ON Ruhrgas purchased about 698 billion kWh
of natural gas from domestic and foreign producers in 2007,
3.5 percent less than in 2006. Russia and Norway were again
the two biggest suppliers, accounting for 26 percent and
25 percent, respectively. E.ON Ruhrgas procured 17 percent
from the Netherlands, 10 percent from the United Kingdom,
and 3 percent from Denmark. It purchased 18 percent of its
natural gas from producers in Germany.
Sales Volume UnchangedPan-European Gas sold 713 billion kWh of natural gas in 2007,
3 billion kWh more than in 2006. Despite warm weather at
the beginning of the year, Pan-European Gas achieved the
slight increase thanks to the positive development of sales
volumes outside Germany.
Volume Growth outside Germany ContinuesE.ON Ruhrgas’s sales in 14 countries outside Germany rose
by 13 percent to 180 billion kWh and accounted for 25 percent
of its total sales volume, an increase of 2 percentage points.
E.ON Ruhrgas’s most important market outside Germany was
again the United Kingdom, where sales volumes grew by
19 percent to 93 billion kWh. Sales volumes in Denmark rose
significantly. E.ON Ruhrgas acquired HNG/Midt-Nord, Denmark’s
second-biggest gas company, as a customer at the beginning
of the year, making E.ON Ruhrgas the country’s second-biggest
gas supplier. There was also a large increase in exports to the
Netherlands, and E.ON Ruhrgas concluded its first supply
contract with a customer in Belgium. By contrast, E.ON Ruhrgas
was unable to repeat its prior-year sales performance in a
number of its long-standing foreign markets (Switzerland,
Austria, Hungary, and Luxembourg).
98
Billion kWh
Russia
Norway
Germany
Netherlands
United Kingdom
Denmark
Other
%
25.5
25.0
18.2
17.2
9.8
3.0
1.3
2007
178.0
174.7
127.1
120.3
68.2
20.8
8.7
Gas Purchases by Region1
1Gas purchases of E.ON Ruhrgas AG; total: 697.8 billion kWh.
E.ON Ruhrgas AG Gas Sales
Billion kWh
First quarter
Second quarter
Third quarter
Fourth quarter
Total
2007
213.4
131.1
137.2
231.1
712.8
2006
266.3
138.6
111.2
193.6
709.7
+/– %
–20
–5
+23
+19
–

99To Our ShareholdersSupervisory Board Year in Review Combined Group Management Report Additional Information Market Units Corporate Governance Consolidated Financial Statements Tables and Explanations
E.ON Ruhrgas sold 3 percent less natural gas in Germany than
in the prior year. As in previous years, regional gas companies
constituted the largest customer segment, although this seg-
ment’s share of total sales declined from 45 percent in 2006
to 41 percent in 2007. Deliveries to municipal utilities and indus-
trial customers accounted for about 24 percent and 10 per-
cent, respectively, of total gas sales, both slightly higher than
in the previous year.
Gas Sales at Downstream Shareholdings
Downstream Shareholdings’ sales volume rose to 197.5 bil-
lion kWh. The increase is attributable to the inclusion of
Hungary’s E.ON Földgáz for the entire year in 2007; this com-
pany was not included until the second quarter in 2006.
Sales and Adjusted EBITPan-European Gas’s sales declined by 1 percent to €22,745 mil-
lion (prior year: €22,974 million). Adjusted EBIT rose by
10 percent to €2,576 million (prior year: €2,347 million), with
Pan-European Gas’s businesses performing as follows:
€ in millions
Sales
Adjusted EBITDA
Adjusted EBIT
Financial Highlights by Business
2006
18,889
2,305
1,905
2007
17,738
2,010
1,581
2006
4,773
799
453
2007
5,625
1,158
987
Downstream Shareholdings
2006
–715
–12
–11
2007
–618
8
8
2006
22,947
3,092
2,347
2007
22,745
3,176
2,576
Up-/MidstreamOther/
Consolidation Pan-European Gas
Gas Sales at Downstream Shareholdings1
Billion kWh
Thüga
E.ON Ruhrgas International
Total
2007
19.9
177.6
197.5
20062
23.1
152.0
175.1
1Unconsolidated gas sales of companies in which majority stakes are held.2Includes E.ON Földgáz from April 2006.
Billion kWh
Gas Sales by Customer Segment
Regional gas companies
Municipal utilities
Industrial customers
Sales outside Germany
292.5
169.8
70.1
180.4
Gas sales of E.ON Ruhrgas AG; total: 712.8 billion kWh.

Retail BusinessIn response to falls in wholesale energy prices in 2006 and
early 2007, E.ON UK announced a reduction in residential
retail prices. Gas prices were reduced by 16 percent and
electricity prices by 5 percent from April 2007. The reductions
were broadly in line with those of other U.K. energy suppliers.
The U.K. market continued to experience high levels of cus-
tomer switching as customers looked for the best deal.
2007 was an improved year for the B2B business. Despite
both sales volumes and customer numbers falling, gross
margin improvements in the small and medium enterprise
(“SME”) and Corporate sectors resulted in an increase in
adjusted EBIT.
Central NetworksCentral Networks continued to increase its capacity to safely
deliver a reliable electricity network across Central England.
To meet the challenge of a larger capital work program
(which in the current five-year price control review period is
60 percent higher in the East and 44 percent higher in the West
than in the previous period), our internal workforce has been
supplemented by re-trainees, apprentices, and graduate
trainees. We achieved this in a year when the region experi-
enced exceptional storms in January and the worst summer
flooding for a number of years.
+/– %
+1
–8
–8
–0.51
+0.31
–
+123
+58
+7
2006
12,518
1,804
1,239
9.7
9.2
64
724
863
15,621
€ in millions
Sales
Adjusted EBITDA
Adjusted EBIT
ROCE (in %)
Cost of capital (in %)
Value added
Cash provided by operatingactivities
Investments
Employees (at year end)
2007
12,584
1,657
1,136
9.2
9.5
–37
1,615
1,364
16,786
1Change in percentage points.
U.K.
U.K. Market Unit
Adjusted EBIT down 8 percentInvestment program up 58 percentGroupwide structural change project
100

101To Our ShareholdersSupervisory Board Year in Review Combined Group Management Report Additional Information Market Units Corporate Governance Consolidated Financial Statements Tables and Explanations
During 2007, the industrial and commercial sales business
continued to focus on securing profitable customers, which
resulted in lower sales volumes in 2007 compared with 2006.
The reduction in residential and SME sales reflects warmer
weather and lower customer numbers. The increase in mar-
ket sales reflects the competitive environment and changes
in demand.
Power Generation and Procurement
The increase in own production in 2007 is primarily attributable
to excellent station availability and the increased attractive-
ness of economic conditions. The increase in power purchased
from jointly owned plants is owed to excellent station avail-
ability at Corby Power. Power purchased from other suppliers
and market sales decreased in 2007 compared with 2006,
reflecting the significant increase in own production.
101
Energy ServicesThe Metering business continued to deliver its main strategic
aim of in-sourcing metering activities. The New Connections
business provided network connections for the Distribution
business. The Home Installation business completed around
100,000 B2B jobs and around 15,000 residential jobs during
2007. This business also launched its Sustainable Energy Solu-
tions function which will deliver low-carbon solutions to cus-
tomers on behalf of the Retail business.
Energy TradingOn May 31, 2007, E.ON set out its new strategic direction which
included the decision to establish a new market unit to com-
bine all its European trading operations. The new unit is called
E.ON Energy Trading (“EET”). Following the announcement,
work commenced at the U.K. market unit to enable this new
strategic direction. Ultimately, the establishment of EET will
result in the centralization of many of the U.K. trading activi-
ties at EET’s new headquarters in Düsseldorf, Germany.
The successful performance of the U.K. trading business
continues to be included in the results of the U.K. market
unit for 2007. Excellent progress is being made to allow the
U.K. trading business to become established within EET.
Energy Policy and Regulatory EnvironmentIn May 2007, the U.K. government published “Meeting the
Energy Challenge: A White Paper on Energy,” which sets out
the government’s energy and climate-protection strategy.
It contains a range of proposals to tackle climate change by
reducing carbon-dioxide emissions and ensuring a secure,
clean, and affordable energy supply. The climate-protection
measures include additional efforts to improve energy effi-
ciency and accelerated growth of renewables capacity. In
2008, the government plans to issue draft legislation to codify
these measures, including legislation on the future use of
nuclear energy.
Power and Gas Sales
Sales by Customer Segment1
Billion kWh
Power—Residential and SME
Power—I&C
Power—Market sales
Total power sales
Gas—Residential and SME
Gas—I&C
Gas—Market sales
Total gas sales
2007
34.2
18.4
25.2
77.8
55.5
23.4
78.2
157.1
2006
37.9
18.4
17.5
73.8
63.9
28.7
62.8
155.4
+/– %
–10
–
+4.4
+5
–13
–18
+25
+1
1Excludes energy trading activities.
2007
41.2
36.7
1.235.5
77.9
–0.1
77.8
1Excludes CHP.
+/– %
+15
–5
+71–7
+4
–
+6
Billion kWh
Owned generation1
Purchasesfrom jointly owned power plantsfrom outside sources
Power procured
Station use, line loss,pumped-storage hydro
Power sales
2006
35.9
38.8
0.738.1
74.7
–1.0
73.7
Power Generation and Procurement
2006
4,910
3,490
1,788
359
10,547
Megawatts
Hard coal
Natural gas
Hydro, wind, oil, other
CHP
Total
2007
4,910
3,506
1,806
359
10,581
December 31
Attributable Generation Capacity

U.K. Market Unit
Natural gas capacity increased following a compressor upgrade
at the Enfield site. Attributable capacity for wind power rose
following completion of the Stags Holt onshore site.
The switching in sources of generation between coal and gas
reflects changes in commodity prices between the years.
Economic conditions made gas production more advantageous
than in the prior year. Renewable output grew in real terms,
while output from the Grain oil-fired plant declined reflect-
ing the redevelopment of the site. The slight reduction in the
CHP number is in part due to the reclassification of a number
of CHP sites as natural gas facilities.
Security of SupplyE.ON UK is currently looking at options to develop further
power plants in the United Kingdom over the next few years.
The objective is to deliver secure energy supplies, reduce CO2
emissions to tackle the challenge of climate change, and
keep energy as affordable as possible for our customers.
E.ON UK is progressing with significant investments to improve
its generation capacity. This is partly to replace capacity that
will be taken out of production in coming years due to envi-
ronmental regulations. In 2007, E.ON UK started construction
of one of the world’s largest gas-fired CHP plants. The plant,
which will generate 1,275 MW of power and export up to
340 MW of heat at its Isle of Grain site in Kent, is due to be
commissioned in 2009.
Progress was also made on consents to build two new highly
efficient coal-fired units at Kingsnorth power station in Kent.
The new supercritical coal-fired units would be built next to
the existing four units and are expected to come online
during 2012. Approval has been ratified by the local authority
and submitted to the U.K. government for its approval.
102
Sources of Generation
Hard coal
Natural gas
Hydro, wind, oil, other
CHP
52
44
2
2
Percentages
Security of Supply + + + Climate Protection + + + Growth
Biomass power station enters service.Steven’s Croft, the United Kingdom’s second-largest
dedicated biomass power station, became operational
in December 2007. It will generate enough electricity
to power about 70,000 homes and, because it’s carbon
neutral, will prevent the emission of approximately
140,000 metric tons of greenhouse gases every year.

The United Kingdom implemented the EU Emissions Trading
directive at the beginning of 2005. E.ON UK was allocated
22.1 million metric tons of CO2 emission allowances for 2007.
Having carried forward 5.1 million metric tons from 2006
operational and trading activity, E.ON UK purchased 4.7 mil-
lion metric tons of additional CO2 emission allowances in
2007. Phase two of the EU Emissions Trading Scheme began
at the start of 2008 and will run through to 2012.
Renewables GrowthE.ON UK plans to grow its renewable electricity generation
business in response to U.K. regulatory initiatives. E.ON UK is
already one of the leading developers and owner/operators of
wind farms in the United Kingdom, with interests in 21 opera-
tional onshore and offshore wind farms with a total capacity
of 212 MW, of which 201 MW is attributable to E.ON UK.
Potential onshore and offshore projects with an aggregate
capacity of approximately 1,134 MW are now in the develop-
ment phase (compared with 1,139 MW in the development
phase in 2006). E.ON UK completed construction of the 18 MW
Stags Holt onshore wind farm in Cambridgeshire which
became operational in the third quarter of 2007. During the
year, E.ON UK commenced construction of Robin Rigg off-
shore wind farm in the Solway Firth on the northwest coast
of England. Robin Rigg will consist of 60 turbines, each with
a capacity of 3 MW. At 180 MW of total capacity, the facility
is expected to be one of the United Kingdom’s largest offshore
wind farms when it is completed in the second quarter of 2009.
In addition to the planned expansion of its wind farm port-
folio, in 2007 E.ON UK generated 192 gigawatt-hours (“GWh”)
of renewable energy by co-firing biomass with coal at Kings-
north and Ironbridge power stations. During 2007, construc-
tion was completed on a 44 MW wood-burning plant at
Steven’s Croft, near Lockerbie in southwest Scotland. Steven’s
Croft will be one of the United Kingdom’s largest dedicated
biomass plants with annual generation of 330 GWh. With
construction complete, testing commenced in November
2007. Final inspection and full commercial handover took
place in February 2008.
During 2008, E.ON UK expects to continue to develop its
capability in marine generation (using tidal, stream, and
wave power) to position itself to capture future opportuni-
ties in this area.
Beginning in 2008, these activities will be managed by
E.ON’s new Climate & Renewables market unit.
Sales and Adjusted EBITIn 2007, E.ON UK increased its sales by 1 percent compared
with the prior year. Adjusted EBIT declined by 8 percent. The
businesses developed as follows:
103To Our ShareholdersSupervisory Board Year in Review Combined Group Management Report Additional Information Market Units Corporate Governance Consolidated Financial Statements Tables and Explanations
€ in millions
Sales
Adjusted EBITDA
Adjusted EBIT
Financial Highlights by Business
2006
858
635
488
2007
888
645
509
2006
12,031
1,267
851
2007
12,126
1,144
762
Non-regulated Business
2006
–371
–98
–100
2007
–430
–132
–135
2006
12,518
1,804
1,239
2007
12,584
1,657
1,136
Regulated Business Other/Consolidation U.K.

Further Integration of E.ON SverigeOn October 12, 2007, E.ON and Statkraft signed a letter of
intent for an asset swap in which E.ON will take over the
44.6-percent stake in E.ON Sverige currently held by
Statkraft. In return, Statkraft will receive assets from the
E.ON Group, including approximately one third of E.ON Sverige’s
hydropower assets and some Swedish heat production
operations.
Centralization of Trading ActivitiesE.ON Nordic’s trading activities have been managed from
Nordic headquarters in Malmö, mainly by the Trading busi-
ness unit. Pending the closing of the transaction between
E.ON and Statkraft, Nordic’s trading activities will be legally
transferred to Düsseldorf-based E.ON Energy Trading.
104
Nordic Market Unit
Adjusted EBIT significantly above prior-year levelCentralization of trading activitiesClimate protection and security of supply
+/– %
+18
+18
+31
+1.71
–0.21
–
+28
+42
+2
2006
2,827
871
512
8.0
9.0
–64
715
642
5,693
€ in millions
Sales
Adjusted EBITDA
Adjusted EBIT
ROCE (in %)
Cost of capital (in %)
Value added
Cash provided by operatingactivities
Investments
Employees (at year end)
2007
3,339
1,027
670
9.7
8.8
62
914
914
5,804
1Change in percentage points.
Nordic

E.ON Nordic has ambitious growth plans for the next three
years. In addition to generation upgrades, it is building the
Öresundsverket CHP plant in Malmö to increase the power
supply in southern Sweden and modernizing and expanding
its biofuel-based heat production with major projects in Öre-
bro and Norrköping.
E.ON Nordic is underlining its long-term ambition for growth
in Finland by participating in Fennovoima, a project to build
Finland’s next nuclear power station. It is also striving to
strengthen its market positions in Finland, Denmark, and
Norway.
Energy Policy and Regulatory Environment The current Swedish government, which took office in Sep-
tember 2006, enacted an energy-policy plan for the period
through 2010. The plan’s main objective is to secure a reliable,
competitively priced, and sustainable supply of energy for
Sweden. It calls for more renewables capacity and the
expansion of capacity at existing nuclear power plants. Due
to open issues with the European Commission, the govern-
ment has not been successful in repealing the carbon tax on
power plants that participate in emissions trading.
In December 2007, the government’s Energy Network Com-
mission proposed a new system for regulating electricity net-
work charges. Under the current system, network charges
are subject to a fairness review on an annual basis. The com-
mission proposes replacing the current system with an incen-
tive system under which the regulatory agency would approve
a system operator’s total network revenues in advance for a
multi-year period. Approved revenues would reflect operat-
ing costs plus a fair return on the asset base. Capital employed
would be based on a system operator’s actual network facili-
ties. The commission recommends that the new system take
effect in January 2012.
105To Our ShareholdersSupervisory Board Year in Review Combined Group Management Report Additional Information Market Units Corporate Governance Consolidated Financial Statements Tables and Explanations
105
Climate Protection and Security of SupplyE.ON Nordic has undertaken a number of projects aimed at
further improving its environmental performance and security
of supply for its customers. It further strengthened its envi-
ronmental portfolio through investments in a number of key
projects, including carbon-capture technology at its Karlshamn
oil-fired power plant. Going forward, E.ON Nordic intends to
increase its investments in biogas production.
E.ON Nordic is updating some of its hydropower plants with
the latest technology to increase their production efficiency
and upgrading its nuclear facilities to increase their generat-
ing capacity. Both are sources of carbon-free generation.
To meet supply reliability requirements, E.ON Nordic continued
its strong investment in the modernization of its power dis-
ribution network and in smart metering equipment, which
will also increase service quality for network customers.
+ + + Climate Protection + + + Security of Supply + + +
E.ON tests new carbon-capture process.E.ON is the first company in Europe to test a new method
of capturing up to 90 percent of the carbon dioxide from
the flue gas of a conventional power plant. This method,
called post-combustion capture, is attractive because it
could be retrofitted on existing conventional power plants.
Part of our innovate.on research initiative, the tests are
being conducted at our Karlshamn facility in Sweden.

Power Sales
E.ON Nordic sold almost 3 billion kWh more electricity than
in 2006, mainly due to increased sales at Nord Pool, Northern
Europe’s energy exchange. This was primarily a result of
higher hydropower production. Sales to residential and com-
mercial customers decreased by 1.4 billion kWh relative to
2006 due to milder weather in the first half of 2007 and
increased competition.
Nordic Market Unit
Power Generation and Procurement
106
2007
30.2
15.3
9.85.5
45.5
–2.1
43.4
+/– %
+8
+3
–4+20
+7
–
+7
Billion kWh
Owned generation
Purchasesfrom jointly owned power plantsfrom outside sources
Power procured
Station use, line loss
Power sales
2006
27.9
14.8
10.24.6
42.7
–2.1
40.6
Power Generation and Procurement
Oil
Natural gas, hardcoal, CHP, wind, other
Hydro
Nuclear
2
3
51
44
Sources of Owned Generation
Percentages
Power Sales
Billion kWh
Residential
Commercial
Sales partners/Nord Pool
Total
2007
6.1
12.0
25.3
43.4
2006
6.6
12.9
21.1
40.6
+/– %
–8
–7
+20
+7

E.ON Nordic’s owned generation increased by 2.3 billion kWh
relative to the prior year. Hydropower production was above
normal due to higher reservoir inflow, primarily during the
last quarter of 2006 and the first quarter of 2007. Nuclear
power production was below the prior-year figure due to
unplanned outages at all three nuclear plants. Purchases
from outside sources increased significantly, driven mainly
by cross-boarder trading activities.
Gas and Heat Sales
Heat and gas sales decreased as a consequence of mild
weather. The average temperature in 2007 was 1.5 degrees
Centigrade (3 degrees Fahrenheit) above normal. The gas
business also suffered from increased competition.
Sales and Adjusted EBITNordic’s sales increased by €512 million, or 18 percent, com-
pared with the prior year. Nordic’s adjusted EBIT increased
by €158 million year on year to €670 million. Its businesses
developed as follows:
107To Our ShareholdersSupervisory Board Year in Review Combined Group Management Report Additional Information Market Units Corporate Governance Consolidated Financial Statements Tables and Explanations
€ in millions
Sales
Adjusted EBITDA
Adjusted EBIT
Financial Highlights by Business
2006
725
311
200
2007
729
331
220
2006
2,298
638
342
2007
2,895
714
488
Non-regulated Business
2006
–196
–78
–30
2007
–285
–18
–38
2006
2,827
871
512
2007
3,339
1,027
670
Regulated Business Other/Consolidation Nordic
2006
5.8
7.9
+/– %
–9
–4
Billion kWh
Gas sales
Heat sales
2007
5.3
7.6
Gas and Heat Sales 2006
2,593
2,751
2,015
7,359
Megawatts
Nuclear
Hydro
Oil, other
Total
2007
2,622
2,754
2,031
7,407
December 31
Attributable Generation Capacity

Security of SupplyIn 2007, E.ON U.S. continued secure and reliable energy supply
to its customers. Between 2008 and 2010, E.ON U.S. plans to
invest approximately €450 million to maintain the reliability
of its transmission and distribution network. Over €750 million
of generation investment in the same period (primarily related
to construction of a new baseload unit at the Trimble County
plant) will reinforce the security of the company’s power supply.
108
+/– %
–6
–9
–9
–0.31
–0.21
–
–43
+73
+3
2006
1,930
595
426
6.0
8.0
–142
381
398
2,890
€ in millions
Sales
Adjusted EBITDA
Adjusted EBIT
ROCE (in %)
Cost of capital (in %)
Value added
Cash provided by operatingactivities
Investments
Employees (at year end)
2007
1,819
543
388
5.7
7.8
–142
216
690
2,977
1Change in percentage points.
U.S. Midwest
U.S. Midwest Market Unit
Increased investments in pollution control equipment and new generationDisposal of WKE advancedDisposal of interest in Gas Natural BAN
Security of Supply + + + Climate Protection + + + Growth
E.ON builds climate-friendly power plant.In Kentucky, we’re sharing expertise across our organiza-
tion to build one of the world’s most environmentally
friendly coal-fired generating units. Trimble County 2 will
have a nameplate capacity of 750 megawatts and meet
stringent environmental standards. It will reduce sulfur
dioxide emissions by more than 99 percent and mercury
and nitrogen oxide emissions by more than 90 percent.

Energy Policy and Regulatory Environment Rising fuel and energy prices were dominant issues in 2007.
In states with liberalized energy markets, the sharp increase
in prices led to widespread consumer dissatisfaction and
halted further deregulation efforts in the electricity sector.
A number of states have introduced climate-protection meas-
ures, including measures that require the use of renewables.
Far-reaching climate-protection incentives are expected in 2008
and beyond. For the first time in 30 years, applications were
filed for permits to build new nuclear power stations. Currently,
neither federal law nor state law in Kentucky, E.ON U.S.’s main
supply area, contains climate-protection provisions.
Rate regulation also varies significantly by state. About two
thirds of U.S. states, including Kentucky, continue to have
cost-based rate regulation.
Power and Gas SalesRegulated utility retail power sales volumes increased slightly
in 2007 compared with 2006, primarily due to colder weather
in February and warmer weather throughout the summer.
Off-system power sales volumes were lower in 2007, primarily
due to lower market prices.
109To Our ShareholdersSupervisory Board Year in Review Combined Group Management Report Additional Information Market Units Corporate Governance Consolidated Financial Statements Tables and Explanations
109
Gas sales increased in 2007 compared with 2006, primarily
due to colder weather in the beginning of 2007 and market
factors that produced opportunities for off-system gas sales.
Power Generation and Procurement
Sales by Customer Segment
Billion kWh
Retail customers
Off-system sales
Power sales
Retail customers
Off-system sales
Gas sales
2007
34.3
1.6
35.9
13.1
0.5
13.6
2006
32.6
2.7
35.3
12.3
0.1
12.4
+/– %
+5
–41
+2
+7
+400
+10
2007
33.8
2.9
36.7
–0.8
35.9
+/– %
–1
–12
–2
–
+2
Billion kWh
Owned generation
Purchases
Power procured
Station use, line loss, other
Power sales
2006
34.2
3.3
37.5
–2.2
35.3
Power Generation and Procurement
Sources of Owned Generation
Coal
Natural gas, hydro,oil, other
97
3
Percentages

U.S. Midwest Market Unit110
Coal-fired power plants accounted for 97 percent of E.ON U.S.’s
owned generation in 2007, while gas-fired, hydro, and other
generating assets accounted for the remaining 3 percent.
E.ON U.S.’s generation portfolio increased slightly, from
7,507 MW at year end 2006, to 7,519 MW at year end 2007,
primarily because a mothballed unit was returned to service.
Sales and Adjusted EBITU.S. Midwest’s sales decreased by €111 million, or 6 percent,
compared with the prior year. U.S. Midwest’s adjusted EBIT
decreased by €38 million year on year to €388 million. The
businesses developed as follows:
€ in millions
Sales
Adjusted EBITDA
Adjusted EBIT
Financial Highlights by Business
2006
1,869
592
431
2007
1,766
545
393
Regulated Business
2006
61
3
–5
2007
53
–2
–5
2006
1,930
595
426
2007
1,819
543
388
Non-regulatedBusiness/Other U.S. Midwest
2006
5,294
2,141
72
7,507
+/– %
–
+1
+3
–
Megawatts
Coal
Natural gas
Hydro
Total
2007
5,281
2,164
74
7,519
December 31
Attributable Generation Capacity

Disposal of WKE and Gas Natural BANThrough its wholly owned subsidiary Western Kentucky Energy
Corp. (“WKE”), E.ON U.S. has a 25-year lease on, and operates
the generating facilities of, Big Rivers Electric Corporation
(“BREC”), a power generation cooperative in western Ken-
tucky, and a coal-fired facility owned by the city of Henderson,
Kentucky.
In March 2007, E.ON U.S. entered into a termination agree-
ment with BREC to terminate the lease and the operational
agreements for nine coal-fired and one oil-fired electricity
generation units in western Kentucky. During 2007, the par-
ties entered into a number of definitive amendments or
ancillary documents regarding the termination transaction.
The closing remains subject to review and approval by vari-
ous regulatory agencies and other interested parties. Subject
to such contingencies, the parties expect to complete the
proposed termination transaction during 2008. WKE there-
fore continues to be classified as a discontinued operation.
In June 2007, E.ON U.S. completed the sale of its minority
shareholding interest in Gas Natural BAN and related Argen-
tine investments to affiliates of Gas Natural SDG of Spain.
E.ON U.S. had held minority interests in various Gas BAN
investments since 1999.
We’re committed to competition. So we’re seizing
the initiative ourselves. By setting the pace, we can
shape our market. Over the next three years, we
also aim to become one of Europe’s leading energy
companies in terms of customer satisfaction.
+ + + Competition + + +

112

E.ON makes customer choice easy
More than 660,000 customersalready agree: the price is right,
and so is the service.
E.ON ushers in a new era of retail competition in Germany.In February 2007, E.ON launched a new retail subsidiary that makes customer choice
easy. Its name explains its approach: E WIE EINFACH. Which is German for “E as in Easy.”
E WIE EINFACH is the first retailer to offer power and gas service nationwide, making
it easy for residential and small business customers across Germany to switch
providers. And it has a rate plan that makes saving easy, too. E WIE EINFACH’s prices
are guaranteed to be cheaper—by 1 cent per kilowatt-hour for power and by
2 cents per cubic meter for natural gas—than customers’ local incumbent supplier.
The easy approach has paid off. In just twelve months, 660,000 customers have
switched to E WIE EINFACH.
Our subsidiary’s success has spurred retail competition in Germany. That’s evident
from the many suppliers that have followed our example. And from the number of
customers who have switched. By the third quarter of 2007, the switch rate had
reached 11 percent, an increase that’s demonstrably the result of our pacesetting
approach.
Customers like E WIE EINFACH not only for its prices but also for its consistent
customer orientation. Easy to understand, easy to switch, easy to save.
113

Corporate Governance114
Corporate Governance Report
Joint Report on Corporate Governance by the E.ONAG Board of Management and Supervisory Board
E.ON views corporate governance as a central component of
its responsible and value-oriented management approach. In
2007, the Board of Management and Supervisory Board paid
close attention to E.ON’s compliance with the guidelines of the
German Corporate Governance Code (“the Code”), particularly
in conjunction with the new Code recommendations issued
on June 14, 2007. On December 17, 2007, the Board of Manage-
ment and the Supervisory Board jointly issued E.ON’s Decla-
ration of Compliance (“the Declaration”) pursuant to Section
161 of the German Stock Corporation Act stating that E.ON
complies with all of the Code’s recommendations. The full text
of the Declaration, and of Declarations from previous years,
is available on the Internet at www.eon.com. E.ON voluntarily
complies with most of the Code’s suggestions, as well.
Management and Oversight StructureSupervisory BoardThe Supervisory Board has 20 members and, in accordance
with the German Codetermination Act, is composed of an
equal number of shareholder and employee representatives.
The shareholder representatives are elected by the share-
holders at the Annual Shareholders Meeting. The employee
representatives are elected by the employees. In the event
of a tie vote on the Supervisory Board, another vote is held;
if there is still a tie, the Chairperson casts the tie-breaking
vote. As a general rule, Supervisory Board members should
not be older than 70.
In order to ensure that the Supervisory Board’s advice and
oversight functions are conducted on an independent basis,
no more than two former members of the Board of Manage-
ment may be members of the Supervisory Board. Supervisory
Board members may not hold a corporate office or perform
advisory services for the Company’s key competitors. Super-
visory Board members are required to disclose to the Super-
visory Board any conflicts of interest, particularly if a conflict
arises from their advising, or holding a corporate office with,
one of E.ON’s customers, suppliers, creditors, or other busi-
ness partners. The Supervisory Board is required to report
any conflicts of interest to the Annual Shareholders Meeting
and to describe how the conflicts have been dealt with. Any
material conflict of interest of a non-temporary nature should
result in the termination of a member’s appointment to the
Supervisory Board. There were no conflicts of interest involv-
ing members of the Supervisory Board in 2007. Any consulting
or other service agreements between the Company and a
Supervisory Board member require the Supervisory Board’s
consent. No such agreements existed in 2007.
The Supervisory Board oversees the Company’s management
and advises the Board of Management. It deals with the
Company’s business development, medium-term plan, and
the further development of corporate strategy. It discusses
the Company’s quarterly Interim Reports and, taking into
consideration the Independent Auditor’s Report and the
Audit Committee’s preliminary report, approves the Financial
Statements of E.ON AG and the Consolidated Financial State-
ments. It also appoints and removes the members of the
Board of Management. Together with the Board of Manage-
ment, it ensures that the Company has a long-term succession
plan in place. Transactions or measures taken by the Board
of Management that materially affect the Company’s assets,
finances, or earnings require the Supervisory Board’s prior
approval. The policies and procedures of E.ON AG’s Supervisory
Board include a list of transactions and measures that require
prior Supervisory Board approval. The list is not exhaustive.
Pursuant to its policies and procedures, the Supervisory Board
has formed the following committees:
The committee required by Section 27, Paragraph 3 of the
Codetermination Act consists of two shareholder representa-
tive members and two employee representative members.
This committee is responsible for recommending to the
Supervisory Board potential candidates for the Board of
Management if the first vote does not yield the necessary
two-thirds majority of votes of Supervisory Board members.
The Executive Committee consists of the four members of
the above-named committee. It prepares meetings of the
Supervisory Board and advises the Board of Management on
matters of general policy relating to the Company’s strategic
development. In urgent cases (in other words, if waiting for
the Supervisory Board’s prior approval would materially pre-
judice the Company), the Executive Committee acts on the
full Supervisory Board’s behalf. In particular, the Executive
Committee prepares the Supervisory Board’s personnel deci-
sions and is responsible for the conclusion, alteration, and
termination of the employment contracts of Board of Man-
agement members. It also deals with corporate governance
matters and reports to the Supervisory Board at least once a
year on the status and effectiveness of, and possible ways of
improving, the Company’s corporate governance.
The Audit Committee consists of four members who have
special knowledge in the field of accounting and/or business
administration. Pursuant to the Code’s mandates, the Chair-
person has extensive knowledge and experience in applying
accounting principles and/or in international business control
processes.
The Audit Committee deals primarily with issues relating to the
Company’s accounting, compliance, and risk management;
the legally mandated independence of the Company’s Inde-
pendent Auditor; the establishment of auditing priorities; and

115To Our ShareholdersSupervisory Board Year in Review Combined Group Management Report Additional Information Market Units Corporate Governance Consolidated Financial Statements Tables and Explanations
agreements on the Independent Auditor’s fees. The Audit
Committee also prepares the Supervisory Board’s decision on
the approval of the Financial Statements of E.ON AG and of
the Consolidated Financial Statements. It also examines the
Company’s quarterly Interim Reports and discusses the audit
review of the Interim Reports with the Independent Auditor.
The Finance and Investment Committee consists of four
members. It advises the Board of Management on all issues
of corporate finance and investment planning. It decides on
behalf of the Supervisory Board on the approval of the acqui-
sition and disposition of companies, equity interests, and
parts of companies, as well as on financial measures whose
value exceeds 1 percent of the equity listed in the most recent
Consolidated Balance Sheet. If the value of any such trans-
actions or activities exceeds 2.5 percent of the equity listed
in the most recent Consolidated Balance Sheet, the Finance
and Investment Committee prepares the Supervisory Board’s
decision on such matters.
The Nomination Committee consists of three shareholder
representative members. Its Chairperson is the Chairperson
of the Supervisory Board. Its task is to recommend to the
Supervisory Board suitable candidates for election to the
Supervisory Board by the Annual Shareholders Meeting.
Board of Management The E.ON AG Board of Management consists of five (through
the end of March 2008: six) members and has one Chairperson.
Board of Management members may not be older than 65.
The Board of Management has in place policies and proce-
dures for the business it conducts. It manages the Company’s
businesses, with all its members bearing joint responsibility
for its decisions. It establishes the Company’s objectives,
sets its fundamental strategic direction, and is responsible
for corporate policy and Group organization.
The Board of Management regularly reports to the Supervi-
sory Board on a timely and comprehensive basis on all rele-
vant issues of corporate planning, business development,
risk assessment, and risk management. It also submits the
Group’s investment, finance, and personnel plan for the com-
ing financial year as well as the medium-term plan to the
Supervisory Board for its approval at the last meeting of
each financial year.
The Chairperson of the Board of Management informs, with-
out undue delay, the Chairperson of the Supervisory Board
of important events that are of fundamental significance in
assessing the Company’s condition, development, and manage-
ment and of any defects that have arisen in the Company’s
monitoring systems. Transactions and measures requiring
the Supervisory Board’s approval are also submitted to the
Supervisory Board without delay.
Members of the Board of Management are also required to
promptly report conflicts of interest to the Executive Com-
mittee of the Supervisory Board and to inform the other mem-
bers of the Board of Management. Members of the Board of
Management may only assume other corporate positions,
particularly appointments to the supervisory boards of non-
Group companies, with the consent of the Executive Com-
mittee of the Supervisory Board. There were no conflicts of
interest involving members of the Board of Management in
2007. Any material transactions between the Company and
members of the Board of Management, their relatives, or
entities with which they have close personal ties require the
consent of the Executive Committee of the Supervisory Board.
No such transactions took place in 2007.
Shareholders and Annual Shareholders MeetingE.ON AG shareholders exercise their rights and vote their
shares at the Annual Shareholders Meeting. The Company’s
financial calendar, which is published in the Annual Report,
in the quarterly Interim Reports, and on the Internet at
www.eon.com, regularly informs shareholders about impor-
tant Company dates.
At the Annual Shareholders Meeting, shareholders may
vote their shares themselves, by a proxy of their choice, or by
a Company proxy who is required to follow their voting
instructions.
Accounting and Annual Financial StatementsEffective the 2007 financial year, the E.ON Group’s Consolidated
Financial Statements are prepared in accordance with Inter-
national Financial Reporting Standards. E.ON AG’s Financial
Statements are prepared in accordance with the German
Commercial Code.
As stipulated by German law, the Annual Shareholders Meet-
ing votes to select the Company’s Independent Auditor.
The Audit Committee prepares the proposal on the selection
of the Company’s Independent Auditor for the Annual Share-
holders Meeting. In order to ensure the auditor’s independ-
ence, the Audit Committee secures a statement from the
proposed auditors detailing any facts that could lead to the
audit firm being excluded for independence reasons or other-
wise conflicted. As part of its audit responsibilities, the
Independent Auditor agrees to:
• promptly inform the Chairperson of the Audit Committee
should any such facts arise during the course of the audit;
• promptly inform the Supervisory Board of anything aris-
ing during the course of the audit that is of relevance to
the Supervisory Board’s duties; and
• inform the Chairperson of the Audit Committee of, or to
note in its Audit Report, any facts determined during
the audit that contradict the statements submitted by
the Board of Management or Supervisory Board in con-
nection with the Code.

Corporate Governance116
Risk PoliciesDetailed information about E.ON’s risk management system
can be found on page 62 of this report. E.ON has established
a Disclosure Committee to support the Board of Management
and to be responsible for correct and timely financial disclo-
sures. Its members come from various departments of E.ON AG
and are, owing to their functions, particularly suited for the
committee’s tasks.
The effectiveness of the financial disclosure controls and
procedures at E.ON AG and at the market unit lead compa-
nies is regularly assessed by E.ON AG Internal Audit and by
our Independent Auditor.
In August 2007, the E.ON AG Board of Management decided
to submit applications to delist E.ON American Depositary
Receipts from the New York Stock Exchange (“NYSE”) and to
deregister and end its reporting obligations with the U.S.
Securities and Exchange Commission (“SEC”). Since neither
the NYSE nor the SEC raised objections during the review
period, the delisting and deregistration took effect. As of the
2007 financial year, E.ON is therefore no longer required to
fulfill, among other requirements, the requirements contained
in Section 404 of the Sarbanes-Oxley Act regarding internal
controls over financial reporting.
Nevertheless, in 2007 E.ON’s management and Internal Audit
carried out an assessment of our documented internal controls
over financial reporting. E.ON determined that, as of Decem-
ber 31, 2007, there are no significant deficiencies or material
weaknesses in the E.ON Group’s internal controls over financial
reporting. Our Independent Auditor confirmed this finding
after conducting a risk-oriented assessment of our internal
controls over financial reporting.
TransparencyTransparency is a high priority of E.ON AG’s Board of Manage-
ment and Supervisory Board. Our shareholders, all capital
market participants, financial analysts, shareholder associa-
tions, and the media regularly receive up-to-date informa-
tion about the situation of, and any material changes to, the
Company. We use the Internet to help to ensure that all
investors have equal access to comprehensive and timely
information about the Company.
E.ON AG issues reports about its situation and earnings by
the following means: Interim Reports (quarterly), an Annual
Report, an annual press conference, telephone conferences,
and numerous events for financial analysts in and outside
Germany.
A financial calendar lists the dates on which the Company’s
financial reports are released. In addition to the Company’s
periodic financial reports, the Company issues ad-hoc state-
ments when events or changes occur at E.ON AG that could
have a significant impact on the price of E.ON stock. Pursuant
to Section 10 of the German Securities Prospectus Law, E.ON
is required to publish an annual document that contains all
its ad-hoc and financial releases of the previous twelve months.
The financial calendar, ad-hoc statements, and annual docu-
ment are available on the Internet at www.eon.com.
Persons with executive responsibilities, in particular members
of E.ON AG’s Board of Management and Supervisory Board and
persons closely related to them, must disclose their dealings
in E.ON stock or in related financial instruments pursuant to
Section 15a of the German Securities Trading Act. Such dealings
that took place in 2007 have been disclosed at ww.eon.com.
As of December 31, 2007, there was no ownership interest
subject to disclosure pursuant to Item 6.6 of the Code.
EthicsOur actions are grounded in integrity and a respect for the
law. To this end, the Board of Management has put into place
a Code of Conduct containing guidelines for dealing with
business partners and government institutions, for keeping
business information and company secrets confidential, and
for addressing conflicts of interest. Compliance Officers at
E.ON AG and the market units are tasked with implementing
the Code of Conduct and ensuring that any ethics issues that
arise are dealt with independently and objectively.
We have defined Guidelines to Prevent Insider Trading which
contain mandatory rules for dealing with insider information
and trading in E.ON stock. These guidelines go beyond the
minimum requirements contained in the German Securities
Trading Act. We have also developed a special Code of Ethics
that applies primarily to Board of Management members
and members of the Disclosure Committee. In particular, the
Code of Ethics obliges these individuals to make full, appro-
priate, accurate, timely, and comprehensible disclosure of
information in our corporate publications. The text of the
Code of Ethics is available on the Internet at www.eon.com.
Finally, the Company has in place a procedure for dealing
with complaints relating to accounting and financial report-
ing. Complaints may be submitted—anonymously, if
desired—to a Compliance Officer who reports directly to the
Audit Committee.

117To Our ShareholdersSupervisory Board Year in Review Combined Group Management Report Additional Information Market Units Corporate Governance Consolidated Financial Statements Tables and Explanations
Compensation Report
The compensation report applies the regulations of the Ger-
man Commercial Code amended to reflect the Management
Board Compensation Disclosure Law as well as the principles
of the German Corporate Governance Code (“the Code”). It is
to be considered part of the Combined Group Management
Report.
Compensation System for Members of theSupervisory Board
The compensation of Supervisory Board members is governed
by E.ON AG’s Articles of Association. In accordance with Ger-
man law and the Code’s recommendations, the compensation
system takes into consideration Supervisory Board members’
responsibilities and scope of duties as well as the Company’s
financial situation and business performance. In accordance
with the Code, Supervisory Board members receive fixed
annual compensation as well as two variable, performance-
based compensation components. The short-term component
is linked to dividends. The long-term component is linked to
the three-year average of the E.ON Group’s consolidated net
income.
Fixed compensation: in addition to being reimbursed for their
expenses including the value-added tax due on their com-
pensation, Supervisory Board members receive a fixed amount
of €55,000.00 for each financial year.
Short-term variable compensation: in addition, Supervisory
Board members receive variable compensation of €115.00
for each €0.01 of dividend paid out to shareholders in excess
of €0.10 per no-par share for the previous financial year.
Long-term variable compensation: furthermore, Supervisory
Board members receive variable compensation of €70.00 for
each €0.01 of the three-year average of the E.ON Group’s
consolidated net income per share in excess of €2.30.
Individuals who were members of the Supervisory Board or
any of its committees for less than the entire financial year
receive pro-rata compensation for each full or partial month
of service. Fixed compensation is payable after the end of
the financial year. Variable compensation components are
payable after the Annual Shareholders Meeting, which votes
to formally approve the acts of the members of the Supervi-
sory Board in the previous financial year.
The Chairman of the Supervisory Board receives a total of
three times the above-mentioned compensation; the Deputy
Chairman and every chairman of a Supervisory Board com-
mittee receive a total of twice the above-mentioned amount;
and each committee member receives a total of one-and-a-
half times the above-mentioned compensation.
Supervisory Board members are paid an attendance fee of
€1,000.00 per day for meetings of the Supervisory Board or
its committees. Finally, the Company has taken out liability
insurance for the benefit of Supervisory Board members to
cover the statutory liability related to their Supervisory
Board duties. If an insurance claim is granted, this insurance
includes a deductible equal to 50 percent of a Supervisory
Board member’s annual fixed compensation.
Fixed annual compensation of €55,000.00 is intended to take
into account the independence of the Supervisory Board
required to fulfill the supervisory function. In addition, there
are a number of duties that Supervisory Board members
need to perform irrespective of the Company’s financial per-
formance. For this reason, a minimum compensation should
be guaranteed even during times that are difficult for the
Company, when the work of the Supervisory Board is usually
particularly challenging. On the other hand, dividend-based
compensation is designed to ensure that the Supervisory
Board’s compensation interests are, to some extent, aligned
with shareholders’ return expectations. Finally, since another
part of variable compensation is linked to the three-year
average of consolidated net income, the Supervisory Board’s
compensation also contains a component that is related to
the Company’s long-term performance.
Compensation of the Members of the SupervisoryBoard
Assuming that the Annual Shareholders Meeting on April 30,
2008, approves the proposed dividend, the total compensation
of the members of the Supervisory Board will amount to
€4.5 million (2006: €4.1 million).
No loans were outstanding or granted to Supervisory Board
members in the 2007 financial year. The members of the
Supervisory Board are listed on page 19.

Corporate Governance118
Compensation System for Members of the Boardof Management
The compensation of the members of the Board of Manage-
ment is currently composed of a fixed annual base salary, an
annual bonus, and a long-term variable component.
The base salary is paid on a monthly basis and is reviewed
regularly to determine whether it is in line with market
salaries and whether it is fair and reasonable.
The amount of the bonus is determined by the degree to which
certain corporate and personal performance targets are
achieved under a target-setting system, 70 percent of which
is related to corporate performance targets and 30 percent to
personal targets. The corporate performance targets reflect, in
equal shares, operating performance (as measured by adjusted
EBIT) and return on capital employed (“ROCE”). Board of Man-
agement members who fully achieve their performance target
receive the target bonus agreed to in their contracts. The
maximum bonus that can be achieved is 200 percent of the
target bonus. Any compensation received for work done in the
Company’s interest (other directorships at Group companies)
is set off against the bonus or transferred to the Company.
Ulrich Hartmann
Hubertus Schmoldt
Dr. Karl-Hermann Baumann
Sven Bergelin (since August 1, 2007)
Dr. Rolf-E. Breuer
Dr. Gerhard Cromme (until June 30, 2007)
Gabriele Gratz
Wolf-Rüdiger Hinrichsen
Ulrich Hocker
Eva Kirchhof
Seppel Kraus (until July 31, 2007)
Prof. Dr. Ulrich Lehner
Dr. Klaus Liesen
Erhard Ott
Hans Prüfer
Klaus Dieter Raschke
Dr. Henning Schulte-Noelle
Dr. Theo Siegert (since July 4, 2007)
Prof. Dr. Wilhelm Simson
Gerhard Skupke
Dr. Georg Freiherr von Waldenfels
Hans Wollitzer (since January 4, 2007)
Subtotal
Attendance fees and meeting-related reimbursements
Total
Compensation of the Supervisory Board 2007
Total
464,490
309,660
309,660
64,513
154,830
116,123
320,343
232,245
154,830
154,830
90,317
193,537
154,830
154,830
172,580
294,225
232,245
77,415
154,830
166,280
154,830
211,580
4,339,023
189,151
4,528,174
SupervisoryBoard
compensationfrom affiliated
companies
–
–
–
–
–
–
101,000
–
–
–
–
–
–
–
17,750
61,980
–
–
–
11,450
–
56,750
248,930
Long-termvariable
compensation
161,490
107,660
107,660
22,429
53,830
40,373
76,259
80,745
53,830
53,830
31,401
67,287
53,830
53,830
53,830
80,745
80,745
26,915
53,830
53,830
53,830
53,830
1,422,009
Short-termvariable
compensation
138,000
92,000
92,000
19,167
46,000
34,500
65,167
69,000
46,000
46,000
26,833
57,500
46,000
46,000
46,000
69,000
69,000
23,000
46,000
46,000
46,000
46,000
1,215,167
Fixed compensation
165,000
110,000
110,000
22,917
55,000
41,250
77,917
82,500
55,000
55,000
32,083
68,750
55,000
55,000
55,000
82,500
82,500
27,500
55,000
55,000
55,000
55,000
1,452,917

119To Our ShareholdersSupervisory Board Year in Review Combined Group Management Report Additional Information Market Units Corporate Governance Consolidated Financial Statements Tables and Explanations
The long-term variable compensation component that Board
of Management members receive is stock-based compensa-
tion. This compensation is designed to reward Board of
Management members (and other key executives) for their
contributions to increasing the Company’s shareholder value
and to promote E.ON’s long-term business performance. This
variable pay component, which combines incentives for
long-term growth with a risk component, effectively aligns
management’s and shareholders’ interests.
Introduced in the 2006 financial year, the E.ON Share Perfor-
mance Plan is a uniform groupwide stock-based compen-
sation system. The amount of compensation from the E.ON
Share Performance Plan depends on the performance of
E.ON’s stock price, both in absolute terms and relative to an
industry index.
Through the end of 2005, E.ON awarded annual stock appre-
ciation rights (“SAR”) as part of its stock option program.
SAR already granted may still be exercised in accordance
with the program’s terms and conditions.
Both programs are described in Note 11 to the Consolidated
Financial Statements.
In line with the Code’s recommendations, the total compen-
sation paid to Board of Management members therefore
includes both fixed and variable components. Criteria applied
to determine the amount of compensation include in par-
ticular a Board of Management member’s duties, his or her
personal performance, the performance of the Board of
Management as a whole, as well as the Company’s financial
situation, its business performance, and its future prospects
relative to a benchmark environment.
The variable compensation components contain an element of
risk and consequently are not guaranteed compensation. The
stock-based compensation program is based on demanding,
relevant benchmark parameters. Under the program’s terms,
performance targets or benchmark parameters cannot be
changed at a later stage.
The Supervisory Board discussed the compensation system
for the Board of Management at its meeting on December 17,
2007. The Supervisory Board’s Executive Committee, which is
responsible for decisions on compensation, most recently
reviewed the Board of Management’s compensation at its
meeting on December 17, 2007.
In the event of a premature loss of a Board of Management
position due to a change-in-control event, the service agree-
ments of Board of Management members entitle them to
severance and settlement payments.
The Company had change-of-control agreements with all
Board of Management members in the 2007 financial year. The
standard change-of-control agreements with the Chairman of
the Board of Management and with the members who joined
the Board of Management in 2006 stipulate that a change of
control exists in three cases: if a third party acquires at least
30 percent of the Company’s voting rights, thus triggering the
automatic requirement to make an offer for the Company pur-
suant to Germany’s Stock Corporation Takeover Law; if the
Company, as a dependent entity, concludes a corporate agree-
ment; or if the Company is merged with another company. If,
within 12 months of the change of control, the service agree-
ment of a Board of Management member is terminated by
mutual consent, expires, or is terminated by the Board of Man-
agement member because his or her position on the Board is
materially altered by the change of control, he or she is entitled
to severance pay equal to the capitalized amount of his or her
total annual compensation (annual base salary, annual target
bonus, and other compensation) for the remaining term of the
service agreement or for at least three years. To reflect dis-
counting and setting off payment for services rendered to oth-
er companies or organizations, payments will be reduced by
20 percent. If a Board of Management member is above the
age of 53, this 20 percent reduction is diminished according to
an age-related schedule.
The change-of-control agreements with the other members of
the Board of Management reflect the hitherto standard terms
for such agreements. Under these agreements, a change in
control exists if a single shareholder acquires 25 percent or
more of the Company’s voting rights; if a third party acquires
a share of the Company’s voting rights that has led or would
lead to this party having a share of the voting rights of at
least half of the Company’s share capital with voting rights at
an Annual Shareholders Meeting; if the Company, as a depend-
ent entity, concludes a corporate agreement, becomes part of
another company through subordination, takes on a different
legal form, or is merged with another company. In the case of
such a change-of-control event, a Board of Management mem-
ber is entitled to severance and settlement payments. A Board
of Management member will receive severance pay equal to
the capitalized amount of his or her total annual compensa-
tion (annual base salary, annual target bonus, and other com-
pensation) for the remaining term of the service agreement. If
the remaining term of the service agreement exceeds three
years, severance pay for the period beyond three years will be
reduced by 25 percent to reflect discounting and setting off
payment for services rendered to other companies or organi-
zations. In addition, he or she will receive a settlement pay-
ment equal to at least three times his or her total annual com-
pensation or, if he or she has been a Board of Management
member for more than ten years, four times such compensation.
Together, severance and settlement payments may not exceed
five times a Board of Management member’s total annual
compensation.

Corporate Governance120
Following the end of their service for the Company, Board of
Management members are entitled to receive pension pay-
ments in three cases: if they reach the standard retirement
age (currently 60 years), if they are permanently incapacitated,
or if their service agreement is terminated prematurely or
not extended. Depending on the length of their service,
Board of Management members are entitled to annual pen-
sion payments equal to between 50 percent and 75 percent
of their last annual base salary. The annual pension of one
member of the Board of Management is a fixed amount. If
Board of Management members are entitled to pension pay-
ments stemming from earlier employment, these payments
will be set off against their pension payments from the Com-
pany. If their service agreement is terminated prematurely
or not extended, and if such termination or non-extension is
not due to misconduct or rejection of an offer of extension
that is at least on a par with the existing service agreement,
Board of Management members who have been in a Top
Management position in the E.ON Group for more than five
years will receive a reduced pension as a bridge payment
until they reach the age of 60. The amount of the bridge pay-
ment will be calculated based on the relation between the
actual and potential length of service to the Company until
the age of 60 is reached. The pension plans the Company
granted to Board of Management members before the 2006
financial year do not include limitations on pension entitle-
ments relating to premature termination or non-extension of
service agreements.
The following table shows the current pension entitlement of
Board of Management members. In line with the Code’s
recommendations, the table also includes the additions to
provisions for pensions. These additions to provisions for
pensions are not paid compensation but valuations calculated
in accordance with IFRS.
Pension payments are adjusted on an annual basis to reflect
changes in the German consumer price index. In the case of
pensions granted before 2003, the Executive Committee of
the Supervisory Board may, under certain circumstances, make
additional adjustments that it deems appropriate. The annual
pension of one member of the Board of Management is a
fixed amount that is also adjusted on an annual basis to reflect
changes in the consumer price index plus an additional
0.7 percent per year.
Following the death of an active or former member of the
Board of Management, a reduced amount of his or her pen-
sion is paid as a survivor’s pension to the family. Widows and
widowers are entitled to lifelong payment of 60 percent of
the pension a Board of Management member received on
the date of his or her death or would have received had he
or she entered retirement on this date. This payment is ter-
minated if a widow or widower remarries. The survivor’s
pension for the widow of one Board of Management mem-
ber deviates from this model and is equal to 75 percent of
the member’s pension. The children or dependents of a
Board of Management member who have not reached the
age of 18 are entitled, for the duration of their education or
professional training until they reach a maximum age of 25,
to an annual payment equal to 20 percent of the pension the
Board of Management member received or would have
received on the date of his or her death. Surviving children
benefits granted before 2006 deviate from this model and
are equal to 15 percent of a Board of Management member’s
pension. If, taken together, the survivor’s pensions of the
widow or widower and children exceed 100 percent of a Board
of Management member’s pension, the pensions paid to
the children are proportionally reduced by the excess amount.
Dr. Wulf H. Bernotat
Dr. Burckhard Bergmann
Christoph Dänzer-Vanotti1
Lutz Feldmann
Dr. Hans Michael Gaul2
Dr. Marcus Schenck1
Dr. Johannes Teyssen
Pensions of the Board of Management Members
(in )
868,000
743,608
300,000
300,000
–
300,000
525,000
As a percentageof annual
base salary
70
–
50
50
–
50
70
Current pension entitlement atDecember 31, 2007
Thereof interest cost
(in €)
473,859
562,382
52,468
95,843
109,686
2,144
259,331
(in )
1,493,957
919,757
828,280
208,538
109,686
366,974
590,867
Additions to provisions for pensions in 2007
1Pension entitlement not yet vested.2Entered retirement on April 1, 2007.

121To Our ShareholdersSupervisory Board Year in Review Combined Group Management Report Additional Information Market Units Corporate Governance Consolidated Financial Statements Tables and Explanations
Compensation of the Members of the Board ofManagement
Dr. Hans Michael Gaul retired from the Board of Management
on March 31, 2007.
The remaining other compensation of the members of the
Board of Management consists primarily of benefits in kind
from the personal use of company cars and, in the case of
one member, temporary reimbursement for rental payments
on a secondary residence.
The performance rights granted in 2007 as the second tranche
of the E.ON Share Performance Plan were quoted at their
fair value of €83.24 per right on the date of their issuance
and were included in the total compensation of the members
of the Board of Management. This fair value is determined
by means of a recognized option pricing model. The model,
called a Monte Carlo simulation, simulates a large number of
different scenarios for E.ON AG stock and its benchmark index,
the Dow Jones STOXX Utilities Index (Return EUR). According
to the terms and conditions of the E.ON Share Performance
Plan, the intrinsic value of the performance rights is deter-
mined for each scenario based on E.ON stock’s outperformance
or underperformance of its benchmark index and the stock’s
corresponding payout value. The fair value is equal to the
discounted average of these intrinsic values.
For purposes of internal communications between the Board
of Management and the Supervisory Board, the target value
is used instead of the fair value. The target value is equal to
the cash payout amount of each performance right, if at the
end of the maturity period, E.ON stock maintains its price
and the performance equals the performance of the bench-
mark index. The target value for the second tranche is €96.52
per right and equals the average E.ON stock price during the
60 trading days prior to the issuance of the rights on January 1,
2007. The Executive Committee of the Supervisory Board used
the target value to determine the number of rights to be issued.
These correspond to a target value of €1.35 million for the
Chairman of the Board of Management, €0.8 million for Board
of Management members, and 80 percent of €0.8 million for
the members who joined the Board of Management in 2006.
The German Commercial Code (Section 314, Paragraph 1,
Item 6a, Sentence 9) requires supplemental disclosure of the
Company’s expenses for the performance rights granted in
2007 and all tranches existing in the 2007 financial year that
were granted in prior years. The following expenses in accor-
dance with IFRS 2 were recorded for the 2007 financial year:
Dr. Bernotat (€5.6 million), Dr. Bergmann (€2.6 million),
Mr. Dänzer-Vanotti (€0.8 million), Mr. Feldmann (€0.4 million),
Dr. Schenck (€0.4 million), and Dr. Teyssen (€1.6 million).
Income of about €0.1 million was recorded relating to
Dr. Gaul for January 1 – March 31, 2007, due to a decline in
the value of SAR and performance rights during this period.
Additional detailed information about E.ON AG’s stock-based
compensation program can be found in Note 11 to the Con-
solidated Financial Statements.
No loans were outstanding or granted to members of the
Board of Management in the 2007 financial year.
Pages 14, 15, and 213 contain additional information about
the members of the Board of Management.
Payments Made to Former Members of the Board of Management
Total payments made to former Board of Management mem-
bers and to their beneficiaries amounted to €6.6 million in
2007 (2006: €11.7 million). Provisions of €97.4 million (2006:
€99.9 million) have been provided for pension obligations to
former Board of Management members and their beneficiaries.
The total compensation of the members of the Board of
Management in the 2007 financial year amounted to €20.4 mil-
lion (2006: €21.7 million). Individual members of the Board of
Management were paid the following total compensation:
Dr. Wulf H. Bernotat
Dr. Burckhard Bergmann
Christoph Dänzer-Vanotti
Lutz Feldmann
Dr. Hans Michael Gaul (until March 31, 2007)
Dr. Marcus Schenck
Dr. Johannes Teyssen
Total
Compensation of the Board of Management 2007
Number of2nd tranche
performancerights granted
13,987
8,288
6,631
6,631
2,072
6,631
8,288
52,528
Fair value of2nd tranche
of perfor-mance rights
1,164,278
689,893
551,964
551,964
172,473
551,964
689,893
4,372,429
Total
5,331,519
3,228,832
2,580,067
2,601,882
806,579
2,595,307
3,286,208
20,430,394
Othercompensation
47,241
28,939
18,103
39,918
6,606
33,343
86,315
260,465
Annual bonus
2,880,000
1,760,000
1,410,000
1,410,000
440,000
1,410,000
1,760,000
11,070,000
Fixed annual
compensation
1,240,000
750,000
600,000
600,000
187,500
600,000
750,000
4,727,500

122
Independent Auditor’s ReportWe have audited the Consolidated Financial Statements
prepared by E.ON AG, Düsseldorf, Germany, comprising the
balance sheet, the income statement, the statement of
recognized income and expenses, the cash flow statement
and the notes to the financial statements, together with
the Group Management Report, which has been combined
with the management report for E.ON AG, for the fiscal year
from January 1 through December 31, 2007. The preparation
of the Consolidated Financial Statements and of the Com-
bined Management Report in accordance with the IFRS
applicable to financial reporting as adopted by the EU and
in accordance with the additional requirements pursuant to
Article 315a (1) of the German Commercial Code (HGB) is
the responsibility of the Company’s Board of Management.
Our responsibility is to express an opinion on the Consoli-
dated Financial Statements and on the Combined Manage-
ment Report based on our audit.
We conducted our audit of the Consolidated Financial State-
ments in accordance with Article 317 HGB and the German
generally accepted standards for the audit of financial
statements promulgated by the Institut der Wirtschafts-
prüfer (Institute of Public Auditors in Germany) (IDW), with
additional consideration given to the International Stan-
dards on Auditing (ISA). Those standards require that we
plan and perform the audit in such a way as to ensure that
misstatements materially affecting the presentation of the
net assets, financial position and results of operations in
the Consolidated Financial Statements in accordance with
the applicable financial reporting framework and in the
Group Management Report are detected with reasonable
assurance. Knowledge of the business activities and the
economic and legal environment of the Group and expecta-
tions as to possible misstatements are taken into account
in the determination of audit procedures. The effectiveness
of the accounting-related internal control system and the
evidence supporting the disclosures in the Consolidated
Financial Statements and the Group Management Report are
examined primarily on a test basis within the framework of
the audit. The audit includes assessing the annual financial
statements of those entities included in consolidation, the
determination of entities to be included in consolidation,
the accounting and consolidation principles used and signifi-
cant estimates made by the Board of Management, as well
as evaluating the overall presentation of the Consolidated
Financial Statements and Group Management Report. We
believe that our audit provides a reasonable basis for our
opinion.
Our audit has not led to any reservations.
In our opinion, based on the findings of our audit, the Con-
solidated Financial Statements are in compliance with the
IFRS applicable to financial reporting as adopted by the EU
and with the additional requirements pursuant to Article
315a (1) HGB, and give a true and fair view of the net assets,
financial position and results of operations of the Group in
accordance with these requirements. The Combined Group
Management Report is consistent with the Consolidated
Financial Statements and, as a whole, provides an appropriate
view of the Group’s position and appropriately presents the
opportunities and risks of future development.
Düsseldorf, February 20, 2008
PricewaterhouseCoopers Aktiengesellschaft
Wirtschaftsprüfungsgesellschaft
Dr. Norbert Vogelpoth Dr. Norbert Schwieters
Wirtschaftsprüfer Wirtschaftsprüfer
(German Public Auditor) (German Public Auditor)

123To Our ShareholdersSupervisory Board Year in Review Combined Group Management Report Additional Information Market Units Corporate Governance Consolidated Financial Statements Tables and Explanations
E.ON AG and Subsidiaries Consolidated Statements of Income
in millions
Sales including electricity and energy taxes
Electricity and energy taxes
Sales
Changes in inventories (finished goods and work in progress)
Own work capitalized
Other operating income
Cost of materials
Personnel costs
Depreciation, amortization and impairment charges
Other operating expenses
Income/Loss (–) from companies accounted for under the equity method
Income/Loss (–) from continuing operations before financial results and income taxes
Financial resultsIncome from equity investmentsIncome from other securities, interest and similar incomeInterest and similar expenses
Income taxes
Income/Loss (–) from continuing operations
Income/Loss (–) from discontinued operations, net
Net incomeAttributable to shareholders of E.ON AGAttributable to minority interests
in €
Earnings per share (attributable to shareholders of E.ON AG)—basic and diluted
from continuing operations
from discontinued operations
from net income
Notes
(5)
(6)
(7)
(8)
(11)
(7)
(33)
(9)
(10)
(4)
(13)
2007
70,761
–2,030
68,731
22
517
7,776
–50,223
–4,597
–3,194
–9,724
1,147
10,455
–772179
1,035–1,986
–2,289
7,394
330
7,7247,204
520
10.55
0.51
11.06
2006
67,653
–3,562
64,091
8
395
7,914
–46,708
–4,529
–3,670
–11,907
748
6,342
–99550
1,169–2,214
–40
5,307
775
6,0825,586
496
7.31
1.16
8.47

124
2007
16,761
4,284
48,552
8,411
21,47814,583
6,895
2,449
680
2,034
1,155
105,804
3,811
1,515
17,973
539
7,0753,888
3002,887
577
31,490
137,294
2006
15,320
3,894
42,484
7,770
20,67913,533
7,146
2,631
373
2,090
1,247
96,488
4,199
1,477
18,057
554
6,1894,448
5871,154
611
31,087
127,575
2006
15,494
4,207
41,067
9,507
16,54410,073
6,471
3,268
1,736
1
2,108
93,932
2,587
1,090
17,088
874
9,9015,455
984,348
682
32,222
126,154
in millions
Goodwill
Intangible assets
Property, plant and equipment
Companies accounted for under the equity method
Other financial assetsEquity investmentsNon-current securities
Financial receivables and other financial assets
Operating receivables and other operating assets
Income tax assets
Deferred tax assets
Non-current assets
Inventories
Financial receivables and other financial assets
Trade receivables and other operating assets
Income tax assets
Liquid fundsSecurities and fixed-term depositsRestricted cashCash and cash equivalents
Assets held for sale
Current assets
Total assets
Notes
(14a)
(14a)
(14b)
(15)
(15)
(17)
(17)
(10)
(16)
(17)
(17)
(18)
(4)
December 31 January 1
E.ON AG and Subsidiaries Consolidated Balance Sheets—Assets

125To Our ShareholdersSupervisory Board Year in Review Combined Group Management Report Additional Information Market Units Corporate Governance Consolidated Financial Statements Tables and Explanations
2007
1,734
11,825
26,828
10,656
–616
–1,053
49,374
6,281
–525
5,756
55,130
15,915
5,432
2,537
2,890
18,073
7,555
52,402
5,549
18,254
1,354
3,992
613
29,762
137,294
2006
1,799
11,760
24,350
11,033
–230
–
48,712
4,994
–2,461
2,533
51,245
10,029
5,422
2,333
3,962
18,138
7,063
46,947
3,443
19,578
1,753
3,994
615
29,383
127,575
2006
1,799
11,749
22,910
8,150
–256
–
44,352
4,747
–3,130
1,617
45,969
10,985
5,666
1,134
9,768
18,009
7,625
53,187
3,455
18,296
1,859
2,552
836
26,998
126,154
in millions
Capital stock
Additional paid-in capital
Retained earnings
Accumulated other comprehensive income
Treasury shares
Reclassification related to put options on treasury shares
Equity attributable to shareholders of E.ON AG
Minority interests (before reclassification)
Reclassification related to put options
Minority interests
Equity
Financial liabilities
Operating liabilities
Income taxes
Provisions for pensions and similar obligations
Miscellaneous provisions
Deferred tax liabilities
Non-current liabilities
Financial liabilities
Trade payables and other operating liabilities
Income taxes
Miscellaneous provisions
Liabilities associated with assets held for sale
Current liabilities
Total equity and liabilities
Notes
(19)
(20)
(21)
(22)
(19)
(19)
(26)
(23)
(26)
(26)
(24)
(25)
(10)
(26)
(26)
(25)
(4)
December 31 January 1
E.ON AG and Subsidiaries Consolidated Balance Sheets—Equity and Liabilities

126
2007
7,724
–81–82
1
2611,183–922
–966–966
0
852
–23
43
7,7677,370
397
in millions
Net income
Cash flow hedgesUnrealized changesReclassification adjustments recognized in income
Available-for-sale securitiesUnrealized changesReclassification adjustments recognized in income
Currency translation adjustmentsUnrealized changesReclassification adjustments recognized in income
Changes in actuarial gains/losses of defined benefit pension plans and similar obligations
Deferred taxes
Total income and expenses recognized directly in equity
Total recognized income and expenses (total comprehensive income)Attributable to shareholders of E.ON AGAttributable to minority interests
2006
6,082
–276–302
26
3,7764,202–426
1459
136
781
–862
3,564
9,6468,937
709
E.ON AG and Subsidiaries Consolidated Statements of Recognized Income and Expenses

127To Our ShareholdersSupervisory Board Year in Review Combined Group Management Report Additional Information Market Units Corporate Governance Consolidated Financial Statements Tables and Explanations
2007
7,724
–330
3,194
–146
–35
–111
–1,502 –52
–444–1,006
–68 321455
–724–958838
8,726
1,431293
1,138
–11,306–6,916–4,390
9,914
–9,114
286
–8,789
55
–3,500
64
–2,210
–237
12,533
–4,897
1,808
1,745
12
–12
0
0
–12
1,154
2,887
–1,822
–1,134
814
1,325
in millions
Net income
Income from discontinued operations, net
Depreciation, amortization and impairment of intangible assets and of property, plant and equipment
Changes in provisions
Changes in deferred taxes
Other non-cash income and expenses
Gain/Loss on disposal of Intangible assets and property, plant and equipmentEquity investmentsSecurities (> 3 months)
Changes in operating assets and liabilities and in income taxesInventoriesTrade receivablesOther operating receivables and income tax assetsTrade payablesOther operating liabilities and income taxes
Cash provided by operating activities of continuing operations (operating cash flow)
Proceeds from disposal of Intangible assets and property, plant and equipmentEquity investments
Purchase of investments in Intangible assets and property, plant and equipmentEquity investments
Proceeds from disposal of securities (> 3 months) and of financial receivables and fixed-term deposits
Purchase of securities (> 3 months) and of financial receivables and fixed-term deposits
Changes in restricted cash
Cash used for investing activities of continuing operations
Payments received/made from changes in capital
Payments for treasury shares, net
Premiums received for put options on treasury shares
Cash dividends paid to shareholders of E.ON AG
Cash dividends paid to minority shareholders
Proceeds from financial liabilities
Repayments of financial liabilities
Cash provided by (used for) financing activities of continuing operations
Net increase (decrease) in cash and cash equivalents from continuing operations
Cash provided by operating activities of discontinued operations
Cash used for investing activities of discontinued operations
Cash provided by financing activities of discontinued operations
Net increase (decrease) in cash and cash equivalents from discontinued operations
Effect of foreign exchange rates on cash and cash equivalents
Cash and cash equivalents at the beginning of the year
Cash and cash equivalents at the end of the year
Supplementary Information on Cash Flows from Operating Activities
Income taxes paid (less refunds)
Interest paid
Interest received
Dividends received
2006
6,082
–775
3,670
1,284
–465
62
–950 –95
–362–493
–1,747–1,673–1,516
46273
907
7,161
3,877303
3,574
–5,037–4,096
–941
6,899
–10,042
–154
–4,457
–1
28
0
–4,614
–244
10,845
–11,874
–5,860
–3,156
69
–109
2
–38
0
4,348
1,154
–840
–1,029
584
1,079
E.ON AG and Subsidiaries Consolidated Statements of Cash Flows

Notes128
Retainedearnings
22,910
–4,614
6,0545,586
468
24,350
24,350
–3,115
–2,210
56
7,7477,204
543
26,828
in millions
Balance as of January 1, 2006
Treasury shares repurchased/sold
Dividends paid
Other changes
Net additions/disposals from thereclassification related to putoptions
Total comprehensive incomeNet incomeChanges in actuarial gains/losses of defined benefit pension plans and similarobligationsOther comprehensive income
Balance as of December 31, 2006
Balance as of January 1, 2007
Changes in scope of consolidation
Treasury shares repurchased/sold
Capital increase
Capital decrease
Dividends paid
Other changes
Net additions/disposals from thereclassification related to putoptions
Total comprehensive incomeNet incomeChanges in actuarial gains/losses of defined benefit pension plans and similarobligationsOther comprehensive income
Balance as of December 31, 2007
Capital stock
1,799
1,799
1,799
–65
1,734
Additionalpaid-in capital
11,749
11
11,760
11,760
65
11,825
Currencytranslationadjustment
675
–43
–43
632
632
–950
–950
–318
Available-for-sale
securities
7,343
3,148
3,148
10,491
10,491
590
590
11,081
Cash flowhedges
132
–222
–222
–90
–90
–17
–17
–107
Accumulated other comprehensive income
Statement of Changes in Equity

129To Our ShareholdersSupervisory Board Year in Review Combined Group Management Report Additional Information Market Units Corporate Governance Consolidated Financial Statements Tables and Explanations
Treasury shares
–256
26
–230
–230
–386
–616
Put options on treasury
shares
0
0
0
–1,053
–1,053
Equity attributable
to shareholdersof E.ON AG
44,352
37
–4,614
8,9375,586
4682,883
48,712
48,712
–386
–3,115
–2,210
–997
7,3707,204
543–377
49,374
Total
45,969
37
–4,858
–218
669
9,6466,082
5033,061
51,245
51,245
1,067
–386
180
–3,179
–2,447
–56
939
7,7677,724
609–566
55,130
Minority interests
1,617
–244
–218
669
709496
35178
2,533
2,533
1,067
180
–64
–237
–56
1,936
397520
66–189
5,756
Reclassification related to
put options
–3,130
669
–2,461
–2,461
1,936
–525
Minority interests
(beforereclassification)
4,747
–244
–218
709496
35178
4,994
4,994
1,067
180
–64
–237
–56
397520
66–189
6,281

Notes130
(1) Basis of Presentation
Based in Germany, the E.ON Group (“E.ON” or the “Group”) is
an international group of companies with integrated elec-
tricity and gas operations. The E.ON Group’s reporting seg-
ments are presented in line with the Group’s internal organi-
zational and reporting structure:
• The Central Europe market unit, led by E.ON Energie AG
(“E.ON Energie”), Munich, Germany, operates E.ON’s inte-
grated electricity business and the downstream gas
business in Central Europe.
• Pan-European Gas is responsible for the upstream and
midstream gas business. Moreover, this market unit
holds predominantly minority shareholdings in the
downstream gas business. This market unit is led by
E.ON Ruhrgas AG (“E.ON Ruhrgas”), Essen, Germany.
• The U.K. market unit encompasses the integrated energy
business in the United Kingdom. This market unit is led
by E.ON UK plc (“E.ON UK”), Coventry, U.K.
• The Nordic market unit, which is led by E.ON Nordic AB
(“E.ON Nordic”), Malmö, Sweden, focuses on the inte-
grated energy business in Northern Europe. It operates
through the integrated energy company E.ON Sverige
AB (“E.ON Sverige”), Malmö, Sweden.
• The U.S. Midwest market unit, led by E.ON U.S. LLC
(“E.ON U.S.”), Louisville, Kentucky, U.S., is primarily active
in the regulated energy market in the U.S. state of Ken-
tucky.
• Corporate Center/New Markets contains those interests
held directly by E.ON AG (”E.ON” or the “Company”),
including the operations acquired in Russia and those in
the area of renewable energy (see Note 4), as well as
E.ON AG itself and the consolidation effects that take
place at the Group level.
The market units and Corporate Center/New Markets are the
reportable segments as defined by International Financial
Reporting Standard (“IFRS”) 8, “Operating Segments” (“IFRS 8”).
Note 33 provides additional information about the market units.
With European Union (“EU”) Regulation 1606/2002 dated July 19,
2002, the European Parliament and the European Council
mandated the adoption of IFRS into EU law governing the
consolidated financial statements of publicly traded compa-
nies for fiscal years beginning on or after January 1, 2005.
However, member states were permitted to defer mandatory
application of IFRS until 2007 for companies that, like E.ON,
had been preparing their consolidated financial statements
in accordance with generally accepted accounting principles
in the United States of America (“U.S. GAAP”) and whose
stock was officially listed for public trading in a non-EU
member state. In Germany, the Bilanzrechtsreformgesetz
(“BilReG”) implemented the option to defer mandatory IFRS
application in October 2004.
E.ON made use of this option and, accordingly, the Consoli-
dated Financial Statements for the year ended December 31,
2007, contained in this Annual Report have been prepared in
accordance with IFRS 1, “First-time Adoption of International
Financial Reporting Standards” (“IFRS 1”). These Consolidated
Financial Statements have been prepared in accordance
with Article 315a (1) of the German Commercial Code (“HGB”)
and with those IFRS and International Financial Reporting
Interpretations Committee (“IFRIC”) interpretations that had
been adopted by the European Commission for use in the
EU as of the end of the fiscal year, and whose application
was mandatory as of December 31, 2007. In addition, E.ON
has opted for the voluntary early adoption of IFRS 8.
The preparation of the Consolidated Financial Statements in
accordance with IFRS has led to changes in the Group’s
accounting policies as compared with the accounting princi-
ples used in the most recent annual Consolidated Financial
Statements, i.e., U.S. GAAP. The following accounting policies
have been applied for all periods presented in these Consoli-
dated Financial Statements. They have also been used, in
accordance with IFRS 1, for the preparation of the opening
balance sheet under IFRS as of January 1, 2006. The effects of
the transition from U.S. GAAP to IFRS are discussed in Note 35.
131To Our ShareholdersSupervisory Board Year in Review Combined Group Management Report Additional Information Market Units Corporate Governance Consolidated Financial Statements Tables and Explanations
(2) Summary of Significant Accounting Policies
General Principles
The Consolidated Financial Statements are prepared based
on historical cost, with the exception of available-for-sale
financial assets that are recognized at fair value and of
financial assets and liabilities (including derivative financial
instruments) that must be recognized in income at fair value.
Scope of ConsolidationThe Consolidated Financial Statements incorporate the finan-
cial statements of E.ON AG and entities controlled by E.ON
(“subsidiaries”). Control is achieved when the parent company
has the power to govern the financial and operating policies
of an entity so as to obtain economic benefits from its activi-
ties. In addition, special purpose entities are consolidated
when the substance of the relationship indicates that the
entity is controlled by E.ON.
The results of the subsidiaries acquired or disposed of during
the year are included in the Consolidated Statement of Income
from the date of acquisition or until the date of the disposal,
respectively.
Where necessary, adjustments are made to the subsidiaries’
financial statements to bring their accounting policies into
line with those of the Group. Intercompany receivables, liabil-
ities and results between Group companies are eliminated in
the consolidation process.
Associated CompaniesAn associate is an entity over which E.ON has significant
influence but which is neither a subsidiary nor an interest in
a joint venture. Significant influence is achieved when E.ON
has the power to participate in the financial and operating
policy decisions of the investee but does not control or jointly
control these decisions. Significant influence is generally
presumed if E.ON directly or indirectly holds at least 20 per-
cent, but less than 50 percent, of an entity’s voting rights.
Interests in associated companies are accounted for under
the equity method. In addition, majority-owned companies in
which E.ON does not exercise control due to restrictions con-
cerning the control of assets or management are also gener-
ally accounted for under the equity method.
Interests in associated companies accounted for under the
equity method are reported on the balance sheet at cost,
adjusted for changes in the Group’s share of the net assets
after the date of acquisition, as well as any impairment
charges. Losses that exceed the Group’s interest in an asso-
ciated company are not recognized. Any goodwill resulting
from the acquisition of an associated company is included in
the carrying amount of the investment.
Unrealized gains and losses arising from transactions with
associated companies accounted for under the equity
method are eliminated within the consolidation process on
a pro-rata basis if and insofar as these are material.
Companies accounted for under the equity method are tested
for impairment by comparing the carrying amount with its
recoverable amount. If the carrying amount exceeds the
recoverable amount, the carrying amount is adjusted in the
amount of this difference. If the reasons for previously rec-
ognized impairment losses no longer exist, such impairment
losses are reversed.
The financial statements of equity interests accounted for
under the equity method are generally prepared using
accounting that is uniform within the Group.
Joint VenturesJoint ventures are also accounted for under the equity method.
Unrealized gains and losses arising from transactions with
joint-venture companies are eliminated within the consolida-
tion process on a pro-rata basis if and to the extent these
are material.
Business Combinations In accordance with the exemption allowed under IFRS 1, the
provisions of IFRS 3, “Business Combinations” (“IFRS 3”), were
not applied with respect to the accounting for business com-
binations that occurred before January 1, 2006. The goodwill
maintained from this period did not include any intangible
assets that had to be reported separately under IFRS. Con-
versely, there were no intangible assets that until now had
been reported separately that had to be included in good-
will. As no adjustment for intangible assets was required
relating to such business combinations, the goodwill reported
under U.S. GAAP was maintained in E.ON’s opening balance
sheet under IFRS.

132 Notes
Foreign Currency TranslationThe Company’s transactions denominated in foreign curren-
cies are translated at the current exchange rate at the date
of the transaction. Monetary foreign currency items are
adjusted to the current exchange rate at each balance sheet
date; any gains and losses resulting from fluctuations in the
relevant currencies are included in other operating income
and other operating expenses, respectively. Gains and losses
from the translation of financial instruments used in hedges
of net investments in its foreign operations are recognized
in equity. The ineffective portion of the hedging instrument
is immediately recognized in income.
The functional currency as well as the reporting currency of
E.ON AG is the euro. The Consolidated Financial Statements
are presented in euro as well. The assets and liabilities of
the Company’s foreign subsidiaries with a functional currency
other than the euro are translated using period-end exchange
rates, while items of the statements of income are translated
using average exchange rates for the period. Significant
transactions of foreign subsidiaries occurring during the fis-
cal year are translated in the financial statements using the
exchange rate at the date of the transaction. Differences
arising from the translation of assets and liabilities, as well
as gains or losses in comparison with the translation of prior
years, are included as a separate component of equity and
accordingly have no effect on net income. In accordance
with the option under IFRS 1, all unrealized cumulative trans-
lation differences that had resulted from the translation of
financial statements into the reporting currency of E.ON in
prior periods and had been recognized in equity were offset
against retained earnings at the date of transition.
The foreign currency translation effects that are attributable
to monetary financial instruments classified as available for
sale are recognized in net income. For non-monetary financial
instruments classified as available for sale, the foreign currency
translation effects are recognized in equity with no effect on
net income.
Business combinations are accounted for by applying the
purchase method, whereby the purchase price is offset against
the proportional share in the acquired company’s net assets.
In doing so, the values at the acquisition date that corres-
ponds to the date at which control of the acquired company
was attained are used as a basis. The acquiree’s identifiable
assets, liabilities and contingent liabilities are recognized
at their fair values, regardless of the extent attributable to
minority interests. The fair values of individual assets are
determined using published exchange or market prices at
the time of acquisition in the case of marketable securities,
for example, and in the case of land, buildings and more sig-
nificant technical equipment, generally using independent
expert reports that have been prepared by third parties. If
exchange or market prices are unavailable for consideration,
fair values are determined using the most reliable informa-
tion available that is based on market prices for comparable
assets or on suitable valuation techniques. In such cases, E.ON
determines fair value using the discounted cash flow method
by discounting estimated future cash flows by a weighted
average cost of capital. Estimated cash flows are consistent
with the internal mid-term planning data for the next three
years, followed by two additional years of cash flow projec-
tions, which are extrapolated until the end of an asset’s
useful life using a growth rate based on industry and internal
projections. The discount rate reflects specific risks inherent to
the asset.
Transactions with minority shareholders are treated in the
same way as transactions with equity holders. Should the
acquisition of additional shares in a subsidiary result in a
difference between the cost of purchasing the shares and
the carrying amount of the minority interest acquired, that
difference must be fully recognized in equity.
Gains and losses from disposals of shares to minority share-
holders are also recognized in equity, provided that such dis-
posals do not result in a loss of control.
Intangible assets must be recognized separately from good-
will if they are clearly separable or if their recognition arises
from a contractual or other legal right. Provisions for restruc-
turing measures may not be recorded in a purchase price
allocation. If the purchase price paid exceeds the proportional
share in the net assets at the time of acquisition, the positive
difference is recognized as goodwill. A negative difference is
immediately recognized in income.

133To Our ShareholdersSupervisory Board Year in Review Combined Group Management Report Additional Information Market Units Corporate Governance Consolidated Financial Statements Tables and Explanations
The following table depicts the movements in exchange
rates for the periods indicated for major currencies of coun-
tries outside the European Monetary Union:
Recognition of Incomea) RevenuesThe Company generally recognizes revenue upon delivery of
products to customers or upon fulfillment of services. Delivery
has occurred when the risks and rewards associated with
ownership have been transferred to the buyer, compensa-
tion has been contractually established and collection of the
resulting receivable is probable. Revenues from the sale of
goods and services are measured at the fair value of the
consideration received or receivable.
Revenues are presented net of sales taxes, returns, rebates
and discounts, and after elimination of intercompany sales.
Revenues are generated primarily from the sale of electricity
and gas to industrial and commercial customers and to retail
customers. Additional revenue is earned from the distribu-
tion of electricity and gas, as well as from deliveries of steam
and heat.
Revenues from the sale of electricity and gas to industrial
and commercial customers and to retail customers are rec-
ognized when earned on the basis of a contractual arrange-
ment with the customer; they reflect the value of the vol-
ume supplied, including an estimated value of the volume
supplied to customers between the date of their last meter
reading and period-end.
b) Interest IncomeInterest income is recognized pro rata using the effective
interest method.
c) Dividend IncomeDividend income is recognized when the right to receive the
distribution payment arises.
Electricity and Energy TaxesThe electricity tax is levied on electricity delivered to retail
customers by domestic utilities in Germany and Sweden and
is calculated on the basis of a fixed tax rate per kilowatt-
hour (“kWh”). This rate varies between different classes of
customers. Electricity and energy taxes paid are deducted
from sales revenues on the face of the income statement.
Germany’s Energy Tax Act (“Energiesteuergesetz,” “EnergieStG”)
regulates the taxation of energy generated from petroleum,
natural gas and coal. It replaced the Petroleum Tax Act
(“Mineralölsteuergesetz”) effective August 1, 2006. Under the
Energy Tax Act, natural gas tax is not levied until delivery to
the end consumer. Under the previously applicable Petroleum
Tax Act, natural gas tax became due at the time of the procure-
ment or removal of the natural gas from storage facilities.
Accounting for Sales of Shares of Subsidiaries orAssociated CompaniesIf a subsidiary or associated company sells shares to a third
party, leading to a reduction in E.ON’s ownership interest in
the relevant company (“dilution”), and consequently to a loss
of control or significant influence, gains and losses from
these dilutive transactions are included in the income state-
ment under other operating income or expenses.
Research and Development CostsUnder IFRS, research and development costs must be allo-
cated to a research phase and a development phase. While
expenditure on research is expensed as incurred, recognized
development costs must be capitalized as an intangible asset
if all of the general criteria for recognition specified in IAS 38,
“Intangible Assets” (“IAS 38”), as well as certain other specific
prerequisites, have been fulfilled. In the 2007 and 2006 fiscal
years, these criteria have not been fulfilled.
Research and development costs totaled 37 million in 2007
(2006: 27 million).
Earnings per ShareBasic (undiluted) earnings per share is computed by dividing
the consolidated net income attributable to the shareholders
of the parent company by the weighted average number of
ordinary shares outstanding during the relevant period. At
E.ON the computation of diluted earnings per share is identical
to basic earnings per share, because E.ON AG has no dilutive
potential ordinary shares.
British pound
Norwegian krone
Russian ruble
Swedish krona
Hungarian forint
U.S. Dollar
ISOCode
GBP
NOK
RUB
SEK
HUF
USD
2007
0.73
7.97
35.99
9.45
253.81
1.47
2006
0.67
8.24
34.68
9.04
251.77
1.32
2007
0.68
8.02
34.99
9.25
251.34
1.37
2006
0.68
8.05
34.11
9.25
264.26
1.26
1, rate atyear-end
1, annualaverage rate
Currencies

134 Notes
Goodwill and Intangible Assets GoodwillAccording to IFRS 3, goodwill is not amortized, but rather
tested for impairment at the cash-generating unit level on
at least an annual basis. Impairment tests must also be per-
formed between these annual tests if events or changes in
circumstances indicate that the carrying amount of the
respective cash-generating unit might not be recoverable.
Newly created goodwill is allocated to those cash-generat-
ing units expected to benefit from the respective business
combination. E.ON has identified the operating units one
level below its primary segments as its cash-generating
units.
In a first step, E.ON determines the recoverable amount of a
cash-generating unit on the basis of the fair value (less costs
to sell) using valuation procedures that make use of the
Company’s internal mid-term planning data. Valuation is
based on the discounted cash flow method, and accuracy is
verified through the use of multiples. In addition, market
transactions or valuations prepared by third parties for com-
parable assets are used to the extent available.
In an impairment test, the recoverable amount of a cash-
generating unit is compared with its carrying amount,
including goodwill. The recoverable amount is the higher of
the cash-generating unit’s fair value less costs to sell and its
value in use. If the carrying amount exceeds the recoverable
amount, the goodwill allocated to that cash-generating unit
is adjusted in the amount of this difference.
If the impairment thus identified exceeds the goodwill allo-
cated to the affected cash-generating unit, the remaining
assets of the unit must be written down in the proportion of
their carrying amounts. Individual assets may not be written
down if their respective carrying amounts were to fall below
the highest of the following as a result:
• Fair value less costs to sell
• Value in use
• Zero
The impairment loss that would otherwise have been allo-
cated to the asset concerned must instead be allocated pro
rata to the remaining assets of the unit.
E.ON has elected to perform the annual testing of goodwill
for impairment at the cash-generating unit level in the fourth
quarter of each fiscal year.
Impairment losses recognized for goodwill in a cash-generat-
ing unit may not be reversed in subsequent reporting periods.
Intangible AssetsIAS 38 requires that intangible assets be amortized over their
useful lives unless their lives are considered to be indefinite.
Acquired intangible assets subject to amortization are classi-
fied as marketing-related, customer-related, contract-based,
and technology-based. Internally generated intangible assets
subject to amortization are related to software. Intangible
assets subject to amortization are measured at cost and amor-
tized using the straight-line method over their expected use-
ful lives, generally for a period between 5 and 25 years or
between 3 and 5 years for software, respectively. Useful lives
and amortization methods are subject to annual verification.
Intangible assets subject to amortization are tested for impair-
ment whenever events or changes in circumstances indicate
that such assets may be impaired.
Intangible assets not subject to amortization are measured at
cost and tested for impairment annually or more frequently if
events or changes in circumstances indicate that such assets
may be impaired. Moreover, such assets are reviewed annually
to determine whether an assessment of indefinite useful life
remains applicable.
In accordance with IAS 36, “Impairment of Assets” (“IAS 36”),
the carrying amount of an intangible asset, whether subject
to amortization or not, is tested for impairment by compar-
ing the carrying value with its recoverable amount, which is
the higher of an asset’s value in use and its fair value less
costs to sell. Should the carrying amount exceed the recover-
able amount, an impairment charge equal to the difference
between the carrying amount and the recoverable amount is
recognized. If the reasons for previously recognized impair-
ment losses no longer exist, such impairment losses are

135
reversed. A reversal shall not cause the carrying amount of an
intangible asset subject to amortization to exceed the amount
that would have been determined, net of amortization, had
no impairment loss been recognized during the period.
If a recoverable amount cannot be determined for an individ-
ual intangible asset, the recoverable amount for the smallest
identifiable group of assets (cash-generating unit) that the
intangible asset may be assigned to is determined.
Please see Note 14(a) for additional information about good-
will and intangible assets.
Emission RightsUnder IFRS, emission rights held under national and inter-
national emission-rights systems for the settlement of obli-
gations are reported as intangible assets. Because emission
rights are not amortized, they are reported as intangible
assets not subject to amortization. Emission rights are cap-
italized at cost on acquisition or when issued for the respec-
tive reporting period as (partial) fulfillment of the notice of
allocation from the responsible national authorities.
A provision is recognized for emissions produced. The pro-
vision is measured at the carrying amount of the emission
rights held or, in the case of a shortfall, at the current fair
value of the emission rights needed. Any expected shortfall
in emission rights is recorded under miscellaneous provi-
sions. The expenses incurred for the recognition of the pro-
vision are reported under cost of materials.
As part of operating activities, emission rights are also held
for proprietary trading purposes. Emission rights held for
proprietary trading are reported under other operating assets
and measured at the lower of cost or fair value.
Property, Plant and Equipment Property, plant and equipment are initially measured at acqui-
sition or production cost, including decommissioning or
restoration cost that must be capitalized, and are depreciated
over their expected useful lives, generally using the straight-
line method, unless a different method of depreciation is
deemed more suitable in certain exceptional cases.
Property, plant and equipment are tested for impairment
whenever events or changes in circumstances indicate that
an asset may be impaired. In such a case, property, plant
and equipment are tested for impairment according to the
principles prescribed for intangible assets in IAS 36. If an
impairment loss is determined, the remaining useful life of
the asset might also be subject to adjustment, where appli-
cable. If the reasons for previously recognized impairment
losses no longer exist, such impairment losses are reversed
and recognized in income. Such reversal shall not cause the
carrying amount to exceed the amount that would have
been presented had no impairment taken place during the
preceding periods.
Investment subsidies do not reduce the acquisition and pro-
duction costs of the respective assets; they are instead reported
on the balance sheet as deferred income.
Subsequent costs arising, for example, from additional or
replacement capital expenditure are only recognized as part
of the acquisition or production cost of the asset, or else—if
relevant—recognized as a separate asset if it is probable that
the Group will receive a future economic benefit and the cost
can be determined reliably.
Repair and maintenance costs that do not constitute significant
replacement capital expenditure are expensed as incurred.
Borrowing CostsBorrowing costs that arise in connection with the acquisi-
tion, construction or production of a qualifying asset from
the time of acquisition or from the beginning of construction
or production until entry into service are capitalized and
subsequently amortized alongside the related asset. Borrow-
ing costs are generally allocated using the Group’s overall
cost of financing as a basis. As of December 31, 2007, a financ-
ing rate uniform within the Group of 5.0 percent was applied.
In the case of a specific financing arrangement, the respec-
tive specific borrowing costs for that arrangement are used.
Other borrowing costs are expensed.
To Our ShareholdersSupervisory Board Year in Review Combined Group Management Report Additional Information Market Units Corporate Governance Consolidated Financial Statements Tables and Explanations
Buildings
Technical equipment, plant and machinery
Other equipment, fixtures,furniture and office equipment
Useful Lives of Property, Plant and Equipment
10 to 50 years
10 to 65 years
3 to 25 years

136 Notes
Government GrantsGovernment investment subsidies do not reduce the acquisi-
tion and production costs of the respective assets; they are
instead reported on the balance sheet as deferred income.
They are amortized on a straight-line basis over the related
asset’s expected useful life.
Government grants are recognized at fair value if it is highly
probable that the grant will be issued and if the Group sat-
isfies the necessary conditions for receipt of the grant.
Government grants for costs are recognized over the period
in which the costs that are supposed to be compensated
through the respective grants are incurred.
Leasing Leasing transactions are classified according to the lease
agreements and to the underlying risks and rewards specified
therein in line with IAS 17, “Leases” (“IAS 17“). In addition, IFRIC 4,
“Determining Whether an Arrangement Contains a Lease”
(“IFRIC 4”), further defines the criteria as to whether an agree-
ment that conveys a right to use an asset meets the defini-
tion of a lease. Certain purchase and supply contracts in the
electricity and gas business as well as certain rights of use
may be classified as leases if the criteria are met. E.ON is
party to some agreements in which it is the lessor and other
agreements in which it is the lessee.
Leasing transactions in which E.ON is the lessee are classified
either as finance leases or operating leases. If the Company
bears substantially all of the risks and rewards incident to
ownership of the leased property, the lease is classified as a
finance lease. Accordingly, the Company recognizes on its bal-
ance sheet the asset and the associated liability in equal
amounts.
Recognition takes place at the beginning of the lease term at
the lower of the fair value of the leased property or the pres-
ent value of the minimum lease payments.
The leased property is depreciated over its useful economic
life or, if it is shorter, the term of the lease.
The liability is subsequently measured using the effective
interest method. All other transactions in which E.ON is the
lessee are classified as operating leases. Payments made
under operating leases are generally expensed over the term
of the lease.
Leasing transactions in which E.ON is the lessor and substan-
tially all the risks and rewards incident to ownership of the
leased property are transferred to the lessee are classified as
finance leases. In this type of lease, E.ON records the present
value of the minimum lease payments as a receivable. Pay-
ments by the lessee are apportioned between a reduction of
the lease receivable and interest income. The income from
such arrangements is recognized over the term of the lease
using the effective interest method.
All other transactions in which E.ON is the lessor are treated
as operating leases. E.ON retains the leased property on its
balance sheet as an asset, and the lease payments are gener-
ally recorded as income over the term of the lease.
Financial Instruments The first-time adoption of IFRS 7, “Financial Instruments:
Disclosures” (“IFRS 7”), became effective in the 2007 fiscal year.
The new standard requires both quantitative and qualitative
disclosures about the extent of risks arising from financial
instruments (e.g., credit, liquidity and market risks).
Non-Derivative Financial InstrumentsNon-derivative financial instruments are recognized at fair
value on the settlement date when acquired. Unconsolidated
equity investments and securities are measured in accor-
dance with IAS 39. E.ON categorizes financial assets as held
for trading, available for sale, or as loans and receivables.
Management determines the categorization of the financial
assets at initial recognition.
Securities categorized as available for sale are carried at fair
value on a continuing basis, with any resulting unrealized
gains and losses, net of related deferred taxes, reported as
a separate component within equity until realized. Realized
gains and losses are recorded based on the specific identifi-
cation method. Unrealized losses previously recognized in
equity are recognized in financial results in the case of sub-
stantial impairment. Reversals of impairment losses relating
to equity instruments are recognized exclusively in equity.
Loans and receivables (including trade receivables) are non-
derivative financial assets with fixed or determinable payments

137
that are not traded in an active market. Loans and receiv-
ables are reported on the balance sheet under “Receivables
and other assets.” They are subsequently measured at amor-
tized cost, using the effective interest method. Valuation
allowances are provided for identifiable individual risks. If
the loss of a certain part of the receivables is probable, valu-
ation allowances are provided to cover the expected loss.
Reversals of losses are recognized under “Other operating
income.”
Non-derivative financial liabilities (including trade payables)
within the scope of IAS 39 are measured at amortized cost,
using the effective interest method. Initial measurement
takes place at fair value plus transaction costs. In subsequent
periods, the amortization and accretion of any premium or
discount is included in financial results.
Derivative Financial Instruments and HedgingTransactionsDerivative financial instruments and separated embedded
derivatives are measured at fair value as of the trade date at
initial recognition and in subsequent periods. IAS 39 requires
that they be categorized as held for trading as long as they
are not a component of a hedge accounting relationship.
Gains and losses from changes in fair value are immediately
recognized in net income.
Instruments commonly used are foreign currency forwards
and swaps, as well as interest-rate swaps and cross-currency
swaps. Equity forwards are entered into to cover price risks
on securities. In commodities, the instruments used include
physically and financially settled forwards and options related
to electricity, gas, coal, oil and emission rights. As part of
conducting operations in commodities, derivatives are also
acquired for proprietary trading purposes.
IAS 39 sets requirements for the designation and documen-
tation of hedging relationships, the hedging strategy, as well
as ongoing retrospective and prospective measurement of
effectiveness in order to qualify for hedge accounting. The
Company does not exclude any component of derivative gains
and losses from the measurement of hedge effectiveness.
Hedge accounting is considered to be appropriate if the assess-
ment of hedge effectiveness indicates that the change in fair
value of the designated hedging instrument is 80 to 125 per-
cent effective at offsetting the change in fair value due to
the hedged risk of the hedged item or transaction.
For qualifying fair value hedges, the change in the fair value
of the derivative and the change in the fair value of the
hedged item that is due to the hedged risk(s) are recognized
in income. If a derivative instrument qualifies as a cash flow
hedge, the effective portion of the hedging instrument’s
gain or loss is recognized in equity (as a component of accu-
mulated other comprehensive income) and reclassified into
income in the period or periods during which the transac-
tion being hedged affects income. The hedging result is
reclassified into income immediately if it becomes probable
that the hedged underlying transaction will no longer occur.
For hedging instruments used to establish cash flow hedges,
the change in fair value of the ineffective portion is recog-
nized immediately in the income statement. To hedge the
foreign currency risk arising from the Company’s net invest-
ment in foreign operations, derivative as well as non-deriva-
tive financial instruments are used. Gains or losses due to
changes in fair value and from foreign currency translation
are recognized separately within equity as currency transla-
tion adjustments.
Changes in fair value of derivative instruments that must be
recognized in income are classified as other operating
income or expenses. Gains and losses from interest-rate
derivatives are netted for each contract and included in
interest income. Gains and losses from derivative proprietary
trading instruments are shown net as either revenues or
cost of materials. Certain realized amounts are, if related to
the sale of products or services, also included in sales or
cost of materials.
Unrealized gains and losses resulting from the initial meas-
urement of derivative financial instruments at the inception
of the contract are not recognized in income. They are instead
deferred and recognized in income systematically over the
term of the derivative. An exception to the accrual principle
To Our ShareholdersSupervisory Board Year in Review Combined Group Management Report Additional Information Market Units Corporate Governance Consolidated Financial Statements Tables and Explanations

138 Notes
applies if unrealized gains and losses from the initial measure-
ment are verified by quoted market prices, observable prices
of other current market transactions or other observable
data supporting the valuation technique. In this case the gains
and losses are recognized in income.
See Note 30 for additional information regarding the Com-
pany’s use of derivative instruments.
InventoriesThe Company measures inventories at the lower of acquisi-
tion or production cost and net realizable value. The cost of
raw materials, finished products and goods purchased for
resale is determined based on the average cost method. In
addition to production materials and wages, production costs
include material and production overheads based on normal
capacity. The costs of general administration are not capital-
ized. Inventory risks resulting from excess and obsolescence
are provided for using appropriate valuation allowances
whereby inventories are written down to net realizable value.
Receivables and Other AssetsReceivables and other assets are initially measured at fair
value, which generally approximates nominal value. They are
subsequently measured at amortized cost, using the effective
interest method. Valuation allowances, included in the reported
net carrying amount, are provided for identifiable individual
risks. If the loss of a certain part of the receivables is probable,
valuation allowances are provided to cover the expected loss.
Liquid FundsLiquid funds include current available-for-sale securities,
checks, cash on hand and bank balances. Bank balances and
available-for-sale securities with an original maturity of more
than three months are recognized under securities and fixed-
term deposits. Liquid funds with an original maturity of less
than three months are considered to be cash and cash equiv-
alents, unless they are restricted.
Restricted cash with a remaining maturity in excess of
twelve months is classified as financial receivables and other
financial assets.
Assets Held for Sale and Liabilities Associatedwith Assets Held for SaleIndividual non-current assets or groups of assets held for sale
and any directly attributable liabilities (disposal groups) are
reported in these line items if they can be disposed of in
their current condition and if there is sufficient probability
of their disposal actually taking place. For a group of assets
and associated liabilities to be classified as a disposal group,
the assets and liabilities in it must be held for sale in a sin-
gle transaction or as part of a comprehensive plan.
Discontinued operations are components of an entity that
are either held for sale or have already been sold and can be
clearly distinguished from other corporate operations, both
operationally and for financial reporting purposes. Addition-
ally, the component classified as a discontinued operation
must represent a major business line or a specific geographic
area of the Group.
Non-current assets that are held for sale either individually
or collectively as part of a disposal group, or that belong to
a discontinued operation, are no longer depreciated. They
are instead accounted for at the lower of the carrying amount
and the fair value less any remaining costs to sell. If the fair
value is less than the carrying amount, an impairment loss is
recognized.
The income and losses resulting from the measurement of
components held for sale at fair value less any remaining
costs to sell, as well as the gains and losses arising from the
disposal of discontinued operations, are reported separately
on the face of the income statement under income/loss
from discontinued operations, net, as is the income from the
ordinary operating activities of these divisions. Prior-year
income statement figures are adjusted accordingly. The cash
flows of discontinued operations are reported separately in
the cash flow statement with prior-year figures being adjusted
accordingly. However, there is no reclassification of prior-
year balance sheet line items attributable to discontinued
operations.

139
Equity InstrumentsIFRS defines equity as the residual interest in the Group’s
assets after deducting all liabilities. Therefore, equity is the
net amount of all recognized assets and liabilities.
E.ON has entered into conditional and unconditional pur-
chase commitments to minority shareholders. By means of
these agreements, the minority shareholders have the right
to require E.ON to purchase their shares on specified condi-
tions. None of the contractual obligations has led to the
transfer of substantially all of the risk and rewards to E.ON
at the time of entering into the contract. IAS 32, “Financial
Instruments: Presentation” (“IAS 32”), prescribes that a liabil-
ity must be recognized at the present value of the probable
future exercise price. This amount is reclassified from a sep-
arate component within minority interests and reported sep-
arately as a liability. The reclassification occurs irrespective
of the probability of exercise. Expenses resulting from the
accretion of the liability are recognized in interest expenses.
If a purchase commitment expires unexercised, the liability
reverts to minority interests. Any difference between liabili-
ties and minority interests is recognized directly in retained
earnings.
Where shareholders of entities own statutory, non-excludable
rights of termination (for example, in German partnerships),
such termination rights require the reclassification of minor-
ity interests from equity into liabilities under IAS 32. The lia-
bility is recognized at the present value of the expected set-
tlement amount irrespective of the probability of termina-
tion. Changes in the value of the liability are reported within
other operating income. Accretion of the liability and the
minority shareholders’ share in net income are shown as
interest expense.
If an E.ON Group company buys treasury shares of E.ON AG,
the value of the consideration paid, including directly attrib-
utable additional costs (net after income taxes), is deducted
from E.ON AG’s equity until the shares are retired, distributed
or resold. If such treasury shares are subsequently distrib-
uted or sold, the consideration received, net of any directly
attributable additional transaction costs and associated
income taxes, are added to E.ON AG’s equity.
Share-Based PaymentShare-based payment plans issued in the E.ON Group are
accounted for in accordance with IFRS 2, “Share-Based Pay-
ment” (“IFRS 2”). Both the E.ON Share Performance Plan
introduced in fiscal 2006 and the remaining Stock Apprecia-
tion Rights granted between 1999 and 2005 as part of the
virtual stock option program of E.ON AG are share-based
payment transactions with cash compensation, the value of
which is reported at fair value of the liability at each bal-
ance sheet date. Compensation expense is recorded pro rata
over the vesting period. E.ON determines fair value using the
Monte Carlo simulation technique.
Provisions for Pensions and Similar ObligationsThe valuation of defined benefit obligations in accordance
with IAS 19, “Employee Benefits” (“IAS 19”), is based on actuarial
computations using the projected unit credit method, with
actuarial valuations performed at year-end. The valuation encom-
passes both pension obligations and pension entitlements that
are known on the balance sheet date as well as economic trend
assumptions made in order to reflect realistic expectations.
Actuarial gains and losses that may arise from differences
between the estimated and actual number of beneficiaries
and from the underlying assumptions are recognized in full in
the period in which they occur. Such gains and losses are not
reported within the Consolidated Statements of Income but
rather are recognized within the Statements of Recognized
Income and Expenses as part of equity.
The service cost representing the additional benefits that
employees earned under the benefit plan during the fiscal
year is reported under personnel costs; interest expenses and
expected return on plan assets are reported under financial
results.
To Our ShareholdersSupervisory Board Year in Review Combined Group Management Report Additional Information Market Units Corporate Governance Consolidated Financial Statements Tables and Explanations

140 Notes
Unrecognized past service cost is recognized immediately to
the extent that the benefits are already vested or is amor-
tized on a straight-line basis over the average period until the
benefits become vested.
The amount reported in the balance sheet represents the
present value of the defined benefit obligation adjusted for
unrecognized past service cost and reduced by the fair value
of plan assets. If a net asset position arises from this calcula-
tion, the amount is limited to the unrecognized past service
cost plus the present value of available refunds and reduc-
tions in future contributions.
Payments for defined contribution pension plans are expensed
as incurred and reported under personnel costs. Contributions
to government pension plans are treated like payments for
defined contribution pension plans to the extent that the
Group’s obligations under these pension plans correspond to
those under defined contribution pension plans.
Provisions for Asset Retirement Obligations andOther ProvisionsIn accordance with IAS 37, “Provisions, Contingent Liabilities
and Contingent Assets” (“IAS 37”), provisions are recognized
when E.ON has a legal or constructive present obligation
towards third parties as a result of a past event, it is proba-
ble that E.ON will be required to settle the obligation, and a
reliable estimate can be made of the amount of the obliga-
tion. The provision is recognized at the expected settlement
amount. Long-term obligations are reported as liabilities at
the present value of their expected settlement amounts if
the interest rate effect (the difference between present val-
ue and repayment amount) resulting from discounting is
material; future cost increases that are foreseeable and likely
to occur on the balance sheet date must also be included
in the measurement. Long-term obligations are discounted
at the market interest rate applicable as of the respective
balance sheet date. The accretion amounts and the effects
of changes in interest rates are generally presented as part
of financial results. A reimbursement related to the provi-
sion that is virtually certain to be collected is capitalized as
a separate asset. No offsetting within provisions is permitted.
Advance payments remitted are deducted from the provisions.
Obligations arising from the decommissioning and restora-
tion of property, plant and equipment are recognized during
the period of their occurrence at their discounted settlement
amounts, provided that the obligation can be reliably esti-
mated. The carrying amounts of the respective property,
plant and equipment are increased by the same amounts.
In subsequent periods, capitalized asset retirement costs are
amortized over the expected remaining useful lives of the
assets, and the provision is accreted to its present value on
an annual basis.
Changes in estimates arise in particular from deviations
from original cost estimates, from changes to the maturity
or the scope of the relevant obligation, and also as a result
of the regular adjustment of the discount rate to current
market interest rates. The adjustment of provisions for the
decommissioning and restoration of property, plant and
equipment for changes to estimates is generally recognized
by way of a corresponding adjustment to assets, with no
effect on income. If the property, plant and equipment to be
decommissioned have already been fully depreciated,
changes to estimates are recognized within the income
statement.
The estimates for non-contractual nuclear decommissioning
provisions are based on external studies and are continuously
updated.
Under Swedish law, E.ON Sverige is required to pay fees to
the country’s national fund for nuclear waste management.
Each year, the Swedish Nuclear Power Inspectorate calcu-
lates the fees for the disposal of high-level radioactive waste
and nuclear power plant decommissioning based on the
amount of electricity produced at the particular nuclear
power plant. The proposed fees are then submitted to gov-
ernment offices for approval. Upon approval, E.ON Sverige
makes the corresponding payments. In accordance with
IFRIC 5, “Rights to Interests Arising from Decommissioning,
Restoration and Environmental Rehabilitation Funds” (“IFRIC
5”), payments into the Swedish national fund for nuclear
waste management are offset by a right of reimbursement
of asset retirement obligations, which is recognized as an
asset under “Other assets.” In a departure from the policy
applied in Germany, provisions for Sweden measured on the
basis of the contributions to the fund are discounted at the
real interest rate.
No provisions are established for contingent asset retirement
obligations where the type, scope, timing and associated prob-
abilities can not be determined reliably.
Contingent liabilities are potential or present obligations
toward third parties in which an outflow of resources
embodying economic benefits is not probable or where the
amount of the obligation cannot be measured with sufficient
reliability. Contingent liabilities are generally not recognized
on the balance sheet.

141
Income Taxes Under IAS 12, “Income Taxes” (“IAS 12”), deferred taxes are
recognized on temporary differences arising between the
carrying amounts of assets and liabilities on the balance
sheet and their tax bases (balance sheet liability method).
Deferred tax assets and liabilities are recognized for tempo-
rary differences that will result in taxable or deductible
amounts when taxable income is calculated for future peri-
ods, unless those differences are the result of the initial
recognition of an asset or liability in a transaction other
than a business combination that, at the time of the transac-
tion, affects neither accounting nor taxable profit/loss. IAS 12
further requires that deferred tax assets be recognized for
unused tax loss carryforwards and unused tax credits.
Deferred tax assets are recognized to the extent that it is
probable that taxable profit will be available against which
the deductible temporary differences and unused tax losses
can be utilized. Each of the corporate entities is assessed
individually with regard to the probability of a positive tax
result in future years. Any existing history of losses is incor-
porated in this assessment. For those tax assets to which
these assumptions do not apply, the value of the deferred
tax assets has been reduced.
Deferred tax liabilities caused by temporary differences asso-
ciated with investments in affiliated and associated compa-
nies are recognized unless the timing of the reversal of such
temporary differences can be controlled within the Group
and it is probable that, owing to this control, the differences
will in fact not be reversed in the foreseeable future.
Deferred tax assets and liabilities are measured using the
enacted or substantively enacted tax rates expected to be
applicable for taxable income in the years in which tempo-
rary differences are expected to be recovered or settled. The
effect on deferred tax assets and liabilities of changes in tax
rates and tax law is generally recognized in income. Equity is
adjusted for deferred taxes that had previously been recog-
nized directly in equity. Following passage of the 2008 corpo-
rate tax reforms in Germany, deferred taxes for domestic
companies were calculated using a total tax rate of 30 per-
cent (2006: 39 percent). This tax rate includes, in addition to
the 15 percent (2006: 25 percent) corporate income tax, the
solidarity surcharge of 5.5 percent on the corporate tax, and
the average trade tax rate of 14 percent (2006: 13 percent)
applicable to the E.ON Group. Foreign subsidiaries use appli-
cable national tax rates.
Note 10 shows the major temporary differences so recorded.
Consolidated Statement of Cash Flows In accordance with IAS 7, “Cash Flow Statements” (“IAS 7”),
the Consolidated Statements of Cash Flows are classified by
operating, investing and financing activities. Cash flows from
discontinued operations are reported separately in the Con-
solidated Statement of Cash Flows. Interest received and
paid, income taxes paid and refunded, as well as dividends
received are classified as operating cash flows, whereas divi-
dends paid are classified as financing cash flows. The pur-
chase and sale prices respectively paid and received in con-
nection with the acquisition and disposal of affiliated com-
panies are reported under investing activities, net of the
cash and cash equivalents acquired or divested as part of
the transaction. This also applies to valuation changes due
to exchange rate fluctuations, whose impact on cash and
cash equivalents is separately disclosed.
Segment InformationSegment reporting has for the first time taken place in
accordance with IFRS 8. The so-called management approach
required by IFRS 8 stipulates that the internal reporting
organization used by management for making decisions on
operating matters and the internal performance measure,
i.e., adjusted EBIT, should be applied in the identification of
the Company’s reportable segments (see Note 33).
Structure of the Consolidated Balance Sheets andStatements of IncomeIn accordance with IAS 1, “Presentation of Financial State-
ments” (“IAS 1”), the Consolidated Balance Sheets have been
prepared using a classified balance sheet structure. Assets
that will be realized within twelve months of the reporting
date, as well as liabilities that are due to be settled within
one year of the reporting date are classified as current.
In addition, as part of the transition to IFRS, classification of
the Income Statement was changed to the nature of expense
method which is also applied for internal purposes.
Capital Structure ManagementAt the end of May 2007, E.ON announced its future corporate
strategy. As part of this strategic reorientation at E.ON, the
financial strategy of the Group was also developed further.
To Our ShareholdersSupervisory Board Year in Review Combined Group Management Report Additional Information Market Units Corporate Governance Consolidated Financial Statements Tables and Explanations

Notes142
Accordingly, E.ON has replaced adjusted EBITDA with the
debt factor as a metric for the management of capital struc-
ture. The debt factor is defined as the ratio of net economic
debt to adjusted EBITDA. Net economic debt includes provi-
sions for pensions and waste disposal in addition to finan-
cial debt. E.ON has set a debt factor of 3 as its target, which
is derived from the target rating of single A flat/A2 and is
actively managed.
Based on adjusted EBITDA in 2007 of 12,450 million (2006:
11,724 million) and net economic debt of 24,138 million as
of the balance sheet date (2006: 18,233 million), the debt
factor is 1.9 (2006: 1.6).
Critical Accounting Estimates and Assumptions;Critical Judgments in the Application of AccountingPolicies The preparation of the Consolidated Financial Statements requires
management to make estimates and assumptions that may influ-
ence the application of accounting principles within the Group
and affect the valuation and presentation of reported figures.
Estimates are based on past experience and on additional knowl-
edge obtained on transactions to be reported. Actual amounts
could differ from these estimates.
The estimates and underlying assumptions are reviewed on
an ongoing basis. Adjustments to accounting estimates are
recognized in the period in which the estimate is revised if
the change affects only that period or in the period of the
revision and subsequent periods if both current and future
periods are affected.
Estimates are particularly necessary for the measurement of
the value of property, plant and equipment and of intangible
assets, especially in connection with purchase price allocations,
the recognition and measurement of deferred tax assets,
the accounting treatment of provisions for pensions and
miscellaneous provisions, as well as for impairment testing
in accordance with IAS 36.
The underlying principles used for estimates in each of the
relevant topics are outlined in the respective sections.
New Standards and InterpretationsThe International Accounting Standards Board (“IASB”) and
the IFRIC have issued standards and interpretations whose
application is not yet mandatory in the reporting period. The
application of some of these standards and interpretations is
at the present time still subject to adoption by the EU, which
remains outstanding.
IFRS 3, “Business Combinations”In January 2008, the IASB published a revised version of IFRS 3,
“Business Combinations” (“IFRS 3”), as part of its “Business
Combinations II” project. The most significant changes from
the previous version relate to the recognition and measure-
ment of assets and liabilities acquired through a business
combination, the measurement of non-controlling interests,
as well as to the calculation of goodwill and the presentation
of transactions with variable purchase prices. The revised
standard is to be applied for transactions taking place in fiscal
years beginning on or after July 1, 2009. However, the standard
has not yet been transferred by the EU into European law.
E.ON is currently evaluating the potential effects arising from
the revision of IFRS 3.
IFRS 2, “Share-based Payment”In January 2008, the IASB issued revised IFRS 2, “Share-based
Payment” (“IFRS 2”). The changes from the previous version
relate primarily to the definition of vesting conditions and to
the regulations governing the cancellation of a plan by a party
other than the entity. The amendments are to be applied for
fiscal years beginning on or after January 1, 2009. However,
the standard has not yet been transferred by the EU into
European law. Revised IFRS 2 will not have a material impact
on E.ON’s Consolidated Financial Statements.
IAS 23, “Borrowing Costs”In March 2007, the IASB issued revised IAS 23, “Borrowing
Costs” (“IAS 23”). IAS 23 eliminates the option of recognizing
borrowing costs immediately as an expense, to the extent
that they are directly attributable to the acquisition, construc-
tion or production of a qualifying asset. Capitalization of
such directly attributable borrowing costs is now mandatory.
The revised standard applies to borrowing costs relating to
qualifying assets for which the commencement date for cap-
italization is on or after January 1, 2009. However, the standard
has not yet been transferred by the EU into European law.
Revised IAS 23 has no impact for E.ON as E.ON already capi-
talizes borrowing costs as a part of the cost of acquisition or
construction.
IAS 1, “Presentation of Financial Statements”In September 2007, the IASB issued a revised version of IAS 1.
The main changes from the previous version relate to the
presentation of equity and to changes in the titles of the
financial statements. The revised standard is to be applied for

143To Our ShareholdersSupervisory Board Year in Review Combined Group Management Report Additional Information Market Units Corporate Governance Consolidated Financial Statements Tables and Explanations
fiscal years beginning on or after January 1, 2009. However,
the standard has not yet been transferred by the EU into
European law. Revised IAS 1 will not have a material impact
on E.ON’s Consolidated Financial Statements.
IAS 27, “Consolidated and Separate Financial Statements”In January 2008, the IASB published a revised version of IAS 27,
“Consolidated and Separate Financial Statements” (“IAS 27”), as
part of its “Business Combinations II” project, which contains
rules on consolidation. In particular, this standard has for the
first time dealt with transactions in which shares in a company
(subsidiary) are bought or sold without resulting in a change
of control. Additional significant changes from the previous
version relate in particular to the recognition and measure-
ment of the remaining investment in an entity after a loss of
control of what had been a subsidiary, and to the recognition
of losses attributable to minority interests. The amendments
introduced by the revised standard are to be applied for fiscal
years beginning on or after July 1, 2009. However, the standard
has not yet been transferred by the EU into European law.
E.ON is currently evaluating the potential effects arising from
the revision of IAS 27.
Amendments to IAS 32 and IAS 1, “Puttable FinancialInstruments and Obligations Arising on Liquidation”In February 2008, the IASB approved amendments to IAS 32
and IAS 1. The primary purpose of the amendments is to
address the accounting treatment for particular types of
puttable financial instruments that have characteristics simi-
lar to ordinary shares. IAS 32 previously required that such
financial instruments be classified as a financial liability. The
new version provides for reporting such instruments as equity
if the holder can require the issuer to deliver a pro rata share
of the net assets of the entity only on liquidation. The amend-
ments are to be applied for fiscal years beginning on or after
January 1, 2009. The amendments have not yet been transferred
by the EU into European law. E.ON is currently evaluating the
potential effects of the amendments to IAS 32 and IAS 1.
IFRIC 11, “IFRS 2—Group and Treasury Share Transactions”IFRIC 11, “IFRS 2—Group and Treasury Share Transactions”
(“IFRIC 11”), addresses how to apply IFRS 2 to share-based
payment arrangements in which an entity’s own equity
instruments or equity instruments of another company in
the same group are granted. IFRIC 11 requires share-based
compensation systems in which a company receives goods
or services as consideration for its own equity instruments
to be accounted for as equity-settled share-based payment
transactions. IFRIC 11 further provides guidance on how
share-based compensation systems in which a parent com-
pany’s equity instruments are granted should be accounted
for at a member of a group of companies. IFRIC 11 is to be
applied for fiscal years beginning on or after March 1, 2007.
The adoption of IFRIC 11 will not have a material impact on
E.ON’s Consolidated Financial Statements.
IFRIC 12, “Service Concession Arrangements”IFRIC 12, “Service Concession Arrangements” (“IFRIC 12”), gov-
erns accounting for arrangements in which a public-sector
institution grants contracts to private companies for the per-
formance of public services. In performing these services, the
private company uses infrastructure that remains under the
control of the public-sector institution. The private company is
responsible for the construction, operation, and maintenance
of the infrastructure. IFRIC 12 is to be applied for fiscal years
beginning on or after January 1, 2008; however, it has not yet
been transferred by the EU into European law. E.ON is currently
evaluating the potential effects of an introduction of IFRIC 12.
IFRIC 13, “Customer Loyalty Programmes”IFRIC 13, “Customer Loyalty Programmes” (“IFRIC 13”), addresses
accounting by entities that grant loyalty award credits. The
interpretation clarifies how such entities should account for
their obligations to provide free or discounted goods or serv-
ices to customers who redeem award credits. The provisions
of IFRIC 13 are to be applied for fiscal years beginning on or
after July 1, 2008. However, the interpretation has not yet
been transferred by the EU into European law. The adoption
of IFRIC 13 will not have a material impact on E.ON’s Consoli-
dated Financial Statements.
IFRIC 14, “IAS 19—The Limit on a Defined BenefitAsset, Minimum Funding Requirements and TheirInteraction”IFRIC 14, “IAS 19—The Limit on a Defined Benefit Asset, Mini-
mum Funding Requirements and Their Interaction” (“IFRIC 14”),
provides general guidance on how to assess the limit in IAS 19
on the amount of the surplus that can be recognized as an
asset. The interpretation also explains how the pension
asset or liability for defined benefit plans may be affected
when there is a statutory or contractual minimum funding
requirement. Under IFRIC 14 no additional liability needs to
be recognized by the employer unless the contributions that
are payable under the minimum funding requirement cannot
be returned to the Company. The interpretation is mandatory
for fiscal years beginning on or after January 1, 2008; however,
it has not yet been transferred by the EU into European law.
The adoption of IFRIC 14 will not have a material impact on
E.ON’s Consolidated Financial Statements.

Notes144
(4) Acquisitions, Disposals and Discontinued Operations
Acquisitions in 2007
OGK-4On October 12, 2007, E.ON acquired from the Russian govern-
ment’s energy holding company RAO UES a majority stake in
the Russian power-plant company OAO OGK-4 (“OGK-4”), Surgut,
Tyumenskaya Oblast, Russian Federation. After the acquisi-
tion of additional smaller tranches following the purchase of
the majority stake, E.ON holds 72.7 percent of OGK-4 as of
the balance sheet date. The total expense incurred for this
acquisition, which includes a contractually agreed capital
increase of 1.3 billion to finance the investment program
planned for the coming years, was approximately 4.4 billion.
Under Russian capital-markets legislation, E.ON was required
to make a public offer to purchase the remainder of the
shares held by the minority shareholders of OGK-4, and this
offer, at a price of 3.3503 rubles per share, was made public
on November 15, 2007. The acceptance period ended on
February 4, 2008. E.ON was thus able to acquire additional
shares equivalent to approximately 3.4 percent of OGK-4 and
increase its total ownership stake to approximately 76.1 per-
cent. As was expected, RAO UES did not accept the offer for
its 22.5 percent stake in OGK-4.
OGK-4 operates conventional power plants at five locations
with a total installed output of 8.6 gigawatts (GW) and plans
to build additional power plants with a capacity of about
2.4 GW at the existing locations by 2011.
The initial recognition of the company in the E.ON Consoli-
dated Financial Statements took place in the fourth quarter
of 2007.
The E.ON Consolidated Financial Statements included revenues
of 248 million and earnings of 3 million (after write-down
of fair value adjustments from the purchase price allocation)
attributable to OGK-4 for the period from October 1 through
December 31, 2007. OGK-4’s revenues and earnings for the full
year amounted to 898 million and 29 million, respectively.
(3) Scope of Consolidation
The number of consolidated companies changed as follows
during the reporting year:
In 2007, a total of 107 domestic and 78 foreign associated
companies were accounted for under the equity method
(2006: 108 domestic and 60 foreign).
See Note 4 for additional information on acquisitions, dis-
posals and discontinued operations.
Total
508
33
40
501
123
33
591
Consolidated companies as of January 1, 2006
Additions
Disposals/Mergers
Consolidated companies as of December 31, 2006
Additions
Disposals/Mergers
Consolidated companies as of December 31, 2007
Domestic
129
15
5
139
23
9
153
Foreign
379
18
35
362
100
24
438
Scope of Consolidation

145To Our ShareholdersSupervisory Board Year in Review Combined Group Management Report Additional Information Market Units Corporate Governance Consolidated Financial Statements Tables and Explanations
The purchase price allocation for OGK-4 was not final as of
December 31, 2007, because effects on property, plant and
equipment and also from potential obligations, in particular,
remain to be evaluated.
in millions
Intangible assets
Property, plant and equipment
Other assets
Total assets
Non-current liabilities
Current liabilities
Total equity and liabilities
Net assetsAttributable to shareholders of E.ON AGAttributable to minority interests
Total acquisition costs
Goodwill (preliminary)
IFRS carryingamounts before
initial recognition
11
738
1,497
2,246
210
124
334
1,9121,390
522
Purchase priceallocation
–
2,212
5
2,217
529
–
529
1,688–1,390
461
4,350
1,733
Carrying amountsat initial
recognition
11
2,950
1,502
4,463
739
124
863
3,600–
983
1,733
Major Balance Sheet Line Items—OGK-4
ENERGI E2 Renovables IbéricasOn August 13, 2007, E.ON Climate & Renewables GmbH acquired
a 100-percent stake in ENERGI E2 Renovables Ibéricas S.L.U.
(“E2-I”), Madrid, Spain. The purchase price totaled roughly
481 million. E2-I and its affiliated companies were fully con-
solidated as of August 31, 2007. Through its affiliated and
associated companies, E2-I primarily operates wind farms in
Spain and Portugal with an installed generating capacity of
260 megawatts (MW). A more extensive development project
pipeline is in place for the coming years. The purchase price
allocation is still preliminary as a definitive clarification of
certain technical issues remains outstanding.
The E.ON Consolidated Financial Statements included revenues
of 5 million and a loss of 1 million (after write-down of fair-
value adjustments from the purchase price allocation) attrib-
utable to E2-I for the period from September 1 through Decem-
ber 31, 2007. E2-I’s revenues and earnings for the full year
amounted to roughly 15 million and 4 million, respectively.

146 Notes
Disposals and Discontinued Operations in 2007
ONEE.ON and its partners Telenor and Tele Danmark had signed
a contract in June 2007 to sell their shares in the Austrian
telecommunications company ONE GmbH (“ONE”), Vienna,
Austria, to a consortium of bidders consisting of France Télé-
com and the financial investor Mid Europa Partners. The
transfer of E.ON’s 50.1-percent stake became effective on
October 2, 2007. In the fourth quarter of 2007, E.ON realized
cash proceeds of 569 million from the sale, including the
consideration for the shareholder loans granted, as well as a
disposal gain of 321 million.
RAGOn August 7, 2007, E.ON, ThyssenKrupp and RWE came to an
agreement with the foundation “RAG-Stiftung” to sell their
shares of RAG AG (“RAG”), Essen, Germany, to that foundation.
The three shareholding companies held a total of 90 percent
of the share capital of RAG. The block of E.ON shares was
transferred on November 30, 2007, for a price of 1.
The following were the effects arising from discontinued
operations:
WKEThrough Western Kentucky Energy Corp. (“WKE”), Henderson,
Kentucky, U.S., E.ON U.S. has a 25-year lease on and operates
the generating facilities of Big Rivers Electric Corporation
(“BREC”), a power generation cooperative in western Kentucky,
and a coal-fired facility owned by the city of Henderson, Ken-
tucky, U.S.
In March 2007, E.ON U.S. entered into a termination agreement
with BREC to terminate the lease and the operational agree-
ments for nine coal-fired and one oil-fired electricity generation
units in western Kentucky, which were all held through its
wholly-owned company WKE and its subsidiaries.
The closing of the agreement is subject to a number of con-
ditions, including review and approval by various regulatory
agencies and acquisition of certain consents by other inter-
ested parties. Subject to such contingencies, the parties
are working on completing the termination transaction by
mid-2008. WKE therefore continued to be classified as a
discontinued operation.
AirtricityOn December 18, 2007, E.ON North America Holdings LLC
acquired all the shares of Airtricity Inc., Chicago, Illinois, U.S.,
and all the shares of Airtricity Holdings (Canada) Ltd., Toronto,
Ontario, Canada, for a purchase price of approximately
580 million. Airtricity operates a number of wind farms in
the U.S. states of Texas and New York with a total installed
output of around 250 MW. Additional wind farms with greatly
in millions
Intangible assets and acquired goodwill
Property, plant and equipment
Other assets
Total assets
Non-current liabilities
Current liabilities
Total equity and liabilities
Net assetsAttributable to shareholders of E.ON AGAttributable to minority interests
Total acquisition costs
Goodwill (preliminary)
IFRS carryingamounts before
initial recognition
74
934
202
1,210
335
828
1,163
4743
4
Purchase priceallocation
231
31
218
480
143
5
148
332–4332
1,061
718
Carrying amountsat initial
recognition
305
965
420
1,690
478
833
1,311
379–
36
718
Major Balance Sheet Line Items—E.ON Climate & Renewables (E2-I and Airtricity)
enhanced generating capacity are to be completed by the
end of 2008. As the timing of this consolidation is so close
to the preparation of the Consolidated Financial Statements,
the entire difference between the purchase price and Air-
tricity’s equity is being carried provisionally as goodwill.
For the full year, Airtricity generated revenues of roughly
9 million and a loss of approximately 44 million.

147To Our ShareholdersSupervisory Board Year in Review Combined Group Management Report Additional Information Market Units Corporate Governance Consolidated Financial Statements Tables and Explanations
The tables below provide selected financial information from
the discontinued WKE operations in the U.S. Midwest segment
for the periods indicated:
In addition, there were other gains from discontinued opera-
tions recognized in 2007. These relate to 418 million in inter-
company gains from the sale of tranches of Degussa shares
to RAG from previous years and arose from the transfer to
RAG-Stiftung on November 30, 2007, of E.ON’s shareholding
in RAG. Moreover, there were 6 million in gains from the dis-
continued operations of the Company’s former Viterra seg-
ment, which had already been disposed of in 2005, as well as
a loss of 13 million from the sale of the former Oil segment.
Acquisitions in 2006
JČP/DDGázIn the course of portfolio adjustments undertaken in the Czech
Republic and Hungary, minority shareholdings in various com-
panies were sold. In exchange, E.ON acquired, in addition to
two other minority shareholdings, a further 46.7 percent of the
company Jihočeská plynárenská, a.s. (“JČP”), České Budějovice,
Czech Republic, in which E.ON previously held a 13.1 percent
share. This company was fully consolidated as of September 1,
2006. An additional 39.2 percent interest was acquired in a
separate transaction, which also took place in September. E.ON
thus held 99.0 percent of JČP. The remaining stake in JČP was
purchased in 2007.
As part of the portfolio adjustment, an additional 49.9 percent
interest was acquired in the fully consolidated company
Dél-dunántúli Gázszolgáltató ZRt. (“DDGáz”), Pécs, Hungary, in
which E.ON previously held 50.02 percent interest. As a result
E.ON held 99.9 percent of DDGáz.
The exchange transaction resulted in total acquisition costs of
104 million, taking into account a total cash component of
30 million. The gains on the disposal of the minority interests
totaled 31 million.
E.ON Földgáz Storage/E.ON Földgáz TradeAs of March 31, 2006, E.ON Ruhrgas had acquired a 100 percent
interest in the gas trading and storage business of the Hun-
garian oil and gas company MOL through the acquisition of
interests in MOL Földgázellátó ZRt. (now E.ON Földgáz Stor-
age) and MOL Földgáztároló ZRt. (now E.ON Földgáz Trade),
both of Budapest, Hungary. The purchase price was approxi-
mately 400 million. It had been agreed that, contingent on
regulatory developments in Hungary, compensatory payments
may be required until the end of 2009. The companies were
fully consolidated as of March 31, 2006. As of December 31,
2006, the purchase price allocation resulted in preliminary
goodwill of 119 million, which in 2007 was adjusted by
9 million to 110 million.
Disposals and Discontinued Operations in 2006
The following were reported as discontinued operations in
2006: E.ON Finland, Espoo, Finland, (“E.ON Finland”) in the Nordic
market unit, the operations of WKE in the U.S. Midwest market
unit, and Degussa. In addition, E.ON recorded a gain of approx-
imately 54 million (net of tax: 53 million) in 2006 from a pur-
chase price adjustment on the disposal of Viterra.
E.ON FinlandOn June 26, 2006, E.ON Nordic and the Finnish energy group
Fortum Power and Heat Oy (“Fortum”) finalized the transfer
to Fortum of all of E.ON Nordic’s shares in E.ON Finland pur-
suant to an agreement signed on February 2, 2006. The pur-
chase price for the 65.56 percent stake totaled approximately
390 million. E.ON Finland was classified as a discontinued
operation in mid-January 2006.
2006
227
–129
98
–34
64
2007
204
–338
–134
53
–81
in millions
Sales
Other income/(expenses), net
Income from continuing operations beforeincome taxes and minority interests
Income taxes
Income from discontinued operations
Selected Financial Information—WKE(Summary)
2006
215
396
611
615
January 1
2006
211
471
682
836
2007
202
362
564
613
December 31
in millions
Property, plant and equipment
Other assets
Total assets
Total liabilities
Major Balance Sheet Line Items—WKE(Summary)

148 Notes
(6) Own Work Capitalized
Own work capitalized amounted to 517 million in 2007 (2006:
395 million) and resulted primarily from engineering services
rendered in connection with new construction projects.
The table below provides selected financial information
from the discontinued operations of the Nordic segment for
the periods indicated:
DegussaIn December 2005, E.ON and RAG signed a framework agree-
ment on the sale of E.ON’s 42.9 percent stake in Degussa to
RAG. As part of the implementation of that framework agree-
ment, E.ON transferred its stake in Degussa into RAG Projekt-
gesellschaft mbH, Essen, Germany on March 21, 2006. E.ON’s
stake in this entity was forward sold to RAG on the same
date. On July 3, 2006, E.ON and RAG executed the forward sales
agreement for E.ON’s stake in RAG Projektgesellschaft mbH.
Thus E.ON has sold its entire remaining, indirectly held stake
in Degussa.
(5) Revenues
Revenues are generally recognized upon delivery of products
to customers or upon fulfillment of services. Delivery is con-
sidered to have occurred when the risks and rewards associ-
ated with ownership have been transferred to the buyer,
compensation has been contractually established and collec-
tion of the resulting receivable is probable.
Revenues are generated primarily from the sale of electricity
and gas to industrial and commercial customers and to retail
customers. Additional revenue is earned from the distribu-
tion of gas and electricity and deliveries of steam and heat.
Revenues from the sale of electricity and gas to industrial
and commercial customers and to retail customers are rec-
ognized when earned on the basis of a contractual arrange-
ment with the customer; they reflect the value of the vol-
ume supplied, including an estimated value of the volume
supplied to customers between the date of their last meter
reading and period-end.
The classification of revenues by segment is presented in
Note 33.
RAG paid E.ON the roughly 2.8 billion purchase price on
August 31, 2006. The transaction initially resulted in a gain of
981 million, which subsequently had to be adjusted for the
intercompany gain attributable to E.ON’s minority ownership
interest in RAG (39.2 percent). An initial gain of 596 million
was thus realized from the transfer and the subsequent sale.
As the interest in Degussa qualified as a discontinued opera-
tion under IFRS 5, “Non-current Assets Held for Sale and Dis-
continued Operations” (“IFRS 5”), until its disposal, this gain,
together with the effect of the equity-method measurement
of Degussa in the first quarter of 2006 of 37 million was
reported as income from discontinued operations in E.ON’s
Consolidated Financial Statements. In total, income of 633
million was recognized for Degussa.
Intercompany gains arising from the sale of tranches of
Degussa shares to RAG totaled 418 million as of Decem-
ber 31, 2006.
2006
131
11
–115
27
–7
20
in millions
Sales
Gain on disposal, net
Other income/(expenses), net
Income from continuing operations before incometaxes and minority interests
Income taxes
Income from discontinued operations
Selected Financial Information— E.ON Finland (Summary)

149To Our ShareholdersSupervisory Board Year in Review Combined Group Management Report Additional Information Market Units Corporate Governance Consolidated Financial Statements Tables and Explanations
(7) Other Operating Income and Expenses
The table below provides details of other operating income
for the periods indicated:
Realized gains from currency derivatives and the effects of
positive exchange rate differences recognized in income are
reported as income from exchange rate differences.
Gains on derivative financial instruments include the gains
recognized as a result of the required marking to market
and realized gains from derivatives under IAS 39, except for
the income effects from interest rate derivatives.
Gains on the disposal of investments included proceeds from
the sale of ONE in the amount of 321 million. The line item
further included gains realized on the sale of securities in the
amount of 1,128 million (2006: 613 million). In 2006, this
line item also included gains from the disposal of institutional
securities funds as part of the transfer to the Contractual
Trust Arrangement (“CTA”) in the amount of 159 million
(see also Note 24).
(8) Cost of Materials
The principal components of expenses for raw materials and
supplies and for purchased goods are the purchase of gas and
electricity and of fuels for electricity generation, as well as the
nuclear segment. Expenses for purchased services consist pri-
marily of maintenance costs. Network usage charges are also
included in the cost of materials.
in millions
Expenses for raw materials and suppliesand for purchased goods
Expenses for purchased services
Total
2007
47,667
2,556
50,223
2006
44,171
2,537
46,708
Cost of Materials
in millions
Income from exchange rate differences
Gain on derivative financialinstruments
Gain on disposal of investments
Other trade income
Miscellaneous
Total
2007
3,284
1,767
1,588
232
905
7,776
2006
4,439
1,087
981
169
1,238
7,914
Other Operating Income
Miscellaneous other operating income in 2007 consisted pri-
marily of reductions of valuation allowances on accounts
receivable, rental and leasing income, the sale of scrap metal
and materials, as well as compensation payments received
for damages.
The following table provides details of other operating
expenses for the periods indicated:
Realized losses from currency derivatives and the effects
of negative exchange rate differences recognized in income
are reported as losses from exchange rate differences.
Losses on derivative financial instruments include losses rec-
ognized as a result of the required marking to market and
realized losses from derivatives under IAS 39, except for the
income effects from interest rate derivatives.
Miscellaneous other operating expenses in 2007 consisted pri-
marily of concession payments in the amount of 471 million
(2006: 512 million), expenses for external audit and non-
audit services and consulting in the amount of 414 million
(2006: 263 million), advertising and marketing expenses in
the amount of 360 million (2006: 281 million), as well as
write-downs of receivables in the amount of 333 million
(2006: 293 million). Additionally reported in this item are
services rendered by third parties, IT expenditures and insur-
ance premiums.
in millions
Loss from exchange rate differences
Loss on derivative financial instruments
Taxes other than income taxes
Loss on disposal of investments
Miscellaneous
Total
2007
3,218
1,331
216
138
4,821
9,724
2006
4,447
3,052
190
125
4,093
11,907
Other Operating Expenses

150 Notes
(9) Financial Results
The following table provides details of financial results for
the periods indicated:
Reduced impairments of minority shareholdings and lower
interest expenses led to a significant improvement in finan-
cial results for 2007 as compared with the previous year.
A total of 140 million in impairment charges that arose in
connection with changes in network regulation on minority
interests in Germany were recognized in 2006 as impairments
of other financial assets.
Net interest and similar expenses improved in 2007 primarily
as a result of an increase in expected returns on plan assets
determined in connection with the measurement of the pro-
visions for pensions and similar obligations.
Other interest income consists mostly of the income from
lease receivables (finance leases). Other interest expense
includes accretion of provisions for asset retirement obliga-
tions in the amount of 708 million (2006: 713 million).
Also included in this item is the interest expense from pro-
visions for pensions—net of the expected return on plan
assets—in the amount of 79 million (2006: 242 million).
The accretion of liabilities in connection with put options
resulted in an expense of 22 million (2006: 102 million)
pursuant to IAS 32.
Interest expense was reduced by capitalized interest on debt
totaling 62 million (2006: 27 million).
Realized gains and losses from interest rate swaps are
shown net.
in millions
Income from companies in which equity investments are held
Impairment of other financial assets
Income from equity investments
Available for sale
Loans and receivables
Held for trading
Other interest income
Income from securities, interest and similar income
Amortized cost
Held for trading
Other interest expenses
Interest and similar expenses
Net interest income
Financial results
2007
215
–36
179
207
696
51
81
1,035
–929
–78
–979
–1,986
–951
–772
2006
209
–159
50
216
779
53
121
1,169
–988
–142
–1,084
–2,214
–1,045
–995
Financial Results
The measurement categories are described in detail in Note 2.

151To Our ShareholdersSupervisory Board Year in Review Combined Group Management Report Additional Information Market Units Corporate Governance Consolidated Financial Statements Tables and Explanations
(10) Income Taxes
The following table provides details of income taxes, includ-
ing deferred taxes, for the periods indicated:
in millions
Current taxes
Domestic corporate income tax
Domestic trade tax
Foreign income taxes
Other income taxes
Total
Deferred taxes
Domestic
Foreign
Total
Total Income Taxes
2007
931
735
648
10
2,324
–149
114
–35
2,289
2006
–407
354
553
5
505
–61
–404
–465
40
Income Taxes
2001. The change de-links the corporate tax credit from distri-
butions of dividends. Instead, after December 31, 2006, an un-
conditional claim for payment of the credit in ten equal annual
installments from 2008 through 2017 has been established.
While the recognition of the discounted credits resulted in
tax income of 1,279 million in 2006, the change in corporate
tax credits resulted in tax income of 75 million in 2007.
With the entry into force on December 29, 2007, of the Annual
Tax Act of 2008 in Germany, those currently untaxed income
components that until then had been recognized in a type of
equity called “EK 02” now have to be declared retrospectively
irrespective of distributions. Taxes on this income must be
paid in up to ten equal annual installments, with the first
payment due on September 30, 2008. This so-called corporate
income tax surcharge is equal to 3 percent of the EK 02 cal-
culated as of December 31, 2006. This produces a gross amount
of 88 million. A one-time payment option is also available.
Assuming a scheduled payment on September 30, 2008, the
tax expense for 2007 is 70 million.
No deferred tax liabilities were recognized in 2006 for the dif-
ferences between net assets and the tax bases of subsidiaries
and associated companies (the so-called “outside basis dif-
ferences”). As of December 31, 2007, deferred tax liabilities
amounted to 7 million. Deferred tax liabilities were not rec-
ognized for subsidiaries and associated companies to the
extent that the Company can control the reversal effect and
insofar as it is probable that temporary differences will not
be reversed in the foreseeable future. No deferred tax liabili-
ties were recognized for temporary differences of 1,646 mil-
lion (2006: 1,335 million) at subsidiaries and associated
companies, as E.ON is able to control the timing of their
reversal and the temporary difference will not reverse in the
foreseeable future.
Changes in tax rates in the United Kingdom, the Czech Republic
and a number of other countries resulted in deferred tax
income of 118 million. In 2006, changes in foreign tax rates
produced total deferred tax income of 21 million.
The increase in tax expense of 2,249 million compared with
2006 primarily reflects the special effect of first-time capital-
ization of discounted corporate tax credits which in 2006
had produced tax income of 1,279 million. The remainder of
the increase is attributable to increased earnings.
The Corporate Tax Reform Act of 2008, which took effect on
August 18, 2007, provides for extensive tax changes in Germany.
In particular, the corporate income tax rate is cut from 25 per-
cent in 2007 to 15 percent in 2008, while the average domestic
trade tax rises from 13 percent in 2007 to 14 percent in 2008.
The solidarity surcharge remains unchanged at 5.5 percent
of the corporate income tax rate. The change in the overall tax
rate from the previous rate of 39 percent to 30 percent neces-
sitates a revaluation of all domestic deferred tax assets and
deferred tax liabilities as of December 31, 2007. This revalua-
tion in 2007 produced non-cash deferred tax income in the
amount of 59 million.
German legislation providing for fiscal measures to accompany
the introduction of the European Company and amending
other fiscal provisions (“SE-Steuergesetz” or “SEStEG”), which
came into effect on December 13, 2006, altered the regulations
on corporate tax credits arising from the corporate imputation
system (“Anrechnungsverfahren”), which had existed until

152 Notes
Deferred tax assets and liabilities as of December 31, 2007,
and December 31, 2006, break down as shown in the follow-
ing table:
As discussed in Note 4, the corporate income taxes relating to
discontinued operations are reported in E.ON’s Consolidated
Statement of Income under “Income/Loss from discontinued
operations, net,” and break down as follows:
Income from continuing operations before income taxes and
minority interests was attributable to the following geographic
locations in the periods indicated:
The differences between the 2007 base income tax rate of
39 percent (2006: 39 percent) applicable in Germany and the
effective tax rate are reconciled as follows:
1Income from capitalization of corporate tax credits in 2006: –1,279 million.
%
39.0
–1.4
–1.3
–0.4
–9.2
–4.2
–21.7
0.8
2006
Expected corporate income tax
Credit for dividend distributions
Foreign tax rate differentials
Changes in tax rate/tax law
Tax effects on tax-free income
Tax effects on equity accounting
Other1
Effective income taxes/tax rate
%
39.0
–0.8
–4.2
–1.8
–8.2
–3.6
3.2
23.6
in millions
3,776
–75
–405
–177
–790
–353
313
2,289
in millions
2,085
–76
–71
–21
–491
–227
–1,159
40
Reconciliation to Effective Income Taxes/Tax Rate
2007
in millions
WKE
E.ON Finland
Viterra
Total
2007
–53
–
–
–53
2006
34
7
1
42
Income Taxes from Discontinued Operations
in millions
Domestic
Foreign
Total
2007
5,500
4,183
9,683
2006
3,463
1,884
5,347
Income from Continuing Operations before Income Taxes and Minority Interests
in millions
Intangible assets
Property, plant and equipment
Financial assets
Inventories
Receivables
Provisions
Liabilities
Net operating loss carryforwards
Tax credits
Other
Subtotal
Valuation allowance
Deferred tax assets
Intangible assets
Property, plant and equipment
Financial assets
Inventories
Receivables
Provisions
Liabilities
Other
Deferred tax liabilities
Net deferred tax assets/liabilities (–)
2007
73
608
138
9
70
3,107
2,070
452
81
163
6,771
–212
6,559
1,033
6,501
1,727
176
1,946
443
253
880
12,959
–6,400
2006
62
647
209
12
397
4,209
2,418
613
38
187
8,792
–435
8,357
1,101
6,547
1,977
246
2,076
502
178
1,546
14,173
–5,816
December 31
Deferred Tax Assets and Liabilities

153To Our ShareholdersSupervisory Board Year in Review Combined Group Management Report Additional Information Market Units Corporate Governance Consolidated Financial Statements Tables and Explanations
Of the deferred taxes reported, a total of €2,246 million was
charged directly to equity in 2007 (2006: €2,223 million).
Net deferred taxes break down as follows based on the
timing of their reversal:
In the acquisition of OGK-4, the purchase price allocation
resulted in deferred tax liabilities of 529 million as of Decem-
ber 31, 2007. The purchase price alloation for E2-I resulted in
deferred tax liabilities of 148 million as of December 31, 2007.
The purchase price allocations of other acquisitions resulted
in the recognition on December 31, 2007, of a total of 19 mil-
lion in deferred tax liabilities.
The acquisitions of DDGáz, E.ON Földgáz Trade, E.ON Földgáz
Storage, Somet and E.ON Värme resulted in the recognition
on December 31, 2006, of a total of 6 million in deferred tax
assets and 27 million in deferred tax liabilities.
The tax loss carryforwards as of the dates indicated are as
follows:
Since January 1, 2004, domestic tax loss carryforwards can
only be offset against up to 60 percent of taxable income,
subject to a full offset against the first 1 million. This mini-
mum corporate taxation also applies to trade tax loss carry-
forwards.
Of the tax credits for which no deferred taxes have been
recognized, 12 million expire after 2012.
in millions
Domestic tax loss carryforwards
Foreign tax loss carryforwards
Total
2007
1,646
739
2,385
2006
2,016
956
2,972
Tax Loss Carryforwards
December 31
non-current
1,428
–424
1,004
–6,495
–5,491
current
254
–11
243
–568
–325
December 31, 2006
non-current
1,069
–208
861
–6,843
–5,982
current
298
–4
294
–712
–418
December 31, 2007
Net Deferred Tax Assets and Liabilities
in millions
Deferred tax assets
Changes in value
Net deferred tax assets
Deferred tax liabilities
Net deferred tax assets/liabilities (–)

Notes154
Share-Based Payment
Members of the Board of Management of E.ON AG and cer-
tain executives of E.ON AG and of the market units receive
share-based payment as part of their long-term variable com-
pensation. Share-based payment can only be granted if the
qualified executive owns a certain minimum number of shares
of E.ON stock, which must be held until maturity or full exer-
cise. The purpose of such compensation is to reward their
contribution to E.ON’s growth and to further the long-term
success of the Company. This variable compensation compo-
nent, comprising a long-term incentive effect along with a
certain element of risk, provides for a sensible linking of the
interests of shareholders and management.
The following discussion includes a report on the E.ON AG
Stock Appreciation Rights plan, which ended in 2005, and on
the E.ON Share Performance Plan, newly introduced in 2006.
Stock Appreciation Rights of E.ON AG
From 1999 up to and including 2005, E.ON annually granted
virtual stock options (“Stock Appreciation Rights” or “SAR”)
through the E.ON AG Stock Appreciation Rights program. The
third tranche of SAR was exercised in full in 2007. SAR from
the fourth through seventh tranches may still be exercised
after the end of the program, in accordance with the SAR
terms and conditions.
In 2007, E.ON purchased on the market a total of 373,905 of
its own shares (0.05 percent of the shares of E.ON AG) for
resale to employees as part of the employee stock purchase
program at an average purchase price of 121.10 per share
(in 2006, treasury share usage: 443,290 shares; 0.06 percent).
These shares were sold to employees at preferential prices
between 45.20 and 104.64 (2006: between 38.37 and
74.77). The costs arising from the granting of these prefer-
ential prices were charged to personnel costs as “wages and
salaries.” Further information about the changes in the number
of its own shares held by E.ON AG can be found in Note 19.
Since the 2003 fiscal year, employees in the U.K. have the
opportunity to purchase E.ON shares through an employee
stock purchase program and to acquire additional bonus
shares. The cost of issuing these bonus shares is also recorded
under personnel costs as part of “Wages and salaries.”
(11) Personnel-Related Information
Personnel Costs
The following table provides details of personnel costs for
the periods indicated:
Date of issuance
Term
Blackout period
Price at issuance1
Level of the Dow Jones STOXX Utilities Index (Price EUR)
Number of participants in year of issuance
Number of SAR issued
Exercise hurdle (minimum percentage by which exercise priceexceeds the price at issuance)
Exercise hurdle (minimum exercise price)1
Maximum exercise gain
3rd tranche
Jan. 2, 2001
7 years
2 years
58.70
300.18
231
1.8 m
20%
70.44
–
4th tranche
Jan. 2, 2002
7 years
2 years
50.70
262.44
186
1.7 m
10%
55.77
–
5th tranche
Jan. 2, 2003
7 years
2 years
37.86
202.14
344
2.6 m
10%
41.65
–
6th tranche
Jan. 2, 2004
7 years
2 years
44.80
211.58
357
2.7 m
10%
49.28
49.05
7th tranche
Jan. 3, 2005
7 years
2 years
61.10
268.66
357
2.9 m
10%
67.21
65.35
Stock Appreciation Rights of E.ON AG
1Adjusted for special dividend distribution in 2006.
in millions
Wages and salaries
Social security contributions
Pension costs and other employeebenefits
Pension costs
Total
2007
3,692
556
349327
4,597
2006
3,553
580
396377
4,529
Personnel Costs

155To Our ShareholdersSupervisory Board Year in Review Combined Group Management Report Additional Information Market Units Corporate Governance Consolidated Financial Statements Tables and Explanations
SAR can be exercised by eligible executives following the
blackout period within preset exercise windows, provided
that the exercise thresholds have been crossed.
The amount paid to executives when they exercise their SAR
is paid out in cash, and is equal to the difference between
the E.ON AG share price at the time of exercise and the under-
lying share price at issuance multiplied by the number of
SAR exercised. Beginning with the sixth tranche, a cap on
gains on SAR equal to 100 percent of the underlying price at
the time of issuance was put in place in order to limit the
effect of unforeseen extraordinary increases in the underly-
ing share price. This cap on gains took effect for the first
time in the 2006 fiscal year.
In accordance with IFRS 2 measurement criteria, the SAR
were measured by reference to the fair value of the rights as
of December 31, 2007.
A recognized option pricing model is used for measuring the
value of these options. This option pricing model simulates a
large number of different possible developments of the E.ON
share price and the benchmark Dow Jones STOXX Utilities
Index (Price EUR) (Monte Carlo simulation).
A certain exercise behavior is assumed when determining
fair value. Individual exercise rates are defined for each of
the tranches, depending on the price performance of the
E.ON share. Historical volatility and correlations of the E.ON
share price and of the benchmark index that reflect remain-
ing maturities are used in the calculations. The risk-free inter-
est rate used for reference is the zero swap rate for the cor-
responding remaining maturity. The dividend yields of the
E.ON share (2.30 percent) and of the benchmark index
(3.18 percent) are also included in the pricing model. The
dividend yield used for the E.ON share in the calculations is
based on the ratio of the most recent dividend distributed
and the share price on the valuation date. Accordingly, as of
the balance sheet date, this yield corresponds approximately
to the anticipated future dividend yield. The average of the
Xetra closing prices for E.ON AG shares was 118.08 in 2007.
The Xetra closing price for E.ON AG shares at year-end was
145.59. The Dow Jones STOXX Utilities Index (Price EUR)
closed at 549.75 points.
The following overview contains additional parameters used
for measurement:
2,902,786 SAR from tranches three through seven were exer-
cised on an ordinary basis in 2007. In addition, 100,349 SAR
from tranches three, four, five, and seven were exercised in
accordance with the SAR terms and conditions on an extra-
ordinary basis. The total gain to the holders on exercise
amounted to 163.2 million (2006: 134.4 million). 7,000 SAR
from tranche three expired during 2007.
Intrinsic value as of December 31, 2007
Fair value as of December 31, 2007
Swap rate
Volatility of the E.ON share
Volatility of the Dow Jones STOXX Utilities Index (Price EUR)
Correlation between the E.ON share price and the Dow Jones STOXX UtilitiesIndex (Price EUR)
4th tranche
94.89
93.81
4.55%
21.97%
13.78%
0.7845
5th tranche
107.73
104.39
4.45%
24.44%
14.54%
0.7492
6th tranche
€49.05
€48.64
4.42%
25.47%
14.78%
0.7191
7th tranche
65.35
64.09
4.43%
25.61%
14.74%
0.7015
SAR Program of E.ON AG—Measurement Parameters of the Option Pricing Model

Notes156
At the end of its three-year term, each Performance Right
is entitled to a cash payout linked to the final E.ON share
price established at that time. The amount of the payout is
also linked to the relative performance of the E.ON share
price in comparison with the benchmark index Dow Jones
STOXX Utilities Index (Total Return EUR). The amount paid
out is equal to the target value of this compensation compo-
nent if the E.ON share price at the end of the term is equal
to the initial price at the beginning of the term and the per-
formance matches that of the benchmark. The maximum
amount to be paid out to each participant per Performance
Right is limited to three times the original target value on
the grant date.
60-day average prices are used to determine the initial price,
the final price and the relative performance, in order to miti-
gate the effects of incidental, short-lived price movements.
The calculation of the amount to be paid out takes place at
the same time for all plan participants with effect on the last
day of the term of the tranche. If the performance of the
E.ON share matches that of the index, the amount paid out
is not adjusted; the final share price is paid out. However, if
the E.ON share outperforms the index, the amount paid out
is increased proportionally. If, on the other hand, the E.ON
share underperforms the index, disproportionate deductions
are made. In the case of underperformance by 20 percent or
more, no payment at all takes place.
The SAR of tranches four through seven were exercisable on
December 31, 2007.
E.ON Share Performance Plan
In 2007, virtual shares (“Performance Rights”) from the second
tranche of the E.ON Share Performance Plan were granted.
For the first time, certain members of senior management
were also granted Performance Rights alongside top man-
agement.
SAR outstanding as of December 31, 2005
SAR granted in 2006
SAR exercised in 2006
SAR expired in 2006
SAR outstanding as of December 31, 2006
SAR granted in 2007
SAR exercised in 2007
SAR expired in 2007
SAR outstanding as of December 31, 2007
Gains on exercise in 2007
Provision as of December 31, 2007
Expense in 2007
3rd tranche
158,750
–
85,750
–
73,000
–
66,000
7,000
–
4.6 m
0.0 m
1.4 m
4th tranche
238,909
–
169,742
–
69,167
–
42,333
–
26,834
2.8 m
2.5 m
2.0 m
5th tranche
613,711
–
346,358
2,423
264,930
–
113,379
–
151,551
9.2 m
15.8 m
8.7 m
6th tranche
2,417,995
–
2,349,731
13,717
54,547
–
26,547
–
28,000
1.3 m
1.4 m
0.1 m
7th tranche
2,885,428
–
49,511
26,041
2,809,876
–
2,754,876
–
55,000
145.3 m
3.5 m
31.2 m
Changes in the E.ON AG SAR Program
The provision for the SAR program was 23.2 million as of
the balance sheet date (2006: 143.1 million). The expense
for the 2007 fiscal year amounted to 43.4 million (2006:
113.0 million).
The number of SAR, provisions for and expenses arising from
the E.ON SAR program have changed as shown in the fol-
lowing table:
Date of issuance
Term
Target value at issuance
Number of participants in year ofissuance
Number of Performance Rights issued
Maximum amount paid
1st tranche
Jan. 1, 2006
3 years
79,22
396
458,641
237.66
2nd tranche
Jan. 1, 2007
3 years
96.52
501
395,025
289.56
E.ON Share Performance Rights

157To Our ShareholdersSupervisory Board Year in Review Combined Group Management Report Additional Information Market Units Corporate Governance Consolidated Financial Statements Tables and Explanations
395,025 second-tranche Performance Rights were granted in
2007. In 2007, the cash amount from 15,500 of the first and
second tranches of Performance Rights was paid out on an
extraordinary basis in accordance with the terms and condi-
tions of the plan. Total payments amounted to 1.6 million
(2006: 0.1 million). 4,349 first- and second-tranche Perfor-
mance Rights expired in the 2007 fiscal year. Provisions for
the plan totaled 67.8 million at year-end (2006: 8.9 mil-
lion). Each provision is prorated for the respective period
The plan contains adjustment mechanisms to eliminate the
effect of events such as interim corporate actions. Accord-
ingly, to compensate for the economic effects of the special
dividend payment of May 5, 2006, capital adjustment factors
were established for the first tranche.
The fair value is determined for the Performance Rights in
accordance with IFRS 2 using a recognized option pricing
model. Similar to the option pricing model used for the SAR
program, this model involves the simulation of a large num-
ber of different possible development tracks for the E.ON
share price (taking into account the effects of reinvested
dividends and capital adjustment factors) and the bench-
mark index (Monte Carlo simulation). However, unlike the
SAR program, the benchmark for this plan is the Dow Jones
STOXX Utilities Index (Total Return EUR), which stood at
968.95 points on December 31, 2007. Since payments to all
plan participants take place on a specified date, no assump-
tions concerning exercise behavior are made in this plan
structure, and such assumptions are therefore not consid-
ered in this option pricing model. Dividend payments and
corporate actions are taken into account through correspon-
ding factors that are analogous to those employed by the
index provider.
elapsed of the total three-year term. The total expense for
the E.ON Share Performance Plan amounted to 60.5 million
in 2007 (2006: 9.0 million).
Intrinsic value as of December 31, 2007
Fair value as of December 31, 2007
Swap rate
Volatility of the E.ON share
Volatility of the Dow Jones STOXXUtilities Index (Total Return EUR)
Correlation between the E.ON shareprice and the Dow Jones STOXXUtilities Index (Total Return EUR)
1st tranche
157.47
158.72
4.55%
21.56%
13.81%
0.8056
2nd tranche
162.93
163.59
4.45%
21.73%
13.46%
0.7977
E.ON Share Performance Plan—Measurement Parameters of theOption Pricing Model
Performance Rights granted in 2006
Settled Performance Rights in 2006
Performance Rights expired in 2006
Performance Rights outstanding asof December 31, 2006
Performance Rights granted in 2007
Settled Performance Rights in 2007
Performance Rights expired in 2007
Performance Rights outstanding asof December 31, 2007
Cash amount paid in 2007
Provision as of December 31, 2007
Expense in 2007
1st tranche
458,641
2,020
2,020
454,601
–
11,042
2,691
440,868
1.0 m
46.6 m
38.8 m
2nd tranche
–
–
–
–
395,025
4,458
1,658
388,909
0.6 m
21.2 m
21.7 m
Changes in the E.ON Share Performance Plan
The first and second tranches were not yet payable on an
ordinary basis on the balance sheet date.
The issue of a third tranche of the E.ON Share Performance
Plan is planned for 2008.
Employees
During 2007, the Company employed an average of
83,434 people (2006: 80,453), not including 2,352 apprentices
(2006: 2,280). The breakdown by market unit is shown below:
Central Europe
Pan-European Gas
U.K.
Nordic
U.S. Midwest
Corporate Center/New Markets
Total
2007
44,054
12,204
16,499
5,872
2,940
1,865
83,434
2006
44,148
12,653
14,599
5,697
2,919
437
80,453
Employees

Notes158
(12) Other Information
German Corporate Governance Code
On December 17, 2007, the Board of Management and Super-
visory Board of E.ON AG made a declaration of compliance
pursuant to Article 161 of the German Stock Corporation Act
(“AktG”). The declaration was made publicly accessible on
E.ON’s Web site (www.eon.com).
Fees and Services of the Independent Auditor
During 2007 and 2006, the Company incurred the following
fees for services provided by its independent auditor, Price-
waterhouseCoopers (“PwC”):
The fees for the financial statement audits concern the audit
of the Consolidated Financial Statements and the legally
mandated financial statements of E.ON AG and its affiliates.
This item also includes the additional fees charged for the
audit of internal controls over financial reporting.
Fees for other attestation services concern in particular the
review of the interim IFRS financial statements and, in 2006,
the review of the conversion to IFRS. Further included in this
item are project-related reviews connected to the introduc-
tion of IT and internal-control systems, due-diligence services
rendered in connection with acquisitions and disposals, and
other specific items.
Fees for tax advisory services primarily include advisory on
a case-by-case basis with regard to the tax treatment of M&A
transactions, ongoing consulting related to preparing tax
returns and review of tax assessments, as well as advisory
on other tax-related issues, both in Germany and abroad.
Fees for other services consist primarily of technical support
in IT projects, technical training measures and regulatory
matters.
Shareholdings and Other Interests
A listing of all shareholdings and other interests of E.ON AG
has been compiled and will be published separately in the
Electronic Federal Gazette (“elektronischer Bundesanzeiger”)
in Germany. That listing also contains those shareholdings
for which the preparation and publication of consolidated
financial statements and of a corresponding management
report under Articles 264 (3) and 264b HGB, respectively, is
not required.
in millions
Financial statement audits
Other attestation services
Tax advisory services
Other services
Total
2006
33
25
1
2
61
2007
33
22
1
1
57
Independent Auditor Fees

159To Our ShareholdersSupervisory Board Year in Review Combined Group Management Report Additional Information Market Units Corporate Governance Consolidated Financial Statements Tables and Explanations
(13) Earnings per Share
The computation of basic and diluted earnings per share for
the periods indicated is shown below:
The computation of diluted EPS is identical to basic EPS, as
E.ON AG has not issued any potentially dilutive common
stock.
Earnings per Share
2006
5,307
–486
4,821
775
–10
765
5,586
0
7.31
1.16
8.47
659
2007
7,394
–520
6,874
330
–
330
7,204
0
10.55
0.51
11.06
651
in millions
Income/Loss (–) from continuingoperations
less: Minority interests
Income/Loss (–) from continuingoperations (attributable to shareholdersof E.ON AG)
Income/Loss (–) from discontinuedoperations, net
less: Minority interests
Income/Loss (–) from discontinued oper-ations, net (attributable to shareholdersof E.ON AG)
Net income attributable to shareholdersof E.ON AG
in
Earnings per share (attributable toshareholders of E.ON AG)
from continuing operations
from discontinued operations
from net income
Weighted-average number of sharesoutstanding (in millions)

160
(14) Goodwill, Intangible Assets and Property, Plant and Equipment
in millions
Goodwill
Marketing-related intangible assets
Customer-related intangible assets
Contract-based intangible assets
Technology-based intangible assets
Internally generated intangible assets
Intangible assets subject to amortization
Intangible assets not subject toamortization
Advance payments on intangible assets
Intangible assets
Real estate and leasehold rights
Buildings
Technical equipment, plant and machinery
Other equipment, fixtures, furniture andoffice equipment
Advance payments and construction in progress
Property, plant and equipment
Transfers
–229
–
10
–11
68
–
67
–400
–13
–346
18
200
1,468
–70
–1,190
426
Disposals
–10
–175
–2
–12
–23
–
–212
–239
–1
–452
–61
–146
–1,428
–206
–12
–1,853
Additions
13
–
1
66
49
32
148
990
29
1,167
25
74
2,327
276
3,961
6,663
Change in scope
of consoli-dation
2,489
–
25
305
10
–
340
–
–
340
1
1,183
1,901
–9
1,001
4,077
Exchangerate
differences
–822
–4
–98
–22
–8
–21
–153
–43
–
–196
–119
–163
–1,963
–141
–176
–2,562
January 1,2007
15,604
227
2,482
1,694
503
218
5,124
1,263
15
6,402
3,970
7,996
80,098
3,362
2,088
97,514
December 31,2007
17,045
48
2,418
2,020
599
229
5,314
1,571
30
6,915
3,834
9,144
82,403
3,212
5,672
104,265
Notes
Acquisition and production costs
Goodwill, Intangible Assets and Property, Plant and Equipment
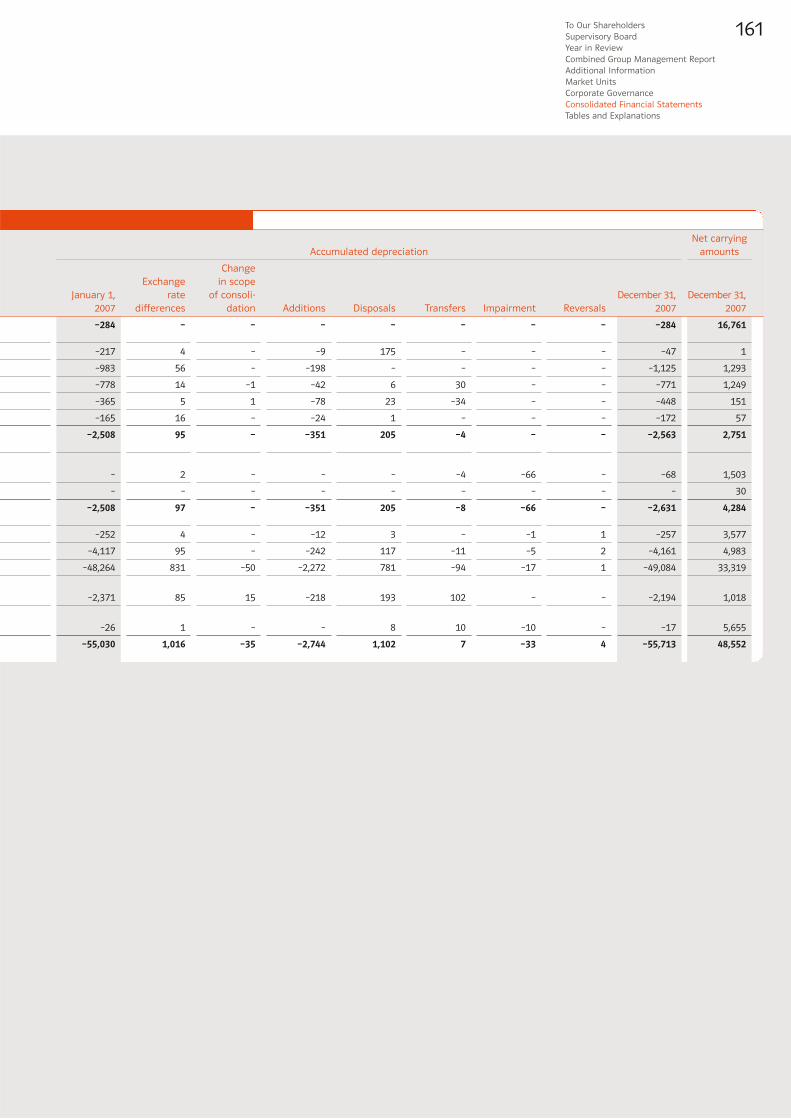
161To Our ShareholdersSupervisory Board Year in Review Combined Group Management Report Additional Information Market Units Corporate Governance Consolidated Financial Statements Tables and Explanations
January 1,2007
–284
–217
–983
–778
–365
–165
–2,508
–
–
–2,508
–252
–4,117
–48,264
–2,371
–26
–55,030
Change in scope
of consoli-dation
–
–
–
–1
1
–
–
–
–
–
–
–
–50
15
–
–35
Additions
–
–9
–198
–42
–78
–24
–351
–
–
–351
–12
–242
–2,272
–218
–
–2,744
Disposals
–
175
–
6
23
1
205
–
–
205
3
117
781
193
8
1,102
Transfers
–
–
–
30
–34
–
–4
–4
–
–8
–
–11
–94
102
10
7
Impairment
–
–
–
–
–
–
–
–66
–
–66
–1
–5
–17
–
–10
–33
Reversals
–
–
–
–
–
–
–
–
–
–
1
2
1
–
–
4
December 31,2007
–284
–47
–1,125
–771
–448
–172
–2,563
–68
–
–2,631
–257
–4,161
–49,084
–2,194
–17
–55,713
December 31,2007
16,761
1
1,293
1,249
151
57
2,751
1,503
30
4,284
3,577
4,983
33,319
1,018
5,655
48,552
Accumulated depreciationNet carrying
amounts
Exchangerate
differences
–
4
56
14
5
16
95
2
–
97
4
95
831
85
1
1,016

Notes162
in millions
Net carrying amount as of January 1, 2006
Changes resulting from acquisitions and divestments
Other changes1
Net carrying amount as of December 31, 2006
Changes resulting from acquisitions and divestments
Other changes1
Net carrying amount as of December 31, 2007
Changes in Goodwill by Segment
1Other changes include transfers and exchange rate differences from the respective reporting year as well as reclassifications to discontinued operations (2006, Nordic segment: –€83 million).
Nordic
368
3
–73
298
2
–12
288
Pan-European
Gas
4,200
146
53
4,399
15
–39
4,375
CentralEurope
2,419
65
1
2,485
17
–28
2,474
U.K.
4,955
–
1
4,956
–
–614
4,342
U.S.Midwest
3,552
–
–370
3,182
–
–330
2,852
CorporateCenter/
New Markets
–
–
–
–
2,458
–28
2,430
Total
15,494
214
–388
15,320
2,492
–1,051
16,761
in millions
Goodwill
Marketing-related intangible assets
Customer-related intangible assets
Contract-based intangible assets
Technology-based intangible assets
Internally generated intangible assets
Intangible assets subject to amortization
Intangible assets not subject toamortization
Advance payments on intangible assets
Intangible assets
Real estate and leasehold rights
Buildings
Technical equipment, plant and machinery
Other equipment, fixtures, furniture andoffice equipment
Advance payments and construction in progress
Property, plant and equipment
Transfers
–61
–
9
9
120
–95
43
–27
–23
–7
–140
258
895
7
–1,040
–20
Disposals
–12
–
–5
–18
–32
–2
–57
–244
–
–301
–49
–24
–1,169
–180
–32
–1,454
Additions
56
–
2
28
65
20
115
391
11
517
55
100
2,067
243
1,815
4,280
Change in scope
of consoli-dation
74
–
2
–24
3
–
–19
–39
–
–58
–12
–59
182
–77
42
76
Exchangerate
differences
–245
4
31
10
1
4
50
11
1
62
86
5
95
26
–27
185
January 1,2006
15,792
223
2,443
1,689
346
291
4,992
1,171
26
6,189
4,030
7,716
78,028
3,343
1,330
94,447
December 31,2006
15,604
227
2,482
1,694
503
218
5,124
1,263
15
6,402
3,970
7,996
80,098
3,362
2,088
97,514
Acquisition and production costs
Goodwill, Intangible Assets and Property, Plant and Equipment
a) Goodwill and Other Intangible Assets
GoodwillDuring the 2007 and 2006 fiscal years, the carrying amount of
goodwill changed as follows in each of E.ON’s segments:

163To Our ShareholdersSupervisory Board Year in Review Combined Group Management Report Additional Information Market Units Corporate Governance Consolidated Financial Statements Tables and Explanations
January 1,2006
–298
–123
–782
–601
–267
–209
–1,982
–
–
–1,982
–333
–3,813
–46,847
–2,378
–9
–53,380
Change in scope
of consoli-dation
14
–
9
12
–3
–
18
–
–
18
–
36
392
38
–
466
Additions
–
–50
–197
–51
–54
–26
–378
–
–
–378
–12
–216
–2,275
–205
–
–2,708
Disposals
–
–
1
8
31
–
40
–
–
40
2
5
914
178
–
1,099
Transfers
–
–
–1
–1
–71
73
–
–
–
–
96
–96
–29
16
–
–13
Impairment
–
–41
–
–140
–
–
–181
–
–
–181
–5
–25
–355
–
–18
–403
Reversals
–
–
–
–
–
–
–
–
–
–
1
–
–
–
–
1
December 31,2006
–284
–217
–983
–778
–365
–165
–2,508
–
–
–2,508
–252
–4,117
–48,264
–2,371
–26
–55,030
December 31,2006
15,320
10
1,499
916
138
53
2,616
1,263
15
3,894
3,718
3,879
31,834
991
2,062
42,484
Accumulated depreciationNet carrying
amounts
Exchangerate
differences
–
–3
–13
–5
–1
–3
–25
–
–
–25
–1
–8
–64
–20
1
–92
historical analysis and prospective forecasting. The after-tax
interest rates used for discounting cash flows are calculated
on a unit-specific basis using market data, and as of Decem-
ber 31, 2007, ranged between 5.6 and 7.3 percent after taxes
(2006: 5.4 to 7.8 percent).
Principal assumptions underlying the determination by man-
agement of fair value less costs to sell include forecasts of
commodity market prices, of future electricity and gas prices
in the wholesale and retail markets, of investment activity,
and of changes in the regulatory framework as well as in
rates of growth and discount rates.
As all the fair values less costs to sell of the cash-generating
units exceeded their respective carrying amounts, no charges
were recognized in 2007 or 2006 in connection with the
testing of goodwill for impairment.
IFRS 3 prohibits the amortization of goodwill. Instead, good-
will is tested for impairment at least annually at the level of
the cash-generating units. Goodwill must also be tested for
impairment at the level of individual cash-generating units
between these annual tests if events or changes in circum-
stances indicate that the recoverable amount of a particular
cash-generating unit might be impaired.
To perform the impairment tests, the Company first determines
the fair values less costs to sell of its cash-generating units,
which are calculated based on discounted cash flow methods
and verified through the use of suitable multiples. In addition,
to the extent available, market transactions or valuations by
third parties are taken into account for similar assets.
Valuation is based on the corporate planning authorized by
the Board of Management. Underlying the calculations is a
detailed forecasting period of five years, which extends to
ten years in exceptional cases. The cash flow assumptions
extending beyond the detailed forecasting period are deter-
mined using unit-specific growth rates that are based on

164 Notes
b) Property, Plant and Equipment
Borrowing costs in the amount of €62 million were capitalized
in 2007 (2006: €27 million) as part of the historical cost of
property, plant and equipment.
In 2007, the Company recorded depreciation of property,
plant and equipment in the amount of €2,744 million (2006:
€2,708 million). Impairment charges on property, plant and
equipment amounted to €33 million (2006: €403 million). In
2006, the amount included €227 million in impairment charges
for gas distribution network operations in Germany that
resulted from the regulation of network charges. Reversals
of impairments on property, plant and equipment amounted
to €4 million in 2007 (2006: €1 million).
Restrictions on disposals of the Company’s property, plant
and equipment exist in the amount of €5,228 million (2006:
€4,236 million) mainly with regard to land, buildings and
technical equipment.
Certain power plants, gas storage facilities and supply net-
works are utilized under finance leases and capitalized in the
E.ON Consolidated Financial Statements because the eco-
nomic ownership of the assets leased is attributable to E.ON.
The property, plant and equipment thus capitalized had the
following carrying amounts as of December 31, 2007:
Intangible AssetsIn 2007, the Company recorded an aggregate amortization
expense of €351 million (2006: €378 million). Impairment
charges of €66 million on intangible assets were recognized
in 2007 (2006: €181 million).
Intangible assets not subject to amortization include emission
rights from a variety of trading systems with a carrying
amount of €228 million (2006: €289 million).
Based on the current amount of intangible assets subject to
amortization, the estimated amortization expense for each
of the five succeeding fiscal years is as follows:
As acquisitions and disposals occur in the future, actual
amounts may vary.
in millions
2008
2009
2010
2011
2012
Total
335
275
211
177
151
1,149
Estimated Aggregated Amortization Expense
in millions
Land
Buildings
Technical equipment, plant and machinery
Other equipment, fixtures, furniture and office equipment
Net carrying amount of capitalized lease assets
E.ON as Lessee—Carrying Amounts of Capitalized Lease Assets
2006
–
3
285
6
294
2007
–
2
271
2
275
December 31
in millions
Due within 1 year
Due in 1 to 5 years
Due in more than 5 years
Total
E.ON as Lessee—Payment Obligations Under Finance Leases
2006
58
127
295
480
2007
56
104
288
448
Minimum lease payments
2006
15
42
203
260
2007
17
50
188
255
Covered interest share
2006
43
85
92
220
2007
39
54
100
193
Present values
The corresponding payment obligations under finance leases
are due as shown below:

165To Our ShareholdersSupervisory Board Year in Review Combined Group Management Report Additional Information Market Units Corporate Governance Consolidated Financial Statements Tables and Explanations
The present value of the minimum lease obligations is reported
primarily under liabilities from leases. A further €22 million
(2006: €24 million) is included in financial liabilities to entities
in which an ownership interest exists.
Regarding future obligations under operating leases where
economic ownership is not transferred to E.ON as the lessee,
see Note 27.
E.ON also functions in the capacity of lessor. The lease
installments from operating leases are due as shown in the
table at right:
See Note 17 for information on receivables from finance
leases.
(15) Companies Accounted for Under the EquityMethod and Other Financial Assets
The following table shows the structure of the companies
accounted for under the equity method and the other finan-
cial assets as of the dates indicated:
The amount shown for non-current securities relates primarily
to fully marketable fixed-income securities.
In 2007, impairment charges on companies accounted for under
the equity method amounted to €1 million (2006: €215 mil-
lion) and impairments on other financial assets amounted to
€28 million (2006: €152 million). In 2006, €335 million in
impairment charges were related to equity method compa-
nies and minority shareholdings with network operations in
Germany, and resulted from the regulation of network charges.
The carrying amount of other financial assets with impair-
ment losses was €524 million as of the end of the fiscal year
(2006: €436 million).
€1,524 million (2006: €1,169 million) in non-current securities
is restricted for the fulfillment of legal insurance obligations
of VKE.
Shares in Associated Companies Accounted forUnder the Equity Method
The financial information below summarizes income statement
and balance sheet data for the investments of the associated
companies that are accounted for under the equity method.
in millions
Companies accounted for underthe equity method
Equity investmentsEquity investment in OAO Gazprom
Non-current securities
Total
Dec. 312007
8,411
14,583
13,061
6,895
29,889
Dec. 312006
7,770
13,533
11,918
7,146
28,449
Jan. 12006
9,507
10,073
8,141
6,471
26,051
Companies Accounted for Under the EquityMethod and Other Financial Assets
in millions
Sales
Net income/loss
2007
48,656
4,399
2006
49,531
3,715
Earnings Data for Companies Accounted for Under the Equity Method
2007
24,940
14,353
8,636
15,280
15,377
December 31
2006
42,011
27,034
23,114
26,381
19,550
Balance Sheet Data for Companies Accounted for Under the Equity Method
in millions
Non-current assets
Current assets
Provisions
Liabilities and deferred income
Equity
in millions
Nominal value of outstanding lease installments
Due within 1 year
Due in 1 to 5 years
Due in more than 5 years
Total
E.ON as Lessor—Operating Leases
2007
29
87
190
306
Investment income generated from associated companies
accounted for under the equity method amounted to €1,019 mil-
lion in 2007 (2006: €880 million).
The carrying amount of associated companies accounted for under
the equity method whose shares are marketable was €1,104 mil-
lion in 2007 (2006: €973 million). The fair value of E.ON’s share in
these companies was €2,284 million (2006: €2,401 million).
Additions of investments in associated companies accounted
for under the equity method resulted in a total goodwill of
€102 million in 2007 (2006: €54 million).
Investments in associated companies totaling €79 million
(2006: €76 million) were restricted because they were pledged
as collateral for financing as of the balance sheet date.

166
Raw materials, goods purchased for resale and finished
products are generally valued at average cost.
Write-downs totaled to €3 million in 2007 (2006: €6 million).
Reversals of write-downs amounted to €5 million in 2007
(2006: €5 million). The carrying amount of inventories recog-
nized at net realizable value was €183 million.
No inventories have been pledged as collateral.
Notes
(16) Inventories
The following table provides details of inventories as of the
dates indicated:
As of December 31, 2007, other financial assets include receiv-
ables from owners of minority interests in jointly owned
power plants of €518 million (2006: €609 million) and margin
account deposits for futures trading of €262 million (2006:
€135 million). In addition, in line with the application of IFRIC 5,
other financial assets include a claim for a refund from the
Swedish nuclear fund in the amount of €1,280 million (2006:
€1,290 million) in connection with the decommissioning of
nuclear power plants and nuclear waste disposal. Since this
asset is designated for a particular purpose, E.ON’s access
to it is restricted.
Other operating assets consist primarily of accrued interest
receivables of €598 million (2006: €555 million).
(17) Receivables and Other Assets
The following table lists receivables and other assets by
remaining time to maturity as of the dates indicated:
2007
1,946
1,801
64
3,811
December 31
2006
2,144
1,987
68
4,199
Inventories
in millions
Raw materials and supplies
Goods purchased for resale
Work in progress and finished products
Inventories
current
451
61
965
1,477
1,018
9,760
4,714
2,565
18,057
19,534
non-current
593
531
1,507
2,631
28
–
4
341
373
3,004
in millions
Financial receivables from entities in which an ownership interest exists
Accounts receivable from finance leases
Other financial receivables and financial assets
Financial receivables and other financial assets
Operating receivables from entities in which an ownership interest exists
Trade receivables
Receivables from derivative financial instruments
Other operating assets
Trade receivables and other operating assets
Receivables and other assets
current
463
43
1,009
1,515
842
9,064
5,232
2,835
17,973
19,488
non-current
564
529
1,356
2,449
4
–
328
348
680
3,129
December 31, 2007 December 31, 2006
Receivables and Other Assets

167To Our ShareholdersSupervisory Board Year in Review Combined Group Management Report Additional Information Market Units Corporate Governance Consolidated Financial Statements Tables and Explanations
Receivables from finance leases are primarily the result of
certain electricity delivery contracts that must be treated as
leases according to IFRIC 4. The nominal and present values
of the outstanding lease payments have the following due
dates:
Of the present value of the outstanding lease payments,
€572 million (2006: €592 million) are reported as receivables
from finance leases and 128 million (2006: €131 million) are
reported as financial receivables from entities in which an
ownership interest exists.
in millions
Total trade receivables
Not impaired and not yet due
Not impaired and up to 90 days past-due
Not impaired and 91 to 180 days past-due
Not impaired and 181 to 360 days past-due
Not impaired and over 360 days past-due
Net value of impaired receivables
2007
9,064
6,874
1,449
285
263
161
32
2006
9,760
7,113
1,938
192
285
189
43
Aging Schedule of Trade Receivables
The aging schedule of trade receivables is presented in the
following table:
2007
–503
–
–333
64
198
18
–556
2006
–394
3
–293
54
149
–22
–503
in millions
Balance as of January 1
Change in scope of consolidation
Write-downs
Reversals of write-downs
Derecognition
Other1
Balance as of December 31
Valuation Allowances for Trade Receivables
The individual impaired receivables are due from a large
number of retail customers from whom it is unlikely that full
repayment will ever be received. Receivables are monitored
by the various market units. There are no indications that the
carrying amounts reported are impaired.
Valuation allowances for trade receivables have changed as
shown in the following table:
2007
104
359
879
1,342
Gross investment in financelease arrangements Unrealized interest income
Present value of minimumlease payments
2006
102
351
1,007
1,460
2007
44
169
429
642
2006
35
155
547
737
2007
60
190
450
700
2006
67
196
460
723
in millions
Due within 1 year
Due in 1 to 5 years
Due in more than 5 years
Total
E.ON as Lessor—Finance Leases
1”Other” consists primarily of additions and currency translation differences.
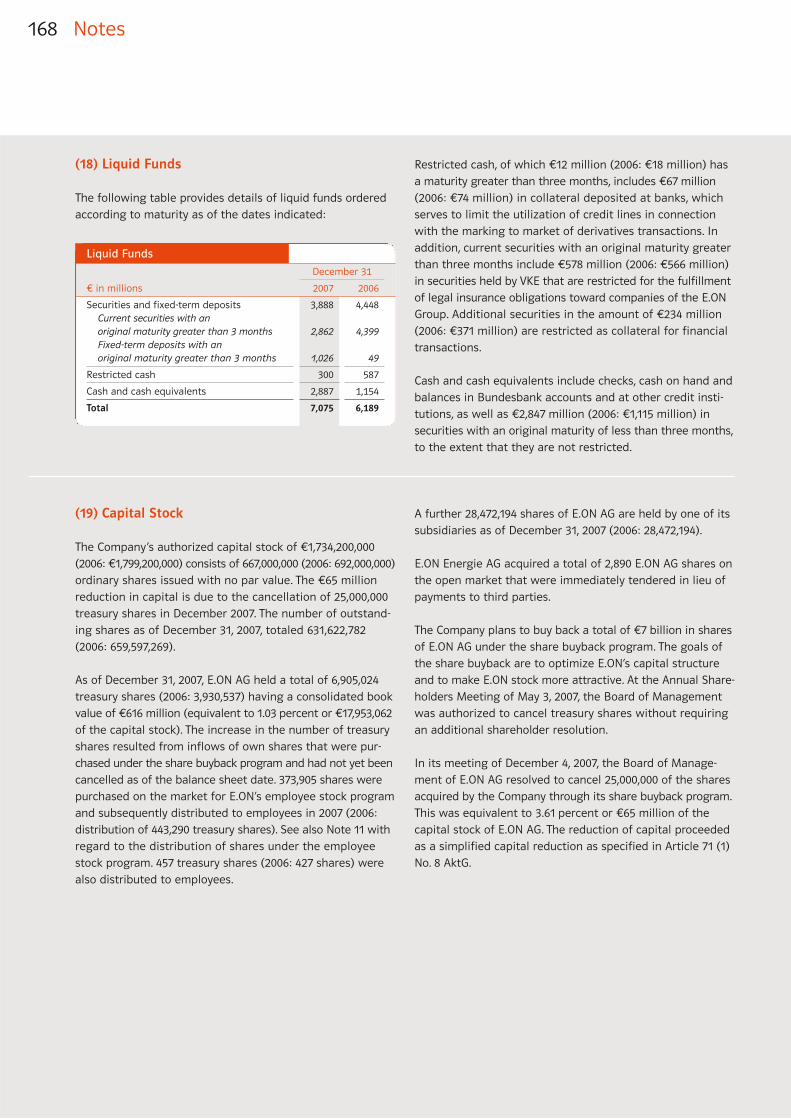
168
(18) Liquid Funds
The following table provides details of liquid funds ordered
according to maturity as of the dates indicated:
(19) Capital Stock
The Company’s authorized capital stock of €1,734,200,000
(2006: €1,799,200,000) consists of 667,000,000 (2006: 692,000,000)
ordinary shares issued with no par value. The €65 million
reduction in capital is due to the cancellation of 25,000,000
treasury shares in December 2007. The number of outstand-
ing shares as of December 31, 2007, totaled 631,622,782
(2006: 659,597,269).
As of December 31, 2007, E.ON AG held a total of 6,905,024
treasury shares (2006: 3,930,537) having a consolidated book
value of €616 million (equivalent to 1.03 percent or €17,953,062
of the capital stock). The increase in the number of treasury
shares resulted from inflows of own shares that were pur-
chased under the share buyback program and had not yet been
cancelled as of the balance sheet date. 373,905 shares were
purchased on the market for E.ON’s employee stock program
and subsequently distributed to employees in 2007 (2006:
distribution of 443,290 treasury shares). See also Note 11 with
regard to the distribution of shares under the employee
stock program. 457 treasury shares (2006: 427 shares) were
also distributed to employees.
Restricted cash, of which €12 million (2006: €18 million) has
a maturity greater than three months, includes €67 million
(2006: €74 million) in collateral deposited at banks, which
serves to limit the utilization of credit lines in connection
with the marking to market of derivatives transactions. In
addition, current securities with an original maturity greater
than three months include €578 million (2006: €566 million)
in securities held by VKE that are restricted for the fulfillment
of legal insurance obligations toward companies of the E.ON
Group. Additional securities in the amount of €234 million
(2006: €371 million) are restricted as collateral for financial
transactions.
Cash and cash equivalents include checks, cash on hand and
balances in Bundesbank accounts and at other credit insti-
tutions, as well as €2,847 million (2006: €1,115 million) in
securities with an original maturity of less than three months,
to the extent that they are not restricted.
A further 28,472,194 shares of E.ON AG are held by one of its
subsidiaries as of December 31, 2007 (2006: 28,472,194).
E.ON Energie AG acquired a total of 2,890 E.ON AG shares on
the open market that were immediately tendered in lieu of
payments to third parties.
The Company plans to buy back a total of €7 billion in shares
of E.ON AG under the share buyback program. The goals of
the share buyback are to optimize E.ON’s capital structure
and to make E.ON stock more attractive. At the Annual Share-
holders Meeting of May 3, 2007, the Board of Management
was authorized to cancel treasury shares without requiring
an additional shareholder resolution.
In its meeting of December 4, 2007, the Board of Manage-
ment of E.ON AG resolved to cancel 25,000,000 of the shares
acquired by the Company through its share buyback program.
This was equivalent to 3.61 percent or €65 million of the
capital stock of E.ON AG. The reduction of capital proceeded
as a simplified capital reduction as specified in Article 71 (1)
No. 8 AktG.
Notes
in millions
Securities and fixed-term depositsCurrent securities with an original maturity greater than 3 monthsFixed-term deposits with an original maturity greater than 3 months
Restricted cash
Cash and cash equivalents
Total
2007
3,888
2,862
1,026
300
2,887
7,075
2006
4,448
4,399
49
587
1,154
6,189
December 31
Liquid Funds

169To Our ShareholdersSupervisory Board Year in Review Combined Group Management Report Additional Information Market Units Corporate Governance Consolidated Financial Statements Tables and Explanations
Moreover, E.ON entered into put option arrangements in 2007
for a further 10,000,000 of its own shares, again as part of the
share buyback program. Pursuant to IAS 32, the €1,098 million
in conditional purchase price obligations arising from the
put options, which had been recognized as a separate com-
ponent of equity, have now been reclassified as a liability.
The €64 million option premium received had the net effect,
after deduction of €19 million in deferred taxes, of increasing
equity by a total of €45 million.
Authorized Capital
At the Annual Shareholders Meeting on April 27, 2005, the
Board of Management was authorized, subject to the Super-
visory Board’s approval, to increase the Company’s capital
stock by up to €540 million (“Article 202 ff. AktG Authorized
Capital”) through one or more issuances of new ordinary
shares with no par value in return for contributions in cash
and/or in kind (with the option to exclude shareholders’
subscription rights). This capital increase is authorized until
April 27, 2010. Subject to the Supervisory Board’s approval,
the Board of Management is authorized to exclude share-
holders’ subscription rights.
At the Annual Shareholders Meeting of April 30, 2003, condi-
tional capital (with the option to exclude shareholders’
subscription rights) in the amount of €175.0 million (“Condi-
tional Capital”) was authorized until April 30, 2008. This Con-
ditional Capital may be used to issue bonds with conversion
or option rights and to fulfill conversion obligations towards
creditors of bonds containing conversion obligations. The
securities underlying these rights and obligations are either
E.ON AG shares or those of companies in which E.ON AG
directly or indirectly holds a majority stake.
For the 2007 fiscal year, the following disclosures about voting
rights have been made pursuant to Article 21 (1) of the German
Securities Trading Act (“WpHG”):
On June 6, 2007, UBS AG, Zurich, Switzerland, informed us
pursuant to Article 21 (1) WpHG that its share of the voting
rights of E.ON AG, Düsseldorf, Germany, ISIN: DE0007614406,
WKN: 761440, passed the threshold of 3 percent on June 1,
2007, and that it stands at 3.48 percent (equivalent to
24,100,066 votes) as of that date. 0.16 percent of the voting
rights (equivalent to 1,102,568 votes) are attributable to UBS AG
pursuant to Article 22 (1), sentence 1, no. 1, WpHG.
On December 21, 2007, Capital Research and Management
Company, Los Angeles, California, U.S., informed us pursuant
to Article 21 (1) WpHG that its share of the voting rights of
E.ON AG, Düsseldorf, Germany, ISIN: DE0007614406, WKN: 761440,
passed the threshold of 5 percent on December 13, 2007, and
that it stands at 5.06 percent (equivalent to 33,743,064 votes)
as of that date. 5.06 percent of the voting rights of E.ON AG
(equivalent to 33,743,064 votes) are attributable to Capital
Research and Management Company pursuant to Article 22 (1),
sentence 1, no. 6, WpHG.
(20) Additional Paid-in Capital
Additional paid-in capital results exclusively from share issuance
premiums. As of December 31, 2007, additional paid-in capital
amounts to €11,825 million (2006: €11,760 million). This repre-
sents an increase of €65 million since December 31, 2006.
This increase is due to the retirement of 25,000,000 shares.
The €11 million increase in 2006 resulted from the distribution
of 443,290 E.ON AG shares to employees.

170
The cancellation of 25,000,000 shares in the form of a simpli-
fied capital reduction had the effect of reducing retained
earnings by a corresponding amount of €3,115 million as of
December 31, 2007.
Under German securities law, E.ON AG shareholders may only
receive distributions from the retained earnings of E.ON AG
as defined by German GAAP. As of December 31, 2007, these
German-GAAP retained earnings amounted to €3,627 million
(2006: €4,593 million). Of these, legal reserves of €45 million
(2006: €45 million) pursuant to Article 150 (3) and (4) AktG and
reserves for treasury shares of €230 million (2006: €230 mil-
lion) pursuant to Article 272 (4) HGB were not distributable on
December 31, 2007. Accordingly, an amount of €3,352 million
(2006: €4,318 million) is in principle available for dividend
payments.
The Group’s retained earnings as of December 31, 2007, include
accumulated undistributed earnings of €1,297 million (2006:
€910 million) from companies that have been accounted for
under the equity method.
A proposal to increase the cash dividend for 2007 by 22 per-
cent, from €3.35 per share to €4.10 per share, will be submit-
ted to the Annual Shareholders Meeting. The dividend will
thus have increased from €1.75 to €4.10 since 2002, which
corresponds to an average annual increase of 19 percent.
Based on E.ON AG’s 2007 year-end closing price, the dividend
yield is 2.8 percent. Based on a €4.10 dividend, the total profit
distribution is €2,590 million.
(22) Changes in Other Comprehensive Income
The change in unrealized gains from available-for-sale secu-
rities was primarily attributable to an increase of €1,143 million
(before deferred taxes) in the fair value of the investment
in Gazprom.
In 2007, reclassification adjustments from available-for-sale
securities recognized in income resulted primarily from the
sale of securities at the Central Europe market unit. In 2006,
this item included a gain of €159 million from the deconsoli-
dation of institutional securities funds that took place as part
of the funding of the CTA (see also Note 24).
Notes
(21) Retained Earnings
The following table breaks down the E.ON Group’s retained
earnings as of the dates indicated:
(23) Minority Interests
Minority interests as of the dates indicated are attributable
to the segments as shown below:
The increase in minority interests in 2007 resulted primarily
from the expiration of an obligation concerning the purchase
of the outstanding stake in E.ON Sverige and from the acqui-
sition of OGK-4 (see also Notes 26 and 4).
in millions
Legal reserves
Other retained earnings
Total
2007
45
26,783
26,828
2006
45
24,305
24,350
December 31
Retained Earnings
in millions
Central Europe
Pan-European Gas
U.K.
Nordic
U.S. Midwest
Corporate Center/New Markets
Total
2007
2,578
212
84
1,782
29
1,071
5,756
2006
2,299
832
63
1,789
77
–2,527
2,533
December 31
Minority Interests

171To Our ShareholdersSupervisory Board Year in Review Combined Group Management Report Additional Information Market Units Corporate Governance Consolidated Financial Statements Tables and Explanations
(24) Provisions for Pensions and Similar Obligations
The retirement benefit obligations toward the employees of
the E.ON Group, which amounted to €15.9 billion, were covered
by plan assets having a fair value of €13.1 billion as of Decem-
ber 31, 2007. This corresponds to a funded status of 82 percent.
In addition to the reported plan assets, VKE manages finan-
cial investments and liquid funds totaling €2.4 billion (2006:
€2.3 billion) that do not constitute plan assets under IAS 19
but which nevertheless are solely intended for the coverage
of employee retirement benefits in the Central Europe mar-
ket unit and at Corporate Center/New Markets.
In 2006 and 2007, the funded status, measured as the differ-
ence between the defined benefit obligation for the pension
units and the fair value of plan assets, has changed as follows:
Description of the Benefit Obligations
In addition to their entitlements under government retirement
systems and the income from private retirement planning,
most E.ON Group employees are also covered by occupational
retirement plans.
Both defined benefit pension plans and defined contribution
pension plans are maintained at E.ON. The majority of the
benefit obligations reported consists of obligations of those
companies in the E.ON Group in which the retirement pen-
sion is calculated either on the salaries earned during the
most recent years of service (final-pay arrangements) or on
a scale of fixed amounts.
In order to reduce the risks associated with this type of
benefit obligations, a majority of the final-pay retirement
pension plans were closed between 1998 and 2006 to new
employees joining the Company and replaced by newly
designed pension plans in Germany and the U.K. containing
elements of both defined benefit and defined contribution
pension plans, and by defined contribution pension plans in
the United States. The newly designed pension plans were
also introduced at many of the Group’s German companies
to cover existing benefits for years of service beyond 2004.
The provisions for pensions and similar obligations further
include minor provisions for obligations from the assumption
of costs for post-employment health care benefits, which are
granted primarily in the United States.
Under defined contribution pension plans, the Company
discharges its obligations toward the employees in defined
contribution pension plans when it pays agreed contribution
amounts into funds managed by external retirement insurers.
in millions
Defined benefit obligation
Fair value of plan assets
Funded status
2007
15,936
–13,056
2,880
2006
17,306
–13,342
3,964
2006
17,849
–8,076
9,773
January 1Dezember 31
Two-Year History

172
Changes in the Benefit Obligation
The following table shows the changes in the benefit obliga-
tion, as measured by the defined benefit obligation, for the
periods indicated:
Foreign benefit obligations relate almost entirely to the ben-
efit plans at the market units U.K. (2007: €7,134 million) and
U.S. Midwest (2007: €779 million). The portion of the entire
benefit obligation allocated to health care benefits amounted
to €139 million (2006: €179 million).
The addition of OGK-4 (€22 million) was the principal factor
behind the change shown as “Change in scope of consolida-
tion” in 2007.
Actuarial gains in 2006 and 2007 are attributable primarily
to the increase of the discount rate, which led to a relative
decrease of the defined benefit obligation.
Actuarial values of the pension obligations of the principal
German, U.K. and U.S. subsidiaries were computed based on
the following average assumptions for each region:
Notes
Foreign
8,466
95
422
22
10
83
–761
25
–437
48
7,973
Total
17,849
265
771
–2
14
–816
45
21
–847
6
17,306
Domestic
9,205
172
361
5
1
–492
–
–
–416
4
8,840
Foreign
8,644
93
410
–7
13
–324
45
21
–431
2
8,466
in millions
Defined benefit obligation as of January 1
Employer service cost
Interest cost
Change in scope of consolidation
Past service cost
Actuarial gains (–)/losses
Exchange rate differences
Employee contributions
Pensions paid
Other
Defined benefit obligation as of December 31
Total
17,306
256
810
24
10
–920
–761
25
–863
49
15,936
Domestic
8,840
161
388
2
–
–1,003
–
–
–426
1
7,963
2007 2006
Changes in the Defined Benefit Obligation
6.65
5.25
8.25
–
9.00
Other
4.50
2.75
4.50
1.50
–
CTA plans
4.50
2.75
4.90
1.50
–
5.10
4.00
5.90
3.00
–
5.95
5.25
8.25
–
10.00
in %
Discount rate
Salary increase rate
Expected return on plan assets
Pension increase rate
Health care cost trend
Other
5.50
2.75
4.50
1.75
–
CTA plans
5.50
2.75
5.40
1.75
–
5.80
4.20
5.90
3.20
–
December 31, 2007
Germany U.K. U.S. Germany U.K. U.S.
December 31, 2006
Actuarial Assumptions

173To Our ShareholdersSupervisory Board Year in Review Combined Group Management Report Additional Information Market Units Corporate Governance Consolidated Financial Statements Tables and Explanations
Other company-specific actuarial assumptions, including
employee fluctuation, have also been included in the compu-
tations. In Germany, the increase in age limits provided by the
Retirement Pension Age Limit Adjustment Act (“RV-Alters-
grenzenanpassungsgesetz”) was included for the first time
in the determination of the benefit obligation in 2007.
To measure the E.ON Group’s occupational pension obligations
for accounting purposes, the Company has employed the
most recent biometric tables recognized in each respective
country for the calculation of pension obligations.
The discount rate assumptions used by E.ON reflect the
country-specific rates available at the end of the respective
fiscal year for high-quality fixed-rate corporate bonds with
a duration corresponding to the average period to maturity
of the pension benefit obligations.
Description of Plan Assets
Defined benefit pension plans in the Group’s companies, be
they within or outside of Germany, are mostly financed
through the accumulation of plan assets in specially created
pension vehicles that legally are distinct from the Company.
In 2006, a number of German subsidiaries established a so-
called Contractual Trust Arrangement (CTA), with two trusts
(Pensionsabwicklungstrust e.V., E.ON Pension Trust e.V.) created
for this purpose. The funds administered on a fiduciary basis
by E.ON Pension Trust e.V. amounted to €5,204 million on
December 31, 2007, and must be treated as plan assets under
IAS 19. The remainder of the domestic plan assets in the
amount of €318 million is held by pension funds in the Central
Europe market unit.
The foreign plan assets, which amounted to €7,534 million in
2007 (2006: €7,974 million) and are managed by independent
pension trusts, are dedicated almost entirely to the financing
of the pension plans at the U.K. and U.S. Midwest market units.
The majority of these plan assets, namely €6,944 million (2006:
€7,401 million), is attributable to the U.K. market unit.
The changes in the fair value of the plan assets covering the
benefit obligation for defined benefit pension plans are
shown in the following table:
Foreign
7,974
465
167
25
–
7
–715
–434
45
7,534
Total
8,076
529
5,241
21
–4
–36
87
–575
3
13,342
Domestic
307
102
5,126
–
–
–21
–
–146
–
5,368
Foreign
7,769
427
115
21
–4
–15
87
–429
3
7,974
in millions
Fair value of plan assets as of January 1
Expected return on plan assets
Employer contributions
Employee contributions
Change in scope of consolidation
Actuarial gains/losses (–)
Exchange rate differences
Pensions paid
Other
Fair value of plan assets as of December 31
Total
13,342
731
436
25
4
–65
–715
–747
45
13,056
Domestic
5,368
266
269
–
4
–72
–
–313
–
5,522
2007 2006
Changes in Plan Assets

174
The €2.4 billion (2006: €2.3 billion) in financial assets and liquid
funds administered by VKE are not included in the determi-
nation of the funded status since they do not constitute plan
assets under IAS 19. However, these assets, which are prima-
rily dedicated to the coverage of the Central Europe market
unit’s benefit obligations, do additionally have to be taken into
consideration for a comprehensive evaluation of the funded
status of the E.ON Group’s benefit obligations.
The principal investment objective for the pension plan
assets is to provide full coverage of benefit obligations at all
times for the payments due under the corresponding pen-
sion plans. Plan assets do not include any owner-occupied
real estate. Investment in equity and debt instruments
issued by E.ON Group companies is generally not intended.
To implement the investment objective, the E.ON Group in
principle pursues a liability-driven investment (LDI) approach
that takes into account the structure of the benefit obliga-
tions. This long-term LDI strategy seeks to manage the funded
status, with the result that any changes in the defined bene-
fit obligation, especially those caused by fluctuating inflation
and interest rates are, to a certain degree, counteracted by
Notes
simultaneous corresponding changes in the fair value of plan
assets. The LDI strategy may also involve the use of deriva-
tives (e.g., interest rate swaps and inflation swaps). In order
to improve the funded status, i.e., the difference between the
defined benefit obligations for all pension plans and the fair
value of all plan assets, of the E.ON Group as a whole, a por-
tion of the plan assets will also be invested in a diversified
portfolio of asset classes that are expected to provide for long-
term returns in excess of those of fixed-income investments.
The determination of the target portfolio structure is based
on regular asset-liability studies. In these studies, the target
portfolio structure is reviewed under consideration of exist-
ing investment principles, the current funded status, the con-
dition of the capital markets and the structure of the benefit
obligations developments, and is adjusted as necessary. The
anticipated long-term returns on the individual plan assets
are derived from the portfolio structure targeted and from
the long-term returns forecast for the individual asset classes
in the asset-liability studies.
Plan assets were invested in the asset classes shown in the
following table as of the dates indicated:
Foreign
27
62
7
4
Total
18
49
8
25
Domestic
6
31
10
53
Foreign
29
63
5
3
Total
18
39
5
38
Domestic
1
3
4
92
Classification of Plan Assets
December 31, 2006December 31, 2007
in %
Equity securities
Debt securities
Real estate
Other (primarily fixed-term deposits)
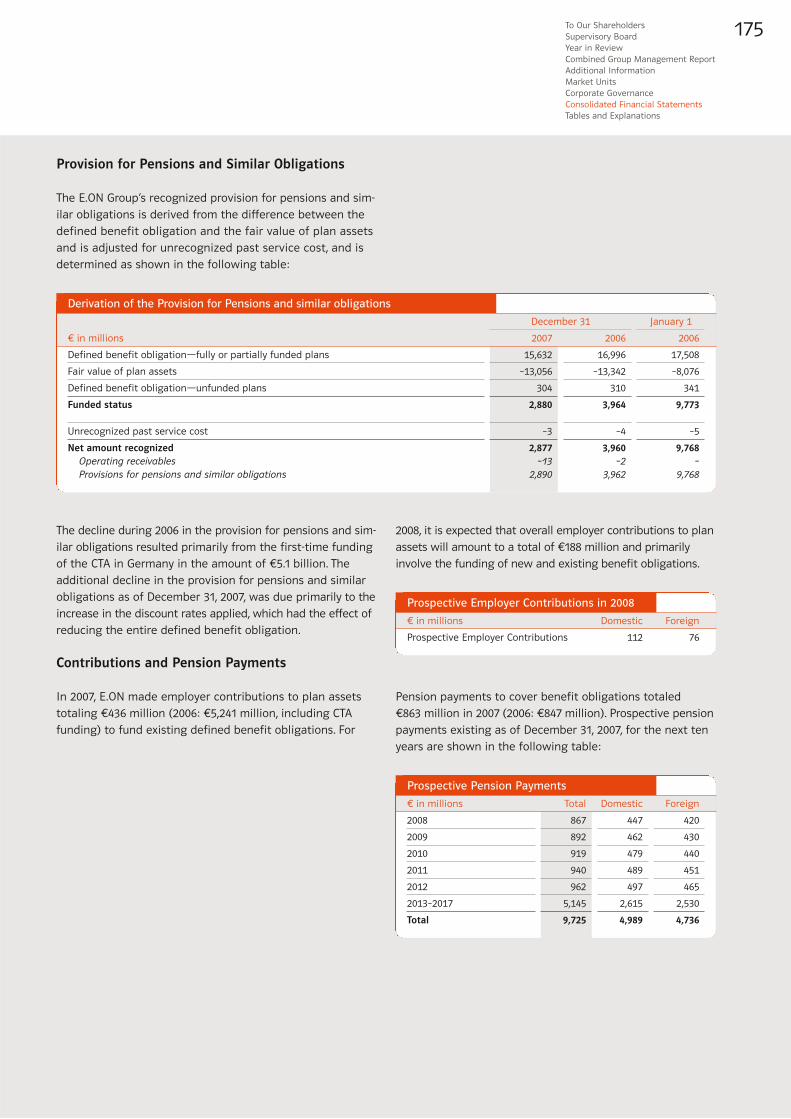
175To Our ShareholdersSupervisory Board Year in Review Combined Group Management Report Additional Information Market Units Corporate Governance Consolidated Financial Statements Tables and Explanations
in millions
2008
2009
2010
2011
2012
2013–2017
Total
Foreign
420
430
440
451
465
2,530
4,736
Domestic
447
462
479
489
497
2,615
4,989
Total
867
892
919
940
962
5,145
9,725
Prospective Pension Payments
Provision for Pensions and Similar Obligations
The E.ON Group’s recognized provision for pensions and sim-
ilar obligations is derived from the difference between the
defined benefit obligation and the fair value of plan assets
and is adjusted for unrecognized past service cost, and is
determined as shown in the following table:
The decline during 2006 in the provision for pensions and sim-
ilar obligations resulted primarily from the first-time funding
of the CTA in Germany in the amount of €5.1 billion. The
additional decline in the provision for pensions and similar
obligations as of December 31, 2007, was due primarily to the
increase in the discount rates applied, which had the effect of
reducing the entire defined benefit obligation.
Contributions and Pension Payments
In 2007, E.ON made employer contributions to plan assets
totaling €436 million (2006: €5,241 million, including CTA
funding) to fund existing defined benefit obligations. For
Pension payments to cover benefit obligations totaled
€863 million in 2007 (2006: €847 million). Prospective pension
payments existing as of December 31, 2007, for the next ten
years are shown in the following table:
2008, it is expected that overall employer contributions to plan
assets will amount to a total of €188 million and primarily
involve the funding of new and existing benefit obligations.
Foreign
76
Domestic
112
Prospective Employer Contributions in 2008
in millions
Prospective Employer Contributions
2007
15,632
–13,056
304
2,880
–3
2,877–13
2,890
2006
17,508
–8,076
341
9,773
–5
9,768–
9,768
2006
16,996
–13,342
310
3,964
–4
3,960–2
3,962
Derivation of the Provision for Pensions and similar obligations
December 31 January 1
in millions
Defined benefit obligation—fully or partially funded plans
Fair value of plan assets
Defined benefit obligation—unfunded plans
Funded status
Unrecognized past service cost
Net amount recognizedOperating receivablesProvisions for pensions and similar obligations

176
in millions
Employer service cost
Interest cost
Expected return on plan assets
Past service cost
Total
Domestic
161
388
–266
–
283
Foreign
95
422
–465
10
62
Total
256
810
–731
10
345
2006
Domestic
172
361
–102
1
432
Foreign
93
410
–427
13
89
Total
265
771
–529
14
521
Net Periodic Pension Cost
Notes
Pension Cost
The net periodic pension cost for defined benefit pension
plans is shown in the table below:
Actuarial gains and losses have been recognized in full in the
period in which they occurred. They are reported outside of
the income statement as part of equity in the statements of
recognized income and expenses.
The actual return on plan assets totaled €666 million in 2007
(2006: €486 million).
In addition to the total net periodic pension cost, an amount
of €53 million in 2007 (2006: €54 million) was incurred for
defined contribution pension plans and other retirement pro-
visions, under which the Company pays fixed contributions to
external insurers or similar institutions.
The total net periodic pension cost shown includes an amount
of €12 million in 2007 (2006: €15 million) for retiree health
care benefits. A one-percentage-point increase or decrease
in the assumed health care cost trend rate would affect the
interest and service components and result in a change in
net periodic pension cost of +€0.5 million or –€0.4 million
(2006: +€0.7 million or –€0.6 million), respectively. The resulting
accumulated post-employment benefit obligation would
change by +€4.9 million or –€4.4 million (2006: +€7.7 million
or –€6.9 million), respectively.
The changes in actuarial gains and losses recognized in equity
are shown in the following table:
In 2007 and 2006, the following experience adjustments were
made to the present value of all benefit obligations and to
the fair value of plan assets:
2007
The experience adjustments reflect the effects on the benefit
obligations and plan assets at the E.ON Group resulting from
differences between the actual changes in these amounts
during the fiscal year from the assumption made with respect
to these changes at the beginning of the year. This includes,
among other things, the development of salary increases
and of other measures relevant in the determination of the
benefit obligations, increases in state pensions, employee
fluctuation and biometric data such as death and disability.
in millions
Accumulated actuarial gains (+) and losses (–) recognized in equity as of January 1
Recognition in equity of current-yearactuarial gains (+) and losses (–)
Accumulated actuarial gains (+) and losses (–) recognized in equity as of December 31
2007
781
852
1,633
2006
–
781
781
Accumulated Actuarial Gains andLosses Recognized in Equity
in %
Experience adjustments to the amountof the benefit obligation
Experience adjustments to the value ofplan assets
2007
1.22
–0.50
December 31
2006
0.73
–0.22
Experience Adjustments

177To Our ShareholdersSupervisory Board Year in Review Combined Group Management Report Additional Information Market Units Corporate Governance Consolidated Financial Statements Tables and Explanations
The changes in the miscellaneous provisions are shown in
the table below:
(25) Miscellaneous Provisions
The following table lists the miscellaneous provisions as of
the dates indicated:
The accretion expense resulting from the changes in provisions
is shown in the financial results (see Note 9).
The interest rates applied for the nuclear power segment,
calculated on a country-specific basis, were 5.5 percent
(2006: 5.0 percent) in Germany and 2.5 percent (2006: 2.1 per-
cent to 2.5 percent) in Sweden. For the other provision items,
the interest rates used ranged from 3.0 percent to 4.5 percent,
depending on maturity (2006: 3.8 percent to 5.2 percent).
in millions
Non-contractual obligations for nuclear waste management
Contractual obligations for nuclear waste management
Personnel obligations
Other asset retirement obligations
Supplier-related obligations
Customer-related obligations
Environmental remediation and similar obligations
Other
Total
non-current
10,425
3,389
804
901
107
41
474
1,997
18,138
current
120
294
686
295
419
309
15
1,856
3,994
non-current
10,022
3,335
690
943
290
80
456
2,257
18,073
current
133
300
593
301
451
296
32
1,886
3,992
December 31, 2007 December 31, 2006
Miscellaneous Provisions
in millions
Non-contractual obliga-tions for nuclear wastemanagement
Contractual obligationsfor nuclear wastemanagement
Personnel obligations
Other asset retirementobligations
Supplier-related obligations
Customer-relatedobligations
Environmental remediationand similar obligations
Other
Total
Reclassi-fications
–110
110
1
–
–
–3
–
–21
–23
Reversals
–
–
–89
–
–35
–92
–19
–244
–479
Changesin esti-mates
–745
3
–
49
–
–
–
–
–693
Dec. 31,2007
10,155
3,635
1,283
1,244
741
376
488
4,143
22,065
Utilization
–
–384
–717
–23
–51
–113
–17
–984
–2,289
Additions
25
55
598
5
297
237
23
1,504
2,744
Accretion
492
181
3
35
6
1
15
30
763
Change inscope
of consoli-dation
–
–
3
2
–
–
–
42
47
Exchangerate dif-
ferences
–52
–13
–6
–20
–2
–4
–3
–37
–137
Jan. 1,2007
10,545
3,683
1,490
1,196
526
350
489
3,853
22,132
Changes in Miscellaneous Provisions

178
based on Germany’s ordinance on advance payments for the
establishment of facilities for the safe custody and final
storage of radioactive wastes in the country (“Endlagervor-
ausleistungsverordnung”) and on data from the German
Federal Office for Radiation Protection (“Bundesamt für
Strahlenschutz”). Advance payments remitted to the Bundes-
amt für Strahlenschutz in the amount of €781 million (2006:
€781 million) have been deducted from the provisions. These
payments are made each year in the amount spent by the
Bundesamt für Strahlenschutz on the construction of the
final storage facilities Gorleben and Konrad, which are calcu-
lated based on the Endlagervorausleistungsverordnung.
Changes in estimates in 2007 reduced provisions by €859 mil-
lion at the Central Europe market unit. The Nordic market unit
recorded an increase of €114 million as a result of changes
in estimates.
Provisions for Contractual Nuclear WasteManagement Obligations
The provisions based on German and Swedish nuclear power
legislation totaling €3.6 billion comprise all those nuclear
obligations relating to the disposal of spent nuclear fuel
rods and low-level nuclear waste and to the retirement and
decommissioning of nuclear power plant components that
are valued at amounts firmly specified in legally binding civil
agreements.
Most of the provisions are classified as non-current provisions
and measured at their settlement amounts, discounted to
the balance sheet date.
Advance payments made to reprocessors and to other waste
management companies in the amount of €126 million
(2006: €113 million) have been deducted from the provisions
attributed to Germany. The advance payments relate to repro-
cessing services and to the delivery of interim storage con-
tainers, as well as the return of waste resulting from repro-
cessing. Concerning the disposal of spent nuclear fuel rods,
the obligations recognized in the provisions comprise the
contractual costs of finalizing reprocessing and the associat-
ed transports and containers for the return of waste into the
central interim storage facilities Gorleben and Ahaus and
the actual central interim storage itself, as well as the pro-
curement of interim storage containers, transports of spent
fuel rods to interim on-site storage facilities and the actual
Provisions for Non-Contractual Nuclear WasteManagement Obligations
The provisions based on German and Swedish nuclear power
legislation totaling €10.2 billion comprise all those nuclear
obligations relating to the disposal of spent nuclear fuel
rods and low-level nuclear waste and to the retirement and
decommissioning of nuclear power plant components that
are determined on the basis of external studies and cost
estimates.
The provisions are classified primarily as non-current provisions
and measured at their settlement amounts, discounted to
the balance sheet date.
The asset retirement obligations recognized for non-contrac-
tual nuclear obligations include the anticipated costs of run-
out operation of the facility, dismantling costs, and the cost
of removal and disposal of the nuclear components of the
nuclear power plant.
Additionally included as part of the disposal of spent fuel rods
are costs for transports to be conducted from central and
local temporary facilities to the conditioning plant and to the
final storage facility, the cost of proper conditioning prior to
final storage and the cost of procurement of final storage
containers.
The decommissioning costs and the cost of disposal of spent
nuclear fuel rods and low-level nuclear waste also respectively
include the actual final storage costs. The cost estimates used
to determine the provision amounts are all based on studies
performed by external specialists and are updated annually.
Measurement of the provisions takes into account the influ-
encing factors agreed in the understanding reached between
the German government and the country’s major power utili-
ties on June 14, 2000, and signed on June 11, 2001. Final stor-
age costs consist mainly of investment and operating costs
for the planned final storage facilities Gorleben and Konrad
Notes

179To Our ShareholdersSupervisory Board Year in Review Combined Group Management Report Additional Information Market Units Corporate Governance Consolidated Financial Statements Tables and Explanations
temporary storage itself arising from the “direct permanent
storage” path. The provisions also include the contractual
costs of decommissioning and the conditioning of low-level
radioactive waste.
Changes in estimates in 2007 reduced provisions by €58 mil-
lion at the Central Europe market unit. The Nordic market unit
recorded an increase of €61 million as a result of changes in
estimates.
Personnel Obligations
Provisions for personnel costs primarily cover provisions for
vacation pay, early retirement benefits, anniversary obligations,
share-based payment and other deferred personnel costs.
Provisions for Other Asset Retirement Obligations
The provisions for other asset retirement obligations consist
of obligations for conventional and renewable-energy power
plants, including the conventional plant components in the
nuclear power segment, that are based on legally binding
civil agreements and public regulations. Also reported here
are provisions for environmental improvements at opencast
mining and gas storage facilities and the dismantling of
installed infrastructure.
Supplier-Related Obligations
Provisions for supplier-related liabilities consist primarily of
provisions for potential losses on open purchase contracts.
Customer-Related Obligations
Provisions for customer-related liabilities consist primarily of
potential losses on open sales contracts. Also included are
provisions for warranties.
Environmental Remediation and Similar Obligations
Provisions for environmental remediation refer primarily to
redevelopment and water protection measures and to the
rehabilitation of contaminated sites. Also included here are
provisions for reversion of title, other environmental improve-
ments and land reclamation obligations at mining sites.
Other
The other miscellaneous provisions consist primarily of pro-
visions from the electricity and gas business, including the
provision established in 2006 for the risk of retroactive appli-
cation of lower network charges resulting from the regulation
of network charges in Germany. They further include provi-
sions for obligations arising from the acquisition and disposal
of businesses, provisions for taxes other than income taxes,
provisions from emissions trading systems and provisions for
tax-related interest expenses.

Notes180
(26) Liabilities
The following table provides details of liabilities as of the
dates indicated:
Financial Liabilities
The following is a description of the E.ON Group’s significant
credit arrangements and debt issuance programs. Included
under “Bonds” are the bonds currently outstanding, including
those issued under the Debt Issuance Program.
Corporate Center€30 Billion Debt Issuance ProgramThe existing €20 billion Medium Term Note program was
increased to €30 billion in December 2007 and renamed
“Debt Issuance Program.” The program allows E.ON AG and
E.ON International Finance B.V. (“EIF”), Amsterdam, the
Netherlands, under the unconditional guarantee of E.ON AG,
to periodically issue debt instruments through public and
private placements to investors. At year-end 2007, the follow-
ing EIF bonds were outstanding:
in millions
Financial liabilities to banks and third parties
Financial liabilities to entities in which an ownership interest exists
Financial liabilities to affiliated companiesFinancial liabilities to associated companies and other equity investments
Financial liabilities
Trade payables
Operating liabilities to entities in which an ownership interest exists
Operating liabilities to affiliated companiesOperating liabilities to associated companies and other equity investments
Capital expenditure grants
Construction grants from energy consumers
Liabilities from derivatives
Advance payments
Other operating liabilities
Trade payables and other operating liabilities
Total
current
3,481
2,068152
1,916
5,549
4,477
474135
339
26
434
5,011
451
7,381
18,254
23,803
non-current
15,876
399
30
15,915
–
6544
21
219
2,978
260
6
1,904
5,432
21,347
Total
19,357
2,107161
1,946
21,464
4,477
539179
360
245
3,412
5,271
457
9,285
23,686
45,150
December 31, 2006
current
1,472
1,971147
1,824
3,443
5,311
27475
199
23
360
5,897
400
7,313
19,578
23,021
non-current
9,993
367
29
10,029
–
7048
22
243
3,110
41
9
1,949
5,422
15,451
Total
11,465
2,007154
1,853
13,472
5,311
344123
221
266
3,470
5,938
409
9,262
25,000
38,472
Liabilities
Volume issued in therespective currency
EUR 4,250 m
CHF 200 m
GBP 500 m
EUR 1,750 m
CHF 225 m
EUR 900 m
EUR 1,750 m
GBP 600 m
GBP 975 m
GBP 900 m
Initial term
7 years
3 years
10 years
5 years
7 years
15 years
10 years
12 years
30 years
30 years
Repayment
May 2009
Dec 2010
May 2012
Oct 2012
Dec 2014
May 2017
Oct 2017
Oct 2019
June 2032
Oct 2037
Coupon
5.750%
3%
6.375%
5.125%
3.25%
6.375%
5.5%
6%
6.375%
5.875%
Listing
Luxembourg
SWX Swiss Exchange
Luxembourg
Luxembourg
SWX Swiss Exchange
Luxembourg
Luxembourg
Luxembourg
Luxembourg
Luxembourg
Debt Issues of E.ON International Finance
December 31, 2007

181To Our ShareholdersSupervisory Board Year in Review Combined Group Management Report Additional Information Market Units Corporate Governance Consolidated Financial Statements Tables and Explanations
The Debt Issuance Program documentation and the docu-
mentation of the outstanding bonds are customary for such
financing programs and instruments.
€10 Billion Commercial Paper ProgramThe existing €10 billion commercial paper program allows
E.ON AG and certain wholly owned subsidiaries, under the
unconditional guarantee of E.ON AG, to periodically issue
commercial paper with maturities of up to 729 days to inves-
tors. As of December 31, 2007, €1,757 million in commercial
paper was outstanding under the program (2006: €123 million).
€15 Billion Syndicated Multi-Currency RevolvingCredit Facility AgreementIn November 2007, E.ON increased the amount available under
its existing revolving credit facility from €10 billion to €15 bil-
lion. Under the facility, E.ON AG and certain subsidiaries, each
under the unconditional guarantee of E.ON AG, may make
borrowings in various currencies in an aggregate amount of
up to €15 billion. The facility is divided into Tranche A in the
amount of €10 billion and Tranche B in the amount of €5 bil-
lion. Tranche A has a maturity date of November 27, 2008.
Tranche B runs until December 2, 2011. Borrowings under the
credit facility generally bear interest equal to EURIBOR or
LIBOR for the respective currency plus a margin of 15 basis
points. As of December 31, 2007, there were no borrowings
outstanding under this facility (2006: €0).
As of December 31, 2007, the book values financial liabilities
of E.ON AG and EIF to banks and third parties outside the
E.ON Group had the following maturities:
in millions
Bonds
Commercial paper
Bank loans / Liabilities to banks
Liabilities from finance leases
Other financial liabilities
Total
Due in 2008
–
1,757
425
–
4
2,186
Duein 2009
4,162
–
–
–
4
4,166
Duein 2010
120
–
–
–
4
124
Duein 2011
–
–
–
–
–
–
Duein 2012
2,423
–
–
–
–
2,423
Dueafter 2012
6,117
–
–
–
–
6,117
Total
12,822
1,757
425
–
12
15,016
Financial Liabilities of E.ON AG and E.ON International Finance

182 Notes
in millions
Bonds
Commercial paper
Bank loans / Liabilities to banks
Liabilities from finance leases
Other financial liabilities
Financial liabilities to banks andthird parties
2007
275
–
8
25
–
308
2006
406
–
27
54
6
493
U.K.
2007
–
–
40
63
47
150
2006
–
–
69
66
105
240
Pan-European Gas
2007
–
–
992
39
136
1,167
2006
–
–
1,040
24
126
1,190
Central Europe
Financial Liabilities by Market Unit as of December 31
Financial Liabilities by SegmentThe following table shows the financial liabilities to banks
and third parties by segment:

183To Our ShareholdersSupervisory Board Year in Review Combined Group Management Report Additional Information Market Units Corporate Governance Consolidated Financial Statements Tables and Explanations
2007
738
227
–
30
431
1,426
2006
634
243
54
36
383
1,350
Nordic
2007
635
–
–
–
–
635
2006
729
–
–
–
15
744
U.S. Midwest
2007
12,822
1,757
972
14
106
15,671
2006
7,234
123
48
16
27
7,448
Corporate Center/New Markets
2007
14,470
1,984
2,012
171
720
19,357
2006
9,003
366
1,238
196
662
11,465
Total
Other Financial LiabilitiesOther financial liabilities include collateral received, measured
at a fair value of €407 million (2006: €55 million). This collat-
eral includes amounts pledged by banks to limit the utilization
of credit lines in connection with the marking to market of
derivatives transactions and margin deposits received in con-
nection with forward transactions on futures exchanges. Also
included here is collateral received in connection with goods
and services in the amount of €75 million (2006: €77 million).
E.ON can sell or repledge this collateral with no subsidiary
conditions.
Trade Payables and Other Operating Liabilities
Trade payables totaled €4,477 million as of December 31, 2007
(2006: €5,311 million).
Capital expenditure grants of €245 million (2006: €266 million)
were paid primarily by customers for capital expenditures
made on their behalf, while E.ON retains the assets. The grants
are non-refundable and are recognized in other operating
income over the period of the depreciable lives of the related
assets.
Construction grants of €3,412 million (2006: €3,470 million)
were paid by customers for the cost of new gas and electric-
ity connections in accordance with the generally binding terms
governing such new connections. These grants are customary
in the industry, generally non-refundable and recognized as
revenue according to the useful lives of the related assets.
Other operating liabilities consist primarily of accruals in the
amount of €3,530 million (2006: €2,673 million), interest
payable in the amount of €760 million (2006: €672 million)
and the €1,111 million in obligations under the put options that
were written in 2007 as part of the share buyback program.
Also included in other operating liabilities are counterparty
obligations to acquire additional shares in already consolidated
subsidiaries and minority interests in fully consolidated part-
nerships totaling €754 million (2006: €2,781 million). This
decrease in liabilities from counterparty obligations resulted
primarily from the obligation toward Statkraft concerning the
purchase of its remaining stake in E.ON Sverige for approxi-
mately €2 billion, which expired unexercised in 2007.

184 Notes
(27) Contingencies and Commitments
As part of its business activities, E.ON is subject to contin-
gencies and commitments involving a variety of underlying
matters. These primarily include guarantees, obligations
from litigation and claims (as discussed in more detail in
Note 28), short- and long-term contractual and legal obliga-
tions and other commitments.
Contingencies
The contingent liabilities of the E.ON Group arising from exist-
ing contingencies amounted to €96 million as of December 31,
2007 (2006: €114 million). E.ON currently does not have reim-
bursement rights relating to the contingent liabilities disclosed.
E.ON has issued direct and indirect guarantees to third parties,
which require E.ON to make contingent payments based on
the occurrence of certain events or changes in an underlying
instrument that is related to an asset, a liability or an equity
instrument of the guaranteed party, on behalf of both related
parties and external entities. These consist primarily of finan-
cial guarantees and warranties.
In addition, E.ON has also entered into indemnification agree-
ments. Along with other guarantees, these indemnification
agreements are incorporated in agreements entered into by
Group companies concerning the disposal of shareholdings
and, above all, cover the customary representations and
warranties, as well as environmental damage and tax contin-
gencies. In some cases the buyer of such shareholdings is
required to either share costs or cover certain specific costs
before E.ON itself is required to make any payments. Some
obligations are covered in the first instance by insurance
contracts or provisions of the disposed companies. Guaran-
tees issued by companies that were later sold by E.ON AG (or
VEBA AG and VIAG AG before their merger) are included in
the respective final sales contracts in the form of indemnities.
Moreover, E.ON has commitments under which it assumes
joint and several liability arising from its interests in the civil-
law companies (“GbR”), non-corporate commercial partner-
ships and consortia in which it participates.
The guarantees of E.ON also include items related to the
operation of nuclear power plants. With the entry into force
on April 27, 2002, of the German Nuclear Power Regulations
Act (“Atomgesetz” or “AtG”), as amended, and of the ordinance
regulating the provision for coverage under the Atomgesetz
(“Atomrechtliche Deckungsvorsorge-Verordnung” or “AtDeckV”),
as amended, German nuclear power plant operators are
required to provide nuclear accident liability coverage of up
to €2.5 billion per incident.
The coverage requirement is satisfied in part by a standard-
ized insurance facility in the amount of €255.6 million. The
institution Nuklear Haftpflicht Gesellschaft bürgerlichen
Rechts (“Nuklear Haftpflicht GbR”) now only covers costs
between €0.5 million and €15 million for claims related to
officially ordered evacuation measures. Group companies
have agreed to place their subsidiaries operating nuclear
power plants in a position to maintain a level of liquidity
that will enable them at all times to meet their obligations
as members of the Nuklear Haftpflicht GbR, in proportion to
their shareholdings in nuclear power plants.
To provide liability coverage for the additional €2,244.4 mil-
lion per incident required by the above-mentioned amend-
ments, E.ON Energie AG and the other parent companies of
German nuclear power plant operators reached a Solidarity
Agreement (“Solidarvereinbarung”) on July 11, July 27, August
21, and August 28, 2001. If an accident occurs, the Solidarity
Agreement calls for the nuclear power plant operator liable
for the damages to receive—after the operator’s own resources
and those of its parent company are exhausted—financing
sufficient for the operator to meet its financial obligations.
Under the Solidarity Agreement, E.ON Energie’s share of
the liability coverage currently stands at 42.0 percent (2006:
42.0 percent), with an additional 5.0 percent charge for the
administrative costs of processing damage claims.
In accordance with Swedish law, the companies of the
Nordic market unit have issued guarantees to governmental
authorities. The guarantees were issued to cover possible
additional costs related to the disposal of high-level radioac-
tive waste and to nuclear power plant decommissioning.
These costs could arise if actual costs exceed accumulated
funds. In addition, Nordic is also responsible for any costs
related to the disposal of low-level radioactive waste.
In Sweden, owners of nuclear facilities are liable for damages
resulting from accidents occurring in those nuclear facilities
and for accidents involving any radioactive substances con-
nected to the operation of those facilities. The liability per
incident as of December 31, 2007, was limited to SEK 3,063 mil-
lion, or €324 million (2006: SEK 3,102 million, or €343 million),
which amount must be insured according to the Law Con-
cerning Nuclear Liability. The Nordic market unit has purchased

185To Our ShareholdersSupervisory Board Year in Review Combined Group Management Report Additional Information Market Units Corporate Governance Consolidated Financial Statements Tables and Explanations
the necessary insurance for its nuclear power plants. The
Swedish government is currently in the process of reviewing
the regulatory framework for the aforementioned liability
limitation. The extent to which this review will result in changes
to the Swedish regulations on the limitation of nuclear lia-
bility is still unclear at present.
Other than in the Central Europe and Nordic market units,
there are no nuclear power plants in operation. Accordingly,
there are no additional contingent liabilities comparable to
those mentioned above.
Other Commitments
In addition to provisions and liabilities carried on the balance
sheet and to the reported contingent liabilities, there also
are other mostly long-term commitments arising from con-
tracts entered into with third parties or on the basis of legal
requirements.
As of December 31, 2007, purchase commitments and obliga-
tions totaled €7.9 billion (2006: €4.9 billion). This total includes
obligations for as yet outstanding investments in connection
with new power plant construction projects as well as mod-
ernizations of existing power plants, particularly at the Cen-
tral Europe, Nordic and U.K. market units and at the power
plant operator OGK-4 acquired in Russia. As of December 31,
2007, purchase commitments and obligations for new power
plant construction totaled €5.4 billion (2006: €2.5 billion).
These commitments also include obligations concerning the
construction of wind power plants.
In addition, other financial obligations arose from rental, and
tenancy agreements and from operating leases. The corre-
sponding minimum lease payments, presented at their nom-
inal values, are due as broken down in the table below:
The expenses reported in the income statement for such
contracts amounted to €218 million (2006: €236 million).
Additional long-term contractual obligations in place at the
E.ON Group as of December 31, 2007, relate primarily to the
purchase of fossil fuels such as gas, lignite and hard coal.
Obligations under these purchase contracts amounted to
roughly €250 billion on December 31, 2007.
Gas is usually procured on the basis of long-term purchase
contracts with large international producers of natural gas.
Such contracts are generally of a “take-or-pay” nature. The
prices paid for natural gas are normally tied to the prices of
competing energy sources, as dictated by market conditions.
The conditions of these long-term contracts are reviewed at
certain specific intervals (usually every 3 years) as part of
contract negotiations and may thus change accordingly. In
the absence of an agreement on a pricing review, a neutral
board of arbitration makes a final binding decision. Financial
obligations arising from these contracts are calculated
based on the same principles that govern internal budget-
ing. Furthermore, the take-or-pay conditions in the individual
contracts are also considered in the calculations.
As of December 31, 2007, €7.7 billion in contractual obligations
are in place for the purchase of electricity; these relate in
particular to purchases from jointly operated power plants in
the Central Europe market unit. The purchase price of elec-
tricity from jointly operated power plants is determined by the
supplier’s production cost plus a profit margin that is generally
calculated on the basis of an agreed return on capital.
Long-term contractual obligations have also been entered
into by the Central Europe market unit for the procurement
of services in the area of reprocessing and interim storage of
spent nuclear fuel elements delivered through June 30, 2005.
Other financial obligations in place as of December 31, 2007,
totaled approximately €3.7 billion. They consist primarily of
obligations concerning the acquisition of equity investments
and the acquisition of real estate funds held as financial
assets, as well as obligations arising from the network con-
nection of offshore wind farms. These items concern prima-
rily the Central Europe market unit.
In addition, there is an obligation toward the minority share-
holders of the Russian power plant operator OGK-4 to acquire
their shares. More information on this is contained in Note 4.
in millions
Due within 1 year
Due in 1 to 5 years
Due in more than 5 years
Total
148
401
334
883
Minimum leasepayments
E.ON as Lessee—Operating Leases

186 Notes
(28) Litigation and Claims
A number of different court actions (including product liabil-
ity lawsuits), governmental investigations and proceedings,
and other claims are currently pending or may be instituted
or asserted in the future against companies of the E.ON
Group. This in particular includes legal actions and proceed-
ings concerning alleged price-fixing agreements and anti-
competitive practices. In addition, there are lawsuits pending
against E.ON AG and U.S. subsidiaries in connection with the
disposal of VEBA Electronics in 2000. E.ON Ruhrgas is a party
to a number of different arbitration proceedings in connec-
tion with the acquisition of Europgas a.s. and in connection
with gas delivery contracts. Since litigation or claims are
subject to numerous uncertainties, their outcome cannot be
ascertained; however, in the opinion of management, any
potential obligations arising from these matters will not have
a material adverse effect on the financial condition, results
of operations or cash flows of the Company.
(29) Supplemental Disclosure of Cash FlowInformation
The following table indicates supplemental disclosures of
cash flow information:
Cash provided by operating activities was 22 percent higher
in 2007 than in 2006. This increase is due primarily to the
positive cash flow effects of operational improvements and
a reduced commitment of funds to working capital at the
Pan-European Gas and Nordic market units. An additional
positive contribution came from the reduction of receivables
at the U.K. market unit. Negative cash flow effects in 2007
occurred at the Corporate Center and were caused primarily
by higher tax payments outside of the Group.
Cash provided by investing activities was negative in 2007.
With declining proceeds from sales of shareholdings, spend-
ing on investments in property, plant and equipment and on
equity investments rose significantly over the previous year.
The largest individual project was the acquisition of the
majority of the shares of the Russian power plant company
OGK-4. This increased spending was offset by a reduction in
funds used for fixed-term deposits and securities purchases.
Increased borrowing led to a strong increase in cash provided
by financing activities. For the first time since 2002, these
cash flows were positive in 2007, in spite of the effect of the
share buyback program.
in millions
Non-cash investing and financing activities
Exchanges and contributions of assets aspart of acquisitions
Funding of external fund assets forpension obligations through transfer offixed-term deposits and securities
2007
–
–
2006
138
5,126
Supplemental Disclosure of Cash Flow Information
The sales price of deconsolidated shareholdings and activities
amounted to €25 million in 2007 (2006: €989 million). The
deconsolidation of shareholdings and activities resulting from
asset sales led to reductions of €21 million (2006: €1,523 mil-
lion) related to assets and €11 million (2006: €562 million)
related to provisions and liabilities. Cash and cash equivalents
divested herewith amounted to €2 million (2006: €550 million).
Purchase prices for acquisitions of subsidiaries totaled
€5,416 million (2006: €550 million). Cash and cash equivalents
acquired in connection with the acquisitions amounted to
€1,450 million (2006: €57 million). These purchases resulted
in assets amounting to €8,615 million (2006: €1,935 million)
and in provisions and liabilities totaling €2,182 million (2006:
€1,365 million).

187To Our ShareholdersSupervisory Board Year in Review Combined Group Management Report Additional Information Market Units Corporate Governance Consolidated Financial Statements Tables and Explanations
(30) Derivative Financial Instruments and HedgingTransactions
Strategy and Objectives
The Company’s policy generally permits the use of derivatives
if they are associated with underlying assets or liabilities,
forecasted transactions, or legally binding rights or obliga-
tions. Some of the companies in the market units also conduct
proprietary trading in commodities within the risk manage-
ment guidelines described below.
Hedge accounting in accordance with IAS 39 is used primarily
for interest rate derivatives used to hedge long-term debts,
as well as for currency derivatives used to hedge net invest-
ments in foreign operations and long-term receivables and
debts denominated in foreign currencies. In commodities,
potentially volatile future cash flows resulting primarily from
planned purchases and sales of electricity and from gas sup-
ply requirements are hedged. Forward transactions are used
to hedge price risks on equities.
Fair Value Hedges
Fair value hedges are used to protect against the risk from
changes in market values. The Company uses fair value
hedge accounting specifically in the exchange of fixed-rate
commitments in long-term receivables and liabilities denom-
inated in foreign currencies and euro for variable rates. The
hedging instruments used for such exchanges are interest
rate and cross-currency interest rate swaps. Gains and losses
on these hedges are generally reported in that line item of
the income statement which also includes the respective
hedged items. Interest rate fair value hedges are reported
under “Interest and similar expenses.” Adjustments to the
carrying amounts of hedged items produced a loss in 2007
of €9 million (2006: €14 million gain), which was offset by
realized gains of €12 million (2006: €15 million loss) for the
year in the designated hedging instruments. The negative fair
values of the derivatives used in fair value hedges totaled
€90 million (2006: negative €98 million).
Cash Flow Hedges
Cash flow hedges are used to protect against the risk arising
from variable cash flows. Interest rate and cross-currency
interest rate swaps are the principal instruments used to
limit interest rate and currency risks. The purpose of these
swaps is to maintain the level of payments arising from
long-term interest-bearing receivables and liabilities denom-
inated in foreign currencies and euro by using cash flow
hedge accounting in the functional currency of the respective
E.ON company.
To reduce cash flow fluctuations arising from future electricity
and gas transactions effected at variable spot prices, futures
and forward contracts are concluded and also accounted for
using cash flow hedge accounting.
As of December 31, 2007, the hedged transactions in place
included foreign currency cash flow hedges with maturities
of up to ten years (2006: up to eleven years) and up to 25 years
(2006: up to 26 years) for interest cash flow hedges. Share
price risk is hedged up to one year (2006: one year). Planned
commodity cash flow hedges have maturities of up to four
years (2006: up to four years).
The amount of ineffectiveness for cash flow hedges recorded
for the year ended December 31, 2007, produced a gain of
€3 million (2006: €3 million gain).

188 Notes
Pursuant to the information available as of the balance sheet
date, the following effects will accompany the reclassifications
from accumulated other comprehensive income to the income
statement in subsequent periods:
Gains and losses from reclassification are generally reported
in that line item of the income statement which also includes
the respective hedged transaction. Gains and losses from the
ineffective portions of cash flow hedges are classified as other
operating income or other operating expenses. Interest cash
flow hedges are reported under “Interest and similar expenses.”
The negative fair values of the derivatives used in cash flow
hedges totaled €339 million (2006: negative €359 million).
A negative amount of €82 million (2006: negative €302 mil-
lion) was added to other comprehensive income in 2007, while
during the same period a gain of €1 million (2006: €26 million)
was reclassified from OCI to the income statement.
Net Investment Hedges
The Company uses foreign currency loans, foreign currency
forwards and foreign currency swaps to protect the value of
its net investments in its foreign operations denominated in
foreign currencies. For the year ended December 31, 2007, the
Company recorded an amount of €1,489 million (2006: €909 mil-
lion) in accumulated other comprehensive income within
equity due to changes in fair value of derivatives and currency
translation results of non-derivative hedging instruments.
There were no ineffective portions from net investment hedges
in 2007 (2006: €2 million gain).
Valuation of Derivative Instruments
The fair value of derivative instruments is sensitive to move-
ments in underlying market rates and other relevant variables.
The Company assesses and monitors the fair value of deriv-
ative instruments on a periodic basis. Fair values for each
derivative financial instrument are determined as being equal
to the price at which one party would assume the rights and
duties of another party, and calculated using common market
valuation methods with reference to available market data
as of the balance sheet date.
The following is a summary of the methods and assumptions
for the valuation of utilized derivative financial instruments
in the Consolidated Financial Statements.
• Currency, electricity, gas, oil and coal forward contracts,
swaps, and emissions-related derivatives are valued sep-
arately at their forward rates and prices as of the balance
sheet date. Forward rates and prices are based on spot
rates and prices, with forward premiums and discounts
taken into consideration. Market data are used to the
extent possible.
• Market prices for currency, electricity and gas options are
valued using standard option pricing models commonly
used in the market. The fair values of caps, floors and
collars are determined on the basis of quoted market
prices or on calculations based on option pricing models.
• The fair values of existing instruments to hedge interest
risk are determined by discounting future cash flows
using market interest rates over the remaining term of
the instrument. Discounted cash values are determined
for interest rate, cross-currency and cross-currency inter-
est rate swaps for each individual transaction as of
the balance sheet date. Interest income is recognized in
income at the date of payment or accrual.
Carrying-amount
–103
6
249
–1
2008
–35
–1
128
–1
2009
–9
–
84
–
2010–2012
–10
–2
37
–
>2012
–49
9
–
–
Timing of Reclassifications from OCI1 to the Income Statement—2007
in millions
OCI—Currency cash flow hedges
OCI—Interest cash flow hedges
OCI—Commodity cash flow hedges
OCI—Other cash flow hedges
1OCI = Other comprehensive income. Figures are pre-tax.
Carryingamount
–98
3
274
–31
2007
–43
–1
253
–31
2008
–10
–1
20
–
2009–2011
–25
–
1
–
>2011
–20
5
–
–
Timing of Reclassifications from OCI1 to the Income Statement—2006
in millions
OCI—Currency cash flow hedges
OCI—Interest cash flow hedges
OCI—Commodity cash flow hedges
OCI—Other cash flow hedges
1OCI = Other comprehensive income. Figures are pre-tax.

189To Our ShareholdersSupervisory Board Year in Review Combined Group Management Report Additional Information Market Units Corporate Governance Consolidated Financial Statements Tables and Explanations
• Equity forwards are valued on the basis of the stock
prices of the underlying equities, taking into considera-
tion any timing components.
• Exchange-traded energy futures and option contracts
are valued individually at daily settlement prices deter-
mined on the futures markets that are published by
their respective clearing houses. Paid initial margins are
disclosed under other assets. Variation margins received
or paid during the term of such contracts are stated
under other liabilities or other assets, respectively.
• Certain long-term energy contracts are valued with the
aid of valuation models that use internal data if market
prices are not available.
Losses of €11 million (2006: €49 million) and gains of €141 mil-
lion (2006: €96 million) from the initial measurement of deriv-
ative financial instruments at the inception of the contract
were deferred and will be recognized in income during sub-
sequent periods as the contracts are fulfilled. The following
two tables include both derivatives that qualify for IAS 39
hedge accounting treatment and those that do not qualify.
in millions
FX forward transactions
Buy
Sell
FX currency options
Buy
Sell
Subtotal
Cross-currency swaps
Cross-currency interest rate swaps
Subtotal
Interest rate swaps
Fixed-rate payer
Fixed-rate receiver
Interest rate future
Subtotal
Other derivatives
Subtotal
Total
Nominal value
8,466.8
9,738.3
–
–
18,205.1
19,847.2
301.6
20,148.8
1,894.0
6,153.7
1,719.4
9,767.1
117.3
117.3
48,238.3
Fair value
–24.2
67.3
–
–
43.1
686.6
–49.6
637.0
–21.5
–85.9
30.2
–77.2
12.0
12.0
614.9
Nominal value
4,532.7
6,982.4
7.4
–
11,522.5
18,499.3
321.9
18,821.2
2,292.5
6,078.3
–
8,370.8
636.7
636.7
39,351.2
Fair value
–27.1
19.4
0.1
–
–7.6
7.4
–17.0
–9.6
–16.4
–89.8
–
–106.2
31.0
31.0
–92.4
December 31, 2007 December 31, 2006
Total Volume of Foreign Currency, Interest Rate and Equity-Based Derivatives
in millions
Electricity forwards
Exchange-traded electricity forwards
Electricity swaps
Exchange-traded electricity options
Coal forwards and swaps
Exchange-traded coal forwards
Oil derivatives
Gas forwards
Gas swaps
Gas options
Exchange-traded gas forwards
Emissions-related derivatives
Exchange-traded emissions-related derivatives
Total
Nominal value
25,733.5
10,033.6
21.4
104.9
5,024.4
38.1
780.4
12,932.1
313.8
4.5
1.2
1,808.0
407.8
57,203.7
Fair value
–794.1
–98.8
–1.1
9.5
193.1
25.7
11.6
335.3
–36.2
–3.6
0.1
6.0
–0.1
–352.6
Nominal value
29,049.7
8,089.5
15.1
0.3
1,320.2
58.9
1,213.4
16,757.1
153.4
5.3
–
461.0
33.9
57,157.8
Fair value
–854.0
–275.0
0.5
0.2
29.2
–1.1
–30.6
6.7
–17.4
2.8
–
2.8
3.8
–1,132.1
December 31, 2007 December 31, 2006
Total Volume of Electricity, Gas, Coal, Oil and Emissions-Related Derivatives

190 Notes
The carrying amounts of cash and cash equivalents and of
trade receivables are considered reasonable estimates of
their fair values because of their short maturity.
Where financial instruments are listed on an active market,
the respective price quotes at that market constitute the
fair value. This applies in particular to equities held and
bonds issued.
The fair value of shareholdings in unlisted companies and of
debt securities that are not actively traded, such as loans
received, loans granted and financial liabilities, is determined
by discounting future cash flows. Discounting takes place
using current customary market interest rates through the
(31) Additional Disclosures on Financial Instruments
The following table shows the carrying amounts of the
financial instruments, their grouping into IAS 39 categories,
their fair values and their measurement sources by class:
in millions
Equity investments
Financial receivables and other financial assetsFinancial receivables from entities in which an ownership interest existsReceivables from finance leases2
Other financial receivables and financial assets
Trade receivables and other operating assetsReceivables from entities in which an ownership interest existsTrade receivablesDerivatives with no hedging relationshipsDerivatives with hedging relationshipsOther operating assets
Securities and fixed-term deposits
Cash and cash equivalents
Restricted cash
Assets held for sale
Total assets
Financial liabilitiesFinancial liabilities to entities in which an ownership interest existsBondsCommercial paperBank loans/Liabilities to banksLiabilities from finance leases2
Other financial liabilities
Trade payables and other operating liabilitiesLiabilities to entities in which an ownership interest existsTrade payablesDerivatives with no hedging relationshipsDerivatives with hedging relationshipsPut option liabilities under IAS 32Other operating liabilities
Total liabilities
Totalcarrying
amountswithin the
scope ofIFRS 7
14,583
3,920
899700
2,321
17,021845
9,0644,928
6321,552
10,783
2,887
300
–
49,494
21,4642,085
14,4701,9842,012
193720
17,356539
4,4774,630
641754
6,315
38,820
Carryingamounts
14,583
3,964
899700
2,365
18,653846
9,0644,928
6323,183
10,783
2,887
300
577
51,747
21,4642,085
14,4701,9842,012
193720
23,686539
4,4774,630
641754
12,645
45,150
IAS 39measure-
mentcategory1
AfS
LaRn/aLaR
LaRLaRHfTn/aLaR
AfS
AfS
AfS
AfS
AmCAmCAmCAmC
n/aAmC
AmCAmC
HfTn/a
AmCAmC
Fair value
14,583
4,140
899705
2,536
16,940845
9,0644,928
6321,471
10,783
2,887
300
–
49,633
21,9032,085
14,8861,9841,931
297720
17,356539
4,4774,630
641754
6,315
39,259
Determinedusing mar-ket prices
13,061
262
––
262
377––
365–
12
9,635
2,860
300
–
26,495
12,869–
12,823–––
46
502––
502–––
13,371
Carrying Amounts and Fair Values by Class Within the Scope of IFRS 7 as of December 31, 2007
1AfS: Available for sale; LaR: Loans and receivables; HfT: Held for trading; AmC: Amortized cost. The categories are described in detail in Note 2.2Includes finance leases with third parties and with entities in which an ownership interest exists.

191To Our ShareholdersSupervisory Board Year in Review Combined Group Management Report Additional Information Market Units Corporate Governance Consolidated Financial Statements Tables and Explanations
remaining terms of the financial instruments. Fair value meas-
urement was not applied in the case of shareholdings with
a carrying amount of €58.3 million (2006: €58.3 million) as
cash flows could not be determined reliably for them. Fair
values could not be derived on the basis of comparable trans-
actions. The shareholdings are not material by comparison
with the overall position of the Group.
The fair value of commercial paper and borrowings under
revolving short-term credit facilities and of trade receivables is
used as the fair value due to the short maturities of these
instruments.
in millions
Equity investments
Financial receivables and other financial assetsFinancial receivables from entities in which an ownership interest existsReceivables from finance leases2
Other financial receivables and financial assets
Trade receivables and other operating assetsReceivables from entities in which an ownership interest existsTrade receivablesDerivatives with no hedging relationshipsDerivatives with hedging relationshipsOther operating assets
Securities and fixed-term deposits
Cash and cash equivalents
Restricted cash
Assets held for sale
Total assets
Financial liabilitiesFinancial liabilities to entities in which an ownership interest existsBondsCommercial paperBank loans/Liabilities to banksLiabilities from finance leases2
Other financial liabilities
Trade payables and other operating liabilitiesLiabilities to entities in which an ownership interest existsTrade payablesDerivatives with no hedging relationshipsDerivatives with hedging relationshipsPut option liabilities under IAS 32Other operating liabilities
Total liabilities
Totalcarrying
amountswithin the
scope ofIFRS 7
13,533
4,095
913723
2,459
16,9801,0469,7604,294
424 1,456
11,594
1,154
587
134
48,077
13,472 1,9839,003
3661,238
220662
18,791344
5,3115,436
502 2,7814,417
32,263
Carryingamounts
13,533
4,108
913723
2,472
18,4301,0469,7604,294
424 2,906
11,594
1,154
587
611
50,017
13,472 1,9839,003
3661,238
220662
25,000344
5,3115,436
502 2,781
10,626
38,472
IAS 39measure-
mentcategory1
AfS
LaRn/aLaR
LaRLaRHfTn/aLaR
AfS
AfS
AfS
AfS
AmCAmCAmCAmC
n/aAmC
AmCAmC
HfTn/a
AmCAmC
Fair value
13,533
4,361
913730
2,718
16,9801,0469,7604,294
4241,456
11,594
1,154
587
134
48,343
14,2391,9829,670
3661,238
321662
18,791344
5,3115,436
502 2,7814,417
33,030
Determinedusing mar-ket prices
11,928
235
––
235
85––
85––
11,266
1,154
587
–
25,255
8,654–
8,622–––
32
421 ––
421–––
9,075
Carrying Amounts and Fair Values by Class Within the Scope of IFRS 7 as of December 31, 2006
1AfS: Available for sale; LaR: Loans and receivables; HfT: Held for trading; AmC: Amortized cost. The categories are described in detail in Note 2.2Includes finance leases with third parties and with entities in which an ownership interest exists.

Notes192
See Note 30 for information on the determination of the fair
value of derivative financial instruments.
The following two tables illustrate the contractually agreed
(undiscounted) cash outflows arising from the financial liabi-
lities included in the scope of IFRS 7:
in millions
Financial liabilities to entities in which an ownership interest exists
Bonds
Commercial paper
Bank loans/Liabilities to banks
Liabilities from finance leases with third parties
Other financial liabilities
Cash outflows for financial liabilities
Liabilities to entities in which an ownership interest exists
Trade payables
Derivatives (with/without hedging relationships)
Put option liabilities under IAS 32
Other operating liabilities
Cash outflows for trade payables and other operating liabilities
Cash outflows for liabilities within the scope of IFRS 7
Cashoutflows
2010–2012
16
4,648
–
713
63
225
5,665
5
–
9,007
125
136
9,273
14,938
Cashoutflows
from 2013
23
12,024
–
221
278
379
12,925
49
–
10,333
185
368
10,935
23,860
Cashoutflows
2009
5
5,324
–
144
25
97
5,595
11
–
13,339
327
32
13,709
19,304
Cash Flow Analysis
Cashoutflows
2008
2,099
1,018
2,026
1,112
52
175
6,482
473
4,477
27,758
131
6,026
38,865
45,347
December 31, 2007
in millions
Financial liabilities to entities in which an ownership interest exists
Bonds
Commercial paper
Bank loans/Liabilities to banks
Liabilities from finance leases with third parties
Other financial liabilities
Cash outflows for financial liabilities
Liabilities to entities in which an ownership interest exists
Trade payables
Derivatives (with/without hedging relationships)
Put option liabilities under IAS 32
Other operating liabilities
Cash outflows for trade payables and other operating liabilities
Cash outflows for liabilities within the scope of IFRS 7
Cashoutflows
2010–2012
19
5,658
–
574
70
42
6,363
–
–
12,445
101
100
12,646
19,009
Cashoutflows
from 2013
20
6,541
–
194
285
113
7,153
53
–
11,157
136
21
11,367
18,520
Cashoutflows
2009
4
679
–
130
42
89
944
–
–
9,027
292
128
9,447
10,391
Cash Flow Analysis
Cashoutflows
2008
1,982
790
367
523
56
487
4,205
305
5,311
22,555
2,187
4,168
34,526
38,731
December 31, 2006

193To Our ShareholdersSupervisory Board Year in Review Combined Group Management Report Additional Information Market Units Corporate Governance Consolidated Financial Statements Tables and Explanations
Risk Management
PrinciplesThe prescribed processes, responsibilities and actions con-
cerning financial and risk management are described in detail
in internal risk management guidelines applicable through-
out the Group. The market units have developed additional
guidelines of their own within the confines of the Group’s
overall guidelines. To ensure efficient risk management at
the E.ON Group, the Trading (Front Office), Financial Settle-
ment (Back Office) and Risk Controlling (Middle Office)
departments are organized as strictly separate units. A new
department was set up in 2007 at Group level to manage all
risk controlling and reporting in the area of commodities,
while risk controlling and reporting in the areas of interest
rates and currencies remains the responsibility of the Finan-
cial Controlling department.
The Company uses a Group-wide treasury, risk management
and reporting system. This system is a standard information
technology solution and is both fully integrated and continu-
ously updated. The system is designed to provide for the
analysis and monitoring of the E.ON Group’s exposure to
liquidity, foreign exchange and interest risks. The market
units employ established systems for commodities.
Counterparty risks are monitored on a Group-wide basis
by Financial Controlling, with the support of a standard soft-
ware package.
A separate Risk Committee is responsible for the maintenance
and further development of the strategy set by the Board
of Management of E.ON AG with regard to commodity and
credit risk management policies.
1. Liquidity ManagementThe primary objectives of E.ON’s internal liquidity manage-
ment consist of ensuring ability to pay at all times, the timely
fulfillment of all payment obligations and the optimization
of costs within the E.ON Group.
In order to control liquidity, the Group’s financial guidelines
provide for a general obligation to tender in the case of
financial transactions by companies of which E.ON is the sole
owner. Cash pooling and external financing are largely cen-
tralized at E.ON AG and certain financing companies. The
funds are transferred internally to the other Group companies
as needed.
In addition to interest income and expenses from financial
receivables, the net gains and losses in the loans and receiv-
ables category consist primarily of valuation allowances on
trade payables. Gains and losses on the disposal of avail-
able-for-sale securities and equity investments are reported
under other operating income and other operating expenses,
respectively.
In addition, the interest income and expenses from interest-
bearing securities is included in this net result.
The net gains and losses in the held-for-trading category
encompass both the changes in fair value of the derivative
financial instruments and the gains and losses on realization.
For financial liabilities that bear floating interest rates, the
rates that were fixed on the balance sheet date are used to
calculate future interest payments for subsequent periods as
well. Financial liabilities that can be terminated at any time
are assigned to the earliest maturity time band in the same
way as put options that are exercisable at any time.
In gross-settled derivatives (usually currency derivatives and
commodity derivatives), outflows are accompanied by related
inflows of funds or commodities.
The net gains and losses from financial instruments by IAS 39
category are shown in the following table:
in millions
Loans and receivables
Available for sale
Held for trading
Amortized cost
Total
2007
385
1,533
446
–929
1,435
2006
520
847
–1,858
–989
–1,480
Net Gains and Losses by Category1
1The categories are described in detail in Note 2.

194
While maintaining a strategic credit line reserve, E.ON AG
makes arrangements with banks for sufficient liquidity on the
basis of current liquidity planning. The subsidiaries submit
their liquidity requirements to E.ON AG.
2. Price RisksIn the normal course of business, the E.ON Group is exposed
to foreign exchange, interest and commodity price risks, and
also to price risks in equity investments in the context of
cash investment activities. These risks create volatility in
earnings, equity and cash flows from period to period. The
Company makes use of derivative financial instruments in
various strategies to limit or eliminate these risks.
The following discussion of the Company’s risk management
activities and the estimated amounts generated from profit-
at-risk, value-at-risk and sensitivity analyses are “forward-
looking statements” that involve risks and uncertainties.
Actual results could differ materially from those projected due
to actual, unforeseeable developments in the global financial
markets. The methods used by the Company to analyze risks,
as discussed below, should not be considered projections of
future events or losses. The Company also faces risks that are
either non-financial or non-quantifiable. Such risks principally
include country risk, operational risk and legal risk, which
are not represented in the following analyses.
Foreign Exchange Risk ManagementDue to the international nature of some of its business activ-
ities, the E.ON Group is exposed to exchange risks related to
sales, assets, receivables and liabilities denominated in foreign
currencies, investments in foreign operations and anticipated
foreign currency payments. The Company’s exposure results
mainly from transactions in U.S. dollars, British pounds, Hun-
garian forint, Swedish kronor and Russian rubles, and from
net investments in foreign operations.
E.ON AG is responsible for controlling the currency risks to
which the E.ON Group is exposed, and sets appropriate risk
parameters. The subsidiaries are responsible for controlling
their operating currency risks. Recognized assets and liabilities
are generally hedged in the full amount. For unrecognized
firm commitments, hedging takes place after consultation
between the subsidiary and E.ON AG.
The foreign exchange risk arising from net investments in
foreign operations with a functional currency other than the
euro is reduced at Group level as needed through hedges of
net investments. In addition, borrowings are made in foreign
currency to control foreign exchange risks.
In line with the Company’s internal risk-reporting process
and international banking standards, market risk has been
calculated using the value-at-risk method on the basis of his-
torical market data. The value-at-risk (or “VaR”) is equal to
the maximum potential loss (on the basis of a probability of
99 percent) from foreign-currency positions that could be
incurred within the following business day. The calculations
take account of correlations between individual transac-
tions; the risk of a portfolio is generally lower than the sum
of its individual risks.
The one-day value-at-risk from the translation of deposits and
borrowings denominated in foreign currency, plus foreign
currency derivatives, amounted to €148 million (2006: €54 mil-
lion) and, as in 2006, resulted primarily from the open posi-
tions denominated in British pounds and U.S. dollars. The
increase in the VaR over the previous year is due in particular
to the increased volatility of the EUR/GBP exchange rate and
to overall higher volumes denominated in foreign currency.
This VaR has been calculated in accordance with the require-
ments of IFRS 7. In practice, however, another value will result,
since certain underlying transactions (e.g., scheduled trans-
actions and off-balance-sheet own-use agreements) are not
considered in the calculation according to IFRS 7.
Interest Risk ManagementSeveral line items on the Consolidated Balance Sheet and
certain financial derivatives are based on fixed interest rates,
and are therefore subject to changes in fair value resulting
from changes in market rates. In the case of balance sheet
items and financial derivatives based on floating interest
rates, E.ON is exposed to profit risks. E.ON seeks to maintain
a specific mix of fixed- and floating-rate debt in its overall
debt portfolio. The Company uses interest rate swaps in order
to benefit from the spread between short-term and long-
term interest rates and from any potential easing of interest
rates in general.
Notes

195To Our ShareholdersSupervisory Board Year in Review Combined Group Management Report Additional Information Market Units Corporate Governance Consolidated Financial Statements Tables and Explanations
As of December 31, 2007, the E.ON Group has entered into
interest rate swaps with a nominal value of €9,767 million
(2006: €8,371 million).
A sensitivity analysis was performed on the Group’s short-
term and variable-rate borrowings, including interest rate
derivatives. A one-percent increase (decline) in the level of
interest rates would cause net interest expense to rise (fall)
by €30 million per annum (2006: €35 million).
Commodity Price Risk ManagementE.ON is exposed to substantial risks resulting from fluctua-
tions in the prices of commodities, both on the supply and
demand side. This risk is measured based on potential nega-
tive deviation from the target adjusted EBIT.
The maximum permissible risk is determined centrally by the
Board of Management in its medium-term planning and
translated into a decentralized limit structure in coordination
with the market units. Before fixing any limits, the invest-
ment plans and all other known obligations and quantifiable
risks have been taken into account.
E.ON conducts commodity transactions primarily within the
system portfolio, which includes core operations, existing
sales and procurement contracts and any energy derivatives
used for hedging purposes or for power plant optimization.
The risk in the system portfolio thus arises from the open
position between planned procurement and generation and
planned sales volumes. The risk of these open positions is
measured using the profit-at-risk (“PaR”) number, which quanti-
fies the risk by taking into account the size of the open posi-
tion and the prices, the volatility and the liquidity of the under-
lying commodities. PaR is defined as the maximum potential
negative change in the value of the portfolio at a probability
of 95 percent in the event that the open position is closed
as quickly as possible.
The principal derivative instruments used by E.ON to cover
commodity price risk exposures are electricity, gas, coal and
oil swaps and forwards, as well as emissions-related deriva-
tives. Commodity derivatives are used by the market units
for the purposes of price risk management, system optimiza-
tion, equalization of burdens and improvement of margins.
Proprietary trading is permitted only within very tightly defined
limits. The risk metric used for the proprietary trading port-
folio is a five-day value-at-risk with a 95-percent confidence
interval.
The trading limits for proprietary trading as well as for all
other trading activities are established and monitored by
bodies that are independent from trading operations. Limits
used on hedging and proprietary trading activities include
five-day value-at-risk and profit-at-risk numbers, as well as
stop-loss limits. Additional key elements of the risk manage-
ment system are a set of Group-wide commodity risk guide-
lines, the clear division of duties between scheduling, trading,
settlement and controlling, as well as a risk reporting system
independent of the trading operations. Group-wide develop-
ments in commodity risks are reported to the Risk Committee
on a monthly basis.
As of December 31, 2007, the E.ON Group has entered into
electricity, gas, coal, oil and emissions-related derivatives with
a nominal value of €57,204 million (2006: €57,158 million).
The VaR for the proprietary trading portfolio amounted to
€13 million as of December 31, 2007 (2006: €16 million). The
PaR for the financial instruments in the scope of IFRS 7
included in the system portfolio was €433 million as of Decem-
ber 31, 2007 (2006: €289 million).
The restriction to financial instruments included in the scope
of IFRS 7 that has been applied in this calculation does not
reflect the economic position of the E.ON Group. Consequently,
none of the off-balance sheet transactions, such as own-use
contracts under normal trading relationships, may be included
when calculating the PaR according to IFRS 7, even though
such transactions represent a material component of the
economic position. The PaR reflecting the actual economic
position therefore differs significantly from the PaR determined
in accordance with IFRS 7.

196 Notes
Equity RiskThe value of all exchange-traded equity investments on the
balance sheet date was €13,457 million (2006: €12,871 million).
The most significant component of these investments is the
interest in Gazprom, which is valued at €13,061 million (2006:
€11,918 million). This investment is treated as strategic and
is not being hedged at this time. Some additional equity posi-
tions held are hedged using forward transactions. The nomi-
nal volume of these forward transactions totaled €97 million
as of the balance sheet date (2006: €567 million). All exchange-
traded equity investments are classified as available for sale.
Changes in value are generally shown as a change in OCI.
Credit Risk ManagementCredit risk management involves the identification, measure-
ment and control of credit risks. Credit risk results from non-
delivery or partial delivery by a counterparty of the agreed
consideration for services rendered or of payments owing on
existing accounts receivable, and from the additional expenses
for replenishment of the funds thus lost.
In order to minimize credit risk arising from the use of finan-
cial instruments and from operating activities, the Company
enters into transactions only with counterparties that satisfy
the Company’s internally established minimum requirements.
Maximum credit risk limits are set on the basis of internally
established credit quality ratings. The setting and monitoring
of credit limits is subject to certain minimum requirements
applicable throughout the Group. Not included in this process
are long-term contracts arising from the operating activities
and asset management transactions. Some of these are
monitored separately at market unit level.
In principle, the respective Group companies are responsible
for managing the credit risks in their operating activities.
Depending on the nature of the operating activities and the
level of the credit limit, additional credit risk monitoring and
controls take place at both market unit and Group levels.
Monthly reports on the levels of credit limits, and on their uti-
lization by significant counterparties in the areas of financial
and energy trading, are forwarded to the E.ON Risk Committee.
The carrying amounts of primary and derivative financial
assets plus the financial guarantees made represent the
maximum credit risk as of the reference date.
To the extent possible, pledges of collateral are negotiated
with counterparties for the purpose of reducing credit risk.
Accepted as collateral are guarantees issued by the respective
parent companies of counterparties or evidence of profit-
and-loss-pooling agreements in combination with letters of
awareness. To a lesser extent, the Company also requires
bank guarantees and deposits of cash and securities as col-
lateral to reduce credit risk. The levels and backgrounds of
financial assets received as collateral is described in more
detail in Note 26.
Derivative transactions are generally executed on the basis
of standard agreements that allow for the netting of all out-
standing transactions with individual counterparties. For
currency and interest rate derivatives in the banking sector,
this netting option is reflected in the accounting treatment.
Although the greater part of the transactions was completed
on the basis of contracts that do allow netting, the table on
the following page does not show netting of positive and
negative fair values of continuous transactions. Moreover, col-
lateral received is not taken into account. This means that
the counterparty risk is shown to be higher in the following
table than it actually is. The counterparty risk is equal to the
sum of the positive fair values. In summary, as of December 31,
2007, the Company’s derivative financial instruments had the
credit ratings and maturities shown in the table. Because

197To Our ShareholdersSupervisory Board Year in Review Combined Group Management Report Additional Information Market Units Corporate Governance Consolidated Financial Statements Tables and Explanations
derivatives in particular are subject to significant market
fluctuations, short-term concentrations of credit risk may
occur. For that reason, the credit risk concentrations arising
from derivative receivables are shown separately.
Exchange-traded forward and option contracts as well as
emissions-related derivatives having an aggregate nominal
value of €12,200 million as of December 31, 2007, (2006:
€8,182 million) bear no counterparty risk.
Nominalvalue
17,384.4
14,778.1
2,352.0
1,583.9
11,590.8
47,689.2
Counter-party risk
1,000.1
1,229.3
220.9
132.1
141.3
2,723.7
Nominalvalue
16,163.8
10,149.3
948.6
2,647.0
4,706.7
34,615.4
Counter-party risk
901.3
728.3
95.7
47.2
181.6
1,954.1
Nominalvalue
4,926.0
2,427.7
95.4
431.8
3,056.4
10,937.3
Counter-party risk
333.6
73.2
8.9
32.6
64.7
513.0
Nominalvalue
38,474.2
27,355.1
3,396.0
4,662.7
19,353.9
93,241.9
Counter-party risk
2,235.0
2,030.8
325.5
211.9
387.6
5,190.8
Total Up to 1 year 1 to 5 years More than 5 years
1This position consists primarily of parties to contracts with respect to which E.ON has received collateral from counterparties with ratings of the above categories or with an equivalent internal rating.
Rating of Counterparties
in millions
AAA and Aaa through AA– and Aa3
AA– and A1 or A+ and Aa3through A– and A3
A– and Baa1 or BBB+ and A3through BBB– or Baa3
BBB– and Ba1 or BB+ andBaa3 through BB– and Ba3
Other1
Total
Standard & Poor’s and/or Moody’s
December 31, 2007
Nominalvalue
13,592.5
9,319.7
2,181.4
1,196.6
11,125.1
37,415.3
Counter-party risk
941.2
944.5
218.1
111.1
200.3
2,415.2
Nominalvalue
15,000.6
11,607.9
1,084.5
827.3
6,332.5
34,852.8
Counter-party risk
616.8
585.5
61.7
45.3
93.2
1,402.5
Nominalvalue
5,859.2
1,922.1
245.7
8.3
8,024.6
16,059.9
Counter-party risk
383.3
55.1
0.0
0.0
102.4
540.8
Nominalvalue
34,452.3
22,849.7
3,511.6
2,032.2
25,482.2
88,328.0
Counter-party risk
1,941.3
1,585.1
279.8
156.4
395.9
4,358.5
Total Up to 1 year 1 to 5 years More than 5 years
1This position consists primarily of parties to contracts with respect to which E.ON has received collateral from counterparties with ratings of the above categories or with an equivalent internal rating.
Rating of Counterparties
in millions
AAA and Aaa through AA– and Aa3
AA– and A1 or A+ and Aa3through A– and A3
A– and Baa1 or BBB+ and A3through BBB– or Baa3
BBB– and Ba1 or BB+ andBaa3 through BB– and Ba3
Other1
Total
Standard & Poor’s and/or Moody’s
December 31, 2006

198
(32) Transactions with Related Parties
E.ON exchanges goods and services with a large number of
companies as part of its continuing operations. Some of
these companies are related companies accounted for under
the equity method or reported at fair value. Transactions
with related parties are summarized as follows:
Asset Management
For the purpose of financing long-term payment obligations,
including those relating to asset retirement obligations (see
Note 25), financial investments totaling €7.3 billion (2006:
€8.9 billion) were held by companies of the Central Europe
market unit as of December 31, 2007.
These financial assets are invested on the basis of an accu-
mulation strategy (total-return approach), with investments
broadly diversified across money market instruments, bonds,
real estate and equities. Asset allocation studies are per-
formed by external financial advisors at regular intervals to
determine the target portfolio structure. The majority of the
assets are held in investment funds managed by external fund
managers. Risk management for the funds is based on a value-
at-risk method, with the VaR figures derived from a three-
month holding period and a confidence interval of 98 percent.
The VaR determined for 2007 using these parameters was
€202 million (2006: €383 million). Corporate Asset Manage-
ment at E.ON AG, which is part of the Company’s Finance
Department, is responsible for continuous monitoring of
overall risks and those concerning individual fund managers.
At year-end 2007, VKE, which is organized in the form of a
German mutual insurance fund (“Versicherungsverein auf
Gegenseitigkeit”), managed a total of €2.4 billion (2006:
€2.3 billion) in financial assets dedicated almost exclusively
to the coverage of employee retirement benefits in the Cen-
tral Europe market unit. The pension plan assets held by VKE
do not constitute plan assets under IAS 19 and are shown as
both non-current and current assets on the balance sheet.
VKE is subject to the provisions of the Insurance Supervision
Act (“Versicherungsaufsichtsgesetz” or “VAG”) and its opera-
tions are supervised by the German Federal Financial Super-
visory Authority (“Bundesanstalt für Finanzdienstleistungs-
aufsicht” or “BaFin”). Financial investments and continuous
risk management are conducted within the regulatory con-
fines set by BaFin. The majority of the diversified portfolio,
consisting of money market instruments, bonds, real estate
and equities, is held in investment funds managed by exter-
nal fund managers. The 3-month VaR with a confidence
interval of 98 percent for the assets managed by VKE was
€118 million in 2007 (2006: €71 million).
Income from transactions with related companies is gener-
ated mainly through the delivery of gas and electricity to
distributors and municipal entities, especially municipal utili-
ties. The relationships with these entities do not generally
differ from those that exist with municipal entities in which
E.ON does not have an interest.
Expenses from transactions with related companies are
generated mainly through the procurement of gas, coal and
electricity.
Receivables from related companies consist mainly of trade
receivables.
Liabilities of E.ON payable to related companies include
€515 million (2006: €286 million) in trade payables to opera-
tors of jointly-owned nuclear power plants. These payables
bear interest at 1.0 percent per annum (2006: 1.0 percent)
and have no fixed maturity. E.ON procures electricity from
these power plants both under a cost-transfer agreement
and under a cost-plus-fee agreement. The settlement of such
liabilities occurs mainly through clearing accounts. In addition,
E.ON reported financial liabilities in 2007 of €1,233 million
(2006: €1,255 million) resulting from fixed-term deposits under-
taken by the jointly-owned nuclear power plants at E.ON.
Notes
2007
6,626
4,407
1,988
3,116
2006
7,467
3,804
1,892
2,440
in millions
Income
Expenses
Receivables
Liabilities
Related-Party Transactions

199To Our ShareholdersSupervisory Board Year in Review Combined Group Management Report Additional Information Market Units Corporate Governance Consolidated Financial Statements Tables and Explanations
The transfer of E.ON’s minority stake in Degussa into RAG
Projektgesellschaft mbH and the subsequent forward sale of
that company to RAG produced a gain of €596 million in
2006. For additional information, see Note 4.
Under IAS 24, compensation paid to key management person-
nel (i.e., the members of the Board of Management of E.ON AG)
must be disclosed. The total expense for 2007 amounted to
€16.1 million (2006: €16.5 million) in short-term benefits and
€3.0 million (2006: €3.3 million) in post-employment benefits.
The service cost of post-employment benefit is equal to the
service cost of the provisions for pensions.
The expense determined in accordance with IFRS 2 for the
tranches of the E.ON SAR Program and the E.ON Share Per-
formance Plan in existence in 2007 was €11.4 million (2006:
€17.7 million).
Detailed and individualized information on compensation can
be found on pages 117 through 121 of the Compensation Report.
(33) Segment Information
The reportable segments of the E.ON Group are presented in
line with the Company’s internal organizational and reporting
structure.
• The Central Europe market unit focuses on E.ON’s inte-
grated electricity business and the downstream gas
business in central Europe.
• Pan-European Gas is responsible for the upstream and
midstream gas business. Additionally, this market unit
holds a number of minority shareholdings in the down-
stream gas business.
• The U.K. market unit encompasses the integrated energy
business in the United Kingdom.
• The Nordic market unit is concentrated on the integrated
energy business in Northern Europe.
• The U.S. Midwest market unit is primarily active in the
regulated energy market in the U.S. state of Kentucky.
• Corporate Center/New Markets contains those interests
managed directly by E.ON AG that have not been allocated
to any of the other segments, including the operations
acquired in 2007 in Russia and in the area of renewable
energy (see also Note 4), as well as E.ON AG itself and
consolidation effects at the Group level.
Under IFRS segments or material business units that have
been sold or are held for sale must be reported as discontinued
operations. In 2007, this includes WKE, which is held for sale.
In 2006, E.ON Finland and Degussa, which had been sold in
June and August of 2006 respectively, were reported as dis-
continued operations along with WKE. The corresponding
figures as of December 31, 2007, as well as those for the pre-
ceding period, have been adjusted for all components of the
discontinued operations (see explanations in Note 4).
Adjusted EBIT is used as the key figure at E.ON for purposes
of internal management control and as an indicator of a
business’s long-term earnings power. Adjusted EBIT is derived
from income/loss before interest and taxes and adjusted to
exclude certain special items. The adjustments include adjusted
net interest income, net book gains, cost-management and
restructuring expenses, and other non-operating income and
expenses.
Adjusted net interest income is calculated by taking the net
interest income shown in the income statement and adjust-
ing it using economic criteria and excluding certain special
items, i.e., the portions of interest expense that are non-oper-
ating. Net book gains are equal to the sum of book gains
and losses from disposals, which are included in other oper-
ating income and other operating expenses. Cost-manage-
ment and restructuring expenses are non-recurring in nature.
Other non-operating earnings encompass other non-operat-
ing income and expenses that are unique or rare in nature.
Depending on the case, such income and expenses may affect
different line items in the income statement. For example,
effects from the marking to market of derivatives are included
in other operating income and expenses, while impairment
charges on property, plant and equipment are included in
depreciation, amortization and impairments.
Due to the adjustments, the key figures by segment may
differ from the corresponding IFRS figures reported in the
Consolidated Financial Statements.

200
The following table shows the reconciliation of adjusted
EBIT to net income as reported in the IFRS Consolidated
Financial Statements:
Net book gains in 2007 increased by €516 million over the
previous year. As in 2006, they were generated primarily
from the sale of securities at the Central Europe market unit.
In 2007, cost-management and restructuring expenses arose
primarily in the U.K. market unit’s retail customer business.
In 2006 there were no cost-management and restructuring
expenses.
Other non-operating earnings resulted primarily from the
marking to market of derivatives (€564 million) used to pro-
tect the operating businesses from fluctuations in prices.
This improvement was attributable primarily to gains of
€2.5 billion at the U.K. and Pan-European Gas market units.
Notes
in millions
Adjusted EBIT
Adjusted interest income (net)
Net book gains
Restructuring expenses
Other non-operating earnings
Income/Loss from continuing operations before taxes
Income taxes
Income/Loss from continuing operations
Income/Loss from discontinuedoperations, net
Net incomeAttributable to shareholders of E.ON AGAttributable to minority interests
2007
9,208
–960
1,345
–77
167
9,683
–2,289
7,394
330
7,7247,204
520
2006
8,356
–948
829
–
–2,890
5,347
–40
5,307
775
6,0825,586
496
Net Income
in millions
External sales
Intersegment sales
Sales
Adjusted EBITDA
Depreciation and amortization
Impairments1
Adjusted EBITEarnings from companies accountedfor under the equity method1
Cash provided by operating activities
InvestmentsIntangible assets and property, plantand equipmentEquity investments2
Total assetsIntangible assetsProperty, plant and equipmentCompanies accounted for under the equity method
2007
31,350
679
32,029
6,222
–1,521
–31
4,670
317
3,811
2,581
2,390191
63,4421,889
18,375
2,134
Financial Information by Business Segment
2006
26,384
813
27,197
5,747
–1,495
–17
4,235
315
3,802
2,279
1,883396
59,0931,965
17,664
1,962
2007
19,714
3,031
22,745
3,176
–530
–70
2,576
696
3,041
2,424
1,3811,043
39,0901,1376,746
5,602
2006
20,555
2,392
22,947
3,092
–502
–243
2,347
536
604
882
377505
36,994867
6,289
5,276
2007
12,455
129
12,584
1,657
–521
–
1,136
24
1,615
1,364
1,364–
18,170675
7,506
2
2006
12,355
163
12,518
1,804
–554
–11
1,239
6
724
863
8603
19,636793
7,157
8
Central Europe Pan-European Gas U.K.
1Impairments recognized in adjusted EBIT differ from the relevant amounts reported in accordance with IFRS due to impairments on equity-method companies and other financialassets, which under IFRS are included in income/loss (–) from companies accounted for under the equity method and financial results, respectively. In 2007, differences resultedprimarily from impairment charges and reversals recognized on equity investments. In 2006, differences were primarily due to impairments stemming from regulation on property,plant and equipment and on equity investments at the Central Europe and Pan-European Gas market units.
2In addition to those accounted for using the equity method, equity investments also include acquisitions of fully consolidated companies and investments in equity holdingsthat need not be consolidated.

201To Our ShareholdersSupervisory Board Year in Review Combined Group Management Report Additional Information Market Units Corporate Governance Consolidated Financial Statements Tables and Explanations
These gains were offset by costs associated with the attempted
acquisition of Endesa (€288 million) and the severe storm in
Sweden at the beginning of 2007 (€95 million). In 2006, the
reduction of network charges enforced by the German Fed-
eral Network Agency (“Bundesnetzagentur”) resulted in impair-
ment charges totaling €374 million at the Central Europe
and Pan-European Gas market units in the gas distribution
networks and in minority shareholdings with activities in the
area of networks. Moreover, additional impairments had to
be recorded for gas storage facilities and CHP plants at the
U.K. market unit (€187 million), as well as for property, plant
and equipment at the Pan-European Gas and Nordic market
units (€100 million in total).
An additional adjustment to the internal profit analysis
relates to interest income, which is adjusted on an economic
basis. Adjusted net interest income is calculated by taking
the net interest income shown in the income statement and
adjusting it using economic criteria and excluding certain
special (i.e., non-operating) items.
Adjusted net interest income is largely unchanged from 2006.
Compared with 2006, net interest and similar expenses
decreased primarily due to increases in expected returns on
plan assets. This is offset at Group level by an increase in net
non-operating interest income. The positive change in non-
operating interest income is due to reduced interest expense
incurred in conection with put options.
Transactions within the E.ON Group are generally effected at
market prices.
2007
3,216
123
3,339
1,027
–345
–12
670
10
914
914
89222
11,759213
7,429
357
2007
1,819
–
1,819
543
–155
–
388
23
216
690
690–
8,13013
4,153
32
2006
1,930
–
1,930
595
–163
–6
426
21
381
398
398–
8,38720
4,000
40
2007
177
–3,962
–3,785
–175
–51
–6
–232
8
–871
3,333
1993,134
–3,297357
4,343
284
2006
127
–3,455
–3,328
–385
–14
–4
–403
–10
935
–27
–14–13
–7,82520
190
101
2007
68,731
–
68,731
12,450
–3,123
–119
9,208
1,078
8,726
11,306
6,9164,390
137,2944,284
48,552
8,411
2006
64,091
–
64,091
11,724
–3,087
–281
8,356
869
7,161
5,037
4,096941
127,5753,894
42,484
7,770
2006
2,740
87
2,827
871
–359
–
512
1
715
642
59250
11,290229
7,184
383
Nordic U.S. Midwest Corporate Center/New Markets E.ON Group
in millions
Interest and similar expenses (net) as shown in the ConsolidatedStatements of Income
Non-operating interest expense (+)/income (–)
Adjusted interest income (net)
2007
–951
–9
–960
2006
–1,045
97
–948
Adjusted Interest Income (Net)

202
Geographic Segmentation
The following table details external sales (by location of
customers and by location of seller) and property, plant and
equipment information by geographic area:
Information on Major Customers and Suppliers
E.ON’s customer structure in 2007 and 2006 did not result in
any major concentration in any given geographical region or
business area. Due to the large number of customers the
Company serves and the variety of its business activities, there
are no individual customers whose business volume is mate-
rial compared with the Company’s total business volume.
Gas is procured primarily from Russia, Norway, Germany, the
Netherlands and the United Kingdom.
Notes
in millions
External sales bylocation of customer
External sales bylocation of seller
Property, plant andequipment
2007
36,895
40,614
18,898
2006
34,929
38,942
18,380
2007
25,520
23,518
23,107
2006
23,431
21,168
18,999
2007
4,491
2,780
1,573
2006
3,783
2,051
1,104
Germany Europe (other)Europe (euro areaexcluding Germany)
2007
68,731
68,731
48,552
2006
64,091
64,091
42,484
2007
56
51
64
2006
64
51
73
Other
2007
1,769
1,768
4,910
2006
1,884
1,879
3,928
United States Total
Geographic Segment Information

203To Our ShareholdersSupervisory Board Year in Review Combined Group Management Report Additional Information Market Units Corporate Governance Consolidated Financial Statements Tables and Explanations
(34) Compensation of Supervisory Board and Boardof Management
Supervisory Board
Provided that E.ON’s shareholders approve the proposed div-
idend at the Annual Shareholders Meeting on April 30, 2008,
total remuneration to members of the Supervisory Board will
be €4.5 million (2006: €4.1 million).
There were no loans to members of the Supervisory Board in
2007.
The Supervisory Board’s compensation structure and the
amounts for each member of the Supervisory Board are pre-
sented on pages 117 through 121 of the Compensation Report,
which is part of the Combined Group Management Report.
Additional information regarding members of the Supervisory
Board is provided on pages 19 and 212.
Board of Management
Total remuneration to members of the Board of Management
in 2007 amounted to €20.4 million (2006: €21.7 million). This
consisted of base salary, bonuses, other compensation elements
and share-based payments.
Total payments to former members of the Board of Manage-
ment and their beneficiaries amounted to €6.6 million (2006:
€11.7 million). Provisions of €97.4 million (2006: €99.9 million)
have been established for the pension obligations to former
members of the Board of Management and their beneficiaries.
There were no loans to members of the Board of Management
in the 2007 fiscal year.
The Board of Management’s compensation structure and the
amounts for each member of the Board of Management are
presented on pages 117 through 121 of the Compensation
Report, which is part of the Combined Group Management
Report.
Additional information regarding members of the Board of
Management is provided on pages 14, 15 and 213.
(35) E.ON Group IFRS Reconciliations
Explanatory Notes Concerning the Transition ofGroup Accounting Policies to International FinancialReporting Standards (IFRS)
E.ON has prepared its first Consolidated Financial Statements
in accordance with IFRS for the year ended December 31,
2007. The effective date of the E.ON Group’s IFRS Consolidated
Opening Balance Sheet is January 1, 2006 (the date of transi-
tion to IFRS according to IFRS 1).
According to IFRS 1, the first IFRS Consolidated Financial
Statements must use recognition and measurement princi-
ples that are based on standards and interpretations that
are mandatory at December 31, 2007, the date of first-time
preparation of Consolidated Financial Statements according
to IFRS, provided these have been published effective Decem-
ber 31, 2007, and adopted by the EU. These accounting and
measurement principles must be applied retrospectively to
the date of transition to IFRS and for all periods presented
within the first IFRS Consolidated Financial Statements.
Any resulting differences between the carrying amounts of
assets and liabilities according to IFRS as of January 1, 2006,
compared with those presented in the U.S. GAAP Consolidated
Balance Sheet as of December 31, 2005, were recognized in
equity within the IFRS opening balance sheet.
As provided for by IFRS 1, E.ON has applied the mandatory
exceptions as well as certain optional exemptions described
in the following text to the retrospective application of IFRS.
Explanation of the IFRS 1 Exemptions Applied by E.ON
In the IFRS Consolidated Opening Balance Sheet as of Janu-
ary 1, 2006, the carrying amounts of assets and liabilities
from the U.S. GAAP balance sheet as of December 31, 2005,
are generally recognized and measured according to those
IFRS regulations in effect on December 31, 2007. For certain
individual cases, however, IFRS 1 provides for optional exemp-
tions to the general principle of retrospective application of
IFRS. The following discussion describes the exemptions that
E.ON has made use of in preparing its IFRS Consolidated
Opening Balance Sheet.
Business CombinationsE.ON has elected to utilize the option under IFRS 1 not to
apply the provisions of IFRS 3 retrospectively to business
combinations that took place prior to the transition to IFRS.
The presentation of these business combinations according
to U.S. GAAP was maintained. In general, all of those assets
and liabilities that were acquired in a business combination
and that fulfill the IFRS recognition criteria must be recognized

Notes204
in millions
Equity under U.S. GAAP
Changes in the presentation of minority interests
Equity under U.S. GAAP, including minority interests
Effects of IAS 32
Inventories
Pensions and similar obligations
Miscellaneous provisions
Derivatives
Valuation of available-for-sale financial instruments
U.S. regulation
Income taxes
Other
Total adjustments
Equity under IFRS
Reference
a
b
c
d
e
f
g
h
i
j
December 31, 2006
47,845
4,917
52,762
–2,780
348
–81
–129
226
370
279
223
27
–1,517
51,245
January 1, 2006
44,484
4,734
49,218
–3,249
134
–1,391
–43
–566
377
403
800
286
–3,249
45,969
Reconciliation of Equity
in the IFRS consolidated opening balance sheet. Furthermore
assets and liabilities that were not recognized under U.S. GAAP
but are subject to recognition under IFRS are recognized in
the IFRS opening balance sheet. Any resulting adjustment
amounts are recognized in retained earnings with no effect
on net income unless they pertain to intangible assets
whereby an adjustment of the goodwill determined under
U.S. GAAP would be required. As no adjustment for intangi-
ble assets was required relating to such business combina-
tions, the goodwill previously reported under U.S. GAAP was
maintained in E.ON’s opening balance sheet under IFRS.
Goodwill must be tested for impairment at the time of tran-
sition to IFRS. No impairment was determined by E.ON at the
time of transition.
Cumulative Translation DifferencesE.ON has elected to utilize the exemption provided for under
IFRS 1 whereby the unrealized cumulative translation differ-
ences resulting from the translation of financial statements
into the reporting currency of E.ON and previously reported
within other comprehensive income may be recognized in
full within equity at the time of transition to IFRS.
In a subsequent disposal of an enterprise, only those foreign
currency translation differences that were recognized in
equity after the preparation of the opening balance sheet
are recognized in the gain or loss on disposal.
Significant Effects of Transition from U.S. GAAP toIFRSThe following reconciliations and their associated explanatory
notes provide an overview of the effects of transition to IFRS.
The adjustments are presented in the following sections:
• Equity as of January 1, 2006
• Equity as of December 31, 2006
• Net income for the fiscal year from January 1, 2006,
through December 31, 2006
Reconciliation of Equity

205To Our ShareholdersSupervisory Board Year in Review Combined Group Management Report Additional Information Market Units Corporate Governance Consolidated Financial Statements Tables and Explanations
a) Changes in the Presentation of Minority InterestsUnder IFRS, minority interests of third parties in the Group
are reported as part of equity. Under U.S. GAAP, minority
interests are reported separately from shareholders’ equity.
b) Effects of IAS 32Put Options on Minority InterestsFinancial instruments for which a right of repayment exists
for the investor do not constitute equity instruments under
the IFRS definition of equity. E.ON has made conditional and
unconditional commitments to certain minority shareholders
to acquire the outstanding shares. As a result, a liability in
the amount of the present value of the future exercise price
must be reported. This reclassification from equity is irrespec-
tive of the probability of exercise and is reported separately
within minority interests.
Under U.S. GAAP, these potential commitments are generally
reported similar to derivatives at fair value.
Minority Interests in German PartnershipsUnder German corporate law, shareholders of a German
partnership have a statutory, non-excludable right of termi-
nation. Under IAS 32, this right of termination causes the
minority interests in the Group to be considered repayable.
Accordingly, a corresponding liability at the present value of
the expected settlement amount must be reclassified from
equity, irrespective of the probability of exercise. The reclas-
sification is reported separately within minority interests.
Under U.S. GAAP, these partnership interests are shown
under minority interests.
In total, these effects resulted in a reduction in equity of
€3,249 million within the opening balance sheet (December 31,
2006: –€2,780 million).
c) InventoriesUnder U.S. GAAP, gas inventories were generally measured at
LIFO. Under IAS 2, “Inventories” (“IAS 2”), this measurement
method is not allowed. The adjustment to average-cost
measurement of gas inventories resulted in an increase in
equity of €134 million within the opening balance sheet
(December 31, 2006: €348 million).
d) Pensions and Similar ObligationsBoth U.S. GAAP and IFRS require the formation of provisions
for pension obligations. Differences in the opening balance
sheet in the values recognized under IAS 19, and SFAS No. 87,
“Employers’ Accounting for Pensions” (“SFAS 87”), resulted in
particular from the election to recognize all cumulative actu-
arial gains and losses in equity under IFRS. As part of the
transition, the intangible pension asset and the prepaid pen-
sion asset as well as the additional minimum liability were
eliminated. As a result, equity decreased by €1,391 million
within the opening balance sheet (December 31, 2006: –€81 mil-
lion). The further decline by December 31, 2006, is predomi-
nantly due to the first-time application of SFAS 158, “Employ-
ers’ Accounting for Defined Benefit Pension and Other
Postretirement Plans—an amendment of FASB Statements
No. 87, 88, 106, and 132(R)“ (“SFAS 158”), which also requires
recognition of actuarial gains and losses within equity.
e) Miscellaneous ProvisionsUnder IFRS, long-term provisions must generally be discounted
at the market interest rate applicable as of the respective
balance sheet date if the effect resulting from discounting
(the difference between present value and repayment amount)
is material. In contrast, U.S. GAAP sets more stringent require-
ments with regard to discountability, with the result that
under IFRS, more provisions are recognized at their lower
present values.
A further difference exists with regard to the subsequent
measurement of provisions for asset retirement obligations.
Under both U.S. GAAP and IFRS, the acquisition or production
costs of property, plant and equipment must be increased to
include future asset retirement cost. The increased amount
is amortized over the useful life of the corresponding asset.
Each subsequent remeasurement of the provision under
IFRS leads to an increase or a reduction of the entire cost of
the asset to be decommissioned, while a remeasurement
under U.S. GAAP leads to an increase or a reduction of only
the asset retirement cost. Remeasurements of this type only
affect the income statement if a reduction of the provision

Notes206
causes the carrying amount of the corresponding asset (or,
under U.S. GAAP, the asset retirement cost portion) to be
reduced to zero; in this case, each further reduction of the
provision is recognized in income. As a consequence of the
different definitions of the corresponding asset items, remea-
surements of asset retirement obligations are less frequently
recognized within the income statement under IFRS than
under U.S. GAAP.
A further reduction in equity resulted from the different
treatment of the bonus features (”Aufstockungsbeträge”) of
early retirement arrangements under IFRS.
In total, the differences in the accounting for other provisions
resulted in a reduction in equity of €43 million within the
opening balance sheet (December 31, 2006: –€129 million).
f) DerivativesFurther differences exist with regard to the definition of a
derivative. Under U.S. GAAP, there are industry-specific
exceptions for power-plant-specific supply contracts that
are unknown under IFRS. This means that the definition of
a derivative encompasses more contracts under IFRS.
In the case of embedded derivatives in certain supply and
sale contracts, IFRS provides for the possibility of measuring
only the embedded derivative, while reporting the non-deriv-
ative portion as a pending transaction. This is an exception
for own-use contracts. Under U.S. GAAP, the existence of an
embedded derivative in these contracts gives rise to fair value
reporting through income for the contract as a whole. Further
effects arise from differences in the definition of a derivative
with regard to future settlement and market liquidity.
In total, these effects resulted in a reduction in equity of
€566 million within the opening balance sheet (December 31,
2006: increase of €226 million).
g) Valuation of Available-for-Sale FinancialInstrumentsUnder U.S. GAAP, non-marketable equity instruments are
accounted for at cost. Under IFRS, all equity instruments must
be reported at fair value to the extent that the fair value can
be reliably determined. This applies even if an exchange quo-
tation or another publicly available market price does not exist.
Unrealized gains and losses from available-for-sale financial
instruments, with the exception of impairment charges are
reported in equity and reclassified when realized. The fair
value measurement of available-for-sale equity instruments
resulted in an increase in equity of €377 million within the
opening balance sheet (December 31, 2006: €370 million).
h) U.S. RegulationAccounting for E.ON’s regulated utility businesses, Louisville
Gas and Electric Company, Louisville, Kentucky, U.S., and Ken-
tucky Utilities Company, Lexington, Kentucky, U.S., of the U.S.
Midwest market unit, conforms to U.S. generally accepted
principles as applied to regulated public utilities in the United
States of America. These entities are subject to SFAS No. 71,
“Accounting for the Effects of Certain Types of Regulation”
(“SFAS 71”), under which certain costs that would otherwise
be charged to expense are deferred as regulatory assets
based on expected recovery of such costs from customers in
future rates approved by the relevant regulator. Likewise,
certain credits that would otherwise be reflected as income
are deferred as regulatory provisions. The current or expected
recovery by the entities of deferred costs and the expected
return of deferred credits is generally based on specific
ratemaking decisions or precedent for each item. The regula-
tory assets and liabilities under U.S. GAAP do not fulfill the
recognition criteria for assets and liabilities under IFRS. As a
result, these regulatory assets and liabilities were offset
against equity and resulted in an increase in equity of €403 mil-
lion within the opening balance sheet (December 31, 2006:
€279 million).
i) Income TaxesThe adjustments described above result in changes in tempo-
rary differences between IFRS carrying amounts and tax-basis
values and, accordingly, to changes in deferred taxes, that
are different from those under U.S. GAAP.
Furthermore, under IAS 12, deferred taxes arising from invest-
ments in subsidiaries and associates (outside basis differences)
are not recognized to the extent that the investor is able to
control the timing of the reversal of the temporary difference
and to the extent that it is probable that the temporary dif-
ferences will not reverse in the foreseeable future.
In total, these effects resulted in an increase in equity within
the opening balance sheet of €800 million (December 31, 2006:
€223 million).
j) OtherLeasingIn a manner analogous to EITF 01-8, “Determining Whether
an Arrangement Contains a Lease” (“EITF 01-8”), IFRIC 4 pro-
vides for the reporting of embedded leases. IFRIC 4 requires
retrospective application whereas the equivalent provisions
of EITF 01-8 under U.S. GAAP had to be applied prospectively
as of May 28, 2003. The positive effect of this application on
equity amounted to €90 million within the opening balance
sheet (December 31, 2006: €125 million).

207To Our ShareholdersSupervisory Board Year in Review Combined Group Management Report Additional Information Market Units Corporate Governance Consolidated Financial Statements Tables and Explanations
Change in Scope of ConsolidationOne gas storage company in the Pan-European Gas market
unit must be additionally consolidated under IFRS. The obli-
gation to consolidate arises from SIC Interpretation 12, “Con-
solidation—Special Purpose Entities” (“SIC 12”), since E.ON
has a right to obtain the majority of this company’s benefits
and is thereby exposed to the majority of its business risks.
The U.S. GAAP criterion of asymmetric distribution of oppor-
tunities and risks under Financial Accounting Standards
Board (“FASB”) Interpretation (“FIN”) No. 46 (revised Decem-
ber 2003), “Consolidation of Variable Interest Entities, an
Interpretation of ARB No. 51” (“FIN 46R”), is not met. More-
over, there are significant protective rights for minority
shareholders, meaning that control in the context of U.S. GAAP
is not present. The consolidation of the gas storage company
resulted in an increase in equity of €81 million in the opening
balance sheet (December 31, 2006: €70 million).
ImpairmentUnder U.S. GAAP, the first step in the impairment testing of
property, plant and equipment and intangible assets is to
determine whether the carrying amount of the asset or group
of assets being tested may not be recoverable. The carrying
amount is not recoverable if it exceeds the estimated future
undiscounted cash flows arising from the use of the asset or
group of assets tested. In such a case, the second step is to
recognize an impairment charge in the amount of the differ-
ence between the previous carrying amount and the lower
fair value. Under IFRS no two-step approach exists. The carry-
ing amount of the asset being tested is compared with its
recoverable amount, which is the higher of an asset’s value
in use and its fair value less costs to sell. If the carrying
amount exceeds the corresponding recoverable amount, an
impairment charge is recognized in the amount of the dif-
ference. In the fourth quarter of 2006, impairment charges in
the amount of €186 million were recognized in accordance
with IFRS on property, plant and equipment and intangible
assets at the U.K. market unit. No impairment was necessary
under U.S. GAAP because the undiscounted cash flows
exceeded the carrying amounts of the assets. As of Decem-
ber 31, 2006, this resulted in a decrease in equity under IFRS
of €186 million.
DegussaFurthermore, the conversion to IFRS of E.ON’s interest in
Degussa within the opening balance sheet, as well as the
subsequent related impacts during 2006 from the application
of the equity method and the accounting for the disposal
of Degussa under IFRS, resulted in a reduction in equity of
–€31 million (December 31, 2006: –€142 million).
Reconciliation of Net Income
in millions
Net income under U.S. GAAP
Changes in the presentation of minority interests
Net income under U.S. GAAP, including minority interests
Effects of IAS 32
Inventories
Pensions and similar obligations
Miscellaneous provisions
Derivatives
Valuation of available-for-sale financial instruments
U.S. regulation
Income taxes
Other
Total adjustments
Net income under IFRS
Reference
a
b
c
d
e
f
g
h
i
j
2006
5,057
526
5,583
–121
214
118
–78
791
–55
9
–363
–16
499
6,082
Reconciliation of Net Income

Notes208
a) Changes in the Presentation of Minority InterestsConsistent with the change in presentation within the bal-
ance sheet, minority interests are reported directly in equity
under IFRS as part of the allocation of earnings. Under U.S.
GAAP, minority interests in earnings are reported within the
calculation of net income.
b) Effects of IAS 32Put Options on Minority InterestsFinancial instruments for which a right of repayment exists do
not constitute equity instruments under the IFRS definition
of equity. E.ON has made conditional and unconditional repur-
chase offers to certain minority shareholders to acquire the
outstanding shares. Correspondingly, a liability in the amount
of the present value of the future exercise price must be
reported, irrespective of the probability of exercise. The accre-
tion expense for the liability is shown in interest income. The
minority interest remains part of the earnings allocation
reported directly within equity under IFRS.
Under U.S. GAAP, these potential commitments are generally
reported at fair value similar to derivatives. Minority interests
are included in the calculation of net income.
Minority Interests in German PartnershipsUnder German corporate law, shareholders of a German
partnership have a statutory, non-excludable right of termi-
nation. Under IAS 32, this right of termination causes the
minority interests in the Group to be considered repayable.
Accordingly, a corresponding liability in the present value of
the expected settlement amount must be reclassified from
minority interests. The shares in earnings to which the
minority shareholders are entitled as well as the accretion
expense for the liability must be shown as interest expense.
Other changes in the value of the liability are reported as
other operating income and expenses.
Under U.S. GAAP, these partnership interests are shown under
minority interests. The share in earnings to which these
minority shareholders are entitled is still shown as minority
interests in earnings and included in the calculation of net
income.
These effects resulted in a decrease of net income by €121
million for the year ended December 31, 2006.
c) InventoriesThe adjustment from LIFO measurement of gas inventories
as was generally applied under U.S. GAAP to average-cost
measurement under IFRS resulted in an increase in net
income of €214 million for the year ended December 31, 2006.
d) Pensions and Similar ObligationsE.ON has elected the option under IAS 19 to recognize all
actuarial gains and losses within equity with no further
amortization through net income as required under U.S. GAAP.
As a result, net income increased by €118 million for the year
ended December 31, 2006.
e) Miscellaneous ProvisionsThe differences in the accounting treatment miscellaneous
of provisions described in connection with the reconciliation
of equity resulted in a reduction in net income of €78 million
for the 2006 fiscal year. The increased charge as of the end
of the fiscal year is primarily due to early retirement agree-
ments at the Central Europe market unit.
f) DerivativesUnder U.S. GAAP, there are industry-specific exceptions for
power-plant-related supply contracts that are unknown
under IFRS. This means that the definition of a derivative
encompasses more contracts under IFRS.
In the case of embedded derivatives in certain supply and
sale contracts, IFRS provides for the possibility of measuring
only the embedded derivative, while reporting the non-deriv-
ative portion as a pending transaction. Under U.S. GAAP, the
existence of an embedded derivative in these contracts gives
rise to fair value reporting through income for the contract
as a whole. Further effects arise from the definition of a
derivative with regard to net settlement and market liquidity.
The total increase in net income for the year ended Decem-
ber 31, 2006, attributable to these circumstances was
€791 million.

209To Our ShareholdersSupervisory Board Year in Review Combined Group Management Report Additional Information Market Units Corporate Governance Consolidated Financial Statements Tables and Explanations
g) Valuation of Available-for-Sale FinancialInstrumentsUnder IFRS, the foreign currency translation effects from
monetary financial instruments classified as available-for-
sale are recognized in income to the extent to which they
are related to acquisition costs. Under U.S. GAAP, these
effects are classified as other comprehensive income, along
with all other changes in fair value. For the year ended
December 31, 2006, this resulted in a decrease in net income
of €55 million.
h) U.S. RegulationThe regulatory assets and liabilities under U.S. GAAP do not
fulfill the recognition criteria for assets and liabilities under
IFRS. Immediate recognition in the income statement of the
resulting income and expenses resulted in an increase in net
income of €9 million for the year ended December 31, 2006.
i) Income TaxesDuring the 2006 fiscal year, the above deviations in income,
particularly with respect to pensions, resulted in changes of
deferred taxes that reduced net income.
Furthermore, under IAS 12, deferred taxes arising from invest-
ments in subsidiaries and associates (outside basis differences)
are not recognized to the extent that the investor is able to
control the timing of the reversal of the temporary difference
and to the extent that it is probable that the temporary
differences will not reverse in the foreseeable future. In
comparison with U.S. GAAP, this resulted in an increase in
net income under IFRS.
Overall the changes in income taxes resulted in a reduction
of net income during the year ended December 31, 2006, of
€363 million.
j) OtherA further difference results from the conversion to IFRS of
E.ON’s interest in Degussa both with respect to the equity
results as well as the book gain calculated upon disposal in
2006. The conversion led to an increase in net income of
€205 million for the year ended December 31, 2006. This was
offset by an impairment charge of €186 million at the U.K. mar-
ket unit recognized only under IFRS in the fourth quarter 2006.
Cash Flow AdjustmentsAs a result of the conversion to IFRS, E.ON’s 2006 cash flows
from operating, investing and financing activities were adjusted
from their U.S. GAAP amounts by –€33 million, +€44 million
and –€11 million, respectively. These minor adjustments result
from differences in the scope of consolidation and the
accounting treatment of lease arrangements in accordance
with IFRIC 4.

210 Declaration of the Board of Management
To the best of our knowledge, and in accordance with appli-
cable financial reporting principles, the Consolidated Financial
Statements give a true and fair view of the assets, liabilities,
financial position and profit or loss of the Group, and the
Group Management Report, which has been combined with
the management report for E.ON AG, provides a fair review
of the development and performance of the business and
the position of the E.ON Group, together with a description
of the principal opportunities and risks associated with the
expected development of the Group.
Düsseldorf, February 19, 2008
The Board of Management
Bernotat Bergmann Dänzer-Vanotti
Feldmann Schenck Teyssen

211To Our ShareholdersSupervisory Board Year in Review Combined Group Management Report Additional Information Market Units Corporate Governance Consolidated Financial Statements Tables and Explanations
Tables and Overviews
Additional Explanations Concerning the IFRSReconciliations
In addition to the explanations in Note 35 concerning the
reconciliation of equity and net income, the following
describes the effects of the transition to IFRS on other
important key financial figures.
The increase in adjusted EBIT according to IFRS is primarily
due to the change in measurement of gas inventories from
LIFO under U.S. GAAP to average-cost measurement under
IFRS. An additional positive effect results from the reduction
compared with U.S. GAAP of the expense for pensions, which
is primarily due to the elimination of the amortization of
actuarial gains and losses in the income statement. The
immediate recognition in income of U.S. regulatory assets
and liabilities recognized in accordance with U.S. GAAP with-
in the U.S. Midwest market unit also led to an increase in
adjusted EBIT.
These positive effects were offset in 2006 by the negative
impact of differences in the accounting for miscellaneous
provisions. As required under IFRS, the adjusted EBIT of the
“other activities” which was attributable to the equity earn-
ings of E.ON’s share in Degussa under U.S. GAAP, has been
reclassified to discontinued operations.
For a detailed explanation of these effects, see the description
in Note 35 of the reconciliation of equity and net income.
Reconciliation of Adjusted Net IncomeThe following table describes the reconciliation from U.S. GAAP
to IFRS of adjusted net income for the 2006 fiscal year:
in millions
Adjusted EBIT under U.S. GAAP2
Inventories
Pensions and similar obligations
Miscellaneous provisions
Derivatives
U.S. regulation
Other
Total adjustments
Adjusted EBIT under IFRS
CentralEurope
4,168
1
102
33
–
–
–69
67
4,235
Pan-European
Gas
2,106
213
9
–7
–
–
26
241
2,347
U.S. Mid-west
391
–
3
–
–
32
–
35
426
CorporateCenter
–416
–
8
–3
–
–
8
13
–403
U.K.
1,229
–
6
–
8
–
–4
10
1,239
Nordic
619
–
–
–107
–
–
–
–107
512
E.ONGroup
8,150
214
128
–84
8
32
–92
206
8,356
CoreEnergy
Business
8,097
214
128
–84
8
32
–39
259
8,356
Otheractivities1
53
–
–
–
–
–
–53
–53
0
Reconciliation of Adjusted EBIT 2006
Reconciliation of Adjusted EBITThe reconciliation of adjusted EBIT from U.S. GAAP to IFRS
for the year ended December 31, 2006, is presented in the
following tables:
in millions
Adjusted net income under U.S. GAAP1
Differences in EBIT
Adjusted interest income (net)
Income taxes
Minority interests
Total adjustments
Adjusted net income under IFRS
2006
4,386
206
133
–73
30
296
4,682
Reconciliation of Adjusted Net Income
1Non-GAAP financial measure; see reconciliation in 2006 Annual Report, page 37.
The definition and reconciliation of net income to adjusted
net income under IFRS is presented on page 40.
In addition to the differences in adjusted EBIT, the increase
in 2006 of adjusted net income as compared with U.S. GAAP
is due primarily to the differences in adjusted interest income,
which result mainly from the differences in the accounting
treatment of miscellaneous provisions, which are described in
Note 35.
1Included in the other activities under U.S. GAAP was the 42.9 percent interest in Degussa accounted for at equity until its disposal in July 2006.2Non-GAAP financial measure; see reconciliation in 2006 Anual Report, page 36.

Other Directorships212
Information as of December 31, 2007, or as of the date on which membership in the E.ON Supervisory Board ended.• Directorships/supervisory board memberships within the meaning of Section 100, Paragraph 2 of the German Stock Corporation Act.• Directorships/memberships in comparable domestic and foreign supervisory bodies of commercial enterprises.
Ulrich HartmannChairman
• Deutsche Bank AG
• Deutsche Lufthansa AG
• IKB Deutsche Industriebank AG
(Chairman)
• Münchener Rückversicherungs-
Gesellschaft AG
• Henkel KGaA
Hubertus SchmoldtChairman of the Board of Management,
Industriegewerkschaft Bergbau,
Chemie, Energie
Deputy Chairman
• Bayer AG
• Deutsche BP AG
• RAG Aktiengesellschaft
• Evonik Industries AG
• DOW Olefinverbund GmbH
Dr. Karl-Hermann Baumann• Linde AG
• Bayer Schering Pharma AG
Sven Bergelin (since August 1, 2007)
Director, National Energy Working Group,
Unified Service Sector Union, ver.di
• E.ON Avacon AG
• E.ON Kernkraft GmbH
Dr. Rolf-E. Breuer• Landwirtschaftliche Rentenbank
Dr. Gerhard Cromme(until June 30, 2007)
Chairman of the Supervisory Board,
ThyssenKrupp AG
• Allianz SE
• Axel Springer AG
• Siemens AG (Chairman)
• ThyssenKrupp AG (Chairman)
• Compagnie de Saint-Gobain
Gabriele GratzChairwoman of the Works Council,
E.ON Ruhrgas AG
• E.ON Ruhrgas AG
Ulrich HockerGeneral Manager, German Investor
Protection Association
• Feri Finance AG
• Deutsche Telekom AG
• Arcandor AG
• ThyssenKrupp Stainless AG
• Gartmore SICAV
• Phoenix Mecano AG
(Chairman of the Administrative
Board)
Seppel Kraus(until July 31, 2007)
Labor Union Secretary
• Hexal AG
• Wacker Chemie AG
• Novartis Deutschland GmbH
Prof. Dr. Ulrich LehnerPresident and Chief Executive Officer,
Henkel KGaA
• Dr. Ing. h.c. F. Porsche AG
• Porsche Automobil Holding SE
• Novartis AG
• HSBC Trinkaus & Burkhardt AG
Erhard OttMember of the Board of Management,
Unified Service Sector Union, ver.di
• E.ON Energie AG
Klaus Dieter RaschkeChairman of the Combined Works
Council, E.ON Energie AG
• E.ON Energie AG
• E.ON Kernkraft GmbH
Dr. Henning Schulte-NoelleChairman of the Supervisory Board,
Allianz SE
• Allianz SE (Chairman)
• Siemens AG
• ThyssenKrupp AG
Dr. Theo Siegert (since July 4, 2007)
Managing Partner, de Haen-Carstanjen
& Söhne
• Deutsche Bank AG
• ERGO AG
• Merck KGaA
• E. Merck OHG
• DKSH Holding Ltd.
• Hülskens Holding GmbH & Co. KG
Prof. Dr. Wilhelm Simson• Hochtief AG
• Merck KGaA (Chairman)
• E. Merck OHG
• Freudenberg KG
• Jungbunzlauer Holding AG
• Frankfurter Allgemeine Zeitung GmbH
Gerhard SkupkeChairman of the Central Works Council,
E.ON edis AG
• E.ON edis AG
Dr. Georg Freiherr von WaldenfelsFormer Minister of State, Attorney
• CAPEO Consulting AG
• Georgsmarienhütte Holding GmbH
• Rothenbaum Sport GmbH (Chairman)
Hans Wollitzer (since Januar 4, 2007)
Chairman of the Central Works Council,
E.ON Energie AG
• E.ON Energie AG
• E.ON Bayern AG
Other Directorships Held by Members of the E.ON AG Supervisory Board (as of December 31, 2007)
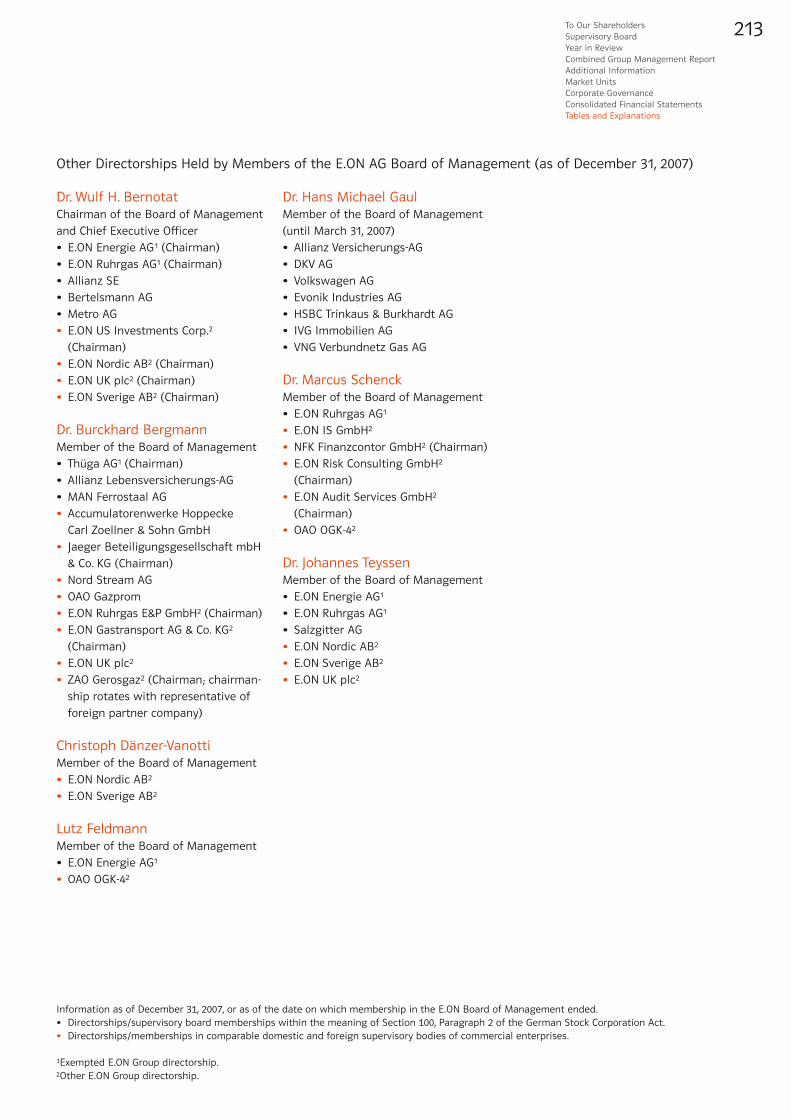
213To Our ShareholdersSupervisory Board Year in Review Combined Group Management Report Additional Information Market Units Corporate Governance Consolidated Financial Statements Tables and Explanations
Dr. Wulf H. BernotatChairman of the Board of Management
and Chief Executive Officer
• E.ON Energie AG1 (Chairman)
• E.ON Ruhrgas AG1 (Chairman)
• Allianz SE
• Bertelsmann AG
• Metro AG
• E.ON US Investments Corp.2
(Chairman)
• E.ON Nordic AB2 (Chairman)
• E.ON UK plc2 (Chairman)
• E.ON Sverige AB2 (Chairman)
Dr. Burckhard BergmannMember of the Board of Management
• Thüga AG1 (Chairman)
• Allianz Lebensversicherungs-AG
• MAN Ferrostaal AG
• Accumulatorenwerke Hoppecke
Carl Zoellner & Sohn GmbH
• Jaeger Beteiligungsgesellschaft mbH
& Co. KG (Chairman)
• Nord Stream AG
• OAO Gazprom
• E.ON Ruhrgas E&P GmbH2 (Chairman)
• E.ON Gastransport AG & Co. KG2
(Chairman)
• E.ON UK plc2
• ZAO Gerosgaz2 (Chairman; chairman-
ship rotates with representative of
foreign partner company)
Christoph Dänzer-VanottiMember of the Board of Management
• E.ON Nordic AB2
• E.ON Sverige AB2
Lutz FeldmannMember of the Board of Management
• E.ON Energie AG1
• OAO OGK-42
Dr. Hans Michael GaulMember of the Board of Management
(until March 31, 2007)
• Allianz Versicherungs-AG
• DKV AG
• Volkswagen AG
• Evonik Industries AG
• HSBC Trinkaus & Burkhardt AG
• IVG Immobilien AG
• VNG Verbundnetz Gas AG
Dr. Marcus SchenckMember of the Board of Management
• E.ON Ruhrgas AG1
• E.ON IS GmbH2
• NFK Finanzcontor GmbH2 (Chairman)
• E.ON Risk Consulting GmbH2
(Chairman)
• E.ON Audit Services GmbH2
(Chairman)
• OAO OGK-42
Dr. Johannes TeyssenMember of the Board of Management
• E.ON Energie AG1
• E.ON Ruhrgas AG1
• Salzgitter AG
• E.ON Nordic AB2
• E.ON Sverige AB2
• E.ON UK plc2
Other Directorships Held by Members of the E.ON AG Board of Management (as of December 31, 2007)
Information as of December 31, 2007, or as of the date on which membership in the E.ON Board of Management ended.• Directorships/supervisory board memberships within the meaning of Section 100, Paragraph 2 of the German Stock Corporation Act.• Directorships/memberships in comparable domestic and foreign supervisory bodies of commercial enterprises.
1Exempted E.ON Group directorship.2Other E.ON Group directorship.

Earningsm
0.0
0.0
174.6
5.5
0.0
129.0
0.0
0.0
0.0
1.9
–3.9
10.0
0.0
0.0
–9.4
73.0
75.2
–13.0
0.0
0.0
0.0
0.0
79.4
27.1
1.6
0.0
–2.9
0.0
71.2
6.3
0.0
70.3
0.0
0.0
0.0
5.6
34.2
11.9
90.9
0.0
30.1
17.1
24.8
–105.0
36.4
24.6
0.0
0.0
10.9
–7.2
Equitym
4,218.8
359.6
645.0
20.4
50.0
1,044.6
905.4
722.9
735.3
152.7
109.9
25.5
552.9
121.5
34.6
744.9
933.3
94.4
995.2
22.8
227.5
4.1
557.3
1,075.4
2.9
245.2
60.7
1,661.7
535.0
237.1
536.2
828.7
128.6
370.9
395.8
81.9
209.6
111.9
338.3
3,501.5
339.0
537.3
267.5
199.0
115.6
428.1
1,048.9
2,214.6
27.7
85.6
Stake %
100.0
100.0
21.0
100.0
100.0
66.9
100.0
100.0
100.0
100.0
67.0
67.0
100.0
100.0
99.9
100.0
74.0
100.0
100.0
100.0
100.0
100.0
73.8
100.0
100.0
100.0
99.6
100.0
73.3
51.0
100.0
77.2
100.0
100.0
62.8
100.0
43.7
49.3
49.0
100.0
47.2
38.9
100.0
100.0
100.0
51.0
100.0
100.0
100.0
100.0
Location
DE, Munich
DE, Helmstedt
CH, Bern
IT, Dalmine
DE, Cologne
DE, Helmstedt
DE, Regensburg
NL, Voorburg
NL, Voorburg
BG, Varna
BG, Gorna
BG, Varna
DE, Munich
HU, Pécs
HU, Pécs
CZ, České Budějovice
DE, Fürstenwalde
CZ, České Budějovice
DE, Munich
DE, Gelsenkirchen
HU, Györ
DE, Munich
DE, Quickborn
HU, Budapest
IT, Milan
DE, Hanover
HU, Nagykanizsa
DE, Hanover
DE, Kassel
RO, Bacau
DE, Bayreuth
DE, Erfurt
HU, Debrecen
DE, Landshut
DE, Paderborn
CZ, České Budějovice
CZ, Brno
CZ, Prague
SK, Bratislava
DE, Essen
LV, Riga
LT, Vilnius
HU, Budapest
HU, Budapest
DE, Essen
RO, Târgu Mures
DE, Essen
DE, Essen
NO, Stavanger
GB, Aberdeen
Salesm
0.0
191.7
1,205.4
604.3
34.8
3,423.4
3,888.6
0.0
1,088.4
6.2
122.9
146.3
6.4
339.2
145.4
399.6
2,113.9
964.8
16,995.3
64.8
581.3
173.0
2,941.0
49.8
188.4
2,308.8
132.1
3,089.3
1,324.2
304.4
5,729.9
1,439.2
372.6
378.2
1,286.5
130.0
637.2
334.0
721.5
19,080.6
261.5
225.4
108.5
1,961.8
1,297.4
718.9
0.0
0.0
130.1
12.2
Major Shareholdings as of December 31, 2007
214 Major Shareholdings
Name
Central Europe market unit
E.ON Energie AG1, 3, 4
BKB Aktiengesellschaft1, 3, 4
BKW FMB Energie AG2
Dalmine Energie S.p.A.1
E WIE EINFACH Strom & Gas GmbH1, 3, 4
E.ON Avacon AG1
E.ON Bayern AG1, 3
E.ON Benelux Holding b.v.1
E.ON Benelux n.v.1
E.ON Bulgaria EAD1
E.ON Bulgaria Grid AD1
E.ON Bulgaria Sales AD1
E.ON Czech Holding AG1, 3, 4
E.ON Dél-dunántúli Áramszolgáltató ZRt. (“EDE”)1
E.ON Dél-dunántúli Gázszolgáltató ZRt.1
E.ON Distribuce, a.s.1
E.ON edis AG1, 7
E.ON Energie, a.s.1
E.ON Energy Trading AG1, 3, 4
E.ON Engineering GmbH1, 3, 4
E.ON Észak-dunántúli Áramszolgáltató ZRt.1
E.ON Facility Management GmbH1, 3, 4
E.ON Hanse AG1
E.ON Hungária Energetikai ZRt.1
E.ON Italia S.p.A.1
E.ON Kernkraft GmbH1, 3, 4
E.ON Közép-dunántúli Gázszolgáltató ZRt.1
E.ON Kraftwerke GmbH1, 3, 4
E.ON Mitte AG1
E.ON Moldova Distributie S.A.1
E.ON Netz GmbH1, 3, 4
E.ON Thüringer Energie AG1, 7
E.ON Tiszántúli Áramszolgáltató ZRt. (“ETI”)1
E.ON Wasserkraft GmbH1, 3, 4
E.ON Westfalen Weser AG1
Jihočeská plynárenská, a.s. (“JČP”)1
Jihomoravská plynárenská, a.s. (“JMP”)2
Prazska plynárenská, a.s.2
Západoslovenská energetika a.s. (“ZSE”)2
Pan-European Gas market unit
E.ON Ruhrgas AG1, 3
A/s Latvijas Gāze2
AB Lietuvos Dujos2
E.ON Földgáz Storage ZRt.1
E.ON Földgáz Trade ZRt.1
E.ON Gastransport AG & Co. KG1, 5
E.ON Gaz Distributie S.A.1, 9
E.ON Ruhrgas E&P GmbH1, 3
E.ON Ruhrgas International AG1, 3
E.ON Ruhrgas Norge AS1
E.ON Ruhrgas UK North Sea Limited1

26.3
23.6
20.6
44.5
13.2
55.3
3.1
82.7
–4.1
17,969.5
0.0
645.9
0.0
3.6
–686.5
222.6
215.6
35.5
336.4
–151.2
–0.6
1.1
14.8
9.9
263.4
49.9
39.3
0.9
129.1
–12.6
82.5
49.9
61.8
–2.2
0.0
8.9
0.0
29.0
Earningsm
83.4
20.0
91.7
226.1
81.7
49.9
23.6
161.6
–3.5
96,358.9
140.2
5,780.5
2,355.4
11.2
3,706.6
906.0
812.1
89.6
2,161.6
–251.0
11.7
19.8
26.5
203.8
4,429.0
3,046.7
4,281.1
568.6
1,074.6
–287.0
807.5
–69.0
1,266.5
22.8
11.3
186.5
10,290.5
3,600.0
Equitym
50.0
74.8
70.0
20.0
25.9
23.6
51.0
40.6
24.5
6.4
20.0
24.5
100.0
51.0
100.0
100.0
100.0
50.0
100.0
100.0
100.0
100.0
100.0
100.0
100.0
55.3
100.0
100.0
100.0
100.0
100.0
100.0
100.0
100.0
100.0
100.0
100.0
72.7
Stake %Location
DE, Erfurt
DE, Friedeburg-Etzel
DE, Nuremberg
FI, Espoo
DE, Frankfurt am Main
GB, London
DE, Essen
DE, Emstek
CH, Zug
RU, Moscow
DE, Saarbrücken
SK, Bratislava
DE, Munich
DE, Essen
GB, Coventry
GB, Coventry
GB, Coventry
GB, Corby
GB, Coventry
GB, Coventry
GB, Coventry
GB, Coventry
GB, Coventry
GB, Coventry
SE, Malmö
SE, Malmö
US, Louisville
US, Louisville
US, Lexington
US, Louisville
US, Louisville
US, Chicago
DE, Duisburg
ES, Madrid
DE, Hanover
US, New York
DE, Düsseldorf
RU, Surgut
739.8
50.3
815.0
879.8
1,280.0
198.8
63.5
113.9
0.0
63,051.6
1,429.3
2,505.4
391.8
59.0
0.0
0.0
0.0
0.0
4,491.7
164.9
51.5
16.5
0.0
164.2
0.0
11.7
0.0
0.0
930.8
50.1
941.4
0.0
0.0
0.7
349.5
0.0
0.0
898.0
Salesm
Major Shareholdings as of December 31, 2007
215To Our ShareholdersSupervisory Board Year in Review Combined Group Management Report Additional Information Market Units Corporate Governance Consolidated Financial Statements Tables and Explanations
1Consolidated associated company.2Other shareholding.3Profit and loss pooling agreement (earnings after pooling).4This company exercised its exemption option under Section 264, Paragraph 3, of the German Commercial Code.5Equity in the amount of €115.6 million, of which €90 million in unpaid capital contributions has not yet been demanded.6Sales reflect the figure recorded for the period ended September 30, 2007.7Includes shares held in trust.8IFRS reporting package.9Formerly E.ON Gaz România S.A.
Name
Erdgasversorgungsgesellschaft Thüringen-Sachsen mbH (“EVG”)2
Etzel Gas-Lager GmbH & Co. KG1
Ferngas Nordbayern GmbH1
Gasum Oy2
Gas-Union GmbH2
Interconnector (UK) Limited2, 6
MEGAL Mittel-Europäische-Gasleitungsgesellschaft mbH & Co. KG2
NETRA GmbH Norddeutsche Erdgas Transversale & Co. KG2
Nord Stream AG2
OAO Gazprom2
Saar Ferngas AG2, 3
Slovenský Plynárenský Priemysel, a.s. (“SPP”)2, 8
Thüga Aktiengesellschaft1, 3
Trans Europa Naturgas Pipeline Gesellschaft mbH & Co. KG2
U.K. market unit
E.ON UK plc1
Central Networks East plc1
Central Networks West plc1
Corby Power Ltd.1
E.ON Energy Limited1
E.ON UK CHP Ltd.1
E.ON UK CoGeneration Limited1
E.ON UK Renewables Limited1
Economy Power Limited1
Enfield Energy Centre Limited1
Nordic market unit
E.ON Nordic AB1
E.ON Sverige AB1, 8
U.S. Midwest market unit
E.ON U.S. LLC1, 8
E.ON U.S. Capital Corp.1, 8
Kentucky Utilities Company (“KU”)1, 8
LG&E Energy Marketing Inc.1, 8
Louisville Gas and Electric Company (“LG&E”)1, 8
Other
Airtricity Inc.1
Aviga GmbH1
E.ON Renovables Iberia, S.L.1
E.ON IS GmbH1
E.ON North America, Inc.1
E.ON Ruhrgas Holding GmbH1, 3
OAO OGK-41

216
Actuarial gains and lossesThe actuarial calculation of provisions for pensions is based on fore-casts of a number of variables, such as projected future salaries andpensions. An actuarial gain or loss is recorded when the actual num-bers turn out to be different from the projections.
Adjusted EBITAdjusted earnings before interest and taxes. Adjusted EBIT, E.ON’s keyfigure for purposes of internal management control and as an indica-tor of a business’s long-term earnings power, is derived from income/loss (–) from continuing operations before interest income and incometaxes and is adjusted to exclude certain extraordinary items, mainlyother income and expenses of a non recurring or rare nature (seeOther non-operating earnings).
Adjusted EBITDA Adjusted earnings before interest, taxes, depreciation, and amortization.
Adjusted net incomeAn earnings figure after interest income, incomes taxes, and minorityinterests that has been adjusted to exclude certain extraordinaryeffects. The adjustments include effects from the marking to market ofderivatives, book gains and book losses on disposals, restructuringexpenses, and other non-operating income and expenses of a non-recurring or rare nature (after taxes and minority interests). Adjustednet income also excludes income/loss (–) from discontinued opera-tions, net.
ADRAbbreviation for American depositary receipt. These are depositarycertificates issued by U.S. banks and traded on U.S. stock exchanges inplace of a foreign share. ADRs make it easier for foreign companies to gain access to U.S. investors.
Balancing energyEnergy not scheduled in advance that is required to meet energyimbalances within a power system in real time. It is supplied to atransmission system operator (“TSO”) by various types of reserve gen-erating equipment that can respond quickly to the TSO’s request formore or less energy, ensuring that customers have a stable supply ofelectricity.
Barrel (“bbl”)Unit of capacity for crude oil and petrochemical products. A barrel isequal to 42 U.S. gallons, 35 Imperial gallons, or 159 liters; “bbl” is actu-ally an abbreviation of “blue barrel,” referring to the blue-colored 42-gallon steel drums used by Standard Oil in the late 19th century.
BaseloadMinimum amount of electricity delivered or required within a powersystem. Since this minimum is typically at night, baseload is the sumof the electricity consumed by industrial facilities that operate 24 hours a day, by street lights, and by commercial and residentialappliances that run around the clock (refrigerators, air conditioners,electric space heating).
Beta factorIndicator of a stock’s relative risk. A beta coefficient of more than oneindicates that a stock has a higher risk than the overall market; a betacoefficient of less than one indicates that it has a lower risk.
BiogasThe German Energy Act of 2005 classifies biomethane, gas from biomass,landfill gas, sewage gas, and mine gas as biogas.
BiomassOrganic material made from plants and animals. Typical examplesrelevant for the energy industry are wood, crops, manure, and sometypes of garbage. Biomass can, for example, be burned in combined-cycle generating units to produce both electricity and heat.
Brent crude oilA light crude oil with a low sulfur content. It is extracted from beneaththe North Sea floor between the Shetland Islands and Norway andtraded at London’s International Petroleum Exchange (“IPE”) and otherEuropean exchanges. Because Brent is Europe’s most commonly tradedcrude oil, the price of the IPE Brent futures contract is often used asEurope’s benchmark price.
British thermal unit (“Btu”)Amount of heat required to raise the temperature of one pound ofwater by one degree Fahrenheit. It is used to compare the heat-pro-ducing value of different fuels. In the U.S., fuels such as natural gasare priced in millions of Btu (“MmBtu”). One MmBtu equals 0.29307megawatt-hours.
Capital employedRepresents the interest-bearing capital tied up in the group. It is equalto a segment’s operating assets less the amount of non-interest-bear-ing available capital. Other shareholdings are included at their acquisi-tion cost, not their fair value.
Carbon dioxide (“CO2”)A colorless, odorless gas that at very low concentrations is a naturalcomponent of air. It is formed by the combustion of carbonaceousmatter.
Cash flow statementCalculation and presentation of the cash a company has generated or consumed during a reporting period as a result of its operating,investing, and financing activities.
Clean Development Mechanism (“CDM”)A flexible arrangement contained in the Kyoto Protocol that allowsindustrialized countries with a greenhouse-gas (“GHG”) reduction com-mitment (Annex 1 countries) to invest in projects that reduce GHGemissions in developing and emerging countries with no GHG reduc-tion commitment (non-Annex 1 countries). The Annex 1 country makingsuch an investment can earn certified emission reductions from theproject and credit these to its emission-reduction target. CDMs alsoresult in technology transfer to developing countries.
CO2 emission allowance tradingEU-wide emissions trading scheme designed to enable the Communityto meet its greenhouse-gas emission-reduction targets under the KyotoProtocol. Energy production and energy-intensive industrial facilitieswith more than 20 megawatts of installed capacity must demonstratethat they have allowances commensurate with their CO2 emissions.EU member states allocate emission allowances to facility operators. Ifoperators produce more CO2 than anticipated, they must either reducethe CO2 emissions of their facilities or buy additional allowances. Ifthey produce less CO2, they may sell their unused allowances on theopen market. Phase one of emissions trading was from 2005 through2007; phase two is from 2008 to 2012.
Cogeneration Protection Law German law designed to promote the maintenance, modernization,and growth of cogeneration capacity in order to reduce energy con-sumption and protect the earth’s climate. Depending on the size andage of a qualifying cogeneration facility, its operator receives, in addi-tion to the market price, a subsidy payment for each kilowatt-hour ofelectricity the facility delivers onto the power system.
Combined heat and power (“CHP”)Generating technology in which both electric and thermal energy areobtained from a single energy source, which makes CHP generatingunits significantly more efficient. Also known as cogeneration.
Commercial papers (“CPs”)Unsecured, short-term money market obligations issued by commercialfirms and financial institutions. CPs are usually quoted on a discountedbasis, with repayment at the par value.
Glossary

217
Compressor station Facilities placed roughly every 100 to 250 kilometers (60 to 150 miles)to move natural gas in transport pipelines through the creation ofpressure differentials.
Contractual trust arrangement (“CTA”)Model for financing pension obligations under which company assetsare converted to assets of a pension plan administered by an indepen-dent trust that is legally separate from the company.
Control areaPower system or part of a power system in which the transmissionsystem operator ensures system stability by matching, at all times,generation and consumption by means of balancing energy.
Control area imbalance calculation Calculation of the difference between electricity generated and con-sumed within a control area, or between gas injected and withdrawnfrom the control area of a market area, over a specified period of time.
Cost of capitalWeighted average of the costs of debt and equity funds (weightedaverage cost of capital: “WACC”). The cost of equity is the returnexpected by an investor in a given stock. The cost of debt is based onthe cost of corporate debt and bonds. The interest on corporate debtis tax deductible (referred to as the “tax shield” on corporate debt).
Credit default swap (“CDS”)A credit derivative used to hedge default risk on loans, bonds, andother debt instruments.
Debt factorRatio between economic net debt and adjusted EBITDA. Serves as ametric for managing E.ON’s capital structure.
Debt issuance programContractual framework and standard documentation for the issuanceof bonds.
Discontinued operationsBusinesses or parts of a business that are planned for divestment orhave already been divested. They are subject to special disclosure rules.
District heating System by which heat (steam or hot water) produced at a centralsource is distributed through a network of pipes to several buildingsand sometimes an entire district of a city.
Economic net debtKey figure that supplements net financial position with pension obliga-tions and asset retirement obligations (less prepayments to the Swedishnuclear fund).
Economic value of investmentsCash-effective capital investments plus debt acquired, long-term rentaland lease obligations, and asset swaps.
Energy efficiency Ratio between the amount of energy produced by a machine and theamount of energy it consumes, indicating the efficiency of a particularenergy transformation technology.
Energy Law of 2005German law designed to create market conditions a) under which thegeneral public will have access to a reliable, economically priced, con-sumer-friendly, efficient, and environmentally friendly supply of naturalgas and electricity and b) that ensure effective competition in theseindustries. It transposes a number of EU laws into German law.
Entry-exit model Pricing model for natural gas transport under which shippers can bookpipeline receipt and delivery points separately and in different volumes,use transport capacity without specifying a transport path, and aggre-gate it with the capacity of other shippers.
Equity methodMethod for valuing shareholdings in associated companies whoseassets and liabilities are not fully consolidated. The proportional shareof the company’s annual net income (or loss) is reflected in the share-holding’s book value. This change is usually shown in the owning com-pany’s income statement.
EU energy regulationEnergy market regulation in individual EU member states is based onEU directives. In September 2007, the EU Commission published a thirdpackage of legislative proposals to establish an EU-wide internal marketfor electricity and natural gas. The package is currently being debatedin the European Council and European Parliament.
Fair valueThe price at which assets, debts, and derivatives pass from a willingseller to a willing buyer, each having access to all the relevant factsand acting freely.
Federal Network Agency for Electricity, Gas, Telecommunications, Post,and RailwayGerman federal regulatory authority that since July 2005 has, in con-junction with state-level agencies, regulatory oversight over Germany’selectricity and gas networks. Its commonly used German abbreviationis BNetzA.
Financial derivativeContractual agreement based on an underlying value (reference inter-est rate, securities prices, commodity prices) and a nominal amount(foreign currency amount, a certain number of stock shares).
Fossil fuelAny naturally occurring energy source (such as petroleum, natural gas,or coal) formed in the earth from plant or animal remains.
Fuel cell Device that generates direct current and heat by means of an electro-chemical reaction between hydrogen and oxygen. Such devices arecurrently about 60 percent energy-efficient.
GoodwillThat portion of the purchase price of a company that exceeds its bookvalue (fixed and intangible assets less debt). Goodwill is based on pro-jections of future earnings.
Henry HubNexus of numerous interstate natural gas pipelines in Louisiana, USA.The price of the natural gas futures contract at the New York Mercan-tile Exchange is based on delivery at the Henry Hub. This contract iswidely used in the U.S. as a benchmark price for natural gas.
High voltageVoltages of between 60 kilovolts und 110 kilovolts and in Sweden up to130 kilovolts.
Impairment testPeriodic comparison of an asset’s book value with its fair value. A com-pany must record an impairment charge if it determines that an asset’sfair value has fallen below its book value. Goodwill, for example, is testedfor impairment on at least an annual basis.
To Our ShareholdersSupervisory Board Year in Review Combined Group Management Report Additional Information Market Units Corporate Governance Consolidated Financial Statements Tables and Explanations

Glossary218
Incentive regulationTerm for a German regulatory policy under which network charges arestructured so that they provide system operators with an incentive tomake their operations more efficient. The regulatory agency sets themaximum annual total revenues an operator can record for providingtransmission or distribution services over a five-year period. Theseannual maximums decline according to a schedule of anticipated effi-ciency improvements. System operators have an incentive to achieveefficiencies at a faster rate than the schedule calls for because theycan, despite having lowered their cost structure, still charge the maxi-mum amount until the end of the regulation period.
Incentive Regulation OrdinanceGerman ordinance that took effect in November 2007 under whichincentive regulation will begin on January 1, 2009. Incentive regulationwill replace the current cost-based model of network charges.
International Financial Reporting Standards (“IFRS”)Under regulations passed by the European Parliament and EuropeanCouncil, capital-market-oriented companies in the EU must apply IFRSfor fiscal years that begin on or after January 1, 2005. However, the reg-ulations gave member states the option to allow companies to applyIFRS beginning on January 1, 2007, at the latest. In October 2004 theGerman parliament passed a law allowing late application.
Joint Implementation (“JI”)A flexible arrangement contained in the Kyoto Protocol that allowsindustrialized countries with a greenhouse-gas (“GHG”) reduction com-mitment (Annex 1 countries) to invest in projects that reduce GHGemissions in another Annex 1 country, to earn certified emission reduc-tions from the project, and to credit these to their own emission-reduction target.
Line loss Difference between the electric energy delivered onto, and suppliedfrom, a transmission or distribution system. Line loss results fromresistance in conductors, conduction over insulators, coronas (lumi-nous electrical discharges on transmission lines), and other physicalphenomena.
Liquefied natural gas (“LNG”)Natural gas converted to a liquid state by pressure and severe cooling(minus 162 degrees Celsius, minus 260 degrees Fahrenheit), whichreduces its volume by a factor of 600. LNG is transported in tankerships to terminals where it is returned to a gaseous state. LNG isplaying an increasingly important role in international gas supply.
National Balancing Point (“NBP”)Notional point on the U.K.’s National Transmission System (“NTS”). Foraccounting and balancing purposes, all gas traded within the NTS issaid to flow through this point. Natural gas futures contracts in theU.K. are typically settled through the transfer of ownership at the NBP.
Net financial positionDifference between a company’s total financial assets (cash and secu-rities) and total financial liabilities (debts to financial institutions,third parties, and associated companies).
Network access charge Amount paid to an intervening network for the use of this network totransport or distribute power or gas. In Germany, these charges arepriced in euro cents per cubic meter for gas and euro cents per MWhfor power. Germany’s Energy Law of 2005 and related ordinances allowboth cost- and market-based mechanisms for setting these charges.
Network charge approvals process Under the Energy Law of 2005 and the Electricity and Gas NetworkCharge Ordinances, a regulatory agency must issue prior approval forcost-based power and gas network access charges. In certain circum-stances, natural gas transport system operators can submit market-based charges to the regulatory authority.
Network Connection OrdinanceEstablishes rules for connecting end-consumers to energy delivery net-works (low-voltage electricity and low-pressure natural gas).
Nitrogen oxide (“NOx”)Term for any of several gaseous oxides of nitrogen. The combustion ofnatural gas, oil, and coal is one of the ways NOx is released into theatmosphere.
Oil price indexation Common feature of natural gas supply contracts by which the price ofnatural gas is indexed to the market price for crude oil or petroleumproducts like heating oil and heavy oil. There is typically a lag of severalmonths before the contract price for natural gas is adjusted to reflectoil price movements, usually in the form of a monthly average ormoving average for several months.
OptionThe right, not the obligation, to buy or sell an underlying asset (forinstance, a security or currency) at a specific date at a predeterminedprice from a counterparty or seller. Buy options are referred to ascalls, sell options as puts.
Ordinary shareParticipation in the ownership of an enterprise. It has no par value(the nominal value assigned to a share of stock by the corporatecharter at the time of issuance).
Other non-operating earningsIncome and expenses that are unusual or infrequent, such as bookgains or book losses from significant disposals as well as restructuringexpenses (see Adjusted EBIT).
PeakloadMaximum demand for electricity within a power system. To meet thisdemand and ensure system reliability as demand fluctuates, a powersystem must have access to extra generating capacity beyond itsbaseload and intermediate-load capacity.
Power Station Grid Connection OrdinanceGerman ordinance in effect since June 2007 that establishes rules forconnecting generating units with a nameplate capacity of 100 mega-watts and higher to electricity networks with a voltage of 100 kilovoltsand higher.
Primary energy Naturally occurring forms of energy or energy sources like fossil fuels(natural gas, petroleum, hard coal, lignite), nuclear fuel (uranium), andrenewables (water, solar, wind).
Primary energy consumptionEnergy consumed by end-users in a political entity (usually a country)over a certain period of time (usually a year). It excludes electricityconsumption, but includes the energy used to produce electricity.
Pumped storage hydroelectric plantFacility that enables electricity to be stored for later use. Electricityproduced by other generating plants (usually during off-peak hours,when electricity is cheaper) is used to pump water into an elevatedstorage reservoir. When additional generating capacity is needed(usually during peakload periods), the water is released to turn theturbines of a hydroelectric plant located on a lower level.
Purchase price allocationIn a business combination accounted for as a purchase, the values at which the acquired company’s assets and liabilities are recorded in the acquiring company’s balance sheet.

219To Our ShareholdersSupervisory Board Year in Review Combined Group Management Report Additional Information Market Units Corporate Governance Consolidated Financial Statements Tables and Explanations
RatingStandardized performance categories for an issuer’s short- and long-term debt instruments based on the probability of full repayment.Ratings provide the foundation for investors and creditors to comparethe risks of various financial investments.
Regenerative energy See Renewable energy.
Regulations on network accessIssued on the basis of Germany’s Energy Law of 2005 to regulate themodalities of power and gas network access.
Regulations on network access chargesIssued on the basis of Germany’s Energy Law of 2005 to regulate themodalities of power and gas network access charges.
Renewable energyEnergy from sources that are essentially inexhaustible. Examplesinclude solar, biomass, hydro, wind, geothermal, wave, and tidal energy.
Renewable Energy LawGerman law to promote the growth of renewable-source generatingcapacity so that Germany can meet its EU-mandated target of 12.5 per-cent renewable generation by 2010 and at least 20 percent by 2020. Itscommonly used German abbreviation is EEG. Under this law, electricitysystem operators must give preferential treatment to electricity fromrenewable-source generating units when they dispatch generatingcapacity to meet load. In Germany, renewable-source electricity receivesa guaranteed price that is above the market price. This extra cost ispassed from system operators and energy suppliers to end-customers.
ROCEAcronym for return on capital employed. A key indicator for monitor-ing the performance of E.ON’s market units, ROCE is the ratio betweenadjusted EBIT and capital employed. Capital employed represents theinterest-bearing capital tied up in the E.ON Group.
Stock appreciation rights (“SAR”)Virtual stock options in which compensation is in cash instead of instock. At E.ON, the exercise gain equals the difference between theprice of E.ON stock on the exercise date and at the time the SARwere issued.
Sulfur dioxide (“SO2”)Heavy, pungent, toxic gas produced primarily through the combustionof sulfurous fossil fuels like coal and petroleum products.
Syndicated line of creditCredit facility extended by two or more banks that is good for a statedperiod of time.
System users Any person or entity feeding energy into, or taking energy out of, anelectricity or gas supply system.
Take-or-pay contracts Long-term supply contracts used primarily in the natural gas industryrequiring the customer to pay for a minimum quantity (typically anannual quantity) of gas whether or not delivery is accepted.
Tax shieldDeductions that reduce an enterprise’s tax burden. For example, theinterest on corporate debt is tax deductible. An enterprise takes thisinto consideration when choosing between equity and debt financing(see Cost of capital).
ThermMeasure of heat content of gas equal to 100,000 British thermal units(see British thermal units). One therm is equal to 0.0293071 megawatt-hours.
Transformer A device for changing voltage levels; for example, from the inter-mediate voltage at which electric energy is distributed to the lowvoltage at which it is delivered to residential customers.
Transmission system Interconnected system of ultra-high-voltage transmission lines ofmore than 100 kilovolts used to transfer electric energy.
Two-contract model (gas)A model for natural gas network access in Germany in which transportcustomers have two contracts: one entry or exit contract and onebalancing area contract. The two-contract model is based on an entry-exit system for market areas that have a single notional trading point.The entry contract gives the transport customer access to the marketarea to transport the capacity booked to the notional trading pointwhere ownership of the gas is transferred. The exit contract allows thetransport customer to transport gas to the receipt point that has beenbooked.
Ultra-high voltage Voltages above 110 kilovolts (typically 220 kilovolts and 380 kilovolts)at which electric energy is moved in bulk over long distances.
Unbundling EU requirement that energy companies create independent entities(with separate accounting, information, organizational, and legal struc-tures) to manage their operations at the individual links in the elec-tricity and natural gas value chain (production, trading, transmission,and distribution). Its purpose is to prevent energy companies fromdistorting competition in the EU’s liberalized energy markets or engag-ing in discriminatory business practices or cross subsidization.
Underground natural gas storage facility Located in natural or manmade caverns in geological formations (in Germany, at depths of up to 2,900 meters or 1.8 miles), such facili-ties serve to balance seasonal or sudden fluctuations in natural gasconsumption.
U.S. GAAPAbbreviation for accounting principles that are generally accepted inthe United States. Accounting, valuation, and disclosure policies basedon the principle of fair presentation of financial statements to provideinformation needed for decision-making, especially for investors.
Value addedKey measure of E.ON’s financial performance based on the residualwealth calculated by deducting the cost of capital (debt and equity)from operating profit. It is equivalent to the return spread (ROCE minusthe cost of capital) multiplied by capital employed, which representsthe interest-bearing capital tied up in the group.
Working capitalThe difference between a company’s current assets and short-termliabilities.

E.ON AG
E.ON-Platz 1
40479 Düsseldorf
Germany
T +49 2 11 -45 79 -0
F +49 2 11 -45 79 -5 01
www.eon.com
Media Relations
T +49 2 11 -45 79 -4 53
Investor Relations
T +49 2 11 -45 79 -5 42
Creditor Relations
T +49 2 11 -45 79 -5 63
Only the German version of this Annual Report is legally binding.
Art Direction: Lesmo, DüsseldorfProduction: Jung Produktion, DüsseldorfTypesetting & Lithography: Addon Technical Solutions, DüsseldorfPrinting: Druckpartner, Essen
Photo Credits: Rüdiger Nehmzow (pages 2, 20, 21, 22, 24, 25, 72, 73, 78, 79, 96, and 97),Andreas Pohlmann (pages 4, 14, and 15), Hartmut Nägele (page 16),
Bernd Meyer (pages 2 and 13), Rainer Rehfeld (pages 2, 22, and 78),Christian Schlüter (pages 2, 13, and 113), Attila Szabó (page 10),Paul Langrock/laif (page 12), Martin Joppen (pages 13 and 23),Dietmar Banck (pages 22 and 113), E.ON Kraftwerke (page 74),Frank Domke (page 75), Cheyenne Smith (page 76), Zaha Hadid (page 80),E.ON Engineering (page 81), Lunar Energy Limited (page 82),E.ON Energie (page 90), Atle Kårstadt (page 94), Gavin Young (page 102),Bergslagsbild AB (page 105), E.ON U.S. (page 108), and E WIE EINFACH (page 112)
This Annual Report was printed on paper produced from fiber that comes from a responsibly managedforest certified by the Forest Stewardship Council.
Additional Information
Cert no. IMO-COC-027827

Summary of Financial Highlights
2006
64,091
11,724
8,356
6,082
5,586
13.8
9.0
2,916
96,488
31,087
127,575
51,2451,799
2,533
46,94722,10010,02914,818
29,3833,9943,443
21,946
127,575
7,161
5,037
40
102
–18,233
1.6
11.2
8.47
73.81
104.40
82.12
102.83
3.35
2,210
67.6
Aa3
AA–
80,612
2007
68,731
12,450
9,208
7,724
7,204
14.5
9.1
3,417
105,804
31,490
137,294
55,1301,734
5,756
52,40220,96315,91515,524
29,7623,9925,549
20,221
137,294
8,726
11,306
40
102
–24,138
1.9
12.7
11.06
78.12
146.06
96.05
145.59
4.10
2,5905
92.0
A2
A
87,815
in millions
Sales and earnings
Sales
Adjusted EBITDA
Adjusted EBIT
Net income
Net income attributable to shareholders of E.ON AG
Value measures
ROCE (in %)
Cost of capital (in %)
Value added
Asset structure
Non-current assets
Current assets
Total assets
Capital structure
EquityCapital stock
Minority interests
Non-current liabilitiesProvisionsFinancial liabilitiesOther liabilities and other
Current liabilitiesProvisionsFinancial liabilitiesOther liabilities and other
Total equity and liabilities
Cash flow and investments
Cash provided by operating activities of continuing operations
Investments
Financial ratios
Equity ratio2 (in %)
Non-current assets as a percentage of property, plant and equipment
Economic net debt (at year end)
Debt factor3
Cash provided by operating activities of continuing operations as a percentage of sales
Stock
Earnings per share attributable to shareholders of E.ON AG (in €)
Equity per share4 (in €)
Twelve-month high per share (in €)
Twelve-month low per share (in €)
Year-end closing price per share (in €)
Dividend per share (in €)
Dividend payout
Market capitalization6 (€ in billions)
E.ON AG long-term ratings
Moody’s
Standard & Poor’s
Employees
Employees at year end
2005
51,616
10,194
7,293
7,407
–
12.2
9.0
1,920
93,914
32,648
126,562
44,4841,799
4,734
52,25127,40210,55514,294
25,0936,4603,807
14,826
126,562
6,544
3,941
35
108
–
–
12.7
11.24
67.50
88.92
64.50
87.39
2.75
4,614
57.6
Aa3
AA–
79,570
2004
42,150
9,664
6,747
4,339
–
11.5
9.0
1,477
88,223
25,839
114,062
33,5601,799
4,144
52,62427,32813,26512,031
23,7346,9147,0369,784
114,062
5,776
4,777
29
102
–
–
13.7
6.61
50.93
67.06
49.27
67.06
2.35
1,549
44.2
Aa3
AA–
59,732
2003
39,953
8,584
5,645
4,647
–
9.9
9.5
251
86,967
24,883
111,850
29,7741,799
4,625
53,45227,08514,52111,846
23,9997,2437,2669,490
111,850
5,224
8,773
27
101
–
–
13.1
7.11
45.39
51.74
34.67
51.74
2.00
1,312
33.9
A-1
AA–
57,029
Summary of Financial Highlights1
1Adjusted for discontinued operations; up to and including 2005 pursuant to U.S. GAAP. 2Excludes minority interests up to 2005. 3Ratio between economic net debt andadjusted EBITDA. 4Thereof shareholders of E.ON AG. 5Based on the number of shares outstanding as of December 31, 2007; further share repurchases could alter thedividend payout. 6Based on the number of shares outstanding.

Financial Calendar
2008 Annual Shareholders MeetingDividend PayoutInterim Report: January – March 2008Interim Report: January – June 2008Interim Report: January – September 2008
Release of 2008 Annual Report2009 Annual Shareholders MeetingDividend PayoutInterim Report: January – March 2009Interim Report: January – June 2009Interim Report: January – September 2009
April 30, 2008May 2, 2008
May 14, 2008August 13, 2008
November 12, 2008
March 10, 2009May 6, 2009May 7, 2009
May 13, 2009August 12, 2009
November 11, 2009
Summary of Financial Highlights