2013 E.ON Russia Capital Market Update · E.ON Russia Capital Market Update 10 October 2013 Cleaner...
22
E.ON Russia Capital Market Update 10 October 2013 Cleaner & Better Energy
Transcript of 2013 E.ON Russia Capital Market Update · E.ON Russia Capital Market Update 10 October 2013 Cleaner...
E.ON Russia
Capital Market Update
10 October 2013
Cleaner & Better Energy

E.ON Russia
Management team
Important footprint of E.ON in Russia
2
Igor Popov
Deputy Director General for
Production
Joerg Tumat
Deputy Director General for
Energy Management
Ulf Backmeyer
Deputy Director General for
Finance and Economics
Maxim Shirokov
Chief Executive Officer
Acquisition of 69.3% stake in OGK4 in 2007,
rebranded to E.ON Russia in 2011
Increase of share from 69.3% to 83.7% as of
today
Installed capacity up by +20% (1.7 GW) since
acquisition to 10.3GW
0
0.5
1
1.5
2
2.5
3
3.5
2007 2008 2009 2010 2011 2012
E.ON Russia share price (RUB)
Markt Cap
RUB167bn
E.ON history
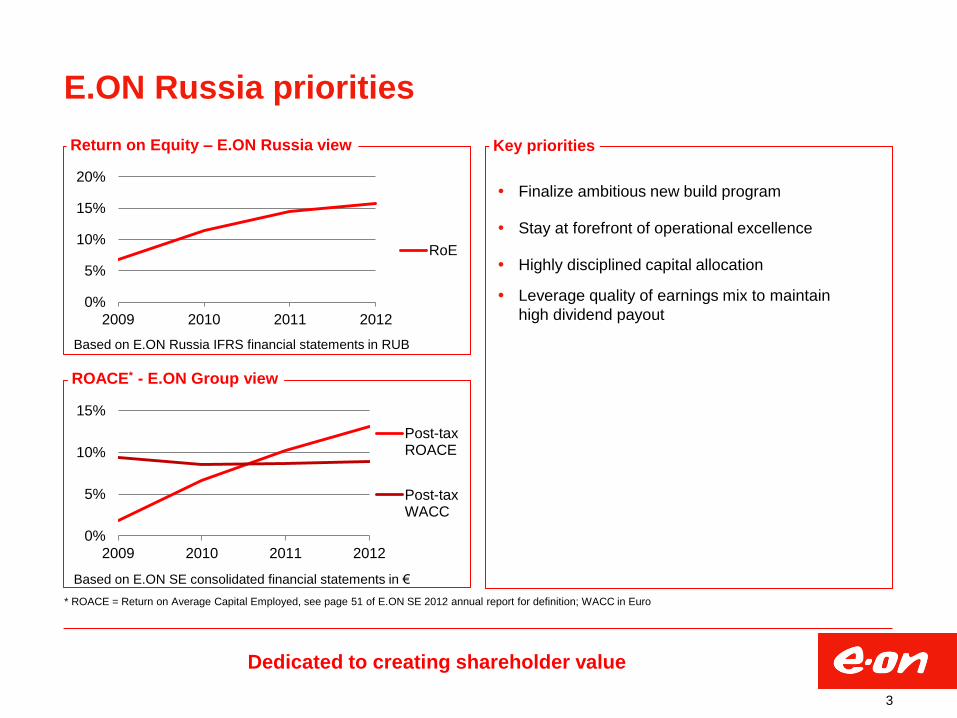
E.ON Russia priorities
Key priorities
Dedicated to creating shareholder value
3
Finalize ambitious new build program
Stay at forefront of operational excellence
Highly disciplined capital allocation
Leverage quality of earnings mix to maintain
high dividend payout
0%
5%
10%
15%
20%
2009 2010 2011 2012
RoE
Return on Equity – E.ON Russia view
Based on E.ON Russia IFRS financial statements in RUB
Based on E.ON SE consolidated financial statements in €
* ROACE = Return on Average Capital Employed, see page 51 of E.ON SE 2012 annual report for definition; WACC in Euro
0%
5%
10%
15%
2009 2010 2011 2012
Post-taxROACE
Post-taxWACC
ROACE* - E.ON Group view
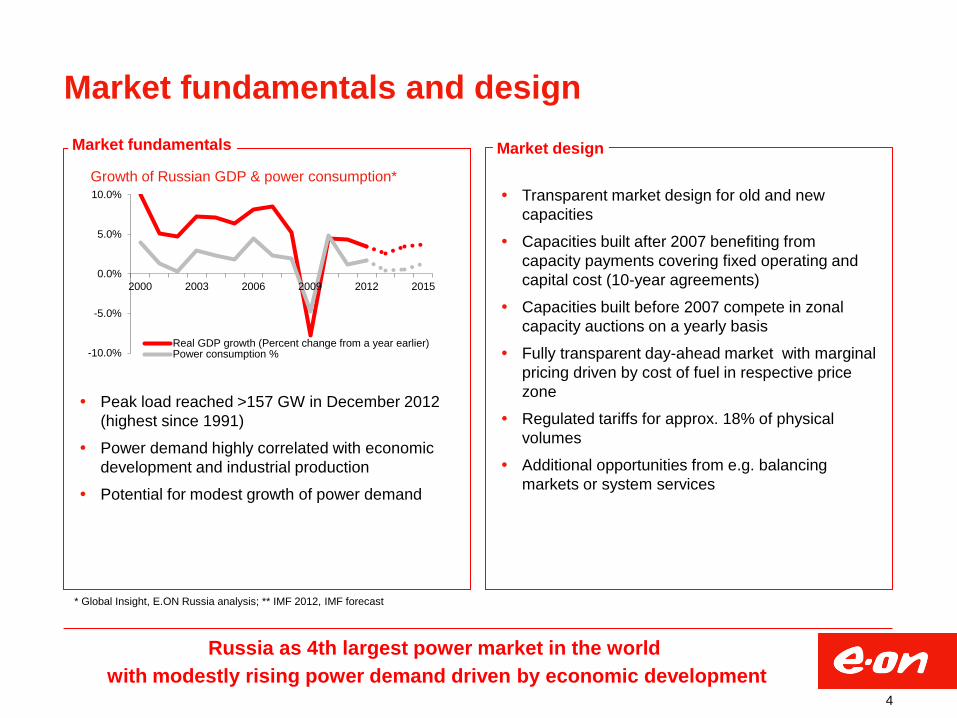
Market fundamentals and design
Russia as 4th largest power market in the world
with modestly rising power demand driven by economic development 4
Peak load reached >157 GW in December 2012
(highest since 1991)
Power demand highly correlated with economic
development and industrial production
Potential for modest growth of power demand
-10.0%
-5.0%
0.0%
5.0%
10.0%
2000 2003 2006 2009 2012 2015
Real GDP growth (Percent change from a year earlier)Power consumption %
Growth of Russian GDP & power consumption*
* Global Insight, E.ON Russia analysis; ** IMF 2012, IMF forecast
Market fundamentals
Market design
Transparent market design for old and new
capacities
Capacities built after 2007 benefiting from
capacity payments covering fixed operating and
capital cost (10-year agreements)
Capacities built before 2007 compete in zonal
capacity auctions on a yearly basis
Fully transparent day-ahead market with marginal
pricing driven by cost of fuel in respective price
zone
Regulated tariffs for approx. 18% of physical
volumes
Additional opportunities from e.g. balancing
markets or system services
2009 2010 2011 2012
El.price, 1st zone, Rub/MWh
Gas price, Moscow region,rub/1000m3
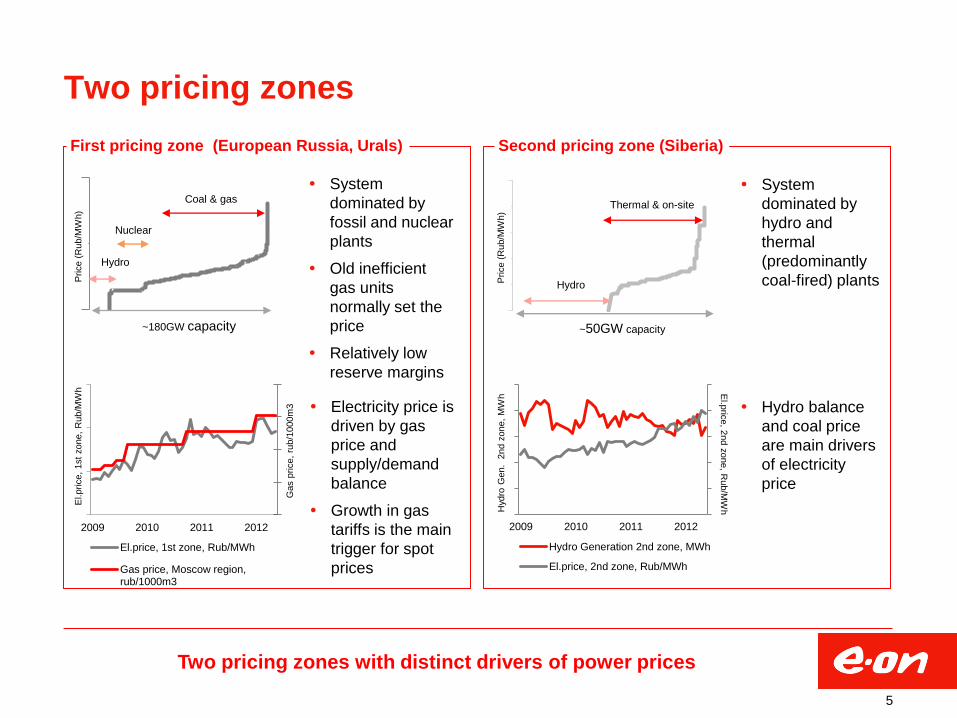
Two pricing zones
First pricing zone (European Russia, Urals) Second pricing zone (Siberia)
Two pricing zones with distinct drivers of power prices
5
System
dominated by
fossil and nuclear
plants
Old inefficient
gas units
normally set the
price
Relatively low
reserve margins
Electricity price is
driven by gas
price and
supply/demand
balance
Growth in gas
tariffs is the main
trigger for spot
prices
System
dominated by
hydro and
thermal
(predominantly
coal-fired) plants
Hydro balance
and coal price
are main drivers
of electricity
price
El.price
, 1st
zone,
Rub/M
Wh
Gas p
rice,
rub/1
000m
3
2009 2010 2011 2012
Hydro Generation 2nd zone, MWh
El.price, 2nd zone, Rub/MWh
El.p
rice, 2
nd z
one, R
ub/M
Wh
Hyd
ro G
en.
2nd z
one,
MW
h
Coal & gas
Nuclear
Hydro
Price (
Rub/M
Wh)
~180GW capacity
Price (
Rub/M
Wh)
Thermal & on-site
Hydro
~50GW capacity
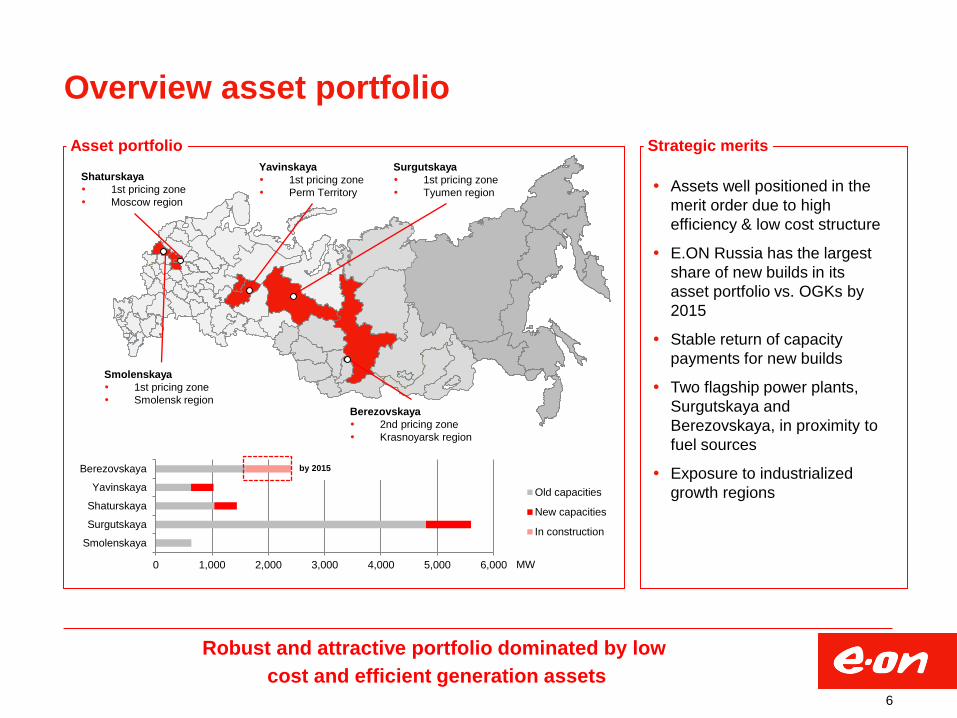
Overview asset portfolio
Asset portfolio
Robust and attractive portfolio dominated by low
cost and efficient generation assets 6
Strategic merits
Assets well positioned in the
merit order due to high
efficiency & low cost structure
E.ON Russia has the largest
share of new builds in its
asset portfolio vs. OGKs by
2015
Stable return of capacity
payments for new builds
Two flagship power plants,
Surgutskaya and
Berezovskaya, in proximity to
fuel sources
Exposure to industrialized
growth regions
0 1,000 2,000 3,000 4,000 5,000 6,000
Smolenskaya
Surgutskaya
Shaturskaya
Yavinskaya
Berezovskaya
Old capacities
New capacities
In construction
by 2015
MW
Shaturskaya
1st pricing zone
Moscow region
Yavinskaya
1st pricing zone
Perm Territory
Surgutskaya
1st pricing zone
Tyumen region
Berezovskaya
2nd pricing zone
Krasnoyarsk region
Smolenskaya
1st pricing zone
Smolensk region
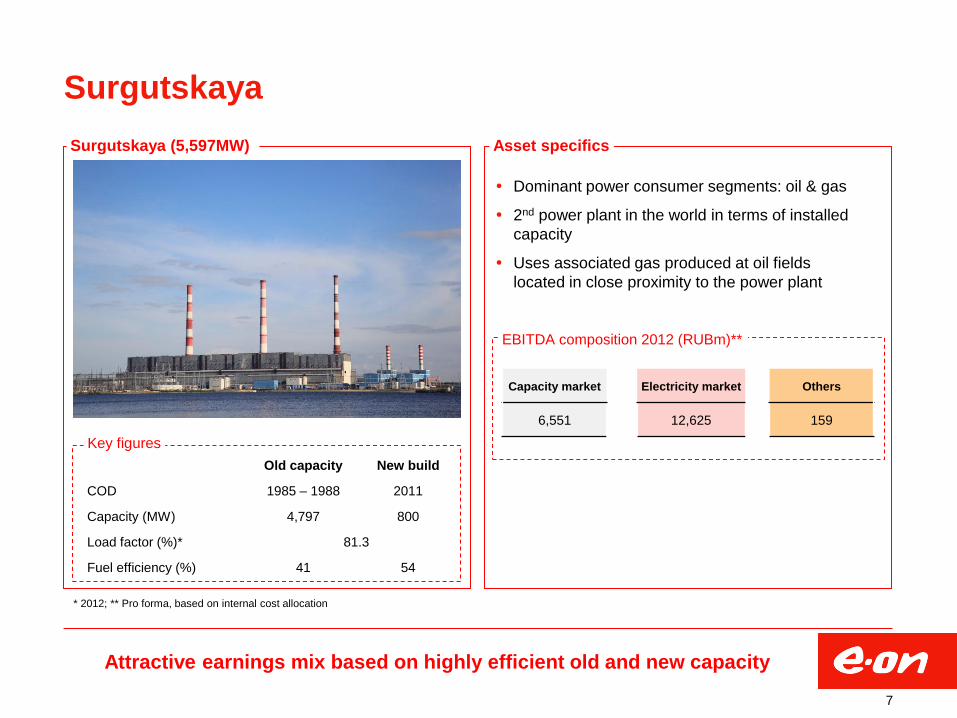
Surgutskaya
Surgutskaya (5,597MW)
Attractive earnings mix based on highly efficient old and new capacity
7
Asset specifics
Dominant power consumer segments: oil & gas
2nd power plant in the world in terms of installed
capacity
Uses associated gas produced at oil fields
located in close proximity to the power plant
Old capacity New build
COD 1985 – 1988 2011
Capacity (MW) 4,797 800
Load factor (%)* 81.3
Fuel efficiency (%) 41 54
Key figures
Capacity market Electricity market Others
6,551 12,625 159
EBITDA composition 2012 (RUBm)**
* 2012; ** Pro forma, based on internal cost allocation

Berezovskaya
Berezovskaya (1,600MW)
Achieve next level with comissioning of Berezovskaya in 2015
8
Dominant power consumer segments: metal &
mining
Major share of lignite is delivered to the plant via
two 14-km long open conveyor belts directly from
Berezovskoye coal deposit
Region has above average power demand growth
Total capex in Berezovskaya new build by 2015:
RUB43bn
Old capacity New build
COD 1987 – 1991 2015
Capacity (MW) 1,600 800
Load factor (%)* 76.4
Fuel efficiency /%) 38
Key figures
Asset specifics
Capacity market Electricity market Others
476 3,692 159
EBITDA composition 2012 (RUBm)**
* 2012; ** Pro forma, based on internal cost allocation
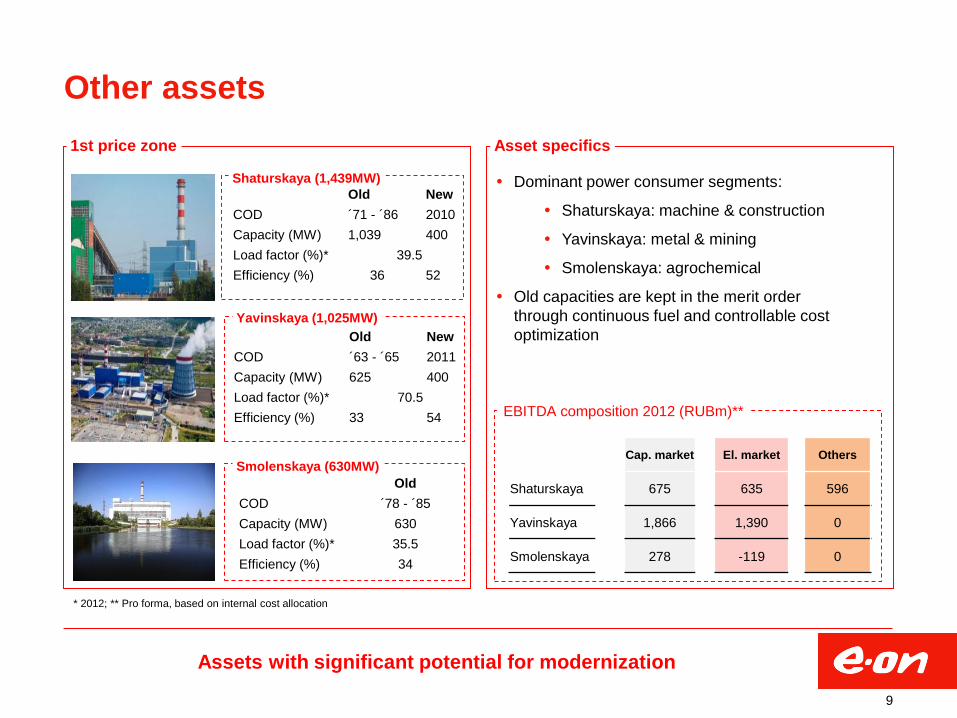
Old
COD ´78 - ´85
Capacity (MW) 630
Load factor (%)* 35.5
Efficiency (%) 34
Old New
COD ´63 - ´65 2011
Capacity (MW) 625 400
Load factor (%)* 70.5
Efficiency (%) 33 54
Old New
COD ´71 - ´86 2010
Capacity (MW) 1,039 400
Load factor (%)* 39.5
Efficiency (%) 36 52
Other assets
1st price zone
Assets with significant potential for modernization
9
Asset specifics
Dominant power consumer segments:
Shaturskaya: machine & construction
Yavinskaya: metal & mining
Smolenskaya: agrochemical
Old capacities are kept in the merit order
through continuous fuel and controllable cost
optimization
Shaturskaya (1,439MW)
Yavinskaya (1,025MW)
Smolenskaya (630MW)
EBITDA composition 2012 (RUBm)**
Cap. market El. market Others
Shaturskaya 675 635 596
Yavinskaya 1,866 1,390 0
Smolenskaya 278 -119 0
* 2012; ** Pro forma, based on internal cost allocation

Outstanding operational performance
Excellent gearing to benefit from operational performance
10
* Public filings, E.ON analysis
400 600 800
OGK-5 (ENEL)
InterRAO
OGK-2
E.ON
2012 fuel costs – RUB/MWh
Superior efficiency* Best load factors*
Lowest fuel costs* Disciplined management of non-fuel costs
250 300 350 400
OGK-5 (ENEL)
InterRAO
OGK-2
E.ON
2012 heat rate – g/kWh
20 40 60 80
OGK-5 (ENEL)
InterRAO
OGK-2
E.ON
2012 load factor - %
80
100
120
140
2008 2009 2010 2011 2012
Inde
x 1
00
in
20
08
Non-fuelcosts -RUB/MW
RussianCPI
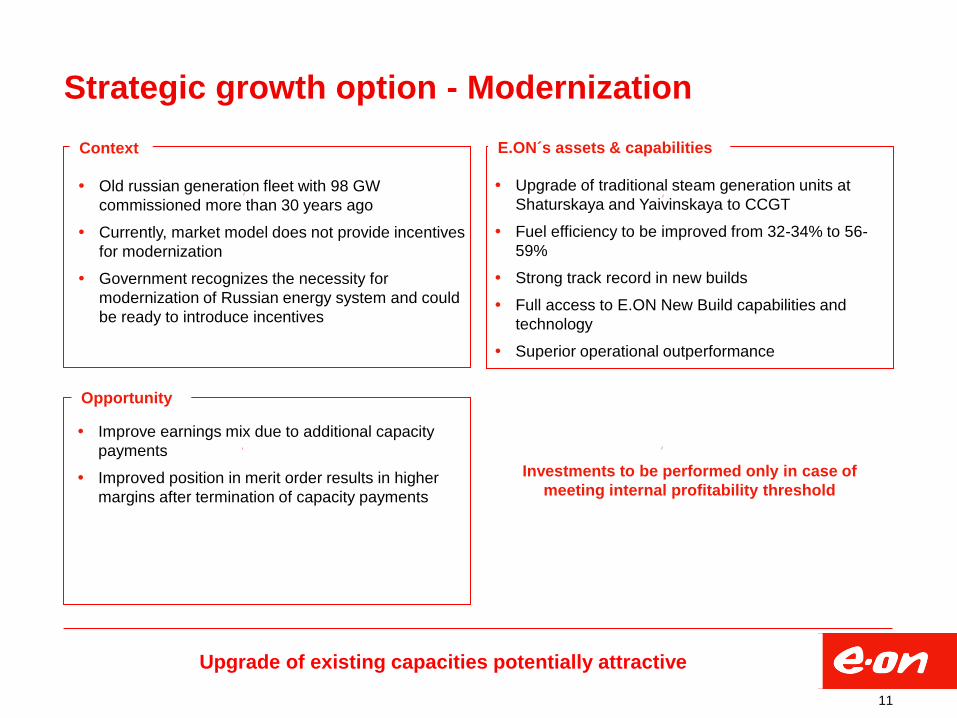
Strategic growth option - Modernization
Old russian generation fleet with 98 GW
commissioned more than 30 years ago
Currently, market model does not provide incentives
for modernization
Government recognizes the necessity for
modernization of Russian energy system and could
be ready to introduce incentives
Improve earnings mix due to additional capacity
payments
Improved position in merit order results in higher
margins after termination of capacity payments
Upgrade of traditional steam generation units at
Shaturskaya and Yaivinskaya to CCGT
Fuel efficiency to be improved from 32-34% to 56-
59%
Strong track record in new builds
Full access to E.ON New Build capabilities and
technology
Superior operational outperformance
Investments to be performed only in case of
meeting internal profitability threshold
Upgrade of existing capacities potentially attractive
Context E.ON´s assets & capabilities
Opportunity
11
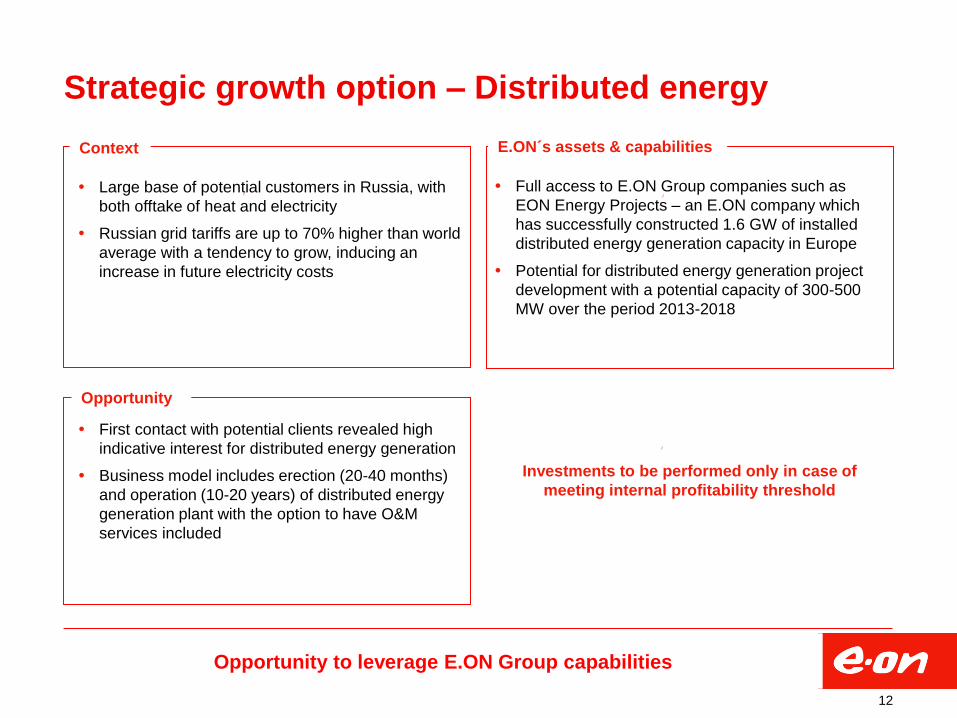
Strategic growth option – Distributed energy
Large base of potential customers in Russia, with
both offtake of heat and electricity
Russian grid tariffs are up to 70% higher than world
average with a tendency to grow, inducing an
increase in future electricity costs
First contact with potential clients revealed high
indicative interest for distributed energy generation
Business model includes erection (20-40 months)
and operation (10-20 years) of distributed energy
generation plant with the option to have O&M
services included
Full access to E.ON Group companies such as
EON Energy Projects – an E.ON company which
has successfully constructed 1.6 GW of installed
distributed energy generation capacity in Europe
Potential for distributed energy generation project
development with a potential capacity of 300-500
MW over the period 2013-2018
Opportunity to leverage E.ON Group capabilities
Context E.ON´s assets & capabilities
Opportunity
12
Investments to be performed only in case of
meeting internal profitability threshold
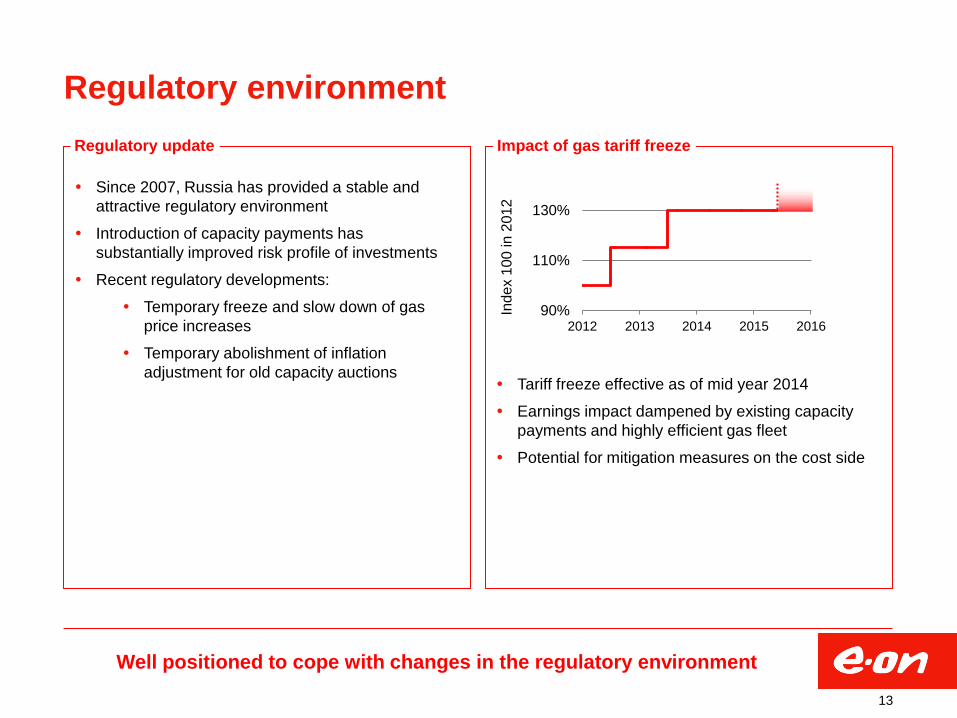
90%
110%
130%
2012 2013 2014 2015 2016
Regulatory environment
Regulatory update
Well positioned to cope with changes in the regulatory environment
13
Impact of gas tariff freeze
Since 2007, Russia has provided a stable and
attractive regulatory environment
Introduction of capacity payments has
substantially improved risk profile of investments
Recent regulatory developments:
Temporary freeze and slow down of gas
price increases
Temporary abolishment of inflation
adjustment for old capacity auctions
Tariff freeze effective as of mid year 2014
Earnings impact dampened by existing capacity
payments and highly efficient gas fleet
Potential for mitigation measures on the cost side
Inde
x 1
00
in
20
12

2008 2009 2010 2011 2012 2013 2014 2015
Financial outlook
Further step-change in earnings due to Berezovskaya
14
Berezovskaya new build, to be commissioned
early in 2015 will increase the total EBITDA of
the company by ~ RUB14bn per year
Increasing capacity payments reduce exposure
to commodity price volatility
Earnings impact Earnings outlook
RUBbn (EBITDA)
Short- term
Mid- term
Long- term
E E E
Gas tariff freeze
Decline in capacity price
in second price zone
Commissioning of
Berezovskaya
Tightening of supply
Modest increasing power
demand and gas prices
OPEX increase below
inflation
29
23
15
9 6
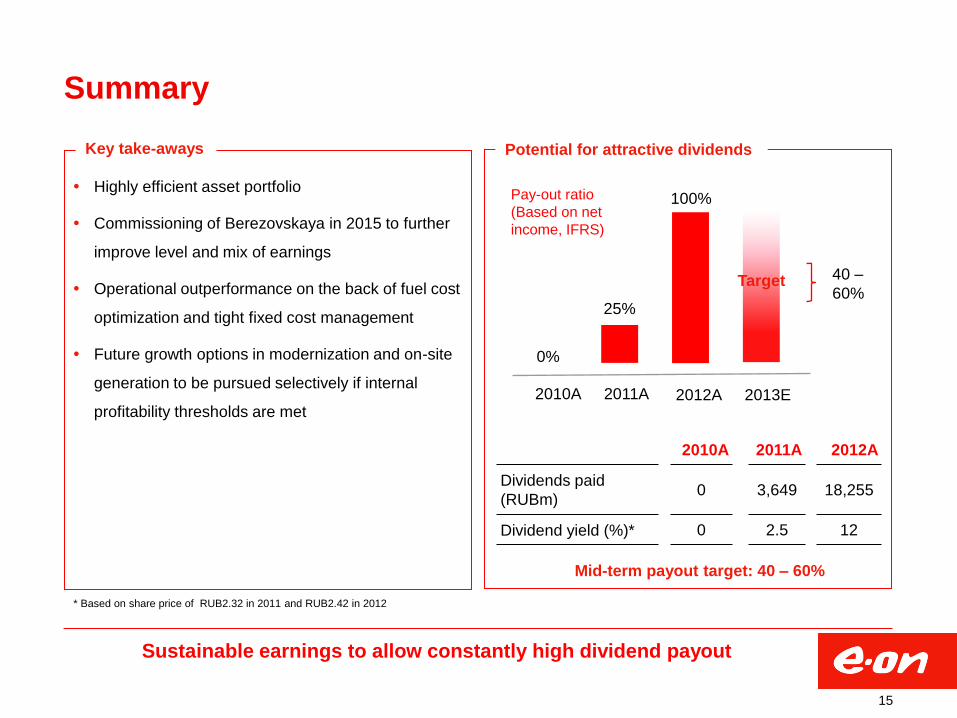
Summary
Key take-aways
15
Potential for attractive dividends
Sustainable earnings to allow constantly high dividend payout
2010A 2011A 2012A 2013E
40 –
60%
Pay-out ratio
(Based on net
income, IFRS)
100%
25%
0%
Mid-term payout target: 40 – 60%
2010A 2011A 2012A
Dividends paid
(RUBm) 0 3,649 18,255
Dividend yield (%)* 0 2.5 12
Highly efficient asset portfolio
Commissioning of Berezovskaya in 2015 to further
improve level and mix of earnings
Operational outperformance on the back of fuel cost
optimization and tight fixed cost management
Future growth options in modernization and on-site
generation to be pursued selectively if internal
profitability thresholds are met
Target
* Based on share price of RUB2.32 in 2011 and RUB2.42 in 2012

Backup
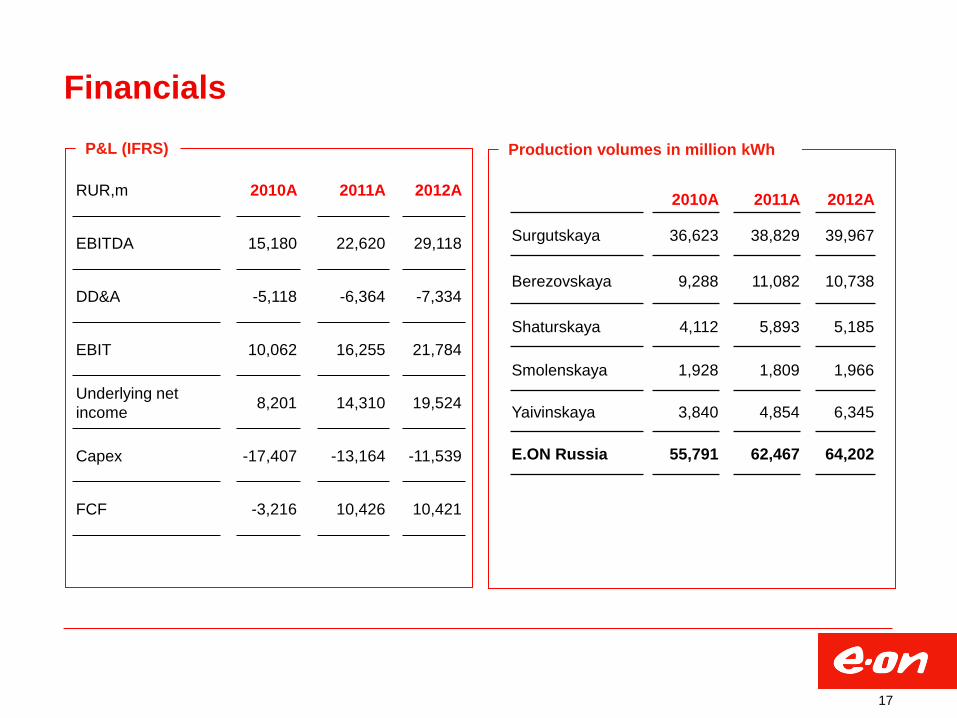
Financials
P&L (IFRS)
17
2010A 2011A 2012A
Surgutskaya 36,623 38,829 39,967
Berezovskaya 9,288 11,082 10,738
Shaturskaya 4,112 5,893 5,185
Smolenskaya 1,928 1,809 1,966
Yaivinskaya 3,840 4,854 6,345
E.ON Russia 55,791 62,467 64,202
Production volumes in million kWh
RUR,m 2010A 2011A 2012A
EBITDA 15,180 22,620 29,118
DD&A -5,118 -6,364 -7,334
EBIT 10,062 16,255 21,784
Underlying net
income 8,201 14,310 19,524
Capex -17,407 -13,164 -11,539
FCF -3,216 10,426 10,421

One market design
18
CAPACITY MARKET ELECTRICITY MARKET
Old capacity (built before 2007)
New capacity (built after 2007)
Capacity payments supposed to cover opex
Zonal capacity auctions, marginal pricing
Price caps and price floors in regions with limited competition
Regulated tariffs for must-run and expensive plants
Ca. 25% sold under regulated tariffs
Capacity payments supposed to cover fixed costs and ensure capital remuneration
10-year capacity supply agreements
Benchmark capex, opex
13-14% allowed rate of return, 15-year payback
Various adjustment coefficients
Cover 71-95% of total new build project costs
Old capacity & New capacity (built before 2007) (built after 2007)
Day-ahead market (~75% of physical volumes)
Marginal pricing
Price driven by cost of fuel
Other
Balancing market
Bilateral contracts
System services
Power arbitrage
Heat sales
Regulated agreements
Ca. 18% of physical volumes
Tariffs set by regulator on cost-plus basis

19
Outstanding performance in new builds
Delay of commissioning
Name Type Capacity (MW)
Start-up date
1 Shaturskaya CCGT 393 On-line
2 Surgutskaya CCGT 797 On-line
3 Yaivinskaya CCGT 425 On-line
4 Berezovskaya Upgrade 100 On-line
5 Berezovskaya Coal 800 2015
Project execution
1 2
3 5
Name Months of delay
Owner
Shaturskaya unit 7
2 E.ON Russia
Surgutskaya unit 7 unit 8
3 1
E.ON Russia
Yaivinskaya unit 6
0 E.ON Russia
Nyaganskaya unit 1 unit 2
~ 11 ~ 14
Fortum
Gusinoozerskaya unit 4
~ 10 INTER RAO – Electric
Power Plants
Vologodskaya unit 2
~ 10 Siberian Generating
Company
Novomoskovskaya unit 6
~ 6 Quadra - Power
Generation
Livenskaya unit 5
~ 2 Quadra - Power
Generation
Novokuybyshevkaya unit 4 unit 5 unit 6
~ 3 ~ 3 ~ 3
IES-Holding

20
Dr. Marc Spieker
Head of IR T+49 2 11-45 79-3 45
Peter Blankenhorn
Regions/Sales, SRI, Retail, T +49 2 11-45 79-4 81
Facts & Figures [email protected]
François Poullet
Generation, Gas T +49 2 11-45 79-3 32
Marc Koebernick
Renewables, Trading T +49 2 11-45 79-2 39
Dr. Stephan Schönefuß
Politics & Regulation, Regions/Distribution T +49 2 11-45 79-48 08
Carmen Schneider
Technology & Innovation,
Roadshow planning & management, T +49 2 11-45 79-3 45
Shareholder ID & Targeting [email protected]
E.ON Investor Relations Contact
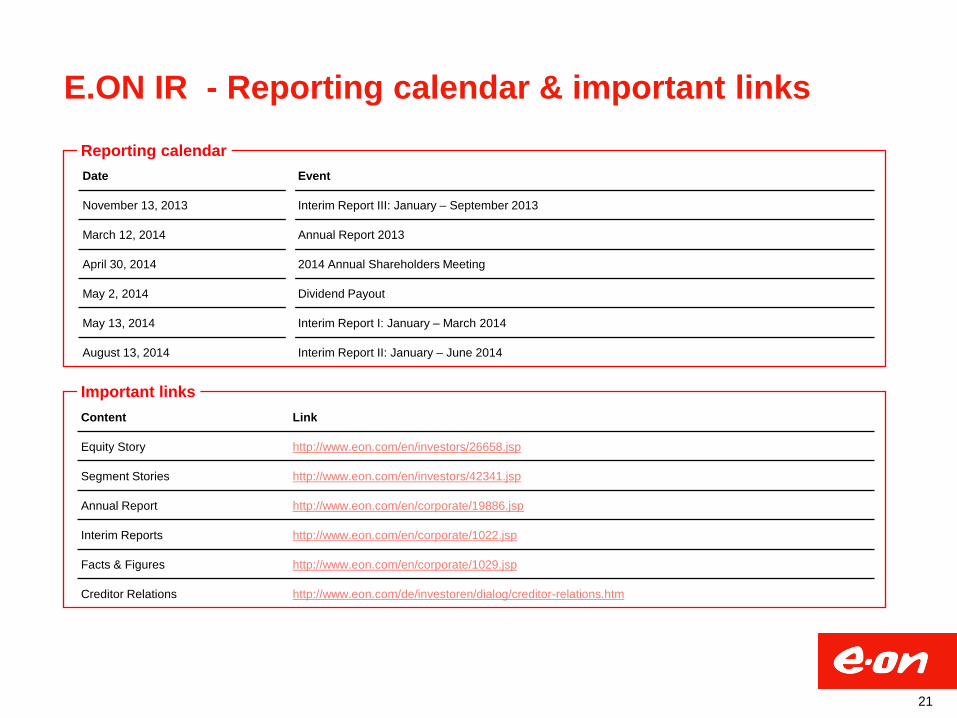
E.ON IR - Reporting calendar & important links
Date Event
November 13, 2013 Interim Report III: January – September 2013
March 12, 2014 Annual Report 2013
April 30, 2014 2014 Annual Shareholders Meeting
May 2, 2014 Dividend Payout
May 13, 2014 Interim Report I: January – March 2014
August 13, 2014 Interim Report II: January – June 2014
Content Link
Equity Story http://www.eon.com/en/investors/26658.jsp
Segment Stories http://www.eon.com/en/investors/42341.jsp
Annual Report http://www.eon.com/en/corporate/19886.jsp
Interim Reports http://www.eon.com/en/corporate/1022.jsp
Facts & Figures http://www.eon.com/en/corporate/1029.jsp
Creditor Relations http://www.eon.com/de/investoren/dialog/creditor-relations.htm
Important links
Reporting calendar
21

This presentation may contain forward-looking statements based on current assumptions and forecasts made
by E.ON Group management and other information currently available to E.ON. Various known and unknown
risks, uncertainties and other factors could lead to material differences between the actual future results,
financial situation, development or performance of the company and the estimates given here. E.ON SE does
not intend, and does not assume any liability whatsoever, to update these forward-looking statements or to
conform them to future events or developments.
Disclaimer